Implementation of Partial Least Squares (PLS) Modeling in ...
90
Implementation of Partial Least Squares (PLS) Modeling in Economics and Business Management Research Dr. Pavel Andreev University of Ottawa
Transcript of Implementation of Partial Least Squares (PLS) Modeling in ...
Implementation of Partial Least Squares (PLS) Modeling in Economics and Business Management Research
Dr. Pavel Andreev University of Ottawa

• Assistant Professor in Performance Management
and Data Analytics
My research is focused on modeling and exploring
impacts of information and communication technologies
on the performance of commercial and non-commercial
organizations at the individual, team, and
organizational level.
INTRODUCING
8/19/2013 BEROC 2013 Pavel Andreev uOttawa 2
• 2011 Postdoc, Visiting Professor at Telfer, uOttawa
Improving performance management of a chronic disease inter-professional healthcare team.
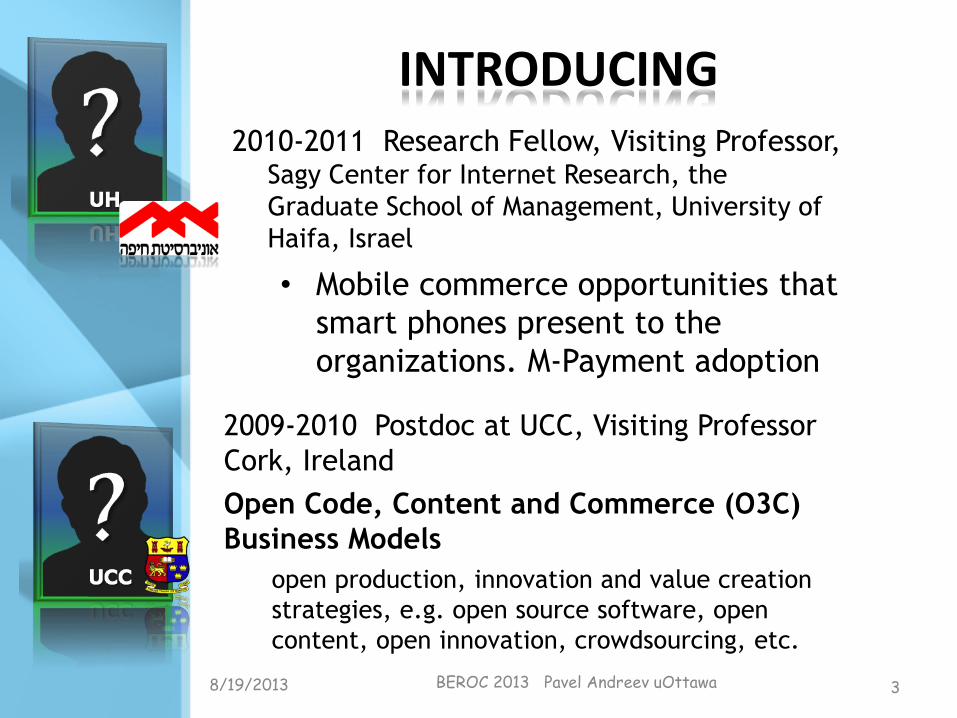
2010-2011 Research Fellow, Visiting Professor, Sagy Center for Internet Research, the
Graduate School of Management, University of
Haifa, Israel
• Mobile commerce opportunities that
smart phones present to the
organizations. M-Payment adoption
2009-2010 Postdoc at UCC, Visiting Professor
Cork, Ireland
Open Code, Content and Commerce (O3C)
Business Models
open production, innovation and value creation
strategies, e.g. open source software, open
content, open innovation, crowdsourcing, etc.
INTRODUCING
8/19/2013 BEROC 2013 Pavel Andreev uOttawa 3

2009 - Ph.D. Ben-Gurion University, Israel
Impacts of Information and Communication
Technologies (ICT) on Personal Activities
• Teleactivities • teleworking, telemedicine, teleshopping,
telelearning, telebanking, and teleleisure
INTRODUCING
8/19/2013 BEROC 2013 Pavel Andreev uOttawa 4
8/19/2013 BEROC 2013 Pavel Andreev uOttawa 5
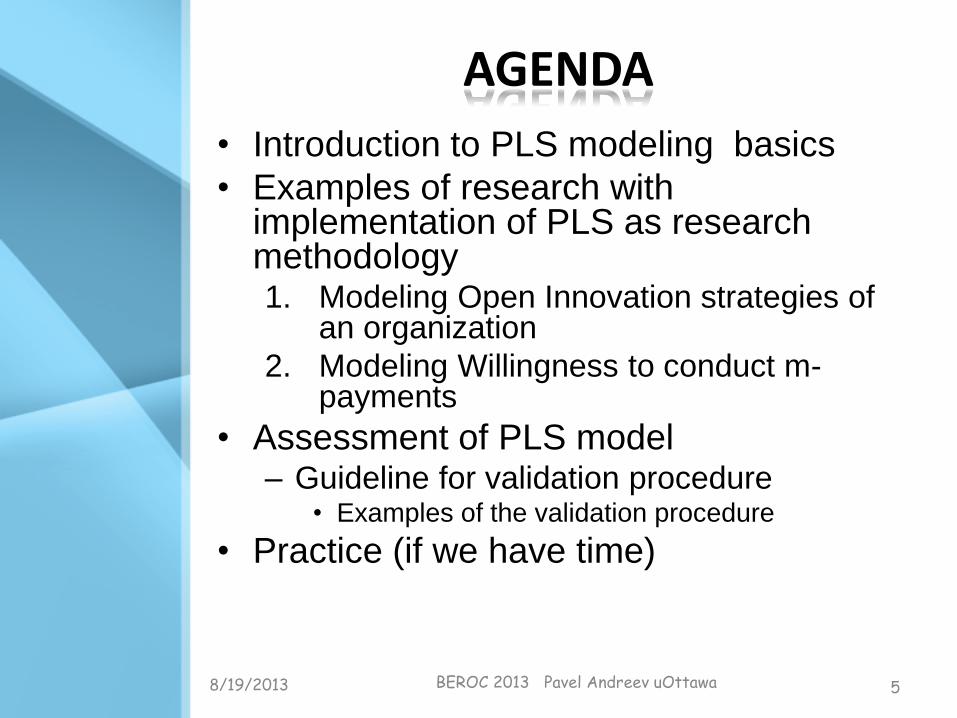
AGENDA
• Introduction to PLS modeling basics
• Examples of research with implementation of PLS as research methodology 1. Modeling Open Innovation strategies of
an organization
2. Modeling Willingness to conduct m-payments
• Assessment of PLS model – Guideline for validation procedure
• Examples of the validation procedure
• Practice (if we have time)
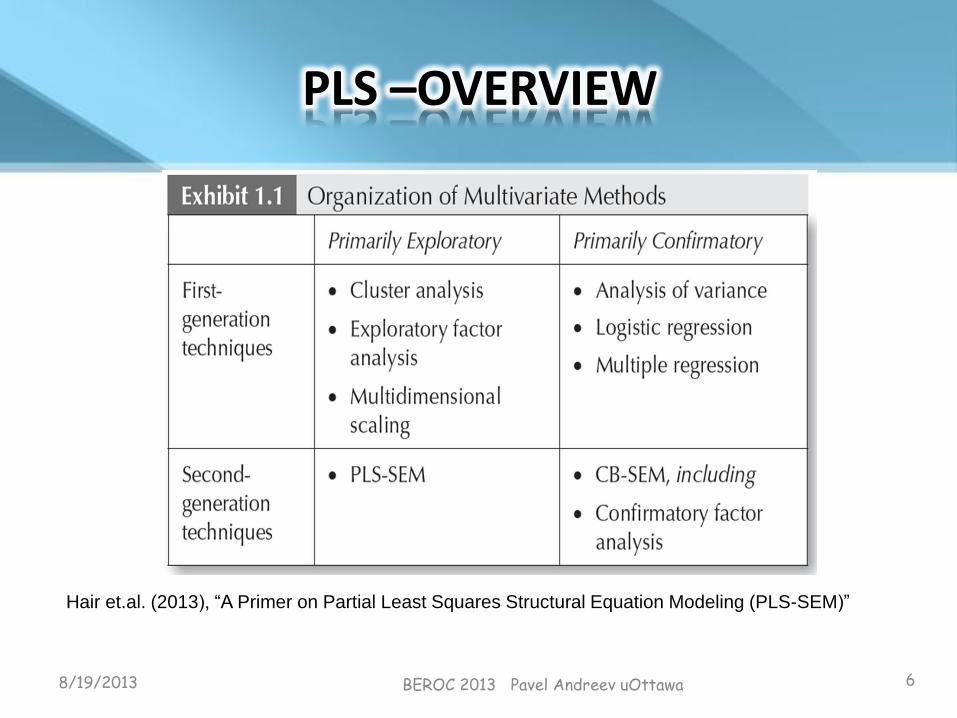
PLS –OVERVIEW
8/19/2013 BEROC 2013 Pavel Andreev uOttawa 6
Hair et.al. (2013), “A Primer on Partial Least Squares Structural Equation Modeling (PLS-SEM)”
SEM
• The desire to test research theories and
concepts is one of the major reasons why
authors conducting business research
have embraced SEM.
• SEM is equivalent to carrying out
covariance-based SEM (CB-SEM)
analyses using software such as Amos,
EQS, LISREL, Mplus, and others.
8/19/2013 BEROC 2013 Pavel Andreev uOttawa 7

PLS-OVERVIEW
• However, there is also another SEM
approach, called Partial Least Squares
SEM (PLS-SEM).
• So, what is the difference between CB-
SEM and PLS-SEM?
8/19/2013 BEROC 2013 Pavel Andreev uOttawa 8
COV-SEM VS. PLS-SEM
• The philosophical distinction is pretty vivid:
• The research objective:
– Theory testing and confirmation - CB-SEM.
– Prediction and theory development - PLS-SEM.
8/19/2013 BEROC 2013 Pavel Andreev uOttawa 9
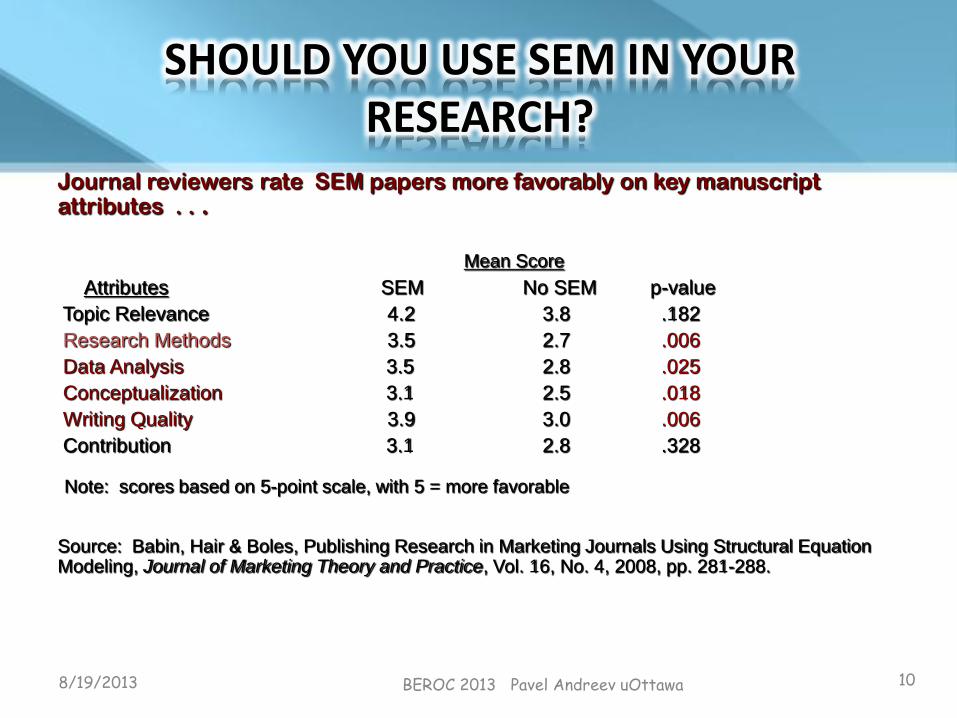
SHOULD YOU USE SEM IN YOUR RESEARCH?
Journal reviewers rate SEM papers more favorably on key manuscript attributes . . .
Mean Score
Attributes SEM No SEM p-value
Topic Relevance 4.2 3.8 .182
Research Methods 3.5 2.7 .006
Data Analysis 3.5 2.8 .025
Conceptualization 3.1 2.5 .018
Writing Quality 3.9 3.0 .006
Contribution 3.1 2.8 .328
Note: scores based on 5-point scale, with 5 = more favorable
Source: Babin, Hair & Boles, Publishing Research in Marketing Journals Using Structural Equation Modeling, Journal of Marketing Theory and Practice, Vol. 16, No. 4, 2008, pp. 281-288.
8/19/2013 BEROC 2013 Pavel Andreev uOttawa 10
SEM IN A NUTSHELL PATH MODEL
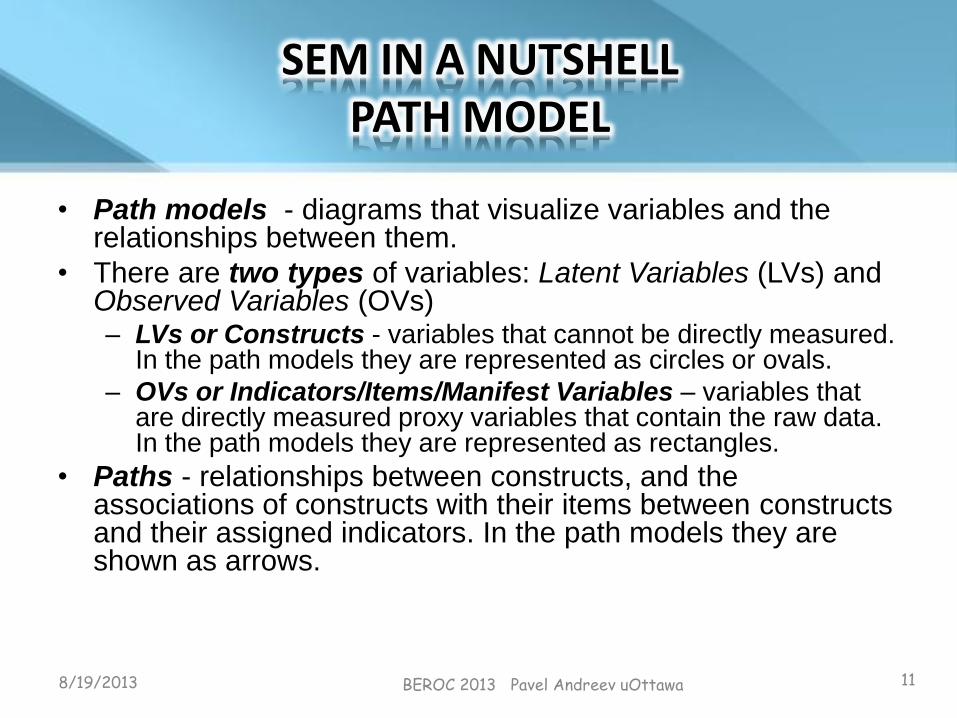
• Path models - diagrams that visualize variables and the relationships between them.
• There are two types of variables: Latent Variables (LVs) and Observed Variables (OVs) – LVs or Constructs - variables that cannot be directly measured.
In the path models they are represented as circles or ovals.
– OVs or Indicators/Items/Manifest Variables – variables that are directly measured proxy variables that contain the raw data. In the path models they are represented as rectangles.
• Paths - relationships between constructs, and the associations of constructs with their items between constructs and their assigned indicators. In the path models they are shown as arrows.
8/19/2013 BEROC 2013 Pavel Andreev uOttawa 11
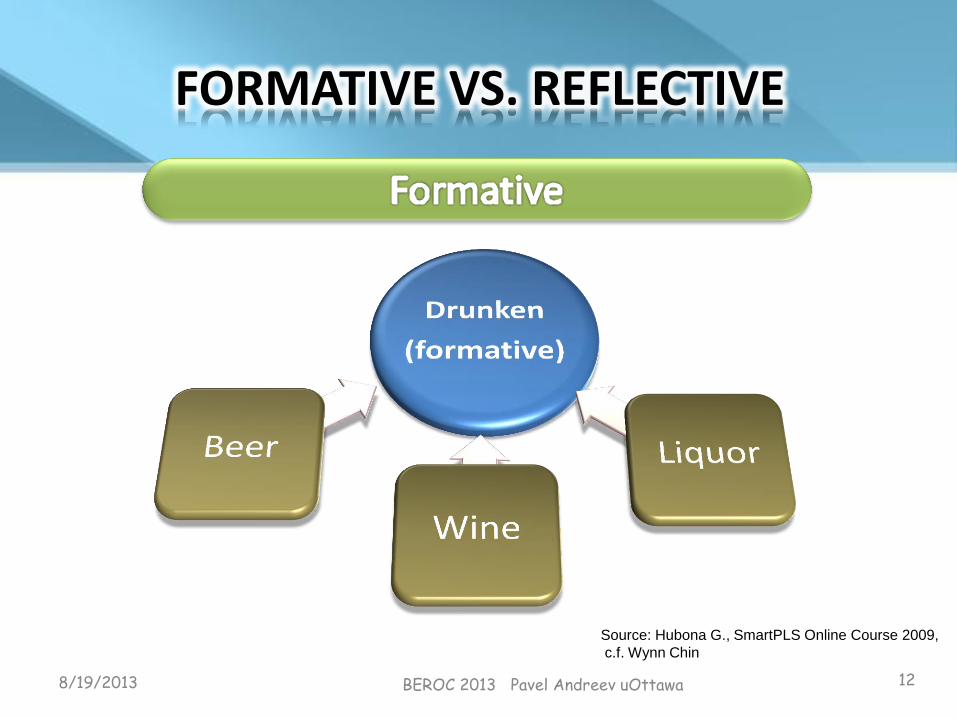
FORMATIVE VS. REFLECTIVE
8/19/2013 BEROC 2013 Pavel Andreev uOttawa 12
Source: Hubona G., SmartPLS Online Course 2009,
c.f. Wynn Chin
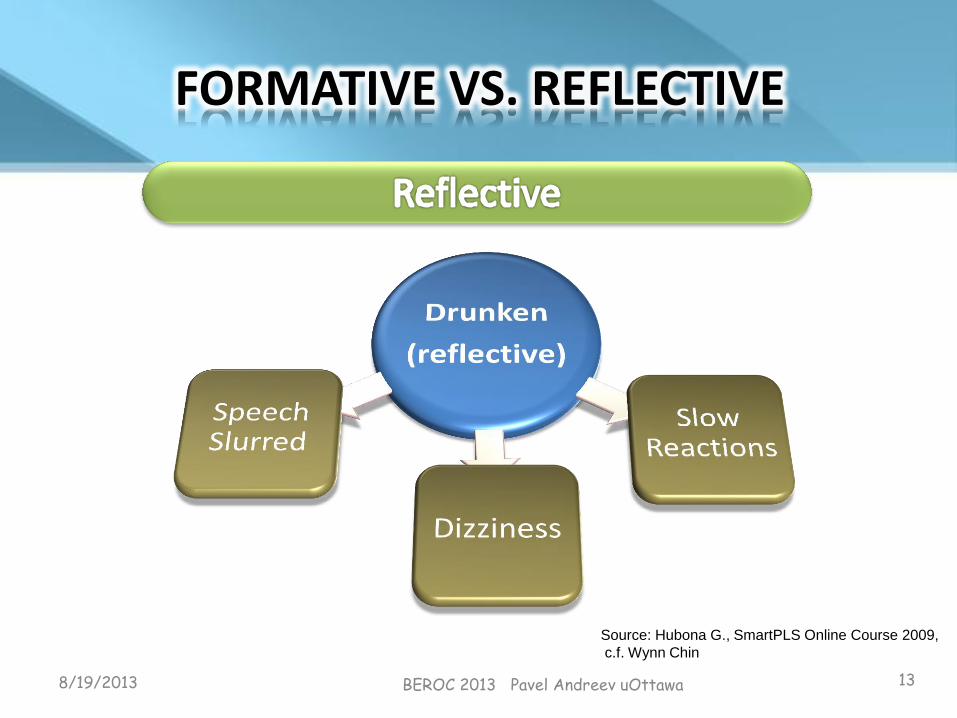
FORMATIVE VS. REFLECTIVE
8/19/2013 BEROC 2013 Pavel Andreev uOttawa 13
Source: Hubona G., SmartPLS Online Course 2009,
c.f. Wynn Chin
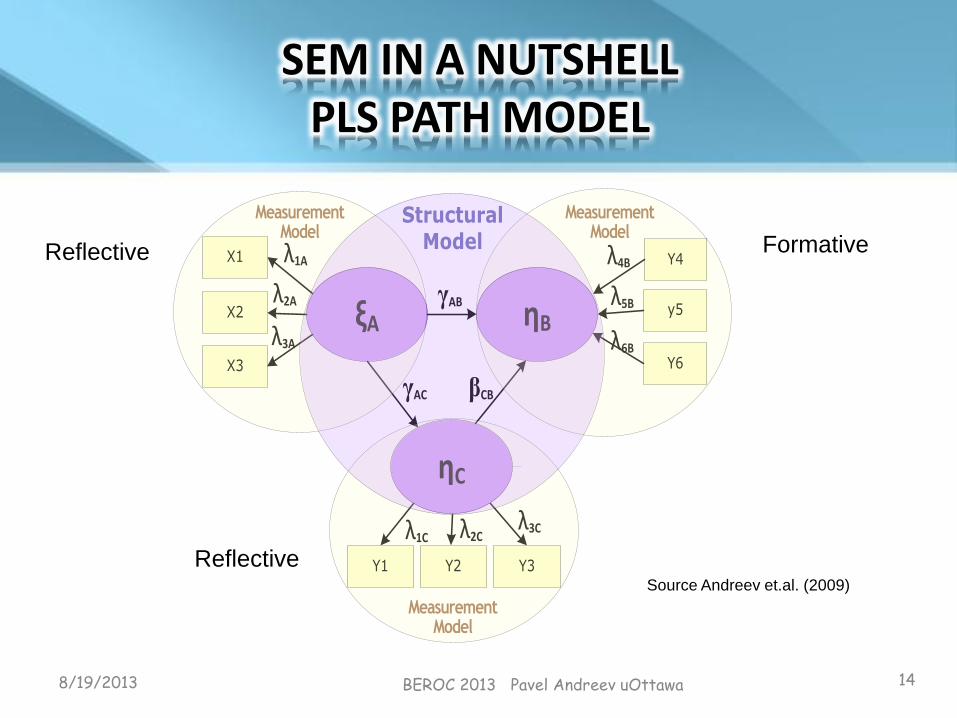
SEM IN A NUTSHELL PLS PATH MODEL
Source Andreev et.al. (2009)
8/19/2013 BEROC 2013 Pavel Andreev uOttawa 14
Y6
y5
Y4
ξA ηB
X3
X2
X1
ηC
Y2 Y3Y1
λ1A
λ2A
λ3A
λ3Cλ2Cλ1C
λ6B
λ5B
λ4B
γAB
γAC βCB
StructuralModel
MeasurementModel
MeasurementModel
MeasurementModel
Reflective Formative
Reflective
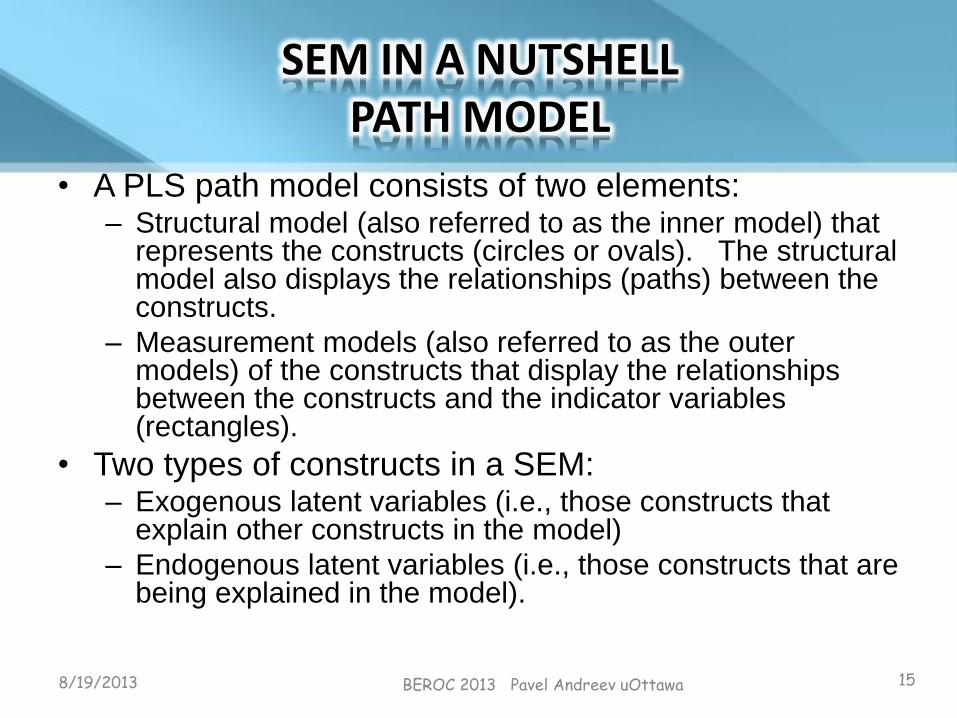
SEM IN A NUTSHELL PATH MODEL
• A PLS path model consists of two elements: – Structural model (also referred to as the inner model) that
represents the constructs (circles or ovals). The structural model also displays the relationships (paths) between the constructs.
– Measurement models (also referred to as the outer models) of the constructs that display the relationships between the constructs and the indicator variables (rectangles).
• Two types of constructs in a SEM: – Exogenous latent variables (i.e., those constructs that
explain other constructs in the model)
– Endogenous latent variables (i.e., those constructs that are being explained in the model).
8/19/2013 BEROC 2013 Pavel Andreev uOttawa 15

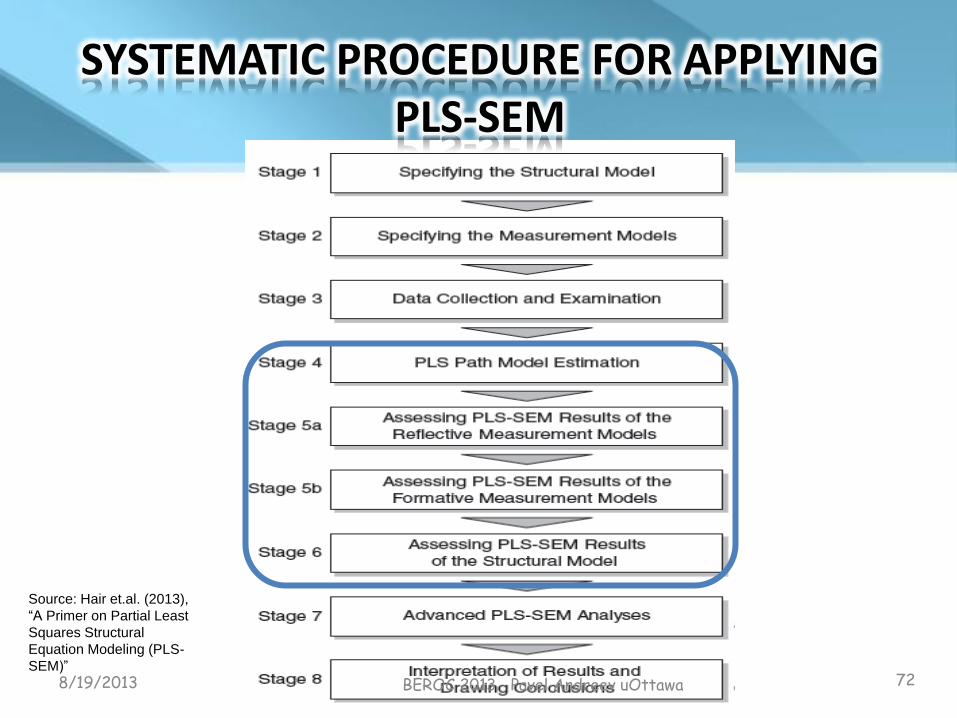
SYSTEMATIC PROCEDURE FOR APPLYING PLS-SEM
Source: Hair et.al. (2013),
“A Primer on Partial Least
Squares Structural
Equation Modeling (PLS-
SEM)”
8/19/2013 BEROC 2013 Pavel Andreev uOttawa 16
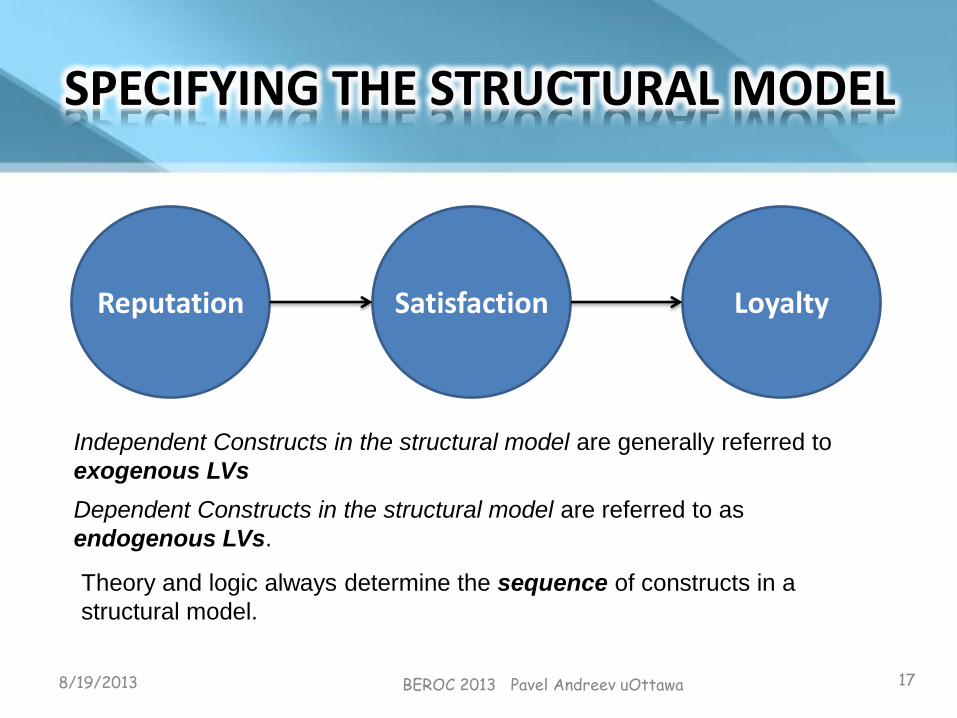
SPECIFYING THE STRUCTURAL MODEL
8/19/2013 BEROC 2013 Pavel Andreev uOttawa 17
Reputation Satisfaction Loyalty
Independent Constructs in the structural model are generally referred to
exogenous LVs
Dependent Constructs in the structural model are referred to as
endogenous LVs.
Theory and logic always determine the sequence of constructs in a
structural model.
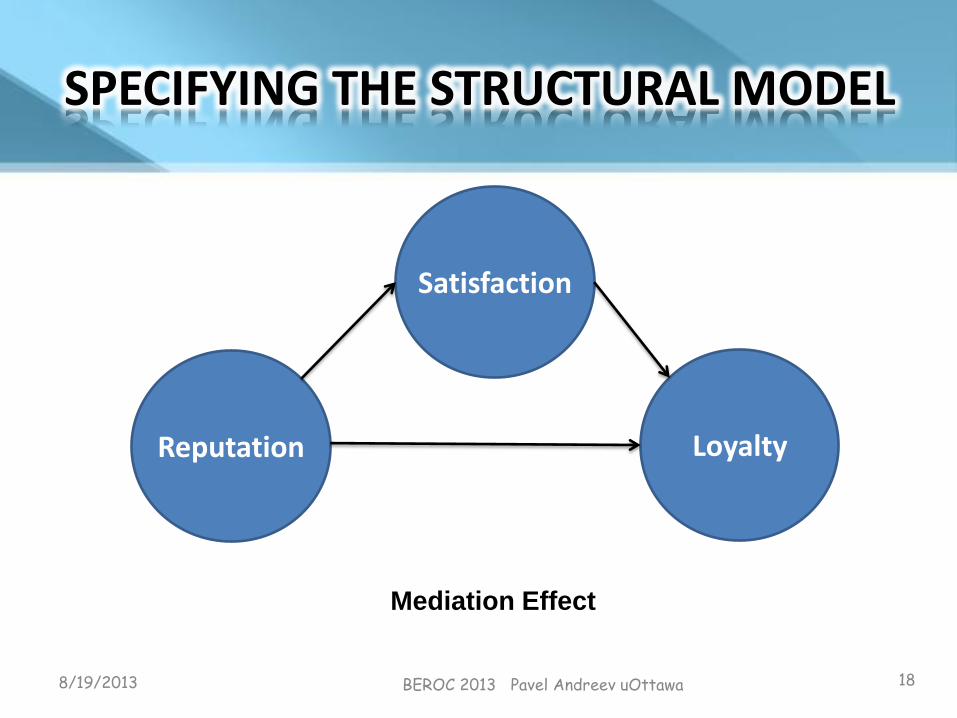
SPECIFYING THE STRUCTURAL MODEL
8/19/2013 BEROC 2013 Pavel Andreev uOttawa 18
Reputation
Satisfaction
Loyalty
Mediation Effect
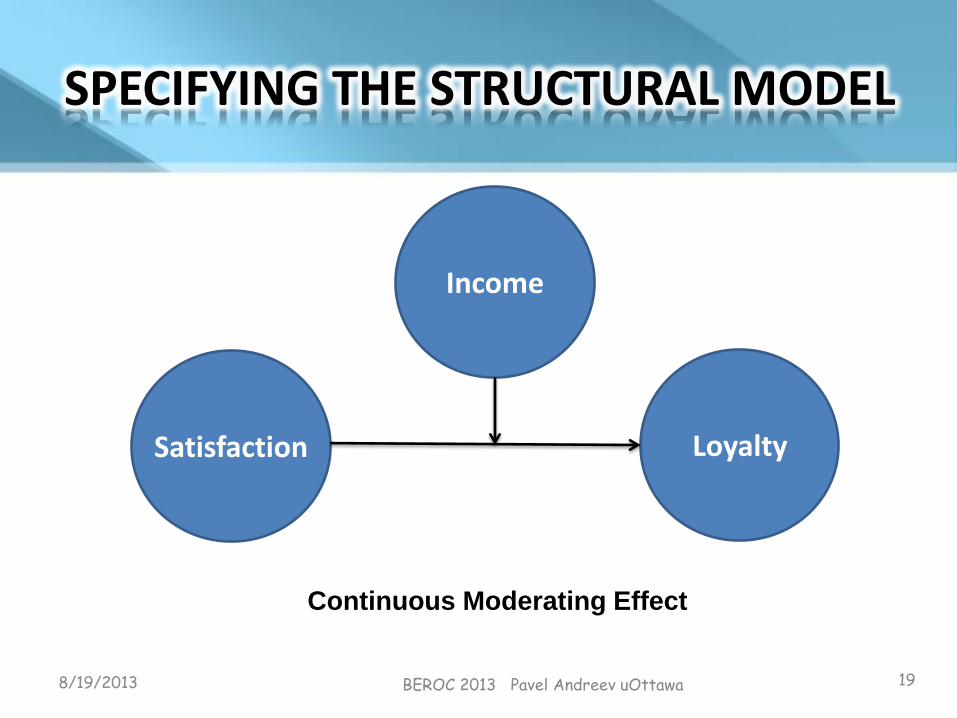
SPECIFYING THE STRUCTURAL MODEL
8/19/2013 BEROC 2013 Pavel Andreev uOttawa 19
Satisfaction
Income
Loyalty
Continuous Moderating Effect
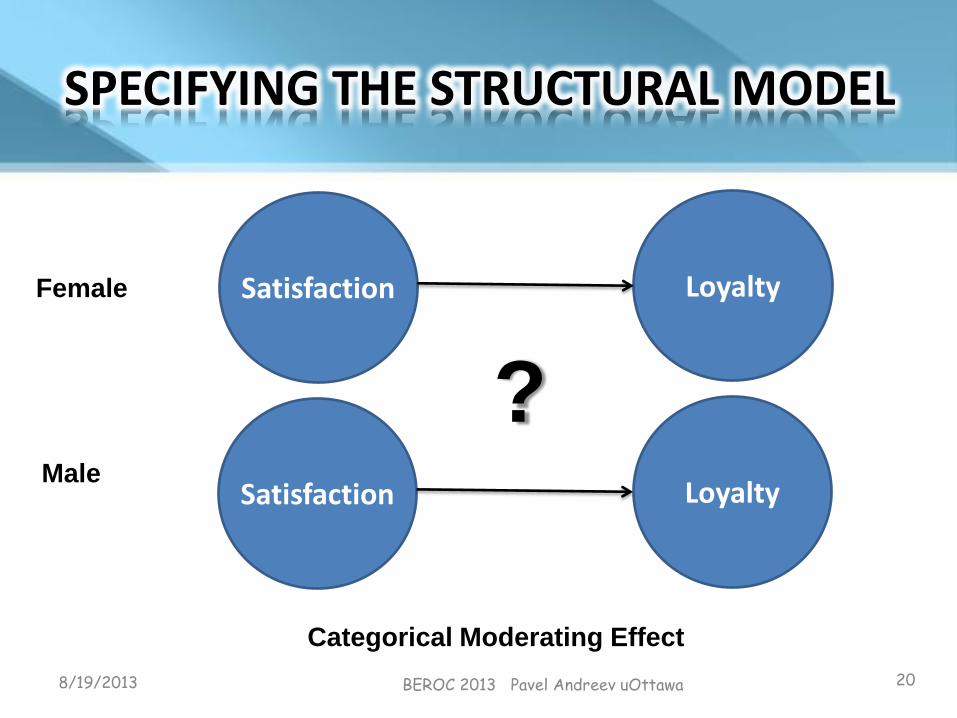
SPECIFYING THE STRUCTURAL MODEL
8/19/2013 BEROC 2013 Pavel Andreev uOttawa 20
Satisfaction Loyalty
Categorical Moderating Effect
Satisfaction Loyalty
Female
Male
?
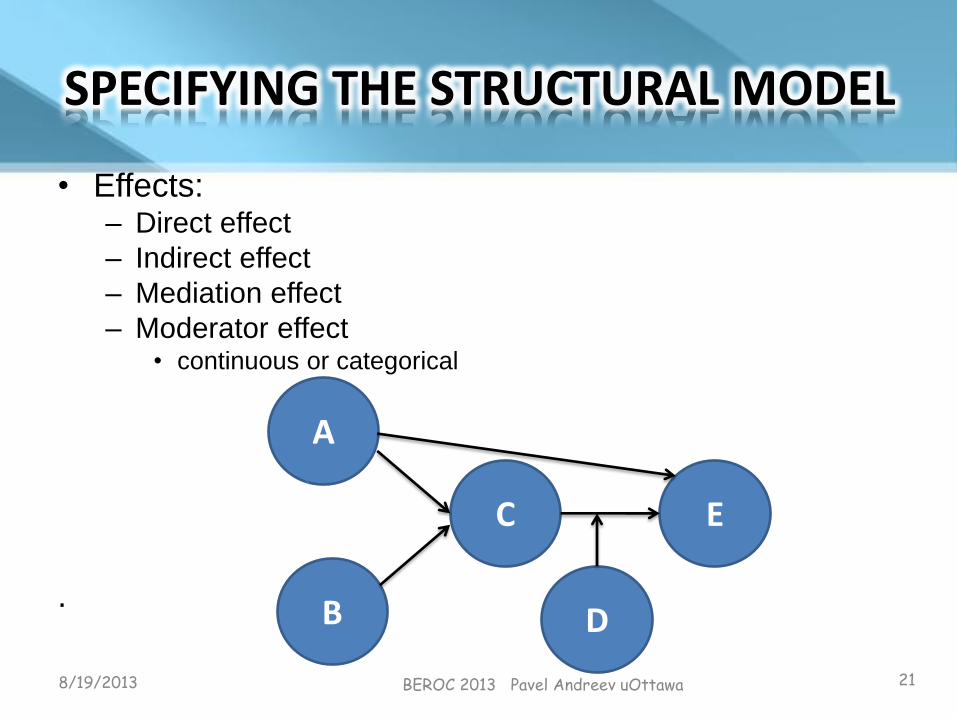
SPECIFYING THE STRUCTURAL MODEL
• Effects: – Direct effect
– Indirect effect
– Mediation effect
– Moderator effect • continuous or categorical
.
8/19/2013 BEROC 2013 Pavel Andreev uOttawa 21
A
C
B
E
D

SYSTEMATIC PROCEDURE FOR APPLYING PLS-SEM
Source: Hair et.al. (2013),
“A Primer on Partial Least
Squares Structural
Equation Modeling (PLS-
SEM)”
8/19/2013 BEROC 2013 Pavel Andreev uOttawa 22

SEM IN A NUTSHELL PATH MODEL
Source Andreev et.al. (2009)
8/19/2013 BEROC 2013 Pavel Andreev uOttawa 23
Y6
y5
Y4
ξA ηB
X3
X2
X1
ηC
Y2 Y3Y1
λ1A
λ2A
λ3A
λ3Cλ2Cλ1C
λ6B
λ5B
λ4B
γAB
γAC βCB
StructuralModel
MeasurementModel
MeasurementModel
MeasurementModel
Reflective Formative
Reflective
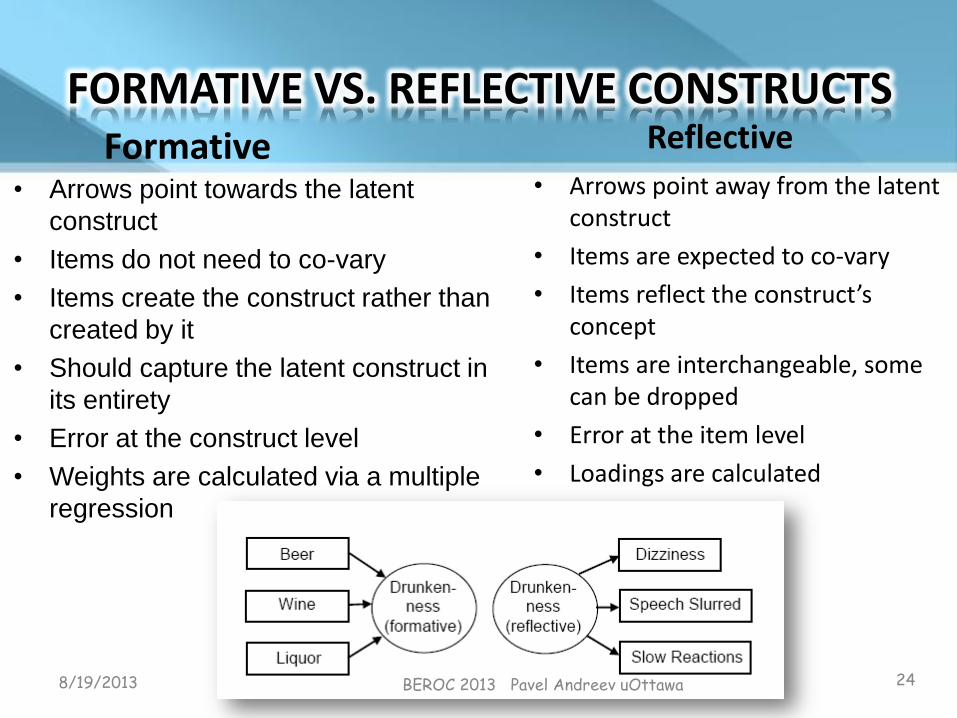
FORMATIVE VS. REFLECTIVE CONSTRUCTS
• Arrows point towards the latent
construct
• Items do not need to co-vary
• Items create the construct rather than
created by it
• Should capture the latent construct in
its entirety
• Error at the construct level
• Weights are calculated via a multiple
regression
8/19/2013 24
Formative Reflective
• Arrows point away from the latent construct
• Items are expected to co-vary
• Items reflect the construct’s concept
• Items are interchangeable, some can be dropped
• Error at the item level
• Loadings are calculated
BEROC 2013 Pavel Andreev uOttawa
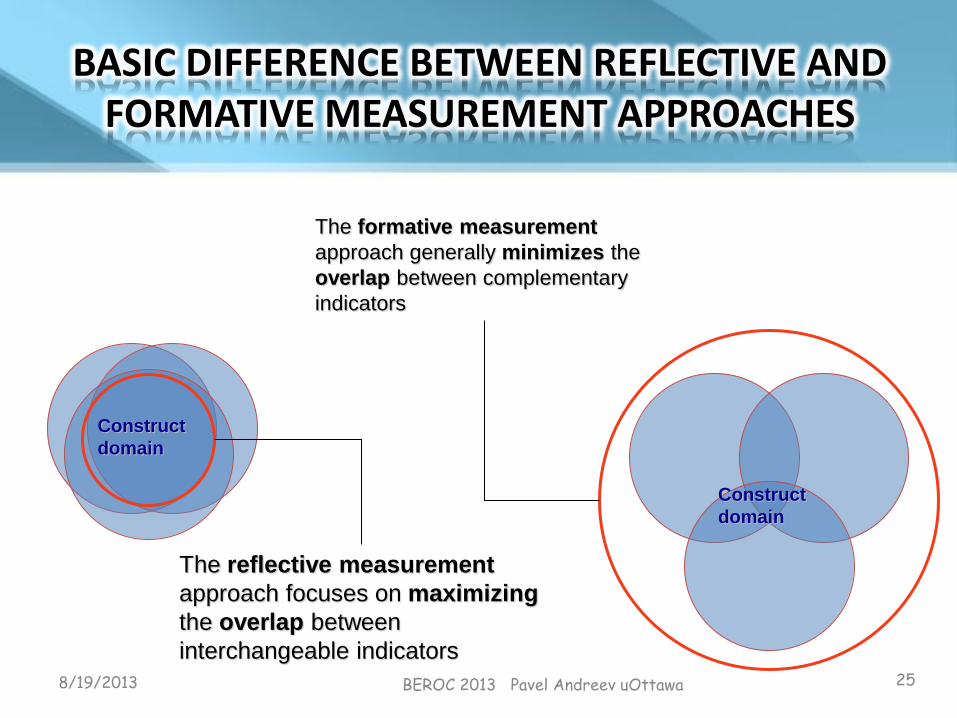
The reflective measurement
approach focuses on maximizing
the overlap between
interchangeable indicators
The formative measurement
approach generally minimizes the
overlap between complementary
indicators
Construct
domain
Construct
domain
BASIC DIFFERENCE BETWEEN REFLECTIVE AND FORMATIVE MEASUREMENT APPROACHES
8/19/2013 BEROC 2013 Pavel Andreev uOttawa 25
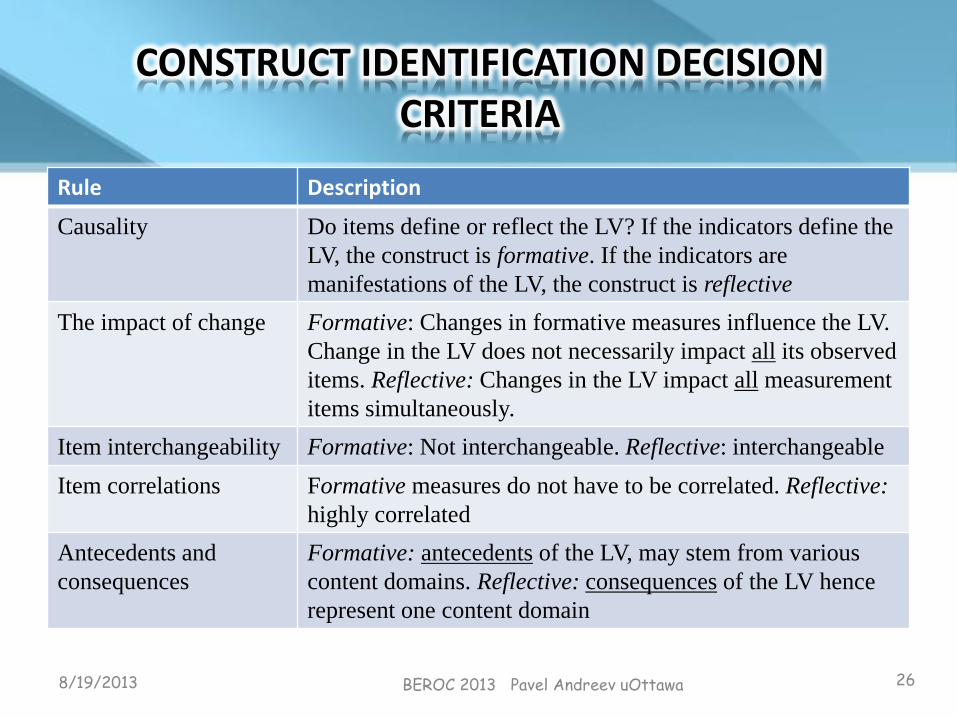
CONSTRUCT IDENTIFICATION DECISION CRITERIA
Description Rule
Do items define or reflect the LV? If the indicators define the
LV, the construct is formative. If the indicators are
manifestations of the LV, the construct is reflective
Causality
Formative: Changes in formative measures influence the LV.
Change in the LV does not necessarily impact all its observed
items. Reflective: Changes in the LV impact all measurement
items simultaneously.
The impact of change
Formative: Not interchangeable. Reflective: interchangeable Item interchangeability
Formative measures do not have to be correlated. Reflective:
highly correlated
Item correlations
Formative: antecedents of the LV, may stem from various
content domains. Reflective: consequences of the LV hence
represent one content domain
Antecedents and
consequences
8/19/2013 BEROC 2013 Pavel Andreev uOttawa 26
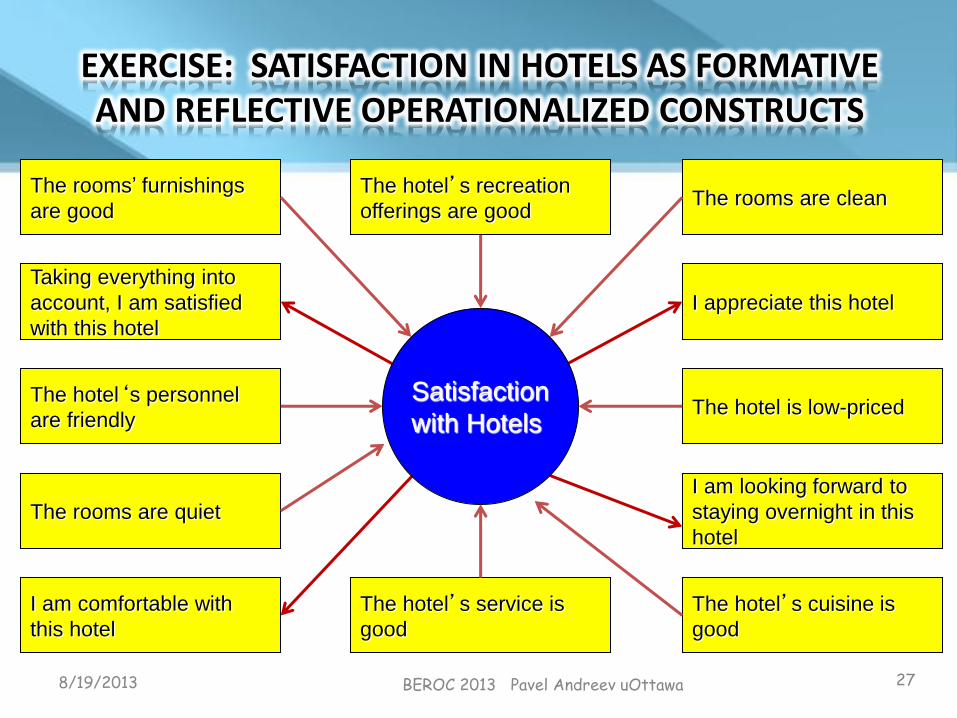
I am comfortable with
this hotel
I appreciate this hotel
I am looking forward to
staying overnight in this
hotel
The rooms’ furnishings
are good
The rooms are quiet
The hotel‘s personnel
are friendly
The hotel’s service is
good
The hotel’s cuisine is
good
The hotel’s recreation
offerings are good The rooms are clean
Taking everything into
account, I am satisfied
with this hotel
The hotel is low-priced Satisfaction
with Hotels
EXERCISE: SATISFACTION IN HOTELS AS FORMATIVE AND REFLECTIVE OPERATIONALIZED CONSTRUCTS
8/19/2013 BEROC 2013 Pavel Andreev uOttawa 27
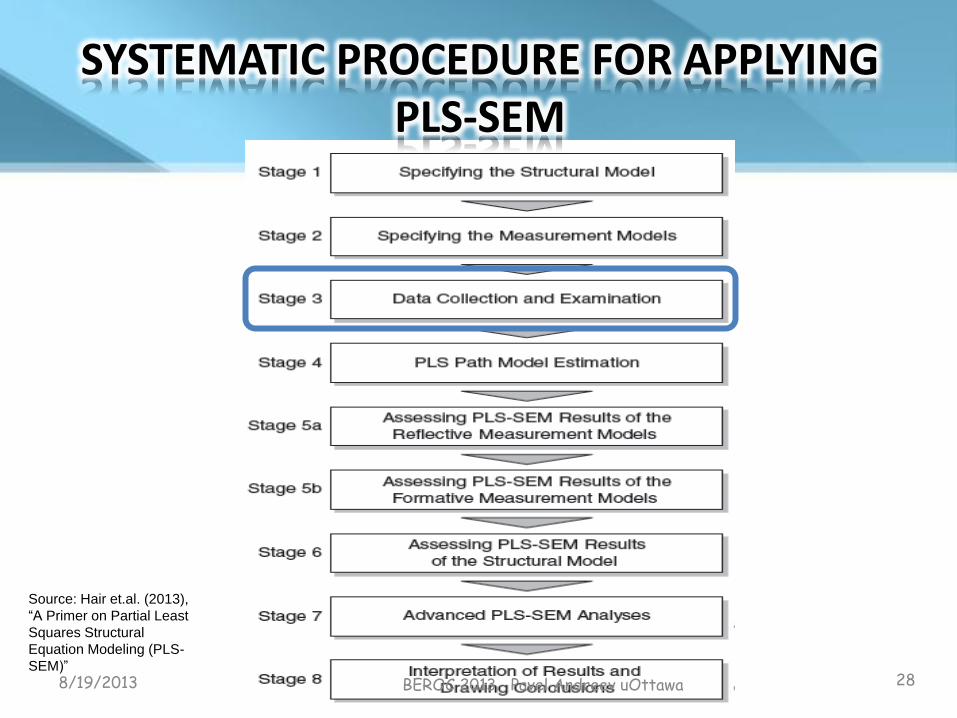
SYSTEMATIC PROCEDURE FOR APPLYING PLS-SEM
Source: Hair et.al. (2013),
“A Primer on Partial Least
Squares Structural
Equation Modeling (PLS-
SEM)”
8/19/2013 BEROC 2013 Pavel Andreev uOttawa 28

DATA
• Data Issues:
– Data Type
– Scale
– Number of Indicators per Construct
– Distribution
– Sample size
– Missing Data
8/19/2013 BEROC 2013 Pavel Andreev uOttawa 29
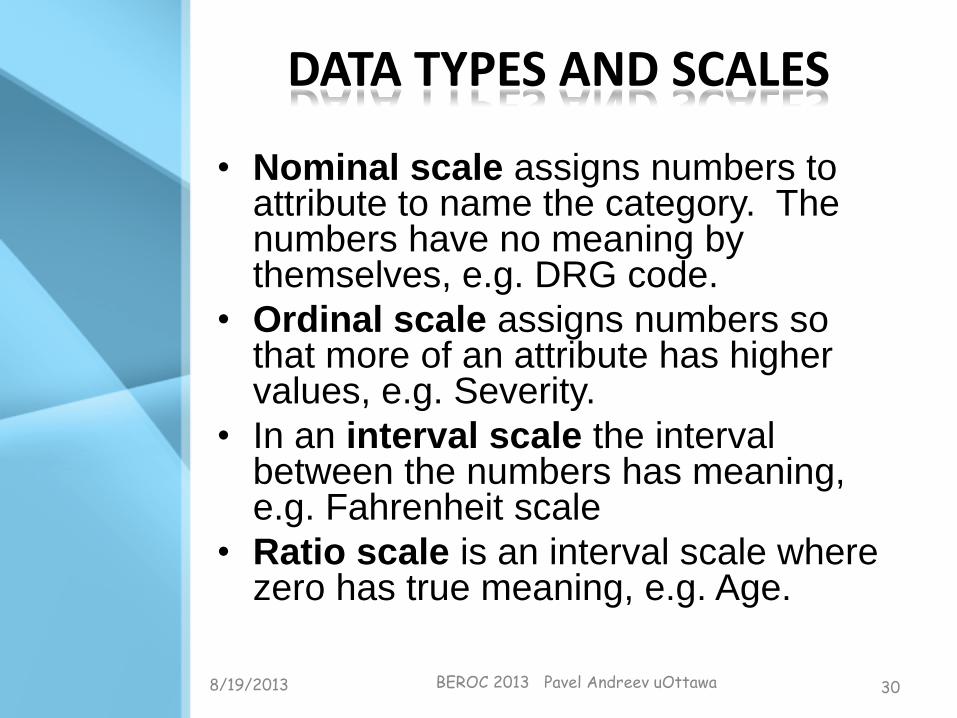
• Nominal scale assigns numbers to attribute to name the category. The numbers have no meaning by themselves, e.g. DRG code.
• Ordinal scale assigns numbers so that more of an attribute has higher values, e.g. Severity.
• In an interval scale the interval between the numbers has meaning, e.g. Fahrenheit scale
• Ratio scale is an interval scale where zero has true meaning, e.g. Age.
DATA TYPES AND SCALES
8/19/2013 BEROC 2013 Pavel Andreev uOttawa 30

• Reflective
• Formative
8/19/2013 BEROC 2013 Pavel Andreev uOttawa 31
NUMBER OF INDICATORS PER CONSTRUCT
• PLS-SEM’s statistical properties provide very robust model estimations with data that have normal as well as extremely nonnormal (i.e., skewness and/or kurtosis) distributional properties. Collinearity, heteroscedasticity, and influential outliers, however, do influence the OLS regressions in PLS-SEM, and researchers should evaluate the data and results for these issues.
8/19/2013 BEROC 2013 Pavel Andreev uOttawa 32
DISTRIBUTION
• PLS-SEM is less restrictive than CV-SEM regardless of the level of the model complexity.
• The rule of thumb:
– The 10 times rule indicates the sample size should be not less than:
• (1) 10 times the largest number of formative indicators used to measure a single construct, or
• (2) 10 times the largest number of structural paths directed at a particular latent construct in the structural model.
8/19/2013 BEROC 2013 Pavel Andreev uOttawa 33
SAMPLE SIZE
• For reasonable limits (i.e., less
than 5% values missing per
indicator), missing value treatment
options such as mean
replacement, EM (expectation-
maximization algorithm), and
nearest neighbor generally result
in only slightly different PLS-SEM
estimations.
8/19/2013 BEROC 2013 Pavel Andreev uOttawa 34
MISSING VALUES

SYSTEMATIC PROCEDURE FOR APPLYING PLS-SEM
Source: Hair et.al. (2013),
“A Primer on Partial Least
Squares Structural
Equation Modeling (PLS-
SEM)”
8/19/2013 BEROC 2013 Pavel Andreev uOttawa 35
8/19/2013 BEROC 2013 Pavel Andreev uOttawa 36
AGENDA
• Introduction to PLS modeling basics
• Examples of research with implementation of PLS as research methodology 1. Modeling Open Innovation strategies of
an organization
2. Modeling Willingness to conduct m-payments
• Assessment of PLS model – Guideline for validation procedure
– Examples of the validation procedure
• Practice (if we have time)
1. Leveraging a Network of Outsiders: Exploring the Sources for
Open Innovation and Impacts on Innovation Effects
Pavel Andreev Joseph Feller Patrick Finnegan Philip O’Reilly Jeffrey Moretz
CHALLENGES
• Innovation expectations
• Information overload
• Penetration of technologies
• The need of dynamically changing BM
• Karim R. Lakhani (2007):
– companies that perform best and especially in
a tough economy are those that innovate and
are open to outside ideas.
8/19/2013 BEROC 2013 Pavel Andreev uOttawa 38
BACKGROUND
• Innovation challenge was addressed internally – NO innovation exchanges with external parties
– Leverage the competencies of employees within the context of internal projects
– exploiting these projects through the existing business models of the firm
• Innovation=Knowledge – “No one company acting alone can hope to out-
innovate every competitor, potential competitor, supplier or external knowledge source” (Quinn 2000 p.13).
8/19/2013 BEROC 2013 Pavel Andreev uOttawa 39
OPEN INNOVATION
• “Open innovation, “a paradigm that assumes that firms can and should use external and internal ideas, and internal and external paths to market…The business model utilizes both external and internal ideas to create value” (Chesbrough 2003 p. xxiv).
8/19/2013 BEROC 2013 Pavel Andreev uOttawa 40
8/19/2013 BEROC 2013 Pavel Andreev uOttawa 41
EXAMPLES
http://www.openinnovators.net/list-open-innovation-crowdsourcing-examples/
MOTIVATION
• “The new leaders in innovation will be those who figure out the best way to leverage a network of outsiders” (Pisano and Verganti 2008)
• Lack of empirical research on the success
of the various open innovation strategies
that organizations can pursue to be high
performance organizations
8/19/2013 BEROC 2013 Pavel Andreev uOttawa 42
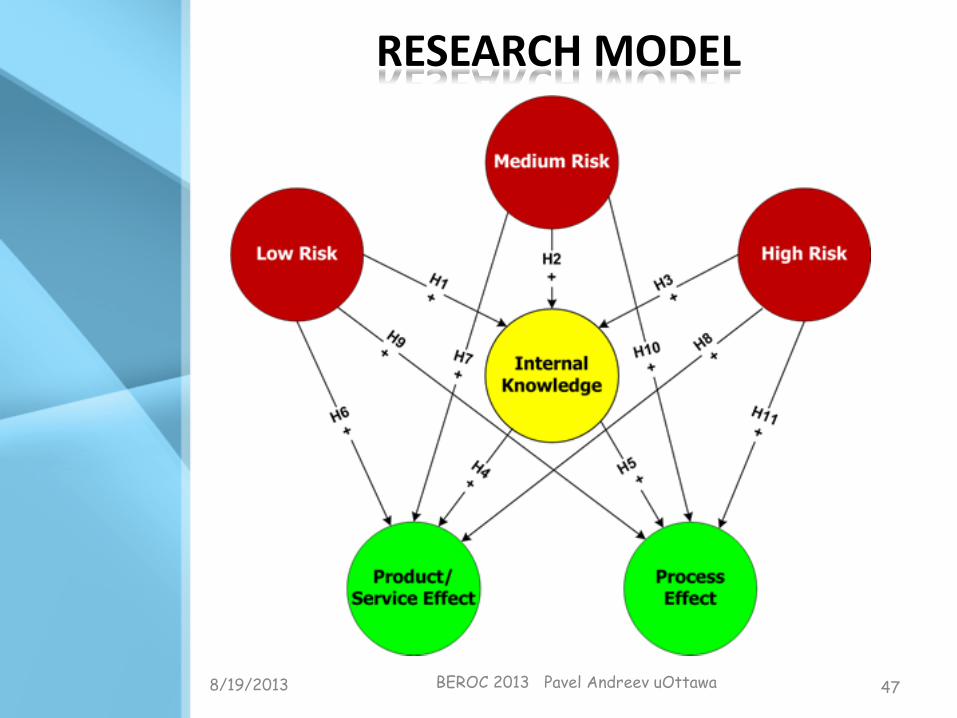
RESEARCH OBJECTIVE
• To understand how organizations can
leverage a network of outsiders to
increase their innovation performance
– explore the impacts of various sources of
open innovation on an organization’s internal
knowledge, process innovation, and
product/service innovation
8/19/2013 BEROC 2013 Pavel Andreev uOttawa 43
BACKGROUND
• Innovation is all about knowledge.
– An organization’s internal knowledge base is
widely identified as a key resource for
individual firms (e.g. Drucker, 1993; Winter, 1987)
and a key driver of competitive advantage (Dunford, 2000; Nonaka et al., 1995).
8/19/2013 BEROC 2013 Pavel Andreev uOttawa 44
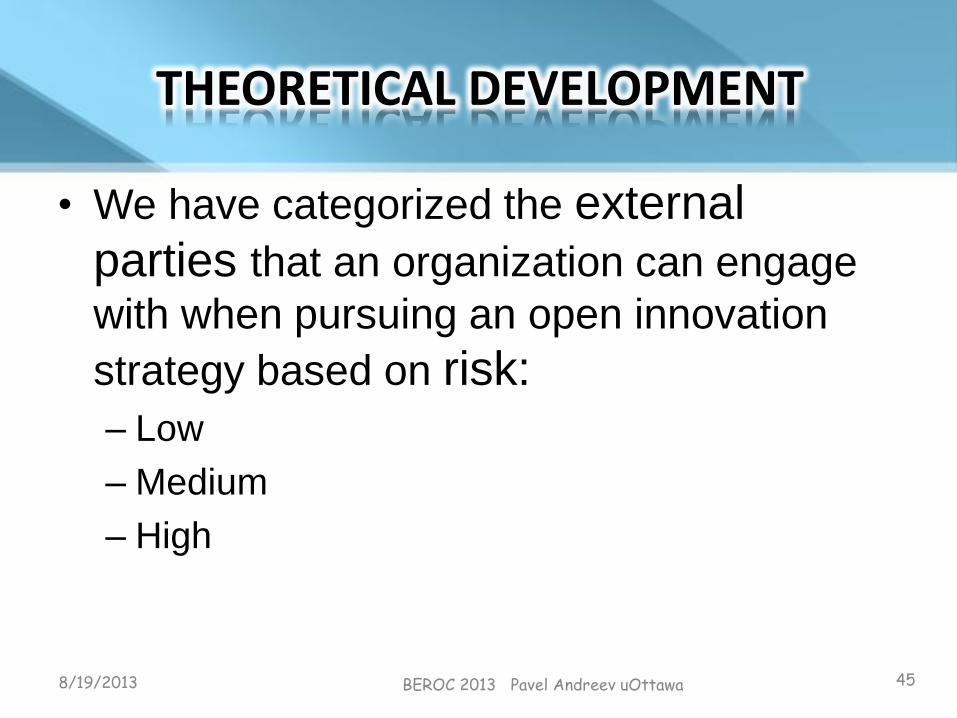
THEORETICAL DEVELOPMENT
• We have categorized the external
parties that an organization can engage
with when pursuing an open innovation
strategy based on risk: – Low
– Medium
– High
8/19/2013 BEROC 2013 Pavel Andreev uOttawa 45
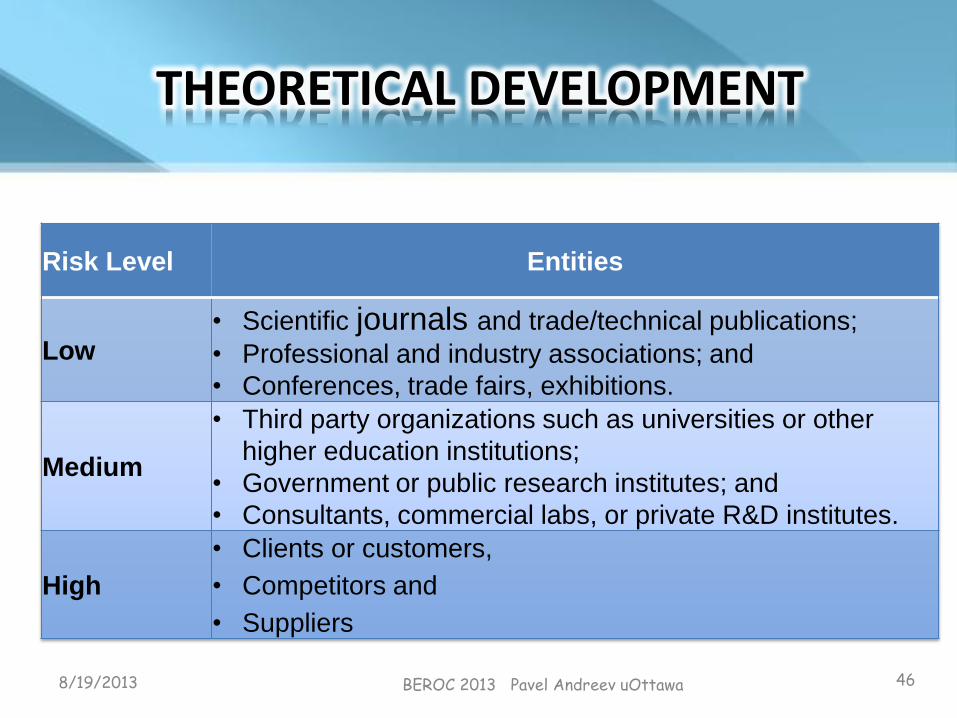
THEORETICAL DEVELOPMENT
8/19/2013 BEROC 2013 Pavel Andreev uOttawa 46
Risk Level Entities
Low • Scientific journals and trade/technical publications;
• Professional and industry associations; and
• Conferences, trade fairs, exhibitions.
Medium
• Third party organizations such as universities or other
higher education institutions;
• Government or public research institutes; and
• Consultants, commercial labs, or private R&D institutes.
High
• Clients or customers,
• Competitors and
• Suppliers
8/19/2013 BEROC 2013 Pavel Andreev uOttawa 47
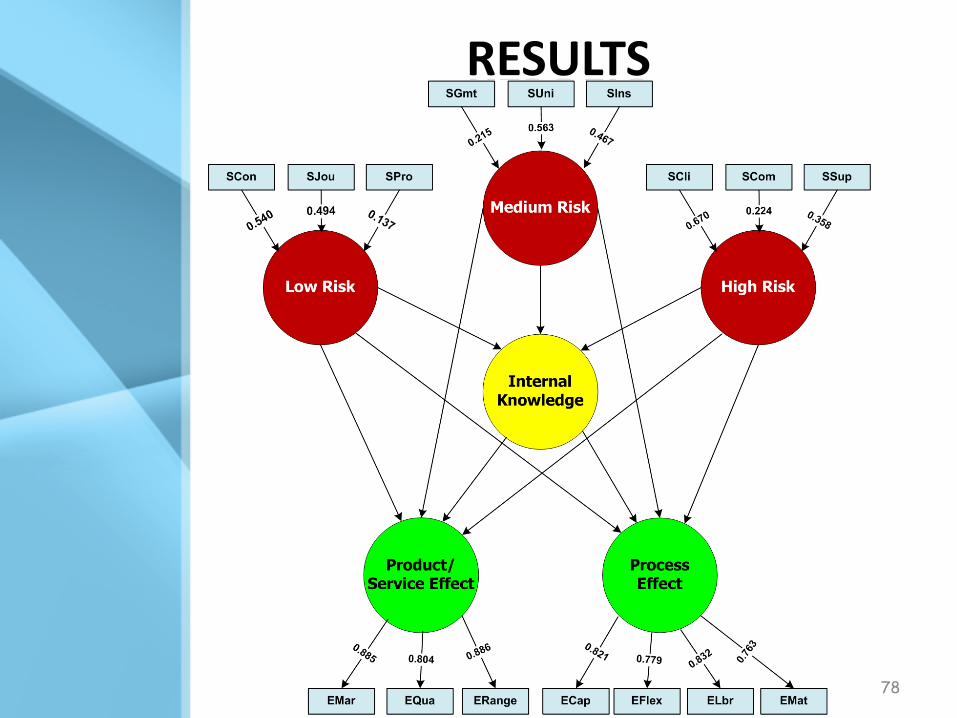
RESEARCH MODEL
8/19/2013 BEROC 2013 Pavel Andreev uOttawa 48
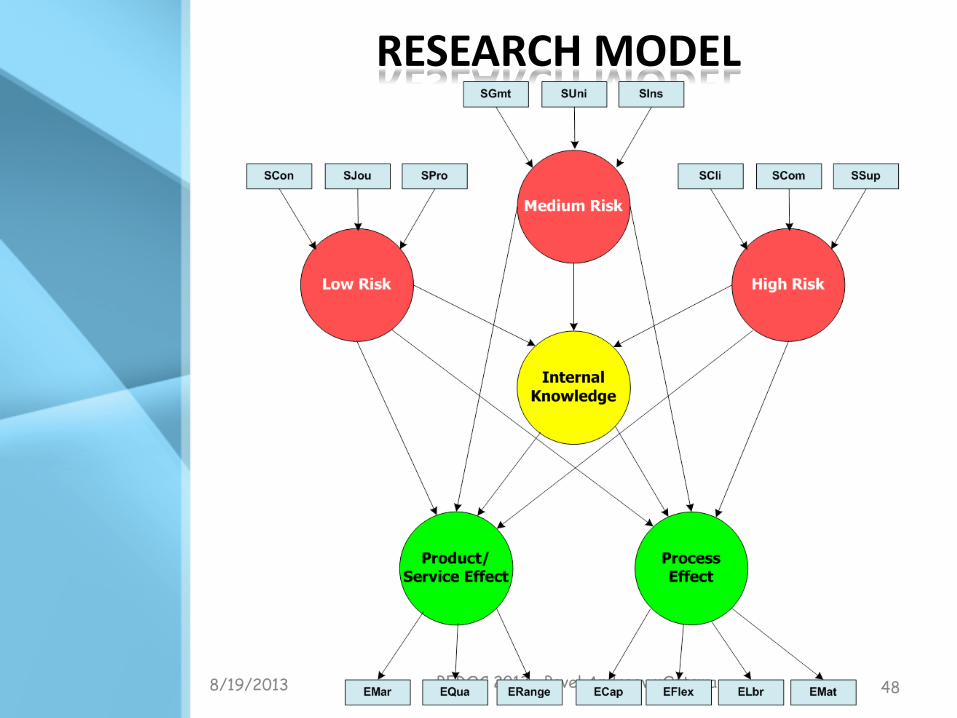
RESEARCH MODEL
DATA
• Data from the 4th Community Innovation Survey (CIS) – a series of surveys executed by national
statistical offices throughout the EU
• Denmark – an 'innovation leader' in the 2008
– data was obtained from 4,054 companies, representing a response rate of 62%
– Our dataset reports on 3,236 (after data cleaning)
8/19/2013 BEROC 2013 Pavel Andreev uOttawa 49
8/19/2013 BEROC 2013 Pavel Andreev uOttawa 50
RESULTS
CONTRIBUTION
• Understanding of how open innovation
affects an organizational innovation
performance
• First conceptualization
• Development & empirical innovation
strategies model validation
8/19/2013 BEROC 2013 Pavel Andreev uOttawa 51
CONCLUSION I – ABSORPTIVE CAPACITY
• There is a need to ensure meaningful
engagement with external sources.
– The relatively low impact of traditional
external sources of innovation (considered
low and medium risk) on internal knowledge
– The imperative to engage with competitors,
suppliers, and customers in order to enhance
innovation knowledge within an organization.
8/19/2013 BEROC 2013 Pavel Andreev uOttawa 52
CONCLUSION II
• The effect of high-risk innovation sources
on process and product/service innovation
is revealed being as important as the
effect of internal innovation knowledge.
• The most dramatic improvements in
innovation may be derived from working
with competitors, customers, and
suppliers.
8/19/2013 BEROC 2013 Pavel Andreev uOttawa 53
2. To M-Pay or not to M-Pay – Realizing the Potential of Smart
Phones: Conceptual Modeling and Empirical Validation
Pavel Andreev Philip O’Reilly Aidan Duane
THE PURPOSE OF THE STUDY
To conceptualize consumers’ willingness to
use Smart Mobile Media Devices (SMMD) for
M-Payments for products/services, and to
empirically validate the model.
8/19/2013 BEROC 2013 Pavel Andreev uOttawa 55
DEFINITION – M-PAYMENT
“M-Payments are payments made or enabled
through digital mobility technologies, via SMMD,
with or without the use of mobile
telecommunications networks. These payments
are digital financial transactions, although not
necessarily linked to financial institutions or
banks”
Dinez et al. (2011)
8/19/2013 BEROC 2013 Pavel Andreev uOttawa 56

DEFINITION - SMMD
• The Smart Phone is dead, long live the SMMD
• A Smart Mobile Media Device (SMMD) is an electronic mobile networked device that provides mobile network subscribers with integrated functions and Smart Mobile Media Services (SMMS) including:
– phone, SMS and MMS; GPS and LBS; photo and video cameras; music players/recorders; email and mobile web access; and downloadable free/fee based applications; etc.
8/19/2013 BEROC 2013 Pavel Andreev uOttawa 57
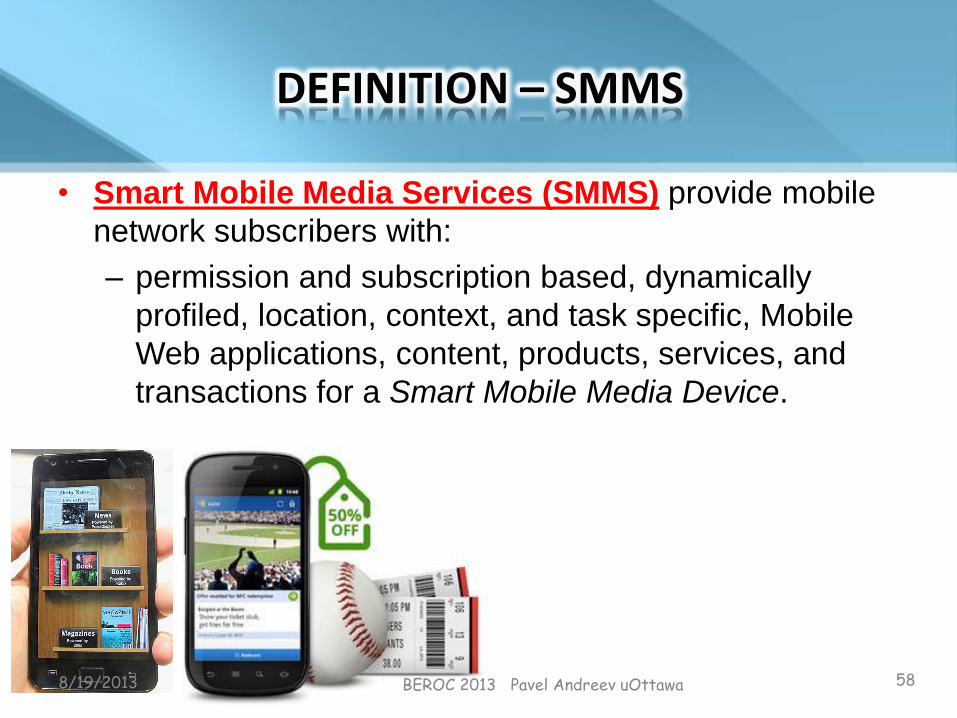
DEFINITION – SMMS
• Smart Mobile Media Services (SMMS) provide mobile
network subscribers with:
– permission and subscription based, dynamically
profiled, location, context, and task specific, Mobile
Web applications, content, products, services, and
transactions for a Smart Mobile Media Device.
8/19/2013 BEROC 2013 Pavel Andreev uOttawa 58

M-PAYMENT FACILITATES THE GROWTH OF SMMS
• A variety of technologies:
– NFS-powered SMMD
– Square (Richard Branson)
– MNOs, banks, financial
institutions…
• However, willingness to M-Pay is
still low
8/19/2013 BEROC 2013 Pavel Andreev uOttawa 59
THE RESEARCH ISSUE
• The commercial potential of SMMS via SMMD
for M-Commerce organizations is enormous
• M-Payment completes M-Commerce
transactional loop
• Willingness to M-Pay is the greatest impediment
to Smart Mobile Media Services (SMMS)
adoption.
• While growth forecasts for M-Payment have
been very positive, the reality is quite different Schierz et al. (2010)
8/19/2013 BEROC 2013 Pavel Andreev uOttawa 60
THE RESEARCH ISSUE
• Realizing consumers’ willingness to use Smart
Mobile Media Devices (SMMD) for M-Payments
is highly critical to expend the performance
horizon
• If Smart Mobile Media Services are to realise their
full potential, the ability of consumers to Transact
and M-Pay using their Smart Mobile Media Devices
in an easy, secure, reliable, and consistent manner
must be addressed.
• The lack of research is of concern
8/19/2013 BEROC 2013 Pavel Andreev uOttawa 61

THEORETICAL BACKGROUND
• Technology Acceptance Model -
TAM (Davis,1989)
• Diffusion of innovations - DoI (Rogers,1995, 2002)
• Perceived characteristics of
innovations - PCI (Moore &
Benbasat, 1991).
8/19/2013 BEROC 2013 Pavel Andreev uOttawa 62
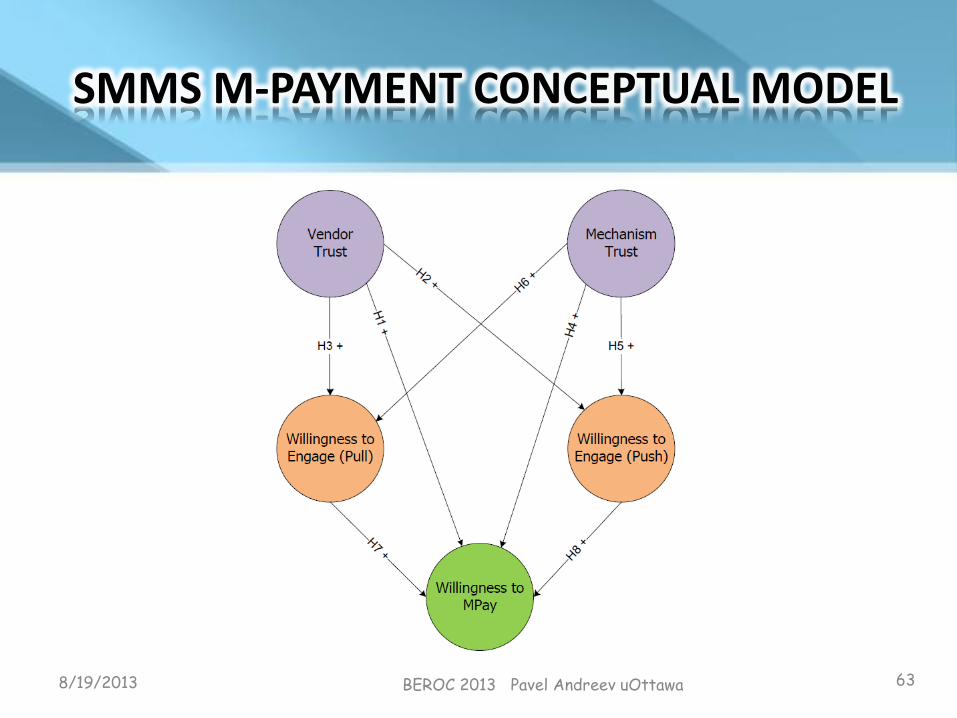
SMMS M-PAYMENT CONCEPTUAL MODEL
8/19/2013 BEROC 2013 Pavel Andreev uOttawa 63
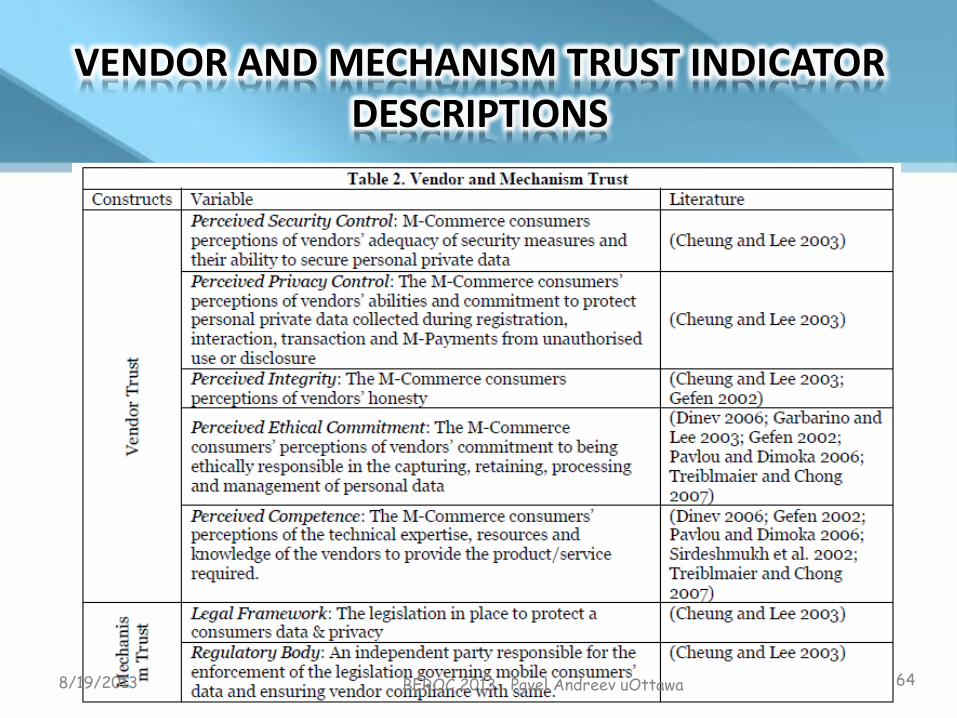
VENDOR AND MECHANISM TRUST INDICATOR DESCRIPTIONS
8/19/2013 BEROC 2013 Pavel Andreev uOttawa 64
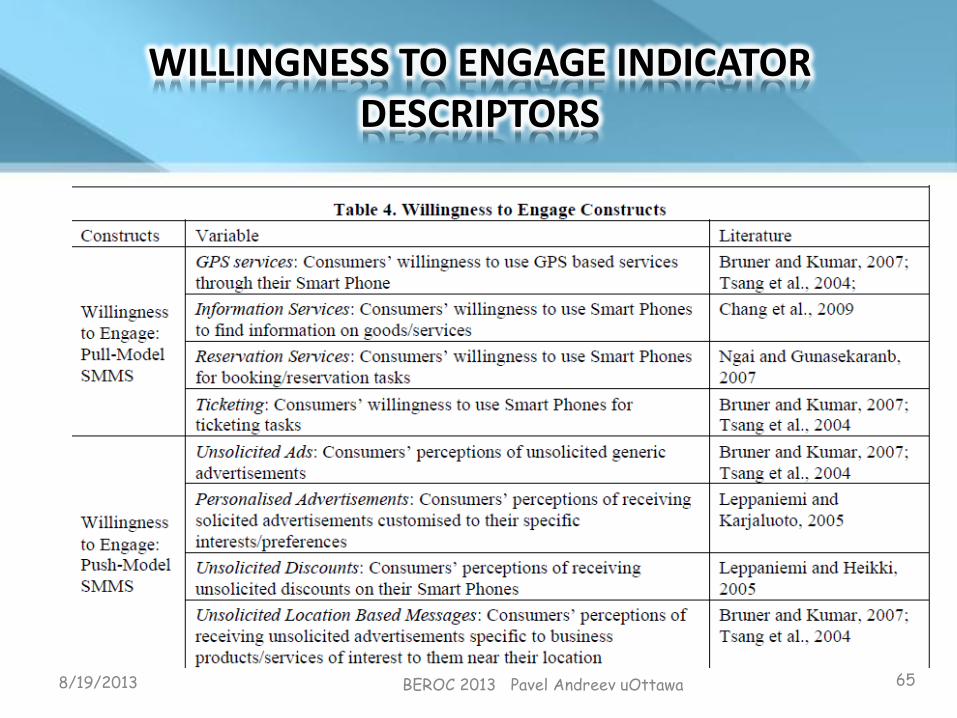
WILLINGNESS TO ENGAGE INDICATOR DESCRIPTORS
8/19/2013 BEROC 2013 Pavel Andreev uOttawa 65
RESEARCH METHOD
• Data Collection
– Survey pre-tested with SMMS “experts”.
– Then hosted on Survey Monkey for 1 month
in June 2010.
• 82 valid responses from 12 of 26 Irish regions – 3
largest cities accounted for 68% of responses.
8/19/2013 BEROC 2013 Pavel Andreev uOttawa 66
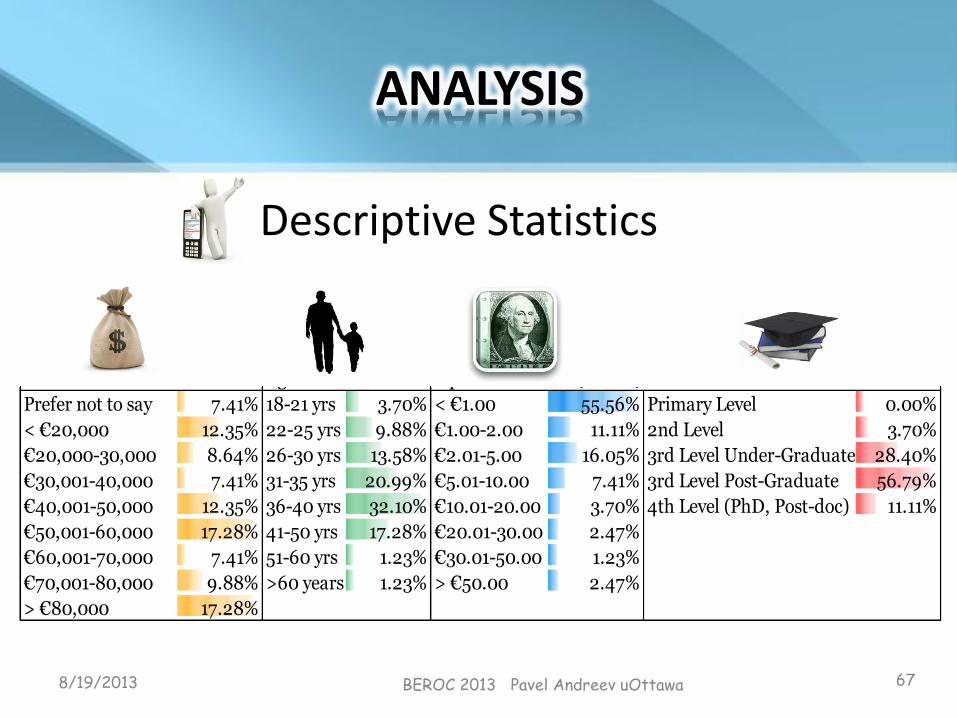
ANALYSIS
Income Age Spend on SMMS (month) Education
Prefer not to say 7.41% 18-21 yrs 3.70% < €1.00 55.56% Primary Level 0.00%
< €20,000 12.35% 22-25 yrs 9.88% €1.00-2.00 11.11% 2nd Level 3.70%
€20,000-30,000 8.64% 26-30 yrs 13.58% €2.01-5.00 16.05% 3rd Level Under-Graduate 28.40%
€30,001-40,000 7.41% 31-35 yrs 20.99% €5.01-10.00 7.41% 3rd Level Post-Graduate 56.79%
€40,001-50,000 12.35% 36-40 yrs 32.10% €10.01-20.00 3.70% 4th Level (PhD, Post-doc) 11.11%
€50,001-60,000 17.28% 41-50 yrs 17.28% €20.01-30.00 2.47%
€60,001-70,000 7.41% 51-60 yrs 1.23% €30.01-50.00 1.23%
€70,001-80,000 9.88% >60 years 1.23% > €50.00 2.47%
> €80,000 17.28%
Descriptive Statistics
8/19/2013 BEROC 2013 Pavel Andreev uOttawa 67
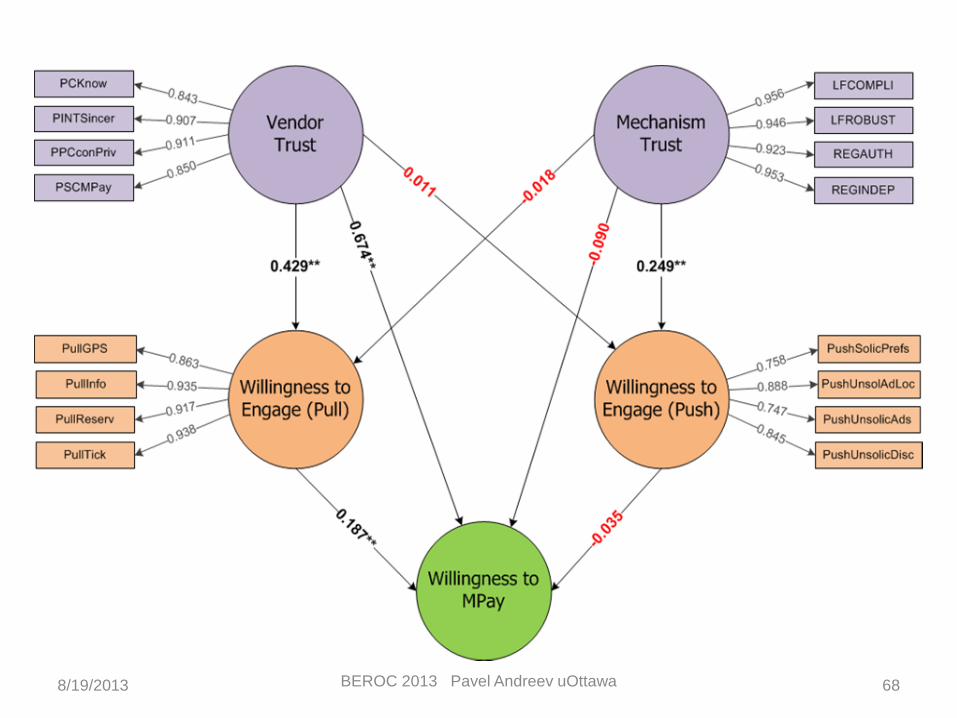
ASSESSMENT OF THE MODEL
8/19/2013 BEROC 2013 Pavel Andreev uOttawa 68
KEY RESEARCH FINDING 1
• The study presents evidence of the association between Vendor Trust and consumers’ Willingness to make an M-Payment using an SMMD.
– Vendor Trust and consumer’s Willingness to Engage in Pull SMMS positively impact on consumers’ Willingness to Make an M-Payment.
– The study shows that Vendor Trust does not statistically impact on Willingness to Engage in Push SMMS.
THIS MAY MEAN THAT CONSUMERS:
• are more willing to M-Pay for products/services proactively searched for and pulled to their SMMD from a trusted Vendor, while less likely to M-Pay for products/services pushed to their SMMD by Vendors without being asked to do so.
• perceive greater control over pull-based services as the decision to initiate contact with the Vendor is volitional and location based information may only be provided to complete the transaction.
8/19/2013 BEROC 2013 Pavel Andreev uOttawa 69
KEY RESEARCH FINDING 2
• The study shows that Willingness to Engage in Push is positively impacted by Mechanism Trust.
– Two measurement variables of Mechanism Trust (LFCOMPLI and LFROBUST) that represent compliance and robustness of the legal framework also have a high loading on Vendor Trust.
• The study shows that Mechanism Trust does not statistically impact consumer’s Willingness to M-Pay.
THIS MAY MEAN THAT CONSUMERS:
• are more concerned with legislation and regulation as it pertains to Push Model SMMS and Vendor Trust.
• may be more Willing to Engage in Push SMMS with Vendors in the future, once there is adequate legislation to protect data and privacy, and an independent party responsible for the enforcement of the legislation.
8/19/2013 BEROC 2013 Pavel Andreev uOttawa 70

8/19/2013 BEROC 2013 Pavel Andreev uOttawa 71
AGENDA
• Introduction to PLS modeling basics
• Examples of research with implementation of PLS as research methodology 1. Modeling Open Innovation strategies of
an organization
2. Modeling Willingness to conduct m-payments
• Assessment of PLS model – Guideline for validation procedure
– Examples of the validation procedure
• Practice (if we have time)
SYSTEMATIC PROCEDURE FOR APPLYING PLS-SEM
Source: Hair et.al. (2013),
“A Primer on Partial Least
Squares Structural
Equation Modeling (PLS-
SEM)”
8/19/2013 BEROC 2013 Pavel Andreev uOttawa 72
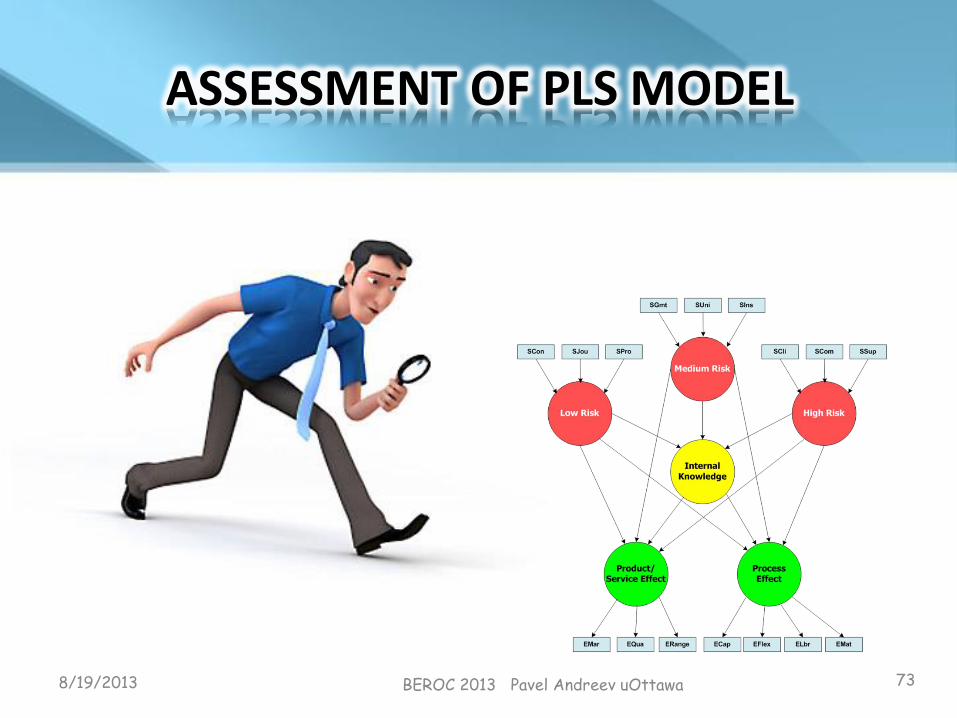
ASSESSMENT OF PLS MODEL
8/19/2013 BEROC 2013 Pavel Andreev uOttawa 73
PLS MODEL EVALUATION
• Model Evaluation
– Testing the quality of the measurement models (outer)
• Reliability
• Validity
– Assessment of the structural model (inner) • Assessment of effects
• Prediction quality
– SmartPLS 2.0 M3 was used for the PLS model assessment.
8/19/2013 BEROC 2013 Pavel Andreev uOttawa 74
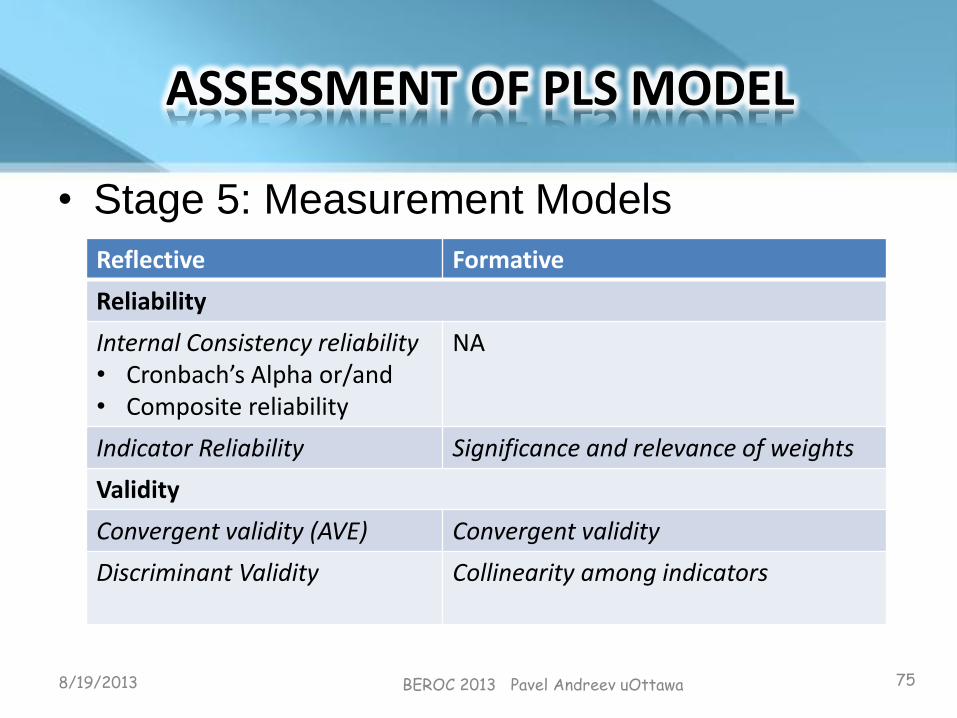
ASSESSMENT OF PLS MODEL
• Stage 5: Measurement Models
8/19/2013 BEROC 2013 Pavel Andreev uOttawa 75
Reflective Formative
Reliability
Internal Consistency reliability • Cronbach’s Alpha or/and • Composite reliability
NA
Indicator Reliability Significance and relevance of weights
Validity
Convergent validity (AVE) Convergent validity
Discriminant Validity
Collinearity among indicators
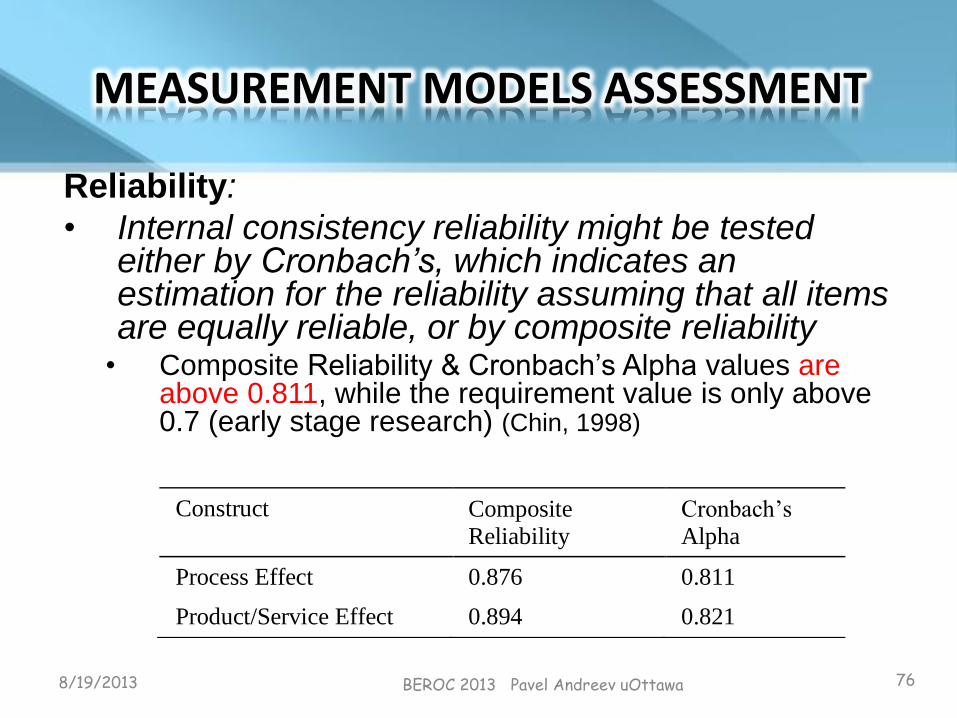
MEASUREMENT MODELS ASSESSMENT
Reliability:
• Internal consistency reliability might be tested either by Cronbach’s, which indicates an estimation for the reliability assuming that all items are equally reliable, or by composite reliability
• Composite Reliability & Cronbach’s Alpha values are above 0.811, while the requirement value is only above 0.7 (early stage research) (Chin, 1998)
8/19/2013 BEROC 2013 Pavel Andreev uOttawa 76
Construct Composite Reliability
Cronbach’s Alpha
Process Effect 0.876 0.811
Product/Service Effect 0.894 0.821

MEASUREMENT MODELS ASSESSMENT
Reliability:
• Individual Indicator Reliability: • Relies on the expectation that latent variable variance
should explain at least 50% of the indicator. In other words,
loadings of manifest variables should not be less than
0.707 (Chin, 1998).
8/19/2013 BEROC 2013 Pavel Andreev uOttawa 77
Construct/Measures Loading SD t-stat. p-value
Innovation Process Effect
Increased Capacity 0.822*** 0.007 116.14 0.000
Improved Flexibility 0.779*** 0.008 93.18 0.000
Reduced Labor Costs 0.832*** 0.006 142.12 0.000
Reduced Materials 0.763*** 0.009 88.28 0.000
Innovation Product/Service Effect
New/Increased Market 0.885*** 0.004 203.75 0.000
Improved Quality 0.804*** 0.008 102.93 0.000
Increased Range 0.886*** 0.004 199.97 0.000
8/19/2013 BEROC 2013 Pavel Andreev uOttawa 78
RESULTS

MM ASSESSMENT– CONVERGENT AND DISCRIMINANT VALIDITY
• Convergent Validity
– Average variance extracted (AVE – Column 1) for all constructs is
higher than 0.5, and means that each latent variable explains more than
50% of their indicator.
• Discriminant Validity
– Constructs have sufficient discriminant validity as the square root of
each latent construct’s AVE (values on the diagonal) is larger than the
correlation of the specific construct with any other reflective constructs
in the model.
8/19/2013 BEROC 2013 Pavel Andreev uOttawa 79
AVE Construct
Inte
r
Kn
ow
led
ge
Pro
cess
Eff
ect
Pro
d/S
ervic
e
Eff
ect
1.000 Inter Knowledge 1
0.639 Process Effect 0.503 0.799
0.738 Product/Service Effect 0.660 0.623 0.859
DISCRIMINANT VALIDITY USING A CROSS LOADINGS TEST
• Discriminant Validity
– Also tested with a cross-loading test (next slide)
which demonstrates that any indicator of any specific
reflective construct has a higher loading on its own
construct than on any other constructs’ (horizontal
loading).
• These results show that the manifest variables
(indicators) presented in the model are reliable and valid.
8/19/2013 BEROC 2013 Pavel Andreev uOttawa 80
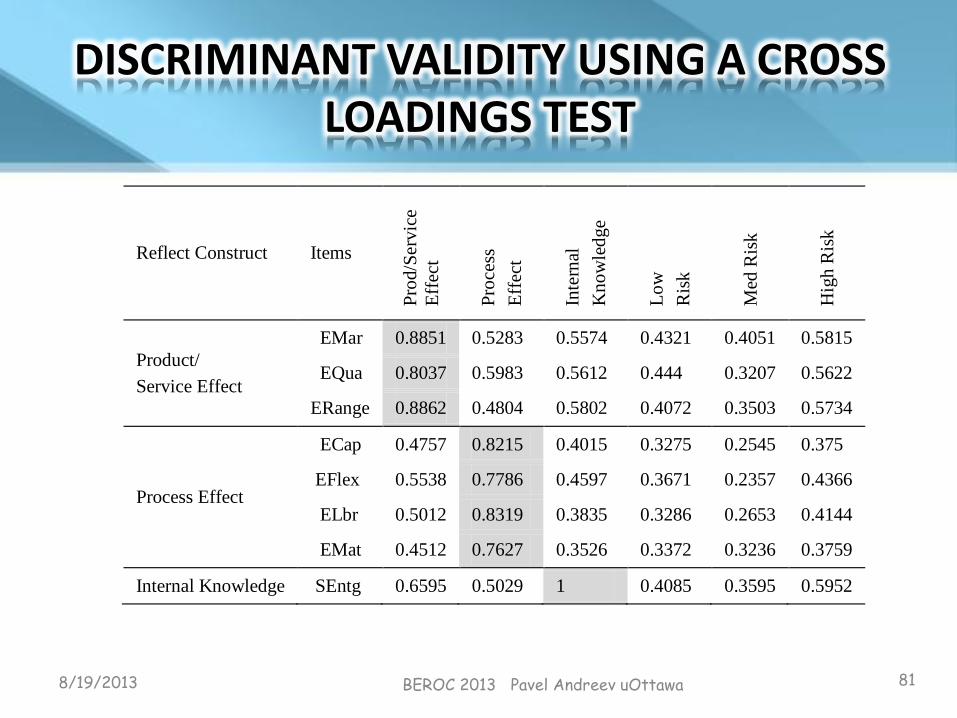
DISCRIMINANT VALIDITY USING A CROSS LOADINGS TEST
8/19/2013 BEROC 2013 Pavel Andreev uOttawa 81
Reflect Construct Items
Pro
d/S
ervic
e
Eff
ect
Pro
cess
Eff
ect
Inte
rnal
Kn
ow
led
ge
Lo
w
Ris
k
Med
Ris
k
Hig
h R
isk
Product/
Service Effect
EMar 0.8851 0.5283 0.5574 0.4321 0.4051 0.5815
EQua 0.8037 0.5983 0.5612 0.444 0.3207 0.5622
ERange 0.8862 0.4804 0.5802 0.4072 0.3503 0.5734
Process Effect
ECap 0.4757 0.8215 0.4015 0.3275 0.2545 0.375
EFlex 0.5538 0.7786 0.4597 0.3671 0.2357 0.4366
ELbr 0.5012 0.8319 0.3835 0.3286 0.2653 0.4144
EMat 0.4512 0.7627 0.3526 0.3372 0.3236 0.3759
Internal Knowledge SEntg 0.6595 0.5029 1 0.4085 0.3595 0.5952
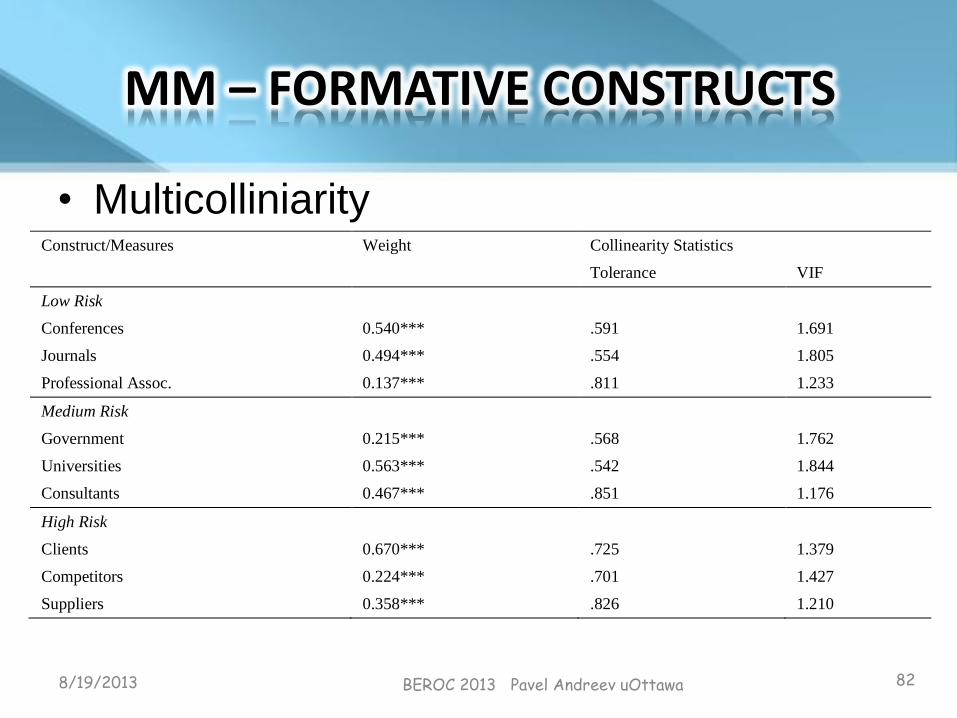
MM – FORMATIVE CONSTRUCTS
• Multicolliniarity
8/19/2013 BEROC 2013 Pavel Andreev uOttawa 82
Construct/Measures Weight Collinearity Statistics
Tolerance VIF
Low Risk
Conferences 0.540*** .591 1.691
Journals 0.494*** .554 1.805
Professional Assoc. 0.137*** .811 1.233
Medium Risk
Government 0.215*** .568 1.762
Universities 0.563*** .542 1.844
Consultants 0.467*** .851 1.176
High Risk
Clients 0.670*** .725 1.379
Competitors 0.224*** .701 1.427
Suppliers 0.358*** .826 1.210
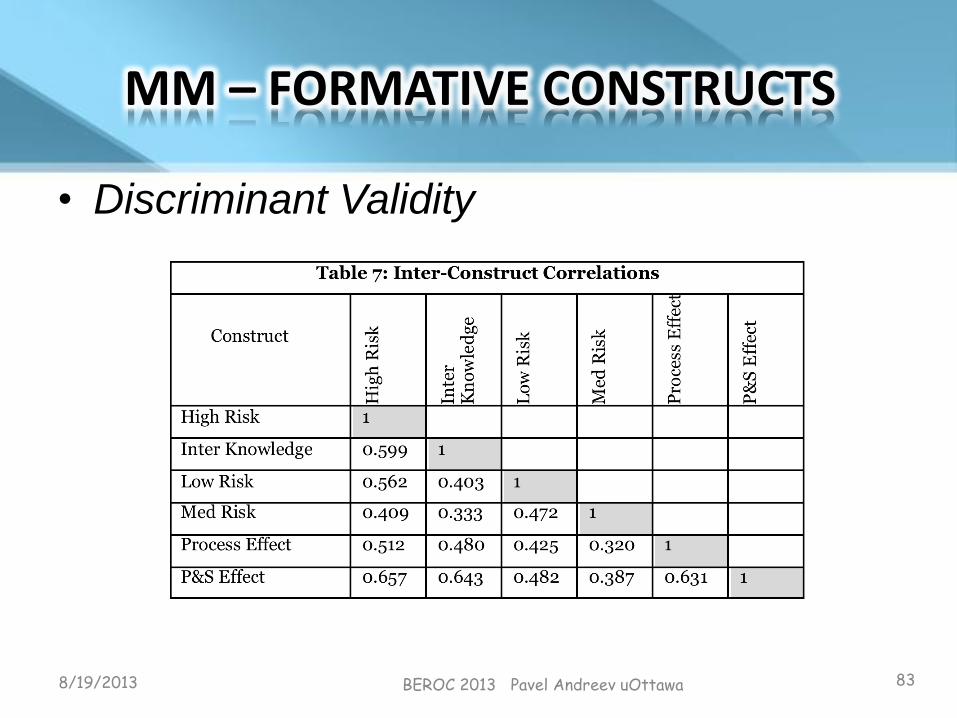
MM – FORMATIVE CONSTRUCTS
• Discriminant Validity
8/19/2013 BEROC 2013 Pavel Andreev uOttawa 83
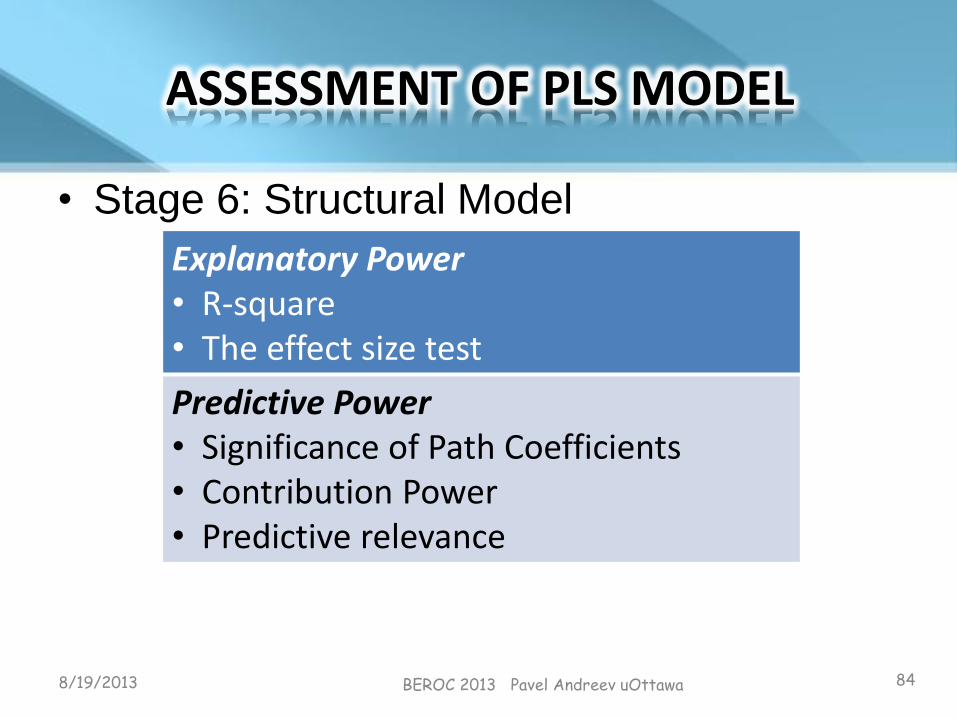
ASSESSMENT OF PLS MODEL
• Stage 6: Structural Model
8/19/2013 BEROC 2013 Pavel Andreev uOttawa 84
Explanatory Power • R-square • The effect size test
Predictive Power • Significance of Path Coefficients • Contribution Power • Predictive relevance

STRUCTURAL MODEL ASSESSMENT – EXPLANATORY POWER (R2)
• The central criterion
for evaluating the
structural model is
the level of explained
variance of the
dependent
constructs
• Statistical
significance of path
coefficients
8/19/2013 BEROC 2013 Pavel Andreev uOttawa 85

F2 OF PLS CONSTRUCTS
• Investigates the substantive impact of each independent construct
on the dependent constructs.
• Table represents a summary of the quantitative results of the effect
size test. (Chin (1998) - Small (f2=0.02), Medium (f2=0.15), and
Large (f2=0.35).
8/19/2013 BEROC 2013 Pavel Andreev uOttawa 86
Predicted Constructs Predictor Constructs f2 effect
Process Effect Low Risk 0.02 small
Medium Risk 0.00 small
High Risk 0.04 small
Internal Knowledge 0.07 small
P&S Effect
Low Risk 0.02 small
Medium Risk 0.01 small
High Risk 0.15 medium
Internal Knowledge 0.22 medium
Internal Knowledge Low Risk 0.01 small
Medium Risk 0.01 small
High Risk 0.27 medium

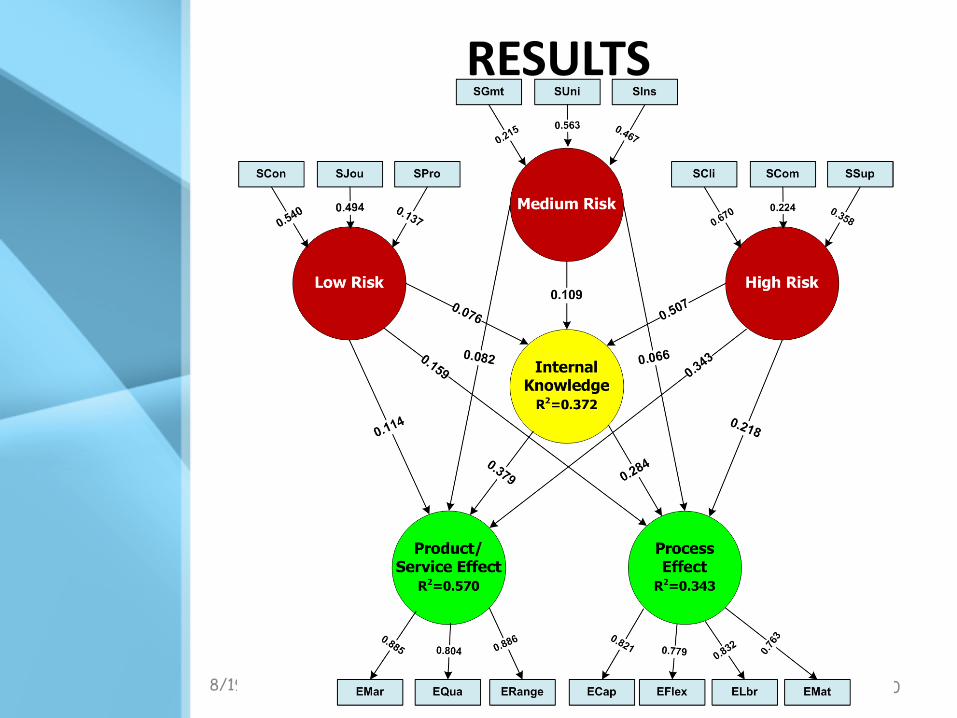
ASSESSMENT OF THE STRUCTURAL MODEL PREDICTIVE POWER BOOTSTRAPPING RE-SAMPLING
TECHNIQUE
Paths (H) Path SD t-stat
LowRisk -> InterKnowl H1 0.159 0.02 8.44
LowRisk -> ProcEffect H9 0.066 0.02 3.66
LowRisk -> P&S Effect H6 0.218 0.02 10.42
MedRisk -> InterKnowl H2 0.285 0.02 15.59
MedRisk -> ProcEffect H10 0.114 0.02 7.13
MedRisk -> P&S Effect H7 0.082 0.01 5.73
HighRisk -> InterKnowl H3 0.343 0.02 20.71
HighRisk -> ProcEffect H11 0.379 0.02 24.86
HighRisk -> P&S Effect H8 0.076 0.02 4.05
InterKnowl-> ProcEffect H5 0.109 0.02 6.62
InterKnowl-> P&S Effect H4 0.507 0.02 28.79
8/19/2013 BEROC 2013 Pavel Andreev uOttawa 87

ASSESSMENT OF THE STRUCTURAL MODEL BLINDFOLDING TEST FOR PREDICTIVE RELEVANCE – STONE
AND GEISSER Q2 TEST
• Enables the evaluation of the predictive relevance of the structural model.
– Q2 reflects an index of the strength of reconstruction by model and parameter estimations.
– A positive Q2 >0 provides evidence that the omitted observations were well-reconstructed and that predictive relevance is achieved,
– A negative Q2 reflects absence of predictive relevance.
– All values of Q2 were greater than zero, indicating predictive relevance for the endogenous constructs of the model.
–
Construct SO SE 𝑄2
Inter Knowledge 236 2041.1 0.37
Process Effect 2944 10308.7 0.20
Product/Service Effect 708 5675.8 0.42
8/19/2013 BEROC 2013 Pavel Andreev uOttawa 88

MORE INFORMATION
• I’d glad to send a list of papers regarding
PLS methodology
• Book
8/19/2013 BEROC 2013 Pavel Andreev uOttawa 89
Source: Hair et.al. (2013), “A Primer on
Partial Least Squares Structural Equation
Modeling (PLS-SEM)”

Thank you
8/19/2013 BEROC 2013 Pavel Andreev uOttawa 90