
Application Note ELITEproTM Recording Poly-Phase … · R Application Note ELITEproTM Recording...
8
R Application Note ELITEpro TM Recording Poly-Phase Power Meter Figure 1: An ELITEpro Logger in the field. DENT Instruments ELITEpro TM Recording Polyphase Power Meter • Collects data on AC power loads • Monitors up to 4 channels: (3-phase 4-wire supply) kW and 600 V • Has internal memory capacity of 128kB: (~25,000 records) for standard Elites and 512kB (~100,000 records) for Elites with extended memory • Monitors voltage (volts), current (amps), power (kW), kilovolt-amps (kVA), power factor (PF), kilovolt-amps reactive (kVAr), and energy (kWh). Below are detailed notes on the procedures for connecting to the logger, configuring the logger, physical set-up of the device, viewing real-time data, retrieving data, graphing data, and exporting data to a spreadsheet. Connecting to the ELITEpro Logger 1. Connect the ELITEpro logger to the computer serial port with the communication cable. (Note that some newer laptops do not have serial ports. If your computer does not have a serial port, use a high speed USB-to-serial adapter or connect via modem.) 2. Open the ELOG software. Double click on the ELOG icon. 3. Communicate with logger by pulling down the Logger menu heading and choosing Communication, Direct Connect (Null Modem Cable). If prompted to match the Baud rate of the PC with the logger click the Match Baud Rates button. 4. When the words; Logger Connected, Logger description and ID# appear in the status menu at the bottom left corner of the computer screen, the Elite is connected and ready to be configured. 5. If a connection cannot be established, verify that the COM port corresponding to where the serial cable is connected on the PC is selected in the software by pulling down the Tools menu heading and choosing PC Setup.... Then, in the Direct Connect dialog box, pull down the Port menu and select the correct COM port. Click Save Changes and retry connecting as described in the previous steps.* * Note that if there is software installed on the computer for a Palm Pilot, digital camera or other type of device that uses the COM port to communicate it may have to be disabled to free up the COM port to communicate with the Elite. Page 1 of 8
Transcript of Application Note ELITEproTM Recording Poly-Phase … · R Application Note ELITEproTM Recording...

R Application Note
ELITEproTM Recording Poly-Phase Power Meter
Figure 1: An ELITEpro Logger in the field.
DENT Instruments ELITEproTM
Recording Polyphase Power Meter
• Collects data on AC power loads
• Monitors up to 4 channels: (3-phase 4-wire supply) kW and 600 V
• Has internal memory capacity of 128kB: (~25,000 records) for standard
Elites and 512kB (~100,000 records) for Elites with extended memory
• Monitors voltage (volts), current (amps), power (kW), kilovolt-amps
(kVA), power factor (PF), kilovolt-amps reactive (kVAr), and energy
(kWh).
Below are detailed notes on the procedures for connecting to the logger,
configuring the logger, physical set-up of the device, viewing real-time data,
retrieving data, graphing data, and exporting data to a spreadsheet.
Connecting to the ELITEpro Logger
1. Connect the ELITEpro logger to the computer serial port with the
communication cable. (Note that some newer laptops do not have serial
ports. If your computer does not have a serial port, use a high speed
USB-to-serial adapter or connect via modem.)
2. Open the ELOG software. Double click on the ELOG icon.
3. Communicate with logger by pulling down the Logger menu heading
and choosing Communication, Direct Connect (Null Modem Cable). If
prompted to match the Baud rate of the PC with the logger click the
Match Baud Rates button.
4. When the words; Logger Connected, Logger description and ID# appear
in the status menu at the bottom left corner of the computer screen, the
Elite is connected and ready to be configured.
5. If a connection cannot be established, verify that the COM port
corresponding to where the serial cable is connected on the PC is
selected in the software by pulling down the Tools menu heading and
choosing PC Setup.... Then, in the Direct Connect dialog box, pull down
the Port menu and select the correct COM port. Click Save Changes and
retry connecting as described in the previous steps.*
* Note that if there is software installed on the computer for a Palm
Pilot, digital camera or other type of device that uses the COM port
to communicate it may have to be disabled to free up the COM port to
communicate with the Elite.
Page 1 of 8

Configuring the ELITEpro Logger
1. Choose New from the File menu heading. Select Setup Table File and
click <OK>. Choose ELITEpro. (4 channel) for the Select a Setup Table
Type.
2. The Setup Table consists of two screens that are accessed with the
<BACK> or <NEXT> buttons.
Figure 2: The first logger setup window.
3. Enter a Setup Table Description. (Figure 2) This is an optional reference
name for this particular setup table that can be saved and used in the
future to avoid having to re-enter the same information.
4. Set the Line Frequency (Figure 2) to 60Hz. (U.S. standard frequency)
5. Configure the logging start time (Figure 2).
• Select Immediately to begin logging now.
• Select Date and Time to start logging in the future. If the latter is
selected, enter the Date and Time when logging will begin.
6. Configure the Logging stop time (Figure 2).
• Select Never to set the logger in a “Ring” mode or a continuous
loop. When the logger’s memory is full, the oldest records will be
overwritten and replaced with the newest records.
• Select When Memory Is Full to stop collecting data when the memory
is full.
• Select Date and Time to program logger to stop logging at a specific
future date and time.
7. Select an Integration Period for the study (Figure 2).The Integration
Period indicates how often a time-stamped data record will be stored Page 2 of 8 into memory.

8. Verify the amount of available memory for the study (Figure 2). Refer to
the Standard Memory Option for standard Elites and the High Memory
Option for Elites with extended memory (indicated by the label on the
front of the logger).
*Note that the amount of memory available will change depending on how
the channels are set up on the next page of the setup table.
9. Click on the <NEXT> button. The second Setup Table window will appear
(Figure 3).
Figure 3: The second logger setup window; the channel setup window with the CT Size dialogue box.
10.Enter the current transducer (CT) size in the CT Size dialog box. This
value will be printed on the current transducer. The setup table above
(Figure 3) is configured for 50 Amp current transducers. The ELITEpro is
compatible with current transducers with a 333 millivolt output.
11.Choose the correct channel set-up button for the type of load and
supply being monitored. Four common types represented by the buttons
at the top of the setup table include:
• Single-phase load with two-wire supply (1-phase 2-wire)
• 1-phase 3-wire
• 3-phase 3-wire (Delta)
• 3-phase 4-wire (Wye)
Page 3 of 8

Figure 4: The second logger setup window; the channel setup window. This setup is for a 3-phase 4-wire supply. 50 amp CTs are being used.
12.Custom configurations can also be entered. Channels 1 through 4 are
measurement channels for measuring volts, amps, power (kW), kilovolt-
amps (KVA), power factor (PF) and kilovolt-amps-reactive (KVAR).
Channels 5 and 6 are calculated channels used for combining measured
data from two or more of the first four channels. The drop down arrow in
the Channel box is used for enabling and disabling channels.
13.In figure 4 the 3-phase 4-wire (Wye) button was pressed. This option
turns on 3 measurement channels (channels 1, 2 and 3) and one
calculated channel (channel 5).
*Note it is recommended that the 3-phase 4-wire setup be used with all
3-phase loads, including delta loads. When there is no neutral, connect the
neutral (white) voltage clip to good ground.
14.Enter the phase names for each channel. (Figure 4) For example; A
Phase, B Phase, C Phase and Total Power for a 3 phase 4 –wire load or A
Phase only if monitoring a single phase 2-wire load.
15.Select the variables (volts, amps, kW, KVA, PF, kVAR) and the values
(Average, Minimum, Maximum, kWh) to be recorded by clicking in the
field under each variable name and checking the appropriate box.
(Figure 4) Average volts, amps and power factor have been selected in
the setup table in Figure 4.
• With Average selected and with the logger connected to external
DC power the logger will average samples every three seconds and
record one data point per integration period. With the internal battery
only, without external DC power, the logger goes into an energy
conservation mode and samples only once minute and records a data
point per integration.
Page 4 of 8

• With Maximum or Minimum selected the logger will record the
maximum or minimum value for the chosen parameter once per
integration period. Again the logger will sample once every 3 seconds
with external DC power and once every minute without external DC
power.
• With Instantaneous selected the logger will sample once and record
one reading per integration period.
16.If a standard setup table is created using one of the radio buttons,
the View Typical Setup button will become available. When clicked,
this button will produce a schematic of the physical installation of the
ELITEpro.
17.Check the amount of memory available after measurement variables
have been selected. Click on the <BACK> button to return to the first
logger setup table window and refer to the Calculated Days Until Memory
Exhausted field.
18.Save the setup table. (Optional) Select Save from the File menu to save
this setup table.
19.Send the setup to the logger. Click on the <SEND TO LOGGER> button to
send the setup table to the logger. This will configure the logger with the
specified settings.
20.Choose to overwrite the logger’s existing setup table by clicking
Overwrite <ACTIVE> Table. This will change the logger’s configuration,
delete the logger’s existing configuration and clear all data previously
stored on the logger.
Figure 5: Overwrite ACTIVE Table.
21.Allow several seconds for the setup to be sent to the logger. When
the next window appears, choose to continue logging by clicking on
Continue Logging. Alternatively, when the loggers are being configured
prior to the scheduled installation and a laptop will be used at the site,
click Stop Logging. To turn the logging on at the site; choose Logging On/Off from the Logger menu and choose Start Logging.
22.Locate the green LED between the words LOG and ON next to the
communication port on the logger. The LED blinks when the ELITEpro is
logging.
Page 5 of 8
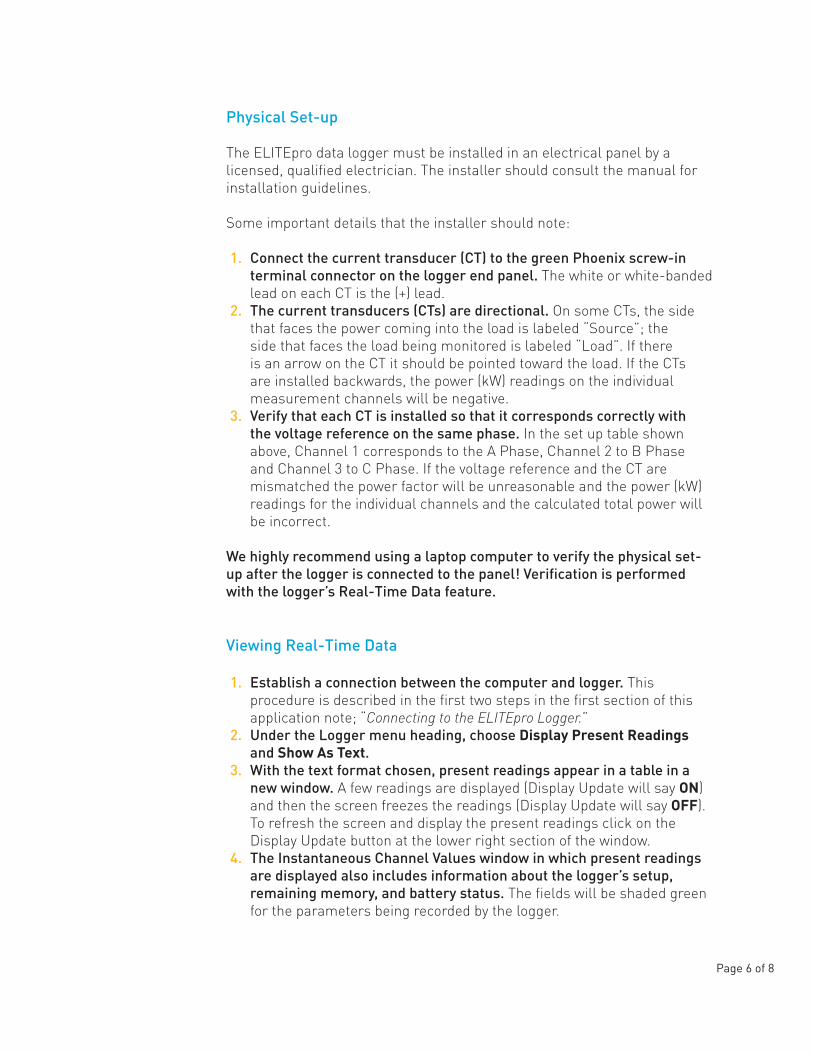
Physical Set-up
The ELITEpro data logger must be installed in an electrical panel by a
licensed, qualified electrician. The installer should consult the manual for
installation guidelines.
Some important details that the installer should note:
1. Connect the current transducer (CT) to the green Phoenix screw-in
terminal connector on the logger end panel. The white or white-banded
lead on each CT is the (+) lead.
2. The current transducers (CTs) are directional. On some CTs, the side
that faces the power coming into the load is labeled “Source”; the
side that faces the load being monitored is labeled “Load”. If there
is an arrow on the CT it should be pointed toward the load. If the CTs
are installed backwards, the power (kW) readings on the individual
measurement channels will be negative.
3. Verify that each CT is installed so that it corresponds correctly with
the voltage reference on the same phase. In the set up table shown
above, Channel 1 corresponds to the A Phase, Channel 2 to B Phase
and Channel 3 to C Phase. If the voltage reference and the CT are
mismatched the power factor will be unreasonable and the power (kW)
readings for the individual channels and the calculated total power will
be incorrect.
We highly recommend using a laptop computer to verify the physical set
up after the logger is connected to the panel! Verification is performed
with the logger’s Real-Time Data feature.
Viewing Real-Time Data
1. Establish a connection between the computer and logger. This
procedure is described in the first two steps in the first section of this
application note; “Connecting to the ELITEpro Logger.”
2. Under the Logger menu heading, choose Display Present Readings and Show As Text.
3. With the text format chosen, present readings appear in a table in a
new window. A few readings are displayed (Display Update will say ON)
and then the screen freezes the readings (Display Update will say OFF).
To refresh the screen and display the present readings click on the
Display Update button at the lower right section of the window.
4. The Instantaneous Channel Values window in which present readings
are displayed also includes information about the logger’s setup,
remaining memory, and battery status. The fields will be shaded green
for the parameters being recorded by the logger.
Page 6 of 8
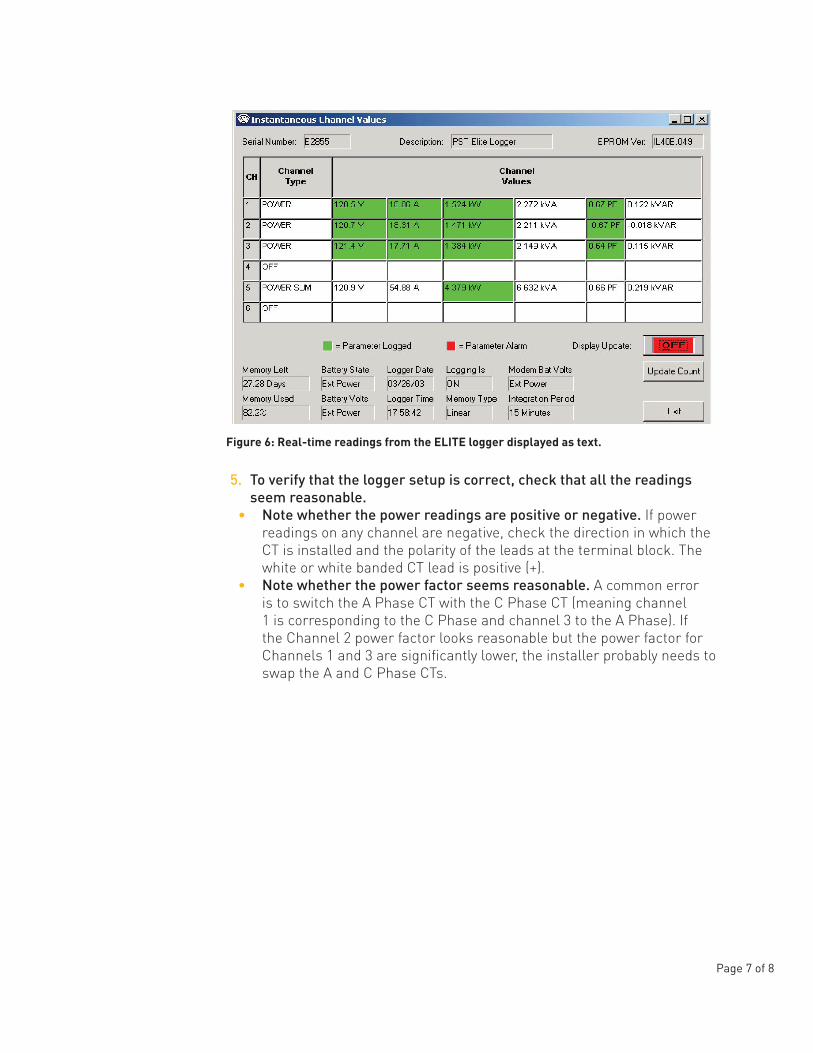
Figure 6: Real-time readings from the ELITE logger displayed as text.
5. To verify that the logger setup is correct, check that all the readings
seem reasonable.
• Note whether the power readings are positive or negative. If power
readings on any channel are negative, check the direction in which the
CT is installed and the polarity of the leads at the terminal block. The
white or white banded CT lead is positive (+).
• Note whether the power factor seems reasonable. A common error
is to switch the A Phase CT with the C Phase CT (meaning channel
1 is corresponding to the C Phase and channel 3 to the A Phase). If
the Channel 2 power factor looks reasonable but the power factor for
Channels 1 and 3 are significantly lower, the installer probably needs to
swap the A and C Phase CTs.
Page 7 of 8
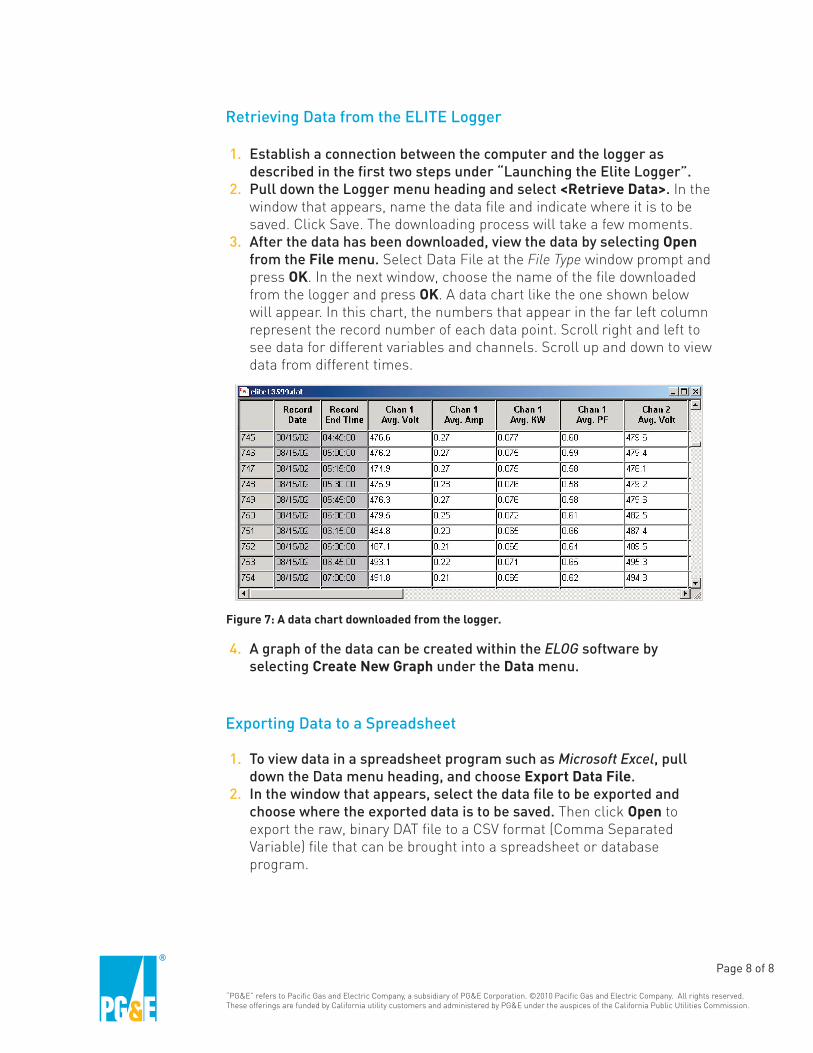
Figure #: Description of image Figure #: Description of image
Retrieving Data from the ELITE Logger
1. Establish a connection between the computer and the logger as
described in the first two steps under “Launching the Elite Logger”.
2. Pull down the Logger menu heading and select <Retrieve Data>. In the
window that appears, name the data file and indicate where it is to be
saved. Click Save. The downloading process will take a few moments.
3. After the data has been downloaded, view the data by selecting Open from the File menu. Select Data File at the File Type window prompt and
press OK. In the next window, choose the name of the file downloaded
from the logger and press OK. A data chart like the one shown below
will appear. In this chart, the numbers that appear in the far left column
represent the record number of each data point. Scroll right and left to
see data for different variables and channels. Scroll up and down to view
data from different times.
Figure 7: A data chart downloaded from the logger.
4. A graph of the data can be created within the ELOG software by
selecting Create New Graph under the Data menu.
Exporting Data to a Spreadsheet
1. To view data in a spreadsheet program such as Microsoft Excel, pull
down the Data menu heading, and choose Export Data File.
2. In the window that appears, select the data file to be exported and
choose where the exported data is to be saved. Then click Open to
export the raw, binary DAT file to a CSV format (Comma Separated
Variable) file that can be brought into a spreadsheet or database
program.
Page 8 of 8
“PG&E” refers to Pacific Gas and Electric Company, a subsidiary of PG&E Corporation. ©2010 Pacific Gas and Electric Company. All rights reserved.
These offerings are funded by California utility customers and administered by PG&E under the auspices of the California Public Utilities Commission.