Appendix E Capital and O-M Costs 20101110 · for Wastewater Treatment Facilities ... Appendix E:...
17
Analysis of Nitrogen Loading Reductions for Wastewater Treatment Facilities and Non-Point Sources in the Great Bay Estuary Watershed Appendix E: Capital and Operation/Maintenance Costs Associated with Nitrogen Removal at 18 Municipal Wastewater Treatment Facilities Discharging to the Great Bay Estuary Prepared by: Ken Kessler Wastewater Engineering Bureau
Transcript of Appendix E Capital and O-M Costs 20101110 · for Wastewater Treatment Facilities ... Appendix E:...
Analysis of Nitrogen Loading Reductions for Wastewater Treatment Facilities and Non-Point Sources
in the Great Bay Estuary Watershed
Appendix E:
Capital and Operation/Maintenance Costs Associated with Nitrogen Removal at 18 Municipal Wastewater Treatment
Facilities Discharging to the Great Bay Estuary
Prepared by: Ken Kessler
Wastewater Engineering Bureau
ptrowbridge
Great Bay Nitrogen Loading Analysis DRAFT Appendix E
Page 2
Table of Contents 1 Introduction................................................................................................................. 3 2 Methods....................................................................................................................... 3
2.1 Capital and Operation & Maintenance Costs...................................................... 3 2.2 Costs Relative to Nitrogen Removal................................................................... 6
3 Results......................................................................................................................... 7 3.1 Capital and Operation & Maintenance Costs...................................................... 7 3.2 Costs Relative to Nitrogen Removal................................................................... 8
4 References................................................................................................................. 10 5 Tables........................................................................................................................ 11
Great Bay Nitrogen Loading Analysis DRAFT Appendix E
Page 3
1 Introduction Contained herein is an explanation of the reasoning and methodology used to estimate total costs, Capital plus Operation and Maintenance (O & M), for removing varying amounts of nitrogen at 18 municipal wastewater treatment facilities (WWTFs) currently discharging into the Great Bay estuary. The nitrogen effluent limits that were considered were 8 mg/l, 5 mg/l and 3 mg/. The latter is considered the current limit of technology for nitrogen removal. Several different approaches were used for cost estimating depending upon the degree of planning that municipalities have already invested toward achieving more advanced treatment goals. This written narrative should be used in conjunction with three spread sheets that contain dollar amounts associated with components making up the total cost for each WWTF.
2 Methods
2.1 Capital and Operation & Maintenance Costs The various approaches used are explained below:
1) Capital and O & M costs for upgrading existing facilities to meet nitrogen effluent limits of 8 mg/l, 5 mg/l, and 3 mg/l were developed by consulting engineering firms for the towns/cities of Portsmouth, NH; Durham, NH; Farmington, NH; Rochester, NH; and Somersworth, NH. These cost estimates were obtained from personal communication with the consulting engineers or officials of the town. These costs are presented in the accompanying three Tables in bold print. The estimates for Portsmouth were taken from a report written by Weston & Sampson and Brown & Caldwell and are presented in the “Draft Wastewater Master Plan – June 2010” 1. This report provides three alternatives with capital costs ranging from $44,500,000 to $60,300,000 at the 8 mg/l permit limit and $57,700,000 to $67,400,000 at the 3 mg/l permit limit. These values have been reduced to eliminate the 20% Design and 30% Contingency allowances used in the Draft Wastewater Master Plan – June 2010 document. For this analysis, the most expensive alternative was selected. The selected scenario accomplishes wastewater treatment at the Pease International Trade Port location with discharge at the Peirce Island outfall location. The Capital and O & M costs for Portsmouth included both the upgrade to secondary treatment and nitrogen removal. It should be noted that if the selected alternative is constructed, the cost of the upgrade to the Pease Tradeport facility would be included in the cost of the Portsmouth upgrade. The costs for the Pease Tradeport upgrade would then be redundant.
Great Bay Nitrogen Loading Analysis DRAFT Appendix E
Page 4
However, for the purpose of this analysis, the costs of the Pease Tradeport facility upgrades have been retained in the totals.
2) Capital costs for upgrading existing facilities in the towns of Exeter, NH; Milton, NH; Newfields, NH; Newmarket, NH; Dover, NH; Epping, NH; Newington, NH; Pease International Trade Port, NH; and Rollinsford, NH to meet a nitrogen effluent limit of 8 mg/l were taken from the report entitled “New Hampshire Seacoast Regional Wastewater Management Feasibility Study 11/07” (NHSRWMFS 11/07)2 which was developed by a study team of consulting engineering firms in 2007 for the Great Bay Estuary Commission. These costs include improvements to plants that are necessary because of aging infrastructure and/or complete upgrades to a facility that requires a new technology necessary for nitrogen removal. There are three components for cost used in the report stated above: a) upgrades to the carbonaceous removal process, b) costs associated with nitrogen treatment to reduce nitrogen from an assumed influent value of 20 mg/l down to an 8 mg/l limit at $ 40 per pound of nitrogen removed and c) costs for other plant improvements needed at the facility. The costs presented in the 2007 report have been modified in the enclosed spreadsheets for two reasons: a) the totals were escalated by use of the Engineering News Record (ENR) index from 2007 (8097) values to January 2010 (8660) values, b) the NHSRWMFS 11/072 report as written assumed that the influent nitrogen into each plant was 20 mg/l, however, collecting data from a variety of treatment plants throughout New Hampshire has indicated that 40 mg/l is more representative of the influent total nitrogen entering a process. An example of the calculation used to estimate the capital cost for the nitrogen treatment component to achieve a 8 mg/l total nitrogen permit limit follows: a) lbs total nitrogen removed per year = Design Flow x (40 mg/l – 8 mg/l) x 8.34 x 365, and b) cost for nitrogen removal = lbs. of nitrogen removed per year x $40 per lb x ENR ratio. These costs were escalated by use of the ENR index as stated above.
3) Capital Costs to upgrade the plants in North Berwick, ME; Berwick, ME and Kittery, ME to achieve 8 mg/l nitrogen were estimated by comparison with similar facilities in the “NH Seacoast Regional Wastewater Management Feasibility Study 11/07” report2.
4) The plants in South Berwick, ME, Durham, NH and Somersworth, NH were assigned “$0” capital cost to achieve 8 mg/l of nitrogen because the plants are already achieving this effluent quality as a result of improvements that have been implemented in recent years.
5) The “Economy of Scale” column accounts for factors that cause a project’s average cost per unit of process flow to decrease as the size of the project increases. The projects with smaller ultimate design flows have an economy of scale factor of 1.0 while plants with increasingly larger design flows have proportionally smaller economy of scale factors assigned – either 0.9, 0.8 or 0.7. The economy of scale factors were applied only to the costs associated with the capital cost of a project (construction cost, design and construction
Great Bay Nitrogen Loading Analysis DRAFT Appendix E
Page 5
administration/resident inspection). The economy of scale factors were not applied to the Operation & Maintenance costs.
a. Economy of scale factors were decided upon using the following three methods:
i. The towns/cities with consulting engineering estimates were assigned an economy of scale factor of 1.0 in order to maintain the magnitude of the estimate as assigned. These towns are Portsmouth (1.0), Durham (1.0), Farmington (1.0), Rochester (1.0) and Somersworth (1.0),
ii. The economy of scale factors for the following towns in New Hampshire were taken directly from the “NH Seacoast Regional Wastewater Management Feasibility Study 11/07” report2 i.e. – Dover (0.7), Exeter (0.7), Pease International Development Authority (0.8), Newmarket (0.9), Milton (1.0), Newfields (1.0), Epping (1.0), Newington (1.0), and Rollinsford (1.0),
iii. The towns in Maine were assigned economy of scale factors comparable to towns in New Hampshire having similar design flows - these are Kittery (0.7), North Berwick (0.9), Berwick (1.0) and South Berwick (1.0).
6) The Capital Costs associated with a 5 mg/l nitrogen limit were calculated by multiplying the Design Flow for a facility by $3.25 per gallon. This cost per gallon figure was established from information in a report executed for 21 WWTFs in Massachusetts. The consulting firm Stearns & Wheler authored the report “Engineering Feasibility & Cost Analyses of Nitrogen Reduction from Selected POTWs in Massachusetts” in June 20083. This report was similar to the NH Seacoast Regional Wastewater Management Feasibility Study 11/07 (NHSRWMFS 11/07)2 in that each Massachusetts plant was evaluated individually to determine the necessary upgrades to meet an 8 mg/l nitrogen effluent limit. It went a step further to estimate additional improvements necessary to meet a 5 mg/l limit. This approach was used for the towns of Exeter, NH; Milton, NH; Newfields, NH; Newmarket, NH; Dover, NH; Epping, NH; Newington, NH; Pease International Trade Port, NH; Rollinsford, NH; Berwick, ME; North Berwick, ME; South Berwick, ME and Kittery, ME. For the other WWTFs, predicted costs from engineering analyses were used.
7) The Capital Costs associated with a 3 mg/l nitrogen limit were calculated by multiplying the Design Flow for the facility by $3.00 per gallon. The cost per gallon figure was established from information in a report by US EPA4 for actual capital costs at 44 WWTFs in Maryland that were designed to reduce the nitrogen limit from 5 mg/l to 3 mg/l. The report is entitled “Biological Nutrient Removal Processes and Costs” and the amounts were upgraded with the ENR index from year 2006 (7911) dollars to January 2010 (8660) dollars. This approach was used for the towns of Exeter, NH; Milton, NH; Newfields, NH; Newmarket, NH; Dover, NH; Epping, NH; Newington, NH; Pease International Trade Port, NH; Rollinsford, NH; Berwick, ME; North Berwick,
Great Bay Nitrogen Loading Analysis DRAFT Appendix E
Page 6
ME; South Berwick, ME and Kittery, ME. For the other WWTFs, predicted costs from engineering analyses were used.
8) The existing O & M budget numbers were obtained by direct contact with the WWTF operators5. They are the total annual budgets for 2009 excluding any debt obligations for previous capital projects.
9) Added O & M costs for upgrades to achieve stricter nitrogen treatment limits were estimated by using an EPA document entitled “Municipal Nutrient Removal Technologies Reference Document”6. This report contains graphs that relate magnitude of flow at a facility with the cost per million gallons treated for typical processes to achieve 8 mg/l, 5 mg/l or 3 mg/l effluent limits. These additional O & M costs were updated by means of the ENR index from 2008 (8096) dollars to 2010 (8660) dollars and were added cumulatively to the actual 2009 O & M budgets.
10) The “Design” and “Construction Administration/Resident Inspection” components of the spread sheets were obtained from documented construction project costs at 44 treatment plant projects in Connecticut7. The Design allowance on average was 9% of the construction cost and the Construction Administration/Resident Inspection allowance was 11% of the construction cost for all facilities. These averages were used as multipliers to estimate the costs for design and construction administration/resident inspection for the work at the wastewater treatment facilities.
a. The “Design” expense is associated with fees for consulting engineering companies to develop plans and specifications for a project.
b. The “Construction Administration/Resident Inspection” component of the project consists of construction phase expenses such as construction quality oversight, conformance of field construction with plans and specifications, interpretation of drawings and engineering clarifications, change orders, work directives and coordination, payment requisitions, materials testing, etc.
2.2 Costs Relative to Nitrogen Removal The mass of nitrogen that would be removed from the Great Bay Estuary with nitrogen effluent limits of 8, 5, and 3 mg/l was calculated to determine the cost effectiveness of the infrastructure upgrades. The nitrogen load discharged from WWTFs was calculated as the product of the facility’s average discharge and the average nitrogen concentration in the effluent. Average discharge was calculated from monthly discharge monitoring reports. Discharge during the period of 2003-2008 was used to represent current conditions. The nitrogen concentration in the effluent was determined from monthly measurements of effluent at eight WWTFs in 2008 (NHEP, 20088) or from 2008 data provided by the operator of the facility. If no data were available for a facility, the average nitrogen concentration from the eight WWTFs monitored in 2008 (17.78 mg TN/L) was used. The average nitrogen concentrations from 2008 were assumed to also be representative of other years between
Great Bay Nitrogen Loading Analysis DRAFT Appendix E
Page 7
2003 and 2007 because no other data were available. The nitrogen loads were adjusted using delivery factors to calculate the nitrogen load delivered to the estuary from each WWTF (details provided in Appendix A). For each of the permitting options, the delivered load from each WWTF was calculated by assuming a nitrogen concentration in the effluent of 8, 5, or 3 mg TN/L and the design flow for the WWTF. The predicted nitrogen loads were adjusted using delivery factors to calculate the nitrogen load delivered to the estuary from each WWTF. The mass of nitrogen removed from the estuary for each permit limit was calculated by subtracting the delivered load for the WWTF with the permit limit from the current delivered load. If the delivered nitrogen load with a permit limit was higher than the current delivered load, the mass of nitrogen removed was a negative number. The cost of nitrogen removal due to the WWTF upgrades was calculated as the annualized cost divided by the pounds of nitrogen removed from the Great Bay, Little Bay, and Upper Piscataqua. For the permit limits of 5 and 3 mg/l, the cost effectiveness was calculated for the cumulative nitrogen removal relative to existing nitrogen loads. Amortized capital costs plus annual operation & maintenance costs were combined to estimate the total annual cost for each treatment level for nitrogen removal. A range of interest rates from 2% to 5% were selected to bracket the potential rates for a 20 year bond.
3 Results
3.1 Capital and Operation & Maintenance Costs Details of the monetary implications for removing nitrogen at the municipal wastewater treatment plants discharging to the Great Bay Estuary can be found in Tables 1, 2, and 3. A very brief synopsis of the estimated construction cost, design fees, construction administration/resident inspection costs plus one year of Operation and Maintenance cost for the 18 point source municipal dischargers is:
1) Costs to meet a nitrogen effluent concentration limit of 8 mg/l a) Total Capital Cost plus Design Fees and Construction Administration/Resident
Inspection Costs would be approximately $197.41 Million dollars to reduce from current discharge conditions to achieve an 8 mg/l nitrogen effluent concentration limit.
b) Total annual O & M Cost would be approximately $21.61 Million dollars to
reduce from current discharge conditions to achieve an 8 mg/l nitrogen effluent concentration limit. This would be an approximate increase of $2.72 Million dollars above the current O & M expenditure.
2) Costs to meet a nitrogen effluent concentration limit of 5 mg/l
Great Bay Nitrogen Loading Analysis DRAFT Appendix E
Page 8
a) Total Capital Cost plus Design Fees and Construction Administration/Resident
Inspection Costs would be approximately $267.31 Million dollars to reduce from current discharge conditions to achieve a 5 mg/l nitrogen effluent concentration limit.
b) Total annual O & M Cost would be approximately $26.52 Million dollars to
reduce from current discharge conditions to achieve a 5 mg/l nitrogen effluent concentration limit. This would be an approximate increase of $7.63 Million dollars above the current O & M expenditure.
3) Costs to meet a nitrogen effluent concentration limit of 3 mg/l a) Total Capital Cost plus Design Fees and Construction Administration/Resident
Inspection Costs would be approximately $353.91 Million dollars to reduce from current discharge conditions to achieve a 3 mg/l nitrogen effluent concentration limit.
b) Total annual O & M Cost would be approximately $29.73 Million dollars to
reduce from current discharge conditions to achieve a 3 mg/l nitrogen effluent concentration limit. This would be an approximate increase of $10.84 Million dollars above the current O & M expenditure.
3.2 Costs Relative to Nitrogen Removal The costs per pound of nitrogen removed from the estuary for each of the WWTFs are shown on Tables 4 and 5. Overall, if all of the WWTFs were given nitrogen effluent limits of 8 mg N/L at design flow, a total of 116.8 tons of nitrogen per year would be removed from Great Bay, Little Bay, and the Upper Piscataqua for an annualized cost of $14.80 to 18.56 million. The cost per pound of nitrogen removed would be $63-$79 per year. For the 5 mg N/L nitrogen permit limit, 215.2 tons or nitrogen would be removed for an annualized cost of $23.98-29.08 million at an annualized cost per pound of $56-$68 per year. Finally, for the 3 mg N/L nitrogen permit limit, 280.8 tons of nitrogen would be removed for an annualized cost of $32.48-$39.24 million at an annualized cost per pound of $58-$70 per year. The costs per pound of nitrogen removed are likely overestimated because the nitrogen load reductions at most WWTFs are partially cancelled out by several WWTFs for which the nitrogen load would increase under the permitting scenarios. Increasing nitrogen loads at WWTFs are unlikely under any permitting scenario. In terms of cost per pound of nitrogen removed, the Rochester, Dover and Newmarket WWTFs are the most cost-effective upgrades. The cost per pound of nitrogen removed from the estuary each year for these WWTFs would be $6-7 per lb, $30-35 per lb, and $32-39 per lb, respectively, for the 3 mg N/L permit scenario. Nitrogen removal at these facilities would be more cost effective than at other facilities because these facilities contribute the majority of the existing nitrogen load from wastewater treatment facilities.
Great Bay Nitrogen Loading Analysis DRAFT Appendix E
Page 9
The four least cost effective WWTFs for upgrades are North Berwick, Somersworth, Durham, and Pease Tradeport. The cost per pound of nitrogen removed can be greater than $1,000 for these facilities for the 3 mg/l permit scenario. The high costs are the result of either low nitrogen concentrations in effluent already (Somersworth, Durham) and/or large design flows which inflate the nitrogen load under the permitting scenarios. For the remaining ten WWTFs, the cost effectiveness of WWTF upgrades would range from $53 to $579 with an average value of $179-$215 for the 3 mg/l permit scenario. WWTF upgrades are more cost effective and more likely to achieve reductions than most options for reducing non-point sources. An evaluation of non-point source offsets for nutrient trading in Virginia9 found the annualized cost of nitrogen reduction from agriculture ranged from $8/lb to $470/lb. Stormwater treatment to remove nitrogen would cost between $54/lb and $2,215/lb annually9. The minimum cost for nitrogen removal by connecting homes using septic systems to a WWTF would be $30/lb to $560/lb annually9. For the Long Island Sound Study, the average cost effectiveness for agricultural controls and stormwater management were assumed to be $5 and $133 per pound of nitrogen removed, respectively, using annualized costs10. In addition to cost, the feasibility of non-point source controls will depend on how much of the existing nitrogen load is from the different types of non-point sources. For example, if nitrogen from agriculture is a small percent of the total nitrogen load, nitrogen reductions on agricultural lands will not be effective at reducing overall loads, regardless of the cost. The contribution of agriculture, stormwater, and septic systems to the existing nitrogen load is not currently known. Future modeling will be done by DES to answer this question.
Great Bay Nitrogen Loading Analysis DRAFT Appendix E
Page 10
4 References 1) Draft Wastewater Master Plan and Long Term Control Plan Update. Prepared for the City of
Portsmouth. Prepared by Weston & Sampson and Brown & Caldwell. June 2010. Published online: http://www.cityofportsmouth.com/publicworks/wwmp-draftjune2010.htm.
2) New Hampshire Seacoast Region Wastewater Management Feasibility Study (Draft Alternatives Report Subtask 4.5). Metcalf & Eddy, Wright-Pierce, ENSR International, Appledore Engineering, Steve Jones, TFMoran, and Gallagher, Callahan and Gatrell. November 2007. Published online: http://des.nh.gov/organization/divisions/water/wweb/documents/ar_section5.pdf.
3) Engineering Feasibility & Cost Analyses of Nitrogen Reduction from Selected POTWs in Massachusetts (Project Number 2007-01/106), prepared by Stearns & Wheler, LLC and CDM, June 2008. Published online: http://www.mass.gov/dep/water/resources/potwexec.pdf.
4) Biological Nutrient Removal Processes and Costs, United States Environmental Protection Agency Office of Water, EPA-823-R-07-002, June 2007. Published online: http://www.epa.gov/waterscience/criteria/nutrient/files/bio-removal.pdf.
5) Personal communication with consultants and/or town officials for estimates to upgrade WWTFs in certain communities.
6) Municipal Nutrient Removal Technologies Reference Document Volume 1 – Technical Report, U. S. Environmental Protection Agency Office of Wastewater Management, Municipal Support Division Municipal Technology Branch (EPA 832-R-08-006 \September 2008. Published online: http://www.epa.gov/owm/mtb/mnrt-volume1.pdf.
7) Actual construction data from 36 treatment plant upgrades over the past 20 years in Connecticut that was received via email from the state of Connecticut through a consulting engineering company. The following towns were included in this data base: Danbury, Ridgefield, Suffield, Greenwich, Torrington, Farmington, Vernon, Cheshire, Derby, Newtown, Ledyard, Norwalk, New Canaan, East Windsor, Fairfield, New London, Thomaston, Branford, Portland, West Haven, Greenwich, Litchfield, Stamford, Jewett City, Simsbury, Westport, Shelton, Milford (BB), Milford (Hous), Plainville, South Windsor, Stratford, Glastonbury, Groton Town, Stafford, and Ansonia.
8) Total Nitrogen Concentrations in Wastewater Treatment Plant Effluent in the Great Bay Estuary in 2008. New Hampshire Estuaries Project, Durham, NH. 2008. Published online: http://www.nhep.unh.edu/resources/pdf/total_nitrogen_concentrations-nhep-08.pdf
9) Stevenson, K., S. Aultman, T. Metcalfe, and A. Miller. 2010. An evaluation of nutrient nonpoint offset trading in Virginia: A role for agricultural nonpoint sources? Water Resources Research 46: W04519.
10) An Evaluation of Potential Nitrogen Load Reductions to Long Island Sound from the Connecticut River Basin. A final report to the New England Interstate Water Pollution Control Commission by Barry Evans, Pennsylvania State University, University Park, PA. Published online: http://www.neiwpcc.org/neiwpcc_docs/CT%20River%20Cost-Benefit%20Final%20Report.pdf.
Great Bay Nitrogen Loading Analysis DRAFT Appendix E
Page 11
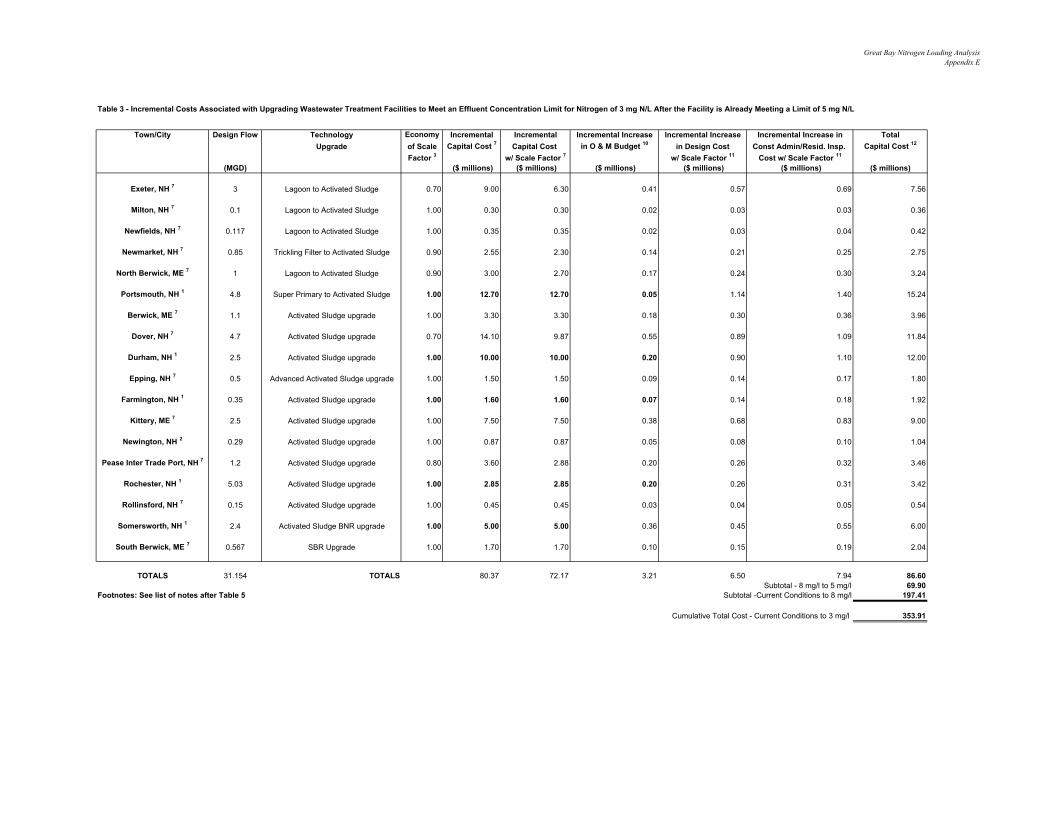
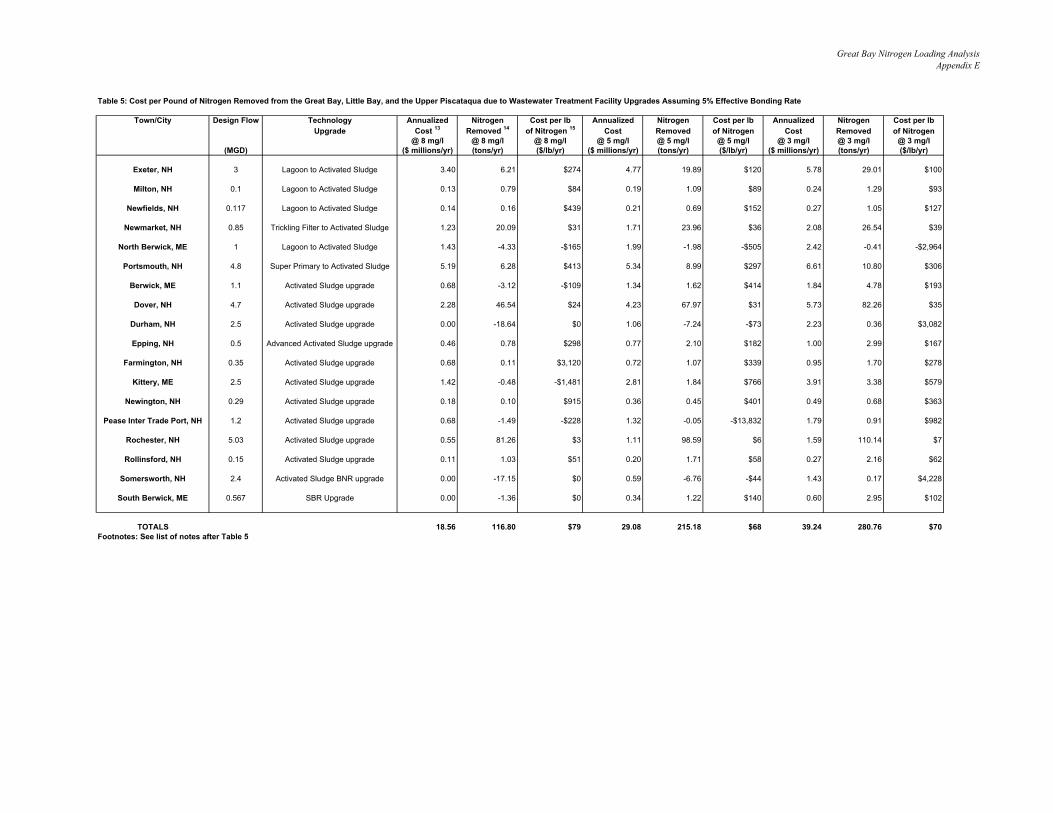
5 Tables List of Tables Table 1 - Costs Associated with Upgrading Wastewater Treatment Facilities from Current Conditions to Meet an Effluent Concentration Limit for Nitrogen of 8 mg N/L Table 2 - Incremental Costs Associated with Upgrading Wastewater Treatment Facilities to Meet an Effluent Concentration Limit for Nitrogen of 5 mg N/L After the Facility is Already Meeting a Limit of 8 mg N/L Table 3 - Incremental Costs Associated with Upgrading Wastewater Treatment Facilities to Meet an Effluent Concentration Limit for Nitrogen of 3 mg N/L After the Facility is Already Meeting a Limit of 5 mg N/L Table 4: Cost per Pound of Nitrogen Removed from the Great Bay, Little Bay, and the Upper Piscataqua due to Wastewater Treatment Facility Upgrades Assuming 2% Effective Bonding Rate Table 5: Cost per Pound of Nitrogen Removed from the Great Bay, Little Bay, and the Upper Piscataqua due to Wastewater Treatment Facility Upgrades Assuming 5% Effective Bonding Rate
Great Bay Nitrogen Loading AnalysisAppendix E
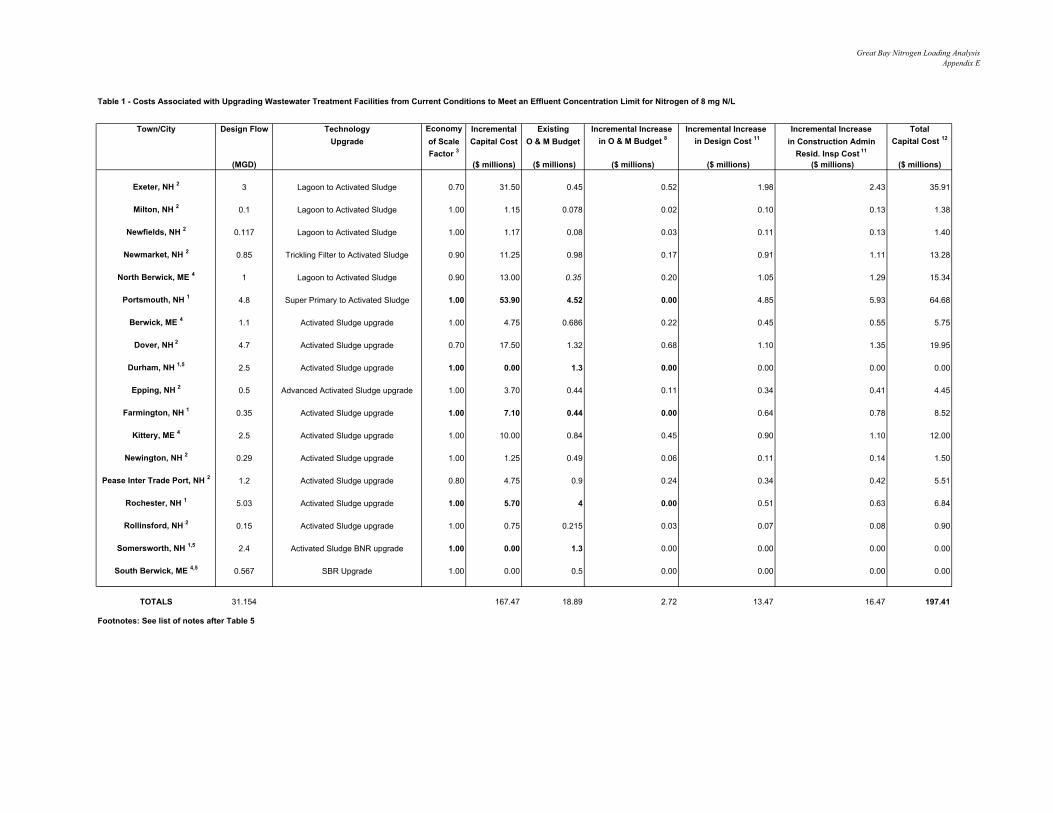
Table 1 - Costs Associated with Upgrading Wastewater Treatment Facilities from Current Conditions to Meet an Effluent Concentration Limit for Nitrogen of 8 mg N/L
Town/City Design Flow Technology Economy Incremental Existing Incremental Increase Incremental Increase Incremental Increase TotalUpgrade of Scale Capital Cost O & M Budget in O & M Budget 8 in Design Cost 11 in Construction Admin Capital Cost 12
Factor 3 Resid. Insp Cost 11
(MGD) ($ millions) ($ millions) ($ millions) ($ millions) ($ millions) ($ millions)
Exeter, NH 2 3 Lagoon to Activated Sludge 0.70 31.50 0.45 0.52 1.98 2.43 35.91
Milton, NH 2 0.1 Lagoon to Activated Sludge 1.00 1.15 0.078 0.02 0.10 0.13 1.38
Newfields, NH 2 0.117 Lagoon to Activated Sludge 1.00 1.17 0.08 0.03 0.11 0.13 1.40
Newmarket, NH 2 0.85 Trickling Filter to Activated Sludge 0.90 11.25 0.98 0.17 0.91 1.11 13.28
North Berwick, ME 4 1 Lagoon to Activated Sludge 0.90 13.00 0.35 0.20 1.05 1.29 15.34
Portsmouth, NH 1 4.8 Super Primary to Activated Sludge 1.00 53.90 4.52 0.00 4.85 5.93 64.68
Berwick, ME 4 1.1 Activated Sludge upgrade 1.00 4.75 0.686 0.22 0.45 0.55 5.75
Dover, NH 2 4.7 Activated Sludge upgrade 0.70 17.50 1.32 0.68 1.10 1.35 19.95
Durham, NH 1,5 2.5 Activated Sludge upgrade 1.00 0.00 1.3 0.00 0.00 0.00 0.00
Epping, NH 2 0.5 Advanced Activated Sludge upgrade 1.00 3.70 0.44 0.11 0.34 0.41 4.45
Farmington, NH 1 0.35 Activated Sludge upgrade 1.00 7.10 0.44 0.00 0.64 0.78 8.52
Kittery, ME 4 2.5 Activated Sludge upgrade 1.00 10.00 0.84 0.45 0.90 1.10 12.00
Newington, NH 2 0.29 Activated Sludge upgrade 1.00 1.25 0.49 0.06 0.11 0.14 1.50
Pease Inter Trade Port, NH 2 1.2 Activated Sludge upgrade 0.80 4.75 0.9 0.24 0.34 0.42 5.51
Rochester, NH 1 5.03 Activated Sludge upgrade 1.00 5.70 4 0.00 0.51 0.63 6.84
Rollinsford, NH 2 0.15 Activated Sludge upgrade 1.00 0.75 0.215 0.03 0.07 0.08 0.90
Somersworth, NH 1,5 2.4 Activated Sludge BNR upgrade 1.00 0.00 1.3 0.00 0.00 0.00 0.00
South Berwick, ME 4,5 0.567 SBR Upgrade 1.00 0.00 0.5 0.00 0.00 0.00 0.00
TOTALS 31.154 167.47 18.89 2.72 13.47 16.47 197.41
Footnotes: See list of notes after Table 5
Great Bay Nitrogen Loading AnalysisAppendix E
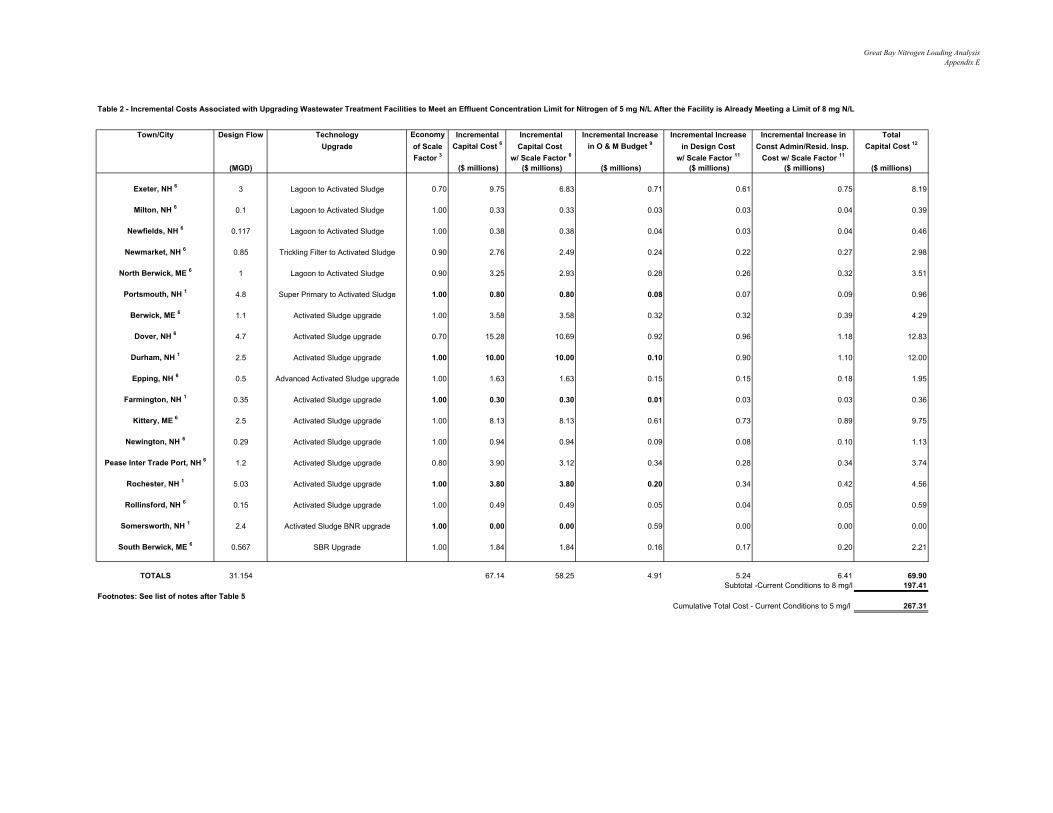
Table 2 - Incremental Costs Associated with Upgrading Wastewater Treatment Facilities to Meet an Effluent Concentration Limit for Nitrogen of 5 mg N/L After the Facility is Already Meeting a Limit of 8 mg N/L
Town/City Design Flow Technology Economy Incremental Incremental Incremental Increase Incremental Increase Incremental Increase in TotalUpgrade of Scale Capital Cost 6 Capital Cost in O & M Budget 9 in Design Cost Const Admin/Resid. Insp. Capital Cost 12
Factor 3 w/ Scale Factor 6 w/ Scale Factor 11 Cost w/ Scale Factor 11
(MGD) ($ millions) ($ millions) ($ millions) ($ millions) ($ millions) ($ millions)
Exeter, NH 6 3 Lagoon to Activated Sludge 0.70 9.75 6.83 0.71 0.61 0.75 8.19
Milton, NH 6 0.1 Lagoon to Activated Sludge 1.00 0.33 0.33 0.03 0.03 0.04 0.39
Newfields, NH 6 0.117 Lagoon to Activated Sludge 1.00 0.38 0.38 0.04 0.03 0.04 0.46
Newmarket, NH 6 0.85 Trickling Filter to Activated Sludge 0.90 2.76 2.49 0.24 0.22 0.27 2.98
North Berwick, ME 6 1 Lagoon to Activated Sludge 0.90 3.25 2.93 0.28 0.26 0.32 3.51
Portsmouth, NH 1 4.8 Super Primary to Activated Sludge 1.00 0.80 0.80 0.08 0.07 0.09 0.96
Berwick, ME 6 1.1 Activated Sludge upgrade 1.00 3.58 3.58 0.32 0.32 0.39 4.29
Dover, NH 6 4.7 Activated Sludge upgrade 0.70 15.28 10.69 0.92 0.96 1.18 12.83
Durham, NH 1 2.5 Activated Sludge upgrade 1.00 10.00 10.00 0.10 0.90 1.10 12.00
Epping, NH 6 0.5 Advanced Activated Sludge upgrade 1.00 1.63 1.63 0.15 0.15 0.18 1.95
Farmington, NH 1 0.35 Activated Sludge upgrade 1.00 0.30 0.30 0.01 0.03 0.03 0.36
Kittery, ME 6 2.5 Activated Sludge upgrade 1.00 8.13 8.13 0.61 0.73 0.89 9.75
Newington, NH 6 0.29 Activated Sludge upgrade 1.00 0.94 0.94 0.09 0.08 0.10 1.13
Pease Inter Trade Port, NH 6 1.2 Activated Sludge upgrade 0.80 3.90 3.12 0.34 0.28 0.34 3.74
Rochester, NH 1 5.03 Activated Sludge upgrade 1.00 3.80 3.80 0.20 0.34 0.42 4.56
Rollinsford, NH 6 0.15 Activated Sludge upgrade 1.00 0.49 0.49 0.05 0.04 0.05 0.59
Somersworth, NH 1 2.4 Activated Sludge BNR upgrade 1.00 0.00 0.00 0.59 0.00 0.00 0.00
South Berwick, ME 6 0.567 SBR Upgrade 1.00 1.84 1.84 0.16 0.17 0.20 2.21
TOTALS 31.154 67.14 58.25 4.91 5.24 6.41 69.90Subtotal -Current Conditions to 8 mg/l 197.41
Footnotes: See list of notes after Table 5Cumulative Total Cost - Current Conditions to 5 mg/l 267.31
Great Bay Nitrogen Loading AnalysisAppendix E
Table 3 - Incremental Costs Associated with Upgrading Wastewater Treatment Facilities to Meet an Effluent Concentration Limit for Nitrogen of 3 mg N/L After the Facility is Already Meeting a Limit of 5 mg N/L
Town/City Design Flow Technology Economy Incremental Incremental Incremental Increase Incremental Increase Incremental Increase in TotalUpgrade of Scale Capital Cost 7 Capital Cost in O & M Budget 10 in Design Cost Const Admin/Resid. Insp. Capital Cost 12
Factor 3 w/ Scale Factor 7 w/ Scale Factor 11 Cost w/ Scale Factor 11
(MGD) ($ millions) ($ millions) ($ millions) ($ millions) ($ millions) ($ millions)
Exeter, NH 7 3 Lagoon to Activated Sludge 0.70 9.00 6.30 0.41 0.57 0.69 7.56
Milton, NH 7 0.1 Lagoon to Activated Sludge 1.00 0.30 0.30 0.02 0.03 0.03 0.36
Newfields, NH 7 0.117 Lagoon to Activated Sludge 1.00 0.35 0.35 0.02 0.03 0.04 0.42
Newmarket, NH 7 0.85 Trickling Filter to Activated Sludge 0.90 2.55 2.30 0.14 0.21 0.25 2.75
North Berwick, ME 7 1 Lagoon to Activated Sludge 0.90 3.00 2.70 0.17 0.24 0.30 3.24
Portsmouth, NH 1 4.8 Super Primary to Activated Sludge 1.00 12.70 12.70 0.05 1.14 1.40 15.24
Berwick, ME 7 1.1 Activated Sludge upgrade 1.00 3.30 3.30 0.18 0.30 0.36 3.96
Dover, NH 7 4.7 Activated Sludge upgrade 0.70 14.10 9.87 0.55 0.89 1.09 11.84
Durham, NH 1 2.5 Activated Sludge upgrade 1.00 10.00 10.00 0.20 0.90 1.10 12.00
Epping, NH 7 0.5 Advanced Activated Sludge upgrade 1.00 1.50 1.50 0.09 0.14 0.17 1.80
Farmington, NH 1 0.35 Activated Sludge upgrade 1.00 1.60 1.60 0.07 0.14 0.18 1.92
Kittery, ME 7 2.5 Activated Sludge upgrade 1.00 7.50 7.50 0.38 0.68 0.83 9.00
Newington, NH 2 0.29 Activated Sludge upgrade 1.00 0.87 0.87 0.05 0.08 0.10 1.04
Pease Inter Trade Port, NH 7 1.2 Activated Sludge upgrade 0.80 3.60 2.88 0.20 0.26 0.32 3.46
Rochester, NH 1 5.03 Activated Sludge upgrade 1.00 2.85 2.85 0.20 0.26 0.31 3.42
Rollinsford, NH 7 0.15 Activated Sludge upgrade 1.00 0.45 0.45 0.03 0.04 0.05 0.54
Somersworth, NH 1 2.4 Activated Sludge BNR upgrade 1.00 5.00 5.00 0.36 0.45 0.55 6.00
South Berwick, ME 7 0.567 SBR Upgrade 1.00 1.70 1.70 0.10 0.15 0.19 2.04
TOTALS 31.154 TOTALS 80.37 72.17 3.21 6.50 7.94 86.60Subtotal - 8 mg/l to 5 mg/l 69.90
Footnotes: See list of notes after Table 5 Subtotal -Current Conditions to 8 mg/l 197.41
Cumulative Total Cost - Current Conditions to 3 mg/l 353.91

Great Bay Nitrogen Loading AnalysisAppendix E
Table 4: Cost per Pound of Nitrogen Removed from the Great Bay, Little Bay, and the Upper Piscataqua due to Wastewater Treatment Facility Upgrades Assuming 2% Effective Bonding Rate
Town/City Design Flow Technology Annualized Nitrogen Cost per lb Annualized Nitrogen Cost per lb Annualized Nitrogen Cost per lbUpgrade Cost 13 Removed 14 of Nitrogen 15 Cost Removed of Nitrogen Cost Removed of Nitrogen
@ 8 mg/l @ 8 mg/l @ 8 mg/l @ 5 mg/l @ 5 mg/l @ 5 mg/l @ 3 mg/l @ 3 mg/l @ 3 mg/l(MGD) ($ millions/yr) (tons/yr) ($/lb/yr) ($ millions/yr) (tons/yr) ($/lb/yr) ($ millions/yr) (tons/yr) ($/lb/yr)
Exeter, NH 3 Lagoon to Activated Sludge 2.72 6.21 $219 3.93 19.89 $99 4.80 29.01 $83
Milton, NH 0.1 Lagoon to Activated Sludge 0.11 0.79 $67 0.16 1.09 $74 0.20 1.29 $78
Newfields, NH 0.117 Lagoon to Activated Sludge 0.11 0.16 $354 0.18 0.69 $127 0.22 1.05 $106
Newmarket, NH 0.85 Trickling Filter to Activated Sludge 0.98 20.09 $24 1.40 23.96 $29 1.71 26.54 $32
North Berwick, ME 1 Lagoon to Activated Sludge 1.14 -4.33 -$131 1.63 -1.98 -$414 2.00 -0.41 -$2,448
Portsmouth, NH 4.8 Super Primary to Activated Sludge 3.96 6.28 $315 4.09 8.99 $227 5.07 10.80 $235
Berwick, ME 1.1 Activated Sludge upgrade 0.57 -3.12 -$91 1.15 1.62 $355 1.57 4.78 $165
Dover, NH 4.7 Activated Sludge upgrade 1.90 46.54 $20 3.60 67.97 $27 4.88 82.26 $30
Durham, NH 2.5 Activated Sludge upgrade 0.00 -18.64 $0 0.83 -7.24 -$58 1.77 0.36 $2,448
Epping, NH 0.5 Advanced Activated Sludge upgrade 0.38 0.78 $244 0.64 2.10 $153 0.84 2.99 $141
Farmington, NH 0.35 Activated Sludge upgrade 0.52 0.11 $2,378 0.55 1.07 $260 0.74 1.70 $217
Kittery, ME 2.5 Activated Sludge upgrade 1.19 -0.48 -$1,241 2.40 1.84 $653 3.33 3.38 $492
Newington, NH 0.29 Activated Sludge upgrade 0.15 0.10 $771 0.31 0.45 $345 0.42 0.68 $311
Pease Inter Trade Port, NH 1.2 Activated Sludge upgrade 0.57 -1.49 -$192 1.14 -0.05 -$11,977 1.55 0.91 $849
Rochester, NH 5.03 Activated Sludge upgrade 0.42 81.26 $3 0.90 98.59 $5 1.31 110.14 $6
Rollinsford, NH 0.15 Activated Sludge upgrade 0.09 1.03 $43 0.17 1.71 $50 0.23 2.16 $53
Somersworth, NH 2.4 Activated Sludge BNR upgrade 0.00 -17.15 $0 0.59 -6.76 -$44 1.32 0.17 $3,891
South Berwick, ME 0.567 SBR Upgrade 0.00 -1.36 $0 0.30 1.22 $122 0.52 2.95 $89
TOTALS 14.80 116.80 $63 23.98 215.18 $56 32.48 280.76 $58Footnotes: See list of notes after Table 5
Great Bay Nitrogen Loading AnalysisAppendix E
Table 5: Cost per Pound of Nitrogen Removed from the Great Bay, Little Bay, and the Upper Piscataqua due to Wastewater Treatment Facility Upgrades Assuming 5% Effective Bonding Rate
Town/City Design Flow Technology Annualized Nitrogen Cost per lb Annualized Nitrogen Cost per lb Annualized Nitrogen Cost per lbUpgrade Cost 13 Removed 14 of Nitrogen 15 Cost Removed of Nitrogen Cost Removed of Nitrogen
@ 8 mg/l @ 8 mg/l @ 8 mg/l @ 5 mg/l @ 5 mg/l @ 5 mg/l @ 3 mg/l @ 3 mg/l @ 3 mg/l(MGD) ($ millions/yr) (tons/yr) ($/lb/yr) ($ millions/yr) (tons/yr) ($/lb/yr) ($ millions/yr) (tons/yr) ($/lb/yr)
Exeter, NH 3 Lagoon to Activated Sludge 3.40 6.21 $274 4.77 19.89 $120 5.78 29.01 $100
Milton, NH 0.1 Lagoon to Activated Sludge 0.13 0.79 $84 0.19 1.09 $89 0.24 1.29 $93
Newfields, NH 0.117 Lagoon to Activated Sludge 0.14 0.16 $439 0.21 0.69 $152 0.27 1.05 $127
Newmarket, NH 0.85 Trickling Filter to Activated Sludge 1.23 20.09 $31 1.71 23.96 $36 2.08 26.54 $39
North Berwick, ME 1 Lagoon to Activated Sludge 1.43 -4.33 -$165 1.99 -1.98 -$505 2.42 -0.41 -$2,964
Portsmouth, NH 4.8 Super Primary to Activated Sludge 5.19 6.28 $413 5.34 8.99 $297 6.61 10.80 $306
Berwick, ME 1.1 Activated Sludge upgrade 0.68 -3.12 -$109 1.34 1.62 $414 1.84 4.78 $193
Dover, NH 4.7 Activated Sludge upgrade 2.28 46.54 $24 4.23 67.97 $31 5.73 82.26 $35
Durham, NH 2.5 Activated Sludge upgrade 0.00 -18.64 $0 1.06 -7.24 -$73 2.23 0.36 $3,082
Epping, NH 0.5 Advanced Activated Sludge upgrade 0.46 0.78 $298 0.77 2.10 $182 1.00 2.99 $167
Farmington, NH 0.35 Activated Sludge upgrade 0.68 0.11 $3,120 0.72 1.07 $339 0.95 1.70 $278
Kittery, ME 2.5 Activated Sludge upgrade 1.42 -0.48 -$1,481 2.81 1.84 $766 3.91 3.38 $579
Newington, NH 0.29 Activated Sludge upgrade 0.18 0.10 $915 0.36 0.45 $401 0.49 0.68 $363
Pease Inter Trade Port, NH 1.2 Activated Sludge upgrade 0.68 -1.49 -$228 1.32 -0.05 -$13,832 1.79 0.91 $982
Rochester, NH 5.03 Activated Sludge upgrade 0.55 81.26 $3 1.11 98.59 $6 1.59 110.14 $7
Rollinsford, NH 0.15 Activated Sludge upgrade 0.11 1.03 $51 0.20 1.71 $58 0.27 2.16 $62
Somersworth, NH 2.4 Activated Sludge BNR upgrade 0.00 -17.15 $0 0.59 -6.76 -$44 1.43 0.17 $4,228
South Berwick, ME 0.567 SBR Upgrade 0.00 -1.36 $0 0.34 1.22 $140 0.60 2.95 $102
TOTALS 18.56 116.80 $79 29.08 215.18 $68 39.24 280.76 $70Footnotes: See list of notes after Table 5
Great Bay Nitrogen Loading AnalysisAppendix E
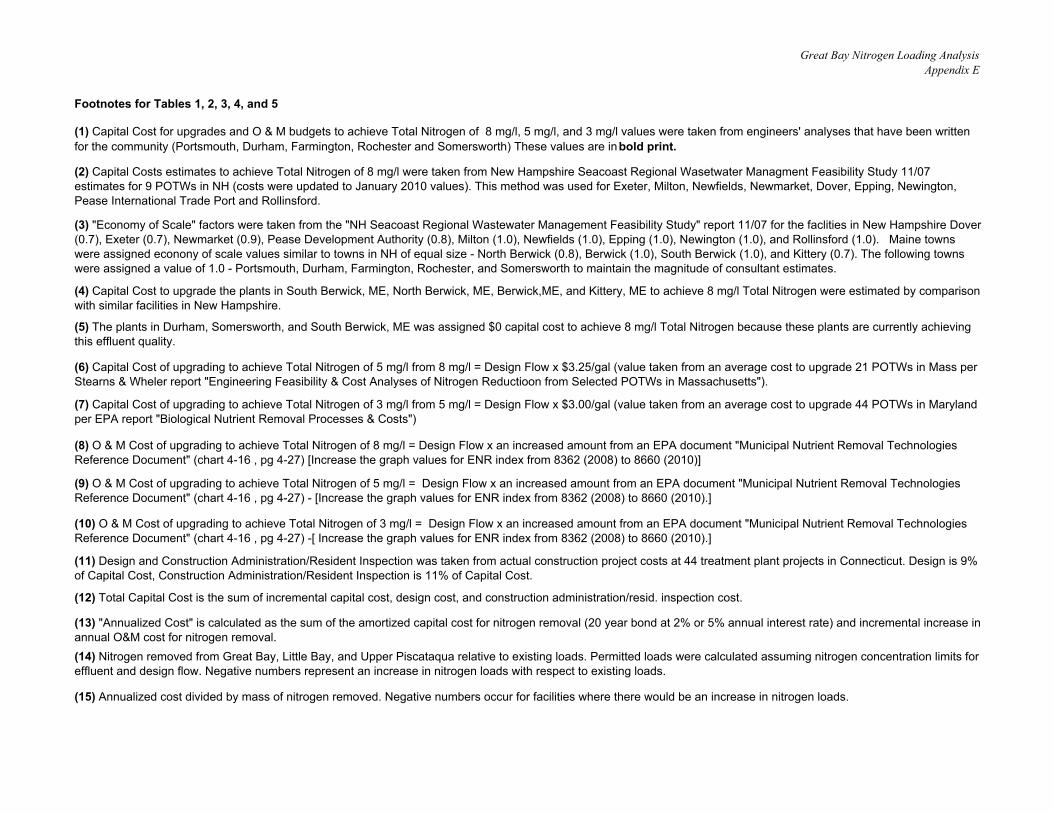
Footnotes for Tables 1, 2, 3, 4, and 5
(1) Capital Cost for upgrades and O & M budgets to achieve Total Nitrogen of 8 mg/l, 5 mg/l, and 3 mg/l values were taken from engineers' analyses that have been written for the community (Portsmouth, Durham, Farmington, Rochester and Somersworth) These values are in bold print.
(2) Capital Costs estimates to achieve Total Nitrogen of 8 mg/l were taken from New Hampshire Seacoast Regional Wasetwater Managment Feasibility Study 11/07 estimates for 9 POTWs in NH (costs were updated to January 2010 values). This method was used for Exeter, Milton, Newfields, Newmarket, Dover, Epping, Newington, Pease International Trade Port and Rollinsford.
(3) "Economy of Scale" factors were taken from the "NH Seacoast Regional Wastewater Management Feasibility Study" report 11/07 for the faclities in New Hampshire Dover (0.7), Exeter (0.7), Newmarket (0.9), Pease Development Authority (0.8), Milton (1.0), Newfields (1.0), Epping (1.0), Newington (1.0), and Rollinsford (1.0). Maine towns were assigned econony of scale values similar to towns in NH of equal size - North Berwick (0.8), Berwick (1.0), South Berwick (1.0), and Kittery (0.7). The following towns were assigned a value of 1.0 - Portsmouth, Durham, Farmington, Rochester, and Somersworth to maintain the magnitude of consultant estimates.
(4) Capital Cost to upgrade the plants in South Berwick, ME, North Berwick, ME, Berwick,ME, and Kittery, ME to achieve 8 mg/l Total Nitrogen were estimated by comparison with similar facilities in New Hampshire.
(5) The plants in Durham, Somersworth, and South Berwick, ME was assigned $0 capital cost to achieve 8 mg/l Total Nitrogen because these plants are currently achieving this effluent quality.
(6) Capital Cost of upgrading to achieve Total Nitrogen of 5 mg/l from 8 mg/l = Design Flow x $3.25/gal (value taken from an average cost to upgrade 21 POTWs in Mass per Stearns & Wheler report "Engineering Feasibility & Cost Analyses of Nitrogen Reductioon from Selected POTWs in Massachusetts").
(7) Capital Cost of upgrading to achieve Total Nitrogen of 3 mg/l from 5 mg/l = Design Flow x $3.00/gal (value taken from an average cost to upgrade 44 POTWs in Maryland per EPA report "Biological Nutrient Removal Processes & Costs")
(8) O & M Cost of upgrading to achieve Total Nitrogen of 8 mg/l = Design Flow x an increased amount from an EPA document "Municipal Nutrient Removal Technologies Reference Document" (chart 4-16 , pg 4-27) [Increase the graph values for ENR index from 8362 (2008) to 8660 (2010)]
(9) O & M Cost of upgrading to achieve Total Nitrogen of 5 mg/l = Design Flow x an increased amount from an EPA document "Municipal Nutrient Removal Technologies Reference Document" (chart 4-16 , pg 4-27) - [Increase the graph values for ENR index from 8362 (2008) to 8660 (2010).]
(10) O & M Cost of upgrading to achieve Total Nitrogen of 3 mg/l = Design Flow x an increased amount from an EPA document "Municipal Nutrient Removal Technologies Reference Document" (chart 4-16 , pg 4-27) -[ Increase the graph values for ENR index from 8362 (2008) to 8660 (2010).]
(11) Design and Construction Administration/Resident Inspection was taken from actual construction project costs at 44 treatment plant projects in Connecticut. Design is 9% of Capital Cost, Construction Administration/Resident Inspection is 11% of Capital Cost.
(12) Total Capital Cost is the sum of incremental capital cost, design cost, and construction administration/resid. inspection cost.
(13) "Annualized Cost" is calculated as the sum of the amortized capital cost for nitrogen removal (20 year bond at 2% or 5% annual interest rate) and incremental increase in annual O&M cost for nitrogen removal.(14) Nitrogen removed from Great Bay, Little Bay, and Upper Piscataqua relative to existing loads. Permitted loads were calculated assuming nitrogen concentration limits for effluent and design flow. Negative numbers represent an increase in nitrogen loads with respect to existing loads.
(15) Annualized cost divided by mass of nitrogen removed. Negative numbers occur for facilities where there would be an increase in nitrogen loads.