Appendix C Quantities & Costs (Cost Engineering)
20
RARITAN BAY AND SANDY HOOK BAY UNION BEACH, NEW JERSEY HURRICANE SANDY LIMITED REEVALUATION REPORT Appendix C Quantities & Costs (Cost Engineering) U.S. Army Corps of Engineers New York District June 2017
Transcript of Appendix C Quantities & Costs (Cost Engineering)
RARITAN BAY AND SANDY HOOK BAY UNION BEACH, NEW JERSEY
HURRICANE SANDY LIMITED REEVALUATION REPORT
Appendix C
Quantities & Costs (Cost Engineering)
U.S. Army Corps of Engineers New York District
June 2017
Appendix C – Cost Engineering
TABLE OF CONTENTS
Introduction ............................................................................................................................................... 1
Operation & Maintenance and Replacements ........................................................................................... 5
2001 vs. 2016 Cost Explanation and Comparison .................................................................................... 6
Table C-1. Project First Cost ............................................................................................................... 7
Table C-2. Annualized Costs .............................................................................................................. 8
Table C-3. Union Beach 2001 vs. 2016 Cost Comparison and Explanation ...................................... 9
Total Project Cost Summary ................................................................................................................... 10
Abbreviated Risk Analysis (ARA) Results ............................................................................................. 17
Construction Schedule ............................................................................................................................ 18
1
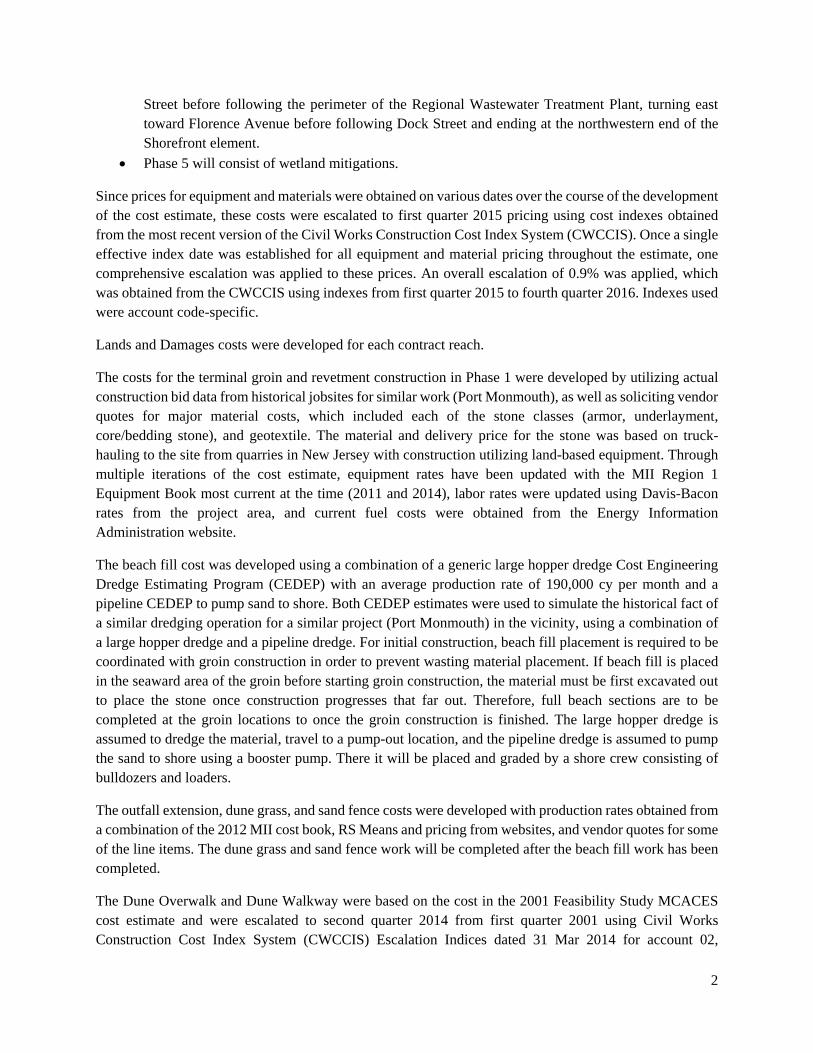
Introduction This Appendix presents the detailed cost estimate and pertinent information for the recommended plan in the Hurricane Sandy Limited Reevaluation Report (HSRR) dated August 2016. The Recommended Plan, which is fully described in the Feasibility Report, can be defined according to the major construction elements and sub-elements or segments within three distinct areas of the Union Beach area. The three areas of the project are designated as the Raritan Bay shoreline, Chingarora Creek and Flat/East Creeks. The selected plan consists of a levee and floodwall alignment for the Chingarora Creek element that begins at the high ground near the intersections of Florence Avenue and Bank Street and ends at the northwestern end Shorefront element. The Shorefront element consists of a beach and dune incorporating terminal groins and revetments stretching from the Chingarora Creek levee floodwall alignment to the southeastern limit of the Dune that ties into the levee alignment near Flat Creek. The Flat/East Creeks element of the flood protection consists of a floodwall and levee alignment that begins at the southeastern limit of the Shorefront element and ties into the existing Keansburg levee at the eastern end of the project limits. The location of each of the sub-areas within the project area is shown in Section V of the Main Report.
It was determined that a change in the 2007 Authorized Plan alignment for the Chingarora Creek element was warranted between Ash Street and State Street due to this reach crossing the wetlands well within the CBRA boundary. The extent of realignment was constrained by the desire to not affect additional private real estate. The alignment change resulted in an increase in floodwall length of 6,465 LF, and a decrease in levee length of 3,998 LF. The additional wetland impact is relatively small. The other reaches along Bay Avenue and Chingarora Street, and around the Bayshore Regional Sewage Treatment Authority plant where the levee/floodwall alignment was adjacent to, along or slightly within the boundary, were not revised. Coordination was initiated with the regional office of the Fish and Wildlife Service. Further discussion on this issue is elsewhere in this study.
The anticipated phasing is as follows:
Phase 1 will consist of the construction of shoreline protection which includes beachfill, terminal groins and revetment, and some relocation elements such as the outfall extension, dune overwalk, and dune walkways.
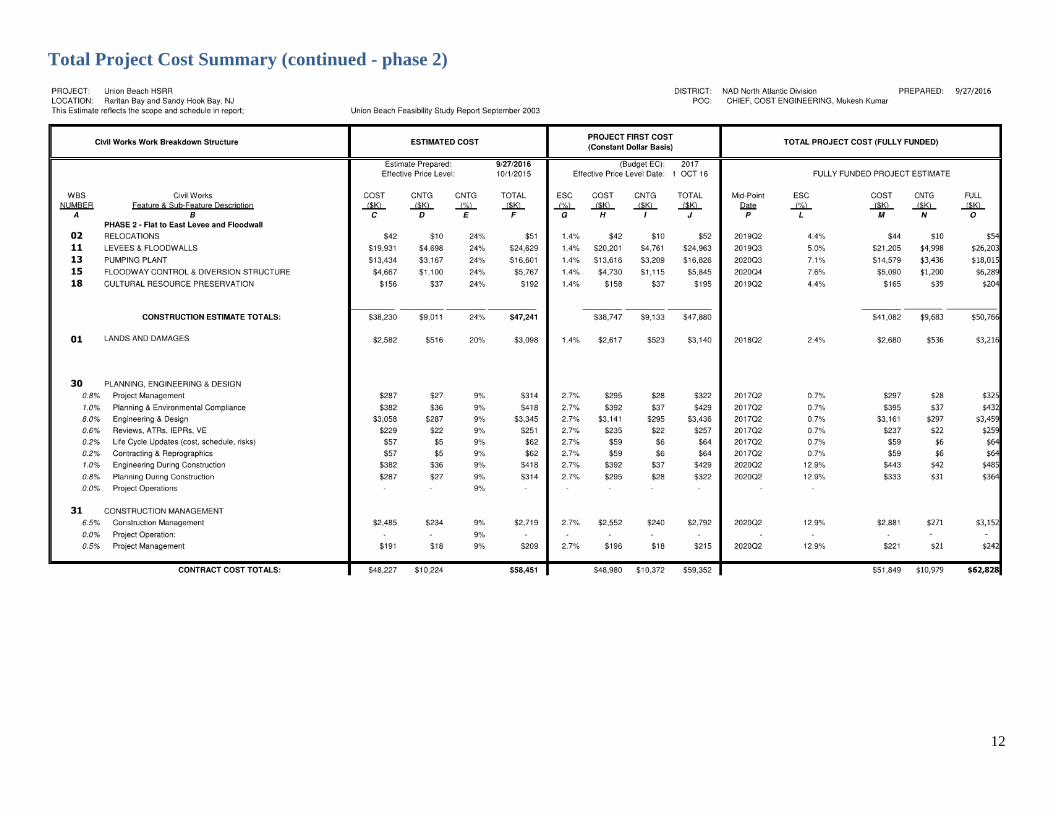
Phase 2 will consist of the construction of 6,959 feet of levee and floodwall, sluice gates and drainage structures from just west of Flat Creek near the intersection of Union Avenue and Brook Avenue, then roughly parallel to Brook Avenue before turning south toward Bayview Avenue then Southwest along East Creek to just east of East Creek, tying into the west end of Phase 1. And approximately 3,388 line feet of interior levee located south of Jersey Avenue and behind the houses lining High and Harris Avenues to the intersection of High and Isabella Avenues on the west and along Harris and Willow Streets to the intersection of Willow Street and Wesley Avenue.
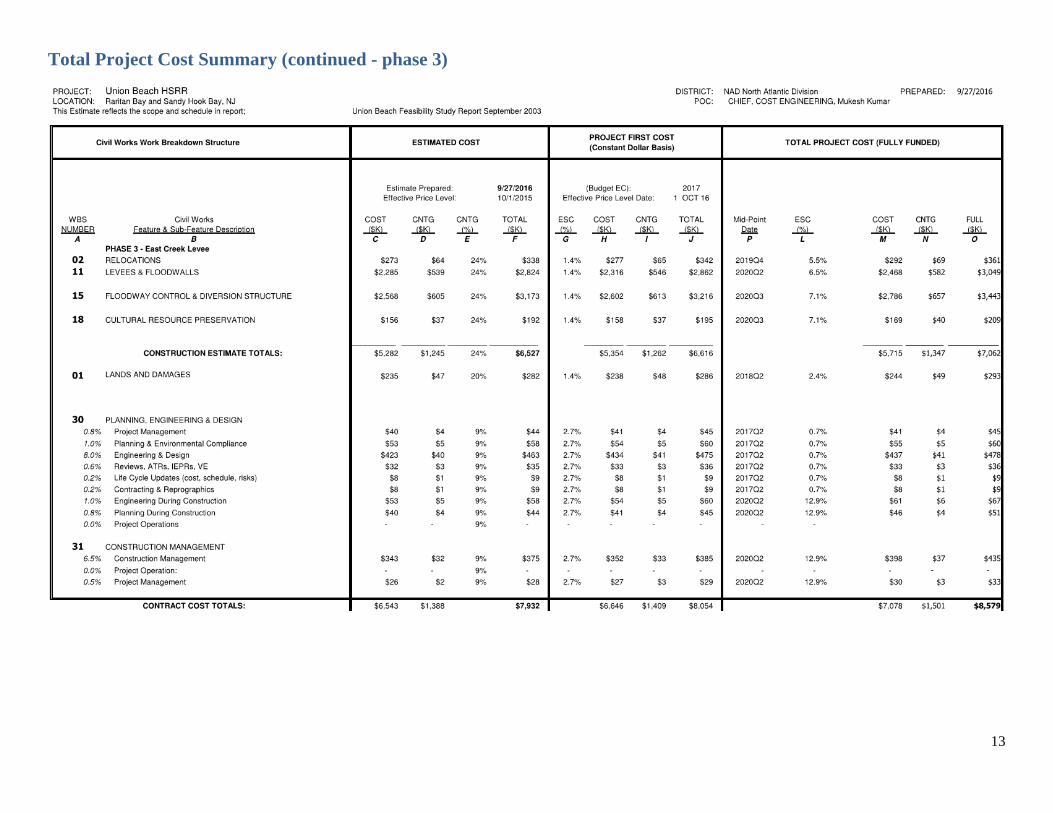
Phase 3 will consist of the construction of 2,919 feet of levee and drainage structures along the Henry Hudson Trail and parallel to Jersey Avenue from just east of the bridge over East Creek, across the raising of Rose Lane, past Natco Lake to the tie-out with the Keansburg levee.
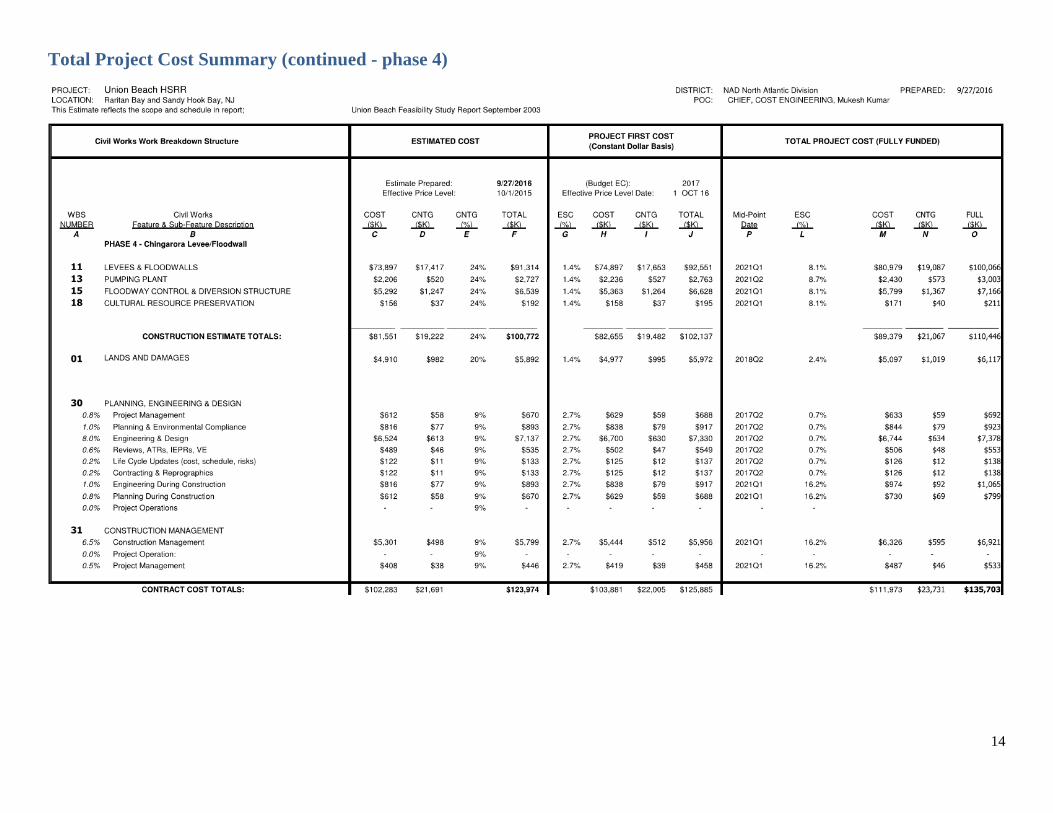
Phase 4 will consist of the construction of 13,280 feet of levee and floodwall, and drainage structures from the high ground near the intersections of Florence Avenue and Bank Street, across Broadway, where a gated closure is required, continuing roughly parallel to Chingagora Creek and to the rear of the houses, past State Street, then turning parallel to Bay Avenue and Chingarora
2
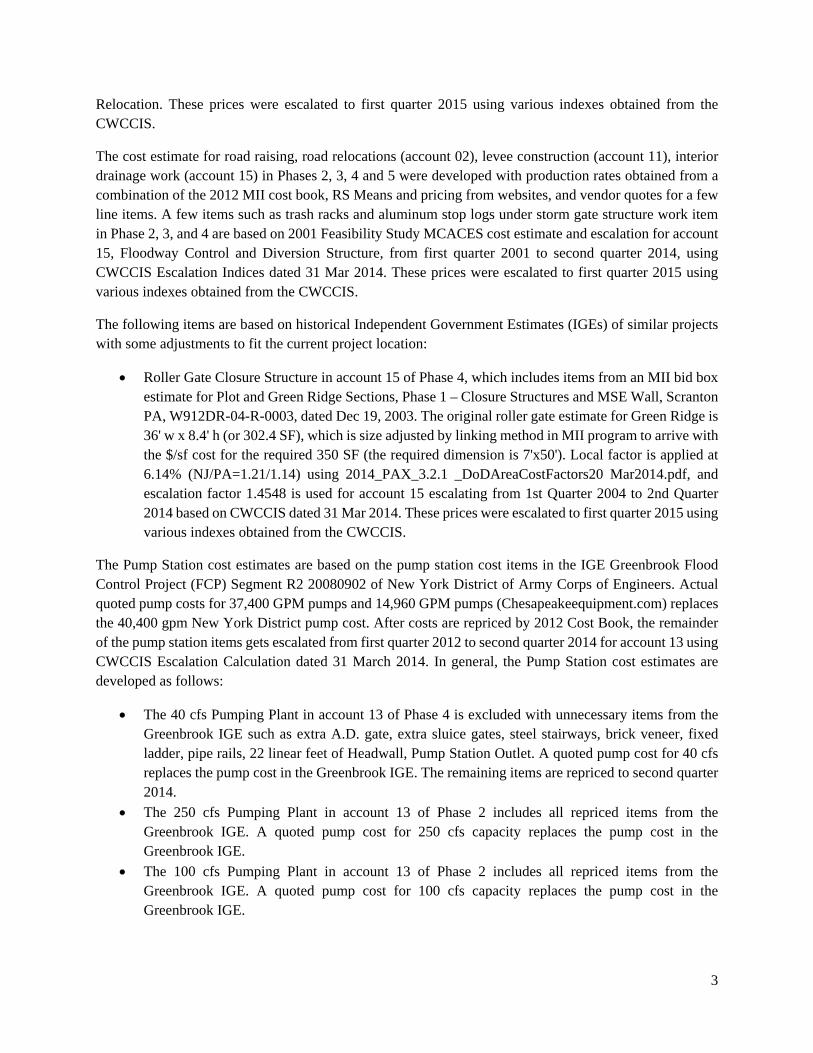
Street before following the perimeter of the Regional Wastewater Treatment Plant, turning east toward Florence Avenue before following Dock Street and ending at the northwestern end of the Shorefront element.
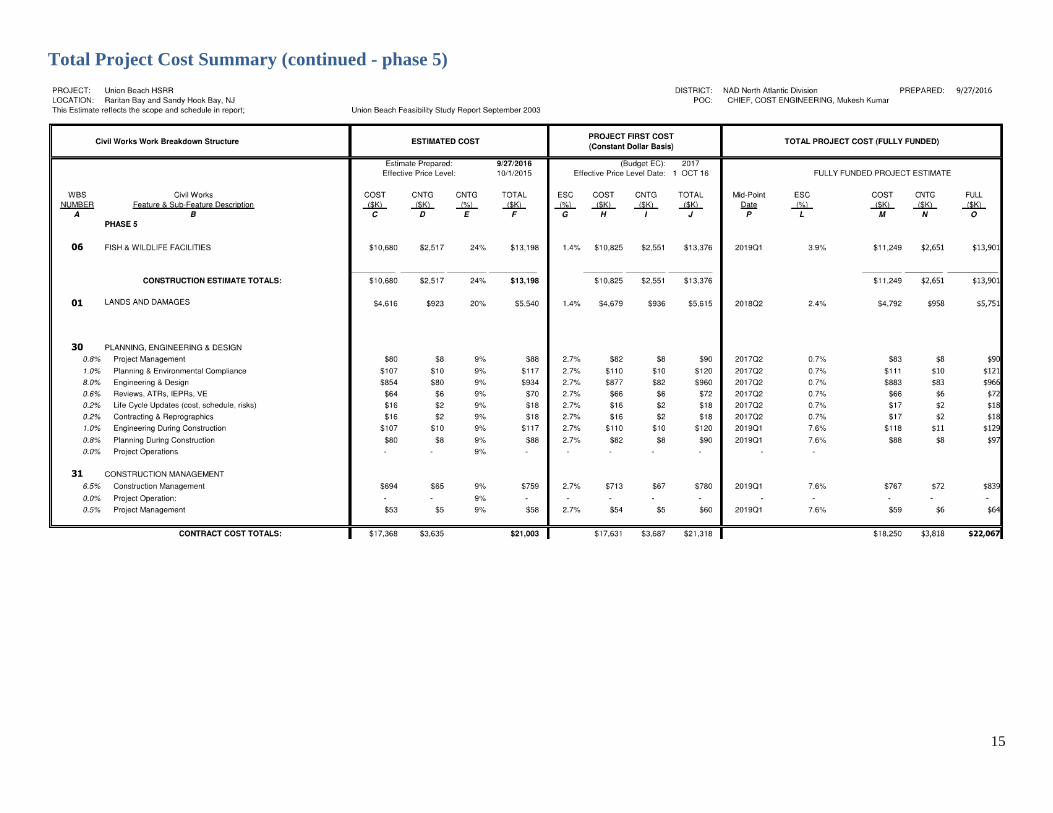
Phase 5 will consist of wetland mitigations.
Since prices for equipment and materials were obtained on various dates over the course of the development of the cost estimate, these costs were escalated to first quarter 2015 pricing using cost indexes obtained from the most recent version of the Civil Works Construction Cost Index System (CWCCIS). Once a single effective index date was established for all equipment and material pricing throughout the estimate, one comprehensive escalation was applied to these prices. An overall escalation of 0.9% was applied, which was obtained from the CWCCIS using indexes from first quarter 2015 to fourth quarter 2016. Indexes used were account code-specific.
Lands and Damages costs were developed for each contract reach.
The costs for the terminal groin and revetment construction in Phase 1 were developed by utilizing actual construction bid data from historical jobsites for similar work (Port Monmouth), as well as soliciting vendor quotes for major material costs, which included each of the stone classes (armor, underlayment, core/bedding stone), and geotextile. The material and delivery price for the stone was based on truck-hauling to the site from quarries in New Jersey with construction utilizing land-based equipment. Through multiple iterations of the cost estimate, equipment rates have been updated with the MII Region 1 Equipment Book most current at the time (2011 and 2014), labor rates were updated using Davis-Bacon rates from the project area, and current fuel costs were obtained from the Energy Information Administration website.
The beach fill cost was developed using a combination of a generic large hopper dredge Cost Engineering Dredge Estimating Program (CEDEP) with an average production rate of 190,000 cy per month and a pipeline CEDEP to pump sand to shore. Both CEDEP estimates were used to simulate the historical fact of a similar dredging operation for a similar project (Port Monmouth) in the vicinity, using a combination of a large hopper dredge and a pipeline dredge. For initial construction, beach fill placement is required to be coordinated with groin construction in order to prevent wasting material placement. If beach fill is placed in the seaward area of the groin before starting groin construction, the material must be first excavated out to place the stone once construction progresses that far out. Therefore, full beach sections are to be completed at the groin locations to once the groin construction is finished. The large hopper dredge is assumed to dredge the material, travel to a pump-out location, and the pipeline dredge is assumed to pump the sand to shore using a booster pump. There it will be placed and graded by a shore crew consisting of bulldozers and loaders.
The outfall extension, dune grass, and sand fence costs were developed with production rates obtained from a combination of the 2012 MII cost book, RS Means and pricing from websites, and vendor quotes for some of the line items. The dune grass and sand fence work will be completed after the beach fill work has been completed.
The Dune Overwalk and Dune Walkway were based on the cost in the 2001 Feasibility Study MCACES cost estimate and were escalated to second quarter 2014 from first quarter 2001 using Civil Works Construction Cost Index System (CWCCIS) Escalation Indices dated 31 Mar 2014 for account 02,
3
Relocation. These prices were escalated to first quarter 2015 using various indexes obtained from the CWCCIS.
The cost estimate for road raising, road relocations (account 02), levee construction (account 11), interior drainage work (account 15) in Phases 2, 3, 4 and 5 were developed with production rates obtained from a combination of the 2012 MII cost book, RS Means and pricing from websites, and vendor quotes for a few line items. A few items such as trash racks and aluminum stop logs under storm gate structure work item in Phase 2, 3, and 4 are based on 2001 Feasibility Study MCACES cost estimate and escalation for account 15, Floodway Control and Diversion Structure, from first quarter 2001 to second quarter 2014, using CWCCIS Escalation Indices dated 31 Mar 2014. These prices were escalated to first quarter 2015 using various indexes obtained from the CWCCIS.
The following items are based on historical Independent Government Estimates (IGEs) of similar projects with some adjustments to fit the current project location:
Roller Gate Closure Structure in account 15 of Phase 4, which includes items from an MII bid box estimate for Plot and Green Ridge Sections, Phase 1 – Closure Structures and MSE Wall, Scranton PA, W912DR-04-R-0003, dated Dec 19, 2003. The original roller gate estimate for Green Ridge is 36' w x 8.4' h (or 302.4 SF), which is size adjusted by linking method in MII program to arrive with the $/sf cost for the required 350 SF (the required dimension is 7'x50'). Local factor is applied at 6.14% (NJ/PA=1.21/1.14) using 2014_PAX_3.2.1 _DoDAreaCostFactors20 Mar2014.pdf, and escalation factor 1.4548 is used for account 15 escalating from 1st Quarter 2004 to 2nd Quarter 2014 based on CWCCIS dated 31 Mar 2014. These prices were escalated to first quarter 2015 using various indexes obtained from the CWCCIS.
The Pump Station cost estimates are based on the pump station cost items in the IGE Greenbrook Flood Control Project (FCP) Segment R2 20080902 of New York District of Army Corps of Engineers. Actual quoted pump costs for 37,400 GPM pumps and 14,960 GPM pumps (Chesapeakeequipment.com) replaces the 40,400 gpm New York District pump cost. After costs are repriced by 2012 Cost Book, the remainder of the pump station items gets escalated from first quarter 2012 to second quarter 2014 for account 13 using CWCCIS Escalation Calculation dated 31 March 2014. In general, the Pump Station cost estimates are developed as follows:
The 40 cfs Pumping Plant in account 13 of Phase 4 is excluded with unnecessary items from the Greenbrook IGE such as extra A.D. gate, extra sluice gates, steel stairways, brick veneer, fixed ladder, pipe rails, 22 linear feet of Headwall, Pump Station Outlet. A quoted pump cost for 40 cfs replaces the pump cost in the Greenbrook IGE. The remaining items are repriced to second quarter 2014.
The 250 cfs Pumping Plant in account 13 of Phase 2 includes all repriced items from the Greenbrook IGE. A quoted pump cost for 250 cfs capacity replaces the pump cost in the Greenbrook IGE.
The 100 cfs Pumping Plant in account 13 of Phase 2 includes all repriced items from the Greenbrook IGE. A quoted pump cost for 100 cfs capacity replaces the pump cost in the Greenbrook IGE.
4
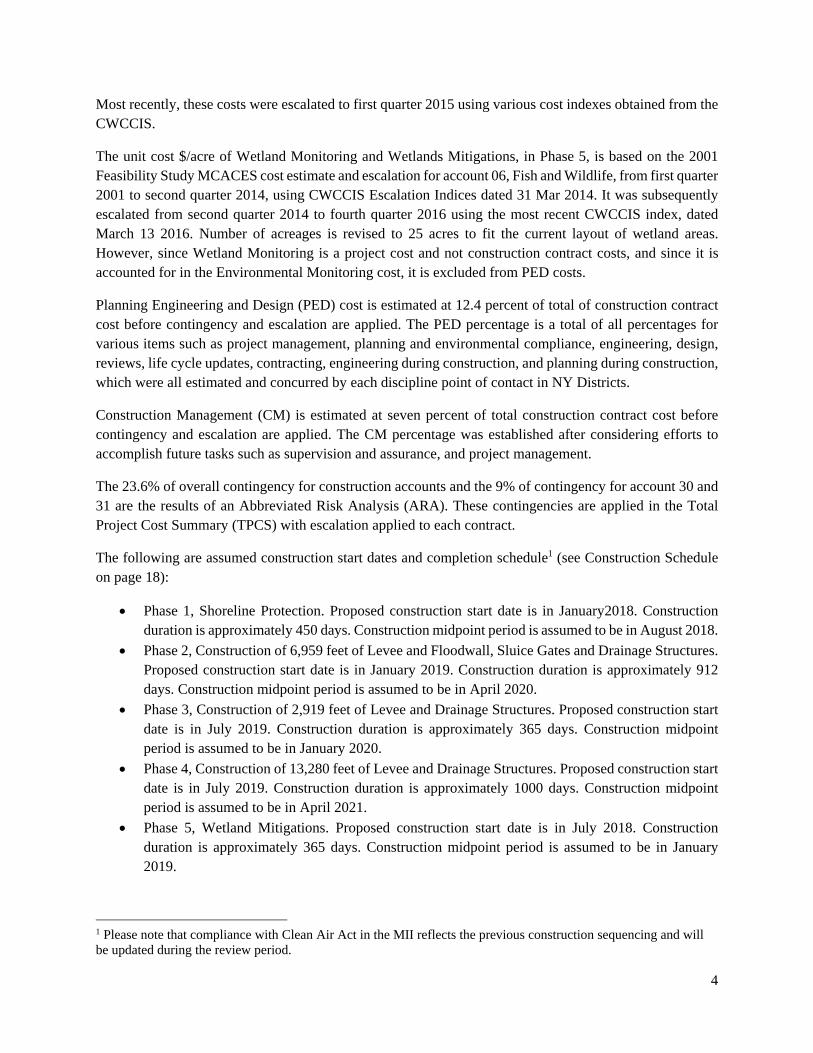
Most recently, these costs were escalated to first quarter 2015 using various cost indexes obtained from the CWCCIS.
The unit cost $/acre of Wetland Monitoring and Wetlands Mitigations, in Phase 5, is based on the 2001 Feasibility Study MCACES cost estimate and escalation for account 06, Fish and Wildlife, from first quarter 2001 to second quarter 2014, using CWCCIS Escalation Indices dated 31 Mar 2014. It was subsequently escalated from second quarter 2014 to fourth quarter 2016 using the most recent CWCCIS index, dated March 13 2016. Number of acreages is revised to 25 acres to fit the current layout of wetland areas. However, since Wetland Monitoring is a project cost and not construction contract costs, and since it is accounted for in the Environmental Monitoring cost, it is excluded from PED costs.
Planning Engineering and Design (PED) cost is estimated at 12.4 percent of total of construction contract cost before contingency and escalation are applied. The PED percentage is a total of all percentages for various items such as project management, planning and environmental compliance, engineering, design, reviews, life cycle updates, contracting, engineering during construction, and planning during construction, which were all estimated and concurred by each discipline point of contact in NY Districts.
Construction Management (CM) is estimated at seven percent of total construction contract cost before contingency and escalation are applied. The CM percentage was established after considering efforts to accomplish future tasks such as supervision and assurance, and project management.
The 23.6% of overall contingency for construction accounts and the 9% of contingency for account 30 and 31 are the results of an Abbreviated Risk Analysis (ARA). These contingencies are applied in the Total Project Cost Summary (TPCS) with escalation applied to each contract.
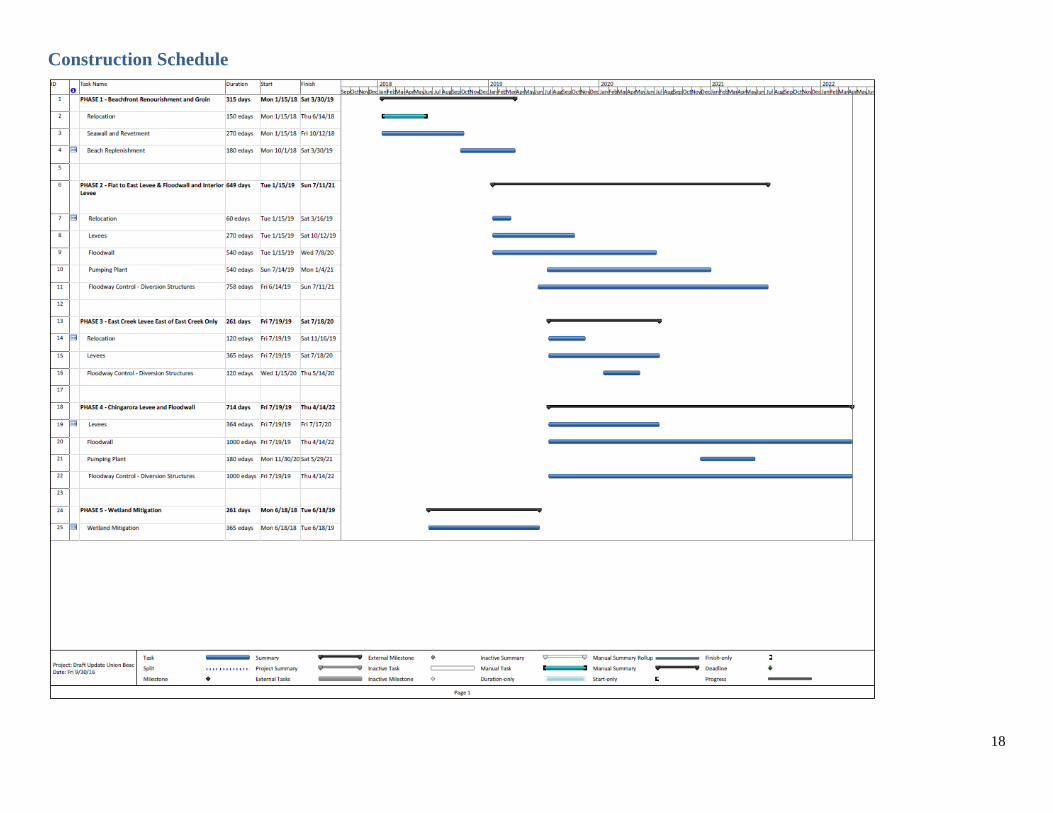
The following are assumed construction start dates and completion schedule1 (see Construction Schedule on page 18):
Phase 1, Shoreline Protection. Proposed construction start date is in January2018. Construction duration is approximately 450 days. Construction midpoint period is assumed to be in August 2018.
Phase 2, Construction of 6,959 feet of Levee and Floodwall, Sluice Gates and Drainage Structures. Proposed construction start date is in January 2019. Construction duration is approximately 912 days. Construction midpoint period is assumed to be in April 2020.
Phase 3, Construction of 2,919 feet of Levee and Drainage Structures. Proposed construction start date is in July 2019. Construction duration is approximately 365 days. Construction midpoint period is assumed to be in January 2020.
Phase 4, Construction of 13,280 feet of Levee and Drainage Structures. Proposed construction start date is in July 2019. Construction duration is approximately 1000 days. Construction midpoint period is assumed to be in April 2021.
Phase 5, Wetland Mitigations. Proposed construction start date is in July 2018. Construction duration is approximately 365 days. Construction midpoint period is assumed to be in January 2019.
1 Please note that compliance with Clean Air Act in the MII reflects the previous construction sequencing and will be updated during the review period.
5
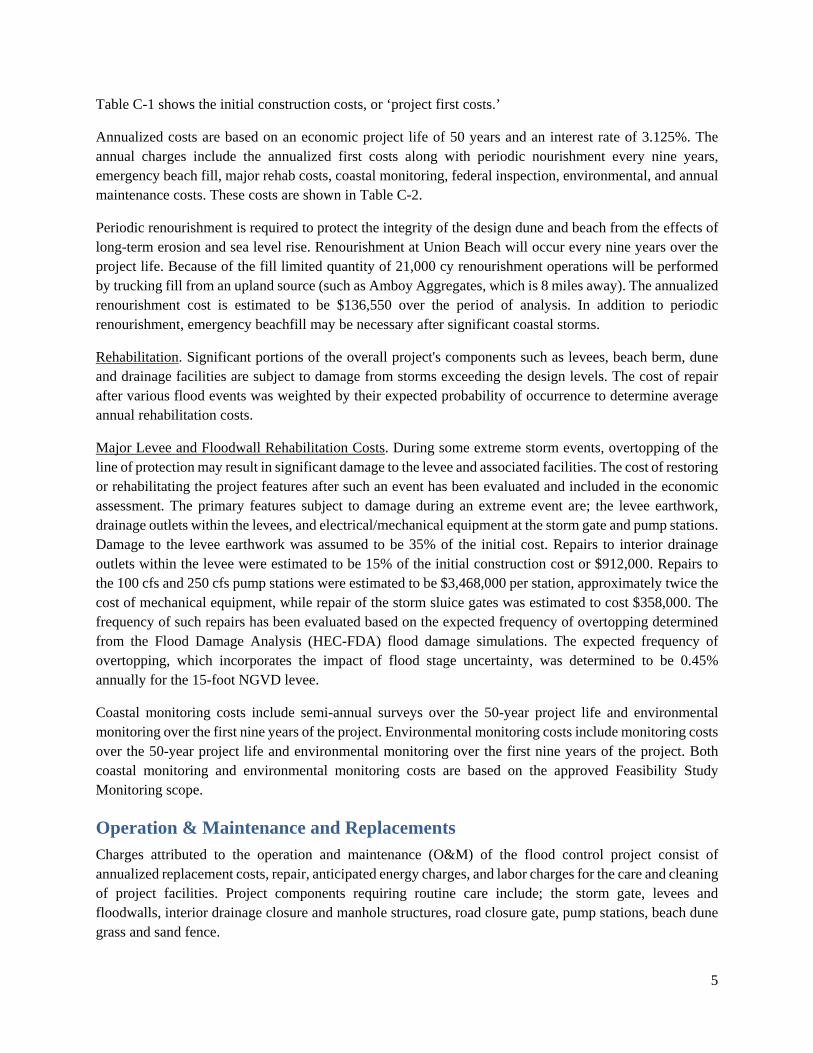
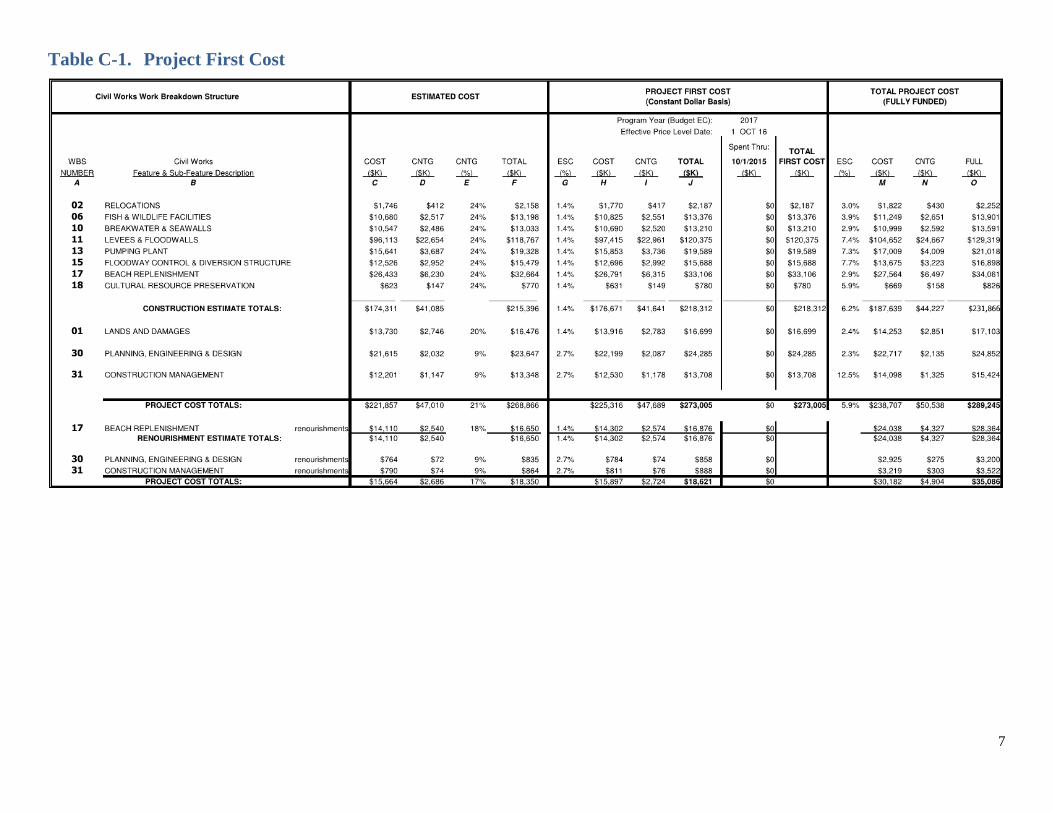
Table C-1 shows the initial construction costs, or ‘project first costs.’
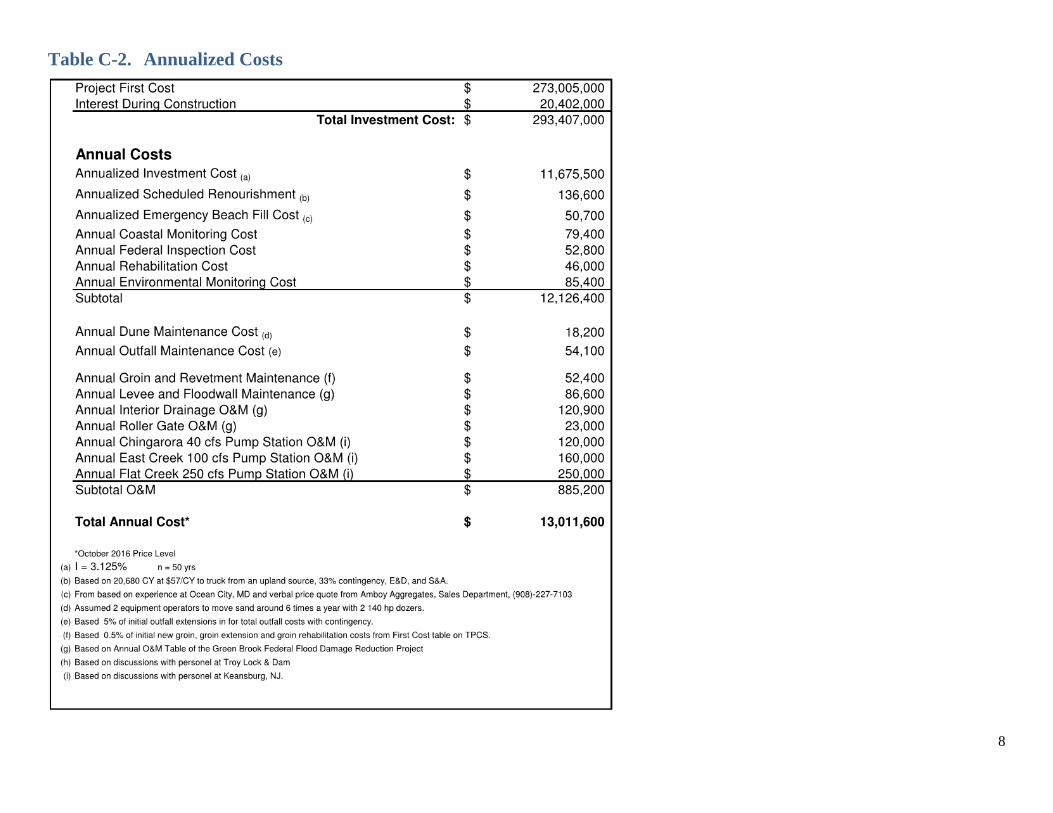
Annualized costs are based on an economic project life of 50 years and an interest rate of 3.125%. The annual charges include the annualized first costs along with periodic nourishment every nine years, emergency beach fill, major rehab costs, coastal monitoring, federal inspection, environmental, and annual maintenance costs. These costs are shown in Table C-2.
Periodic renourishment is required to protect the integrity of the design dune and beach from the effects of long-term erosion and sea level rise. Renourishment at Union Beach will occur every nine years over the project life. Because of the fill limited quantity of 21,000 cy renourishment operations will be performed by trucking fill from an upland source (such as Amboy Aggregates, which is 8 miles away). The annualized renourishment cost is estimated to be $136,550 over the period of analysis. In addition to periodic renourishment, emergency beachfill may be necessary after significant coastal storms.
Rehabilitation. Significant portions of the overall project's components such as levees, beach berm, dune and drainage facilities are subject to damage from storms exceeding the design levels. The cost of repair after various flood events was weighted by their expected probability of occurrence to determine average annual rehabilitation costs.
Major Levee and Floodwall Rehabilitation Costs. During some extreme storm events, overtopping of the line of protection may result in significant damage to the levee and associated facilities. The cost of restoring or rehabilitating the project features after such an event has been evaluated and included in the economic assessment. The primary features subject to damage during an extreme event are; the levee earthwork, drainage outlets within the levees, and electrical/mechanical equipment at the storm gate and pump stations. Damage to the levee earthwork was assumed to be 35% of the initial cost. Repairs to interior drainage outlets within the levee were estimated to be 15% of the initial construction cost or $912,000. Repairs to the 100 cfs and 250 cfs pump stations were estimated to be $3,468,000 per station, approximately twice the cost of mechanical equipment, while repair of the storm sluice gates was estimated to cost $358,000. The frequency of such repairs has been evaluated based on the expected frequency of overtopping determined from the Flood Damage Analysis (HEC-FDA) flood damage simulations. The expected frequency of overtopping, which incorporates the impact of flood stage uncertainty, was determined to be 0.45% annually for the 15-foot NGVD levee.
Coastal monitoring costs include semi-annual surveys over the 50-year project life and environmental monitoring over the first nine years of the project. Environmental monitoring costs include monitoring costs over the 50-year project life and environmental monitoring over the first nine years of the project. Both coastal monitoring and environmental monitoring costs are based on the approved Feasibility Study Monitoring scope.
Operation & Maintenance and Replacements Charges attributed to the operation and maintenance (O&M) of the flood control project consist of annualized replacement costs, repair, anticipated energy charges, and labor charges for the care and cleaning of project facilities. Project components requiring routine care include; the storm gate, levees and floodwalls, interior drainage closure and manhole structures, road closure gate, pump stations, beach dune grass and sand fence.
6
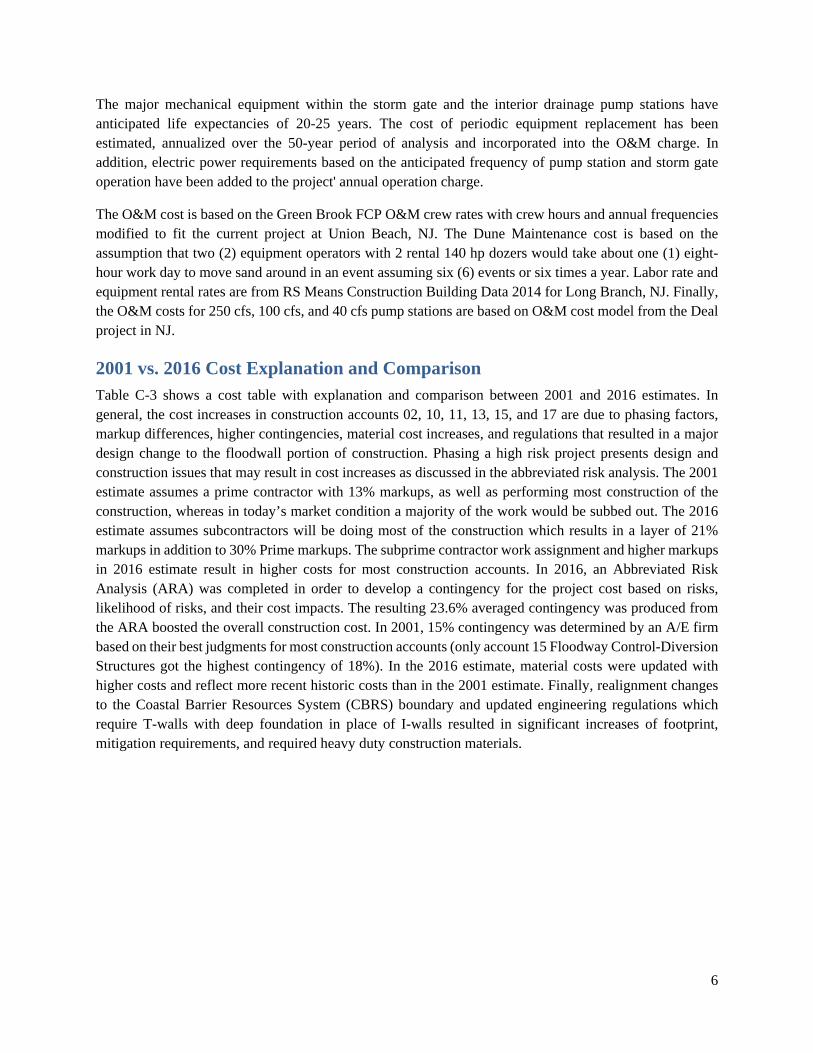
The major mechanical equipment within the storm gate and the interior drainage pump stations have anticipated life expectancies of 20-25 years. The cost of periodic equipment replacement has been estimated, annualized over the 50-year period of analysis and incorporated into the O&M charge. In addition, electric power requirements based on the anticipated frequency of pump station and storm gate operation have been added to the project' annual operation charge.
The O&M cost is based on the Green Brook FCP O&M crew rates with crew hours and annual frequencies modified to fit the current project at Union Beach, NJ. The Dune Maintenance cost is based on the assumption that two (2) equipment operators with 2 rental 140 hp dozers would take about one (1) eight-hour work day to move sand around in an event assuming six (6) events or six times a year. Labor rate and equipment rental rates are from RS Means Construction Building Data 2014 for Long Branch, NJ. Finally, the O&M costs for 250 cfs, 100 cfs, and 40 cfs pump stations are based on O&M cost model from the Deal project in NJ.
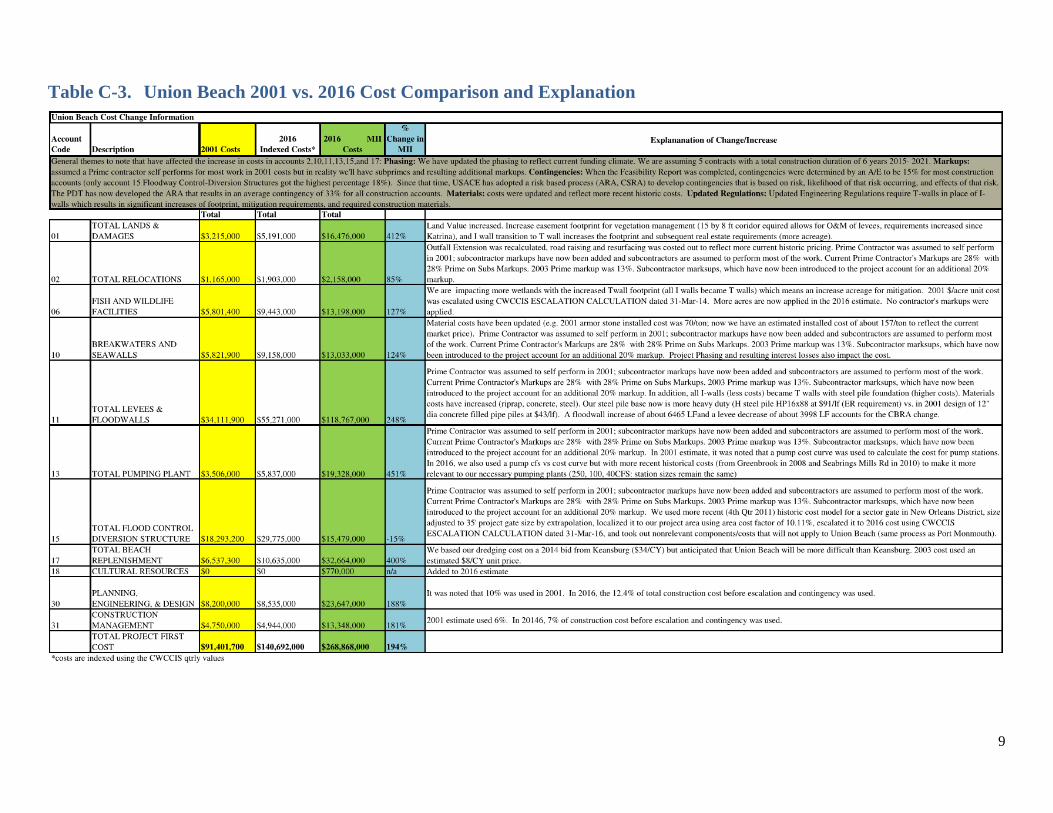
2001 vs. 2016 Cost Explanation and Comparison Table C-3 shows a cost table with explanation and comparison between 2001 and 2016 estimates. In general, the cost increases in construction accounts 02, 10, 11, 13, 15, and 17 are due to phasing factors, markup differences, higher contingencies, material cost increases, and regulations that resulted in a major design change to the floodwall portion of construction. Phasing a high risk project presents design and construction issues that may result in cost increases as discussed in the abbreviated risk analysis. The 2001 estimate assumes a prime contractor with 13% markups, as well as performing most construction of the construction, whereas in today’s market condition a majority of the work would be subbed out. The 2016 estimate assumes subcontractors will be doing most of the construction which results in a layer of 21% markups in addition to 30% Prime markups. The subprime contractor work assignment and higher markups in 2016 estimate result in higher costs for most construction accounts. In 2016, an Abbreviated Risk Analysis (ARA) was completed in order to develop a contingency for the project cost based on risks, likelihood of risks, and their cost impacts. The resulting 23.6% averaged contingency was produced from the ARA boosted the overall construction cost. In 2001, 15% contingency was determined by an A/E firm based on their best judgments for most construction accounts (only account 15 Floodway Control-Diversion Structures got the highest contingency of 18%). In the 2016 estimate, material costs were updated with higher costs and reflect more recent historic costs than in the 2001 estimate. Finally, realignment changes to the Coastal Barrier Resources System (CBRS) boundary and updated engineering regulations which require T-walls with deep foundation in place of I-walls resulted in significant increases of footprint, mitigation requirements, and required heavy duty construction materials.
7
Table C-1. Project First Cost
8
Table C-2. Annualized Costs
9
Table C-3. Union Beach 2001 vs. 2016 Cost Comparison and Explanation
10
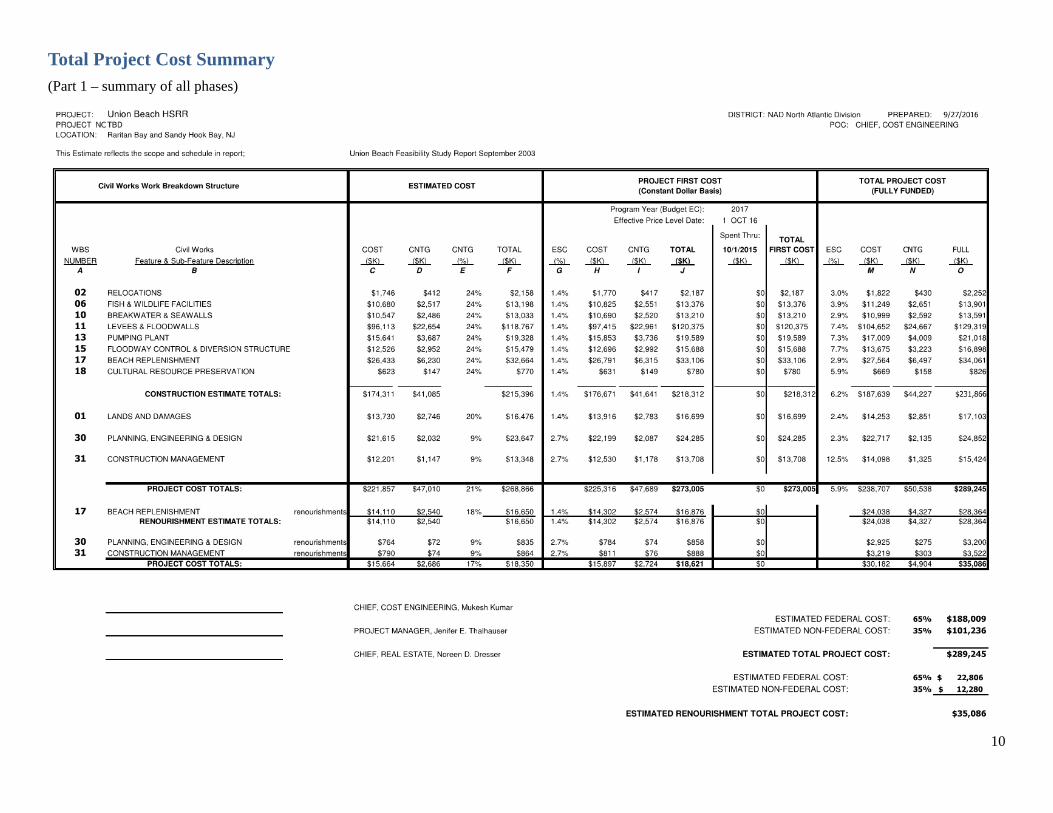
Total Project Cost Summary (Part 1 – summary of all phases)
11
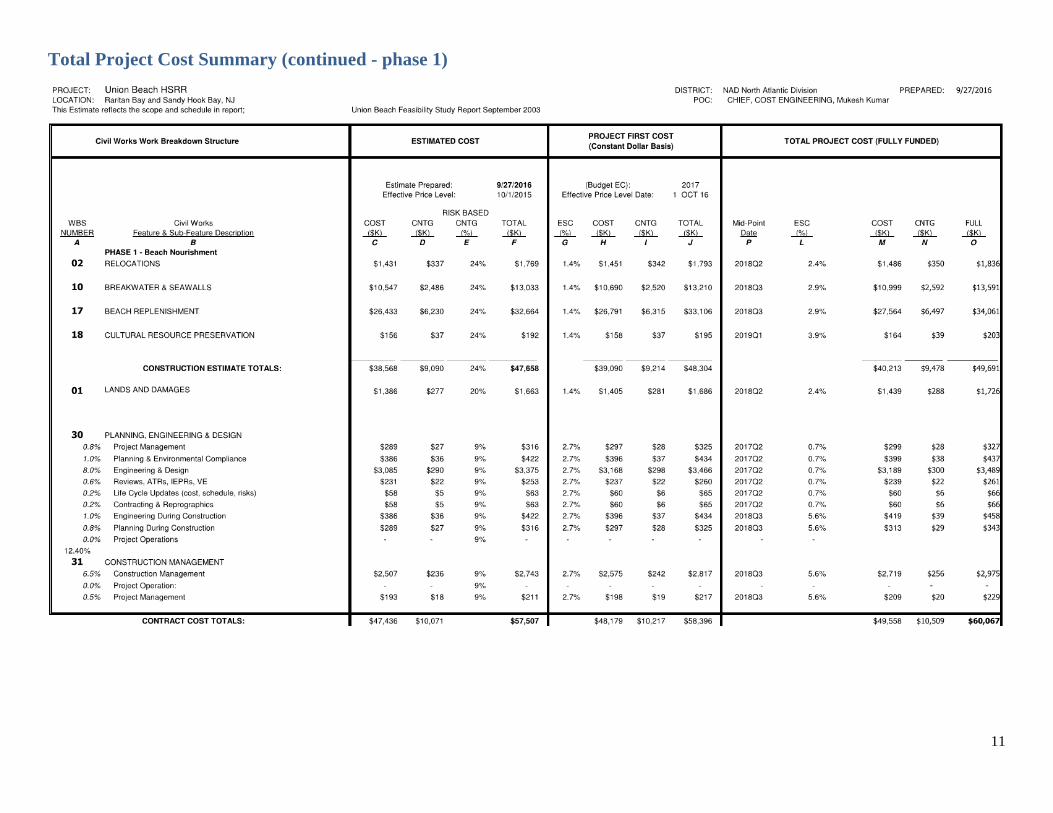
Total Project Cost Summary (continued - phase 1)
12
Total Project Cost Summary (continued - phase 2)
13
Total Project Cost Summary (continued - phase 3)
14
Total Project Cost Summary (continued - phase 4)
15
Total Project Cost Summary (continued - phase 5)
16
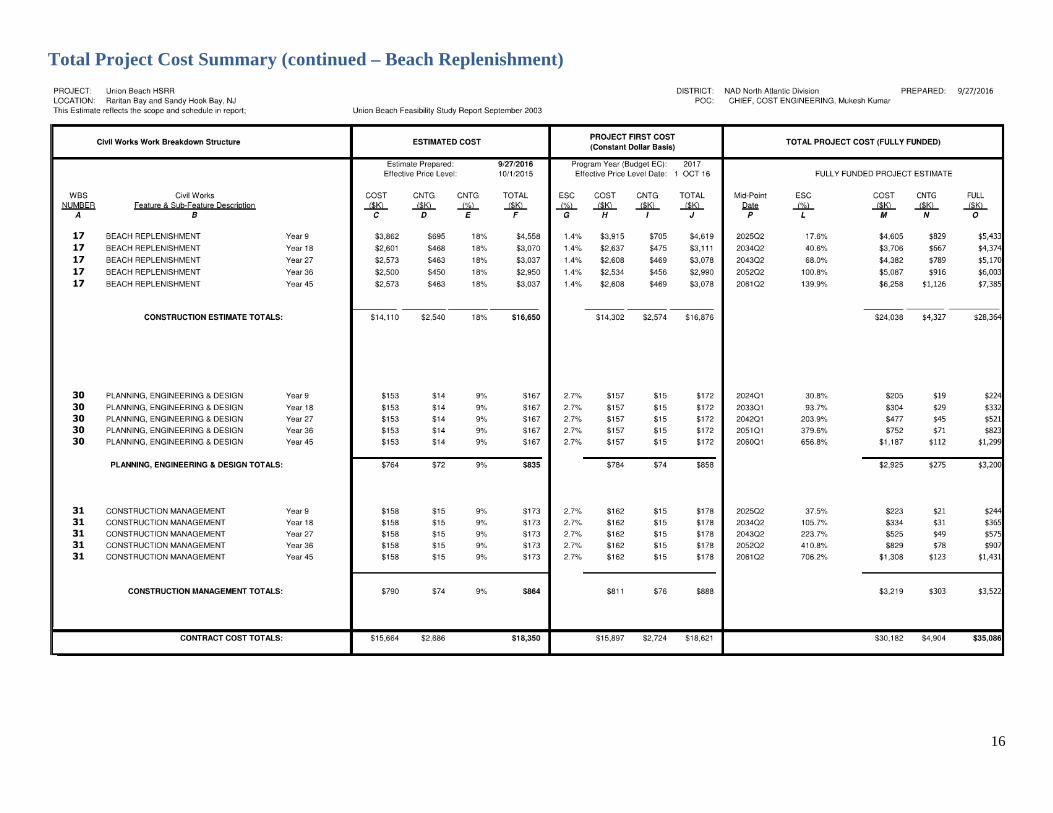
Total Project Cost Summary (continued – Beach Replenishment)
17
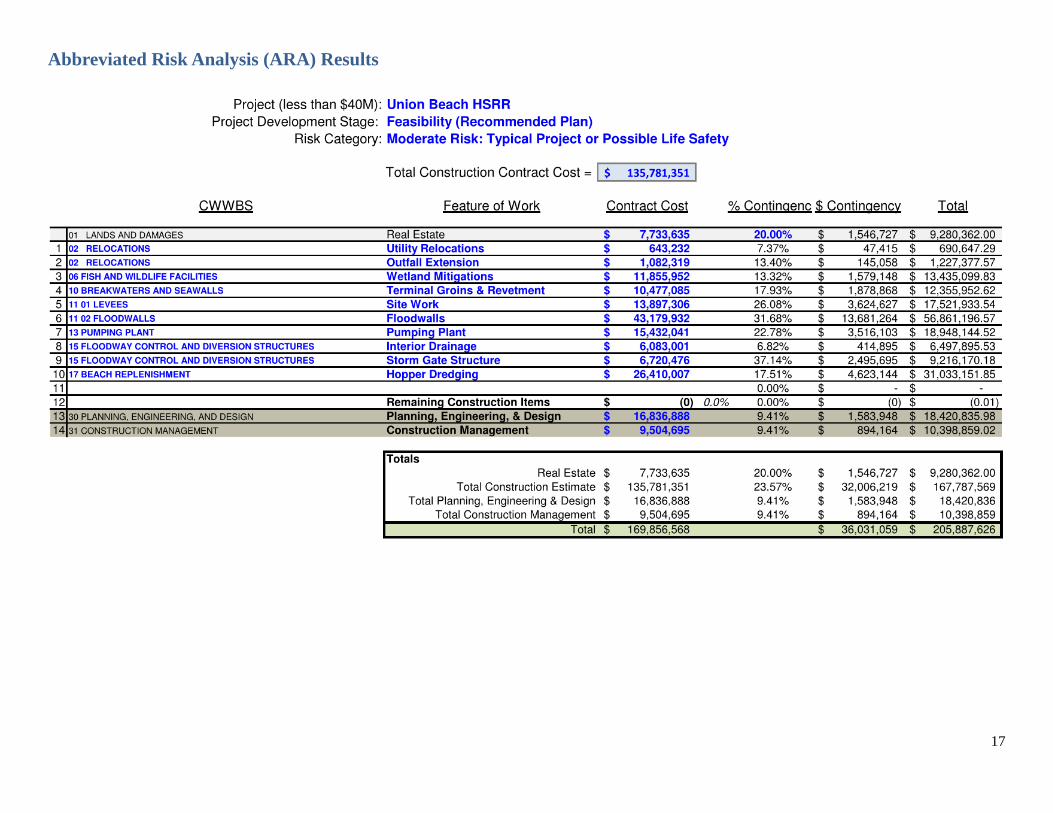
Abbreviated Risk Analysis (ARA) Results
18
Construction Schedule