Annual Greenhouse Gas Emissions - PwC
17
Annual Greenhouse Gas Emissions www.pwc.com.au Inventory Report Year ended 30 June 2011
Transcript of Annual Greenhouse Gas Emissions - PwC
Annual Greenhouse Gas Emissions
www.pwc.com.au
Inventory Report
Year ended 30 June 2011

Annual Greenhouse Gas Emissions2
CEO, PwC Australia
Mark Johnson
It is with pleasure that I present PwC Australia’s fourth Annual Greenhouse Gas Emissions Inventory Report (GHG Report), for the year ended 30 June 2011.
At PwC we believe in the collective responsibility of business, government and the public to create a sustainable future together. We strive to be environmentally responsible ourselves, and grow environmental intelligence more broadly. One of the ways that we are doing this is to increase transparency around our corporate reporting.
Our GHG Report enables us to measure our progress against our commitment, to be transparent with our performance, and to share our perspective on the challenges and experiences we have faced through this process.
PwC’s approach is to focus on reducing our gross GHG emissions through infrastructure and behavioural change, then reduce further by purchasing renewable energy, and finally offset all net GHG emissions to achieve carbon neutrality.
I am pleased to announce that we have achieved National Carbon Offset Standard (NCOS) carbon neutral certification for our organisation from 1 July 2011. In FY11 we have also reached a 44% GHG emissions reduction since our FY08 baseline year, including renewable energy purchases.
With the introduction of a carbon price in Australia in 2012, one thing is clear – reducing GHG emissions is now a business imperative rather than an optional extra. We see tremendous value in our early adoption of GHG emissions management and carbon neutrality. Since FY08 we have been learning through doing, and are now well placed to deliver this value to our people, communities, clients and the environment.
While we have come a long way, we still have work to do. We have performed better in some areas than others, and we are working to measure and improve performance across all aspects of our internal and external operations.
More information about PwC and our broader Corporate Responsibility agenda can be found in our Annual Review 2011 available at www.pwcannualreview.com.au.
Regards,
Mark Johnson
A message from Mark Johnson
1Inventory Report
01 Purpose of the report 2
Contents
02 Performance 3
03 Greenhouse gas emissions inventory 5
04 Emissions Management Overview 6
05 Targets 9
06 Independent assurance report 13
Page
Annual Greenhouse Gas Emissions2
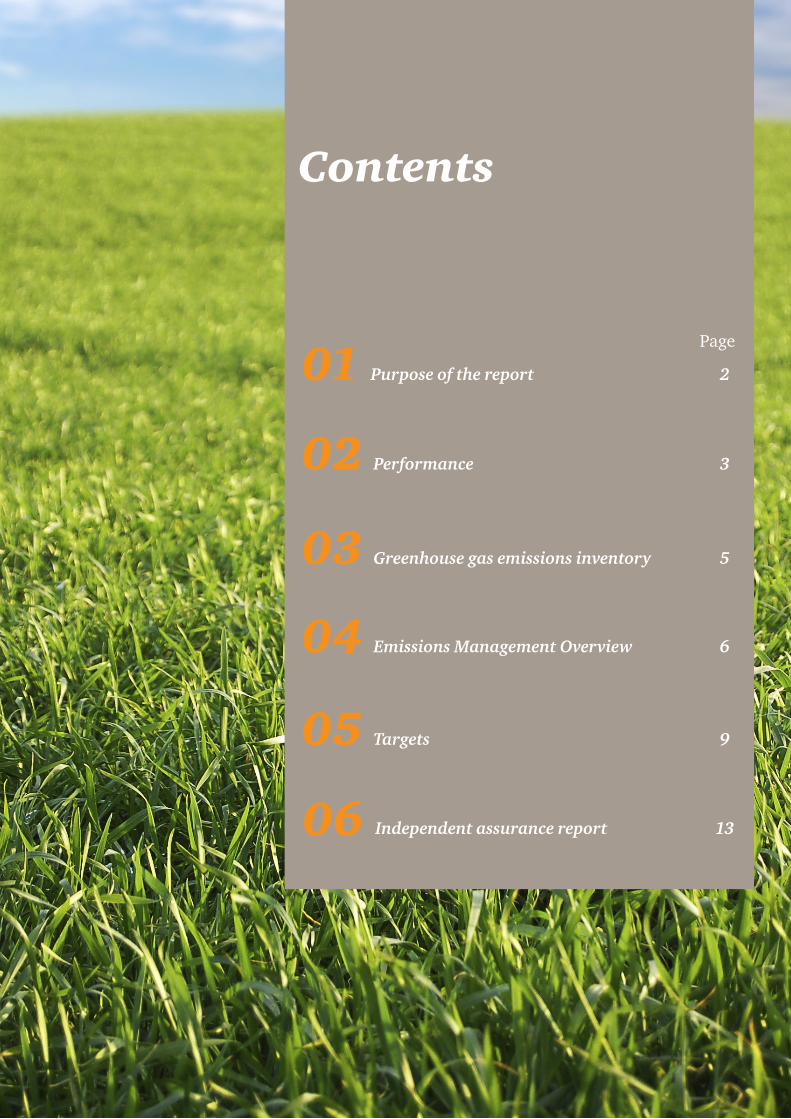
In order to measure our progress against our environmental commitment and to be transparent with our performance, we have committed to producing annual GHG Reports.
This is PwC’s fourth GHG Report and is for the year ended 30 June 2011 (FY11). It is intended to provide our stakeholders with an update of our environmental performance, and includes our independently assured FY11 GHG emissions inventory. Our GHG Report this year also includes discussion around some of the challenges that we have faced in relation to measuring, monitoring and reporting GHG emissions. Now that we have been reporting our GHG emissions for a number of years, we want to share what we have learned.
The Clean Energy Future Legislative package was passed by the Senate on 8 November 2011, introducing a carbon price into the Australian economy from 1 July 2012. It is important for organisations to understand the implications of this change, and to demonstrate how they are taking appropriate steps to reduce their GHG emissions.
PwC is monitoring these developments closely, not only for the benefit and advancement of our own strategy, but also to assist our clients to better understand and plan for the implications of these changes. We are committed to sharing our experiences with others so that together we can collaborate to better address this significant global issue.
For further information about the proposed carbon price, please visit www.pwc.com.au/carbonprice
PwC’s Greenhouse Gas Emissions Inventory is prepared in accordance with the National Carbon Offset Standard (NCOS). The NCOS contains provisions based on a number of Australian and international standards and Australian legislation, for guidance in determining the Greenhouse Gas Emissions Inventory. PwC refers to the following:
• Greenhouse Gas Protocol – A Corporate Accounting and Reporting Standard (GHG Protocol)
• ISO 14064 – Greenhouse gases, Part 1: Specification with guidance at the organisation level for quantification and reporting of greenhouse gas emissions and removals (ISO 14064)
• The National Greenhouse and Energy Reporting Act 2007 (NGER Act)
01
2
3Carbon neutral
1 Reduce GHG emissions through infrastructure and behavioural change
Invest in renewable electricity
Offset net GHG emissions
The introduction of a carbon price will have a diverse range of financial and operational impacts for both liable and non-liable entities. PwC’s collective capability across consulting, deals, assurance, tax and legal and private clients provides our clients across all industries unique value in navigating these impacts.
Purpose of the report
3Inventory Report
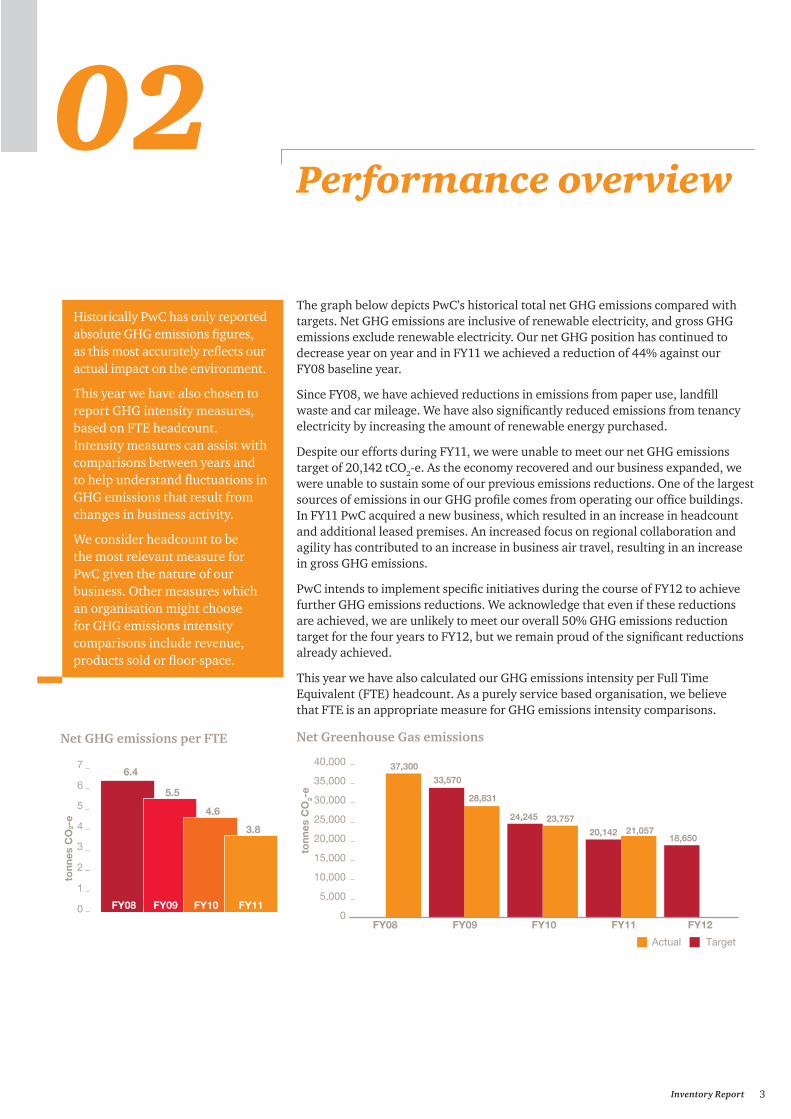
The graph below depicts PwC’s historical total net GHG emissions compared with targets. Net GHG emissions are inclusive of renewable electricity, and gross GHG emissions exclude renewable electricity. Our net GHG position has continued to decrease year on year and in FY11 we achieved a reduction of 44% against our FY08 baseline year.
Since FY08, we have achieved reductions in emissions from paper use, landfill waste and car mileage. We have also significantly reduced emissions from tenancy electricity by increasing the amount of renewable energy purchased.
Despite our efforts during FY11, we were unable to meet our net GHG emissions target of 20,142 tCO2-e. As the economy recovered and our business expanded, we were unable to sustain some of our previous emissions reductions. One of the largest sources of emissions in our GHG profile comes from operating our office buildings. In FY11 PwC acquired a new business, which resulted in an increase in headcount and additional leased premises. An increased focus on regional collaboration and agility has contributed to an increase in business air travel, resulting in an increase in gross GHG emissions.
PwC intends to implement specific initiatives during the course of FY12 to achieve further GHG emissions reductions. We acknowledge that even if these reductions are achieved, we are unlikely to meet our overall 50% GHG emissions reduction target for the four years to FY12, but we remain proud of the significant reductions already achieved.
This year we have also calculated our GHG emissions intensity per Full Time Equivalent (FTE) headcount. As a purely service based organisation, we believe that FTE is an appropriate measure for GHG emissions intensity comparisons.
Net Greenhouse Gas emissions
02Performance overview
Historically PwC has only reported absolute GHG emissions figures, as this most accurately reflects our actual impact on the environment.
This year we have also chosen to report GHG intensity measures, based on FTE headcount. Intensity measures can assist with comparisons between years and to help understand fluctuations in GHG emissions that result from changes in business activity.
We consider headcount to be the most relevant measure for PwC given the nature of our business. Other measures which an organisation might choose for GHG emissions intensity comparisons include revenue, products sold or floor-space.
37,300
33,570
28,831
24,245 23,75720,142 21,057
18,650
0
5,000
10,000
15,000
20,000
25,000
30,000
35,000
40,000
FY08 FY09 FY10 FY11 FY12
TargetActual
tonn
es C
O2-
e
2
3
4
5
6
7
tonn
es C
O2-
e
6.4
5.5
4.6
3.8
FY08 FY09 FY10 FY110
1
Net GHG emissions per FTE
Annual Greenhouse Gas Emissions4
National Carbon Offset Standard
The National Carbon Offset Standard (NCOS), effective from 1 July 2010, has replaced the Greenhouse Friendly TM program. The NCOS provides a voluntary standard for businesses to use in claiming carbon neutrality, and provides guidance on determining their GHG emissions and for purchasing robust offsets. The NCOS Carbon Neutral program also provides the ability to become certified under the NCOS as carbon neutral.
In addition to being carbon neutral since FY09, we are proud to announce that PwC has achieved certified carbon neutral status under the NCOS from 1 July 2011.
Further details are available in our NCOS Public Disclosure Summary, available at www.lowcarbonaustralia.com.au/page/carbon-neutral-network
Preparing and submitting our application for NCOS carbon neutral certification has been another learning process for PwC. As a result, we have a deep understanding of the requirements of each step of the application, verification and certification processes.
This experience has confirmed for us the areas which need our greatest attention to achieve further emission reductions. We now have a certified Emissions Management Plan, and report annually to Low Carbon Australia, the body administering the NCOS carbon neutral program on behalf of the Department of Climate Change and Energy Efficiency.
5Inventory Report
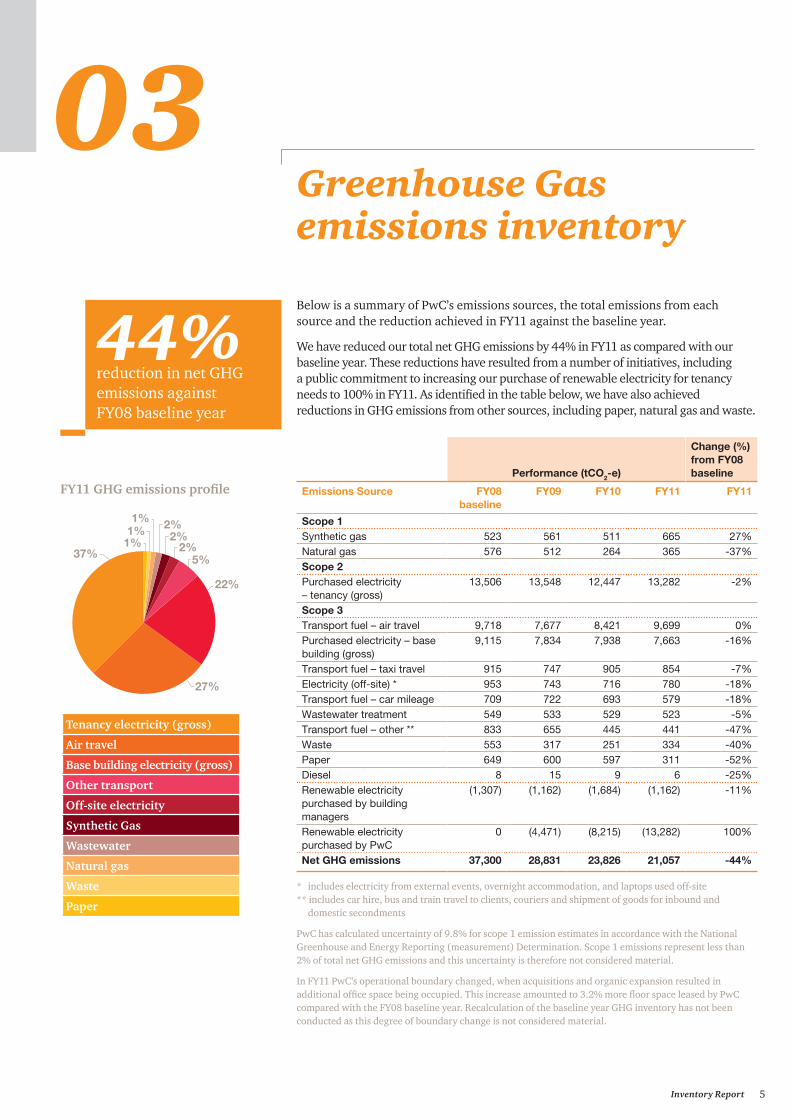
Below is a summary of PwC’s emissions sources, the total emissions from each source and the reduction achieved in FY11 against the baseline year.
We have reduced our total net GHG emissions by 44% in FY11 as compared with our baseline year. These reductions have resulted from a number of initiatives, including a public commitment to increasing our purchase of renewable electricity for tenancy needs to 100% in FY11. As identified in the table below, we have also achieved reductions in GHG emissions from other sources, including paper, natural gas and waste.
Performance (tCO2-e)
Change (%) from FY08 baseline
Emissions Source FY08 baseline
FY09 FY10 FY11 FY11
Scope 1Synthetic gas 523 561 511 665 27%Natural gas 576 512 264 365 -37%Scope 2Purchased electricity – tenancy (gross)
13,506 13,548 12,447 13,282 -2%
Scope 3Transport fuel – air travel 9,718 7,677 8,421 9,699 0%Purchased electricity – base building (gross)
9,115 7,834 7,938 7,663 -16%
Transport fuel – taxi travel 915 747 905 854 -7%Electricity (off-site) * 953 743 716 780 -18%Transport fuel – car mileage 709 722 693 579 -18%Wastewater treatment 549 533 529 523 -5%Transport fuel – other ** 833 655 445 441 -47%Waste 553 317 251 334 -40%Paper 649 600 597 311 -52%Diesel 8 15 9 6 -25%Renewable electricity purchased by building managers
(1,307) (1,162) (1,684) (1,162) -11%
Renewable electricity purchased by PwC
0 (4,471) (8,215) (13,282) 100%
Net GHG emissions 37,300 28,831 23,826 21,057 -44%
* includes electricity from external events, overnight accommodation, and laptops used off-site ** includes car hire, bus and train travel to clients, couriers and shipment of goods for inbound and domestic secondments
PwC has calculated uncertainty of 9.8% for scope 1 emission estimates in accordance with the National Greenhouse and Energy Reporting (measurement) Determination. Scope 1 emissions represent less than 2% of total net GHG emissions and this uncertainty is therefore not considered material.
In FY11 PwC’s operational boundary changed, when acquisitions and organic expansion resulted in additional office space being occupied. This increase amounted to 3.2% more floor space leased by PwC compared with the FY08 baseline year. Recalculation of the baseline year GHG inventory has not been conducted as this degree of boundary change is not considered material.
03Greenhouse Gas emissions inventory
44%reduction in net GHG emissions against FY08 baseline year
FY11 GHG emissions profile
1%1%1%
2%2%
2%
5%
22%
27%
37%
Tenancy electricity (gross)
Air travel
Base building electricity (gross)
Other transport
Off-site electricity
Synthetic Gas
Wastewater
Natural gas
Waste
Paper
Annual Greenhouse Gas Emissions6
PwC has been measuring and reporting our GHG emissions since FY08 (1 July 2007 to 30 June 2008 – the baseline year). In 2008, PwC publicly committed to reducing our total net GHG emissions by 25% over a four year period, between FY09 and FY12. However, given that we almost achieved our original target in FY09, we revised the four year target to a 50% reduction in net emissions by FY12 (inclusive of renewable electricity purchases).
We have renewed our focus on structured emissions reductions measures as outlined below, however achieving the reductions in GHG emissions necessary to reach our FY12 target is proving to be a considerable challenge. No further reductions can be obtained from increasing our purchase of renewable electricity, which is already at 100% for tenancy electricity. Additionally, the growth and regionalisation of PwC mentioned previously, is continuing during the FY12 period.
Our approachPwC’s approach is to focus on reducing our gross GHG emissions through infrastructure and behavioural change, then reduce further by purchasing renewable energy, and finally offset all net GHG emissions to achieve carbon neutrality.
Emissions reductions measuresYear-on-year aspirational targets for selected emissions sources have previously been in place for paper consumption, waste to landfill and firm-related air travel. In FY11 we engaged with our people to help achieve GHG emissions reductions from these sources, utilising a range of communication channels including our nation-wide Corporate Responsibility Champion network, internal emails, newsletters and articles, and provision of educational information on our intranet. For example:
Firm-related air travel – to increase the level of accountability, detailed air travel statistics are reported monthly and available to all staff via our Corporate Responsibility – Environment intranet page.
Paper consumption – default double-sided printing has helped to reduce our paper consumption considerably already, and we also encourage staff to reduce their individual printing. Reducing printing was the focus of one of our quarterly environment challenges during FY11, in which Champions were asked to drive a particular environment related initiative within their teams.
Landfill waste – awareness-raising campaigns were rolled out in collaboration with PwC Facilities teams, Building Management and Champions in various office locations to improve signage and education about recycling practices. A number of Champions attended a tour of recycling and waste management facilities in Sydney, and a slide pack from this tour including photos was distributed to all Champions nationally. We also distributed PwC KeepCups in late 2010 to over 3,000 staff in a bid to reduce disposable coffee cups going to landfill.
These initiatives contributed to the reduction in GHG emissions from these sources in FY11 compared to the baseline year, as outlined in the table on page five.
For further information regarding definitions of our emissions sources see our detailed GHG criteria on our website www.pwc.com.au/about-us/corporate-responsibility
04
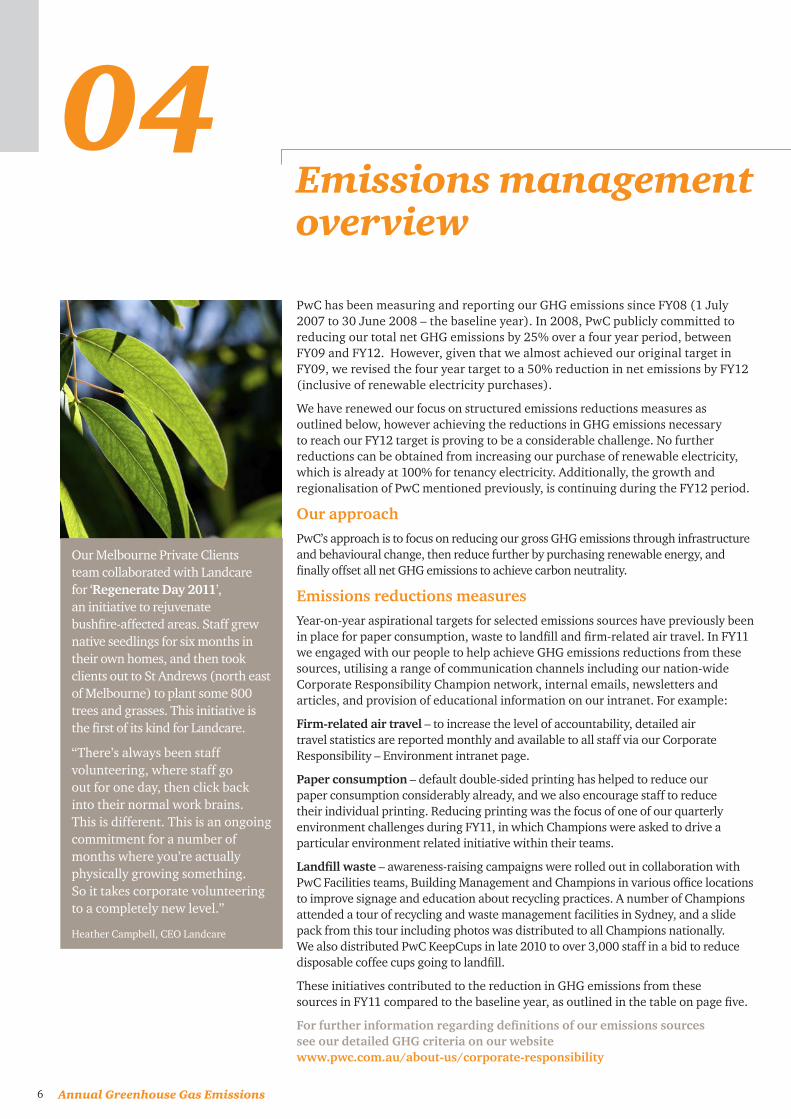
Our Melbourne Private Clients team collaborated with Landcare for ‘Regenerate Day 2011’, an initiative to rejuvenate bushfire-affected areas. Staff grew native seedlings for six months in their own homes, and then took clients out to St Andrews (north east of Melbourne) to plant some 800 trees and grasses. This initiative is the first of its kind for Landcare.
“There’s always been staff volunteering, where staff go out for one day, then click back into their normal work brains. This is different. This is an ongoing commitment for a number of months where you’re actually physically growing something. So it takes corporate volunteering to a completely new level.”
Heather Campbell, CEO Landcare
Emissions management overview
7Inventory Report
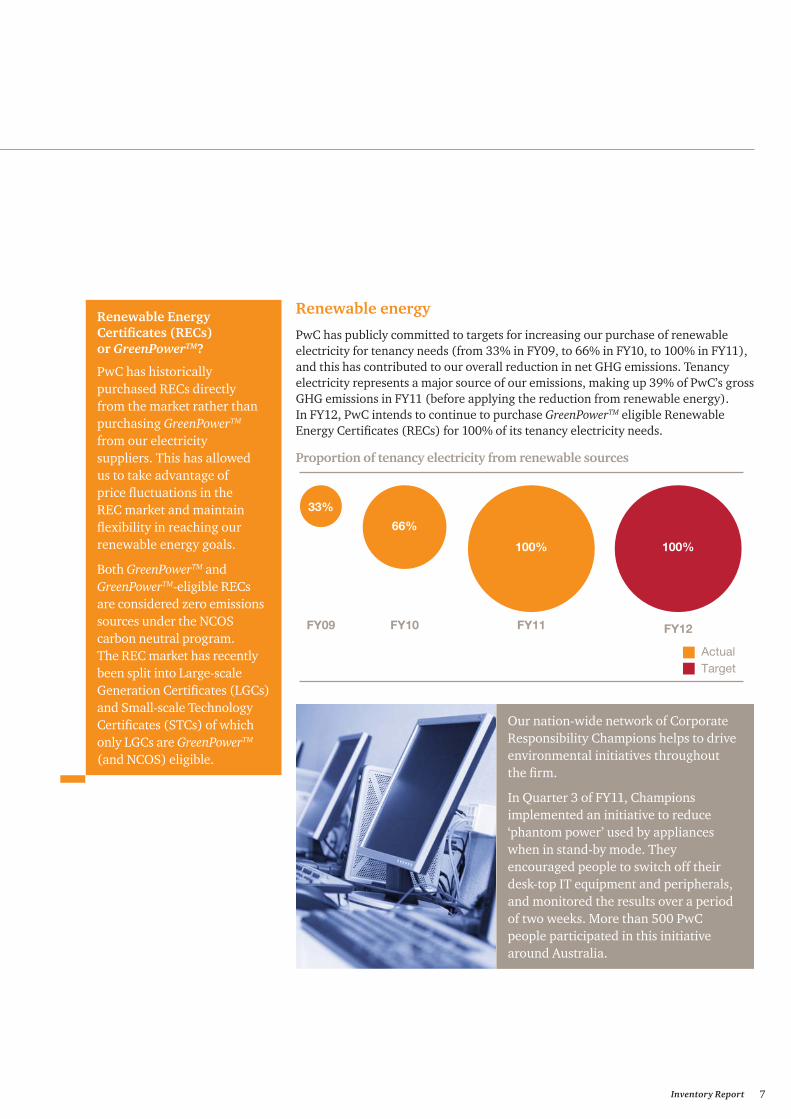
Renewable energy
PwC has publicly committed to targets for increasing our purchase of renewable electricity for tenancy needs (from 33% in FY09, to 66% in FY10, to 100% in FY11), and this has contributed to our overall reduction in net GHG emissions. Tenancy electricity represents a major source of our emissions, making up 39% of PwC’s gross GHG emissions in FY11 (before applying the reduction from renewable energy). In FY12, PwC intends to continue to purchase GreenPowerTM eligible Renewable Energy Certificates (RECs) for 100% of its tenancy electricity needs.
Proportion of tenancy electricity from renewable sources
Renewable Energy Certificates (RECs) or GreenPowerTM?
PwC has historically purchased RECs directly from the market rather than purchasing GreenPowerTM from our electricity suppliers. This has allowed us to take advantage of price fluctuations in the REC market and maintain flexibility in reaching our renewable energy goals.
Both GreenPowerTM and GreenPowerTM-eligible RECs are considered zero emissions sources under the NCOS carbon neutral program. The REC market has recently been split into Large-scale Generation Certificates (LGCs) and Small-scale Technology Certificates (STCs) of which only LGCs are GreenPowerTM
(and NCOS) eligible.
ActualTarget
33%
66%
100%
FY09 FY10 FY11
100%
FY12
Our nation-wide network of Corporate Responsibility Champions helps to drive environmental initiatives throughout the firm.
In Quarter 3 of FY11, Champions implemented an initiative to reduce ‘phantom power’ used by appliances when in stand-by mode. They encouraged people to switch off their desk-top IT equipment and peripherals, and monitored the results over a period of two weeks. More than 500 PwC people participated in this initiative around Australia.
Annual Greenhouse Gas Emissions8
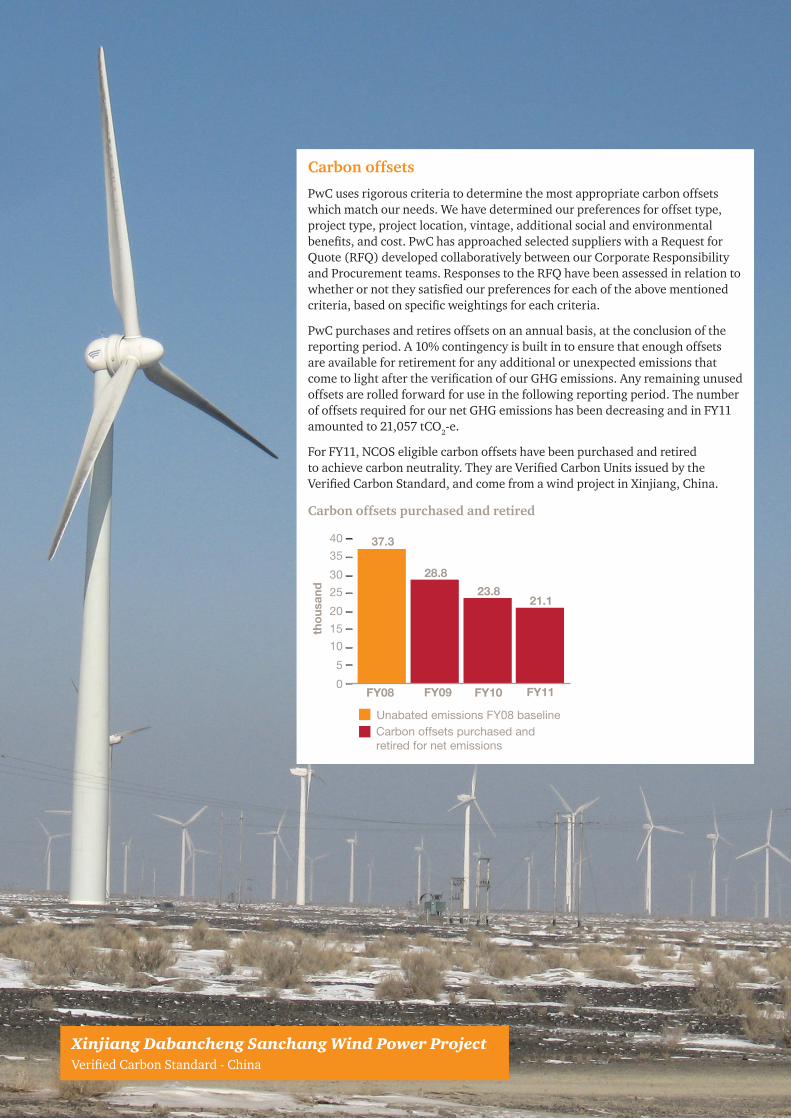
Carbon offsets
PwC uses rigorous criteria to determine the most appropriate carbon offsets which match our needs. We have determined our preferences for offset type, project type, project location, vintage, additional social and environmental benefits, and cost. PwC has approached selected suppliers with a Request for Quote (RFQ) developed collaboratively between our Corporate Responsibility and Procurement teams. Responses to the RFQ have been assessed in relation to whether or not they satisfied our preferences for each of the above mentioned criteria, based on specific weightings for each criteria.
PwC purchases and retires offsets on an annual basis, at the conclusion of the reporting period. A 10% contingency is built in to ensure that enough offsets are available for retirement for any additional or unexpected emissions that come to light after the verification of our GHG emissions. Any remaining unused offsets are rolled forward for use in the following reporting period. The number of offsets required for our net GHG emissions has been decreasing and in FY11 amounted to 21,057 tCO2-e.
For FY11, NCOS eligible carbon offsets have been purchased and retired to achieve carbon neutrality. They are Verified Carbon Units issued by the Verified Carbon Standard, and come from a wind project in Xinjiang, China.
Carbon offsets purchased and retired
0
5
10
15
20
25
30
35
40
FY08 FY09 FY10 FY11
Unabated emissions FY08 baselineCarbon offsets purchased and retired for net emissions
tho
usan
d
37.3
28.8
23.821.1
Xinjiang Dabancheng Sanchang Wind Power ProjectVerified Carbon Standard - China
9Inventory Report
In addition to our overall target to reduce total net GHG emissions by 50% compared to the baseline year, PwC has historically set public targets for the following GHG emissions sources: paper consumption; waste to landfill; and firm-related air travel.
These year-on-year aspiration targets have focused on consumption rather than GHG emissions, and were set in isolation to the total GHG emissions reduction target. Historically, decentralised and relatively unstructured programs and communications have been put into place in a bid to engage staff to change individual behaviours which have an environmental impact. Paper, waste and air travel were chosen as they were considered the primary activities which individual staff members could genuinely influence through changing their every-day habits.
Going forward, we intend to implement more structured measures to assist in the further reduction of GHG emissions.
05
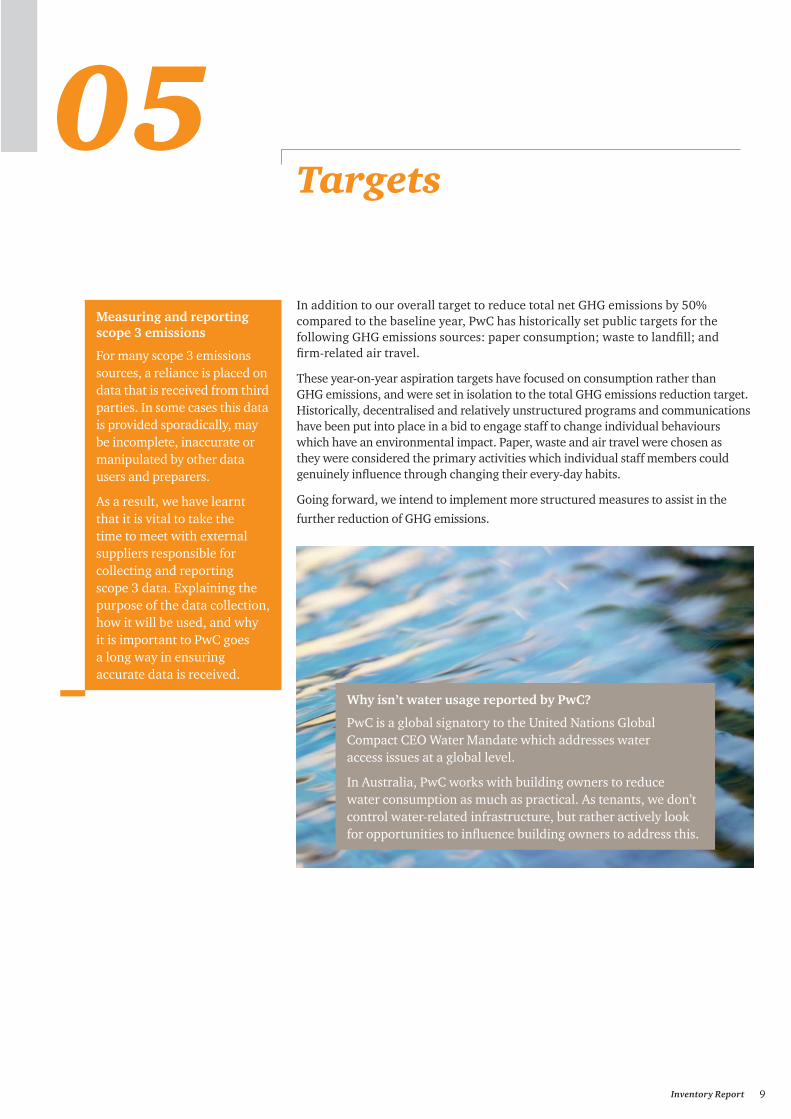
Why isn’t water usage reported by PwC?
PwC is a global signatory to the United Nations Global Compact CEO Water Mandate which addresses water access issues at a global level.
In Australia, PwC works with building owners to reduce water consumption as much as practical. As tenants, we don’t control water-related infrastructure, but rather actively look for opportunities to influence building owners to address this.
Targets
Measuring and reporting scope 3 emissions
For many scope 3 emissions sources, a reliance is placed on data that is received from third parties. In some cases this data is provided sporadically, may be incomplete, inaccurate or manipulated by other data users and preparers.
As a result, we have learnt that it is vital to take the time to meet with external suppliers responsible for collecting and reporting scope 3 data. Explaining the purpose of the data collection, how it will be used, and why it is important to PwC goes a long way in ensuring accurate data is received.
10
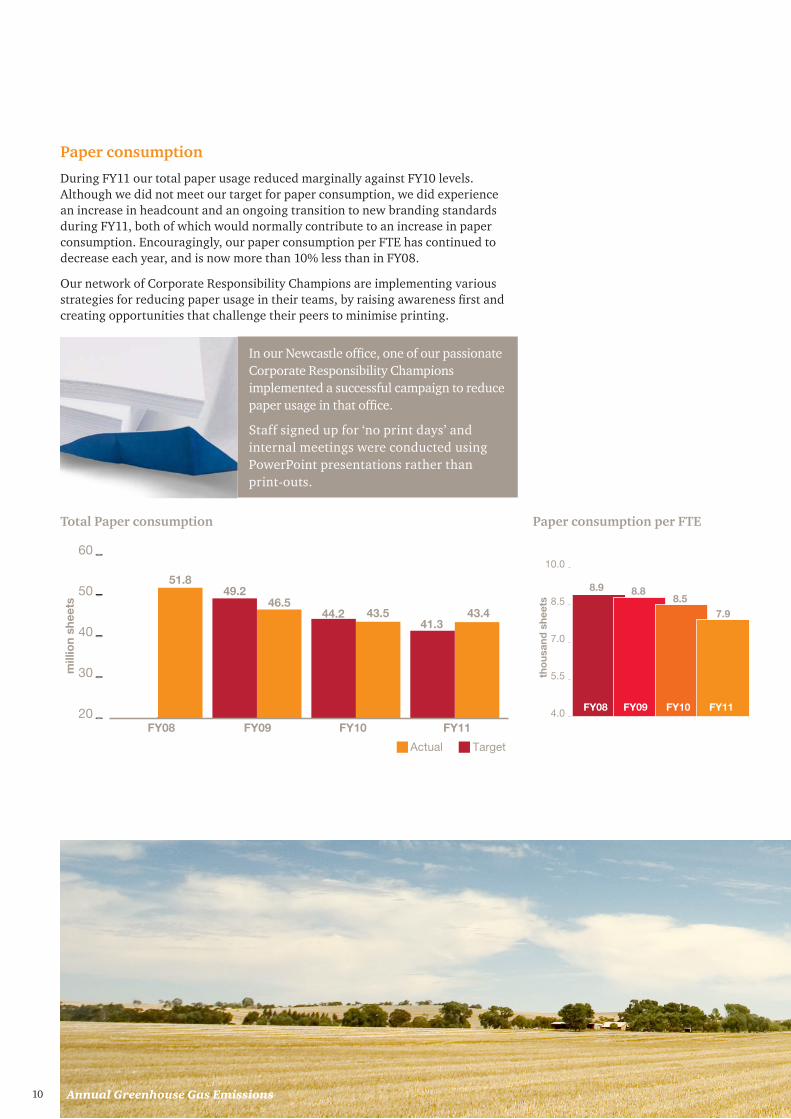
Total Paper consumption
51.849.2
46.544.2 43.5
41.343.4
20
30
40
50
60
FY08 FY09 FY10 FY11
TargetActual
mill
ion
shee
ts
FY08 FY09 FY10 FY11
tho
usan
d s
heet
s
8.9 8.88.5
7.9
4.0
5.5
7.0
8.5
10.0
Paper consumption per FTE
Paper consumption
During FY11 our total paper usage reduced marginally against FY10 levels. Although we did not meet our target for paper consumption, we did experience an increase in headcount and an ongoing transition to new branding standards during FY11, both of which would normally contribute to an increase in paper consumption. Encouragingly, our paper consumption per FTE has continued to decrease each year, and is now more than 10% less than in FY08.
Our network of Corporate Responsibility Champions are implementing various strategies for reducing paper usage in their teams, by raising awareness first and creating opportunities that challenge their peers to minimise printing.
In our Newcastle office, one of our passionate Corporate Responsibility Champions implemented a successful campaign to reduce paper usage in that office.
Staff signed up for ‘no print days’ and internal meetings were conducted using PowerPoint presentations rather than print-outs.
Annual Greenhouse Gas Emissions
20
30
40
50
60 57.754.8
49.3
55.4
FY08 FY09 FY10kg
FY11
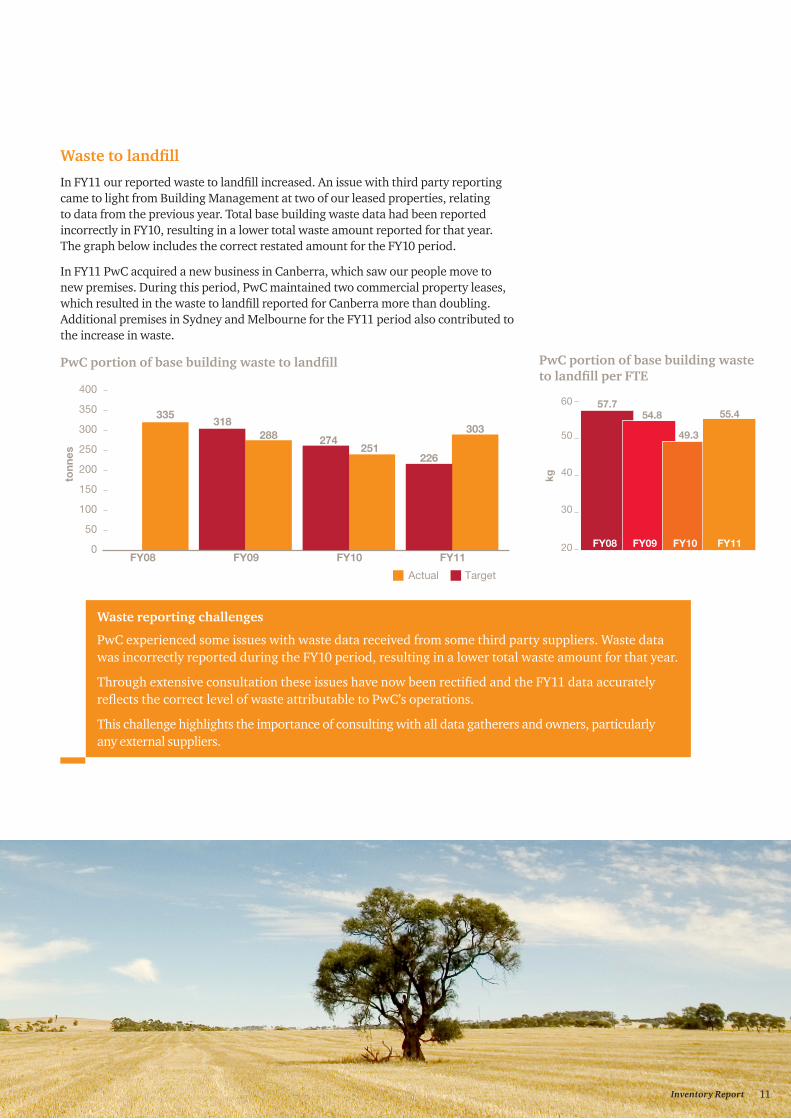
PwC portion of base building waste to landfill per FTE
Inventory Report
Waste reporting challenges
PwC experienced some issues with waste data received from some third party suppliers. Waste data was incorrectly reported during the FY10 period, resulting in a lower total waste amount for that year.
Through extensive consultation these issues have now been rectified and the FY11 data accurately reflects the correct level of waste attributable to PwC’s operations.
This challenge highlights the importance of consulting with all data gatherers and owners, particularly any external suppliers.
Waste to landfill
In FY11 our reported waste to landfill increased. An issue with third party reporting came to light from Building Management at two of our leased properties, relating to data from the previous year. Total base building waste data had been reported incorrectly in FY10, resulting in a lower total waste amount reported for that year. The graph below includes the correct restated amount for the FY10 period.
In FY11 PwC acquired a new business in Canberra, which saw our people move to new premises. During this period, PwC maintained two commercial property leases, which resulted in the waste to landfill reported for Canberra more than doubling. Additional premises in Sydney and Melbourne for the FY11 period also contributed to the increase in waste.
PwC portion of base building waste to landfill
335318
288 274251
226
303
0
50
100
150
200
250
300
350
400
FY08 FY09 FY10 FY11
TargetActual
tonn
es
11
Annual Greenhouse Gas Emissions12
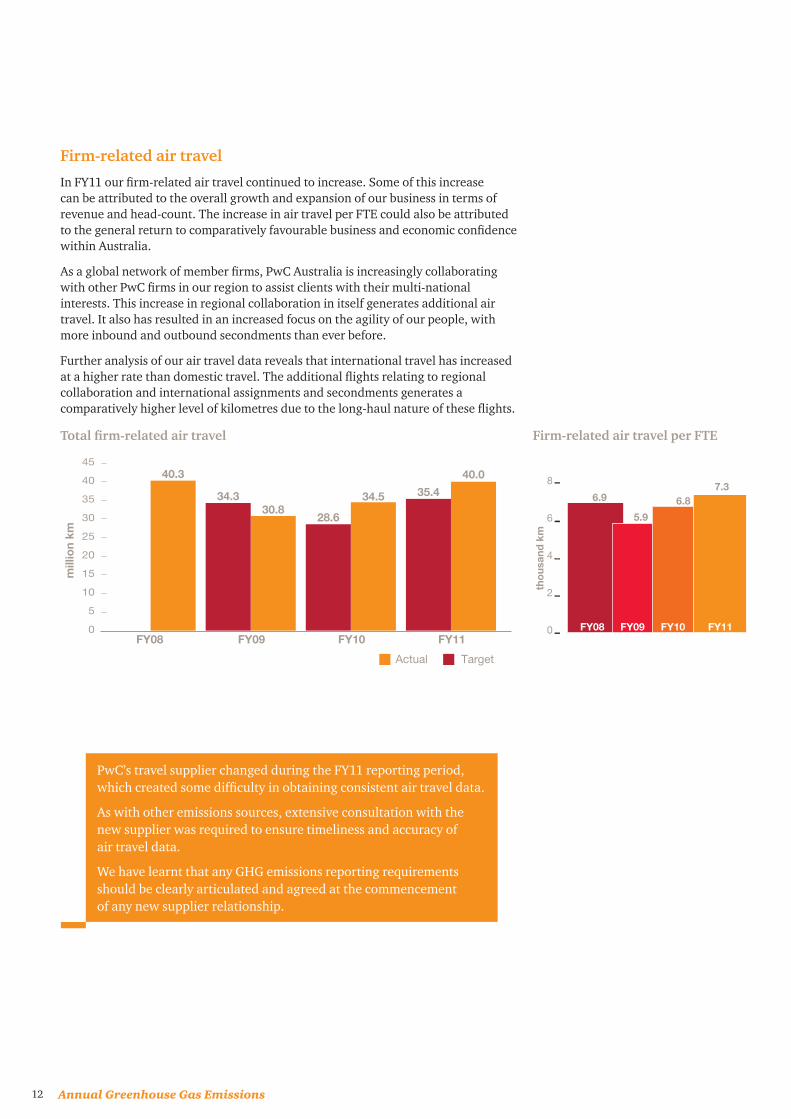
Firm-related air travel
In FY11 our firm-related air travel continued to increase. Some of this increase can be attributed to the overall growth and expansion of our business in terms of revenue and head-count. The increase in air travel per FTE could also be attributed to the general return to comparatively favourable business and economic confidence within Australia.
As a global network of member firms, PwC Australia is increasingly collaborating with other PwC firms in our region to assist clients with their multi-national interests. This increase in regional collaboration in itself generates additional air travel. It also has resulted in an increased focus on the agility of our people, with more inbound and outbound secondments than ever before.
Further analysis of our air travel data reveals that international travel has increased at a higher rate than domestic travel. The additional flights relating to regional collaboration and international assignments and secondments generates a comparatively higher level of kilometres due to the long-haul nature of these flights.
Total firm-related air travel
40.3
0
5
10
15
20
25
30
35
40
45
34.330.8
28.6
34.5 35.4
40.0
FY08 FY09 FY10 FY11
TargetActual
mill
ion
km
tho
usan
d k
m
6.9
5.9
6.87.3
FY08 FY090
2
4
6
8
FY10 FY11
Firm-related air travel per FTE
PwC’s travel supplier changed during the FY11 reporting period, which created some difficulty in obtaining consistent air travel data.
As with other emissions sources, extensive consultation with the new supplier was required to ensure timeliness and accuracy of air travel data.
We have learnt that any GHG emissions reporting requirements should be clearly articulated and agreed at the commencement of any new supplier relationship.
13Inventory Report
Independent assurance report
06
Liability limited by a scheme approved under Professional Standards Legislation
Independent Auditor’s Assurance Report to the Board of Partners of PricewaterhouseCoopers Australia To the Board of Partners of PricewaterhouseCoopers Australia Ernst & Young has been engaged to undertake an independent verification of PricewaterhouseCoopers Australia (‘PwC’) to obtain certification under the National Carbon Offset Standard (‘NCOS’). The verification has been planned and performed in accordance with the proposal approved by PwC to enable Ernst & Young to provide a level of assurance (as detailed below) over PwC’s NCOS Carbon Neutral Program documentation which includes the Greenhouse Gas (‘GHG’) Inventory, Emissions Management Plan and Public Disclosure Summary. Subject Matter
We have carried out our assurance engagement in order to:
a) Provide reasonable assurance over whether PwC’s scope 1 and 2 greenhouse gas emissions (expressed in tonnes of carbon dioxide equivalents) as outlined in the GHG inventory and PwC’s NCOS Carbon Neutral Program documentation are, in all material aspects, in accordance with the criteria set out below
b) Provide limited assurance over PwC’s scope 3 greenhouse gas emissions (expressed in tonnes of carbon dioxide equivalents) outlined in the GHG inventory in order for us to conclude whether anything has come to our attention that causes us to believe they are not presented fairly, in all material aspects, in accordance with the criteria set out below
Criteria
The following criteria have been applied to the subject matter described above:
1. National Carbon Offset Standard 2. National Carbon Offset Standard Carbon Neutral Program Guidelines 3. National Greenhouse and Energy Reporting (Measurement) Determination 2008 as amended on
30 June 2010
Management’s Responsibility
PwC is responsible for preparing the NCOS Carbon Neutral Program documentation (GHG Inventory, EMP and Public Disclosure Summary) and for maintaining an effective internal control environment and data management system, including control procedures supporting the inputs into this documentation, in accordance with the requirements of the NCOS and the NCOS Carbon Neutral Program Guidelines.
Auditor’s Responsibility
The verification has been conducted in accordance with Australian Standard on Assurance Engagements ASAE 3000 ‘Assurance Engagements other than Audits or Reviews of Historical Financial Information’ in order to provide a conclusion on whether PwC have met the requirements of the NCOS to the NCOS Carbon Neutral Program Administrator and PwC over the scope set out above. As such Ernst & Young has undertaken the following procedures that are considered appropriate:
• Discussions with relevant personnel in relation to monitoring systems, procedures and controls • Checking the validity of emission factors selected from the National Greenhouse and Energy Reporting
(Measurement) Determination 2008, National Greenhouse Accounts (NGA) Factors and other relevant sources
• Sample testing the calculations used in the GHG Inventory Excel worksheet are correct • Conducting analytical testing of year on year information to support the reasonableness of the subject
matter • Conducted high level discussions to assess if all appropriate scope 3 emission sources have been included
In addition, for the reasonable assurance subject matter, we conducted the following additional procedures:
• Sample testing material reported emissions and inputs back to source data (e.g. third party invoices, internal metering systems)
• Performed procedures to check that all material scope 1 and 2 emission sources have been included
Annual Greenhouse Gas Emissions14
2
Ernst & Young did not conduct any verification procedures with respect to the internal control environment and data management system of PwC as a whole. As such, no assurance is provided on any internal control environment and data management system not associated with preparing the NCOS Carbon Neutral Program documentation.
Ernst & Young confirms that we are not aware of any actual or perceived conflict of interest in having completed this engagement and that we have not carried out more than four (4) previous consecutive verifications under NCOS for PwC.
Limitations of Our Work
Because of the inherent limitations in any internal control environment and data management system it is possible that fraud, error, or non-compliance with requirements of the NCOS or NCOS Carbon Neutral Program Guidelines may occur and may not be detected. Further, the verification process was not designed to detect all weakness or errors in the internal control environment and data management system so far as they relate to the scope set out above, as the verification has not been performed continuously throughout the period and the procedures performed on the relevant internal information and data management system were on a test basis. Any extrapolation from this verification to future periods is subject to the risk that the procedures may become inadequate because of changes in conditions, or that the degree of compliance with them may deteriorate.
Restriction of Use
This Verification Statement has been prepared for the management of the NCOS Carbon Neutral Program participant, PwC, for review by the NCOS Carbon Neutral Program Administrator, and for the information of the Department of Climate Change and Energy Efficiency, solely for use in relation to the NCOS Carbon Neutral Program. We disclaim any liability for reliance upon this Report by any other party or for any other purpose other than that for which it was prepared.
Conclusions
Based on the subject matter outlined in the scope section of this verification report: a) in our opinion, for PwC’s scope 1 and 2 greenhouse gas emissions (expressed in tonnes of carbon dioxide
equivalents) as outlined in the GHG inventory and PwC’s NCOS Carbon Neutral Program documentation are, in all material aspects, in accordance with the criteria above.
b) based on our limited assurance procedures, for PwC’s scope 3 greenhouse gas emissions (expressed in tonnes of carbon dioxide equivalents) outlined in the GHG inventory, nothing has come to our attention that causes us to believe that they are not presented, in all material aspects, in accordance with the criteria above.
Matters Relating to Electronic Presentation of the 2011 Annual Greenhouse Gas emissions report
Our review was of the web-based version of the Annual Greenhouse Gas emissions report as of the date of this statement. We provide no assurance over changes to the content of this web-based information after the date of this assurance statement.
Mathew Nelson partner
Ernst & Young 02 December 2011 Melbourne
Independent assurance report continued
15Inventory Report
© 2012 PricewaterhouseCoopers. All rights reserved. PwC refers to the Australian member firm, and may sometimes refer to the PwC network. Each member firm is a separate legal entity. Please see www.pwc.com/structure for further details. WL217889
WL
11/2
011
2179
90
For more information
Douglas JohnsonCorporate [email protected]+61 (3) 8603 3547
Liza MaimoneSustainability & Climate Change [email protected]+61 (3) 8603 4150