AN INVESTIGATION OF EFFECTS OF FLOW … · 3.2.3 Two phase test procedure ... 1.4 Multiphase...
78
AN INVESTIGATION OF EFFECTS OF FLOW CONDITIONING ON STRAIGHT TUBE CORIOLIS METER A Thesis by SHASHANK SHUKLA Submitted to the Office of Graduate Studies of Texas A&M University in partial fulfillment of the requirements for the degree of MASTER OF SCIENCE May 2008 Major Subject: Petroleum Engineering
Transcript of AN INVESTIGATION OF EFFECTS OF FLOW … · 3.2.3 Two phase test procedure ... 1.4 Multiphase...

AN INVESTIGATION OF EFFECTS OF FLOW CONDITIONING
ON STRAIGHT TUBE CORIOLIS METER
A Thesis
by
SHASHANK SHUKLA
Submitted to the Office of Graduate Studies of
Texas A&M University
in partial fulfillment of the requirements for the degree of
MASTER OF SCIENCE
May 2008
Major Subject: Petroleum Engineering

AN INVESTIGATION OF EFFECTS OF FLOW CONDITIONING
ON STRAIGHT TUBE CORIOLIS METER
A Thesis
by
SHASHANK SHUKLA
Submitted to the Office of Graduate Studies of
Texas A&M University
in partial fulfillment of the requirements for the degree of
MASTER OF SCIENCE
Approved by:
Chair of Committee, Stuart L. Scott
Committee Members, Gioia Falcone
Gerald Morrison
Head of Department, Stephen A. Holditch
May 2008
Major Subject: Petroleum Engineering

iii
ABSTRACT
An Investigation of Effects of Flow Conditioning on Straight Tube Coriolis Meter.
(May 2008)
Shashank Shukla, B.Tech, National Institute of Technology, Calicut, India
Chair of Advisory Committee: Dr. Stuart L. Scott
Coriolis meter, despite being very accurate in single phase conditions, fails to
accurately measure two-phase flows. It poses a complex fluid-structure interaction
problem in case of two-phase operation; there is a scarcity of theoretical models
available to predict the errors reported by Coriolis meter in aforementioned conditions,
hence the need for experimental research.
Experiments are conducted in both single and two-phase flow conditions. Meter
accuracy is excellent in single phase conditions and no significant effect is observed on
use of flow conditioners, namely inlet swirl and inline mixer. Operational two-phase
envelope is determined through experiments at different flowrates. Flow conditioners are
used to study the effect of phase segregation and homogenization on accuracy of the
meter. Testing is done to cover two-phase flows from both extreme ends, namely aerated
liquids and wet gas. Use of flow conditioners show slight improvement in meter
accuracy on use of inline mixer, and reduction in accuracy in case of inlet swirl, when
both former and latter are compared to results obtained from experiments with no flow
conditioners. The difference in accuracies between results with flow conditioner and

iv
without flow conditioners is attributed to relative motion between the phases, which is
more in case of inlet swirl, due to larger bubble sizes. Flow conditioners show an
insignificant effect on meter accuracy during wet gas tests. The reason proposed is
annular flow regime, which is not highly affected by flow conditioners.
Single phase tests demonstrate that Coriolis meter gives accurate measurement
even in presence of severe flow disturbances. There is no need for flow conditioning
before the meter to obtain accurate readings from it, which would be the case in other
metering technologies like orifice and turbine. In two phase flows, the meter reports
negative errors, which is consistent with previous experimental works available in
literature. Use of flow conditioners clearly affects the reading of the meter in aerated
liquids. This phenomenon can be used to get fairly accurate estimate of flow rate in low
gas volume fraction liquid flows.

v
DEDICATION
I dedicate this research effort to my brother-in-law, Mr. Ashutosh Mishra, and
my sister, Mrs. Shipra Mishra. Due to their constant support and affection, I was able to
continue my education.

vi
ACKNOWLEDGEMENTS
I would like to thank my committee chair, Dr. Scott, for his support and
encouragement throughout the duration of this work. He has been ideal mentor and I
could not have asked for better. I would also like to very much thank Dr. Falcone and
Dr. Morrison for their guidance and support.
Thanks also goes to my friends and colleagues and the department faculty and
staff for making my time at Texas A&M University a great experience, especially Amol
Dixit, Austin Gascamp, Deepam Tiwan, Fouad Solomon, Gretchen Fudge, Issac Ekoto,
John Boham, Jose Baker, Joshua Davis, Kharli Mootz, Luciana Cruz, Sukesh Shenoy,
Sumanth Panda, Sunny Jain, Vaibhav Deshpande, Varun Mishra and Xian Xu, to name a
few (in strict alphabetical order!).
Finally, thanks to my parents, Dr. Chitra Shukla and Dr. Krishna Kant Shukla,
for their encouragement and understanding of my absence from home for more than two
years.

vii
TABLE OF CONTENTS
CHAPTER Page
I INTRODUCTION ............................................................................... 1
1.1 Background ................................................................................... 1
1.1.1 Layout of production facilities ........................................... 2
1.1.2 Well testing ........................................................................ 2
1.1.3 Reservoir management ....................................................... 3
1.1.4 Production allocation .......................................................... 3
1.1.5 Production monitoring ........................................................ 3
1.1.6 CAPEX and OPEX ............................................................. 4
1.1.7 Fiscal metering or custody transfer .................................... 4
1.2 Literature review .......................................................................... 6
1.3 Objectives of the research ............................................................. 14
1.4 Thesis outlook ............................................................................... 14
II PHYSICAL GEOMETRY AND OPERATIONAL FEATURES OF
CORIOLIS METERS ........................................................................... 16
2.1 Physical geometry of Coriolis meters ........................................... 16
2.2 Operational features of Coriolis meters ........................................ 17
2.3 Performance and applications ....................................................... 19
2.4 Limitations of Coriolis meters ....................................................... 21
III EXPERIMENTAL PROGRAM .......................................................... 23
3.1 Test facility .................................................................................... 23
3.1.1 Coriolis meter test section ................................................... 24
3.1.2 Inlet section ......................................................................... 25
3.1.3 Metering section .................................................................. 29
3.1.4 Uncertainty analysis ………………………………….…... 29
3.2 Experimental procedure ................................................................ 31
3.2.1 Data acquisition system ....................................................... 33
3.2.2 Single phase test procedure ................................................. 37
3.2.3 Two phase test procedure .................................................... 37
IV SINGLE PHASE METERING WITH CORIOLIS METER ............... 39
4.1 Single phase water tests ................................................................ 39
4.2 Single phase air tests ..................................................................... 42
V TWO PHASE METERING WITH CORIOLIS METER .................... 45

viii
CHAPTER Page
5.1 Aerated liquids tests ..................................................................... 48
5.2 Wet-gas tests ................................................................................ 56
VI CONCLUSIONS AND RECOMMENDATIONS ............................... 59
6.1 Conclusions ................................................................................... 59
6.2 Recommendations ......................................................................... 60
NOMENCLATURE .................................................................................................. 61
REFERENCES .......................................................................................................... 63
VITA ......................................................................................................................... 67

ix
LIST OF FIGURES
FIGURE Page
1.1 Single tube Coriolis meter accuracy under aerated liquid tests.................. 8
1.2 Dual tube Coriolis meter accuracy under aerated liquid tests .................... 9
1.3 Comparison between straight tube and U-tube design ............................... 10
1.4 Multiphase metering system using compact separation and Coriolis
meters (From Phase Dynamics) …………………………………………. 13
2.1 A Coriolis mass flowmeter of U-tube configuration .................................. 16
2.2 Single straight tube Coriolis meter ............................................................ 18
2.3 U-tube Coriolis meter in use for calibration of other meters at CEESI,
Colorado ..................................................................................................... 20
3.1 Experiment flow loop ................................................................................. 23
3.2 Single straight tube Coriolis meter used in experiments ............................ 24
3.3 Inlet swirl generator .................................................................................. 25
3.4 In-line mixer ............................................................................................... 26
3.5 Aerated liquid flow without flow conditioners .......................................... 26
3.6 Aerated liquid flow in presence of inlet swirl ............................................ 27
3.7 Snapshot of aerated liquid flow exiting the Coriolis; it confirms that
swirl continues throughout the meter ……………………………………. 27
3.8 Inline mixer in aerated liquid flow ............................................................. 28
3.9 Inline mixer creates large amounts of smaller bubbles .............................. 28
3.10 Process flow diagram of experimental setup .............................................. 31
3.11 Mixing junction ......................................................................................... 32

x
FIGURE Page
3.12 Schematic of pressure signal acquisition ................................................... 34
3.13 NI Interface Board CB-68LP DAQ ............................................................ 34
3.14 Data acquisition LabVIEW program (front panel) .................................... 35
3.15 Data acquisition LabVIEW program (block diagram) ............................... 36
4.1 Effect of flow conditioners on MFR reading in single phase liquid
test ............................................................................................................. 40
4.2 Effect of flow conditioners on density reading in single phase liquid
test ............................................................................................................. 40
4.3 Error in liquid mass flow rate with range of uncertainty (black
markers) ………...………………………………………….……………. 41
4.4 Error in liquid density with range of uncertainty (same color) …………. 41
4.5 Effect of flow conditioners on MFR reading in single phase air test ......... 42
4.6 Effect of flow conditioners on density reading in single phase air test ...... 43
4.7 Error in air mass flow rate with range of uncertainty (same color) .......... 43
4.8 Error in air density with range of uncertainty (same color) ………….. .... 44
5.1 Test matrix showing both aerated liquid (blue) and Wet gas (orange) data
points (plotted on Taitel & Dukler flow regime map at atmospheric
pressure) ..................................................................................................... 47
5.2 Motion of small sphere in a liquid filled container .................................... 50
5.3 Aerated liquid test at flow rate, lQ = 105 lb/min ...................................... 55
5.4 Aerated liquid test at flow rate lQ = 130 lb/min ....................................... 55
5.5 Aerated liquid test at flow rate lQ = 150 lb/min ....................................... 56
5.6 Wet gas test at flow rate gQ = 1 lb/min ..................................................... 57

xi
FIGURE Page
5.7 Wet gas test at flow rate gQ = 1.5 lb/min .................................................. 58
5.8 Wet gas test at flow rate gQ = 2 lb/min ..................................................... 58

1
CHAPTER I
INTRODUCTION
1.1 Background
The measurement of multiphase flow with good rangeability and acceptable
accuracy will be a very cost effective solution for the development of new satellite fields
as well as for optimization of existing fields1. Multiphase metering technology has
advanced quite significantly over past few years, as has the acceptance and utilization of
such technology both onshore and offshore.
Many new fields are economically marginal and cannot sustain the financial
implications of the traditional separator based technology. Multiphase meters can offer
substantial cost savings by eliminating the need of separators, or by allowing several
fields to share common processing facilities.
In well management applications, multiphase meters offer continuous data output
giving valuable information about the performance of the wells. This enables problems
or changes in well performance to be detected sooner, and subsequent interventions
planned earlier than would be possible with traditional processing technology.
The importance of multiphase metering is evident in the number of papers
published on the subject and the time devoted to it at major flow measurement and oil
and gas conferences.
_____________
This thesis follows the style and format of SPE Journal.

2
Within the oil and gas industry, it is generally recognized that multiphase
metering can be very beneficial for the following1, 2
.
1.1.1 Layout of production facilities
Use of multiphase meters reduces the hardware needed for onshore, offshore
topside and offshore subsea applications by eliminating the need of dedicated test
separator for well testing applications. With a smaller “footprint” it minimizes platform
space and load requirements. It also makes the costly well test lines obsolete; which is
very important for unmanned locations, deepwater developments and satellite fields.
1.1.2 Well testing
Well testing using multiphase meters is much quicker than by traditional
separator. Multiphase phase meters have accuracy comparable to conventional test
separators (~5-10%)2, but the latter require regular intervention by trained personnel and
cannot provide continuous well monitoring. Another disadvantage of using conventional
well testing with separators is that wells suffer from regular shutdown cycles related to
well testing; this may lead to more frequent workovers needed to maintain their
production rates. Multiphase meters can also be used to measure clean up flow after
exploratory drilling; added value may include improved control of drawdown applied to
the formation, the pressure transient and shortened flow periods.

3
1.1.3 Reservoir management
Multiphase meters can provide real time, continuous data for the operators to
better characterize field and reservoir performance and to react faster. Using multiphase
meters in individual wells can be a powerful tool in field development. It can help
singling out the “under-performing” wells, and to plan interventions. Any appreciable
changes in productivity index, gas-oil ratio and water cut can be detected and quantified
almost immediately, as opposed to conventional test separators where this information is
at discrete points in time and on cumulative volume basis.
1.1.4 Production allocation
Using multiphase meters in manifolds handling commingled production from
different fields/wells operated by different companies holds clear advantage over the
conventional testing. In the latter, production from each well must flow through a test
separator before commingling with other produced streams. This especially is a
formidable task in planning tie-backs for existing facilities.
1.1.5 Production monitoring
Real time monitoring of production data from multiphase meters can give useful
information for detecting problems associated with well slugging and gas-lift issues.
This allows operators to optimize well performance and extend field life.

4
1.1.6 CAPEX and OPEX
Apart from direct savings in CAPEX for multiphase meters compared to
conventional test separators, the OPEX of multiphase meters is also estimated to be
considerably lower than the latter. In addition, it is estimated that multiphase metering
systems could improve the management of the field/well with 6-9%2 gain in the value of
the oil recovered. Both CAPEX and OPEX for multiphase meters are estimated to
reduce as competition in the market increases and more operational experience is gained.
1.1.7 Fiscal metering or custody transfer
Current technology in multiphase metering is not accurate enough for fiscal
metering. Custody transfer metering is still being done single phase metering devices,
used after separating the phases. Considerable research and development work is
however being done in improving the accuracy of multiphase measurement.
A large number of technologies are available to measure multiphase flows. Most
of the multiphase meters are combination of techniques each giving parameters, which
together can give individual flowrates and volume fraction. Due to large costs associated
with multiphase meters, a lot of attention has been given to single phase meters (which
are comparatively inexpensive) operating in multiphase conditions. One of such
candidates is Coriolis meter.
Coriolis mass flow and density meters are considered the flow metering solution
of choice for many precision flow applications. Coriolis mass flow metering has been
used in industry since early 1980s; since then Coriolis meters have grown into one of the

5
largest and fastest growing meter segment, representing roughly $400 million annual
sales on approximately 100,000 units3.
Coriolis mass flow meters are available in widely varying designs (e.g. straight-
through pipes, U-tubes, B-tubes, with single path or split flow configurations), but the
operating principle remains the same: mass flow through a vibrating tube causes a
proportional Coriolis force to act, which is detected as a phase difference between two
velocity sensors. Almost all transmitter designs cause the flowtube to vibrate at its
natural frequency; this frequency is a function of the process fluid density, which can
thus be calculated and given as an additional measurement. The process fluid
temperature is also measured to provide temperature correction of the mass flow and
density (compensating for tube stiffness), and as an extra process measurement. Coriolis
meter is thus a fairly sophisticated example of a multivariable industrial sensor.
Coriolis meters offer several advantages over other flow rate measurement
technologies. They have accuracy and repeatability of 0.2% or better, and the ability to
handle difficult, non-Newtonian fluids such as slurries and food stuffs4. There are also
limitations associated with them. Currently Coriolis meters are very expensive to buy
and install. Another major disadvantage is the impact of two-phase (gas-liquid) flow on
meter performance. Even a short burst of gas in a liquid flow stream may cause serious
disruption to meter operation and lead to large measurement errors5.
In the past, research and design efforts to improve the performance of Coriolis
mass flow meters have concentrated on areas such as digital signal processing;
separation of phases using compact separators, design of tubes among others. Very few

6
public domain literature concerns with effect of flow conditioning on performance of
Coriolis meters operating in single phase flows. To the best of author‟s knowledge, no
one has reported effect of flow conditioning on Coriolis meter in two-phase flows. A
good understanding of latter will aid in the design of multiphase metering packages
incorporating Coriolis meter and ultimately, confidence in its use.
1.2 Literature review
Domnick et al (1987)6 states and gives arguments, that in case of multiphase
flows, Coriolis mass flow meter will be accurate when the secondary phase
particles/droplets/bubbles in the flow follow the oscillations of the measuring instrument
(and the primary phase). In the presence of axial swirl, one is forcing the suspended
particles (or bubbles/droplets) to move in a fashion different from that dictated by the
vibration of the sensor tube. This phenomenon predicts a degraded performance of
Coriolis meters in presence of axial swirl though, they haven‟t looked particularly into
the effect of axial swirl particularly.
Cascetta et al (1989)7 describe a new design of Coriolis mass flow meter, which
permits measurements independent of the elastic properties of the vibrating tube. The
measuring principle is suitable for metering homogeneous or heterogeneous two-phase
fluids. For the latter the density of the secondary phase should not be too different from
that of primary phase, so that when the sensor tube is set in relative motion the two
phases may behave as rigidly connected. Cascetta et al (1992)8 experimentally compared
performance of seven Coriolis mass flowmeters. They also outlined some of the external

7
factors which might affect accuracy of Coriolis mass flow meter, including but not
limited to various turbulence spectra and presence of axial swirl. No explanation, as of
what might be the effect of axial swirl on Coriolis mass flow meter would be, is
presented.
Hemp and Sultan (1989)9 developed a “bubble” model for Coriolis mass flow
meters operating in two-phase regimes; considering the inertial losses generated by a
single bubble surrounded by much denser liquid, passing through vibrating tube. This
model predicts monotonic, negative errors which are a function of gas void fraction
(GVF) only, i.e. the proportion of gas by volume in the two-phase mixture. Mass flow
and density errors specifically take following form 10
,
1
2.
..
true
trueobserved
m
mm ……………………………………………………………………………………………….. (1)
3
true
trueobserved ………………………………………………………………………………………………….. (2)
Where.
m is the mass flow rate of the combined stream, and is the gas volume fraction
on a scale of 0 to 1. This model was then compared to measurements by Grumski and
Bajura (1984)11
. The theory overestimated the errors and the reason provided was
possible interaction between bubbles.
Tests of single-tube and dual-tube Coriolis meters in liquid flows by Grumski
and Bajura (1984)11
found that the meters could measure single-phase mass flow rates to
within ± 0.4% of the actual. Air was then injected into the water flow to test the
tolerance of the Coriolis meters to entrained air. The single tube meter gave mass flow

8
readings accurate to within ± 2% for flows up to 1.5% gas by volume, then its accuracy
dropped until complete failure occurred between gas volume fractions of 2.5% and 3.5%
(Fig. 1.1).
Fig. 1.1 – Single tube Coriolis meter accuracy under aerated liquid tests
10.
The dual tube Coriolis meter fared better; errors of less than ± 2% were observed
for gas volume fractions below 7.5%, and failure occurred between gas volume fractions
of 16% to 20% (Fig. 1.2).
Benefits of using one particular design of Coriolis meter over others are also
scarcely reported. Al-Khamis et al12
reported that straight tube Coriolis mass flow meter
is less sensitive to gas entrained in the liquid than both U-tube and the modified form of
U-tube Coriolis mass flow meter for the range that was tested (Fig. 1.3). The reason
%
m
e
t
e
r
e
r
r
o
r
Void fraction
22.7 kg/min
56.7 kg/min
90.7 kg/min
0.000 0.005 0.01 0.015 0.02 0.025 0.03
-20
-10
0
10
20
30
40
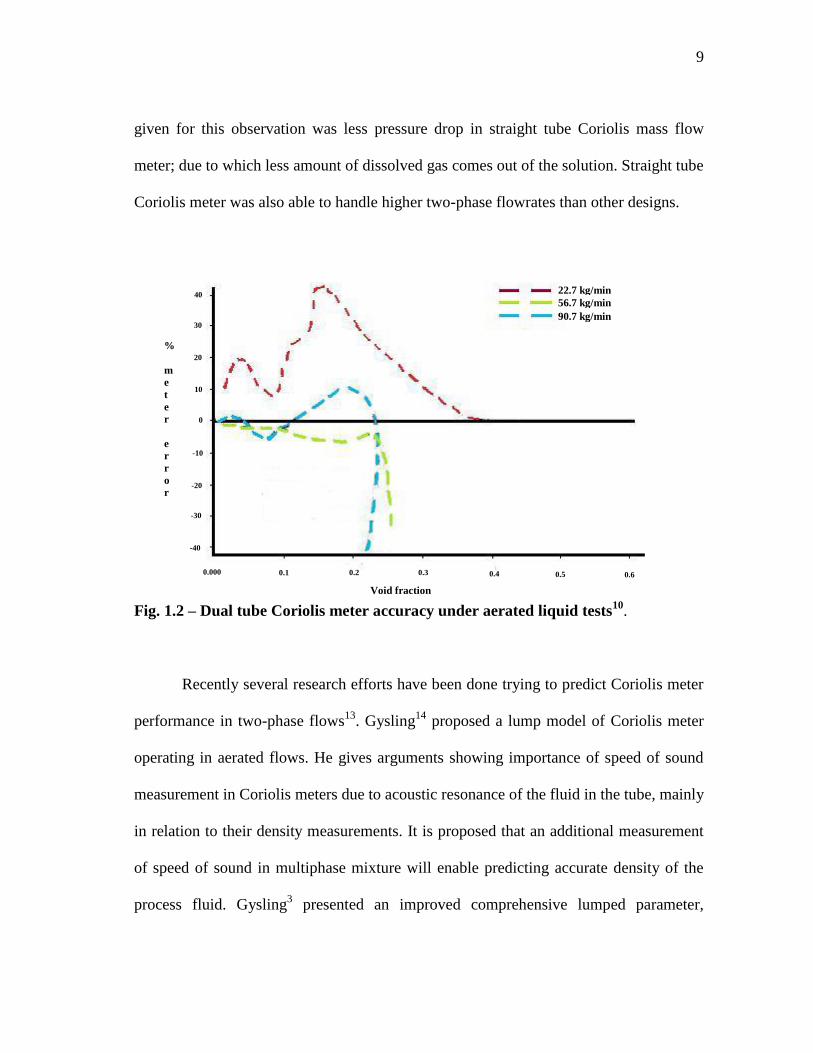
9
given for this observation was less pressure drop in straight tube Coriolis mass flow
meter; due to which less amount of dissolved gas comes out of the solution. Straight tube
Coriolis meter was also able to handle higher two-phase flowrates than other designs.
Fig. 1.2 – Dual tube Coriolis meter accuracy under aerated liquid tests
10.
Recently several research efforts have been done trying to predict Coriolis meter
performance in two-phase flows13
. Gysling14
proposed a lump model of Coriolis meter
operating in aerated flows. He gives arguments showing importance of speed of sound
measurement in Coriolis meters due to acoustic resonance of the fluid in the tube, mainly
in relation to their density measurements. It is proposed that an additional measurement
of speed of sound in multiphase mixture will enable predicting accurate density of the
process fluid. Gysling3 presented an improved comprehensive lumped parameter,
%
m
e
t
e
r
e
r
r
o
r
Void fraction
22.7 kg/min
56.7 kg/min
90.7 kg/min
0.000 0.1 0.2 0.3 0.4 0.5 0.6
-40
-10
0
10
20
30
40
-30
-20

10
aeroelastic model of U-tube Coriolis massflow and density meter addressing the issues
of compressibility and inhomogeniety present by aerated process fluids. He shows that
the behavior of the meter is influenced by several parameters like void fraction, fluid
viscosity and reduced frequency. As in previous work14
, speed of sound in aerated fluid
is measured as an additional variable and is used to calculate all aeroelastic operating
parameters, gas volume fraction and reduced frequency. They also discuss process of
relative motion between the bubbles and the liquid, and how this can cause damping and
a change in the apparent density of the mixture. This methodology has been successfully
used in recent field experiences 15, 16
.
Fig. 1.3 – Comparison between straight tube and U-tube design. Straight tube
Coriolis meter is able to handle higher two-phase flow rates than U-tube11
.

11
Hemp and Kutin (2006)17
investigated both massflow and density errors
associated with Coriolis meter operating on compressible fluids. Their analysis is
applicable to small fractional errors (low contamination of secondary phase) and as such
does not cover the full range of two-phase flows from aerated liquids to wet-gas. They
propose following expressions for massflow and density errors encountered in case of
compressible fluids,
2
1
.
..
2
1
b
cm
mm
true
trueobserved …………………………………………………………………………...................... (3)
2
1
4
1
b
ctrue
trueobserved
……………………………………………………………………………………….. (4)
Where 1 is resonance frequency of the flowmeter tube filled with compressible fluid, b
is the flowmeter tube radius (inner) and, c is the velocity of sound in fluid.
Investigation of effect of inlet velocity profiles on Coriolis meter performance
has also been done for single phase flows by researchers. Cheesewright et al (2000)18
identified external factors which influence the calibration of Coriolis massflow meter.
Tests were conducted where they found no significant (>0.25%) effect of inlet swirl
conditions on the three Coriolis meters used in tests; also the effect of severely
asymmetric inlet velocity profiles (50% blockage immediately upstream of the meter)
was minimal. Bobovnik et al19
investigated the effect of fully developed, asymmetric
triangular and swirl flows (introduced at the inlet) on the straight tube Coriolis meter
using CFD analysis. They found that the effect of inlet swirl flow is not negligible only
for the highest Reynolds number simulated. Similarly the effect of asymmetric triangular

12
inlet condition was minimal (~0.1%) on the performance of the meter for the whole
range of Reynolds number simulated. Recently Kutin20
discussed velocity profile effects
on Coriolis meters. Results showed Coriolis meter is sensitive to inlet velocity profiles;
as in other investigations the effect observed was minimal.
In past other benefits of Coriolis massflow meters have been widely reported.
Cox21
showed that Coriolis meters can be used to satisfactorily measure oil/water
emulsions. He also demonstrated the calibration is independent of the rheological nature
of the fluid. Andersson and Gudmundsson22
used Coriolis meter to measure flow rates of
hydrate-water slurries. They noted that the meter gives accurate readings till the
concentration of hydrate in water is less than 15%.
Another interesting development in multiphase metering using Coriolis meters is
emergence of relatively inexpensive multiphase metering systems using compact
separation systems along with Coriolis meters to measure fully or partially separated
fluid streams, considerable research efforts are being undertaken to improve the
separation capabilities of compact separator in order to improve the operational envelope
of the system23,24
; an example of such a system is shown in Fig. 1.4. This is a primary
application of results obtained through testing Coriolis meters in swirl conditions, since
the compact separators can experience phenomenon of gas carry under, where due to
large centrifugal forces, gas phase may develop swirl characteristics. Another good
application of inlet swirl will be installation of Coriolis meter after any bend or elbow
where partial phase separation occurs due to the difference in the velocity profiles of two
phases.

13
Fig. 1.4 – Multiphase metering system using compact separation and Coriolis
meters (from Phase Dynamics).
Recently Hemp and Yeung (2003)10
provided a novel Coriolis transmitter
technology developed at Oxford University, which they propose, can be accurate in
measurement of aerated liquids. Difficulty encountered in accurately measuring aerated
fluids is probably the most critical issue with Coriolis technology. Companies providing
Coriolis meters suggest removing as much air from flow stream as possible before
measuring it with Coriolis meter, but it is not generally the case. In most cases it is
prohibitively expensive to bring air levels below admissible. There is a need for

14
intensive research to devise methods to increase the permissible operation envelope of
Coriolis meter measuring aerated fluids or wet-gas. Flow conditioning of fluids before
they enter Coriolis meters can be an approach to attain the goal.
1.3 Objectives of the research
The purpose of this research effort is to observe the effect of flow conditioning
on the mass flow and density measurement of a two phase flow by a straight tube
Coriolis meter. This involves quantifying errors observed in mass flow and density
measurement upon, introduction of air in fluid flow (aerated liquid) and introduction of
liquid in air flow (wet-gas) with and without flow conditioning. Flow conditioning will
be done using both swirl generator (phase segregation) and inline mixer (phase
homogenization).
1.4 Thesis outlook
The physical geometry and operational features of Coriolis meters will be
described next followed by a discussion of the applications and performance of Coriolis
meters. Limiting physical phenomenon associated with Coriolis meters will be
described. A general overview of experimental facility and process is given.
The effect of flow conditioning on the mass flow and density errors observed in
two phase flow are compared with base cases (single phase, with and without flow
conditioning) and presented. Analysis of the results obtained from this investigation
compared to analytical models available in literature is reported.

15
Finally, conclusions and recommendations deduced from the outcome of this
research are outlined.

16
CHAPTER II
PHYSICAL GEOMETRY AND OPERATIONAL FEATURES OF
CORIOLIS METERS
2.1 Physical geometry of Coriolis meters
Coriolis meters are essentially aeroelastic devices; and as such involve coupled
dynamic interaction of fluid dynamics and structural system. The Coriolis meter
basically consists of a tube conveying fluid (lying in one plane and clamped at its ends)
and associated circuitry. Circuitry includes an electromagnetic drive generally at the
middle of the tube, and two electromagnetic detectors. It also includes a feedback circuit
for maintaining vibration at the fundamental frequency and electronic means of
measuring the phase difference (due to flow) between signals received from the
detectors.
Fig. 2.1 – A Coriolis mass flowmeter of U-tube configuration.

17
2.2 Operational features of Coriolis meters
In the Coriolis mass flowmeter, an angular movement is imparted to a tube
conveying fluid by means of electromagnetic drive. This angular movement is generally
harmonic in nature though some earlier designs used steady rotation. This additional
motion communicated to the flowing fluid causes the particles of fluid to undergo
Coriolis acceleration. As a result forces proportional to the product of the fluid density
and velocity act through the fluid medium and generate pressure on the conduit walls,
producing a measurable effect.
va c 2 …………………………………………………………………………. (5)
Where ca
is the Coriolis acceleration,
v is the velocity vector of the particle in the
rotating system, and
is the angular velocity vector of the rotating vector (which has
magnitude equal to the rotation rate and is directed along the axis of rotation).
vmF c 2 ……………………………………………………………………..… (6)
Where cF
is Coriolis force acting on the particle and m is mass of the particle.
For example in the general arrangement of a meter of U-tube configuration
shown in Fig. 2.1, the electromagnetic driver causes the tube to perform an oscillatory
rotation about the y-axis. Fluid flows in opposite directions in the straight limbs of the
U-tube so the effect of the Coriolis acceleration is to cause an oscillatory twisting of the
tube about the x-axis. This secondary motion is exceedingly small compared with the
main vibration about the y axis but it causes a slight difference in the phase of the signals

18
from the detectors. The total mass flow of the fluid can be deduced from the
measurement of this phase difference.
The physical principle used to determine process fluid density is similar to that
used in vibrating tube density meters. In Coriolis meter the measuring tube conveying
the process fluid, is driven to oscillate and its resonant frequency is determined. The
amount by which resonant frequency obtained in presence of process fluid is shifted
from that obtained in vacuo is a function of the density of the process fluid, which can
then be determined.
A feedback circuit is used to maintain the vibration, an amplified form of the
signal received at one detector being used to power the drive. The rectified signal from
one detector is employed as a gain control for the driving voltage. In this way the
amplitude of vibration at the fundamental frequency is maintained at a fixed level. Since
losses are small the fundamental natural vibration motion is effectively set up and
maintained.
A single straight tube Coriolis meter was used in the experiment (Fig. 2.2). Its
operation is similar to U-tube design explained above.
Fig. 2.2 – Single straight tube Coriolis meter.
Electromagnetic
detectors
Electromagnetic
driver

19
2.3 Performance and applications
Coriolis massflow meters have emerged as the fastest growing fluid metering
technology over the past decade. With worldwide revenues presently greater than $400
million and moving to $600 million in near future, Coriolis technology is considered as
market leader mass flow metering technology by many. A major reason for this
phenomenal growth is its ability to measure single phase fluids with accuracy and
repeatability of 0.2% or less; which without question makes it the most accurate general
purpose meter used by industry. It has been used successfully in wet-gas with at most
2.5% of liquid. It has been used successfully for many applications including, but not
limited to the following:
Custody transfer and fiscal metering of industrial gases (e.g. Carbon dioxide,
Nitrogen) and natural gases.
Custody transfer and fiscal metering of crude oil and other natural liquids.
Metering of liquid-liquid emulsions.
„Check‟ metering of natural and industrial gases.
Batch and continuous reactor feed.
Process control of combustion gases (e.g. natural gas feed to reactors).
Process control of cryogenic fluids (e.g. Nitrogen, Argon, Oxygen).
Measurement of highly corrosive acids, bases and liquid-solid slurries (e.g.
water-hydrate slurry).
Interface detection.

20
Fig. 2.3 – U-tube Coriolis meter in use for calibration of other meters at CEESI,
Colorado.
Apart from being very accurate, Coriolis technology has several other advantages; some
of them are:
It is not affected by the thermodynamic state of the fluid (i.e. temperature,
pressure or density of measured fluid to a large extent).
They are fairly independent of the rheological properties of the fluid; this makes
it quite suitable for Newtonian and non-Newtonian emulsions. This being said,
Coriolis meters are affected by density of fluid, though dependence is not as
much as seen in some other metering technologies.

21
They are almost non-intrusive in nature; though some pressure drop does occur
in the vibrating tube.
They can measure massflow rate directly. Most of the other meters measure
volume flow rate, which is dependent on thermodynamic (pressure, temperature)
state of fluid. Mass measurement, therefore is considered superior.
Capital savings because of relatively short installation length requirement and
easy retrofit.
Bi-directional flow capability; not many designs allow this but it is theoretically
possible.
Less secondary instrumentation is required. It measures both massflow rate and
density, thus compared to traditional metering technologies (e.g. turbine meter,
orifice meter) fewer pressure transmitters are required.
Broader flow ranges possible; generally ratio between lowest and highest flow
rates is 1:100.
Operational savings because of the on-board diagnostic capabilities.
2.4 Limitations of Coriolis meters
Coriolis technology, like all other metering technologies has few disadvantages
associated, which limit the use of it. One of the limitations is high CAPEX of the meters
and associated circuitry. At present generally cost of Coriolis meter is more than orifice
meter and turbine meter, but is definitely less than metering technologies like gamma ray
and sonar. This cost is expected to come down as more meters are installed worldwide.

22
Another major limitation of Coriolis meter is its inability to handle aerated
liquids or wet gas with reasonable accuracy. Coriolis meter by design is a single phase
meter. Multiphase flow through a Coriolis meter becomes a very complicated fluid-
structure problem. Though Coriolis meter by design works in multiphase flow but past
works show that the errors in mass flow rate and density reading can be as much as 80%
even with low presence of secondary phase; also as the gas volume fraction in aerated
liquids rise, so does the power required by the driving circuitry. There have been
attempts to remedy this limitation by improving analog and digital circuitry, but with
limited success. This work attempts to investigate the multiphase flow envelope, straight
tube Coriolis meter can work in with reasonable accuracy. Also effects of flow
conditioning on this envelope will be investigated.

23
CHAPTER III
EXPERIMENTAL PROGRAM
3.1 Test facility
The experimental two-phase flow loop consists of a pumping and metering
section where required flowrates of individual phases are controlled and metered, and
straight tube Coriolis section where most of experimental data is acquired (Fig. 3.1).
Coriolis section itself is set-up in inlet section and actual straight tube Coriolis meter. A
separate inlet section provides the flexibility of installing different flow conditioners
upstream of Coriolis meter and observing their effect on the Coriolis performance.
Fig. 3.1 – Experiment flow loop.
44”
19.5”
19”
27.5”
9”
26”
24
3.1.1 Coriolis meter test section
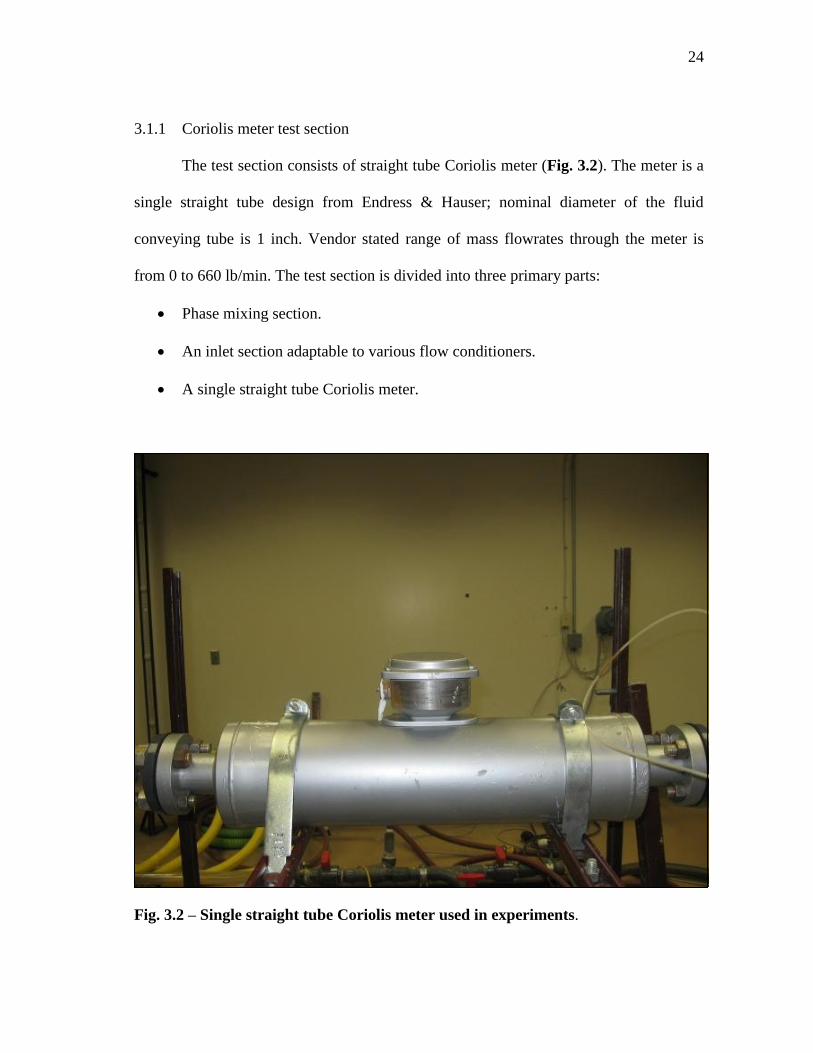
The test section consists of straight tube Coriolis meter (Fig. 3.2). The meter is a
single straight tube design from Endress & Hauser; nominal diameter of the fluid
conveying tube is 1 inch. Vendor stated range of mass flowrates through the meter is
from 0 to 660 lb/min. The test section is divided into three primary parts:
Phase mixing section.
An inlet section adaptable to various flow conditioners.
A single straight tube Coriolis meter.
Fig. 3.2 – Single straight tube Coriolis meter used in experiments.

25
3.1.2 Inlet section
Inlet section is made by transparent 1 inch PVC pipe and is compartmentalized in
primary test section by means of flanges. This makes it adaptable to different flow
conditioners used in the experiment by reducing the time and effort needed to change the
configurations. Two types of flow conditioners were used in the experiments:
Swirl generator: It acts as a phase segregator (Fig. 3.3). A flow of multiphase
mixture through the swirl generator causes the heavier phase to flow on the
periphery of the tube with the lighter phase occupying the middle of the tube.
This is caused by the centrifugal forces generated as the fluid rotates in transit
through the swirl generator. Hardware similar has been used in past to separate
two phase mixtures27
.
Fig. 3.3 – Inlet swirl generator.
In-line mixer: It acts as a phase homogenizer. The model used in the testing is
Ryan Herco all plastic static in-line mixer (6 elements) with nominal diameter of
1 inch. (Fig. 3.4). Multiphase flow through the mixer comes out as a well
homogenized mixture of phases with the slip velocity between the phases
2”
0.5” 1”
11”
60o

26
minimum. This occurs due to various obstructions (built in the mixer)
encountered by the flow. The pressure drop along the obstructions act to break
the secondary phase into small droplets dispersed throughout the primary phase.
This makes the mixture “homogeneous” in a macroscopic sense.
Fig. 3.4 – In-line mixer.
Fig. 3.5 – Aerated liquid flow without flow conditioners.

27
Visual inspection during the tests has been done during the tests to confirm the
effects of flow conditioners. Fig. 3.5 shows the aerated flow in the tube with no flow
conditioners; as visible there is significant inhomogeniety present in the phase with air
bubbles majorly present in the top of the tube. Inlet swirl generates a concentric core of
air as seen in Fig. 3.6. The swirl continues throughout the meter length (Fig. 3.7).
Fig. 3.6 – Aerated liquid flow in presence of inlet swirl.
Fig. 3.7 – Snapshot of aerated liquid flow exiting the Coriolis; it confirms that swirl
continues throughout the meter.

28
Fig. 3.8 – Inline mixer in aerated liquid flow.
Fig. 3.8 shows the inline mixer in aerated liquids. It tends to create and disperse
large amounts of smaller air bubbles (Fig. 3.9) and thus makes the flow “homogenized”.
Fig. 3.9 – Inline mixer creates large amounts of smaller bubbles.

29
3.1.3 Metering section
The metering section consists of two parallel, single-phase feeder lines for
measuring individual incoming single-phase gas and liquid flow rates. Air, which is
supplied by an air compressor, is used as the gas phase in the present setup. The air flow
rate into the loop is controlled by a regulating valve and metered by an elite series
Micromotion (ESM) Coriolis meter. The liquid phase used in the current work is water.
It is supplied from a 15-barrel storage tank at atmospheric pressure and pumped to the
liquid feeder line by a combination of two centrifugal pumps. Variable frequency drives
are used to control the drive frequency of centrifugal pumps; drive frequency controls
the liquid flow rate.
Similar to the gas phase, the liquid flow rate is metered using 1½-in. Model D
Micromotion meter. The single-phase gas and liquid streams are combined at the mixing
tee and delivered to the test section. No-return valves, located downstream of each
feeder, are installed to prevent backflow. The two-phase mixture downstream of the test
section is separated by a conventional separator. The air is vented to the atmosphere and
the liquid is returned to the storage tank to complete the cycle.
3.1.4 Uncertainty analysis
Uncertainty analysis is performed on single phase tests to determine level of
confidence in the results. Vendor provided technical manuals25,26
are used to get
accuracy information about participating instruments. Relevant information used to
calculate uncertainties of measured parameters are presented below:

30
Mass flow rate of liquid: maximum uncertainty of 0.1% of rate.
Mass flow rate of gas: maximum uncertainty of 0.5% of rate.
Density measurement of liquids: maximum uncertainty of 0.5
kg/m3 0.0312 lb/ft
3.
Temperature measurement of gas: maximum uncertainty of 10C 0.5% of
reading in 0C 69.6
0F to 73.6
0F (test temperature is constant at 72
0F).
Pressure measurement: 0.25% of the range of the transducer (100 psi in this
work).
Expressions resulting from these considerations are used to calculate uncertainty
associated with reference measurements and presented as range of errors (of mass flow
rate and density readings for single phase flows) in chapter IV.
)001.01(,, observedlactuall MFRMFR ……………………………………………….. (7)
)005.01(,., observedgactualg MFRMFR ………………………………………………. (8)
0312.0,, observedlactuall …………………………………………………………... (9)
And for density of air, applying ideal gas law at the inlet of the Coriolis meter,
)26.71(
)0025.01(,,
,
R
P
RT
P observedinlet
actual
actualinlet
actuala ……………………………………... (10)
An important assumption made during uncertainty analysis is that variables
measurements are considered independent of each other, i.e. density reading of liquid is
not affected by mass flow rate reading of the Coriolis meter. Results of uncertainty
analysis are presented in Chapter IV.
31
3.2 Experimental procedure
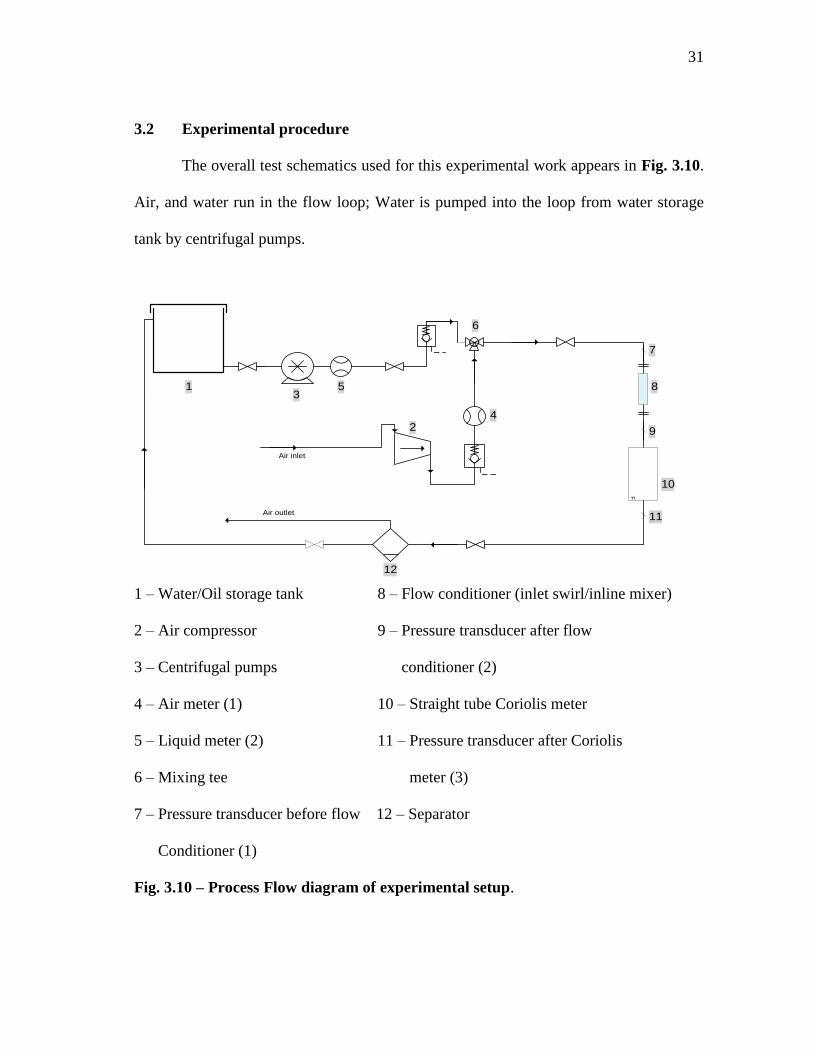
The overall test schematics used for this experimental work appears in Fig. 3.10.
Air, and water run in the flow loop; Water is pumped into the loop from water storage
tank by centrifugal pumps.
F
13
5
6
8
10
4
12
2
7
9
11
Air inlet
Air outlet
1 – Water/Oil storage tank 8 – Flow conditioner (inlet swirl/inline mixer)
2 – Air compressor 9 – Pressure transducer after flow
3 – Centrifugal pumps conditioner (2)
4 – Air meter (1) 10 – Straight tube Coriolis meter
5 – Liquid meter (2) 11 – Pressure transducer after Coriolis
6 – Mixing tee meter (3)
7 – Pressure transducer before flow 12 – Separator
Conditioner (1)
Fig. 3.10 – Process Flow diagram of experimental setup.

32
Variable frequency drives are applied to control liquid flow rates. Air for the gas
loop comes from a compressor, which is regulated with a needle control valve. Pressure
transducers are located all around the test facility to provide the required pressure
measurements. Mixing tee is used to mix the two single phase streams into a single two-
phase flow, it is shown in Fig. 3.11; 0.5 inch pipe is used to inject secondary phase into
2 inch pipe carrying primary phase. An additional needle valve on the 0.5 inch flow line
provides additional control on secondary phase flowrates. After passing through the test
section, multiphase flow is allowed to flow back to a settling tank (separator), where air
is released to the atmosphere and liquid is recirculated.
Fig. 3.11 – Mixing junction. Secondary phase is injected through ½’’ pipe in
primary phase being carried through 2’’ pipe.
33
3.2.1 Data acquisition system
To monitor real time behavior of the experiments, it is essential to record various
parameters that define the process. Apart from the flowrates, pressure and temperature at
various points are important parameters. Air temperature is given as additional output
by ½ inch Coriolis meter used to measure air flow rates.
Three Rosemount (Emerson) absolute pressure transducers are installed on the
flow loop. They measure pressure readings before inlet section, after inlet section and
after Coriolis test meter respectively, and transmit a proportional or square root (flow)
electrical signal. The differential pressure gauges are energized by a 20 volts single DC
power supply and output 4~20 mA DC current signals that travel to hardware via grade
16AWG electric cable.
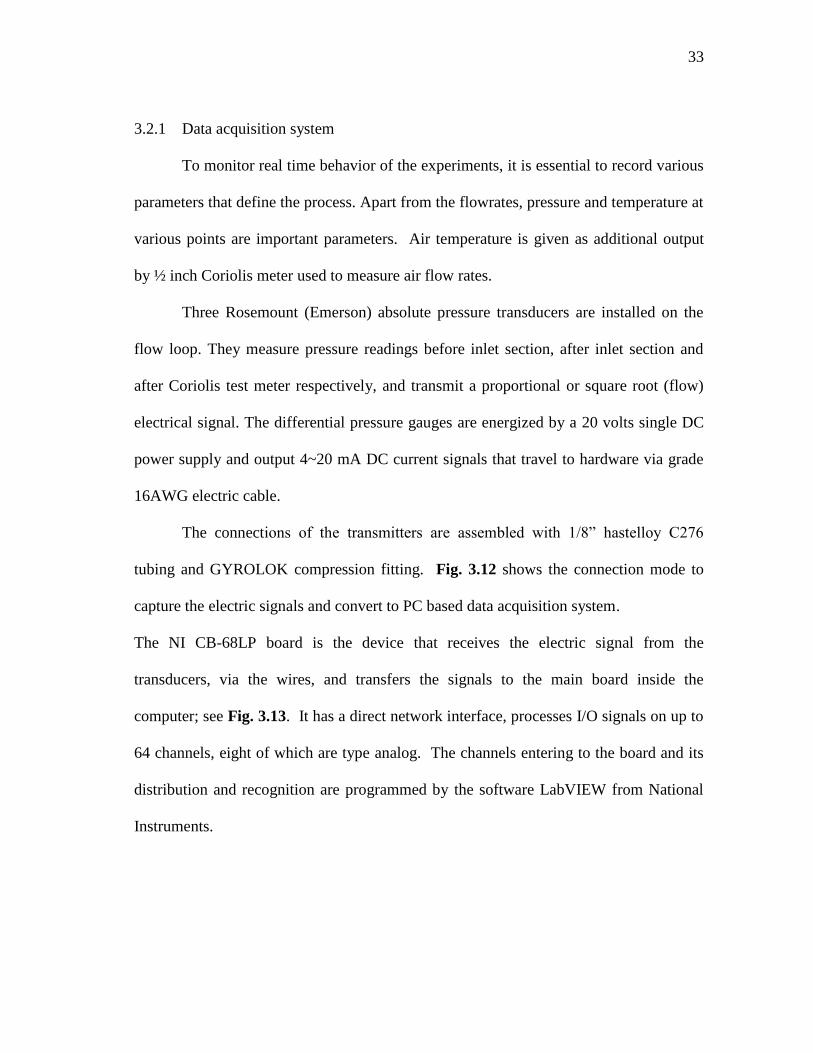
The connections of the transmitters are assembled with 1/8” hastelloy C276
tubing and GYROLOK compression fitting. Fig. 3.12 shows the connection mode to
capture the electric signals and convert to PC based data acquisition system.
The NI CB-68LP board is the device that receives the electric signal from the
transducers, via the wires, and transfers the signals to the main board inside the
computer; see Fig. 3.13. It has a direct network interface, processes I/O signals on up to
64 channels, eight of which are type analog. The channels entering to the board and its
distribution and recognition are programmed by the software LabVIEW from National
Instruments.

34
Fig. 3.12 – Schematic of pressure signal acquisition.
Fig. 3.13 – NI Interface Board CB-68LP DAQ.

35
The three pressure signals use independent analog channels in the interface
board; these signals are then distributed and directed to the main board installed inside
desktop. These three signals are processed by the software LabVIEW which
automatically recognizes and display them on a wave chart in front panel as shown in
Fig. 3.14.
Fig. 3.14 – Data acquisition LabVIEW program (front panel).

36
The software works with specific commands for each tasks and it easily links the
pressure signals with the workflow to calculate the GVF encountered by the test Coriolis
meter. Finally the pressure and GVF readings along with flowrates of both water and air
are sent to be written in a file. The sampling frequency is fixed at 10 Hz .When a steady
state condition is attained; a mean of data recorded for a run, usually about 5 minutes is
taken as the final measurement. The file can be extracted as a excel spread sheet to
represent the differential pressure and permeability data. Fig. 3.15 shows the block
diagram of the LabVIEW with the program to acquiring and writing the data.
Fig. 3.15 – Data acquisition LabVIEW program (block diagram).

37
3.2.2 Single phase test procedure
Single experimental setup is used for conducting both single phase and two-
phase tests. In single phase tests, both air and water are allowed to flow through the test
skid individually. This is done by cutting off secondary phase flow by means of control
valves. Single phase tests were performed both with and without flow conditioners. The
meter was tested for both air and water. Upper limit of flowrates for which meter was
tested were limited due to incapability of clear PVC pipe (used in the experiment for
visual inspection) to handle high pressures. Frequency of swirl in single phase flows can
be easily determined; another interesting testing can be to measure the output of the
meter as the swirl frequency nears the frequency of the meter itself, and to see what
happens when those two are same. When these two frequencies will be same, resonance
will occur, but that is very hard to achieve since commercial coriolis meters vibrate at
100 hertz to 200 hertz. This effect has not been discussed in present work.
3.2.3 Two phase test procedure
Two scenarios are given emphasis while testing flow-loop for two phase flows:
Aerated liquids: Aerated liquids are generated by introducing trace amounts of
gas in liquid flow. Amount of air in liquid is varied to observe the change in
Coriolis performance. Tests are carried out till the gas volume fraction above
which the error in mass flow rate becomes more than 10%. Tests are done
without using flow conditioners, as well as with swirl generator/in-line mixer.

38
Wet gas: Trace amounts of liquid are introduced in the gas stream to generate
wet gas flows. As in aerated liquid testing, here too amount of liquid present in
the flow is varied to observe the effect of change of liquid loading on Coriolis
performance. This also gives an operation envelope, where Coriolis meter can
work with reasonable accuracy, in spite of being subjected to two phase flow. As
before, tests are carried out in presence of flow conditioners as well as without
them.

39
CHAPTER IV
SINGLE PHASE METERING WITH CORIOLIS METER
Previous literature shows that Coriolis meter works best in single phase flows. First step
in this work is to test the meter in single phase flows to ascertain the performance of the
meter at different flowrates. This step can be viewed as a pre calibration procedure.
Single phase testing was done for both air and water flows. Also, effect of flow
conditioning is determined by employing both inlet swirl and inline mixer just before the
inlet to the Coriolis. Following sections describe the results obtained during the testing.
4.1 Single phase water tests
Tests were done using water as the singular phase while keeping the air supply
closed. Using the centrifugal pumps water was pumped at different rates and the
corresponding mass flowrate and density readings of test meter were acquired using data
acquisition system. Reading reported are mean of several reading taken over an interval
of 5 to 10 minutes when steady state conditions prevailed. Fig. 4.1 and Fig. 4.2 show the
data captured during the tests. From these plots, flow conditioning has no or minimal
effect on the mass flowrate and density readings of the Coriolis meter in case of single
phase liquid flow. These results suggest that the metering technology is immune to
velocity vectors associated with the fluid being metered in above mentioned conditions.
This has important implications for practical use of this technology. Flow conditioning is

40
not essential for accurate metering of the fluid. This also eliminates the need to install a
straight length of pipe between the meter and any sort of bend or elbow.
Fig. 4.1 – Effect of flow conditioners on MFR reading in single phase liquid test.
Fig. 4.2 – Effect of flow conditioners on density reading in single phase liquid test.

41
Errors recorded in the experiments along with range of uncertainty in reference
measurement are plotted versus liquid mass flow rates in Fig. 4.3 and Fig. 4.4, for liquid
mass flow rate and liquid density respectively.
Fig. 4.3 – Error in liquid mass flowrate with range of uncertainty (black markers).
Fig. 4.4 – Error in liquid density with range of uncertainty (same color).

42
As seen in the figures, error magnitudes are relatively small (~ %6.0 ) for mass
flow rate and (~ %3.0 ) for liquid density. No clear trends are visible, and errors can be
attributed random.
4.2 Single phase air tests
Single phase air tests are done in similar fashion as described in previous section,
only during these tests water inlet remains closed. Fig. 4.5 and Fig. 4.6 show the data
captured during the tests. Results show no or minimal effect of flow conditioning before
the meter. This aspect is similar to the results described in previous section. This
response of the meter in presence of any single phase flow could be attributed to the fact
that the response of the meter to flow vectors is negligible to the order of force generated
by high vibration frequency of the meter itself.
Fig. 4.5 – Effect of flow conditioners on MFR reading in single phase air test.

43
Fig. 4.6 – Effect of flow conditioners on density reading in single phase air test.
Fig. 4.7 – Error in air mass flow rate with range of uncertainty (same color).

44
Fig. 4.8 – Error in air density with range of uncertainty (same color).
Fig. 4.7 and Fig. 4.8 shows the relative difference between the reference (actual)
and the bserved parameters for mass flow rate and density respectively, along with the
renge of uncertainty in reference air mass flow rate and uncertainty in calculation of
reference density respectively. Though error magnitude in air mass flow rates are small
(~ %2 ), it is larger than in case of liquids. Errors in air density readings are very
significant (~ %10 ). The reason for these observations seems to be the inability of
coriolis meter to handle low density fluids at very low pressures; though this effect is
more important in density readings than mass flow rate readings. Another observation is
the reduction of error magnitude as the mass flow rates and hence the pressure is
increased.

45
CHAPTER V
TWO PHASE METERING WITH CORIOLIS METER
An accurate and real-time measurement of multiphase flows composed of oil,
water and gas phases is of great importance in many industries, such as chemical and
process industries, oil refineries and particularly in exploration and production of crude
oil and natural gas. A typical flow in any exploration and production operation consists
of any combination of oil, water and gas. Traditionally metering has involved separation
of these mixed flows into involved phases and using single phase meters to measure
them. This is not only an expensive “brute force” method; it also has a large footprint,
which in case of offshore operations is a hefty premium. As the drive towards attaining
cost reduction and smaller foot prints, especially in offshore exploration and production
operations gains momentum, the industry is searching for compact and inexpensive
alternatives to the traditional “separate and measure” approach.
Though intense efforts are being done to come up with universal multiphase
meters, unfortunately the basic nature of multiphase flows makes it virtually impossible
for anyone metering technology to measure any and every combination of phases
accurately. Currently there are several multiphase measuring technologies with
individual niches. Most of these technologies use multiple sensors to deduce individual
flowrates and other properties. Most of these technologies have a smaller footprint,
albeit not a cost advantage when compared to traditional approach to the problem.

46
Owing to very high accuracy of Coriolis meters operating in single phase flows, it shows
promise in emerging as a multiphase technology.
Coriolis meters have been evaluated in the past to measure two phase flows, as
cited in literature review. At this point, it is still very difficult to develop a reliable
theoretical model that can accurately predict behavior of Coriolis meter in two phase
flows; this is evident by the fact that only bubble model has been widely used by
researchers since late 90s till now28
. This is because of the complex fluid-structure
problem Coriolis meter poses operating in two phase flows; therefore, experimental
investigation is needed to verify the performance and limitations of Coriolis meter in two
phase flows.
Experimental program has been divided into two different types of two phase
flows, namely aerated liquids and wet gas (Fig. 5.1); in the former flow primarily
consists of liquid phase with small amounts of air, while in latter small volumes of liquid
is introduced in air flow. Since these two phase flows differ widely from each other in
their behavior, respective results are discussed separately.
In Fig. 5.1, test matrix is plotted on Taitel and Dukler flow regime map, created
by FlowPat (Chevron) at atmospheric pressure and 720 F. Axes of the map denote the
velocity which each phase would be having in the coriolis meter if that phase alone was
occupying the whole tube cross section. This is also termed as “superficial” velocity;
hence the names of the axes are Vsl and Vsg, for superficial liquid velocity and
superficial gas velocity respectively. It also shows the regions the data points lie; aerated
liquids in dispersed bubble regime I and wet gas in annular flow regime A.

47
Fig. 5.1 – Test matrix showing both aerated liquid (blue) and wet gas (orange) data
points (plotted on Taitel & Dukler flow regime map at atmospheric pressure).
min/130.
lbM l
min/105.
lbM l
min/150.
lbM l
min/5.1.
lbM g
min/2.
lbM g
min/1.
lbM g

48
Maximum pressure achieved before the Coriolis meter in these testing was 5 psig
for cases with highest liquid mass flow rate and highest gas volume fractions; all the data
points corresponded to pressures ranging from 2-5 psi, hence the flow pattern map was
made for atmospheric pressure.
5.1 Aerated liquid tests
Aerated liquids are termed as flows containing primarily liquid with small
amounts of gas. In actual field conditions this gas may come from reservoir or it may be
dissolved in the liquid which comes out as “free” gas when considerable pressure drop
occurs. In any practical field condition, it is nearly impossible to eliminate free gas from
the liquid phase since any flow consists of pressure gradient; therefore it is imperative
for meters to have certain resistance to liquid flows with small amount of air in them,
even if it is supposed to operate in single phase flow. This is necessary to avoid a meter
failure if conditions change and can be viewed as a contingency plan.
One of the aims of aerated liquid tests in current work is to observe whether the
Coriolis meter can handle aerated liquid flows. The amount of gas present in the flow is
quantified by gas volume fraction ( ), (also denoted by GVF) where,
gl
g
VV
V
………………..………………………………………………………….. (11)
V denotes the volume of a particular phase present in the flow, and l and g denote the
liquid and gas phase respectively. GVF reported in results are calculated at the inlet of

49
the meter by applying pressure correction to account for the expansion of the gas; this is
due to drop in pressure between the supply air outlet and the Coriolis meter inlet.
As specified before in the metering subsection, air mass flowrate ( gM.
) and
temperature ( gT ) are measured by the Coriolis meter installed on the air supply line,
whereas liquid mass flowrate ( lM.
) and liquid density ( l ) are measured by the Coriolis
meter installed at the liquid supply. Since the experiment is conducted at ambient
conditions, air is considered to be in isothermal conditions, which is confirmed later by
direct measurements. Liquids are considered incompressible in all the experiments.
l
ll
MV
..
……………..……………………………………………………………. (11)
..
29
7316.10460g
atminlet
gg M
PP
TV
…………..………………………………………….. (12)
gl
g
VV
V..
.
……………..……………………………………………………………. (13)
Where gT is measured in Degree Fahrenheit, 10.7316 ft3·psi·°R
-1·lb-mol
-1 is the
universal gas constant, and 29 is the molecular mass of air. inletP denotes the measured
inlet gauge pressure just before the Coriolis test meter and atmP is the atmospheric
pressure at lab conditions. lV.
and gV.
are the volumetric flowrate of liquid and gas
phase respectively.
Results obtained in aerated liquid tests are compared with the “bubble” model
given by Hemp and Sultan9. A simplified schematic of an entrained air bubble in a liquid

50
is shown in Fig. 5.2. Here a small sphere of material (density s ) is situated in a pool of
another material (density l ). When the liquid with density l is accelerated at A m/s2,
the sphere with density s does not accelerate at same rate A m/s2 but at rate A1 m/s
2,
where both are related as (page 36 of [29]),
AAsl
l
2
31
………………..…………………………………………………….. (14)
Fig. 5.2 – Motion of small sphere in a liquid filled container.
As clear from the equation 9, if the density of the sphere s exceeds that of the
surrounding fluid ( l ), the sphere “lags” behind the surrounding fluid; on other hand if
s < l , the sphere “leads” ahead. In case of aerated liquids, s << l and equation 9
gives,
AA 31 ……………………………………………………………………………… (15)
A
l A1
s

51
Considering a unit volume of aerated mixture, with GVF equals , passing
through the Coriolis meter, equation 10 suggests that gas bubble will vibrate with
acceleration equaling three time the acceleration experienced by the rest of the
surrounding fluid; this also suggests that in context of motion of sphere/bubble in a cross
section of the vibrating tube, increased motion of the sphere/bubble compared to rest of
the fluid will result in reduced level of participation in oscillation by rest of the fluid.
This gives rise to reduced, apparent system inertia.
Rayleigh-Plesset equation in case of bubble acting as a harmonic oscillator
surrounded by liquid gives30
,
03
2
..
xR
Px
l
………..……………………………………………………………. (16)
Where x is the small displacement along the equilibrium axis of the bubble, P is the far
field liquid pressure, R is the radius of the bubble, and is the ideal gas specific heat
ratio.
When compared to linear oscillator of the form,
02....
xxxm
kx ……………………………………………………….......... (17)
Where k is the spring constant, m is the effective mass oscillating, and is the resonant
angular frequency.
It gives,
l
P
R
31………………………………………………………………...... (18)
Along with,

52
34 Rmm e ……………………………………………………...…………… (19)
Equation (14) shows that when a bubble oscillates in the pool of the liquid, the effective
mass oscillating is equal to three times the mass of liquid displaced by the bubble. This
in turn results to no participation in oscillations by equal amount of liquid.
Therefore the meter measures apparent density and apparent mass flow rate given by,
)31( la…………………………………………………..…………………… (20)
)31(.
tla vAM …………………………………………….…………………….. (21)
Where, v is the velocity of the mixture through the meter, and tA is the cross sectional
area of measuring tube.
Now if the density of liquid, l is known and the apparent density value is given by the
meter, the density error is given by,
3
l
ladE ………………..……………………………..…………………… (22)
Since the true mass flow rate is,
tl vAM )1(.
…………...…………………….……………………………………. (23)
The mass flow error (neglecting the mass of gas) is given by,
1
2.
..
M
MME a
m …………….………..……………………………................... (24)
In the prior reasoning, the mass of the gas phase is considered negligible and hence is
not accounted for in the model; also multi bubble dynamics is not included in the

53
formulation. Another notable simplification is absence of any bubble-boundary
interactions.
Experiments are conducted at three different liquid flowrates. All the
experiments are started by introducing small quantities of air in single phase water flow
and gradually increasing air quantities to reach required GVF. Experiments are stopped
at the GVF which either corresponds to 10% error in mass flowrate reading or when
pressure experienced prior to flow conditioner becomes higher than 15 psi; while the
latter limit is dictated by the pressure handling capacity of transparent PVC pipes used in
the setup, the former is frequently reported as the maximum error for any satisfactory
multiphase metering.
Similar trends are seen from the separate tests conducted at liquid mass flow
rates of 105 lb/m (439 bbl/day) (Fig. 5.3), 130 lb/m (541 bbl/day) (Fig. 5.4), and 150
lb/m (627 bbl/day) (Fig. 5.5). Negative mass flow errors are recorded for all the tests.
Observed mass flow rates for all the cases lie between the actual (reference) and those
predicted by the “bubble-model” (model MFR); this tends to suggest that the model does
predicts the lower limit of mass flow errors. The discrepancies between the observed and
predicted readings can be accounted to lack of multi-bubble dynamics and lack of
bubble-structure interactions in the model.
In case of inlet swirl conditioner, observed errors are largest when compared to
reference mass flow rate, and seems to follow the model rather well (Fig. 5.4 & Fig.
5.5). This can be due to coalesce of bubbles into a single air core; this reduces the

54
deviation of the observed errors to that predicted by the model (which doesn‟t accounts
for multi-bubble dynamics).
Flow conditioners affect the reading of the meter. This inference is unlike that
observed in single phase flows; this suggests that the flow conditioners change the flow
conditions rather than having any direct impact on the meter itself. In tests at each flow
rate, inline mixer tends to homogenize flow and hence gives most accurate result
compared to reference flow rate; on the other hand, inlet swirl tends to segregate flow
and gives least accurate reading. Difference between readings with inline mixer and with
no flow conditioner tends to decrease at higher flowrates. This may be explained due to
increased shear rate, which tends to homogenize fluid distribution.
Use of inline mixer also increases the GVF limit for a particular error. For
example, at liquid mass flow rate 105 lb/m (439 bbl/day), 10% error is achieved at GVF
between 4 and 5, in case of inlet swirl; inline mixer gives 10% error after GVF 7. This
can be a way of increasing the operational two-phase envelope of Coriolis meter. At
liquid mass flow rate 150 lb/m (627 bbl/day), same analysis yields GVF between 5 and 6
(inlet swirl), and GVF 7 (inline mixer); this tends to suggest that effectiveness of inline
mixer decreases at higher flow rates.

55
Fig. 5.3 – Aerated liquid test at flow rate, lQ = 105 lb/min.
Fig. 5.4 – Aerated liquid test at flow rate lQ = 130 lb/min.

56
Fig. 5.5 – Aerated liquid test at flow rate lQ = 150 lb/min.
5.2 Wet gas tests
Wet gas is the generic name given to multi-phase fluids, where small quantities
of liquids are present in flow stream comprised mainly from gas phase fluids. In field
conditions, liquids may originate from the reservoir or may form from the gas phase
itself in the form of condensates. In lab conditions, wet gas is generated by adding small
quantities of liquid in an air flow. Similarly to aerated liquid tests, gas volume fractions
(GVF) are calculated and recorded. Unlike in aerated liquids, there is no model available
for Coriolis meter performance in wet gas. Though superficially, the only parameter that
distinguishes wet gas from aerated liquids is GVF, the flow profile changes completely.
In most cases the phase mixture is in annular flow regime; as such the models used in
aerated liquids cannot be used for wet gas.

57
Tests are done at three different rates, 1 lb/m (19.2 Mscf/day), 1.5 lb/m (28.8
Mscf/day) and 2 lb/m (38.4 Mscf/day). The results of the investigation are presented in
Figs. 5.6 – 5.8. A close observation of the plot shows that flow conditioners have no
significant effect on the mass flow rate output of the meter; the reason seems to be the
quick reversal of the flow back to annular even in presence of flow conditioners. As
expected, error associated with the reading also increases as the GVF increases. Unlike
aerated liquid tests, error in mass flow rate output is significant even at very low liquid
contaminations (GVF~97). This may be due to high mass contrast between single phase
gas and wet gas with even slight liquid contamination. At higher air flow rate (Fig. 5.8),
inline mixer seems to cause an improvement in mass flow rate reading due to high shear
rate involved with the flow.
Fig. 5.6 – Wet gas test at flow rate gQ = 1 lb/min.

58
Fig. 5.7 – Wet gas test at flow rate gQ = 1.5 lb/min.
Fig. 5.8 – Wet gas test at flow rate gQ = 2 lb/min.

59
CHAPTER VI
CONCLUSIONS AND RECOMMENDATIONS
6.1 Conclusions
From the results of this experimental investigation the following conclusions
were reached:
1. Coriolis meter‟s performance in single phase flows is excellent. Flow
conditioners have no significant effect on accuracy.
2. Coriolis meter reports negative errors in case of aerated liquid flows for the gas
volume fractions included in the work. The reason seems to be the relative
motion between two phases.
3. Flow conditioners affect the accuracy of Coriolis meter in aerated liquid
conditions. In most of the cases, inlet swirl decreases the accuracy while inline
mixer has an opposite impact. Coriolis meter reports an error of 10% at GVF 7 to
8, when mass flow rate increase from 105 lb/m to 150 lb/m.
4. In aerated fluid tests, effect of flow conditioners on accuracy reduces with
increased flow rate.
5. Coriolis meter reports negative errors in case of wet gas flows. Flow conditioners
seem to have negligible effect on measurement accuracy on lower rates, with
inline mixer showing improvement in highest flow rate used in testing.
Effect of flow conditioners on two-phase envelope has been
experimentally determined. Flow conditioners are shown to have an impact on

60
meter accuracy in aerated liquid flows, however small that might be; on the other
hand, results from experiments with flow conditioners in wet gas don‟t look
promising. Coriolis meter is also shown to be able to handle two-phase flows
without stalling.
6.2 Recommendations
Following recommendations are made based on results from this research:
1. Accuracy of Coriolis meters operating in two-phase flows should be investigated
further with fluids having different viscosities and densities than water and air.
2. Current analytical prediction of Coriolis meter performance in two-phase flows
lacks accuracy. Efforts should be made towards improvement.
3. Two-phase testing of Coriolis meters should be done at higher pressures and
higher flow rates, simulating field conditions more realistically.
4. Further investigation of Coriolis meter performance should be done with vertical
installation, to eliminate effect of buoyancy on readings.

61
NOMENCLATURE
= gas volume fraction
a = apparent density
l = liquid density
s = sphere/bubble density
= resonant angular frequency
= ideal gas specific heat ratio
tA = cross sectional area of measuring tube
dE = density error
mE = mass flow rate error
GVF = gas volume fraction
k = spring constant
MFR = mass flow rate
.
M = actual mass flow rate (gas mass neglected)
aM.
= apparent mass flow rate
gM.
= gas mass flow rate
lM.
= liquid mass flow rate
atmP = atmospheric pressure

62
inletP = pressure at the inlet of Coriolis meter
P = far-field pressure
gQ = gas mass flow rate
lQ = liquid mass flow rate
R = radius of sphere/bubble.
gT = gas temperature
gV.
= gas volumetric flow rate
lV.
= liquid volumetric flow rate
63
REFERENCES
1. Bourgoyne A.T. Jr., Scott S.L. and Regg J.: “Technology Allows Metering
Multiphase Flow,” Pumps & Systems Magazine, (May 2002), 24-28.
2. Falcone G., Hewitt G.F., Alimonti C., and Harrison B.: “Multiphase Flow Metering:
Current Trends and Future Developments,” paper SPE 71474 presented at the 2001 SPE
Annual Technical Conference and Exhibition, New Orleans, Louisiana, 30 September –
3 October.
3. Gysling D.L.: “An Aeroelastic Model of Coriolis Mass and Density Meters Operating
on Aerated Mixtures,” Flow Measurement and Instrumentation, (2007) 18, 69-77.
4. Liu R.P., Fuent M.J., Henry M.P., and Duta M.D.: “A Neural Network to Correct
Mass Flow Errors Caused by Two-Phase Flow in a Digital Coriolis Mass Flowmeter,”
Flow Measurement and Instrumentation, (2001) 12, 53-63.
5. Skea A.F.: “Effects of Gas Leaks in Oil flow on Single-Phase Flowmeters,” Flow
Measurement and Instrumentation, (1999) 10, 146-150.
6. Domnick J., Durst F., Raszillier H., and Ziesel H.: “A Method to Measure Mass and
Volume Flow Rates of Two-Phase Flows,” International Journal of Multiphase Flow,
(1987) 13 (5), 685-698.
7. Cascetta F., Valle S.D., Guido A.R., and Vigo P.: “A Coriolis Mass Flowmeter Based
on a New Type of Elastic Suspension,” Measurement, (Oct-Dec 1989) 7 (4), 182-191.

64
8. Cascetta F., Cignolo G., Goria R., Martini G., Rivetti A., and Vigo P.: “Experimental
Intercomparison of Coriolis Mass Flowmeters,” Transactions of the Institute of
Measurement and Control, (1992) 14 (2), 99-107.
9. Hemp J. and Sultan G.: “On the Theory and Performance of Coriolis Mass Flow
Meters," paper presented at 1989 International Conference on Mass Flow Measurement
Direct & Indirect, 21-22 Feb, London.
10. Hemp J. and Yeung H.: “Coriolis Meters in Two Phase Conditions,” IEE Computing
and Control Engineering, (August/September 2003), 36.
11. Grumski J.T. and Bajura R.A.: “Performance of a Coriolis-Type Mass Flow Meter in
the Measurement of Two-Phase (Air-Liquid) Mixtures,” ASME Fluid Engineering
Division Publication FED, (1984) 17, 75-84.
12. Al-Khamis M.N., Al-Nojaim A.A., and Al-Marhoun M.A.: “Performance Evaluation
of Coriolis Mass Flowmeters,” Transactions of the ASME, (June 2002) 124, 90-94.
13. Hekimian N., Jumonville J.M., and Scott S.L.: "Experimental Investigation of the
Influence of Trace Amounts of Gas on Coriolis Liquid Metering," paper presented at the
ASME-ETCE 2000 Production Technology Symposium, New Orleans, Louisiana, Feb.
14-17.
14. Gysling D.L.: “Measurement at Speed of Sound: New Method Using Coriolis Gain
Aerated Liquid Accuracy,” paper presented at the 2005 ISA Houston, 01 March.
15. Ward E.R.: “New Class of Meter Solves Oil Problem Impacting Well Test
Accuracy,” paper SPE 100893 presented at 2006 SPE Western Regional/APG Pacific
Section/GSA Cordilleran Section Joint Meeting, Anchorage, Alaska, 8-10 May.

65
16. Volz R., Gysling D., Loose D., and Rawat A.: “Accurate Volumetric Flow-Rate and
Density Based Water-Cut Measurement in Bubbly Liquid Hydrocarbon Flow,” paper
SPE 102962 presented at 2006 SPE Technical Conference and Exhibition, San Antonio,
Texas, 24-27 September.
17. Hemp J. and Kutin J.: “Theory of Errors in Coriolis Flowmeter Readings due to
Compressibility of the Fluid Being Metered,” Flow Measurement and Instrumentation,
(2006) 17, 359-369.
18. Cheesewright R., Clark C., and Bisset D.: “The Identification of External Factors
which Influence the Calibration of Coriolis Massflow Meters,” Flow Measurement and
Instrumentation, (2000) 11, 1-10.
19. Bobovnik G., Kutin J., and Bajsic I.: “The Effect of Flow Conditions on the
Sensitivity of the Coriolis Flowmeter,” Flow Measurement and Instrumentation, (2004)
15, 69-76.
20. Kutin J., Bobovnik G., Hemp J., and Bajsic I.: “Velocity Profile Effects in Coriolis
Flowmeters: Recent Findings and Open Questions,” Flow Measurement and
Instrumentation, (2006) 17, 349-358.
21. Cox. M.C.: “A Strategy for Continuous In-Pipeline Metering of Oil/Water
Emulsions,” M.A.Sc. Thesis, University of Waterloo, (1987).
22. Andersson V. and Gudmundsson J.S.: “Flow Properties of Hydrate-in-Water
Slurries,” Annals of New York Academy of Sciences, (2000) 912, 322-329.
23. Uvwo I., and Scott S.L.: “Variable Inlet Configuration Improves Flexibility of
Compact Cylindrical Cyclone Separators,” paper presented at the 2005 NEL Advances

66
in Multiphase Separation & Multiphase Pumping Technologies Conference, Aberdeen,
Scotland, 1-2 September.
24. Adebare A.: “Optimizing the Efficiency of Cylindrical Cyclone Gas/Liquid
Separators for Field Applications,” M.S. Thesis, Texas A&M University (2006).
25. “Micro Motion ELITE Coriolis Flow and Density Meters: Product Data Sheet, PS
00374, Rev 1,” www.emersonprocess.com/micromotion (accessed on 03-02-08).
26. “Rosemount 1151 Pressure Transmitter: Product Data Sheet, 00813-0100-4360, Rev
HA,” www.emersonprocess.com/rosemount (accessed on 03-02-08).
27. Weingarten J.S.: “Field Results of Separations – Vessels and Multiphase-Flowline
Debottlenecking Using an In-line Gas/Liquid Auger Separator,” paper SPE 65072
Presented at the 1998 SPE Annual Technical Conference and Exhibition, New Orleans,
Louisiana, 27-30 September.
28. Henry M., Tombs M., Duta M., Zhou F., Mercado R., Kenyery F., Shen J., Morles
M., Garcia C., and Langansan R.: “Two-Phase Flow Metering of Heavy Oil Using A
Coriolis Mass Flow Meter: A Case Study,” Flow Measurement and Instrumentation
(2006) 17, 399-413.
29. Landau L.D. and Lifshitz E.M.: Fluid Mechanics, 1st Edition, Pergamon Press, New
York (1959).
30. Godwin R.P. and Chapyak E.J.: “Resource Letter BD-1: Bubble Dynamics,”
American Journal of Physics, (2000) 68 (3), 211-222.

67
VITA
Name: Shashank Shukla
Address: 3116, Richardson Building
Department of Petroleum Engineering
Texas A&M University
College Station, TX 77843
Email Address: [email protected]
Education: Texas A&M University
Master of Science in petroleum engineering
Graduation Date: May 2008
National Institute of Technology Calicut, India
Bachelor of Technology in mechanical engineering
Graduation Date: May 2005