![Comparison of Fuzzy logic, AHP, FAHP and Hybrid Fuzzy AHP … · 2014-08-21 · [Post-print version] Please cite as: Alessio Ishizaka, Comparison of Fuzzy logic, AHP, FAHP and Hybrid](https://static.fdocuments.in/doc/165x107/5cd53a2d88c993f06f8be8e1/comparison-of-fuzzy-logic-ahp-fahp-and-hybrid-fuzzy-ahp-2014-08-21-post-print.jpg)
An integrated methodology of FTA and fuzzy AHP for risk … · 2018-08-15 · An integrated...
23
Int. J. Operational Research, Vol. 25, No. 1, 2016 77 Copyright © 2016 Inderscience Enterprises Ltd. An integrated methodology of FTA and fuzzy AHP for risk assessment in green supply chain Sachin Kumar Mangla* and Pradeep Kumar Department of Mechanical and Industrial Engineering, Indian Institute of Technology, Roorkee, Uttrakhand, 247667, India Email: [email protected] Email: [email protected] *Corresponding author Mukesh Kumar Barua Department of Management Studies, Indian Institute of Technology, Roorkee, Uttrakhand, 247667, India Email: [email protected], Abstract: This study proposes an integrated methodology of fault-tree analysis (FTA) and the fuzzy analytical hierarchy process (AHP) approach, which provide means to integrate the qualitative and quantitative information to the group decision-making process for analysing green supply chain risks under the fuzzy surroundings. In the proposed methodology, initially, a fault tree diagram is constructed, which includes the probable criteria, and sub-criteria of the green supply chain risks, and later, using the fuzzy AHP approach, these criteria and sub-criteria were prioritised for risk assessment. A total eight risk criteria and 30 sub-criteria were identified based on relevant literature and the experts’ input. The research findings illustrates that the product recovery risks and process risks criteria possess highest priority and need considerable managerial responsiveness for reducing the green supply chain susceptibility and hence performance improvement. Further, a plastic manufacturer green supply chain example is presented to show the application of the study. Keywords: green supply chain; GSC; supply chain management; fault-tree analysis; FTA; fuzzy AHP; risk; risk assessment. Reference to this paper should be made as follows: Mangla, S.K., Kumar, P. and Barua, M.K. (2016) ‘An integrated methodology of FTA and fuzzy AHP for risk assessment in green supply chain’, Int. J. Operational Research, Vol. 25, No. 1, pp.77–99. Biographical notes: Sachin Kumar Mangla is presently a Research Scholar in the Department of Mechanical and Industrial Engineering, Indian Institute of Technology, Roorkee, India. He is pursuing his PhD degree in the field of green supply chain management, sustainability, decision making, flexible systems, risk management, reverse logistics and product recovery. He has completed his graduation (specialisation: production and industrial engineering) from IIT Roorkee. He has published/presented several papers in several journals of reputes and in conference proceedings.
Transcript of An integrated methodology of FTA and fuzzy AHP for risk … · 2018-08-15 · An integrated...

Int. J. Operational Research, Vol. 25, No. 1, 2016 77
Copyright © 2016 Inderscience Enterprises Ltd.
An integrated methodology of FTA and fuzzy AHP for risk assessment in green supply chain
Sachin Kumar Mangla* and Pradeep Kumar Department of Mechanical and Industrial Engineering, Indian Institute of Technology, Roorkee, Uttrakhand, 247667, India Email: [email protected] Email: [email protected] *Corresponding author
Mukesh Kumar Barua Department of Management Studies, Indian Institute of Technology, Roorkee, Uttrakhand, 247667, India Email: [email protected],
Abstract: This study proposes an integrated methodology of fault-tree analysis (FTA) and the fuzzy analytical hierarchy process (AHP) approach, which provide means to integrate the qualitative and quantitative information to the group decision-making process for analysing green supply chain risks under the fuzzy surroundings. In the proposed methodology, initially, a fault tree diagram is constructed, which includes the probable criteria, and sub-criteria of the green supply chain risks, and later, using the fuzzy AHP approach, these criteria and sub-criteria were prioritised for risk assessment. A total eight risk criteria and 30 sub-criteria were identified based on relevant literature and the experts’ input. The research findings illustrates that the product recovery risks and process risks criteria possess highest priority and need considerable managerial responsiveness for reducing the green supply chain susceptibility and hence performance improvement. Further, a plastic manufacturer green supply chain example is presented to show the application of the study.
Keywords: green supply chain; GSC; supply chain management; fault-tree analysis; FTA; fuzzy AHP; risk; risk assessment.
Reference to this paper should be made as follows: Mangla, S.K., Kumar, P. and Barua, M.K. (2016) ‘An integrated methodology of FTA and fuzzy AHP for risk assessment in green supply chain’, Int. J. Operational Research, Vol. 25, No. 1, pp.77–99.
Biographical notes: Sachin Kumar Mangla is presently a Research Scholar in the Department of Mechanical and Industrial Engineering, Indian Institute of Technology, Roorkee, India. He is pursuing his PhD degree in the field of green supply chain management, sustainability, decision making, flexible systems, risk management, reverse logistics and product recovery. He has completed his graduation (specialisation: production and industrial engineering) from IIT Roorkee. He has published/presented several papers in several journals of reputes and in conference proceedings.

78 S.K. Mangla et al.
Pradeep Kumar is a Professor in the Department of Mechanical and Industrial Engineering at IIT Roorkee, India. He obtained his Bachelor’s in Industrial Engineering in 1982 from Roorkee University and Masters in Production Engineering (Gold Medallist) from University of Roorkee (Now, IIT Roorkee) in 1989. He received his PhD degree in 1994 with specialisation in Industrial Engineering from University of Roorkee (now, IIT Roorkee), India. He has more than 25 years research/teaching experience. He has supervised 27 PhD theses, and had contributed more than 450 publications in international/national journals/conferences of repute. His research interests include industrial engineering, supply chain management (SCM), quality engineering: robust design methodologies, reliability engineering, advanced manufacturing processes; microwave joining of metals, and metal casting.
Mukesh Kumar Barua is an Assistant Professor in the Department of Management Studies, IIT Roorkee. His research area includes supply chain management, quality management, operations research, and operations management. He obtained Master of Technology in Mechanical Engineering and Doctor of Philosophy from IIT Madras. He has published more than 40 research papers in reputed journals and conferences.
1 Introduction
Ecological concern is gaining essential importance worldwide. There is an increased awareness and concern, about implementing the green aspect in various facets, by various stakeholders of an organisation. The various stakeholders are consumers, government regulatory bodies, competitors, non-profit or non-government organisations, investors, employees, shareholders, etc. The expectations of stakeholders have become a driving force for the companies to consider the aspect of going green in various functions of the organisations. Supply chain is one of the important areas that is considered as a potential candidate for the implementation of the green aspects. The aspect of environmental consideration or going green need to be considered in almost all the manufacturing industries and service organisations.
The environmental consideration is viewed as important not only in business like electronic industry, for example, Toshiba, Motorola, IBM, Dell, and Panasonic, proactive on greening the supply chains, aiming to reduce the raw material consumption and lowers the waste generation (Zhu and Sarkis, 2006). Similarly, the manufacturing organisations for instance, Ford, GM, Xerox, etc. introduces the green component in managing their supplier(s) related decisions (Zhu et al., 2007). In addition, the European Union Restriction of Hazardous Substance Directive, which prohibits the use of certain hazardous substance, is also noteworthy in direction to lower the overall ecological impact (Hu et al., 2009). To accomplish the environment and ecological responsibilities in business, the perception of greening the supply chain or green supply chain (GSC), and green supply chain management (GSCM) has been evolved. The GSC and GSCM involves an exhaustive view in a product life cycle by adding environmental component exactly from design phase of the product to till it reaches the end users, and finally its end-of-life management (Rao and Holt, 2005; Srivastava, 2007).
Nonetheless, any production and business activity in GSC includes some objective risk factors, and inescapably these risk factors add to the unforeseen activities, and lower

An integrated methodology of FTA and fuzzy AHP for risk assessment 79
the overall performance (Ruimin et al., 2012). Hence, the issue of considerate risk, risk analysis and research is the imperative subject matter of GSCM research. Despite, there is insufficiency of literature focusing risks and risk issues especially in GSC, and very few publications or research has presented a solid identification, prioritisation and analysis and/or assessment of risks in the context of GSC (Ruimin et al., 2012). In that way, the present study is an attempt to fill this gap of research in GSC direction. Additionally, it should be noted that the term risk assessment and risk analysis are being used interchangeably in the present study.
The term ‘risk assessment’ is quite effective in identification, estimation and evaluation of the risks in GSC, yet, major hindrance in analysing risks is the inclusion of subjectivity since input from experts mainly comes in the form of subjective assessments. Thus, under this scenario use of fuzzy logics may be quite helpful (Chang et al., 1998; Tseng et al., 2009). Therefore, it has been planned to use fuzzy set theory to handle the imprecise judgement of experts, in conjunction with the analytic hierarchy process (AHP), i.e., fuzzy AHP approach for prioritising risks in GSC. However, for identification and analysis of risk causes and sub-causes or risk criteria and sub-criteria in GSC, the fault-tree analysis (FTA) method can be used. The FTA is a risk estimation tool that has ability to model interactions between the events (Lee et al., 1985). In view of the above, the present research is aimed at providing an integrated FTA-fuzzy AHP model for prioritising and analysing risks in GSC.
Additionally, to understand the intricacy in dealing with management of the green factors to supply chain planning, a firm GSCM case, which portrays more clear illustrations of understanding and analysis of risks in GSC under uncertain conditions or surroundings, has been studied.
The remaining of the study is structured as: Section 2 explores the relevant literature on GSC, GSCM and some background on the proposed integrated FTA-fuzzy AHP approach. Section 3 illustrates the concern of risks in GSC. While, Section 4 includes the description of FTA, and Section 5, presents the details of fuzzy extended approach to AHP method. The proposed methodology of research is detailed in Section 6, and a firm GSCM case is illustrated in Section 7, whereas Section 8 discusses study findings, and offers several managerial implications. Conclusions, limitations of the study and scope of future research have been detailed in Section 9.
2 Review of literature
Environmental issues are becoming imperative, including substantial responsiveness in supply chain dimension, results in maturity of literature on GSC and GSCM. Pertaining to relevant literature, GSC has been described by different researchers using various lexis, such as a closed-loop supply chain, sustainable supply chain, environmental supply chain, integrated supply chain, etc. (Beamon, 2005; Zhu and Sarkis, 2006; Vachon and Klassen, 2006; Zhu et al., 2008). Nonetheless, the focal point of the green supply taxonomy is ‘environment’. Therefore, GSCM expressed to be the addition of the green component into the traditional supply chain management (Srivastava, 2007; Mangla et al., 2014a). In this line, Hervani et al. (2005) present GSCM a mean, to include ecological concern at each stage of supply chain planning for instance, green procurement, green manufacturing, green distribution, and reverse logistics for closing

80 S.K. Mangla et al.
the supply chain loop. While, Albino et al. (2009) define GSCM as a strategic approach, which seeks to, address ecological measures to the supply chain. On the other side, GSC and GSCM also viewed as measuring the ecological performance of the supply chain (Zhu and Sarkis, 2006; Mangla et al., 2014b).
However, incorporating green in supply chain context involves complexity, and includes several risk and uncertainties related to the GSC, very few studies attempts to address the issue (Mangla et al., 2014c), for instance, Hu et al. (2009) offered a quantitative-based approach to analyse the risks linked to green components in GSC. In another study, Dan-Li et al. (2011) evaluated the influencing risk and factors for greening an organisational supply chain. Initiating work to identify and analyses risk sources and issues in organisation GSC is also noteworthy (Ruimin et al., 2012), but, still it requires considerable effort to evaluate and measure the GSC risks, and in this response, a structural framework should be developed.
Furthermore, for the evaluation and analysing the risks, literature has accounted the usage of several qualitative and quantitative techniques and methods. Some of these methods are FTA, failure modes and effect analysis (FMEA), the Markov method, quality function deployment (QFD), etc. [for details refers to Khan and Abbasi (1998), Raharjoa et al. (2008), Hu et al. (2009), Lindhea et al. (2009) and Chaudhuri et al. (2013)].
The FTA approach is the most appropriate as it exhibits excellent characteristics for identifying risk issues. Notably, FTA is a documented approach for determining the basic causes of a given undesired event (Lee et al., 1985). It involves the construction of a fault-tree, and initiates from a top event (Vesely et al., 1981). After identifying risk criteria and sub-criteria, there is a need to prioritise them for determining the relative importance, and for making the priority, AHP method is most widely used. However, it is unable to capture the subjectivity and vagueness involved due to human judgement in decision-making (Ishizaka and Labib, 2009). To address this issue, fuzzy set theory along with AHP for determining the relative importance of criteria and sub-criteria is suggested (Chan et al., 2008). Additionally, fuzzy AHP method is finding its application in modelling and developing of risk evaluation models (Hu et al., 2009; Yang and Li, 2010; Radivojević and Gajović, 2013).
3 Risks in GSC
Risk occurs because we never know exactly what will happen in the future (Miller, 1992). It is useful to the best forecasts and does all probable analysis; however, still uncertainty incurred to the future. This uncertainty further leads to risks (Chopra and Sodhi, 2004). Nonetheless, traditional supply chains can be understood as the network of various members and all linked together and if any member incurs a risk then it would be automatically transferred to all other members (Samvedi and Jain 2013). For example, instability in behaviour of any one-supplier, not only affects its immediate customers, but also affects each member of the supply chain. Further, how the past epidemics of SARS, or bird flu in 2003 affects the world supply chain network, likewise, the occurrence of hurricanes Katrina and Rita in the Gulf of Mexico in 2005, have raised the threats of the deficit of fuel and oil around the world and hence increase in price. Therefore, managing risks and its consequences is important to reduce its negative effect on business performance.

An integrated methodology of FTA and fuzzy AHP for risk assessment 81
Moreover, discussing risks in GSC includes several uncertainties and unplanned events linked to forward and reverse operations of the GSC network design, in terms of demand, operations, methods and techniques, information network design, recovery and returning activities, etc. (Ruimin et al., 2012). Table 1 Description of GSC risks with source
GSC risks Description Sources Information technology risks (C1)
This kind of risk represents the issues allied to flow and information network design in GSC, for instance, the arrangement of information flow and sharing of information within partners of GSC, tracking the product information for product recovery, etc.
Porter and van der Linde (1995), Wee and Quazi (2005), Sarkis (2006)
Financial risks (C2)
Financial risks in GSC include issues of asset recovery and uncertainty in returned material value, economic downturns, and market fluctuations together with consideration of cost associated with green activities.
Orsato (2006), Siegel (2009), Mudgal et al. (2010), Zou and Couani (2012)
Supply risks (C3)
Supply risks primarily concern issues at supply network of green supply chain.
Lippmann (1999), Hall (2001), Sarkis (2003), Rao and Holt (2005), Mangla et al. (2013a, 2013b), Mathiyazhagan et al. (2013)
Process risks (C4)
The issues involved in manufacturing and processing of a green product corresponds to the process risks in GSC.
Green et al. (1998), Sarkis (2003), Rao and Holt (2005), Adler (2006), Jose (2008), Qianlei (2012), Xu et al. (2013)
Government interference risks (C5)
The involvement of government by means of regulations and/or legislations, and impact of various environmental pressures for implementing the reverse and green operations in supply chain corresponds to the government interference risks in GSC.
Mitra and Webster (2008), Atasu et al. (2009), Sheu (2011)
Social and environmental risks (C6)
Social risks in GSC may obstruct the social responsibilities for GSC due to impact of business activity on public and people, while occurrence of natural calamities and disaster events leads to environmental risks.
Cruz and Matsypura (2009), Luthra et al. (2011), Mangla et al. (2012), Qianlei (2012)
Demand risks (C7)
Collectively, the demand of aggregate return used product for recovery operations and final finished green product produced by a producer represents the demand risks in GSC.
Zhu et al. (2008), Paulraj (2009), Holt and Ghobadian (2009), Mathiyazhagan et al. (2013)
Product recovery risks (C8)
Product recovery risk entails the uncertainties and issues incurred at returning and recovery end of the products.
Hervani et al. (2005), Luthra et al. (2011), Mangla et al. (2012, 2013a)
However, the risks associated with GSC could be classified based on different means and perception, e.g., business super visionary and governance, and the structure of the GSC system (Yang and Li, 2010; Qianlei, 2012). One simple category might be on perspective of resource flow, i.e., knowledge flow risks, logistics risks, and capital flow risks, etc. In
82 S.K. Mangla et al.
the present study, based on factors internal or external to the organisation GSC, the GSC risks are classified into two main categories, i.e., internal and external risk category. These two categories further expanded into eight evaluation risk criteria, viz. information technology risks (C1), financial risks (C2), supply risks (C3), process risks (C4), government interference risks (C5), social and environmental risks (C6), demand risks (C7), product recovery risks (C8), etc.
Regarding internal risks category, includes those risks related to variability of internal organisational environment, i.e., controlled or preventive risk, and organisations requires internal efforts to manage such risks. The information technology risks, financial risks, supply risks, process risks, etc. falls under this category. While, risk caused by the unpredictability of external environment, i.e., uncontrolled or protective, composed of external risks category, and this category mainly includes government interference risks, social and environmental risks, demand risks, product recovery risks, etc. Additionally, a brief depiction of the risks related to GSC is provided in Table 1.
4 Fault-tree analysis
H.A. Watson (from Bell Laboratories, USA Air force) has initiated the model of FTA (Ericson, 1999). While, Boeing, a business organisation first construct a FTA model for achieving profitability in their business. Afterwards, the concept of FTA gained great recognition, for instance, being useful in assessing the failure causes in nuclear and chemical industry (Ericson, 1999; Gu et al., 2007). It entails detection and the determination of an instant/immediate source for the event, positioned on top (i.e., gate events or intermediary events). These intermediary or gate events occupy the sub-top positions in the fault-tree diagram, whilst on this basis; analyst can further identify their instant/immediate causes. This process repeats until one reaches the lowest level/basic events in fault-tree illustration, however, these basic events can be understood as root causes. While for connecting these root causes to the top-level events, the logic gates, i.e., the OR gates, AND gate, etc. are generally used. Additionally, using the OR gate, illustrates the occurrence of any one event in the lower level makes top event to occur; on the other side, using the AND gate, the top event will occur if and only if all events positioned at the lower level has already been occurred. However, in the present case, the occurrence of any one event (i.e., risk criteria and sub-criteria) at the lower level is sufficient to cause risk in GSC, so OR gate has been used as representation only.
Additionally, FTA allows both kinds of analysis, i.e., qualitative and quantitative (Gu et al., 2007). The qualitative approach for solving fault-tree diagram is conceded through the minimal path sets (Ayyub, 2003). While quantitative approach is conducted by calculating the probability of occurrence of low and intermediate level events (Wu et al., 2005).
In this research, initially a fault-tree is constructed using FTA analysis, and accordingly quantitative analysis is conducted for identified GSC risk causes and sub causes to evaluate them. The process of GSC risk analysis may be distorted due to human judgement, so, to overcome the issues, it is proposed to utilise fuzzy AHP approach.

An integrated methodology of FTA and fuzzy AHP for risk assessment 83
5 Fuzzy extended approach to AHP
Saaty in 1980 has introduced the methodology of the AHP. It is a multi-objective decision-making technique, which facilitates the decision-making by prioritising the criteria, and determines their relative importance of a system. Using the AHP method, individuals can handle the inconsistent attributes and human judgement-based criteria effectively (Saaty, 1980; Ishizaka and Labib, 2009; Shaw et al., 2013). Accordingly, various researchers and scholars have made use of the AHP approach for solving the different problem (Saaty and Forman, 1992; Wei et al., 2005; Vaidya and Kumar, 2006; Bhatti et al., 2010a; Madaan and Mangla, 2012). However, subjectivity and vagueness always inherent in human judgement decisions, and in this background, the AHP method is not a suitable choice (Qureshi et al., 2009a; Wang et al., 2012). Therefore, it is proposed to extend fuzzy set theory to AHP (i.e., fuzzy AHP) approach to ease the decision-making process under fuzzy environment (Gu and Zhu, 2006; Chan et al., 2008; Qureshi et al., 2009b; Bhatti et al., 2010b; Wang et al., 2012; Mangla et al., 2013c).
In this study, the fuzzy AHP approach has been used to determine the priorities and the relative importance of criteria and sub-criteria for risk analysis in GSC dimension, and further fuzzy numbers were used to transform the fuzzy judgements of decision-makers into exact numbers. Some essential basics of fuzzy AHP approach are given in the subsequent sections:
5.1 Application of fuzzy set theory
Zadeh (1965) describes the utility of fuzzy set theory in handling the imprecision due to uncertainty in information. Usefulness of fuzzy set theory that it considerably represents the uncertain data. In this theory, each number between 0 and 1 correspond to the fractional exactness to a fuzzy set, while crisp values refer to the binary logic [0, 1].
Let, ‘X’ a set of objects, whereas ‘x’ (x1, x2, x3, ………, xn) imply its generic element, then fuzzy set ‘A’ for the object set X is represented as {(x, μA(x)) | x ∈ X}, and the membership function for the set is symbolised by μA(x) (Dubois and Prade, 1979). The triangular membership function for any fuzzy number (a, b, c) can be mathematically expressed as in equation (1), where a ≤ b ≤ c. If P1 = (a, b, c) and P2 = (p, q, r) are two triangular fuzzy number, and both would be equal if and only if a = p, b = q, c = r.
0, ,
, [ , ],( )
, [ , ],
0, ,
A
x ax a x a bb aμ xx c x b cb c
x c
≤⎧⎪ −⎪ ∈⎪ −= ⎨ −⎪ ∈⎪ −⎪ >⎩
(1)
5.2 Construction of the hierarchical structure
Based on experts’ judgement, and using linguistic expressions, the pairwise evaluation matrix of all criteria and sub-criteria should be formed. In this way, an analyst can develop all matrices by collecting all pairwise comparisons from expert’s decisions and hence finalise the hierarchy.

84 S.K. Mangla et al.
5.3 Development of a fuzzy matrix
The entries in above-constructed pairwise matrices are replaced with corresponding positive fuzzy numbers, which are represented as A = [yij]r×s.
Additionally, the fuzzy positive matrix can be written as, yij = (aij, bij, cij), where fuzzy number satisfies the following:
i i i
ij ij ijj j j
1 1 1a , b , c ,a b c
= = =
where i and j = 1, 2, …………., n.
5.4 Calculation for finding fuzzy weights
For finding the relative importance of recognised criteria and sub-criteria, fuzzy weights need to be calculated, for this purpose, Chang’s extent analysis method has been applied. The details of some essential calculations of extent analysis method as described by Chang (1992), Chan et al. (2008) and Wang et al. (2012), is as following:
If i i i i
p1 2 3g g g gP , P , P , ........., P represents the extent analysis values for ith object, then its
fuzzy synthetic extent is presented as:
i i
p n pj ji g gj 1 i 1 j 1
S P P= = =
⎡ ⎤= × ⎢ ⎥⎣ ⎦∑ ∑ ∑ (2)
Further, to investigate the minimum and maximum fuzzy number value, the degree of possibility of two fuzzy numbers is given as:
( ) ( )1 21 2 p pV P P sup min μ (x), μ (y) ; x, y R, and x y≥ = ⎡ ⎤ ∈ ≥⎣ ⎦ (3)
Note that, if, x ≥ y and 1 2p pf (x) f (y) 1,= = then V(P1 ≥ P2) = 1. Since P1 and P2 are two convex fuzzy numbers, therefore:
( )1 2 1 2V P P 1 if p p≥ = ≥ (4)
( ) ( ) 12 1 1 2 pV P P hgt P P f (z)≥ = ∩ = (5)
While, ‘z’ can be viewed as the ordinate of the highest intersection point Z between 1 2p pμ , μ (see Figure 1), and further, Z is given as:
( ) ( )2 1 1 2V P P hgt P P (a r) / (q r) (b a)≥ = ∩ = − − − − (6)
Moreover, the degree of possibility for ‘k’ convex fuzzy numbers Pi (i = 1, 2, ………, k) is calculated as:
( ) ( ) ( ) ( )( )1 2 k 1 2 k
i
V P P , P , ........., P V P P and P P and ......... and P P
min V P P , i 1, 2, 3, ..............., k.
⎡ ⎤≥ = ≥ ≥ ≥⎣ ⎦= ≥ =
(7)
Assuming, i i kz (C ) min V(S S ),′ = ≥ for k = 1, 2, ……, n; k ≠ i; the weight vector is given as:

An integrated methodology of FTA and fuzzy AHP for risk assessment 85
( ) ( ) ( ) ( )( )T1 1 1 1W z C , C , C , ............, C′ ′= (8)
Upon normalisation, the normalised fuzzy weight vectors are given as below:
( ) ( ) ( ) ( )( )T1 1 1 1W z C , C , C , ............, C′= (9)
where while, ‘W’ is a non-fuzzy number and Ci (i = 1, 2, ……, n) are the elements.
Figure 1 Representation of intersection between P1 and P2
6 Proposed methodology
In this research, an integrated FTA-fuzzy AHP methodology for analysing and determining the relative importance of risks criteria and sub-criteria in GSC is proposed. The systematic procedure of applying the proposed methodology is as follows:
Step 1 Collect the relevant information about the goal and define the objective of study. To accomplish the ultimate objective, the intermediate levels in terms of causes and sub-causes or criteria and sub-criteria should be determined, and construct the fault-tree diagram to represent the outcomes. A team of minimum two experts is required to solve such decision problem.
Step 2 Design the survey instrument to gather the experts’ opinion about the criteria and sub-criteria. After determining the criteria and sub-criteria, the hierarchical structure corresponding to the objective of the study is constructed. Experts’ response would be significant in finalising the hierarchal structure.
Step 3 Form the pairwise comparison matrix for all criteria and sub-criteria and using fuzzy linguistic scale, the pairwise matrix entries is replaced with corresponding fuzzy numbers.
Step 4 Calculate the fuzzy weights for identified criteria and sub-criteria.

86 S.K. Mangla et al.
Step 5 Determine the relative importance of risk criteria and sub-criteria associated with the final objective.
Step 6 Analyse the performance of the system under study based on calculated criteria and sub-criteria fuzzy weights.
Figure 2 Flow diagram for proposed methodology (see online version for colours)
The Step 1 depicts the application of FTA method, and Steps 2 to 5 are based on fuzzy AHP method; while Step 6 is collectively based on both methods (for details refer Figure 2).
7 An illustration
A case of a plastic manufacturer in the northern region of India has been taken to illustrate the proposed methodology. The manufacturer produces plastic-based products viz. the kitchen frame and shelf, domestic usage items, restroom seat covers, etc. The global trend and competitions in the plastic sector proposes a great pressure to consider ecological influence in the supply chain planning process of the case industry, and offers enough opportunities for green and sustainable operations, such as reprocess, reuse, and recycling of plastic-based products (Plastic Europe, 2009).

An integrated methodology of FTA and fuzzy AHP for risk assessment 87
Figure 3 Fault-tree diagram to analyse risks for GSC under study (see online version for colours)
For investigation the case industry, a group of three experts is formed consists of planning manager, general manager and environmental representative. All experts are proficient in decision-making and actively involved in supply chain planning and management functions almost from the last five years. The managers of the case industry were facing some difficulties in managing green practices and further recognising a threat in form of several internal and external uncertain factors or events in greening the supply chain throughout the network. Consequently, there is continuous threat that the whole GSC may get affected, and may result into loss of business. To become proactive in identification of risks related to greening the supply chain activities, and managing their GSC under uncertain surrounds, case industry managers seek to build a strategic approach for good understanding of the root causes of risks in GSC. The managers are also concerned for determining the relative importance/priority of linked risk causes and factors, and further desire to make evaluation for risk assessment. The methodology given above is applied to the case industry and details of which is given below:
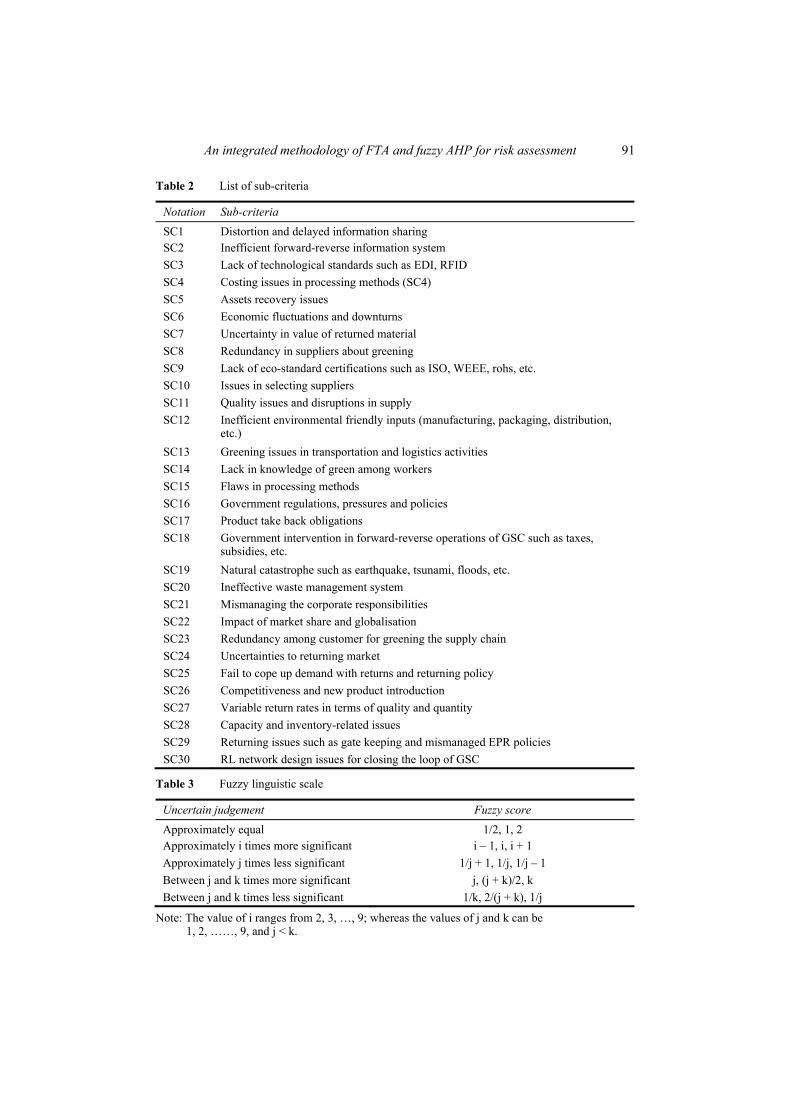
Step 1 Objective and goal of research is the assessment of risks in GSC (represented at top level) as shown in Figure 2. Based on relevant literature, eight risk criteria (C1 to C8) are identified under the two categories, i.e., internal and external categories. Further, in consultation with experts, a fault-tree diagram is constructed for the case GSC that depicts the recognised criteria (say, intermediate level elements) within these two categories (for details refer Figure 3). These intermediate level elements then further analysed to identify their instant causes (i.e., lower level elements or sub-criteria events), and in this way, 30 sub-criteria (SC1 to SC 30) events have been identified for the GSC under study, and are listed in Table 2.

88 S.K. Mangla et al.
Step 2 A survey instrument was designed for the case GSC, and the experts’ view for finalising the hierarchy was conducted, which is as shown in Figure 4.
Step 3 After interaction and consultation with experts, the pairwise comparison matrix for each risk criteria and sub-criteria was finalised; however, the respondent’s responses were recorded through fuzzy linguistic scale (see Table 3). Additionally, using triangular fuzzy number, the positive triangular fuzzy number-based pairwise judgement matrix for criteria is formed and shown as in the Table 4, and in same manner, pairwise judgement matrix is constructed for sub-criteria.
Step 4 The calculated fuzzy weights for identified criteria and sub-criteria using equations (2) to (8) are given in Table 5 and Table 6.
Step 5 Based on calculated fuzzy weights, the relative importance of risk criteria and sub-criteria for GSC risk assessment was prioritised and determined. The details of prioritisation can be understood from Table 5 and Table 6. Additionally, a graphic illustration of the fuzzy weights for the GSC risk criteria and relative fuzzy weights for sub-criteria is illustrated in Figure 5 and Figure 6, respectively.
Step 6 Finally, the overall behaviour and performance of the system based on fuzzy weights of criteria and sub-criteria (say the probability of their occurrence) was analysed. Nevertheless, the likelihood of GSC risks can be modelled as the total sum of probability, due to internal and external surroundings, while mathematically it described as:
P(Risks in GSC) P(Risks due to internal surroundings)P(Risks due to external surroundings);
=+
P(Risks due to internal surroundings) P(risks in GSC due to informationtechnology risks) P(risks in GSC due to financial risks)
P(risks in GSC due to supply risks)P(risks in GSC due to process risks
⇒ =+
++ ).
Moreover, P (External risks in GSC) = P (risks in GSC due to government interference risks) + P (risks in GSC due to social and environmental risks) + P (risks in GSC due to demand risks) + P (risks in GSC due to product recovery risks).
From, calculated fuzzy weights, it is inferred that the probability of occurrence of risk in GSC is found to be more due to internal risks than external risks (as P (Risks due to internal surroundings) equals to 0.536 and P (Risks due to external surroundings) is equal to 0.464).
Additionally, the overall likelihood of the system may also be modelled in term of any risk criteria by applying the condition of knowing the probability of occurrence of that particular criterion, more clearly using P (risks in GSC due to Process risks):

An integrated methodology of FTA and fuzzy AHP for risk assessment 89
P (risks in GSC due to process risks) = 0.154 × P (Risks in GSC), While, P (risks in GSC due to process risks) can be estimated from the constructed fault-tree diagram.
Figure 4 Hierarchical structure for analysing the risks in GSC under study (see online version for colours)

90 S.K. Mangla et al.
Figure 5 Illustration of fuzzy weights for risk criteria (see online version for colours)
Figure 6 Illustration of relative fuzzy weights for risk sub-criteria (see online version for colours)
An integrated methodology of FTA and fuzzy AHP for risk assessment 91
Table 2 List of sub-criteria
Notation Sub-criteria SC1 Distortion and delayed information sharing SC2 Inefficient forward-reverse information system SC3 Lack of technological standards such as EDI, RFID SC4 Costing issues in processing methods (SC4) SC5 Assets recovery issues SC6 Economic fluctuations and downturns SC7 Uncertainty in value of returned material SC8 Redundancy in suppliers about greening SC9 Lack of eco-standard certifications such as ISO, WEEE, rohs, etc. SC10 Issues in selecting suppliers SC11 Quality issues and disruptions in supply SC12 Inefficient environmental friendly inputs (manufacturing, packaging, distribution,
etc.) SC13 Greening issues in transportation and logistics activities SC14 Lack in knowledge of green among workers SC15 Flaws in processing methods SC16 Government regulations, pressures and policies SC17 Product take back obligations SC18 Government intervention in forward-reverse operations of GSC such as taxes,
subsidies, etc. SC19 Natural catastrophe such as earthquake, tsunami, floods, etc. SC20 Ineffective waste management system SC21 Mismanaging the corporate responsibilities SC22 Impact of market share and globalisation SC23 Redundancy among customer for greening the supply chain SC24 Uncertainties to returning market SC25 Fail to cope up demand with returns and returning policy SC26 Competitiveness and new product introduction SC27 Variable return rates in terms of quality and quantity SC28 Capacity and inventory-related issues SC29 Returning issues such as gate keeping and mismanaged EPR policies SC30 RL network design issues for closing the loop of GSC
Table 3 Fuzzy linguistic scale
Uncertain judgement Fuzzy score
Approximately equal 1/2, 1, 2 Approximately i times more significant i – 1, i, i + 1 Approximately j times less significant 1/j + 1, 1/j, 1/j – 1 Between j and k times more significant j, (j + k)/2, k Between j and k times less significant 1/k, 2/(j + k), 1/j
Note: The value of i ranges from 2, 3, …, 9; whereas the values of j and k can be 1, 2, ……, 9, and j < k.

92 S.K. Mangla et al.
Table 4 Positive triangular fuzzy number-based pairwise judgement matrix
C1 C2 C3 C4
C1 1, 1, 1 1, 2, 3 3, 7/2, 4 1/3, 1/2, 1 C2 1/3, 1/2, 1 1, 1, 1 1, 2, 3 3, 7/2, 4 C3 1/4, 2/7, 1/3 1/3, 1/2, 1 1, 1, 1 1/3, 2/5, 1/2 C4 1, 2, 3 1/4, 2/7, 1/3 2, 5/2, 3 1, 1, 1 C5 1, 2, 3 2, 5/2, 3 1/5, 1/4, 1/3 1/4, 1/3, 1/2 C6 1/3, 1/2, 1 1, 2, 3 1/3, 2/5, 1/2 1/4, 2/7, 1/3 C7 3, 7/2, 4 1/3, 1/2, 1 1/4, 1/3, 1/2 1/3, 1/2, 1 C8 3, 7/2, 4 1/4, 2/7, 1/3 1, 2, 3 3, 7/2, 4
C5 C6 C7 C8
C1 1/3, 1/2, 1 1, 2, 3 1/4, 2/7, 1/3 1/4, 2/7, 1/3 C2 1/3, 2/5, 1/2 1/3, 1/2, 1 1, 2, 3 3, 7/2, 4 C3 3, 4, 5 2, 5/2, 3 2, 3, 4 1/3, 1/2, 1 C4 2, 3, 4 3, 7/2, 4 1, 2, 3 1/4, 2/7, 1/3 C5 1, 1, 1 1, 2, 3 1/4, 2/7, 1/3 1/2, 1, 2 C6 1/3, 1/2, 1 1, 1, 1 3, 7/2, 4 1/3, 2/5, 1/2 C7 3, 7/2, 4 1/4, 2/7, 1/3 1, 1, 1 2, 3, 4 C8 2, 5/2, 3 2, 5/2, 3 1/4, 1/3, 1/2 1, 1, 1
Notes: Information technology risks (C1), financial risks (C2), supply risks (C3), process risks (C4), government interference risks (C5), social and environmental risks (C6), demand risks (C7), product recovery risks (C8).
Table 5 Summarising priorities for risk criteria
Risk criteria C1 C2 C3 C4 C5 C6 C7 C8 Fuzzy weights 0.103 0.145 0.134 0.154 0.099 0.077 0.134 0.154 Priorities/relative importance
IV II III I V VI III I
Table 6 Summarising priorities for risk sub-criteria
Risks criteria Risks sub-criteria Relative fuzzy weights Priorities/relative importance
Information technology risks (C1)
SC1 0.323 II SC2 0.245 II SC3 0.431 I
Financial risks (C2)
SC4 0.262 II SC5 0.114 IV SC6 0.243 III SC7 0.380 I
Supply risks (C3)
SC8 0.043 III SC9 0.379 II SC10 0.027 IV SC11 0.549 I

An integrated methodology of FTA and fuzzy AHP for risk assessment 93
Table 6 Summarising priorities for risk sub-criteria (continued)
Risks criteria Risks sub-criteria Relative fuzzy weights Priorities/relative importance Process risks (C4)
SC12 0.167 IV SC1 3 0.171 III SC14 0.242 II SC15 0.418 I
Government interference risks (C5)
SC16 0.280 II SC17 0.292 III SC18 0.427 I
Social and environmental risks (C6)
SC119 0.220 II SC20 0.158 III SC21 0.107 IV SC22 0.513 I
Demand risks (C7)
SC23 0.174 III SC24 0.313 I SC25 0.20 II SC26 0.313 I
Product recovery risks (C8)
SC27 0.176 IV SC28 0.255 II SC29 0.245 III SC30 0.323 I
8 Discussion and implications for managers
The priority wise preference order of identified eight risk criteria is given as C8 = C4 > C2 > C7 = C3 > C1 > C5 > C6. The fuzzy AHP-based prioritisation, determination of relative importance of criteria and sub-criteria for risk assessment for the case industry offers several appealing findings, and accordingly several managerial insights are being offered. The important managerial insights are product recovery risks (C8), and process risks (C4) have the highest and the almost equal probability of occurrence in GSC as their fuzzy weights are equal in value (i.e., 0.154). It means both kinds of risks hold equivalent relative importance in respect to other criteria. Therefore, it is suggested to the managers, they should consider the green processing and operations issues while transforming raw material into final products. An adequate knowledge and understanding of green methodology in terms of techniques and methods to be employed to process a green product is crucial for effective GSCM (Paulraj, 2009; Holt and Ghobadian, 2009), and to enhance this, it is recommended that the employees should be motivated and educated regarding the effective green adoption (Mathiyazhagan et al., 2013). Besides, the issues of product returning and the green recovery of used products for further reprocessing should be focused to make GSC less susceptible (Mangla et al., 2013a).
While, the financial risks (C2) holds second position and priority with respect to other criteria (its fuzzy weights is equal to 0.145), it should be noticeably focused to enhance

94 S.K. Mangla et al.
the overall performance. Aligned with the previous studies, financial concerns are crucial for GSCM adoption (Orsato, 2006; Mudgal et al., 2010). Further, study findings indicate that the demand risk (C7) and supply risks (C3) in GSC also acquire equivalent priority and relative importance in respect to other criteria as fuzzy weights for both equals to 0.134. Considering this, the firm case GSC managers must crosscheck issues such as supplier’s behaviour, competitiveness in market and customer knowledge regarding green to lower these risks in greening the supply chain. As understanding and green education of supplier and customer provides useful means to resolve, the demand and supply issues in GSC dimension and hence managers should pay attention to both kinds of risks for making the GSC more robust and improvement in overall performance (Lippmann, 1999; Hall, 2001; Mathiyazhagan et al., 2013).
Next, the information technology risk (C1) occupies the fourth position, among risk criteria (its fuzzy weights is equal to 0.103), and it should be noted that an effective and efficient information system is key to success in managing green issues in forward and reverse operations in GSC (Wee and Quazi, 2005). Therefore, the managers should put more efforts to improve their information network design, such as sharing and flow of information, etc. to improve the overall performance.
Finally, the government interference risks (C5), and social and environmental risks (C6) criteria occupy the fifth and sixth positions respectively, having fuzzy weights 0.099 and 0.077. It depicts the role of government intervention in terms of various legislative pressures, regulations and policies in implementing green practices is significant to improve the ecological image. Notably, the government of any nation declares environmental rules and guidelines for a corporation. The stated governmental environmental policies should be strict enough to enforce or encourage organisations for effective GSCM practices (Zhu and Sarkis, 2006). Strict penalty and rewards system might be offered by the regulating authorities to improve environmental performance of the organisational GSCs. Additionally, it is quite useful to have top management commitment and responsiveness for the organisation to an effective GSCM concept in reduction in waste and emissions, protect resources and becomes social responsible. While, the natural disaster can be struck anytime and have probability to disrupt the GSC.
9 Conclusions and avenues for future research
This research presents a structural framework for understanding the concept of risk in GSC network design. Through this study, authors attempt to fill the gap in GSCM dimension by illustrating the identification, understanding, and assessment of risk in GSC.
The present study proposes an operational model for risks analysis in GSC. Further, the proposed integrated FTA-fuzzy AHP methodology provides means to integrate the qualitative and quantitative group decision-making for assessing risks in GSC, which is surrounds by fuzzy segmentation. Additionally, the proposed methodology contribution is two-fold: initially, the fault-tree diagram provides a framework for systematic qualitative and quantitative analysis for resolving an undesired top event (GSC risks assessment) into causes (criteria) and sub-causes (sub-criteria) and later, fuzzy AHP helps in determining the relative priorities of identified risk criteria and sub-criteria in GSC.
The study findings depict that eight risk criteria (C1 to C8) and 30 sub-criteria (SC1 to SC30) were analysed for risk assessment using an industrial case study. The product

An integrated methodology of FTA and fuzzy AHP for risk assessment 95
recovery risks (C8) and process risks (C4) criteria possess the highest likelihood in comparison to other risk criteria and therefore, both requires more attention in comparison to others.
Although the present research intends to develop a novel integrated methodology of FTA-fuzzy AHP for proposing a risk evaluation framework in the GSC dimension, but still there are certain limitations. As a committee of only three experts were formed while exploring firm GSCM case, future research might increase the number of experts in committee and may well follow a questionnaire survey. Additionally, FTA focuses only on one top event at a time, which means an entire tree needs to be generated for each top event. Thus, this approach becomes complex when trying to assess a multifaceted product which includes multiple failures. Therefore, future work may be conducted by using any of other risk analysis techniques, such as, FMEA, QFD, etc. to overcoming the limitation of FTA method.
Nonetheless, complexity in the selection of criteria and sub-criteria might be the challenge for the perspective of future research. Additionally, the fuzzy AHP method to prioritise risk criteria and sub-criteria for GSC risk assessment is used in this study, future research can be conducted via utilising the analytic network process (ANP) method, which also considers the interrelationships between the considered risk criteria and sub-criteria.
Finally, the present study provides an opportunity to the case industry to manage risks in GSC and certainly, the findings of this study would be significant for enhancing the overall performance of the case industry.
References Adler, J. (2006) ‘Going green’, Newsweek, 17 July, pp.42–52 [online] http://www.msnbc.msn.com
(accessed August 2013). Albino, V., Balice, A. and Dangelico, R.M. (2009) ‘Environmental strategies and green product
development: an overview on sustainability-driven companies’, Business Strategy and the Environment, Vol. 18, No. 2, pp.83–96.
Atasu, A., van Wassenhove, L.N. and Sarvary, M. (2009) ‘Efficient take-back legislation’, Production and Operations Management, Vol. 18, No. 3, pp.243–258.
Ayyub, B.M. (2003) Chapter 2, Risk Analysis in Engineering and Economics, pp.33–113, Chapman & Hall/CRC, New York, NY.
Beamon, B.M. (2005) ‘Environmental and sustainability ethics in supply chain management’, Science and Engineering Ethics, Vol. 11, No. 2, pp.221–234.
Bhatti, R.S., Kumar, P. and Kumar, D. (2010a) ‘Analytical modeling of third party service provider selection in lead logistics provider environments’, Journal of Modelling in Management, Vol. 5 No. 3, pp.275–286.
Bhatti, R.S., Kumar, P. and Kumar, D. (2010b) A Fuzzy AHP Model for 3PL Selection in Lead Logistics Provider Scenarios, Chapter 18 of Enterprise Information Systems and Implementing IT Infrastructures: Challenges and Issues, IGI Global Publications, Hershey, Pennsylvania, USA, ISBN: 978-1-61520-625-4.
Chan, F.T.S., Kumar, N., Tiwari, M.K., Lau, H.C.W. and Choy, K.L. (2008) ‘Global supplier selection: a fuzzy-AHP approach’, International Journal of Production Research, Vol. 46, No. 14, pp.3825–3857.
Chang, D.Y. (1992) ‘Extent analysis and synthetic decision’, Optimization Techniques and Applications, Vol. 1, No. 1, pp.352–355.

96 S.K. Mangla et al.
Chang, Y.H., Yeh, C.H. and Cheng, J.H. (1998) ‘Decision support for bus operations under uncertainty: a fuzzy expert system approach’, Omega, International Journal of Management Science, Vol. 26, No. 3, pp.367–380.
Chaudhuri, A., Mohanty, B.K. and Singh, K.N. (2013) ‘Supply chain risk assessment during new product development: a group decision making approach using numeric and linguistic data’, International Journal of Production Research, Vol. 51, No. 10, pp.2790–2804.
Chopra, S. and Sodhi, M. (2004) ‘Managing risk to avoid supply chain breakdown’, Sloan Management Review, Vol. 46, No. 1, pp.53–62.
Cruz, J. and Matsypura, D. (2009) ‘Supply chain networks with corporate social responsibility through integrated environmental decision-making’, International Journal of Production Research, Vol. 47, No. 3, pp.621–648.
Dan-Li, D., Ju, Q. and Hong-Yan, Z. (2011) ‘Risk assessment study of manufacturing green supply chain based on grey theory’, in Proceedings of the Information Systems for Crisis Response and Management (ISCRAM), China, pp.234–240.
Dubois, D. and Prade, H. (1979) ‘Fuzzy real algebra: some results’, Fuzzy Sets Systems, Vol. 2, No. 4, pp.327–349.
Ericson, C. (1999) ‘Fault tree analysis: a history’, in Proceedings of the 17th International System Safety Conference, International System Safety Society, Orlando, FL, pp.1–9.
Green, K., Morton, B. and New, S. (1998) ‘Green purchasing and supply policies: do they improve companies’ environmental performance’, Supply Chain Management: An International Journal, Vol. 3, No. 2, pp.89–95.
Gu, L., Liu, X.D. and Yan, H.Q. (2007) ‘Application of fault tree to risk assessment of fire and explosion at oil-fuel depot’, Environmental Science & Technology, Vol. 30, No. 6, pp.52–54.
Gu, X. and Zhu, Q. (2006) ‘Fuzzy multi-attribute decision-making method based on eigenvector of fuzzy attribute evaluation space’, Decision Support Systems, Vol. 41, No. 2, pp.400–410.
Hall, J. (2001) ‘Environmental supply chain innovation’, Greener Management International, Vol. 35, pp.105–119.
Hervani, A.A., Helms, M.M. and Sarkis, J. (2005) ‘Performance measurement for green supply chain management’, Benchmarking: An International Journal, Vol. 12, No. 4, pp.330–353.
Holt, D. and Ghobadian, A. (2009) ‘An empirical study of green supply chain management practices amongst UK manufacturers’, Journal of Manufacturing Technology Management, Vol. 20, No. 7, pp.933–956.
Hu, A.H., Hsu, C.W., Kuo, T.C. and Wu, W.C. (2009) ‘Risk evaluation of green components to hazardous substance using FMEA and FAHP’, Expert Systems with Applications, Vol. 36, No. 3, pp.7142–7147.
Ishizaka, A. and Labib, A. (2009) ‘Analytic hierarchy process and expert choice: benefits and limitations’, OR Insight, Vol. 22, No. 4, pp.201–220.
Jose, P.D. (2008) ‘Getting serious about green’, Real CIO World, Vol. 3, No. 8, pp.26–28. Khan, F.I. and Abbasi, S.A. (1998) ‘Techniques and methodologies for risk analysis in chemical
process industries’, Journal of Loss Prevention in the Process Industries, Vol. 11, No. 4, pp.261–277.
Lee, W., Grosh, D., Tilman, F. and Lie, C. (1985) ‘Fault tree analysis, methods, and applications – a review’, IEEE Transactions on Reliability, Vol. 34, No. 3, pp.194–203.
Lindhea, A., Rosen, L., Norberg, T. and Bergstedt, O. (2009) ‘Fault tree analysis for integrated and probabilistic risk analysis of drinking water systems’, Water Research, Vol. 43, No. 6, pp.1641–1653.
Lippmann, S. (1999) ‘Supply chain environmental management: elements of success’, Corp. Environ. Strategy, Vol. 6, No. 2, pp.175–182.
Luthra, S., Kumar, V., Kumar, S. and Haleem, A. (2011) ‘Barriers to implement green supply chain management in automobile industry using interpretive structural modeling technique an Indian perspective’, Journal of Industrial Engineering and Management, Vol. 4, No. 2, pp.231–257.

An integrated methodology of FTA and fuzzy AHP for risk assessment 97
Madaan, J. and Mangla, S. (2012) ‘Environmental pressure driven flexible green supply chain: a decision modeling perspective’, in Proceedings of GLOGIFT 12, University of Vienna, Austria, 30 July–1 August, pp.1–18.
Mangla, S., Madaan, J., Sarma, P.R.S. and Gupta, M.P. (2014a) ‘Multi-objective decision modeling using interpretive structural modeling (ISM) for green supply chains’, International Journal of Logistics Systems and Management, Vol. 17, No. 2, pp.125–142.
Mangla, S., Kumar, P. and Barua, M.K. (2014b) ‘An evaluation of attribute for improving the green supply chain performance via DEMATEL method’, International Journal of Mechanical Engineering & Robotics Research Special Issue on ‘Recent Advances in Mechanical Engineering’ – RAME, Vol. 1, No. 1, pp.30–35.
Mangla, S.K., Kumar, P. and Barua, M.K. (2014c) ‘Flexible decision approach for analysing performance of sustainable supply chains under risks/uncertainty’, Global Journal of Flexible Systems Management, DOI 10.1007/s40171-014-0059-8.
Mangla, S., Madaan, J. and Chan, F.T.S. (2012) ‘Analysis of performance focused variables for multi-objective decision modeling approach of flexible product recovery systems’, Global Journal of Flexible Systems Management, Vol. 13, No. 2, pp.77–86.
Mangla, S., Madaan, J. and Chan, F.T.S. (2013a) ‘Analysis of flexible decision strategies for sustainability-focused green product recovery system’, International Journal of Production Research, Vol. 51, No. 11, pp.3428–3442.
Mangla, S., Madaan, J., Sarma, P.R.S. and Gupta, M.P. (2013b) ‘Multi-objective decision modeling using interpretive structural modeling (ISM) for green supply chains,’ International Journal of Logistics Systems and Management, in press.
Mangla, S.K., Kumar, P. and Barua, M.K. (2013c) ‘Flexible decision modeling for evaluating green supply chain risks using fuzzy AHP methodology’, in Proceedings of GLOGIFT 13, 13 December–15 December, IIT Delhi, India, pp.575–583.
Mathiyazhagan, K., Govindan, K., Noorul Haq, A. and Geng, Y. (2013) ‘An ISM approach for the barrier analysis in implementing green supply chain management’, Journal of Cleaner Production, Vol. 47, pp.283–297.
Miller, K.D. (1992) ‘A framework for integrated risk management in international business’, Journal of International Business Studies, Vol. 23, No. 2, pp.311–331.
Mitra, S. and Webster, S. (2008) ‘Competition in remanufacturing and the effects of government subsidies’, International Journal of Production Economics, Vol. 111, No. 2, pp.287–298.
Mudgal, R.K., Shankar, R., Talib, P. and Raj, T. (2010) ‘Modeling the barriers of green supply chain practices: an Indian perspective’, International Journal of Logistics Systems and Management, Vol. 7, No. 1, pp.81–107.
Orsato, R. (2006) ‘Competitive environmental strategies: when does it pay to be green’, California Management Review, Vol. 48, No. 2, pp.127–143.
Paulraj, A. (2009) ‘Environmental motivations: a classification scheme and its impact on environmental strategies and practices’, Business Strategy and the Environment, Vol. 18, No. 7, pp.453–468.
Plastic Europe (2009) ‘The compelling facts about plastics 2009, an analysis of European plastics production, demand and recovery for 2008’, Plastic Europe [online] http://www.plasticseurope.org (accessed August 2013).
Porter, M.E. and van der Linde, C. (1995) ‘Green and competitive: ending the stalemate’, Harvard Business Review, Vol. 73, No. 5, pp.20–34.
Qianlei, L. (2012) ‘The study on the risk management of agricultural products green supply chain based on systematic analysis’, in Proceedings of the Business Computing and Global Informatization (BCGIN), Second International Conference, Shanghai, China, pp.250–253.
Qureshi, M.N., Kumar, P. and Kumar, D. (2009a) ‘Selection of 3PL service providers: a combined approach of AHP and graph theory’, International Journal of Services Technology and Management, Vol. 12, No. 1, pp.35–60.

98 S.K. Mangla et al.
Qureshi, M.N., Kumar, P. and Kumar, D. (2009b) ‘Framework for benchmarking logistics performance using fuzzy AHP’, International Journal of Business Performance and Supply Chain Modelling, Vol. 1, No. 1, pp.82–98.
Radivojević, G. and Gajović, V. (2013) ‘Supply chain risk modeling by AHP and fuzzy AHP methods’, Journal of Risk Research, DOI:10.1080/13669877.2013.808689.
Raharjoa, H., Brombacher, A.C. and Xie, M. (2008) ‘Dealing with subjectivity in early product design phase: a systematic approach to exploit quality function deployment potentials’, Computers & Industrial Engineering, Vol. 55, No. 1, pp.253–278.
Rao, P. and Holt, D. (2005) ‘Do green supply chains lead to competitiveness and economic performance?’, International Journal of Operations & Production Management, Vol. 25, No. 9, pp.898–916.
Ruimin, M., Yao, L. and Huang, R. (2012) ‘The green supply chain management risk analysis’, Advanced Materials Research, Vols. 573–574, pp.734–739.
Saaty, T. and Forman, E. (1992) The Hierarchon: A Dictionary of Hierarchies, RWS Publications, Pittsburgh.
Saaty, T.L. (1980) The Analytic Hierarchy Process, McGraw-Hill, New York. Samvedi, A. and Jain, V. (2013) ‘A study on the interactions between supply chain risk
management criteria using fuzzy DEMATEL method’, International Journal of Operational Research, Vol. 18, No. 3, pp.255–271.
Sarkis, J. (2003) ‘A strategic framework for green supply chain management’, Journal of Cleaner Production, Vol. 11, No. 4, pp.397–409.
Sarkis, J. (2006) Greening the Supply Chain, Springer-Verlag, London. Shaw, K., Shankar, R., Yadav, S.S. and Thakur, L.S. (2013) ‘Global supplier selection considering
sustainability and carbon footprint issue: AHP multi-objective fuzzy linear programming approach’, International Journal of Operational Research, Vol. 17, No. 2, pp.215–247.
Sheu, J.B. (2011) ‘Bargaining framework for competitive green supply chains under governmental financial intervention’, Transportation Research Part E, Vol. 47, No. 5, pp.573–592.
Siegel, D. (2009) ‘Green management matters only if it yields more green: an economic/strategic perspective’, The Academy of Management Perspectives, Vol. 23, No. 3, pp.5–16.
Srivastava, S.K. (2007) ‘Green supply-chain management: a state-of-the-art literature review’, International Journal of Management Reviews, Vol. 9, No. 1, pp.53–80.
Tseng, M.L., Lin, Y.H. and Chiu, A.S.F. (2009) ‘FAHP based study of cleaner production implementation in PCB manufacturing firms, Taiwan’, Journal of Cleaner Production, Vol. 17, No. 14, pp.1249–1256.
Vachon, S. and Klassen, R.D. (2006) ‘Extending green practices across the supply chain: the impact of upstream and downstream integration’, International Journal of Operations and Production Management, Vol. 26, No. 7, pp.795–821.
Vaidya, O.S. and Kumar, S. (2006) ‘Analytic hierarchy process: an overview of applications’, European Journal of Operational Research, Vol. 169, No. 1, pp.1–29.
Vesely, W.E., Goldberg, F.F., Roberts, N.H. and Haasi, D.F. (1981) The Fault Tree Handbook, NUREG 0492, US Government Printing Office, Washington, DC.
Wang, X., Chan, H.K., Yee, R.W.Y. and Diaz-Rainey, I. (2012) ‘A two-stage fuzzy-AHP model for risk assessment of implementing green initiatives in the fashion supply chain’, International Journal of Production Economics, Vol. 135, No. 2, pp.595–606.
Wee, Y.S. and Quazi, H.A. (2005) ‘Development and validation of critical factors of environmental management’, Industrial Management & Data Systems, Vol. 105, No. 1, pp.96–114.
Wei, C.C., Chien, C.F. and Wang, M.J. (2005) ‘An AHP-based approach to ERP system selection’, International Journal of Production Economic, Vol. 96, No. 1, pp.47–62.
Wu, A.Y., Wang, C.L. and Xiao, G.Q. (2005) ‘Application of fault tree analysis in casualty of building fire’, China Safety Science Journal, Vol. 15, No. 5, pp.92–95.

An integrated methodology of FTA and fuzzy AHP for risk assessment 99
Xu, L., Mathiyazhagan, K., Govindan, K., Noorul Haq, A., Ramachandrand, N.V. and Ashokkumar, A. (2013) ‘Multiple comparative studies of green supply chain management: pressures analysis’, Resources, Conservation and Recycling, Vol. 78, pp.26–35.
Yang, Z.K. and Li, J. (2010) ‘Assessment of green supply chain risk based on circular economy’, in Proceedings of the Industrial Engineering and Engineering Management (IE&EM), IEEE 17Th International Conference, Xiamen, pp.1276–1280.
Zadeh, L.A. (1965) ‘Fuzzy sets’, Information and Control, Vol. 8, No. 3, pp.338–352. Zhu, Q. and Sarkis, J. (2006) ‘An inter-sectoral comparison of green supply chain management in
China: drivers and practices’, Journal of Cleaner Production, Vol. 14, No. 5, pp.472–486. Zhu, Q., Sarkis, J. and Lai, K.H. (2007) ‘Green supply chain management: pressures, practices and
performance within the Chinese automobile industry’, Journal of Cleaner Production, Vol. 15, No. 11, pp.1041–1052.
Zhu, Q., Sarkis, J. and Lai, K.H. (2008) ‘Green supply chain management implications for closing the loop’, Transportation Research Part E: Logistics and Transportation Review, Vol. 44, No. 1, pp.1–18.
Zou, P.X.W. and Couani, P. (2012) ‘Managing risks in green building supply chain’, Architectural Engineering and Design Management, Vol. 8, No. 2, pp.143–158.