USE OF THE FUZZY AHP - MABAC HYBRID MODEL IN RANKING · 707 Božani ć, D., et al., Use of the...
25
705 Božani ć, D., et al., Use of the fuzzy AHP - MABAC hybrid model in ranking potential locations for preparing laying- up positions pp. 705–729 USE OF THE FUZZY AHP - MABAC HYBRID MODEL IN RANKING POTENTIAL LOCATIONS FOR PREPARING LAYING-UP POSITIONS Darko I. Božanić a , Dragan S. Pamučar b , Samed M. Karović c University of Defence in Belgrade, Military Academy, Belgrade, Republic of Serbia a e-mail: [email protected], ORCID iD: http://orcid.org/0000-0002-9657-0889, b e-mail: [email protected], ORCID iD: http://orcid.org/0000-0001-8522-1942 c e-mail: [email protected], ORCID iD: http://orcid.org/0000-0001-5470-4650 DOI: 10.5937/vojtehg64-9261 FIELD: Mathematics, Operations Research ARTICLE TYPE: Original Scientific Paper ARTICLE LANGUAGE: English Summary: The paper proposes a hybrid model, FAHP-MABAC. The fuzzyficated Saaty's scale with the AHP method (FAHP) is used for defining the weight coefficients of criteria. The MABAC method is applied in evaluating and ranking the alternatives. This hybrid model is developed in order to support decision making while selecting locations for the preparation of laying-up positions (facilities intended for concealment, protection and maneuvering of military ships). Key words: location selecton, fuzzy AHP, MABAC. Introduction The decision making process is usually followed by a large number of uncertainties. This is particularly characteristic of combat operations involving different units and different types of modern military equipment. Therefore, the development of a decision making model has an important role in the operational planning process. This paper presents a hybrid model using the fuzzyficated Saaty’s scale, the analytic hierarchy process method (FAHP) and the MABAC (Multi-Attributive Border Approximation area Comparison) method - the FAHP-MABAC model. Herein are briefly explained the methods used, with a more detailed elaboration of the fuzzyfication of Saaty’s scale and the MABAC method. The hybrid FAHP-MABAC model is made in order to support decision making while choosing the location for the development of laying-up positions.
Transcript of USE OF THE FUZZY AHP - MABAC HYBRID MODEL IN RANKING · 707 Božani ć, D., et al., Use of the...

705
Boža
nić,
D.,
et a
l., U
se o
f the
fuzz
y AH
P - M
ABAC
hyb
rid m
odel
in ra
nkin
g po
tent
ial lo
catio
ns fo
r pre
parin
g la
ying-
up p
ositio
ns p
p. 7
05–7
29
USE OF THE FUZZY AHP - MABAC HYBRID MODEL IN RANKING POTENTIAL LOCATIONS FOR PREPARING LAYING-UP POSITIONS Darko I. Božanića, Dragan S. Pamučarb, Samed M. Karovićc University of Defence in Belgrade, Military Academy, Belgrade, Republic of Serbia a e-mail: [email protected], ORCID iD: http://orcid.org/0000-0002-9657-0889, b e-mail: [email protected], ORCID iD: http://orcid.org/0000-0001-8522-1942 c e-mail: [email protected], ORCID iD: http://orcid.org/0000-0001-5470-4650
DOI: 10.5937/vojtehg64-9261 FIELD: Mathematics, Operations Research ARTICLE TYPE: Original Scientific Paper ARTICLE LANGUAGE: English Summary:
The paper proposes a hybrid model, FAHP-MABAC. The fuzzyficated Saaty's scale with the AHP method (FAHP) is used for defining the weight coefficients of criteria. The MABAC method is applied in evaluating and ranking the alternatives. This hybrid model is developed in order to support decision making while selecting locations for the preparation of laying-up positions (facilities intended for concealment, protection and maneuvering of military ships). Key words: location selecton, fuzzy AHP, MABAC.
Introduction The decision making process is usually followed by a large number
of uncertainties. This is particularly characteristic of combat operations involving different units and different types of modern military equipment. Therefore, the development of a decision making model has an important role in the operational planning process.
This paper presents a hybrid model using the fuzzyficated Saaty’s scale, the analytic hierarchy process method (FAHP) and the MABAC (Multi-Attributive Border Approximation area Comparison) method - the FAHP-MABAC model. Herein are briefly explained the methods used, with a more detailed elaboration of the fuzzyfication of Saaty’s scale and the MABAC method. The hybrid FAHP-MABAC model is made in order to support decision making while choosing the location for the development of laying-up positions.

706
VOJN
OTE
HN
IČK
I GLA
SN
IK /
MIL
ITA
RY
TE
CH
NIC
AL
CO
UR
IER
, 201
6., V
ol 6
4, N
o 3 Problem description
During the preparation of combat operations, various kinds of masking are carried out in order to protect forces and resources from enemy's surveillance and effects. This term is defined in the literature in different ways, but essentially it refers to the same or similar activities. The most general definition is provided in the Military Lexicon (Vojni leksikon, 1981, p.275), where the term masking refers to "a set of measures and procedures used to conceal the intentions of one’s own forces, movements and placements of combat and other means and the facilities from the enemy's surveillance from land, sea, air and cosmic space, achieving a surprise effect and deceiving the enemy." In other words, by means of masking, the enemy is misled into erroneous conclusions, decisions and actions (Milosavljević, 1985, p.129). This is accomplished in several ways- by hiding, concealment or deception (Rkman, 1984, pp.21-26).
A large number of war experiences speaks in favor of the importance of including masking in combat operations. In this regard, the Vietnam War (1954-1975) is extremely impressive. Also, the experience from the wars in the former Yugoslavia, and especially the NATO bombing of Yugoslavia in 1999, demonstrated how even small-scale masking protection techniques in the era of electronic means for surveillance can result in the reduction or even avoidance of losses.
One of the elements of masking is the development of laying-up positions. These are "arranged parts of the coast that provide concealment, a partial degree of protection and quick maneuver of river flotilla forces" (Vojni leksikon, 1981, p.276), i.e. military ships. In accordance with the general purpose of masking, the main objective of construction of laying-up positions is leading the enemy to erroneous conclusions, decisions and actions related to the deployment of our military ships (Bozanić et al., 2015a).
The literature generally describes a part of criteria that a location of laying-up positions should meet. However, their precise definition, weight values and relationships are missing. Therefore, the decisions made on this problem rely on the knowledge and experience of decision makers (DM) and their associates. Such a situation represents a field for the application of multiple criteria methods.
Description of the methods used in the hybrid FAHP-MABAC model The described model is based on the knowledge of several decision-
making methods (areas), fuzzy logic, the AHP method (Saaty's scale) and the MABAC method. Fuzzy logic covers successfully vagueness and

707
Boža
nić,
D.,
et a
l., U
se o
f the
fuzz
y AH
P - M
ABAC
hyb
rid m
odel
in ra
nkin
g po
tent
ial lo
catio
ns fo
r pre
parin
g la
ying-
up p
ositio
ns p
p. 7
05–7
29
uncertainty that are often present in decision-supporting models. The Saaty's scale, which is an indispensable part of the AHP method, shows good results in the criteria weight coefficients defining, and it is increasingly applied with other methods (Ertuğrul, Karakaşoğlu, 2009), (Das, et al., 2012), (Beikkhakhian, et al. , 2015), (Zhu, et al., 2015), (Sara, et al., 2015), (Kazan, et al. 2015), (Knežević, et al., 2015). The MABAC method provides stable (consistent) solutions and it represents a reliable tool for rational decision-making (Pamučar, Ćirović, 2015).
Fuzzy logic and fuzzy sets In fuzzy logic, unlike in conventional sets, belonging of one element
to the given set is not precisely defined; the element can be more or less a part of the set (Pamučar, et al., 2011a, p.594). Therefore, fuzzy logic is closer to human perception than conventional logic (Pamučar, et al., 2011a, p.594). This feature allows fuzzy logic to quantify the information which, in classic logic, is considered imprecise. The existence of apparently imprecise information, which in fuzzy logic is very well handled, frequently occurs in social sciences, including decision-making processes.
The creator of fuzzy logic is Lotfi Zadeh. In a series of papers, he presented the basics of fuzzy logic (Zadeh, 1965), (Zadeh, 1972), (Zadeh, 1973) and others. These basics were enough to empower fuzzy logic and now cause it to constantly evolve and increasingly be applied in practice. For the purposes of this paper, several segments of fuzzy logic are significant: definition of fuzzy set, selection of a membership function form and confidence intervals.
The fuzzy set A is defined as a set of arranged pairs
( )( ) ( ){ }, , 0 1A AA x x x X xμ μ= ∈ ≤ ≤ (1)
where: - X - is a universal set or a set of considerations based on which a
fuzzy set A is defined; - μA (x) is a membership function of the element x (x∈X) to the set A;
A membership function can have any value between 1 and 0; so, as the value of the function is closer to 1, the membership of the element x to the set A is greater, and vice versa.
Each fuzzy set is completely and uniquely defined by its membership function (Zadeh, 1965). Membership functions may have different forms, but the most commonly used are triangular, trapezoidal and Gaussian. The selection of the membership function is carried out so

708
VOJN
OTE
HN
IČK
I GLA
SN
IK /
MIL
ITA
RY
TE
CH
NIC
AL
CO
UR
IER
, 201
6., V
ol 6
4, N
o 3 that it best describes the phenomenon it represents, for which there are
no certain rules. In this paper, triangular fuzzy numbers T = (t1, t2, t3), will be used (Figure 1), where t1 represents left and t3 right distribution of the confidence interval of the fuzzy number T and t2 represents the point where the membership function of the fuzzy number has its maximum value, or value 1.
( )T xμ
( ) 21, T x x tμ = =
( )1
1 22 1
, T x
x t t x tt t
μ −= < <− ( )
32 3
3 2
, T x
t x t x tt t
μ −= < <−
( ) 10, T x x tμ = ≤ ( ) 30, T x x tμ = ≥α
0
Figure 1 – Triangular fuzzy number T (Pamučar et al., 2016, p.77)
Фигура 1 – Треугольное нечеткое число T (Pamučar i dr., 2016, p.77) Slika 1 – Trouglasti fuzzy broj T (Pamučar i dr., 2016, p.77 )
The elements of fuzzy sets are taken from the confidence interval.
The confidence interval contains all the elements that can be considered. Therefore, a fuzzy variable can have only the values from the confidence interval. Determination of the confidence interval of each fuzzy variable is the task of the designer and the most natural solution is to adopt the confidence interval so that it matches the physical limits of the variable (Pamučar, et al., 2016). If the variable is not of physical origin, one of the standard ones is adopted or an abstract confidence interval is defined (Božanić, Pamučar, 2010), (Pamučar, et al., 2011a).
For the purpose of end use, the fuzzy number T = (t1, t2, t3) is converted into a real number. For this operation, a number of methods are used (Herrera Martínez, 2000). Some of the well-known expressions for the defuzzyfication are the following ones (Seiford, 1996)
3 1 2 1 1(( ) ( )) / 3= − + − +A t t t t t (2)
( )3 2 11 / 2λ λ= + + −⎡ ⎤⎣ ⎦A t t t (3)

709
Boža
nić,
D.,
et a
l., U
se o
f the
fuzz
y AH
P - M
ABAC
hyb
rid m
odel
in ra
nkin
g po
tent
ial lo
catio
ns fo
r pre
parin
g la
ying-
up p
ositio
ns p
p. 7
05–7
29
where λ is the optimism index, which can be described as the belief/attitude of DM considering the risk in decision making (Milićević, 2014, p.186). The most common optimism index is 0, 0.5 or 1, corresponding to the pessimistic, average and optimistic view of the decision-maker (Milićević, 2014, p.186).
Analytical Hierarchy Process and the Saaty’s scale The AHP method was developed by Thomas L. Saaty. It is based on
the decomposition of a complex problem through the hierarchy approach, with the goal at the top, criteria, sub-criteria and alternatives at the levels and sub-levels of the hierarchy (Saaty, 1980), Figure 2.
Figure 2 – General hierarchical model in AHP Фигура 2 – Иерархическая модель AHP
Slika 2 – Hijerarhijski model AHP
The key element of the AHP method is the development of a comparison matrix in pairs. It is made at each level of the hierarchy.
1 2
1 11 12 1
2 12 22 2
1 2
⎡ ⎤⎢ ⎥⎢ ⎥⎢ ⎥⎢ ⎥⎣ ⎦
=
K
K
K
M M M O M
K
n
n
n
n n n nn
K K KK a a a
A K a a a
K a a a
(4)
Pairwise comparison is performed according to the data collected and their measurement, as well as based on own beliefs, estimates or experiences of those who carry out the assessment (Cupic, Suknovic, 2010). A so-called Saaty's scale, Table 1 (Saaty, 1980) is used for pairwise
710
VOJN
OTE
HN
IČK
I GLA
SN
IK /
MIL
ITA
RY
TE
CH
NIC
AL
CO
UR
IER
, 201
6., V
ol 6
4, N
o 3
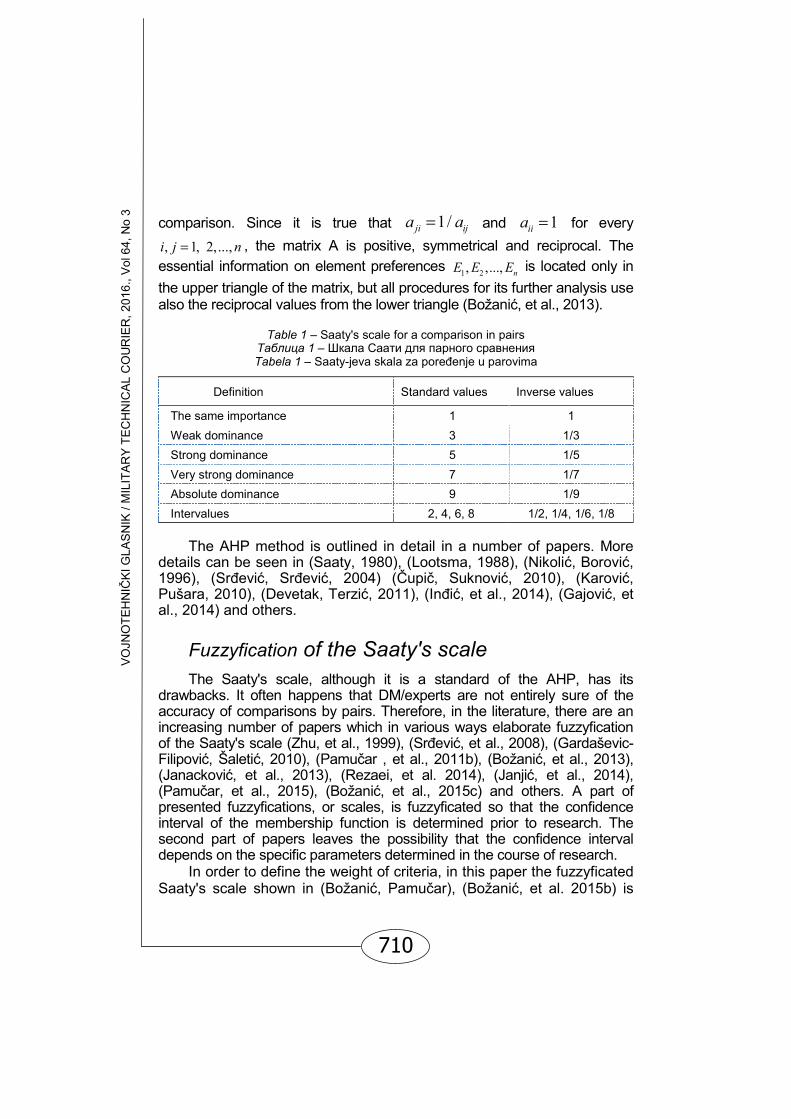
comparison. Since it is true that 1/ji ija a= and 1iia = for every , 1, 2,...,i j n= , the matrix A is positive, symmetrical and reciprocal. The
essential information on element preferences 1 2, ,..., nE E E is located only in the upper triangle of the matrix, but all procedures for its further analysis use also the reciprocal values from the lower triangle (Božanić, et al., 2013).
Table 1 – Saaty's scale for a comparison in pairs
Таблица 1 – Шкала Саати для парного сравнения Tabela 1 – Saaty-jeva skala za poređenje u parovima
Definition Standard values Inverse values
The same importance 1 1 Weak dominance 3 1/3 Strong dominance 5 1/5 Very strong dominance 7 1/7 Absolute dominance 9 1/9 Intervalues 2, 4, 6, 8 1/2, 1/4, 1/6, 1/8
The AHP method is outlined in detail in a number of papers. More
details can be seen in (Saaty, 1980), (Lootsma, 1988), (Nikolić, Borović, 1996), (Srđević, Srđević, 2004) (Čupič, Suknović, 2010), (Karović, Pušara, 2010), (Devetak, Terzić, 2011), (Inđić, et al., 2014), (Gajović, et al., 2014) and others.
Fuzzyfication of the Saaty's scale The Saaty's scale, although it is a standard of the AHP, has its
drawbacks. It often happens that DM/experts are not entirely sure of the accuracy of comparisons by pairs. Therefore, in the literature, there are an increasing number of papers which in various ways elaborate fuzzyfication of the Saaty's scale (Zhu, et al., 1999), (Srđević, et al., 2008), (Gardaševic-Filipović, Šaletić, 2010), (Pamučar , et al., 2011b), (Božanić, et al., 2013), (Janacković, et al., 2013), (Rezaei, et al. 2014), (Janjić, et al., 2014), (Pamučar, et al., 2015), (Božanić, et al., 2015c) and others. A part of presented fuzzyfications, or scales, is fuzzyficated so that the confidence interval of the membership function is determined prior to research. The second part of papers leaves the possibility that the confidence interval depends on the specific parameters determined in the course of research.
In order to define the weight of criteria, in this paper the fuzzyficated Saaty's scale shown in (Božanić, Pamučar), (Božanić, et al. 2015b) is
711
Boža
nić,
D.,
et a
l., U
se o
f the
fuzz
y AH
P - M
ABAC
hyb
rid m
odel
in ra
nkin
g po
tent
ial lo
catio
ns fo
r pre
parin
g la
ying-
up p
ositio
ns p
p. 7
05–7
29
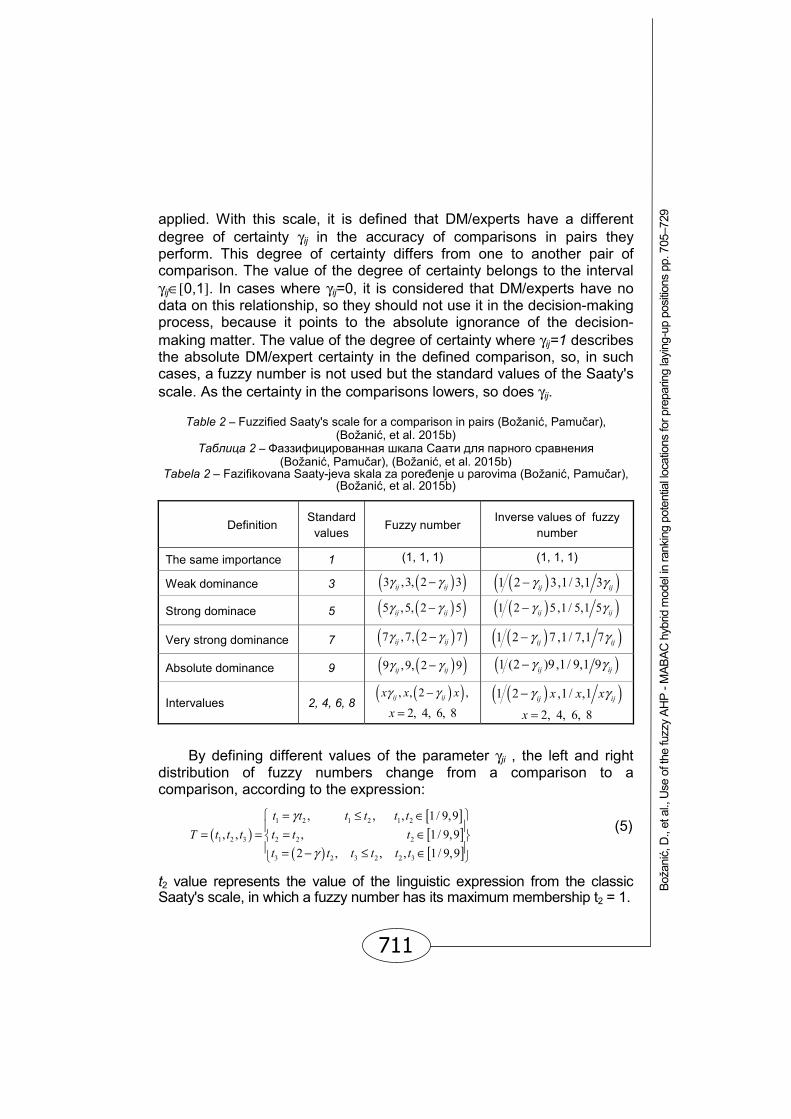
applied. With this scale, it is defined that DM/experts have a different degree of certainty γij in the accuracy of comparisons in pairs they perform. This degree of certainty differs from one to another pair of comparison. The value of the degree of certainty belongs to the interval γij∈[0,1]. In cases where γij=0, it is considered that DM/experts have no data on this relationship, so they should not use it in the decision-making process, because it points to the absolute ignorance of the decision-making matter. The value of the degree of certainty where γij=1 describes the absolute DM/expert certainty in the defined comparison, so, in such cases, a fuzzy number is not used but the standard values of the Saaty's scale. As the certainty in the comparisons lowers, so does γij.
Table 2 – Fuzzified Saaty's scale for a comparison in pairs (Božanić, Pamučar),
(Božanić, et al. 2015b) Таблица 2 – Фаззифицированная шкала Саати для парного сравнения
(Božanić, Pamučar), (Božanić, et al. 2015b) Tabela 2 – Fazifikovana Saaty-jeva skala za poređenje u parovima (Božanić, Pamučar),
(Božanić, et al. 2015b)
Definition Standard
values Fuzzy number
Inverse values of fuzzy number
The same importance 1 (1, 1, 1) (1, 1, 1)
Weak dominance 3 ( )( )3 ,3, 2 3γ γ−ij ij ( )( )1 2 3,1/ 3,1 3γ γ− ij ij
Strong dominace 5 ( )( )5 ,5, 2 5γ γ−ij ij ( )( )1 2 5,1 / 5,1 5γ γ− ij ij
Very strong dominance 7 ( )( )7 ,7, 2 7γ γ−ij ij ( )( )1 2 7 ,1/ 7,1 7γ γ− ij ij
Absolute dominance 9 ( )( )9 ,9, 2 9γ γ−ij ij ( )1 (2 )9,1/ 9,1 9γ γ− ij ij
Intervalues 2, 4, 6, 8 ( )( ), , 2 ,γ γ−ij ijx x x
2, 4, 6, 8x = ( )( )1 2 ,1/ ,1γ γ− ij ijx x x
2, 4, 6, 8x =
By defining different values of the parameter γji , the left and right
distribution of fuzzy numbers change from a comparison to a comparison, according to the expression:
( )[ ][ ]
( ) [ ]
1 2 1 2 1 2
1 2 3 2 2 2
3 2 3 2 2 3
, , , 1/ 9,9, , , 1 / 9,9
2 , , , 1/ 9,9
γ
γ
⎧ ⎫= ≤ ∈⎪ ⎪= = = ∈⎨ ⎬⎪ ⎪= − ≤ ∈⎩ ⎭
t t t t t tT t t t t t t
t t t t t t
(5)
t2 value represents the value of the linguistic expression from the classic Saaty's scale, in which a fuzzy number has its maximum membership t2 = 1.

712
VOJN
OTE
HN
IČK
I GLA
SN
IK /
MIL
ITA
RY
TE
CH
NIC
AL
CO
UR
IER
, 201
6., V
ol 6
4, N
o 3 A fuzzy number ( ) ( )( )1 2 3, , , , 2γ γ= = −ij ijT t t t x x x , is defined with
experessions:
1
, 1
1, 1
γ γγ
γ∀ ≤ ≤⎧⎪= = ⎨ ∀ <⎪⎩
ij ijij
ij
x x xt x
x (6)
[ ]2 , 1,9t x x= ∀ ∈ (7)
( ) [ ]3 2 , 1,9γ= − ∀ ∈ijt x x (8)
The inverse fuzzy number ( ) ( )( )1
3 2 11 / ,1/ ,1/ 1 2 ,1 / ,1γ γ− = = − ij ijT t t t x x x , )1 / 9,1x∈ ⎡⎣ ,
is defined as:
( ) ( ) ( )( )3
1 2 , 1 2 11/ 1 2
1, 1 2 1
γ γγ
γ
⎧ − ∀ < − <⎪= − = ⎨∀ − >⎪⎩
ij ij
ij
ij
x x xt x
x (9)
]21/ 1/ , 1/ 1/ 9,1t x x ⎡= ∀ ∈ ⎣ (10)
[ ]11 / 1 , 1 / 1 / 9,1γ= ∀ ∈ijt x x (11)
On the basis of the previously defined scale, DM/experts fill a new, modified matrix:
1 2
1 11 11 12 12 1 1
2 21 21 22 22 2 2
1 1 2 2
; ; ;; ; ;
; ; ;
γ γ γγ γ γ
γ γ γ
⎡ ⎤⎢ ⎥⎢ ⎥⎢ ⎥⎢
=
⎥⎣ ⎦
K
K
K
M M M O M
K
n
n n
n n
n n n n n nn nn
K K KK a a a
A K a a a
K a a a
(12)
A new scale can be applied in group decision-making, which has significantly improved the quality of decision-making. In specific cases, the data collected by the Delphi technique are analyzed separately for each expert. The data analysis is performed by the AIJ synthesis (Aggregating Individual Judgments), where numerical ratings of element preferences are aggregated at the local level (for each matrix separately), in order to obtain a synthetic set of matrices for a fictitious ("group") decision-maker representing the group, and then the standard AHP synthesis could be executed (Zoranović, Srdjević, 2003). After all members of the group have performed the necessary comparisons in pairs of elements of the hierarchy, the filled matrices of type A(e)={aij(e)} (e = 1, 2, ..., E, where e represents the number of group members), are

713
Boža
nić,
D.,
et a
l., U
se o
f the
fuzz
y AH
P - M
ABAC
hyb
rid m
odel
in ra
nkin
g po
tent
ial lo
catio
ns fo
r pre
parin
g la
ying-
up p
ositio
ns p
p. 7
05–7
29
aggregated into the correspondent unique matrices for the group { }=G G
ijA a by applying, at each position (i,j), a micro aggregation by
geometric averaging (Zoranović, Srdjević, 2003) using the formula:
( )1/
1=
⎡ ⎤= ⎢ ⎥⎣ ⎦∏
EEGij ij
e
a a e
(13)
The MABAC method The MABAC method was developed by Pamučar and Ćirović
(2015). The basic setting of the MABAC method is reflected in the definition of the distance of the criterion function of each of the observed alternatives from the approximate border area. The text that follows shows the procedure of implementation of the MABAC method in six steps, i.e. its mathematical formulation:
Step1. Creating the initial decision matrix (X). In the first step, the evaluation of the m alternatives by the n criteria is carried out. The alternatives are presented with vectors ( )1 2, ,...,i i i inA x x x= , where ijx is the value of the i alternative according to the j criteria ( 1, 2,..., ; 1, 2,...,i m j n= = ).
1 2
1 11 12 1
2 11 22 2
1 2
......
... ... ... ... ......
⎡ ⎤⎢ ⎥⎢ ⎥=⎢ ⎥⎢ ⎥⎣ ⎦
n
n
n
m m m mn
K K KA x x xA x x x
X
A x x x
(14)
where m indicates the number of alternatives, and n indicates the total number of criteria.
Step 2. Normalization of the elements of the initial matrix (X). 1 2
1 11 12 1
2 11 22 2
1 2
...
...
... ... ... ... ......
⎡ ⎤⎢ ⎥⎢ ⎥=⎢ ⎥⎢ ⎥⎣ ⎦
n
n
n
m m m mn
K K KA t t tA t t t
N
A t t t
(15)
The elements of the normalized matrix (N) are obtained using the following expressions:
a) For the "benefit" type criteria
ij iij
i i
x xt
x x
−
+ −
−=
− (16)

714
VOJN
OTE
HN
IČK
I GLA
SN
IK /
MIL
ITA
RY
TE
CH
NIC
AL
CO
UR
IER
, 201
6., V
ol 6
4, N
o 3 b) For the "cost" type criteria
ij iij
i i
x xt
x x
+
− +
−=
− (17)
where ijx , ix+ and ix
− are the components of the initial decision matrix
(X), where ix+ and ix
− are defined as:
( )1 2max , ,...,i mx x x x+ = and represents the maximum value of the observed criteria by alternatives.
( )1 2min , ,...,i mx x x x− = and represents the minimum value of the observed criteria by alternatives.
Step 3. Calculation of the weighted matrix elements (V).
11 12 1
21 22 2
1 2
...
...... ... ... ...
...
⎡ ⎤⎢ ⎥⎢ ⎥=⎢ ⎥⎢ ⎥⎣ ⎦
n
n
m m mn
v v vv v v
V
v v v
(18)
The elements of the weighted matrix (V) are calculated on the basis of expression (19):
ij i ij iv w t w= + (19)
where ijt are the elements of the normalized matrix (N), and iw represents the weight coefficient of criteria. By applying the expression (19), we get the weighted matrix V that otherwise can be written as:
1 11 1 2 12 2 1
1 21 1 2 22 2 2
1 1 1 2 2 2
...
...... ... ... ...
...
+ + +⎡ ⎤⎢ ⎥+ + +⎢ ⎥=⎢ ⎥⎢ ⎥+ + +⎣ ⎦
n n n
n n n
m m n mn n
w t w w t w w t ww t w w t w w t w
V
w t w w t w w t w
(20)
where n is the total number of criteria, and m is the total number of alternatives.
Step 4. Determination of the approximate border area (G) matrix. The border approximate area (BAA) for each criterion is determined by expression (21)
1/
1
mm
i ijj
g v=
⎛ ⎞= ⎜ ⎟⎝ ⎠∏ (21)

715
Boža
nić,
D.,
et a
l., U
se o
f the
fuzz
y AH
P - M
ABAC
hyb
rid m
odel
in ra
nkin
g po
tent
ial lo
catio
ns fo
r pre
parin
g la
ying-
up p
ositio
ns p
p. 7
05–7
29
where ijv are the weighted matrix elements (V) and m represents the total number of alternatives.
After determining the value ig according to the criteria, we form the matrix of approximate border areas G (22) size nx1 (n is the total number of criteria by which the election of the offered alternatives is made).
[ ]1 2
1 2
......=
n
n
K K KG g g g (22)
Step 5. Calculation of the matrix elements distance from the border approximate area (Q)
11 12 1
21 22 2
1 2
...
... ... ... ......
n
n
m m mn
q q qq q q
Q
q q q
⎡ ⎤⎢ ⎥⎢ ⎥=⎢ ⎥⎢ ⎥⎣ ⎦
(23)
The distance of the alternatives from the border approximate area ( ijq ) is defined as the difference between the weighted matrix elements (V) and the values of the border approximate areas (G).
= −Q V G (24)
which otherwise can be written as:
11 1 12 2 1
21 1 22 2 2
1 1 2 2
...
...... ... ... ...
...
− − −⎡ ⎤⎢ ⎥− − −⎢ ⎥=⎢ ⎥⎢ ⎥− − −⎣ ⎦
n n
n n
m m mn n
v g v g v gv g v g v g
Q
v g v g v g
(25)
where ig represents the border approximate area for the criterion iK ,
ijv is the weighted matrix elements (V), n represents the number of criteria, and m represents the number of alternatives.
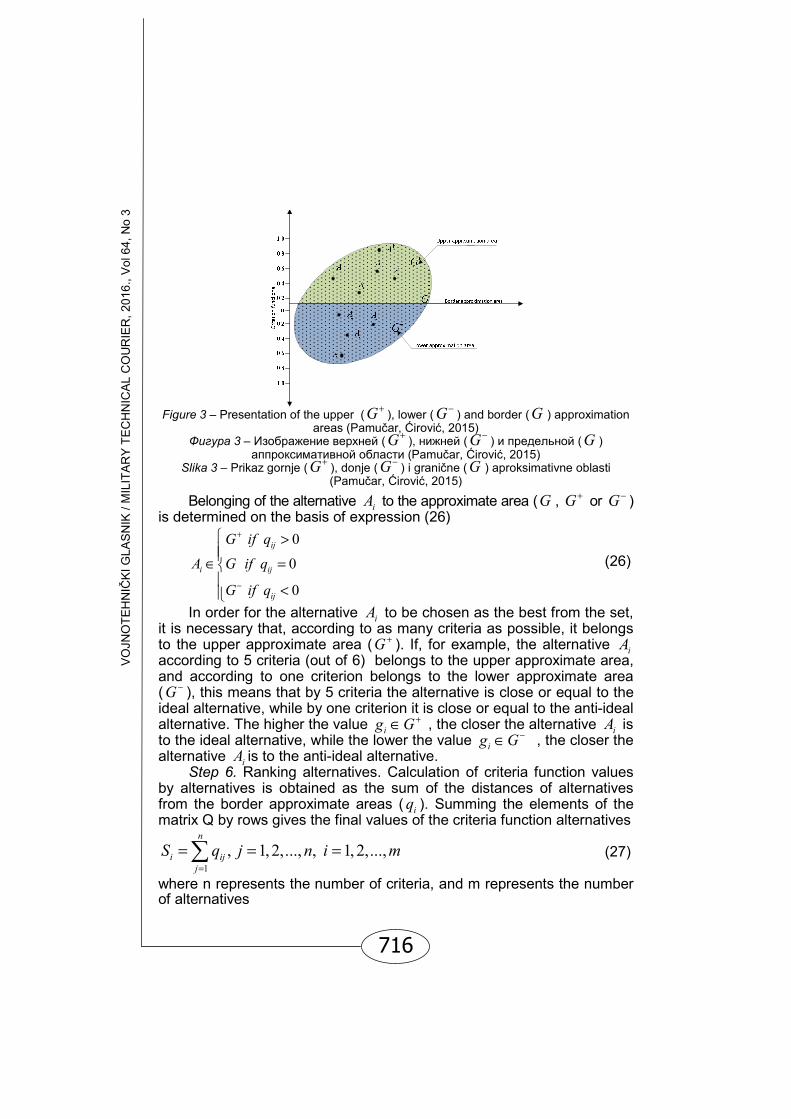
The alternative iA may belong to the border approximate area (G),
the upper approximate area (G+ ) or the lower approximate area (G− ), respectively { }iA G G G+ −∈ ∨ ∨ . The upper approximate area (G+ ) is an
area in which the ideal alternative is found ( A+ ), while the lower approximate area (G− ) is an area in which the anti-ideal alternative ( A− ) is found (Figure 3).
716
VOJN
OTE
HN
IČK
I GLA
SN
IK /
MIL
ITA
RY
TE
CH
NIC
AL
CO
UR
IER
, 201
6., V
ol 6
4, N
o 3
Figure 3 – Presentation of the upper (G+ ), lower (G− ) and border (G ) approximation
areas (Pamučar, Ćirović, 2015) Фигура 3 – Изображение верхней (G+ ), нижней (G− ) и предельной (G )
аппроксимативной области (Pamučar, Ćirović, 2015) Slika 3 – Prikaz gornje (G+ ), donje (G− ) i granične (G ) aproksimativne oblasti
(Pamučar, Ćirović, 2015)
Belonging of the alternative iA to the approximate area (G , G+ or G− ) is determined on the basis of expression (26)
0
0
0
ij
i ij
ij
G if q
A G if q
G if q
+
−
⎧ >⎪⎪∈ =⎨⎪ <⎪⎩
(26)
In order for the alternative iA to be chosen as the best from the set, it is necessary that, according to as many criteria as possible, it belongs to the upper approximate area (G+ ). If, for example, the alternative iA according to 5 criteria (out of 6) belongs to the upper approximate area, and according to one criterion belongs to the lower approximate area (G− ), this means that by 5 criteria the alternative is close or equal to the ideal alternative, while by one criterion it is close or equal to the anti-ideal alternative. The higher the value ig G+∈ , the closer the alternative iA is to the ideal alternative, while the lower the value ig G−∈ , the closer the alternative iA is to the anti-ideal alternative.
Step 6. Ranking alternatives. Calculation of criteria function values by alternatives is obtained as the sum of the distances of alternatives from the border approximate areas ( iq ). Summing the elements of the matrix Q by rows gives the final values of the criteria function alternatives
1
, 1, 2,..., , 1, 2,...,n
i ijj
S q j n i m=
= = =∑ (27) where n represents the number of criteria, and m represents the number of alternatives
717
Boža
nić,
D.,
et a
l., U
se o
f the
fuzz
y AH
P - M
ABAC
hyb
rid m
odel
in ra
nkin
g po
tent
ial lo
catio
ns fo
r pre
parin
g la
ying-
up p
ositio
ns p
p. 7
05–7
29
Ranking alternatives - location for the development of laying-up positions by applying
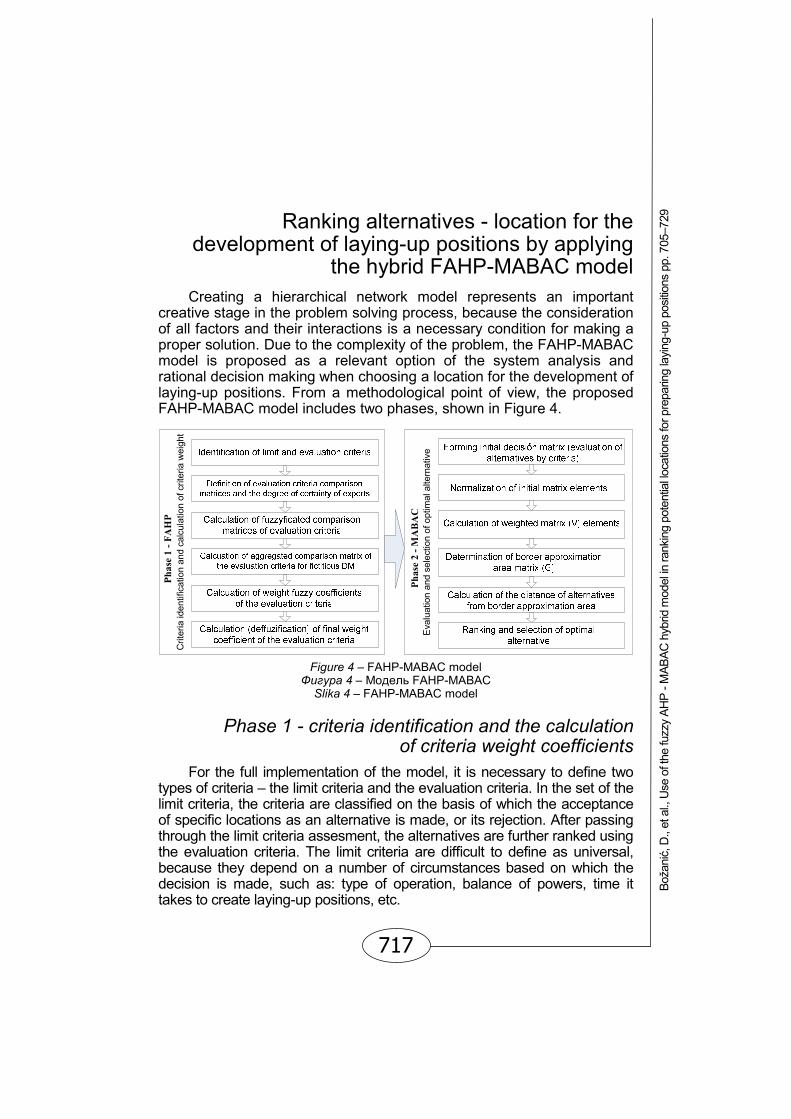
the hybrid FAHP-MABAC model Creating a hierarchical network model represents an important
creative stage in the problem solving process, because the consideration of all factors and their interactions is a necessary condition for making a proper solution. Due to the complexity of the problem, the FAHP-MABAC model is proposed as a relevant option of the system analysis and rational decision making when choosing a location for the development of laying-up positions. From a methodological point of view, the proposed FAHP-MABAC model includes two phases, shown in Figure 4.
E
valu
atio
n an
d se
lect
ion
of o
ptim
al a
ltern
ativ
ePh
ase
2 -M
AB
AC
Phas
e 1
-FA
HP
Crit
eria
iden
tific
atio
n an
d ca
lcul
atio
n of
crit
eria
wei
ght
Figure 4 – FAHP-MABAC model
Фигура 4 – Модель FAHP-MABAC Slika 4 – FAHP-MABAC model
Phase 1 - criteria identification and the calculation of criteria weight coefficients
For the full implementation of the model, it is necessary to define two types of criteria – the limit criteria and the evaluation criteria. In the set of the limit criteria, the criteria are classified on the basis of which the acceptance of specific locations as an alternative is made, or its rejection. After passing through the limit criteria assesment, the alternatives are further ranked using the evaluation criteria. The limit criteria are difficult to define as universal, because they depend on a number of circumstances based on which the decision is made, such as: type of operation, balance of powers, time it takes to create laying-up positions, etc.

718
VOJN
OTE
HN
IČK
I GLA
SN
IK /
MIL
ITA
RY
TE
CH
NIC
AL
CO
UR
IER
, 201
6., V
ol 6
4, N
o 3 In the most general sense, a certain location will not be considered
as an alternative in the following situations: when it cannot provide even the minimum conditions for the protection and masking, when it cannot provide even the minimum conditions for the stay of military ships in all meteorological and hydrological conditions, when it is located next to visible objects, when it is not at a sufficient distance from the existing laying-up positions or other protection and masking facilities on the coast and along the coast, when the volume of work is so large that the production can be considered unrewarding, etc.
The evaluation criteria in the selection of the most suitable location for the development of laying-up positions are defined based on the analysis of the available literature. The most detailed description of the conditions which a location for making laying up positions should meet is given in (Milovanović, 1971, pp.169-170). Through a detailed analysis of all conditions, five key evaluation criteria stand out (Milovanović, 1971, pp.169-170), (Božanić et al., 2015a, pp. 695-696):
• C1 - masking conditions - the place where the laying up position is going to be placed should provide a good concealment of military ships, and during masking, as simple mask base as possible should be used (one that can be quickly set and removed);
• C2 - scope of work - a place where production of laying up positions is carried out must ensure the most favorable conditions for its development, ie. as small as possible volume of work, especially when performing underwater works;
• C3 - degree of protection – laying up position should provide the best possible protection from enemy effects from the air, by land or by river;
• C4 - benefits for sailing in and out- approaches to laying-up positions should be safe for quick sailing in and out;
• C5 - terrain conditions for the immediate security organization - the surrounding terrain should provide favorable conditions for possible defense against an imminent attack of a military ship, primarily from sabotage and terrorist groups.
The set of criteria Ci (i = 1, .. 5) consists of two subsets: • C + - a subset of the "benefit" type criteria, which means that the
higher value of the criteria is preferable or better (criteria: C1, C3, C4, C5), and • C - a subset of the "cost" type criteria, which means that the lower
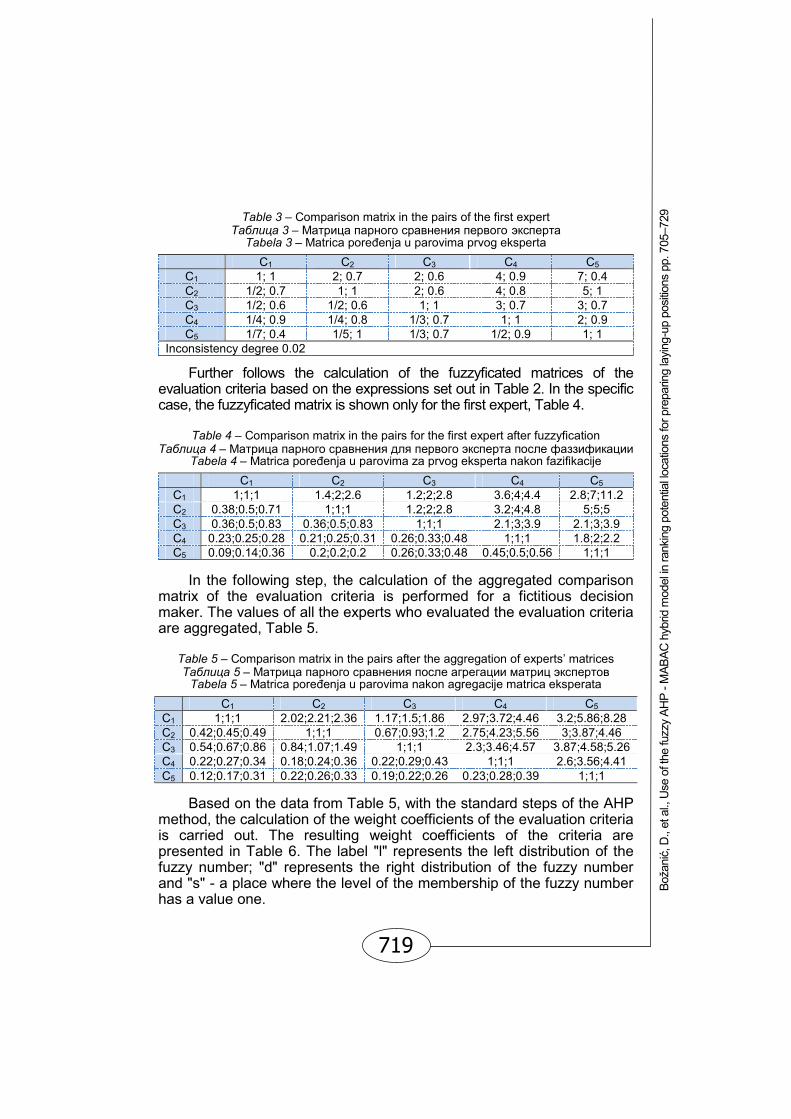
value is preferable or better (criterion C2). The following step is to define a matrix of comparison of the
evaluation criteria in pairs and the degree of certainty for each comparison. The matrix is filled by every expert for themselves. In the specific case, the matrix of comparison is provided only for the first expert, Table 3.
719
Boža
nić,
D.,
et a
l., U
se o
f the
fuzz
y AH
P - M
ABAC
hyb
rid m
odel
in ra
nkin
g po
tent
ial lo
catio
ns fo
r pre
parin
g la
ying-
up p
ositio
ns p
p. 7
05–7
29
Table 3 – Comparison matrix in the pairs of the first expert Таблица 3 – Матрица парного сравнения первого эксперта
Tabela 3 – Matrica poređenja u parovima prvog eksperta C1 C2 C3 C4 C5
C1 1; 1 2; 0.7 2; 0.6 4; 0.9 7; 0.4 C2 1/2; 0.7 1; 1 2; 0.6 4; 0.8 5; 1 C3 1/2; 0.6 1/2; 0.6 1; 1 3; 0.7 3; 0.7 C4 1/4; 0.9 1/4; 0.8 1/3; 0.7 1; 1 2; 0.9 C5 1/7; 0.4 1/5; 1 1/3; 0.7 1/2; 0.9 1; 1
Inconsistency degree 0.02
Further follows the calculation of the fuzzyficated matrices of the evaluation criteria based on the expressions set out in Table 2. In the specific case, the fuzzyficated matrix is shown only for the first expert, Table 4.
Table 4 – Comparison matrix in the pairs for the first expert after fuzzyfication
Таблица 4 – Матрица парного сравнения для первого эксперта после фаззификации Tabela 4 – Matrica poređenja u parovima za prvog eksperta nakon fazifikacije
C1 C2 C3 C4 C5 C1 1;1;1 1.4;2;2.6 1.2;2;2.8 3.6;4;4.4 2.8;7;11.2 C2 0.38;0.5;0.71 1;1;1 1.2;2;2.8 3.2;4;4.8 5;5;5 C3 0.36;0.5;0.83 0.36;0.5;0.83 1;1;1 2.1;3;3.9 2.1;3;3.9 C4 0.23;0.25;0.28 0.21;0.25;0.31 0.26;0.33;0.48 1;1;1 1.8;2;2.2 C5 0.09;0.14;0.36 0.2;0.2;0.2 0.26;0.33;0.48 0.45;0.5;0.56 1;1;1
In the following step, the calculation of the aggregated comparison
matrix of the evaluation criteria is performed for a fictitious decision maker. The values of all the experts who evaluated the evaluation criteria are aggregated, Table 5.
Table 5 – Comparison matrix in the pairs after the aggregation of experts’ matrices Таблица 5 – Матрица парного сравнения после агрегации матриц экспертов
Tabela 5 – Matrica poređenja u parovima nakon agregacije matrica eksperata C1 C2 C3 C4 C5 C1 1;1;1 2.02;2.21;2.36 1.17;1.5;1.86 2.97;3.72;4.46 3.2;5.86;8.28 C2 0.42;0.45;0.49 1;1;1 0.67;0.93;1.2 2.75;4.23;5.56 3;3.87;4.46 C3 0.54;0.67;0.86 0.84;1.07;1.49 1;1;1 2.3;3.46;4.57 3.87;4.58;5.26 C4 0.22;0.27;0.34 0.18;0.24;0.36 0.22;0.29;0.43 1;1;1 2.6;3.56;4.41 C5 0.12;0.17;0.31 0.22;0.26;0.33 0.19;0.22;0.26 0.23;0.28;0.39 1;1;1
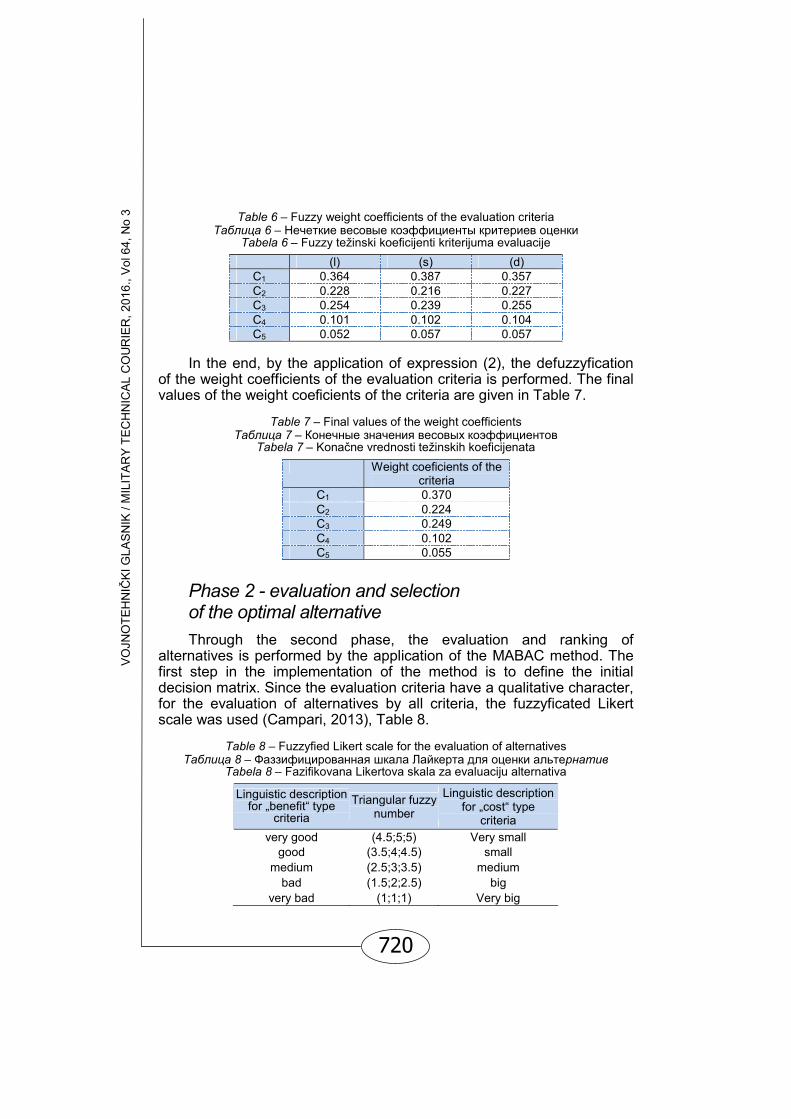
Based on the data from Table 5, with the standard steps of the AHP
method, the calculation of the weight coefficients of the evaluation criteria is carried out. The resulting weight coefficients of the criteria are presented in Table 6. The label "l" represents the left distribution of the fuzzy number; "d" represents the right distribution of the fuzzy number and "s" - a place where the level of the membership of the fuzzy number has a value one.
720
VOJN
OTE
HN
IČK
I GLA
SN
IK /
MIL
ITA
RY
TE
CH
NIC
AL
CO
UR
IER
, 201
6., V
ol 6
4, N
o 3 Table 6 – Fuzzy weight coefficients of the evaluation criteria
Таблица 6 – Нечеткие весовые коэффициенты критериев оценки Tabela 6 – Fuzzy težinski koeficijenti kriterijuma evaluacije
(l) (s) (d) C1 0.364 0.387 0.357 C2 0.228 0.216 0.227 C3 0.254 0.239 0.255 C4 0.101 0.102 0.104 C5 0.052 0.057 0.057
In the end, by the application of expression (2), the defuzzyfication
of the weight coefficients of the evaluation criteria is performed. The final values of the weight coeficients of the criteria are given in Table 7.
Table 7 – Final values of the weight coefficients
Таблица 7 – Конечные значения весовых коэффициентов Tabela 7 – Konačne vrednosti težinskih koeficijenata
Weight coeficients of the criteria
C1 0.370 C2 0.224 C3 0.249 C4 0.102 C5 0.055
Phase 2 - evaluation and selection of the optimal alternative Through the second phase, the evaluation and ranking of
alternatives is performed by the application of the MABAC method. The first step in the implementation of the method is to define the initial decision matrix. Since the evaluation criteria have a qualitative character, for the evaluation of alternatives by all criteria, the fuzzyficated Likert scale was used (Campari, 2013), Table 8.
Table 8 – Fuzzyfied Likert scale for the evaluation of alternatives
Таблица 8 – Фаззифицированная шкала Лайкерта для оценки альтернатив Tabela 8 – Fazifikovana Likertova skala za evaluaciju alternativa
Linguistic description for „benefit“ type
criteria Triangular fuzzy
number
Linguistic description for „cost“ type
criteria very good (4.5;5;5) Very small
good (3.5;4;4.5) small medium (2.5;3;3.5) medium
bad (1.5;2;2.5) big very bad (1;1;1) Very big

721
Boža
nić,
D.,
et a
l., U
se o
f the
fuzz
y AH
P - M
ABAC
hyb
rid m
odel
in ra
nkin
g po
tent
ial lo
catio
ns fo
r pre
parin
g la
ying-
up p
ositio
ns p
p. 7
05–7
29
In the specific case, the fuzzyficated Likert scale is applied to provide the assessment of ten illustrative alternatives, whose values are defuzzyficated by using expression (2) and shown in Table 9.
Table 9 – Initial decision matrix (X)
Таблица 9 – Исходная матрица принятия решений (X) Tabela 9 – Početna matrica odlučivanja (X)
C1 C2 C3 C4 C5 A1 4.83 1 4 2 1 A2 4 2 4.83 1 3 A3 2 4 1 4.83 2 A4 3 3 4.83 2 4 A5 1 2 2 3 4.83 A6 3 4.83 1 4 3 A7 4 3 3 4 4.83 A8 4.83 1 2 3 1 A9 1 4.83 4 1 4 A10 3 4 3 4.83 2
The next step is the normalization of the initial matrix elements by the application of expressions (16) and (17). The normalized matrix (N) is presented in Table 10.
Table 10 – Normalized matrix (N) Таблица 10 – Нормированная матрица (N)
Tabela 10 – Normalizovana matrica (N) C1 C2 C3 C4 C5
A1 1.00 1.00 0.78 0.26 0.00 A2 0.78 0.74 1.00 0.00 0.52 A3 0.26 0.22 0.00 1.00 0.26 A4 0.52 0.48 1.00 0.26 0.78 A5 0.00 0.74 0.26 0.52 1.00 A6 0.52 0.00 0.00 0.78 0.52 A7 0.78 0.48 0.52 0.78 1.00 A8 1.00 1.00 0.26 0.52 0.00 A9 0.00 0.00 0.78 0.00 0.78 A10 0.52 0.22 0.52 1.00 0.26
The weighted matrix (V) is calculated using expression (19), Table 11.
Table 11 – Weighted matrix (V) Таблица 11 – Нечеткая матрица (V)
Tabela 11 – Otežana matrica (V) C1 C2 C3 C4 C5
A1 0.74 0.45 0.44 0.13 0.06 A2 0.66 0.39 0.50 0.10 0.08 A3 0.47 0.27 0.25 0.20 0.07 A4 0.56 0.33 0.50 0.13 0.10 A5 0.37 0.39 0.31 0.16 0.11 A6 0.56 0.22 0.25 0.18 0.08 A7 0.66 0.33 0.38 0.18 0.11 A8 0.74 0.45 0.31 0.16 0.06 A9 0.37 0.22 0.44 0.10 0.10 A10 0.56 0.27 0.38 0.20 0.07

722
VOJN
OTE
HN
IČK
I GLA
SN
IK /
MIL
ITA
RY
TE
CH
NIC
AL
CO
UR
IER
, 201
6., V
ol 6
4, N
o 3 Then the approximate border areas are calculated using expression
(21), Table 12.
Table 12 – Border approximation area matrix (G) Таблица 12 – Матрица предельных аппроксимативных областей (G)
Tabela 12 – Matrica graničnih aproksimativnih oblasti (G)
C1 C2 C3 C4 C5 GAO 0.55 0.32 0.37 0.15 0.08
The penultimate step is the calculation of the distance of alternatives from the border approximate area by the application of expression (24), Table 13.
Table 13 – Distance of the alternative from the border approximation area
Таблица 13 – Расстояние альтернатив от предельных аппроксимативных областей Tabela 13 – Udaljenost alternativa od graničnih aproksimativnih oblasti
C1 C2 C3 C4 C5 A1 0.19 0.12 0.08 -0.02 -0.03 A2 0.11 0.07 0.13 -0.05 0.00 A3 -0.09 -0.05 -0.12 0.05 -0.01 A4 0.01 0.01 0.13 -0.02 0.02 A5 -0.18 0.07 -0.05 0.01 0.03 A6 0.01 -0.10 -0.12 0.03 0.00 A7 0.11 0.01 0.01 0.03 0.03 A8 0.19 0.12 -0.05 0.01 -0.03 A9 -0.18 -0.10 0.08 -0.05 0.02 A10 0.01 -0.05 0.01 0.05 -0.01
In the end, expression (27) is applied for ranking the alternatives, Table 14.
Table 14 – Rank of the alternatives Таблица 14 – Рейтинг альтернатив
Tabela 14 – Rang alternativa
Si Rank A1 0.342 1. A2 0.259 2. A3 -0.212 9. A4 0.145 5. A5 -0.135 7. A6 -0.172 8. A7 0.188 4. A8 0.239 3. A9 -0.236 10. A10 0.014 6.
Based on the obtained values Si, the alternatives are ranked from
the most suitable alternative (A1) to the most unfavorable one (A9).

723
Boža
nić,
D.,
et a
l., U
se o
f the
fuzz
y AH
P - M
ABAC
hyb
rid m
odel
in ra
nkin
g po
tent
ial lo
catio
ns fo
r pre
parin
g la
ying-
up p
ositio
ns p
p. 7
05–7
29
Sensitivity analysis of the output results A logical sequence in most multi criteria decision-making processes is to
analyze sensitivity. It is recommended as a means of checking the stability of the results against the subjectivity of decision-makers (Meszaros, Rapcsak, 1996). The sensitivity analysis of the results is carried out by changing the initial weight coefficients of the evaluation criteria. The situations of changing weight coefficients, from A to F, are provided in Table 15.
Table 15 – Scenarios with different weights of the criteria Таблица 15 – Сценарий изменения веса критерия
Tabela 15 – Scenariji promene težina kriterijuma
A B C D E F K1 0.2 0.6 0.1 0.1 0.1 0.1 K2 0.2 0.1 0.6 0.1 0.1 0.1 K3 0.2 0.1 0.1 0.6 0.1 0.1 K4 0.2 0.1 0.1 0.1 0.6 0.1 K5 0.2 0.1 0.1 0.1 0.1 0.6
Ranks of alternatives using different situations are given in Table 16.
Table 16 – Ranks of alternatives by the application of different situations Таблица 16 – Рейтинги альтернатив при применении различных сценариев
Tabela 16 – Rangovi alternativa primenom različitih scenarija
Rank from Table 14 A B C D E F
A1 1 2 1 1 3 7 8 A2 2 2 4 3 1 9 4 A3 9 9 8 8 10 3 10 A4 5 2 5 6 1 7 3 A5 7 7 8 5 8 6 2 A6 8 8 7 9 9 5 6 A7 4 1 2 4 4 1 1 A8 3 5 3 2 7 4 9 A9 10 10 10 10 6 10 5 A10 6 6 6 7 5 2 7 Table 16 shows a significant result stability compared to situations A, B,
C and slightly less D (especially when it comes to the first five alternatives). The stability of the results compared to situations E and F is much smaller, which could be expected if we bear in mind that the importance of the favored criteria in the developed model is several times smaller.

724
VOJN
OTE
HN
IČK
I GLA
SN
IK /
MIL
ITA
RY
TE
CH
NIC
AL
CO
UR
IER
, 201
6., V
ol 6
4, N
o 3 Conclusion
The review of a practical application of the FAHP-MABAC model and its sensitivity analysis indicate the potential of the application of the created models in real situations. Based on the already-made hybrid model, the proposed alternatives are successfully ranked.
The hybrid model uses the advantages of several methods. The first one is the fuzzyficated Saaty's scale, which has been used for obtaining the weight of criteria functions, which successfully covered the uncertainty of experts in claims based on paired comparison.
Also, the new MABAC method is shown as well as its successful implementation in practice. The analysis of the output results sensitivity has shown that the hybrid FAHP-MABAC model provides stable solutions to the problem of choice of laying-up positions. The model is applicable in the process of operational planning for different situations and provides reliable solutions.
Literature Beikkhakhian, Y., Javanmardi, M., Karbasian, M., & Khayambashi, B. 2015. The
application of ISM model in evaluating agile suppliers selection criteria and ranking suppliers using fuzzy TOPSIS-AHP methods. Expert Systems with Application, 42, str.6224-6236.
Božanić, D., Milojević, D., & Milićević, J. 2015a. Izbor lokacija za izradu maskirnih vezova primenom metode VIKOR. U: DQM međunarodna konferencija Upravljanje kvalitetom i pouzdanošću, Prijevor. , str.694-699.
Božanić, D., & Pamučar, D. 2010. Vrednovanje lokacija za uspostavljanje mosnog mesta prelaska preko vodenih prepreka primenom fuzzy logike. Vojnotehnički glasnik/Military Technical Courier, 58(1), str.129-145.
Božanić, D., Karović, S., & Pamučar, D. 2015b. Fazifikacija Saaty-jeve skale primenom trouglastog fuzzy broja sa promenljivim intervalom poverenja. U: 42. Simpozijum o operacionim istraživanjima (SYM-OP-IS), Srebrno jezero, str.420-424.
Božanić, D., & Pamučar, D. Modifikacija Saaty-jeve skale primenom fuzzy broja sa promenljivim intervalom poverenja: Primer procene opasnosti od poplava, Analitički hijerarhijski proces - Teorijske osnove i primena u energetici, zaštiti radne i životne sredine i obrazovanju. U Tematski zbornik (rad prihvaćen za objavljivanje).
Božanić, D., Pamučar, D., & Bojanić, D. 2015c. Modification of the analytic hierarchy process (AHP) method using Fuzzy logic: Fuzzy AHP approach as a support to the decision making process concerning engagement of the Group for additional hindering. Serbian Journal of Management, 10(2), str.151-171.
Božanić, D., Pamučar, D., & Đorović, B. 2013. Modifikacija metode analitičkog hijerarhijskog procesa i njena primena u donošenju odluka u sistemu odbrane. Tehnika, 68(2), str.327-334.
Camparo, J. 2013. A geometrical approach to the ordinal data of Likert scaling and attitude measurements: The density matrix in psychology. Journal of Mathematical Psychology, 57, str.29-42.
Čupić, M., & Suknović, M. 2010. Odlučivanje.Beograd: Fakultet organizacionih nauka.

725
Boža
nić,
D.,
et a
l., U
se o
f the
fuzz
y AH
P - M
ABAC
hyb
rid m
odel
in ra
nkin
g po
tent
ial lo
catio
ns fo
r pre
parin
g la
ying-
up p
ositio
ns p
p. 7
05–7
29
Das, M.C., Sarkar, B., & Ray, S. 2012. A framework to measure relative performance of Indian technical institutions using integrated fuzzy AHP and COPRAS methodology. Socio-Economic Planning Sciences, 46, str.230-241.
Devetak, S., & Terzić, M. 2011. Primena metode analitičkih hijerarhijskih procesa u izboru optimalnog taktičkog radio sistema. Vojnotehnički glasnik/Military Technical Courier, 59(1), str.161-176.
Ertuğrul, I., & Karakaşoğlu, N. 2009. Performance evaluation of Turkish cement firms with fuzzy analytic hierarchy process and TOPSIS methods. Expert Systems with Application, 36, str.702-716.
Gajović, V., & Radivojević, G. 2014. Menadžment rizicima u osiguranju primenom AHP metode. Tehnika, 69(4), str.687-693.
Gardašević-Filipović, M., & Šaletić, D. 2010. Multicriteria optimization in a fuzzy environment: The fuzzy Analytic hierarchy process. Yugoslav Journal of Operations Research, 20(1), str.71-85.
Herrera, F., & Martínez, L. 2000. An Approach for Combining Numerical and Linguistic Information based on the 2-tuple fuzzy linguistic representation model in Decision Making. International Journal of Uncertainty, Fuzziness and Knowledge-Based Systems, 8, str.539-562.
Inđić, D., Luković, Z., & Mučibabić, S. 2014. Model angažovanja jedinica ABH službe prilikom hemijskog udesa. Vojnotehnički glasnik/Military Technical Courier, 62(1), str.23-41.
Janacković, G.L., Savić, S.M., & Stanković, M.S. 2013. Selection and ranking of occupational safety indicators based on fuzzy AHP: A case study in road construction companies. South African Journal of Industrial Engineering, 24(3), str.175-189.
Janjić, A., Stanković, M., & Velimirović, L. 2014. Smart Grid Strategy Assessment Using the Fuzzy AHP.. U: 6th ICT Conference, Niš. , str.13-18
Karović, S., & Pušara, M. 2010. Kriterijumi za angažovanje snaga u oeracijama. Novi glasnik, 3-4, str.37-58.
Kazan, H., Ozçelik, S., & Hobikoğlu, E.H. 2015. Election of Deputy Candidates for Nomination with AHP-Promethee Methods. Procedia - Social and Behavioral Sciences, 195, str.603-613.
Knežević, N., Macura, D., & Bojović, N. 2015. Primena A'WOT metode za izbor scenarija razvoja poštanskih usluga u Republici Srbiji. Tehnika, 70(1), str.158-163.
Lootsma, F.A. 1988. Numerical scaling of human judgment in pairwise-comparison methods for fuzzy multi-criteria decision analysis, Mathematical Models for Decision Support. U NATO ASI Series F, Computer and System Sciences.Berlin, Germany: Springer-Verlag., str.57-88.
Meszaros, C., & Rapcsak, T. 1996. On sensitivity analysis for a class of decision systems. Decision Support Systems, 16, str.231-240.
Milosavljević, M. 1985. Maskiranje i zamračivanje kao uslov za zaštitu i spasavanje. U Civilna zaštita.Zagreb: Privredni vjesnik., str.129-131.
Milićević, M. 2014. Ekspertsko ocenjivanje.Beograd: Medija centar "Odbrana". Milovanović, D. 1971. Privremena pristaništa, maskirni vezovi i navozi.Split: Vojna
štamparija. Nikolić, I., & Borović, S. 1996. Višekriterijumska optimizacija.Beograd: Centar vojnih
škola VJ. Pamučar, D., Božanić, D., & Milić, A.. 2016. Selection of a course of action by
Obstacle Employment Group based on a fuzzy logic system. Yugoslav journal of operations research, 26(1), str. 75-90.

726
VOJN
OTE
HN
IČK
I GLA
SN
IK /
MIL
ITA
RY
TE
CH
NIC
AL
CO
UR
IER
, 201
6., V
ol 6
4, N
o 3 Pamučar, D., & Ćirović, G. 2015. The selection of transport and handling resources
in logistics centers using Multi-Attributive Border Approximation area Comparison. Expert Systems with Applications, 42(6), str. 3016-3028.
Pamučar, D., Božanić, D., Đorović, B., & Milić, A. 2011a. Modelling of the fuzzy logical system for offering support in making decisions within the engineering units of the Serbian army. International journal of the physical sciences, 6(3), str.592-609.
Pamučar, D., Ćirović, G., & Sekulović, D. 2015. Development of an integrated transport system in distribution centres: A FA'WOT analysis. Tehnički vjesnik, 22(3), str.649-658.
Pamučar, D., Ćirović, G., Sekulović, D., & Ilić, A. 2011b. A new fuzzy mathematical model for multi criteria decision making: An application of fuzzy mathematical model in a SWOT analysis. Scientific Research and Essays, 6(25), str.5374-5386.
Rezaei, J., Fahim, P.B.M., & Tavasszy, L. 2014. Supplier selection in the airline retail industry using a funnel methodology: Conjunctive screening method and fuzzy AHP.Expert System with Applications, 41(18), str.8165-8179.
Rkman, I. 1984. Maskiranje.Beograd: Vojnoizdavački zavod. Saaty, T.L. 1980. The analytic hierarchy process.New York: McGraw-Hill.. Sara, J., Stikkelman, R.M., & Harder, P.M. 2015. Assessing relative importance and
mutual influence of barriers for CCSdeployment of the ROAD project using AHP and DEMATEL methods. International Journal of Greenhouse Gas Control, 41, str.336-357.
Seiford, L.M. 1996. Data envelopment analysis: The evolution of the state of the art (1978?1995). Journal of Productivity Analysis, 7(2-3), str.99-137. 7(2-3): 99-137. doi:10.1007/BF00157037
Srdjevic, B., & Medeiros, Y.D.P.2008. Fuzzy AHP Assessment of Water Management Plans. Water Resources Management, 22(7), str.877-894. 22(7): 877-894. doi:10.1007/s11269-007-9197-5
Srđević, B., & Srđević, Z. 2004. Vrednovanje kriterijuma i strategija korišćenja regionalnog hidrosistema "nadela" pomoću analitičkog hijerarhijskog procesa. Studija rađena za J.V.P “Vode Vojvodine”, Novi Sad.
Vojni leksikon 1981. Beograd: Vojnoizdavački zavod. Zadeh, L.A. 1972. A Rationale for Fuzzy Control. Journal of Dynamic Systems,
Measurement and Control, (G), 94, str.3-4. Zadeh, L.A. 1973. Outline of a new approach to the analysis of complex systems
and decision processes. IEEE Transactions on systems, Man and Cybernetics, SMC, 3(1), str.28-44.
Zadeh, L. 1965. Fuzzy sets. Information and control, 8, str.338-353. Zhu, G., Hu, J., Qi, J., Gu, C., & Peng, Y. 2015. An integrated AHP and VIKOR for
design concept evaluation based on rough number. Advanced Engineering Informatics, 29, str.408-418.
Zhu, K.J., Jing, Y., & Chang, D.Y. 1999. A discussion on extent analysis method and applications on fuzzy AHP.European Journal of Operational Research, 116(18), str.450-456.
Zoranović, T., & Srđević, B. 2003. Primer primene AHP u grupnom odlučivanju u poljoprivredi. . U: 30. Simpozijum o operacionim istraživanjima (SYM-OP-IS), Herceg Novi. , str.723-726
727
Boža
nić,
D.,
et a
l., U
se o
f the
fuzz
y AH
P - M
ABAC
hyb
rid m
odel
in ra
nkin
g po
tent
ial lo
catio
ns fo
r pre
parin
g la
ying-
up p
ositio
ns p
p. 7
05–7
29
ГИБРИДНАЯ МОДЕЛЬ FUZZY AHP (FUZZY ANALYTICAL HIERARCHY PROCESS) МЕТОДА АНАЛИТИЧЕСКОЙ ИЕРАРХИИ В НЕЧЕТКИХ УСЛОВИЯХ – MABAC (MULTI-ATTRIBUTIVE BORDER APPROXIMATION AREA COMPARISON) ДЛЯ РАНЖИРОВАНИЯ ПОТЕНЦИАЛЬНЫХ ПОЗИЦИЙ УСТРОЙСТВА ЗАМАСКИРОВАННЫХ ПРИЧАЛОВ
Дарко И. Божанич, Драган С. Памучар, Самед М. Карович
Университет обороны в г. Белград, Военная академия, Белград, Республика Сербия ОБЛАСТЬ: математика, oперационные исследования ВИД СТАТЬИ: оригинальная научная статья ЯЗЫК СТАТЬИ: английский
Резюме:
В работе представлена гибридная модель FAHP-MABAC. Фаззифицированная шкала Саати с методом AHP (FAHP) приме-няется для определения весовых коэффициентов критериев. Ме-тод MABAC применяется в процессе оценки и ранжирования аль-тернатив. Гибридная модель разработана для поддержки приня-тия решений при выборе позиций для устройства замаскирован-ных причалов (объекты, предназначенные для скрытия, защиты и маневров боевых кораблей).
Ключевые слова: выбор позици, fuzzy AHP, MABAC.
HIBRIDNI MODEL FUZZY AHP-MABAC ZA RANGIRANJE POTENCIJALNIH LOKACIJA ZA IZRADU MASKIRNIH VEZOVA Darko I. Božanić, Dragan S. Pamučar, Samed M. Karović
Univerzitet odbrane u Beogradu, Vojna akademija, Beograd, Republika Srbija OBLAST: matematika, operaciona istraživanja VRSTA ČLANKA: originalni naučni članak JEZIK ČLANKA: engleski Sažetak:
U radu je predložen hibridni model FAHP-MABAC. Fazifikovana Saaty-jeva skala sa metodom AHP (FAHP) primenjuje se za definisanje težinskih koeficijenata kriterijuma. Metoda MABAC primenjena je u procesu evaluacije i rangiranja alternativa. Hibridni model razvijen je za podršku odlučivanju pri izboru lokacija za izradu maskirnih vezova (objekti namenjeni za prikrivanje, zaštitu i manevar vojnih brodova).

728
VOJN
OTE
HN
IČK
I GLA
SN
IK /
MIL
ITA
RY
TE
CH
NIC
AL
CO
UR
IER
, 201
6., V
ol 6
4, N
o 3 Uvod
U ovom radu prikazan je hibridni model korišćenjem fazifikovane Saaty-jeve skale i metode analitičkog hijerarhijskog procesa (FAHP) i metode MABAC (Multi-Attributive Border Approximation area Comparison) – model FAHP-MABAC. U radu su ukratko opisane metode koje se primenjuju, sa detaljnijom razradom fazifikacije Saaty-jeve skale i metode MABAC. Hibridni model FAHP-MABAC izrađen je za podršku odlučivanju prilikom izbora lokacija za izradu maskirnih vezova.
U delu pod nazivom Opis metoda koje se primenjuju u hibridnom modelu FAHP-MABAC opisane su primenjene metode kroz nekoliko podnaslova:
U tekstu pod naslovom Fuzzy logika i fuzzy skupovi ukratko je izvršeno definisanje fuzzy skupa, izbor oblika funkcije pripadnosti i intervala poverenja.
U tekstu pod naslovom Analitički hijerarhijski proces i Saaty-jeva skala ukratko su predstavljene osnove analitičkog hijerarhijskog procesa i prikazana klasična Saaty-jeva skala.
Fazifikacija Saaty-jeve skale
U literaturi se može pronaći veliki broj fazifikacija Saaty-jeve skale. Fazifikacija se najčešće vrši tako što se umesto stepena poređenja definišu fuzzy brojevi sa unapred definisanim intervalima poverenja. Osnovna ideja fazifikacije Saaty-jeve skale u ovom radu jeste da intervali poverenja budu definisani nakon završenog poređenja u parovima od strane donosilaca odluke –eksperata. Stoga je definisano da je interval poverenja svakog fuzzy broja, koji definiše stepen poređenja, povezan sa stepenom uverenosti donosilaca odluka – eksperata u datu tvrdnju. Drugim rečima, interval poverenja proračunava se na osnovu stepena uverenosti donosilaca odluka γji, a prema tabeli 2.
Metoda MABAC
U ovoj celini prikazani su standardni koraci metode MABAC: 1) formiranje početne matrice odlučivanja (X), 2) normalizacija elemenata početne matrice, 3) proračun elemenata otežane matrice (V), 4) određivanje matrice graničnih aproksimativnih oblasti (G), 5) proračun elemenata matrice udaljenosti alternativa od granične aproksimativne oblasti (Q) i 6) rangiranje alternativa.
Rangiranje alternativa – lokacija za izradu maskirnih vezova primenom hibridnog modela FAHP-MABAC
U ovoj celini prikazana je praktična primena hibridnog modela FAHP-MABAC. Prikaz primene izvršen je kroz dve faze.U prvoj fazi identifikovani su kriterijumi i proračunati težinski koeficijenti kriterijuma. Po identifikovanim kriterijumima vrši se ocena alternativa. Identifikovano je pet kriterijuma (uslovi maskiranja, obim radova, stepen zaštite, povoljnost za uplovljavanje i isplovljavanje i uslovi terena za organizaciju neposrednog obezbeđenja) i definisani njihovi težinski koeficijenti (

729
Boža
nić,
D.,
et a
l., U
se o
f the
fuzz
y AH
P - M
ABAC
hyb
rid m
odel
in ra
nkin
g po
tent
ial lo
catio
ns fo
r pre
parin
g la
ying-
up p
ositio
ns p
p. 7
05–7
29
tabela 7).U drugoj fazi izvršena je evaluacija i izbor optimalne alternative. Rangirane su ocene i deset alternativa.
Analiza osetljivosti rezultata sprovedena je promenom početnih težinskih koeficijenata kriterijuma evaluacije. Takođe, pokazala je stabilnost rezultata u odnosu na veći broj scenarija.
Hibridnim modelom FAHP-MABAC uspešno je izvršena evaluacija i rangiranje predloženih alternativa.
Ključne reči: izbor lokacije, fuzzy AHP, MABAC. Paper received on / Дата получения работы / Datum prijema članka: 12. 10. 2015. Manuscript corrections submitted on / Дата получения исправленной версии работы / Datum dostavljanja ispravki rukopisa: 21. 04. 2016. Paper accepted for publishing on / Дата окончательного согласования работы / Datum konačnog prihvatanja članka za objavljivanje: 23. 04. 2016. © 2016 The Authors. Published by Vojnotehnički glasnik / Military Technical Courier (www.vtg.mod.gov.rs, втг.мо.упр.срб). This article is an open access article distributed under the terms and conditions of the Creative Commons Attribution license (http://creativecommons.org/licenses/by/3.0/rs/). © 2016 Авторы. Опубликовано в "Военно-технический вестник / Vojnotehnički glasnik / Military Technical Courier" (www.vtg.mod.gov.rs, втг.мо.упр.срб). Данная статья в открытом доступе и распространяется в соответствии с лицензией "Creative Commons" (http://creativecommons.org/licenses/by/3.0/rs/). © 2016 Autori. Objavio Vojnotehnički glasnik / Military Technical Courier (www.vtg.mod.gov.rs, втг.мо.упр.срб). Ovo je članak otvorenog pristupa i distribuira se u skladu sa Creative Commons licencom (http://creativecommons.org/licenses/by/3.0/rs/).