
An employment of flow cytometry to plant · PDF fileCharles University in Prague, Faculty of...
55
Charles University in Prague, Faculty of Science, Department of Botany An employment of flow cytometry into plant biosystematics J a n S u d a 2004 P h D . T h e s i s Supervisor: Jan Kirschner
Transcript of An employment of flow cytometry to plant · PDF fileCharles University in Prague, Faculty of...
Charles University in Prague, Faculty of Science, Department of Botany
An employment of flow cytometry
into plant biosystematics
J a n S u d a
2004
P h D . T h e s i s
Supervisor: Jan Kirschner


D e d i c a t e d t o m y p a r e n t s , g r a n d m o t h e r a n d
m y w i f e R a d k a . . .
. . . t h e y k n o w w h y . . .


ACKNOWLEDGEMENTS
It would have been very difficult to complete this thesis if my friends and colleagueshad not helped me in so many ways.
I am very indebted to Jaroslav Doležel and his co-workers from the Laboratory ofMolecular Cytogenetics and Cytometry, Olomouc (mainly Martin A. Lysák, Jan Vrána andJan Bartoš) for the introduction to the flow cytometry arena and for their strongencouragement from the very beginning of my own work. They set high standard and I havedone my best to follow their way knowing that ‘all peaks should be very narrow andsymmetrical’.
A huge majority of measurements have been performed at the Laboratory of flowcytometry, Průhonice. I have shared that workplace with Anna Krahulcová and we spentmany hours discussing both the current contribution and long-term perspectives of cytometrictechniques in plant biosystematics.
The manuscripts were reviewed by my supervisor Jan Kirschner who offerednumerous comments, amendments and remarks, and also provided conversion from Czenglishto English.
My thanks should be extended to many other colleagues from both of my employers(Charles University in Prague and Institute of Botany, Průhonice) who contributed to thefriendly atmosphere and gave several interesting ideas and suggestions about cytometricanalyses. Both items are to the same degree applicable to several of my students.
Special acknowledgement deserve all my friends outside the flow cytometric world,notably those grouped in the BPR. We have gone through countless pleasant and funnyexperiences over years and they always remembered me that not only peaks are part of thelife.
I would like to give a warmest thank for their understanding and support to myparents, grandmother, and particularly to my wife Radka. She was of immense patience whenI was spending days and nights among lenses, cuvettes and fluorochromes, and always stoodby me with her charming smile when she was urgently needed.
A comprehensive list of friends and colleagues who have had direct or indirect impacton my thesis would cover several pages and it was extremely difficult to single out a fewforegoing names. Finally, to all of you - either mentioned or not – I would like to say again:‘Thank you’.
Prague, February 4th 2004 Jan Suda
1
T H E S I S C O N T E N T
Summary …………………………………………………………………………………….. 2
List of papers …………………………………………………………………………..……. 3
Glossary ……………………………………………………………………………………… 4
Introduction …………………………………………………………………………………. 6What is flow cytometry? ……….…………………………………………………….. 6Instrumentation ………………………………………………………………………. 6Brief history ………………………………………………………………………….. 9FCM and plant sciences .……………………………………………………………. 10FCM analysis of nuclear DNA content …………………………………………….. 11Fluorochromes .……………………………………………………………………… 11Data output and interpretation .……………………………………………………… 13Adjustment and standardization .……………………………………………………. 14Advantages of FCM ………………………………………………………………… 16Limitations of FCM …………………………………………………………………. 17Related techniques .………………………………………………………………….. 18
Applications of flow cytometry in current plant biosystematics ..……………………… 19Ploidy level estimation ……………………………………………………………… 19Nuclear DNA content determination .……………………………………………….. 22Reproduction mode screening ………………………………………………………. 27Double check before you publish …………………………………………………… 28Best practice for nuclear DNA content estimation using flow cytometry ......……… 31
Future perspectives ...……………………………………………………………………… 33Troublesome material – how to deal with? .………………………………………… 33Ploidy level estimation in herbarium vouchers .…………………………………….. 36Nuclear DNA content determination in pollen grains ………………………………. 40Obscure histogram instead of epilogue …...………………………………………… 41
References ………………………………………………………………………………….. 42
Articles 1 – 8
Appendix
2
S U M M A R Y
This thesis is a culmination of my more than three-year work (2000-2003) in the fieldof flow cytometry. The principal task was to establish the technique in the Institute of Botany,Academy of Sciences, Průhonice and in the Department of Botany, Charles University inPrague. This aim was coupled with an endeavour to identify new and promising domainswhere flow cytometry should be particularly beneficial, and to disseminate gained knowledgeamong other colleagues and students.
The first part of the PhD. thesis summarizes general information about flow cytometryand its utilization in current plant biosystematics. Sources of errors and a short guide forreliable data acquisition are presented. The chapter includes also topics that are believed torepresent future ‘hot-spots’ in plant-flow-biosystematics. The second part contains a set ofeight articles (incl. one popularization) demonstrating an efficient application of flowcytometry in various branches of plant biosystematics.
Ploidy levels in Vaccinium sect. Oxycoccus were estimated in the Paper I. Subsequentmorphometric analyses identified both species- and cytotype-specific characters that allowedto propose an unbiased and robust taxonomic treatment of the group. Comprehensive cytotypescreening at fine spatial scale was performed in the Paper II. Sympatric occurrence of variousploidy levels was found to be quite a common phenomenon in cranberry populations, bringingfurther support for taxonomic concept deduced in the previous work.
Flow cytometry proved successful in the detection of rare cytotypes, as documentedby a revelation of a new triploid plant (presumably of hybrid origin) in the genus Empetrum(Paper III). Research targeted on cytotype distribution pattern continued in the Paper IV. Co-occurrence of various ploidy levels was repeatedly found, disproving the theory of theirdistinct ecological separation.
Flow cytometric study on alien plants was materialized in the Paper V. Surprisingvariation in DNA-ploidy levels was detected within Reynoutria species collected in the CzechRepublic.
An attempt to untangle the puzzle of polyploid Lamium subg. Galeobdolon resulted inan extensive investigation of karyological, morphological, and isozyme variations (Paper VI).Once again, only karyologically-confirmed individuals were involved, thus the conclusionsand implications are not negatively influenced by subjective plant determination.
Paper VII concentrates on nuclear DNA content estimation in Macaronesianangiosperms (the first study of DNA content variation in insular flora). Remarkableconcentration of species with very small DNA amounts was revealed, suggesting that rapidinsular radiation is associated with genome diminution.
Beginner-friendly information on plant flow cytometry is encapsulated in the PaperVIII (I apologize to all readers not familiar with Czech language).
3
L I S T O F P A P E R S
I. Suda J. & Lysák M. A. (2001): A taxonomic study of the Vaccinium sect. Oxycoccus(Hill) W.D.J. Koch (Ericaceae) in the Czech Republic and adjacent territories. – FoliaGeobotanica 36/3: 303-319.
II. Suda J. (xxxx): Sympatric occurrences of various cytotypes of Vaccinium sect.Oxycoccus (Ericaceae). – Nordic Journal of Botany 22/5: xx-xx. (in press).
III. Suda J. (2002): New DNA ploidy level in Empetrum (Empetraceae) revealed by flowcytometry. – Annales Botanici Fennici 39/2: 133-141.
IV. Suda J., Malcová R., Abazid D., Baňas M., Procházka F., Šída O. & Štech M. (xxxx):Cytotype distribution pattern in Empetrum (Ericaceae) at various spatial scales in theCzech Republic. – Folia Geobotanica 39/2: xx-xx (accepted).
V. Mandák B., Pyšek P., Lysák M. A., Suda J., Krahulcová A. & Bímová K. (2003):Variation in DNA-ploidy levels of Reynoutria taxa in the Czech Republic. – Annals ofBotany (London) 92/4: 265-272.
VI. Rosenbaumová R., Plačková I. & Suda J. (2004): Variation in Lamium subg.Galeobdolon (Lamiaceae) – insights from ploidy levels, morphology and isozymes. –Plant Systematics and Evolution xx: xx-xx (in press).
VII. Suda J., Kyncl T. & Wildová R. (2003): Nuclear DNA amount in MacaronesianAngiosperms. – Annals of Botany (London) 92/1: 153-164.
VIII. Suda J. (xxxx): Co se skrývá za rostlinnou průtokovou cytometrií [What does theplant flow cytometry mean]. – Živa xx: xx-xx (accepted) [in Czech]
4
G L O S S A R Y
C-valueDNA amount in the unreplicated haploid nucleus, irrespective of the ploidy level of
the organism (expressed either in picograms or megabase pairs; 1 pg = 978 Mbp). Restingsomatic cells thus posses 2C DNA amount. In plant kingdom, the values vary from about 0.1pg to 127.4 pg.
Coefficient of variation (CV)An attribute of a histogram peak describing its width (expressed as a percentage). It is
defined as the standard deviation divided by the mean of a series of fluorescence values, andallows to compare the quality of peaks located on different fluorescence channels. CVfundamentally affects the resolution of flow cytometric acquisitions - reasonably lowthreshold (e.g. 3 %) should be kept to guarantee reliable results.
CytotypeOrganisms with different ploidy levels (= number of basic, monoploid, chromosome
sets). They can be treated as separate taxa or merged into one taxon without any autonomousrank.
DAPI4´,6-Diamidino-2-phenylindole – nucleic acid stain with A-T preference. It is excited
in UV, and emits blue fluorescence. Frequently used for ploidy level estimation, yieldinghistograms with very high resolution (low CVs).
DNA content, DNA amountDNA quantity in resting somatic cells of the organism (equivalent to 2C-value).
Flow cytometry (FCM)Method for rapid measurement of optical properties (e.g. fluorescence, light scatter) of
isolated particles (cells, nuclei, chromosomes) moving singly in a narrow liquid stream.Estimation of nuclear DNA content is the most frequent application of FCM in plantbiosystematics.
FluorochromeChemical compound able to absorb light and then emit fluorescence of a different
colour (different wavelength). Three basic types of fluorochromes are used in plant flowcytometry: intercalating (e.g. propidium iodide), A-T specific (e.g. DAPI), and G-C specific(e.g. mithramycin).
5
Genome sizeNuclear DNA amount in the monoploid chromosome set (in polyploids averaged). It
should be calculated according to the formula: 2C-value / ploidy level. Genome size equals C-value in diploid organisms, however, is proportionally smaller in the polyploids.
HistogramTwo-dimensional graph used for a visualization of flow cytometric acquisitions.
Horizontal axis describes the intensity of a recorded signal (usually fluorescence), verticalaxis the number of objects with a given intensity range.
Propidium iodide (PI)Nucleic acid stain intercalating into double-stranded DNA. It is excited with blue-
green light, and emits red fluorescence. Popular fluorochrome for nuclear DNA amountdetermination. It binds also to double-stranded RNA, a pre-treatment with ribonuclease is thusessential.
INTRODUCTION
6
I N T R O D U C T I O N
WHAT IS FLOW CYTOMETRY?
Flow cytometry (FCM) might be broadly defined as a method for measurement ofoptical characteristics (fluorescence, light scatter) of isolated particles (cells, nuclei,chromosomes) that flow one by one in a narrow liquid stream through a powerful beam oflight.
The technique was originally developed for biomedical applications (rapid countingand analysing of blood cells) in the 1960s - 1970s (Doležel 1997a). With a construction ofuser-friendly and versatile flow cytometers during the last two decades, and an invention ofnew fluorochromes, the method has spread into various fields of biological sciences.Currently, FCM is routinely used in clinical diagnostics, biotechnology, and basic and appliedresearch (immunology, molecular biology, genetics, pharmacology, zoology, marine biology,and botany). The power of this technique lies both in the wide range of parameters that can besimultaneously recorded and in the information on how these parameters are distributedwithin the particle population. By using an adequate approach, flow cytometry facilitatesdetermination of various characteristics at cellular (size, shape, granularity, membranepotential, cell cycle, apoptosis) and intracellular levels (DNA and RNA contents, basecomposition, protein content, intracellular pH, calcium concentration, chromosome size,centromeric index, etc.) (Doležel 1997b, Rieseberg et al. 2001). The number of applications isfurther multiplied in more advanced systems equipped with a sorting unit that offers rapidseparation of a defined subpopulation of particles (Doležel et al. 1995).
INSTRUMENTATION
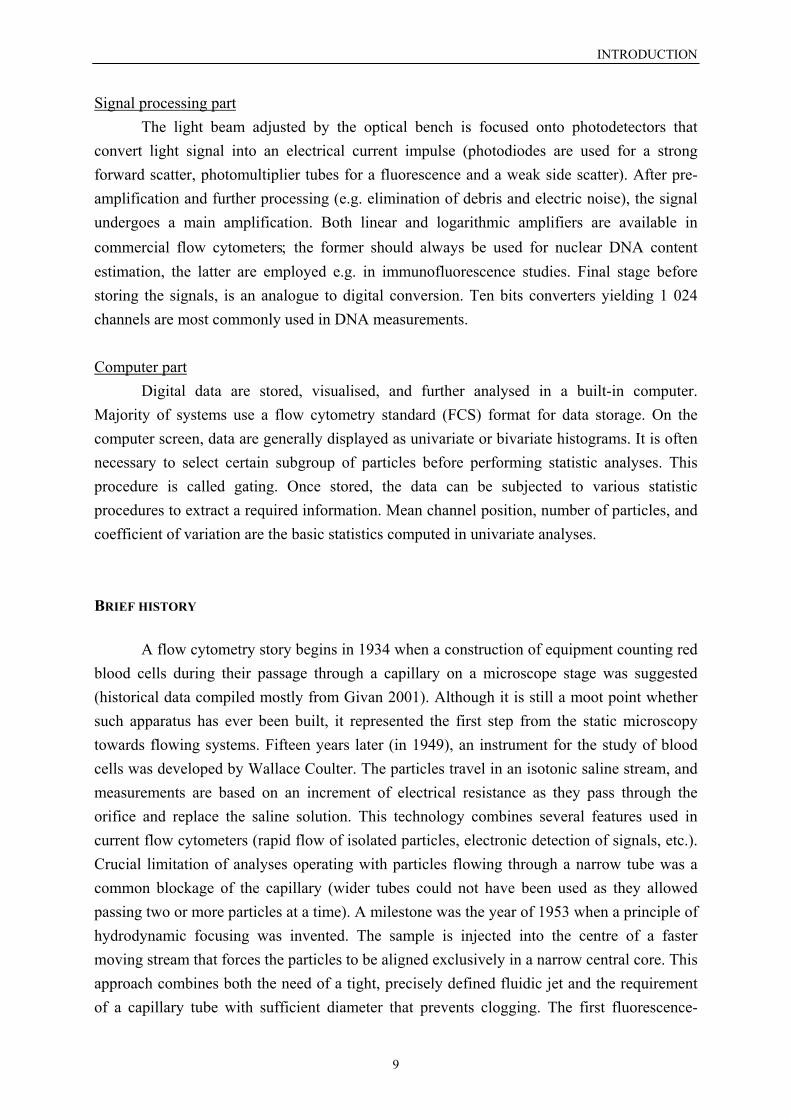
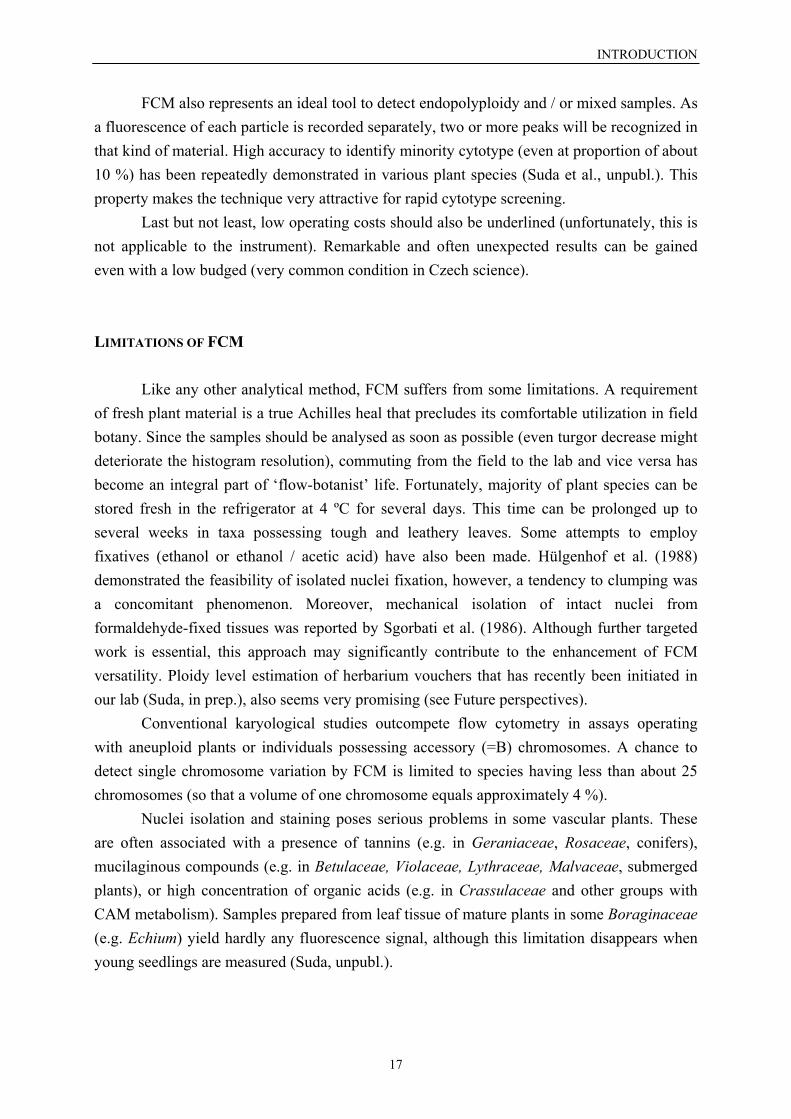
Typical flow cytometer (Fig. 1) consists of five basic operational units (Ormerod1999):
1) light source (laser or arc lamp)2) flow chamber and fluidic system3) optical assembly (lenses, filters, mirrors)4) signal processing part (photodetectors, converters)5) computer part
Light sourcesTwo types of light sources are used in commercial flow cytometers: lasers and/or arc
lamps.
INTRODUCTION
7
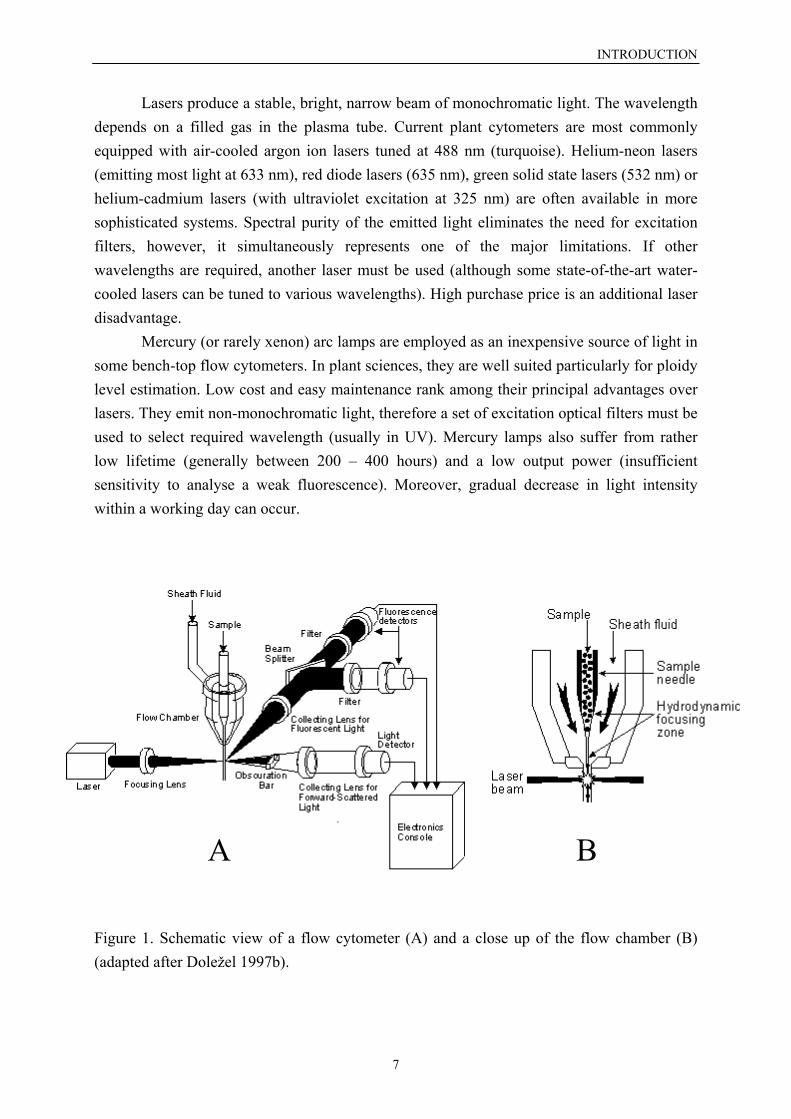
Lasers produce a stable, bright, narrow beam of monochromatic light. The wavelengthdepends on a filled gas in the plasma tube. Current plant cytometers are most commonlyequipped with air-cooled argon ion lasers tuned at 488 nm (turquoise). Helium-neon lasers(emitting most light at 633 nm), red diode lasers (635 nm), green solid state lasers (532 nm) orhelium-cadmium lasers (with ultraviolet excitation at 325 nm) are often available in moresophisticated systems. Spectral purity of the emitted light eliminates the need for excitationfilters, however, it simultaneously represents one of the major limitations. If otherwavelengths are required, another laser must be used (although some state-of-the-art water-cooled lasers can be tuned to various wavelengths). High purchase price is an additional laserdisadvantage.
Mercury (or rarely xenon) arc lamps are employed as an inexpensive source of light insome bench-top flow cytometers. In plant sciences, they are well suited particularly for ploidylevel estimation. Low cost and easy maintenance rank among their principal advantages overlasers. They emit non-monochromatic light, therefore a set of excitation optical filters must beused to select required wavelength (usually in UV). Mercury lamps also suffer from ratherlow lifetime (generally between 200 – 400 hours) and a low output power (insufficientsensitivity to analyse a weak fluorescence). Moreover, gradual decrease in light intensitywithin a working day can occur.
Figure 1. Schematic view of a flow cytometer (A) and a close up of the flow chamber (B)(adapted after Doležel 1997b).
A B

INTRODUCTION
8
Flow chamberFlow chamber (= flow cell, nozzle) represents a central part of the instrument (Fig. 1).
Its mission is to adjust the measured particles in a narrow central stream and to deliver themone after another into a focal point of the light source. This is achieved by so-calledhydrodynamic focusing (Doležel 1991). The sample is injected into a stream of sheath fluid(mostly water or saline solution) moving with a greater velocity and thus confining the samplewithin a central core. The jet then passes through a narrowing flow chamber orifice. Inducedacceleration forces the particles to move singly, and they are delivered to the point ofexcitation (with an accuracy of about 1 µm). Typical stream velocity is between 1 and 10 m/sthat corresponds to several dozens or hundreds of analysed particles per second.
There are three basic types of flow chamber configuration (Doležel 1997b). In ‘jet-in-air’ design, the stream exits from the flow chamber into open air where the particles intersecta light beam. As the flow chamber orifice has a small diameter (typically 75 µm), high speedis attained. This configuration is used in most cell sorters. ‘Enclosed stream’ design operateswith lower velocity (higher sensitivity is often achieved), and the particles are measuredduring their movement in a narrow capillary tube (of about 250 µm in cross-section). Thisarrangement is employed e.g. in Partec flow cytometers that are commonly used inlaboratories working on plant material. In ‘jet on open surface’ design, the particles areanalysed in a stream flowing on a glass coverslip.
Optical assemblyAn optical part of the instrument provides focusing the excitation beam, selection of
required wavelengths, collection of output light and its delivery to the detectors.Non-adjusted laser beam has a circular shape of approximately 1-2 mm in diameter
(Ormerod 1999). However, to fulfil the requirement for identical illumination of each particle,it must be focused with lenses to an appropriate profile. Elliptical spot of about 60 × 20 µm(with longer dimension perpendicular to the sample stream) is preferred for DNA amountanalysis in ‘enclosed stream’ cytometers; spherical beams are often used in ‘jet-in-air’systems.
The output light from illuminating particles (collected through the lens with a highnumerical aperture) consists of various colours. This spectral mixture must be partitioned intospecified wavelengths before reaching the photodetectors. An assembly of optical mirrors,dichroic mirrors, and colour filters is used in this mission. Standard filters accommodated inflow cytometers are the short-pass ones (transmit light below a specified wavelength), long-pass filters (transmit light above a specified wavelength), and band-pass filters (transmit lightover a narrow wavelength band close to the specified value; they are generally usedimmediately in the front of the detectors). Dichroic mirrors (beam splitters) are placed at a 45˚angle in the light path and they work in a similar fashion as filters (reflect vs. transmit light ofspecified wavelengths).
INTRODUCTION
9
Signal processing partThe light beam adjusted by the optical bench is focused onto photodetectors that
convert light signal into an electrical current impulse (photodiodes are used for a strongforward scatter, photomultiplier tubes for a fluorescence and a weak side scatter). After pre-amplification and further processing (e.g. elimination of debris and electric noise), the signalundergoes a main amplification. Both linear and logarithmic amplifiers are available incommercial flow cytometers; the former should always be used for nuclear DNA contentestimation, the latter are employed e.g. in immunofluorescence studies. Final stage beforestoring the signals, is an analogue to digital conversion. Ten bits converters yielding 1 024channels are most commonly used in DNA measurements.
Computer partDigital data are stored, visualised, and further analysed in a built-in computer.
Majority of systems use a flow cytometry standard (FCS) format for data storage. On thecomputer screen, data are generally displayed as univariate or bivariate histograms. It is oftennecessary to select certain subgroup of particles before performing statistic analyses. Thisprocedure is called gating. Once stored, the data can be subjected to various statisticprocedures to extract a required information. Mean channel position, number of particles, andcoefficient of variation are the basic statistics computed in univariate analyses.
BRIEF HISTORY
A flow cytometry story begins in 1934 when a construction of equipment counting redblood cells during their passage through a capillary on a microscope stage was suggested(historical data compiled mostly from Givan 2001). Although it is still a moot point whethersuch apparatus has ever been built, it represented the first step from the static microscopytowards flowing systems. Fifteen years later (in 1949), an instrument for the study of bloodcells was developed by Wallace Coulter. The particles travel in an isotonic saline stream, andmeasurements are based on an increment of electrical resistance as they pass through theorifice and replace the saline solution. This technology combines several features used incurrent flow cytometers (rapid flow of isolated particles, electronic detection of signals, etc.).Crucial limitation of analyses operating with particles flowing through a narrow tube was acommon blockage of the capillary (wider tubes could not have been used as they allowedpassing two or more particles at a time). A milestone was the year of 1953 when a principle ofhydrodynamic focusing was invented. The sample is injected into the centre of a fastermoving stream that forces the particles to be aligned exclusively in a narrow central core. Thisapproach combines both the need of a tight, precisely defined fluidic jet and the requirementof a capillary tube with sufficient diameter that prevents clogging. The first fluorescence-
INTRODUCTION
10
recording cytometer with hydrodynamic focusing was constructed in Los AlamosLaboratories in 1969. At the present, flow cytometry is developing in two directions: 1)complex instruments recording many properties of diverse particles at increasingly higherrates and sensitivity; 2) ‘fool-proof’ (bench-top) cytometers with elementary equipment for aroutine use in laboratories.
FCM AND PLANT SCIENCES
The application of flow cytometry in plant sciences has been markedly delayed incomparison with human or animal biology (Doležel 1991). Although the first article utilizingthis technology appeared already in 1973 (Heller 1973), the technique has been practised onlyin a few laboratories until the early 1980s. The time lag was largely caused by the requirementof a single-particle suspension. As a huge majority of plant cells is incorporated into solid,three-dimensional tissues, a method for their isolation had to be developed.
Protoplasts obtained after enzymatic digestion of cell walls were of primary choice.Unfortunately, intact plasma membrane is not permeable for DNA-specific fluorochromes,and ethanol / acetic acid fixation was essential for their sufficient penetration (Doležel 1991).Moreover, another difficulties were encountered during cytometric acquisitions. They arosefrom a presence of cytoplasmatic DNA, various inclusions (e.g. starch grains), high content ofnatural fluorochromes (e.g. chlorophyll), or non-identical position of the nucleus (due to theshift induced by a large vacuole) (Doležel 1991, Galbraith 1989).
The above-mentioned obstacles can be eliminated in analyses operating with isolatednuclei. It was demonstrated that protoplast lysis in the presence of non-ionic detergents yieldsintact nuclei suitable for flow cytometry (Puite et Ten Broeke 1983). Although this approachwas routinely employed in several laboratories, it still suffered from laborious samplepreparation. A breakthrough in plant flow cytometry emerged in 1983 when David Galbraithand his co-workers presented a simple and rapid method for mechanical isolation of nucleifrom plant tissues (Galbraith et al. 1983). The tissue is chopped with a sharp razor blade in aglass petri dish containing hypotonic buffer supplemented with a non-ionic detergent and afluorochrome. Up to now, this technique has remained by far the most frequent method forsample preparation in plant flow cytometry.
INTRODUCTION
11
FCM ANALYSIS OF NUCLEAR DNA CONTENT
Without any doubt, analysis of nuclear DNA amount is the most widespreadapplication of FCM in plant biosystematics. Background of DNA content estimation lies inthe recording of relative fluorescence of isolated nuclei after their staining with afluorochrome. As the particle (nucleus-fluorochrome complex) intersects the illuminatingbeam, several physical processes occur (Watson 1991):
1) absorption, diffraction, refraction and reflection of the incidental light2) fluorescence (= emission of longer wavelengths when electrons fall from the
excited state to the ground state)Diffraction is generally related to the size (more precisely to the cross-sectional area)
of the object. After blocking the direct beam (with a narrow obscuration bar), any lightscattered at low angles is collected by a photodiode and further processed. This signal iscommonly referred to as forward scatter (FSC).
The light scattered at higher angles (refraction and reflection become increasinglyimportant) is more related to structural features of the particle such as granularity or surfaceirregularity. For convenience, the measurements are made orthogonal to the incidental beamand the signal is referred to as side scatter (SSC, right-angle light scatter). However, neitherFSC nor SSC have found wide utilization in biosystematic studies of vascular plants.
An attention of ‘flow-botanists’ is almost exclusively fastened on the fluorescence.After an absorption of illuminating light, electrons in the fluorochrome molecule move to ahigher energy level. The excited state is, however, not stable and the electrons fall promptlyback to their ground state, releasing a heat and a fluorescent light. Due to the loss of someenergy as heat, the emitted light is always of longer wavelength (and less energy). Thisdifference (so-called Stokes shift) facilitates discrimination between the illuminating and thefluorescent lights (Givan 2001).
FLUOROCHROMES
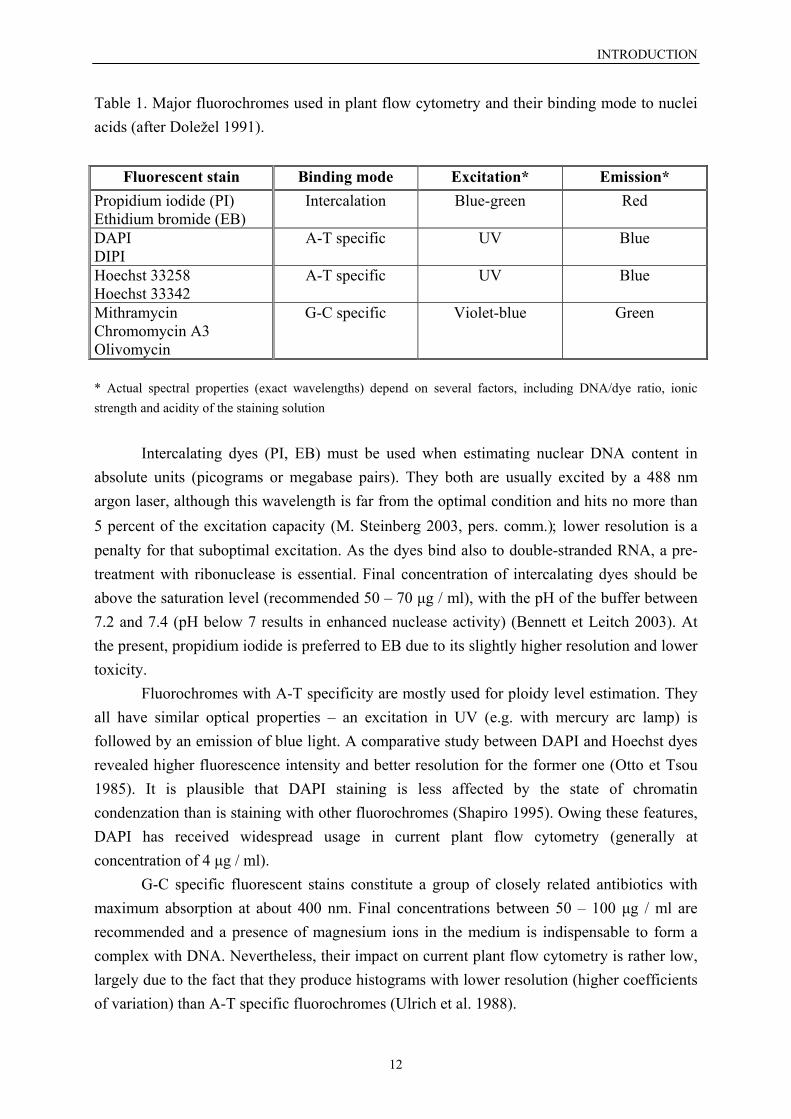
Fluorochromes are chemical compounds able to absorb light and then emitfluorescence of a different colour (different wavelength). DNA-specificity and stoichiometricbinding are essential properties to be employed into analyses of nuclear DNA content. Thefluorescence intensity in free form is weak, however, it increases markedly after their bindingto nucleic acids. Three groups of fluorescent stains can be distinguished with respect to thebinding mode (Doležel 1991): 1) dyes quantitatively intercalating into double-strandednucleic acids; 2) dyes selectively binding to adenine-thymine-rich regions; 3) dyes selectivelybinding to quanine-cytosine-rich regions. A synopsis of the most frequently usedfluorochromes for estimation of nuclear DNA amount in plants is presented in the Table 1.
INTRODUCTION
12
Table 1. Major fluorochromes used in plant flow cytometry and their binding mode to nucleiacids (after Doležel 1991).
Fluorescent stain Binding mode Excitation* Emission*Propidium iodide (PI)Ethidium bromide (EB)
Intercalation Blue-green Red
DAPIDIPI
A-T specific UV Blue
Hoechst 33258Hoechst 33342
A-T specific UV Blue
MithramycinChromomycin A3Olivomycin
G-C specific Violet-blue Green
* Actual spectral properties (exact wavelengths) depend on several factors, including DNA/dye ratio, ionicstrength and acidity of the staining solution
Intercalating dyes (PI, EB) must be used when estimating nuclear DNA content inabsolute units (picograms or megabase pairs). They both are usually excited by a 488 nmargon laser, although this wavelength is far from the optimal condition and hits no more than5 percent of the excitation capacity (M. Steinberg 2003, pers. comm.); lower resolution is apenalty for that suboptimal excitation. As the dyes bind also to double-stranded RNA, a pre-treatment with ribonuclease is essential. Final concentration of intercalating dyes should beabove the saturation level (recommended 50 – 70 µg / ml), with the pH of the buffer between7.2 and 7.4 (pH below 7 results in enhanced nuclease activity) (Bennett et Leitch 2003). Atthe present, propidium iodide is preferred to EB due to its slightly higher resolution and lowertoxicity.
Fluorochromes with A-T specificity are mostly used for ploidy level estimation. Theyall have similar optical properties – an excitation in UV (e.g. with mercury arc lamp) isfollowed by an emission of blue light. A comparative study between DAPI and Hoechst dyesrevealed higher fluorescence intensity and better resolution for the former one (Otto et Tsou1985). It is plausible that DAPI staining is less affected by the state of chromatincondenzation than is staining with other fluorochromes (Shapiro 1995). Owing these features,DAPI has received widespread usage in current plant flow cytometry (generally atconcentration of 4 µg / ml).
G-C specific fluorescent stains constitute a group of closely related antibiotics withmaximum absorption at about 400 nm. Final concentrations between 50 – 100 µg / ml arerecommended and a presence of magnesium ions in the medium is indispensable to form acomplex with DNA. Nevertheless, their impact on current plant flow cytometry is rather low,largely due to the fact that they produce histograms with lower resolution (higher coefficientsof variation) than A-T specific fluorochromes (Ulrich et al. 1988).
INTRODUCTION
13
0
160
320
480
640
800
0 250 500 750 1000
G2/M
G0/G1
Relative fluorescence
Num
ber o
f nuc
lei
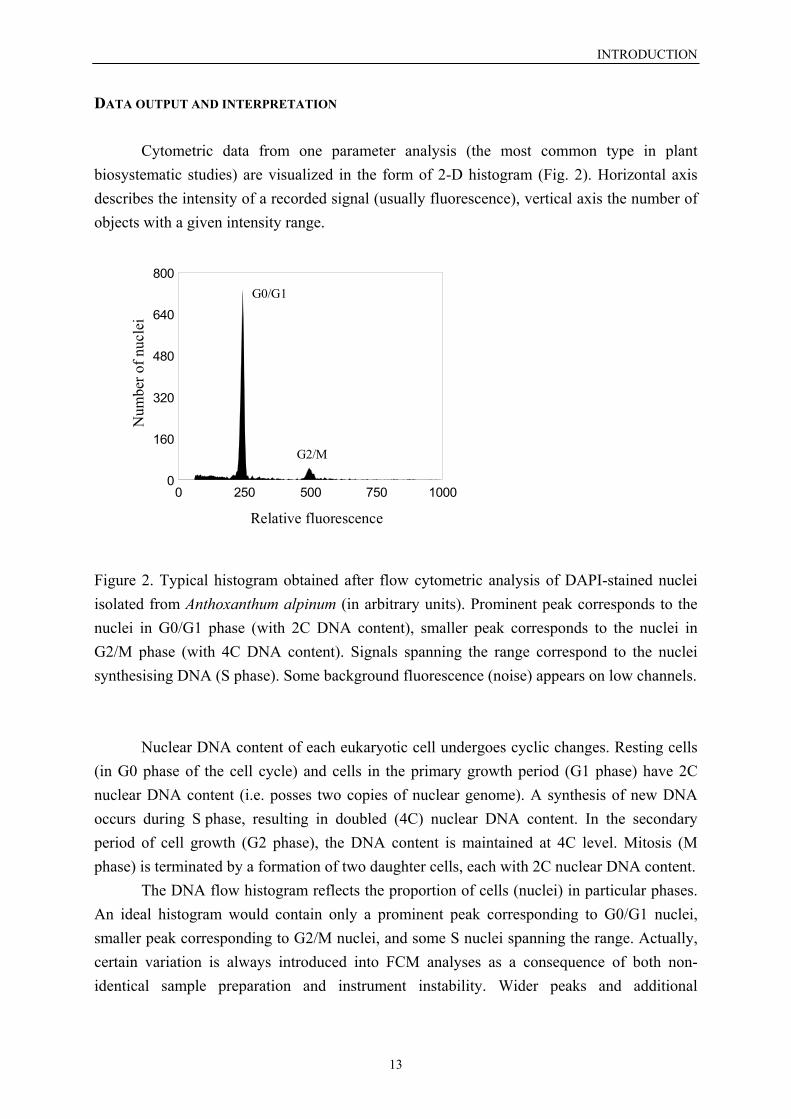
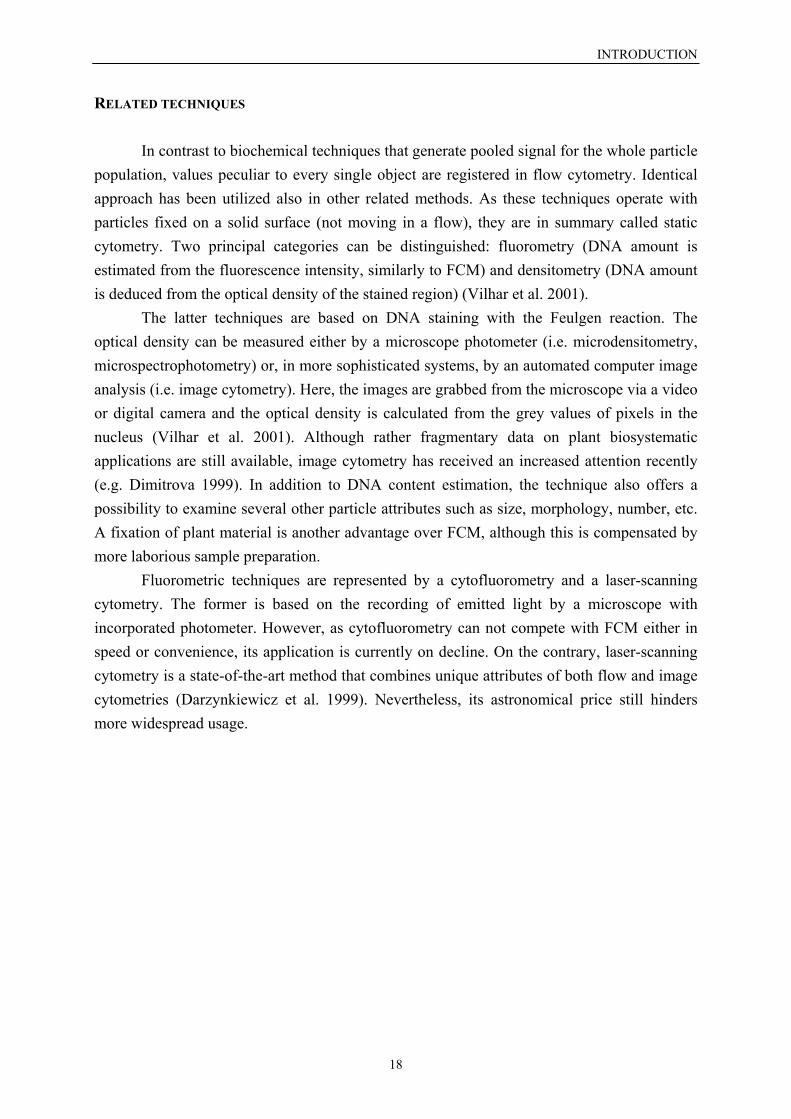
DATA OUTPUT AND INTERPRETATION
Cytometric data from one parameter analysis (the most common type in plantbiosystematic studies) are visualized in the form of 2-D histogram (Fig. 2). Horizontal axisdescribes the intensity of a recorded signal (usually fluorescence), vertical axis the number ofobjects with a given intensity range.
Figure 2. Typical histogram obtained after flow cytometric analysis of DAPI-stained nucleiisolated from Anthoxanthum alpinum (in arbitrary units). Prominent peak corresponds to thenuclei in G0/G1 phase (with 2C DNA content), smaller peak corresponds to the nuclei inG2/M phase (with 4C DNA content). Signals spanning the range correspond to the nucleisynthesising DNA (S phase). Some background fluorescence (noise) appears on low channels.
Nuclear DNA content of each eukaryotic cell undergoes cyclic changes. Resting cells(in G0 phase of the cell cycle) and cells in the primary growth period (G1 phase) have 2Cnuclear DNA content (i.e. posses two copies of nuclear genome). A synthesis of new DNAoccurs during S phase, resulting in doubled (4C) nuclear DNA content. In the secondaryperiod of cell growth (G2 phase), the DNA content is maintained at 4C level. Mitosis (Mphase) is terminated by a formation of two daughter cells, each with 2C nuclear DNA content. The DNA flow histogram reflects the proportion of cells (nuclei) in particular phases.An ideal histogram would contain only a prominent peak corresponding to G0/G1 nuclei,smaller peak corresponding to G2/M nuclei, and some S nuclei spanning the range. Actually,certain variation is always introduced into FCM analyses as a consequence of both non-identical sample preparation and instrument instability. Wider peaks and additional
INTRODUCTION
14
fluorescence signals (noise or background caused by damaged particles, non-specificfluorescence or clumped objects) are the typical symptoms.
An accuracy of FCM analysis is described by the coefficient of variation (CV) of thepeak (defined as the ratio of standard deviation to the mean). It facilitates comparing thequality of peaks located on different fluorescence channels. In contrast to standard deviation,CV is generally not influenced by the peak position (Watson 1992). The CV of nuclei inG0/G1 phase mostly varies from 1 % to 10 % depending on plant material (species with lowDNA content generally yield higher CV), fluorochrome used (DAPI generally gives betterhistograms) and the sample preparation. Nevertheless, only cytometric acquisitions withsufficiently low CVs should be accepted to guarantee reliable data interpretation. Theresolution of FCM histogram critically depends on the CV: assuming identical peak heights insimultaneous analysis, CV lower than half of the difference between DNA contents of theanalysed samples is imperative to achieve their discrimination (e.g. CV equivalent to 3 %would detect 6 % difference in DNA content).
ADJUSTMENT AND STANDARDIZATION
Instrument adjustment has a significant effect on the histogram quality. An accuracyof measurements should be regularly monitored using FCM calibration standards, i.e.biological or artificial particles with a homogenous fluorescence. Stained trout red blood cellsand fluorescent microbeads are routinely used in plant DNA flow cytometry (both give CVsaround 1 – 1.5 %). Optimal operational conditions yield maximum signal amplitude, minimalCV and minimal background.
In addition to the peak quality, a linearity of measurements should also be controlled(so that the modal position of G2/M peak is exactly twice that of G0/G1 peak). A tendency ofsome FCM standards to form clusters (doublets, triplets, etc.) is an appropriate feature forsuch inspection.
FCM estimation of nuclear DNA content always requires an involvement of areference standard (= material with known DNA amount). Ploidy level or genome size of theanalysed plant is determined by a comparison between standard – sample peak positions. Twodifferent types of standardization exist: external and internal (Doležel 1997). In the formerapproach, both standard and sample are prepared and measured separately. Relative peakposition of the reference standard is checked before or after each sample run. However,external standardization may considerably bias the accuracy of measurements due toinstrument instability or non-identical staining conditions. On that account, it should becompletely excluded from plant flow cytometry. Above-mentioned errors can be eliminatedby internal standardization when nuclei from both the reference standard and the sample areisolated, stained, and analysed simultaneously. One internal standard is usually employed,
INTRODUCTION
15
although a secondary reference point may enhance the sensitivity (especially when aneuploidyis suspected) (Pfosser et al. 1995). Plant of the same species with known chromosome number(usually diploid) is generally used as a standard for the ploidy level estimation; severaldifferent plant species (with known 2C-values) are available for the determination of genomesize. The following reference standards have been successfully employed in our lab:Raphanus sativus L. cv. Saxa (2C = 1.11 pg), Lycopersicum esculentum Mill. cv. Stupnicképolní tyčkové rané (2C = 1.96 pg), Glycine max (L.) Merrill cv. Polanka (2C = 2.5 pg), Zeamays L. cv. CE-777 (2C = 5.43 pg), Pisum sativum L. cv. Ctirad (2C = 9.09 pg), and Viciafaba L. (=Faba vulgaris Moench) cv. Inovec (2C = 26.9 pg) (Doležel et al. 1992, Doležel etal. 1994, Lysák et Doležel 1998). Some other reference standards have also beenrecommended (Johnston et al. 1999), however, they mostly posses large genomes and thus donot sufficiently cover the entire range of plant DNA contents.
An accurate determination of nuclear DNA amount should follow some basic rules(particularly when measured in absolute units):
1) small ratio between 2C-values of the analysed plant and the internal standard tominimise potential non-linearity of FCM measurement
2) avoiding very close or overlapping peaks of the analysed plant and the internalstandard
3) accepting only analyses yielding peaks of approximately the same height (toeliminate bias due to greatly different number of particles); at least 5 000 particlesshould be recorded
4) using the same internal standard for all taxa belonging to one genus (or the groupexamined) to facilitate a comparative study
5) re-estimation of absolute nuclear DNA content at least three times on differentdays (by the same operator and the same instrument)
Moreover, herbarium vouchers kept in public herbaria should be available for thematerial being measured by FCM, and each novel 2C-value should be supplemented with achromosome count.
Setting minimal difference between peak positions of the internal standard and thesample to 12 percent, recommended standards for plant material with given 2C-value rangesare presented in the Table 2.
INTRODUCTION
16
Table 2. Internal reference standards recommended for determination of absolute nuclearDNA amount in samples with given 2C-value ranges (orig.).
Sample 2C-value (pg) Recommended reference standard
0 – 0.98, 1.24 – 1.47 Raphanus sativus (2C = 1.11 pg)
0.98 – 1.24, 1.47 – 1.72, 2.20 – 2.80 Lycopersicum esculentum (2C = 1.96 pg)
1.72 – 2.20, 2.80 – 3.68 Glycine max (2C = 2.50 pg)
3.68 – 4.78, 6.08 – 7.03, 8.00 – 10.18 Zea mays (2C = 5.43 pg)
4.78 – 6.08, 7.03 – 8.00, 10.18 – 15.64, 23.67 – 30.13 Pisum sativum (2C = 9.09 pg)
15.64 – 23.67, more than 30.13 Vicia faba (2C = 26.90 pg)
ADVANTAGES OF FCM
Flow cytometry has several important advantages over laborious chromosomecounting:
The sample preparation is very easy and convenient (i.e. chopping and chopping ☺),and it lasts only few minutes. Even the ‘most time-consuming’ two-step procedure involvinga centrifugation does not exceed ten minutes. The particles are measured at high speeds,several dozens per second being usually an optimal rate. Owing to the rapidity, numeroussamples can be investigated within one working day.
High accuracy of FCM assays facilitates detection of minute variation in nuclear DNAamount. Differences as low as four percent have been manifested in several plant species inour laboratory.
Non-destructiveness is another feature of a paramount importance. Only smallquantities of plant tissue (e.g. 0.5 cm2) are required for the sample preparation. This opens away for comprehensive studies of rare and endangered plant species without a risk of theirpopulation destruction or decline. An investigation of seedlings in very early ontogeneticstage is also feasible.
Although young leaves are most frequently used for nuclei isolation, a variety of otherplant tissues can be utilized, i.e. roots, stems, sepals, petals, or seeds (it seems that just juicyfruits do not yield satisfactory histograms). In contrast to conventional karyological studies,mitotically active cells are not indispensable for FCM acquisitions. This advantage will beundoubtedly highly appreciated by everybody whose attempts to find mitoses in microscopicslides were in vain.
INTRODUCTION
17
FCM also represents an ideal tool to detect endopolyploidy and / or mixed samples. Asa fluorescence of each particle is recorded separately, two or more peaks will be recognized inthat kind of material. High accuracy to identify minority cytotype (even at proportion of about10 %) has been repeatedly demonstrated in various plant species (Suda et al., unpubl.). Thisproperty makes the technique very attractive for rapid cytotype screening.
Last but not least, low operating costs should also be underlined (unfortunately, this isnot applicable to the instrument). Remarkable and often unexpected results can be gainedeven with a low budged (very common condition in Czech science).
LIMITATIONS OF FCM
Like any other analytical method, FCM suffers from some limitations. A requirementof fresh plant material is a true Achilles heal that precludes its comfortable utilization in fieldbotany. Since the samples should be analysed as soon as possible (even turgor decrease mightdeteriorate the histogram resolution), commuting from the field to the lab and vice versa hasbecome an integral part of ‘flow-botanist’ life. Fortunately, majority of plant species can bestored fresh in the refrigerator at 4 ºC for several days. This time can be prolonged up toseveral weeks in taxa possessing tough and leathery leaves. Some attempts to employfixatives (ethanol or ethanol / acetic acid) have also been made. Hülgenhof et al. (1988)demonstrated the feasibility of isolated nuclei fixation, however, a tendency to clumping wasa concomitant phenomenon. Moreover, mechanical isolation of intact nuclei fromformaldehyde-fixed tissues was reported by Sgorbati et al. (1986). Although further targetedwork is essential, this approach may significantly contribute to the enhancement of FCMversatility. Ploidy level estimation of herbarium vouchers that has recently been initiated inour lab (Suda, in prep.), also seems very promising (see Future perspectives).
Conventional karyological studies outcompete flow cytometry in assays operatingwith aneuploid plants or individuals possessing accessory (=B) chromosomes. A chance todetect single chromosome variation by FCM is limited to species having less than about 25chromosomes (so that a volume of one chromosome equals approximately 4 %).
Nuclei isolation and staining poses serious problems in some vascular plants. Theseare often associated with a presence of tannins (e.g. in Geraniaceae, Rosaceae, conifers),mucilaginous compounds (e.g. in Betulaceae, Violaceae, Lythraceae, Malvaceae, submergedplants), or high concentration of organic acids (e.g. in Crassulaceae and other groups withCAM metabolism). Samples prepared from leaf tissue of mature plants in some Boraginaceae(e.g. Echium) yield hardly any fluorescence signal, although this limitation disappears whenyoung seedlings are measured (Suda, unpubl.).
INTRODUCTION
18
RELATED TECHNIQUES
In contrast to biochemical techniques that generate pooled signal for the whole particlepopulation, values peculiar to every single object are registered in flow cytometry. Identicalapproach has been utilized also in other related methods. As these techniques operate withparticles fixed on a solid surface (not moving in a flow), they are in summary called staticcytometry. Two principal categories can be distinguished: fluorometry (DNA amount isestimated from the fluorescence intensity, similarly to FCM) and densitometry (DNA amountis deduced from the optical density of the stained region) (Vilhar et al. 2001).
The latter techniques are based on DNA staining with the Feulgen reaction. Theoptical density can be measured either by a microscope photometer (i.e. microdensitometry,microspectrophotometry) or, in more sophisticated systems, by an automated computer imageanalysis (i.e. image cytometry). Here, the images are grabbed from the microscope via a videoor digital camera and the optical density is calculated from the grey values of pixels in thenucleus (Vilhar et al. 2001). Although rather fragmentary data on plant biosystematicapplications are still available, image cytometry has received an increased attention recently(e.g. Dimitrova 1999). In addition to DNA content estimation, the technique also offers apossibility to examine several other particle attributes such as size, morphology, number, etc.A fixation of plant material is another advantage over FCM, although this is compensated bymore laborious sample preparation.
Fluorometric techniques are represented by a cytofluorometry and a laser-scanningcytometry. The former is based on the recording of emitted light by a microscope withincorporated photometer. However, as cytofluorometry can not compete with FCM either inspeed or convenience, its application is currently on decline. On the contrary, laser-scanningcytometry is a state-of-the-art method that combines unique attributes of both flow and imagecytometries (Darzynkiewicz et al. 1999). Nevertheless, its astronomical price still hindersmore widespread usage.
APPLICATIONS OF FLOW CYTOMETRY
19
A P P L I C A T I O N S O F F L O W C Y T O M E T R Y I N C U R R E N TP L A N T B I O S Y S T E M A T I C S
Estimation of nuclear DNA content (either in relative or absolute units) is without anydoubts the most frequent application of FCM in modern plant biosystematics. This approachfacilitates rapid screening of ploidy level, determination of genome size, or convenientdetection of reproduction mode.
PLOIDY LEVEL ESTIMATION
Polyploidy has played a significant role in the evolution of vascular plants - up to80 % of angiosperms and about 95 % of pteridophytes were estimated to be polyploid (Leitchet Bennett 1997). It is unlikely to come as any surprise that FCM has found a large-scaleutilization in plant sciences.
Ploidy level screeningThe knowledge of ploidy level provides a reliable criterion for taxa determination in
numerous taxonomically intricate groups of vascular plants. Representative examples fromCentral-European flora are Veronica hederifolia agg. with three microspecies (2x, 4x, 6x), orGalium mollugo agg. and Polypodium vulgare agg. comprising each two taxa. Themicrospecies from cited alliances differ only negligibly in morphological characters, however,they are unambiguously defined by unique number of chromosomes (ploidy level). Hybrididentification in these groups is far beyond the limits of traditional morphological approach,and ploidy level estimation represents an essential approach for their unbiased detection.Unfortunately, there is still an appreciable deficit of that kind of studies, although I believethat flow cytometry owns a great capacity to elucidate taxonomy in various polyploidcomplexes.
On the contrary, much information has been amassed on FCM utilization in breedingprogrammes of various crops. Industrial applications of flow cytometric ploidy analysis cover(Doležel 1997b):
- screening for haploid plants (e.g. regenerants from anther or ovary cultures)- screening for diploid plants (e.g. spontaneously occurring dihaploids)- screening for triploid plants (e.g. hybrids with low seed production)- screening for higher polyploids (e.g. individuals with high biomass production)- screening for interspecific hybrids- assessing the ploidy purity of seed lots
APPLICATIONS OF FLOW CYTOMETRY
20
Few examples where rapid screening for suitable germplasm has recently beenmaterialized include Medicago sativa (Brummer et al. 1999), Acacia (Blakesley et al. 2002),Citrus (Tusa et al. 2002), or Oxalis tuberosa alliance (Emshwiller 2002). It has beendocumented that the rise of ploidy is often associated with an expression of apomixis(Naumova et al. 1999, Bantin et al. 2001, Quarin et al. 2001). Under artificial conditions, thepolyploidization is usually induced by a colchicine treatment and suitable mutants aresubsequently selected using FCM that can easily cope with high numbers of samples.Similarly, this technique has been routinely employed in the horticulture in order to identifynovel or perspective cytotypes, such as in Dahlia (Gatt et al. 1998), Primula (Kato et Mii2000), or Viola (Ajalin et al. 2002). In addition, flow cytometry has proved successful inploidy estimation of in vitro cultures that are generally characterized by a low mitotic activityprecluding conventional chromosome counting (Winkelmann et al. 1998, Thiem et Śliwińska2003). An ensuing rapid screening of regenerants has also been extensively practised (Vageraet al. 1994, Brutovská et al. 1998).
Aneuploidy and sex detectionIn contrast to routine inspection of ploidy modification, a detection of aneuploidy
(especially when only one chromosome is involved) is much more ambitious task.Nevertheless, it has been documented that the sensitivity of FCM is sufficient to detect apresence of a pair of rye chromosomes in wheat-rye addition lines (Bashir et al. 1993) oraneuploid individuals in triticale (Pfosser et al. 1995). Promising results as to the tentativeidentification of aneuploid plants in Hieracium subg. Pilosella were also achieved in ourlaboratory.
An existence of sex chromosome heteromorphism in some dioecious plants providesan opportunity for male and female separation even at very early stage of their ontogenesis.Costich et al. (1991) demonstrated the feasibility of such task using ‘indirect’ sex comparison;individuals of both sexes were processed separately and their DNA contents weresubsequently compared. Further improvement arose in the study of Doležel et Göhde (1995)who carried out simultaneous analyses. They showed that females in both Melandrium albumand M. rubrum have lower DNA content than males, and precise FCM assays would thusyield two non-overlapping peaks. However, extremely high resolution is a prerequisite forthat kind of analyses due to minute differences in DNA amount between sex chromosomes(small X and large Y).
Endopolyploidy, somatic mosaic, agmatoploidyEndopolyploidy (=endoreduplication, recurrent duplication of DNA without mitosis)
is a common phenomenon in various eukaryotic organisms (Nagl 1976). Flow cytometryrepresents in all probability the most convenient technique for reliable detection of that typeof genome organization.
APPLICATIONS OF FLOW CYTOMETRY
21
Traditionally, it has been believed that endoreduplication is associated with very smallgenomes, assuming a certain minimum amount of DNA necessary for proper cell functions.Recent investigations on vascular plants, however, revealed only low negative correlationbetween genome size and degree of polyploidization (Barow et Meister 2003). On thecontrary, the authors suggested that taxonomic position is the major component determiningthe endopolyploidy, while life cycle, genome size and organ type have only a minority,supporting effect. Brassicaceae (e.g. Galbraith et al. 1991) and succulent plants from variousfamilies (De Rocher et al. 1990, Mishiba et Mii 2000) seem to be more susceptible toendoreduplication. For example, somatic tissues of young cabbage (Brassica oleracea)seedlings exhibited up to 16-fold increase of nuclear DNA content (= 4 rounds of DNAsynthesis without cell division) compared with diploid complement present in resting embryos(Kudo et Kimura 2001a), and even higher DNA amount was observed in mature flowers(Kudo et Kimura 2001b). An increase of DNA content is frequently connected with tissuedifferentiation to a specialized function; storage organs such as endosperm (Kowles et al.1997), cotyledons (Bino et al. 1993), or pod walls (Lagunes-Espinoza et al. 2000) are theillustrate examples. The degree of endoreduplication in particular organs might be influencedby ploidy level as indicated by significant differences between diploid and tetraploidcytotypes of maize (Biradar et al. 1993). Remarkable phenotype manifestation of elevatedDNA amount was described in cultivated azaleas (Rhododendron subg. Tsutsusi) (DeSchepper et al. 2001). Variegated flowers with broad, differently coloured petal edges provedto be somatic mozaic – tetraploid in the edges, diploid in the rest of petals. Gene dosage effectand increased cell size were proposed to be responsible for that kind of flower coloration.
Agmatoploidy (non-lethal chromosome fragmentation owing to the presence of diffusecentromere) is a common feature of two angiosperm families (Juncaceae, Cyperaceae). Thisprocess results in the increase of chromosome number (either proportional to the haploid setor not) under constant nuclear DNA amount. Simultaneous employment of conventionalkaryological counting and flow cytometry is thus obligatory for reliable identification ofagmatoploid individuals.
Population cytotype structureCytotype distribution over vast geographic areas provides useful insight into
population biology of multi-ploid taxa. However, large-scale cytotype investigations had beenenormously time-consuming until flow cytometry was routinely employed (Lewis et al.1967). Fortunately, papers based on 1 500 plus individuals are far from the utopia nowadays(e.g. Burton et Husband 1999). This progress allows to raise numerous challenging questionsof current biosystematics, such as the overall distribution pattern (sympatry vs. parapatry),investigation of evolutionary forces governing the cytotype co-existence, ecologicalpreferences of individual cytotypes, inter- vs. intra-cytotype competition, or mechanisms ofreproductive isolation (Petit et al. 1999).
APPLICATIONS OF FLOW CYTOMETRY
22
Large single cytotype areas were found to be a common feature in several species,Plantago media (van Dijk et al. 1992), Cham(aen)erion angustifolium (Husband et Schemske1998), and Themeda triandra (Liebenberg et al. 1993) being some examples. Contact zonesharbouring two or more cytotypes were very narrow in these taxa and generally did notexceed few kilometres. On the contrary, cytotype mixing over large geographic areas wasencountered e.g. in Pennisetum sect. Brevivalvula (Renno et al. 1995). A co-existence of morecytotypes within a single population undoubtedly deserves particular attention. Thesepopulations are most frequently constituted by diploids and their autotetraploid derivates, asin Artemisia subg. Tridentatae (McArthur et Sanderson 1999) or Centaurea jacea (Hardy etal. 2000). Nevertheless, an intermingling of different polyploids has also been documented:hexaploid and enneaploid individuals grew in natural populations of Andropogon gerardii(Keeler et Davis 1999), tetraploids and hexaploids predominated in Buchloë dactyloides(Johnson et al. 1998). The phenomenon of different cytotype co-existence can be explainedeither by 1) a directional selection or 2) a balanced selection (Weiss et al. 2002). The formertheory assumes that the cytotype intermingling is a transitional stage and one cytotype will befinally outcompeted (minority cytotype exclusion); the latter type of selection assumes thatthe co-existence of different cytotypes can be maintained for a long time due to thedevelopment of various isolating mechanisms. Flowering time divergence observed inArrhenatherum elatius (Petit et al. 1997) and in Dactylis glomerata (Bretagnole et Thompson1996), or microhabitat differentiation in Anthoxanthum alpinum (Felber-Girard et al. 1996)are the examples of prezygotic barriers reducing potential production of hybrids and thusfavouring cytotype co-existence. Similarly, a ‘triploid block’ promoting intra-cytotype matinghas evolved in several diploid-tetraploid groups (Hardy et al. 2001).
NUCLEAR DNA CONTENT DETERMINATION
C-value and genome sizeNuclear DNA amount is an important feature of all living organisms. DNA content in
the unreplicated haploid nucleus (irrespective of the ploidy level of the taxon) is referred to asC-value (Swift 1950). DNA content of the monoploid chromosome set (in polyploidsaveraged) is referred to as genome size. C-value thus equals genome size in diploid species,however, always exceeds genome size in polyploid species. Both C-value and genome sizecan be expressed either in DNA picograms (=10-9 g) or megabase pairs (1 pg = 978 Mbp;Doležel et al. 2003).
Remarkable variation in C-values has been found in plant kingdom (Bennett et Leitch2003): 1C-values range from about 0.16 pg in Arabidopsis thaliana to 127.4 pg in Fritillariaassyriaca, differing about 800-fold. Although even smaller values (e.g. 0.05 pg in Cardamineamara) have been reported, they are bound to be erroneous and were not confirmed by
APPLICATIONS OF FLOW CYTOMETRY
23
subsequent critical investigations. A theoretical minimum for vascular plants is believed to beabout half of the Arabidopsis genome (M. Bennett 2003, pers. comm.). Increasing need for C-value data and their rapid and easy accession led to the publication of several summarizinglists covering data for approx. 1.4 % of the total angiosperm flora (Bennett et Smith 1976,1991, Bennett et al. 1982, 2000, Bennett et Leitch 1995, 1997). Moreover, the C-valuedatabase(s) currently harbouring estimates for 3 927 land plant species are available inelectronic form at Royal Botanical Gardens web page (Bennett et Leitch 2003). Thiscumulative approach allowed to determine major gaps in our knowledge of nuclear DNAamount and propose principal goals for the forthcoming period. Particular attention during lastfew years has been paid to better coverage of plant families. Several targeted works werepublished (Hanson et al. 2001a, b, 2003), nevertheless, the C-values are still unknown forabout 50 percent of angiosperm families (with more data for monocots and basal angiospermsand less for eudicots). Similarly, additional information on nuclear DNA content is urgentlyneeded for pteridophytes, as no more than 82 reliable estimates (from approx. 9 000 species)are available (Bennett et Leitch 2001, Obermayer et al. 2002). Much more satisfactorysituation is encountered in gymnosperms where familiar representation has been completed(Leitch et al. 2001). Mosses have generally been neglected in comparison with vascular plants(Renzaglia et al. 1995, Temsch et al. 1998) until the appearance of precisely targetedinvestigation of Voglmayr (2000) who estimated nuclear DNA amounts for 138 differentmoss taxa representing all major clades (except Sphagnum). Basic descriptive statistics on C-values for all major groups of extant plants are summarized in the Table 3.
Table 3. Basic descriptive statistics on 1C-values for major groups of living plants (data takenfrom Bennett et Leitch 2003, revised).
Mean Lowestvalue
Highestvalue
Mode Median Range Numberof taxa
Bryophytes 0.5 0.17 2.05 0.45 0.43 c. 12 171Pteridophytes 11.5 0.16 72.7 7.95 7.95 c. 450 78Gymnosperms 17.1 2.25 32.2 9.95 16.25 c. 14 265Angiosperms 6.34 0.16 127.4 0.55 2.9 c. 800 3 485
Information on C-value and genome size has been fruitfully utilized in variousbranches of plant sciences. Taxonomists undoubtedly appreciate the fact that some relatedspecies with identical number of chromosomes might differ in DNA volume, being thus easilyrecognizable using FCM. Dimitrova et al. (1999) investigated Bulgarian populations of Crepisfoetida and concluded that - despite the karyotype constancy - subsp. commutata posses about
APPLICATIONS OF FLOW CYTOMETRY
24
0
70
140
210
280
350
0 250 500 750 1000
D. carthusianaD. dilatata
Relative fluorescence
Num
ber o
f nuc
lei
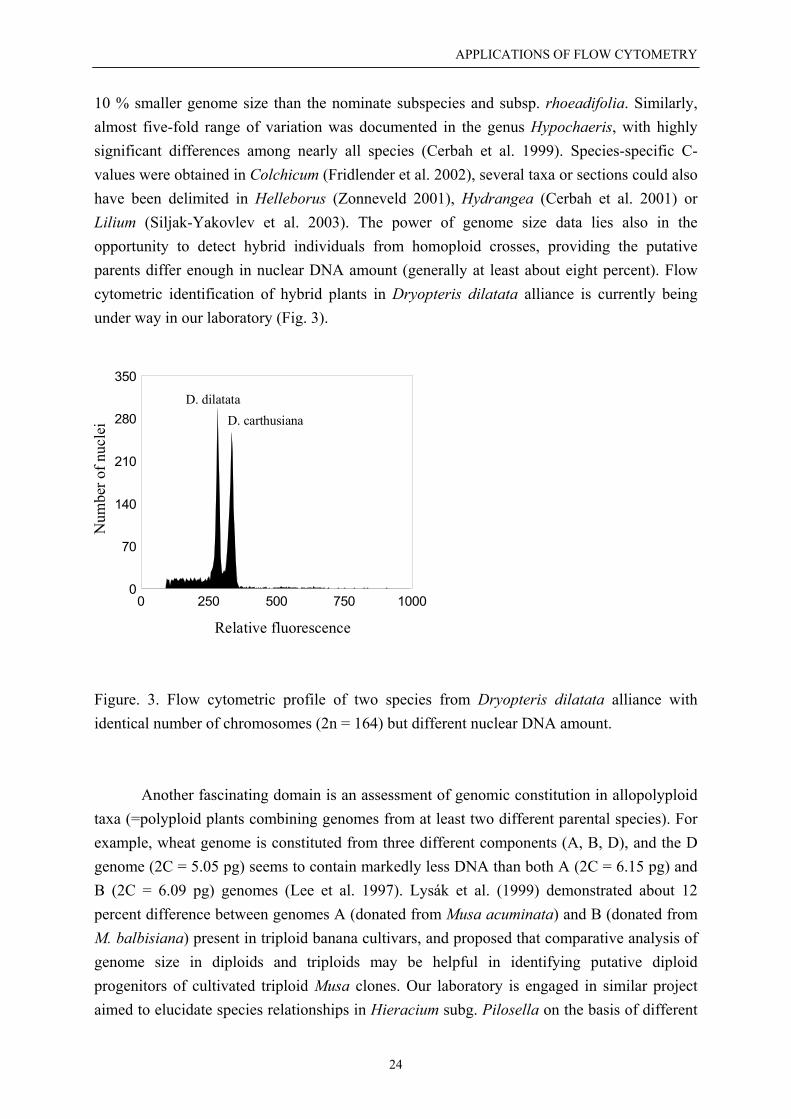
10 % smaller genome size than the nominate subspecies and subsp. rhoeadifolia. Similarly,almost five-fold range of variation was documented in the genus Hypochaeris, with highlysignificant differences among nearly all species (Cerbah et al. 1999). Species-specific C-values were obtained in Colchicum (Fridlender et al. 2002), several taxa or sections could alsohave been delimited in Helleborus (Zonneveld 2001), Hydrangea (Cerbah et al. 2001) orLilium (Siljak-Yakovlev et al. 2003). The power of genome size data lies also in theopportunity to detect hybrid individuals from homoploid crosses, providing the putativeparents differ enough in nuclear DNA amount (generally at least about eight percent). Flowcytometric identification of hybrid plants in Dryopteris dilatata alliance is currently beingunder way in our laboratory (Fig. 3).
Figure. 3. Flow cytometric profile of two species from Dryopteris dilatata alliance withidentical number of chromosomes (2n = 164) but different nuclear DNA amount.
Another fascinating domain is an assessment of genomic constitution in allopolyploidtaxa (=polyploid plants combining genomes from at least two different parental species). Forexample, wheat genome is constituted from three different components (A, B, D), and the Dgenome (2C = 5.05 pg) seems to contain markedly less DNA than both A (2C = 6.15 pg) andB (2C = 6.09 pg) genomes (Lee et al. 1997). Lysák et al. (1999) demonstrated about 12percent difference between genomes A (donated from Musa acuminata) and B (donated fromM. balbisiana) present in triploid banana cultivars, and proposed that comparative analysis ofgenome size in diploids and triploids may be helpful in identifying putative diploidprogenitors of cultivated triploid Musa clones. Our laboratory is engaged in similar projectaimed to elucidate species relationships in Hieracium subg. Pilosella on the basis of different
APPLICATIONS OF FLOW CYTOMETRY
25
C-values of particular taxa. The group under investigation is a typical example oftaxonomically intricate polyploid complex whose structure is substantially influenced byhybridization.
The genome size and C-value may also be beneficial in predicting various phenotypiccharacters, or phenological and ecological behaviour. For this reason, C-values should betreated as a fundamental factor involved in the scaling of living systems (Bennett et al.2000a). Positive correlations were found between DNA amount and nuclear and cell volumes,mitotic cycle duration, and duration of meiosis (Van’t Hof et Sparrow 1963, Evans et Rees1971). The same relationships manifested at tissue and organ levels involve, among others,seed weight and volume (Kenton et al. 1986, Chung et al. 1998). An interest in C-valuesextends also to ecological and environmental issues. Genome size significantly affectsminimum generation time in herbaceous plants: ephemerals, on average, have the smallestgenomes, followed by annuals, whereas obligate perennials have higher DNA amounts(Bennett 1972). Negative correlation between nuclear DNA content and the probability ofbeing recognized as weedy species is thus not surprising (Bennett et al. 1998). Analogously,variation in plant phenology (Grime et Mowforth 1982, Grime et al. 1985), or the sensitivityto frost (MacGillivray et Grime 1995) may be related to genome size. It has beendemonstrated that species with small genomes tend to grow later in the year than species withlarge genomes, and are more susceptible to late-frost events. Development in early springinvolves mainly sudden expansion of cells formed during previous summer, while growthlater in the season is predominantly realized by quick cell divisions. Significant negativecorrelation between genome size in Allium and the first month of flowering (Baranyi etGreilhuber 1999) corroborates the concept. Moreover, Allium species with the highest DNAamount have long dormant period, whereas only very short winter dormancy is typical forspecies with the lowest DNA amount (Ohri et al. 1998). Not only temperature, but also otherenvironmental factors may be mirrored by genome size. Diploids with lower DNA content inthe genus Berberis grew in sites with greater rainfall but lower water availability (Bottini etal. 2000), and negative relationship between precipitation and genome size was observedamong 18 North American Pinus species (Wakamiya et al. 1993). Nevertheless, presentedcorrelations with ecological or climatic variables are certainly not a general property of allplant groups, and no equivalent relationships have been found in numerous other taxa (e.g.Palomino et Sousa 2000).
Another scientific field with practical utilization of C-value data is a modernmolecular research. It has been demonstrated that species with large genomes (C-value above20 pg) may cause problems when investigating by standard AFLP procedure (Bennett et al.2000a). An illustrative example is Alstroemeria (Han et al. 1999) possessing C-values fromca. 18 pg to 39.5 pg (Buitendijk et al. 1997). Protocol modification involving either change inrestriction enzymes or in the number of selective bases was recommended for these taxa.
APPLICATIONS OF FLOW CYTOMETRY
26
Valuable information has been extracted when inspecting C-values data in thephylogenetic context (superimposing DNA values on the robust consensus phylogenetic tree)(Leitch et al. 1998). It was demonstrated that ancestral angiosperms most probably possessedvery small C-values (1.4 pg or less), whereas very large C-values (35 pg and more) representa derived condition that evolved at least twice, in monocots and in higher eudicots (namelyfamily Santalaceae).
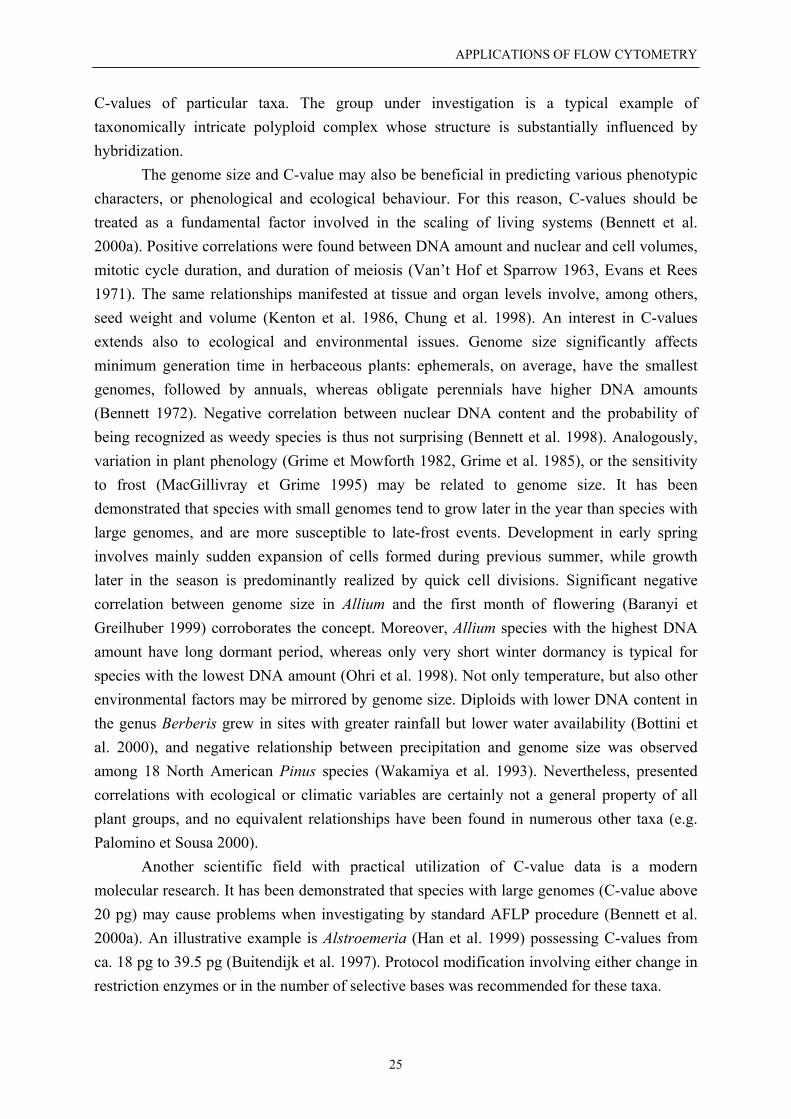
Noteworthy accumulation of angiosperms with very small C-values in theMacaronesia has recently been revealed in our laboratory (Table 4; see also Paper VII).Representatives of Macaronesian endemic genera crown the pattern, and 19 out of 23 generainvestigated (82.6 %) posses very small DNA amounts. Interestingly, only limited variation in1C nuclear DNA content among endemic plants was ascertained, ranging from 0.19 pg inDescurainia bourgeauana to 9.52 in Scilla dasyantha (about 50-fold difference). It isplausible that the selection for small genomes is coupled with rapid angiospermdiversification on islands (adaptive radiation), and with requirements for fast individualdevelopment. The theory of very small genomes preference may also be helpful in theexplanation of very low abundance of DNA-obese geophytes in the Macaronesia.
Table 4. Marked difference in proportions (%) of angiosperms with particular C-values in theMacaronesia and in the rest of the world (data on non-Macaronesian species taken fromBennett et Leitch 2003, revised)
very small(≤ 1.4 pg)
small(1.41 – 3.5 pg)
intermediate(3.51-14 pg)
large(14.01-35 pg)
very large(> 35 pg)
Macaronesian(n = 241)
67.22 20.33 12.45 0 0
Non-Macaronesian(n = 3 478)
32.29 23.29 32.26 10.46 1.70
Base compositionIn addition to nuclear DNA content, the base composition (proportion of AT / GC base
pairs) yield further information about genome organization (Schwencke et al. 1998, Dagher-Kharrat et al. 2001, Ellul et al. 2002, Siljak-Yakovlev et al. 2002). The base compositionobviously differs among plant families (for example, Poaceae have relatively small ATfrequency), but usually exhibits high similarity at lower taxonomic levels (Barow et Meister2002).
Base-specific fluorescent dyes (often DAPI with AT preference) are employed in thatkind of investigations. Although DAPI is being popular in FCM arena for more than twodecades, the exact nature of its binding to DNA still remains rather speculative. Originally,
APPLICATIONS OF FLOW CYTOMETRY
27
linear correlation between DAPI fluorescence and AT base proportion has been expected.Nevertheless, Godelle et al. (1993) reappraised that premise and derived a formula based on acurvilinear relationship between DAPI fluorescent intensity and AT content. They assumedthat certain number of consecutive bases of the same type is necessary to bind a dye molecule(e.g. 3-4 bases were proposed for DAPI, 5 bases for Hoechst 33342). Final algorithm forcalculation of AT bases proportion is as follow:
AT (%) sample = AT (%) standard × (DAPI/PI)1/n, whereDAPI – ratio between standard / sample peak positions in DAPI stainingPI – ratio between standard / sample peak positions in PI stainingn – number of consecutive bases, usually set to 4
Although presented formula has been widely employed into the estimation of basecomposition, recent investigations revealed several inconsistencies. They were attributedeither to the effect of non-randomness of base sequences on dye binding (Barow et Meister2002) or to the incorrectness of simple theory of several consecutive bases (Meister 2003).Measurements performed by the latter author indicated that the binding length for allinvestigated dyes is near to 1, and in no way greater than 2. Similar discrepancies as well asrather fluctuating results when compared the base composition in various species pairs wereexperienced also in our laboratory. In accordance with Barow et Meister (2002), I thus inclineto the résumé that ‘... in general, a good approximation of AT content can be computed on thebasis of the DAPI factor, but important deviations are possible in some cases.’
REPRODUCTION MODE SCREENING
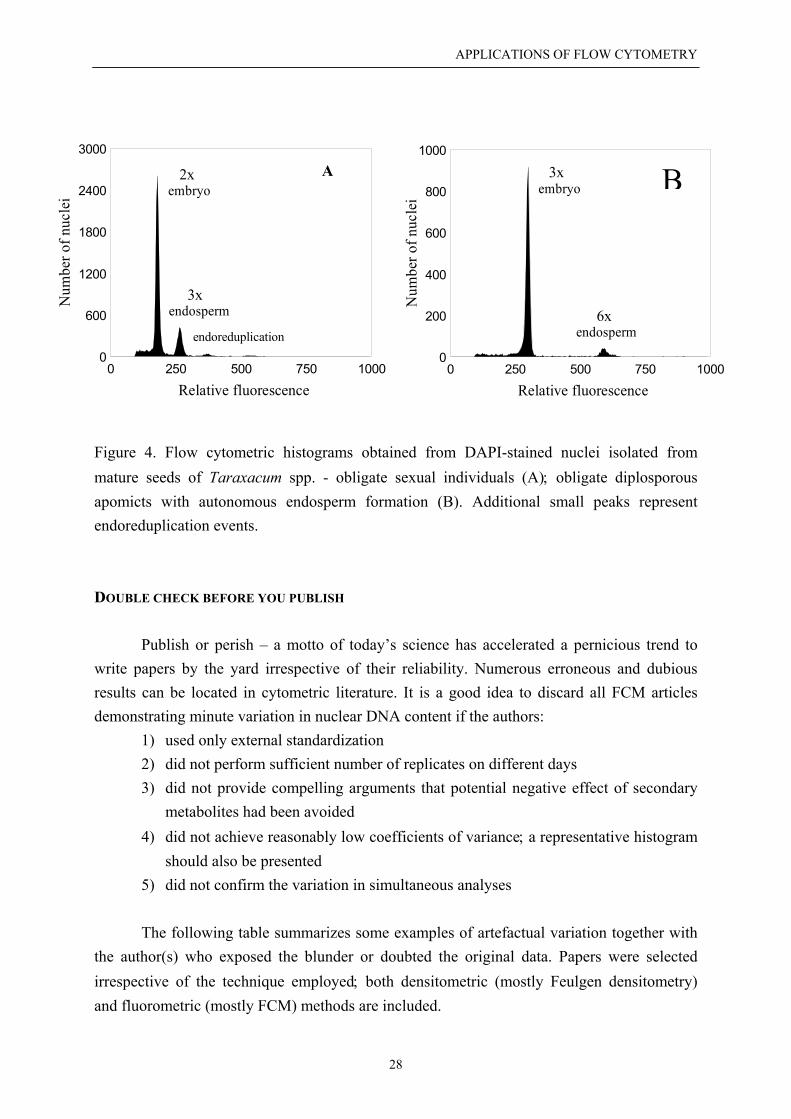
A revolutionary advance in FCM methodology represents an efficient method forreproduction mode screening published recently by Fritz Matzk and his co-workers (Matzk etal. 2000). They brilliantly linked flow cytometry with the knowledge of different proportionalDNA content of embryo and endosperm in mature seeds, depending on the reproductivepathway. Considering the type of male and female gametes (reduced vs. unreduced), theembryo origin (zygotic vs. parthenogenetic), and the endosperm origin (pseudogamous vs.autonomous route), ten different pathways of seed formation can be reconstructed. The novelapproach combines several advantages such as speed, convenience and low cost, and yieldsreliable information on reproductive behaviour useful in various fields of plant sciences. It hassoon been adopted in plant breeding and taxonomy as a powerful tool for reproduction modecharacterization (Cáceres et al. 2001, Heenan et al. 2002). Model histograms obtained in ourlaboratory demonstrating different profiles in sexual and apomictic individuals are shown atFig. 4.
APPLICATIONS OF FLOW CYTOMETRY
28
0
600
1200
1800
2400
3000
0 250 500 750 1000
Relative fluorescence
Num
ber o
f nuc
lei
2xembryo
3xendosperm
endoreduplication0
200
400
600
800
1000
0 250 500 750 1000
Relative fluorescenceN
umbe
r of n
ucle
i
embryo
3x
endosperm
6x
A B
Figure 4. Flow cytometric histograms obtained from DAPI-stained nuclei isolated frommature seeds of Taraxacum spp. - obligate sexual individuals (A); obligate diplosporousapomicts with autonomous endosperm formation (B). Additional small peaks representendoreduplication events.
DOUBLE CHECK BEFORE YOU PUBLISH
Publish or perish – a motto of today’s science has accelerated a pernicious trend towrite papers by the yard irrespective of their reliability. Numerous erroneous and dubiousresults can be located in cytometric literature. It is a good idea to discard all FCM articlesdemonstrating minute variation in nuclear DNA content if the authors:
1) used only external standardization2) did not perform sufficient number of replicates on different days3) did not provide compelling arguments that potential negative effect of secondary
metabolites had been avoided4) did not achieve reasonably low coefficients of variance; a representative histogram
should also be presented5) did not confirm the variation in simultaneous analyses
The following table summarizes some examples of artefactual variation together withthe author(s) who exposed the blunder or doubted the original data. Papers were selectedirrespective of the technique employed; both densitometric (mostly Feulgen densitometry)and fluorometric (mostly FCM) methods are included.
APPLICATIONS OF FLOW CYTOMETRY
29
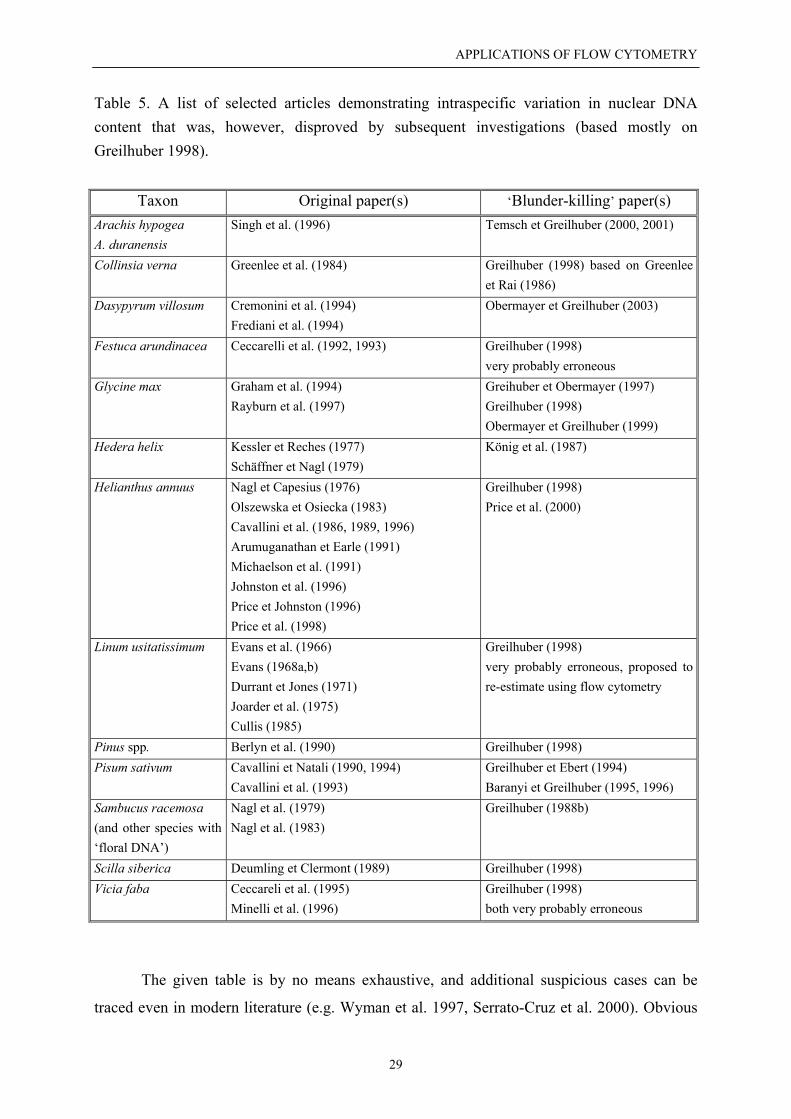
Table 5. A list of selected articles demonstrating intraspecific variation in nuclear DNAcontent that was, however, disproved by subsequent investigations (based mostly onGreilhuber 1998).
Taxon Original paper(s) ‘Blunder-killing’ paper(s)Arachis hypogeaA. duranensis
Singh et al. (1996) Temsch et Greilhuber (2000, 2001)
Collinsia verna Greenlee et al. (1984) Greilhuber (1998) based on Greenleeet Rai (1986)
Dasypyrum villosum Cremonini et al. (1994)Frediani et al. (1994)
Obermayer et Greilhuber (2003)
Festuca arundinacea Ceccarelli et al. (1992, 1993) Greilhuber (1998)very probably erroneous
Glycine max Graham et al. (1994)Rayburn et al. (1997)
Greihuber et Obermayer (1997)Greilhuber (1998)Obermayer et Greilhuber (1999)
Hedera helix Kessler et Reches (1977)Schäffner et Nagl (1979)
König et al. (1987)
Helianthus annuus Nagl et Capesius (1976)Olszewska et Osiecka (1983)Cavallini et al. (1986, 1989, 1996)Arumuganathan et Earle (1991)Michaelson et al. (1991)Johnston et al. (1996)Price et Johnston (1996)Price et al. (1998)
Greilhuber (1998)Price et al. (2000)
Linum usitatissimum Evans et al. (1966)Evans (1968a,b)Durrant et Jones (1971)Joarder et al. (1975)Cullis (1985)
Greilhuber (1998)very probably erroneous, proposed tore-estimate using flow cytometry
Pinus spp. Berlyn et al. (1990) Greilhuber (1998)Pisum sativum Cavallini et Natali (1990, 1994)
Cavallini et al. (1993)Greilhuber et Ebert (1994)Baranyi et Greilhuber (1995, 1996)
Sambucus racemosa(and other species with‘floral DNA’)
Nagl et al. (1979)Nagl et al. (1983)
Greilhuber (1988b)
Scilla siberica Deumling et Clermont (1989) Greilhuber (1998)Vicia faba Ceccareli et al. (1995)
Minelli et al. (1996)Greilhuber (1998)both very probably erroneous
The given table is by no means exhaustive, and additional suspicious cases can be
traced even in modern literature (e.g. Wyman et al. 1997, Serrato-Cruz et al. 2000). Obvious
APPLICATIONS OF FLOW CYTOMETRY
30
accumulation of some authors (e.g. Cavallini, Ceccarelli, Cionini, Minelli, Natali) supplies an
evidence that non-optimal method has been constantly adopted in their laboratory. Therefore,
any other results should also be treated with caution and should not be cited uncritically. Ohri
(1998) summarized additional examples of intraspecific variation reported in angiosperms.
However, as numerous records on that kind of variation have broken down to nothing when
appropriate methods were applied, it would be a good idea to re-analyse the same material
using the best techniques currently available (particularly those taxa that has become textbook
examples, such as Micromeria (Price et al. 1980, 1981a, b)).
A presence of secondary metabolites ranks among important triggers of artefactual
variation. Much knowledge on the deteriorating effect of secondary compounds has been
accumulated for the Feulgen staining (Greilhuber 1988a, b). Polyphenol substances
(particularly tannins) occur commonly in some groups of vascular plants. In intact cells, they
are trapped in vacuoles, however, they are releasing during the sample preparation. As
polyphenols bind strongly to the chromatin (and proteins), they interfere with nuclear dyes
and cause significant reduction of staining intensity. Similar effect can be induced even by
low-molecular weight compounds such as catechin or quercetin (common flavonoid).
Flow cytometric analyses are bound to be negatively influenced in the same way. For
example, Noirot et al. (2000) demonstrated that cytosolic components may markedly affect
fluorochrome accessibility to nuclear DNA. They noted up to 20% decrease in fluorescent
intensity of petunia nuclei after an addition of nuclei-free extract from yam (Dioscorea alata)
leaves. Similarly, reported intraspecific variation in DNA content in sunflower (Helianthus
annuus) leaves can be most simply explained by a variation in the amount of inhibitory
compounds (Price et al. 2000). These nucleus-cytosol interactions clearly highlight the
sensitivity of chromatin structure (e.g. condenzation intensity) to extranuclear factors.
A taxonomic criterion must also be taken into consideration when assessing
intraspecific genome size variation. Scilla bifolia s.l. can be chosen as an instructive example
(Greilhuber et Speta 1985). When this group is treated as a single species, it shows about two-
fold genome size variation. Nevertheless, the variation disappears after its splitting up into
relatively inconspicuous, but natural taxa.
Although I do not a-priori reject the existence of intraspecific variation, I strictlybelieve that this phenomenon is certainly much less common than previously thought. Thetheory of genome size constancy has gained numerous supporting pieces of evidence recently.For example, any significant differences were observed neither among wheat near isolinesdiffering in aluminium tolerance (Wetzel et al. 1999), nor among disjunct populations of
APPLICATIONS OF FLOW CYTOMETRY
31
Abies fraseri (Auckland et al. 2001), and Sesleria albicans (Lysák et al. 2000). Remarkabledegree of stability in nuclear DNA content was also demonstrated in Allium cepa cultivarsoriginating from four continents (Bennett et al. 2000b). Nevertheless, taxa adapted to variousclimates, occurring in diverse habitats over vast geographic area, spatially isolated autogamicraces or crops under long-lasting human selection might potentially manifest some differencein nuclear DNA content. Maize (Zea mays) may be considered as a model crop plantdisplaying variation in C-value. This variation (up to 37 %) was shown to correlate with thesize and number of heterochromatic knobs (Laurie et Bennett 1985, Rayburn et al. 1985).Maize behaviour corresponded well with the nucleotype theory (Bennett 1972) – races havingsmaller genomes (and thus more rapid development) were better adapted to the growth inmore northerly regions. Allopolyploid species with multiple origins represent anothercandidates where intraspecific nuclear DNA content variability may be detected.
BEST PRACTICE FOR NUCLEAR DNA CONTENT ESTIMATION USING FLOW CYTOMETRY
Although basic rules for reliable estimation of nuclear DNA content were presented inthe introductory chapters, they will be summarized here once again. I believe that as long asthese rules are followed, the artefactual variation could be eliminated from FCMmeasurements:
1) internal standardization should always be used2) nuclear DNA contents of the internal standard and the sample should be
reasonably close (but not overlapping or extremely close)3) the same internal standard is recommended for all taxa belonging to the group
examined. If more internal standards are necessary (to span the range of DNAamounts), the secondary standard must be calibrated against the primary one (it isnot a good idea to use tabulated values).
4) young (but not premature), intact, parasite- and disease-free leaves of both sampleand internal standard should be used. The plants should be cultivated under thesame conditions to eliminate potential negative effect of different levels ofsecondary metabolites.
5) intercalating propidium iodide (+ RNAse) at concentration between 50 – 70 µg /ml (pH 7.2 – 7.4) must be chosen as a fluorochrome for DNA contentdetermination in absolute units (more sensitive DAPI with A-T preferenceprovides only expression in relative values)
6) each measurement must be repeated at least three times on different days(repetitions on the same day are useless). If the variation between individual runsexceeds some critical value (personally, I mostly use two-percent threshold),
APPLICATIONS OF FLOW CYTOMETRY
32
additional measurements should be performed. The most out-layered measurementcan be avoided.
7) the peaks of both the internal standard and the sample should be symmetrical (non-skewed) and of approximately the same height. The fluorescence of at least 5 000particles should be recorded.
8) the analyses must not be distorted by the presence of secondary metabolites – themean peak position of the internal reference standard should be located on (almost)identical fluorescence channel in all measurements, either with or without thesample
9) the coefficient of variation of G0/G1 peaks should be reasonably low (generallybelow 3 %, although higher values can be regarded as acceptable e.g. in plantspossessing very small nuclear DNA content)
10) all measurements must be performed on the same flow cytometer with the samelight source of excitation, as small but systematic differences exist betweendifferent types of equipment (Doležel et al. 1998); the same operator is alsorecommended. The cytometer should be adjusted to maximum signal amplitude,minimal CV and minimal background. In Partec intruments, the gain (signalamplification) should not exceed the value of ca. 600 (ideally less than 500).
11) it is advisable to measure at least three individuals per taxon to inspect potentialintraspecific DNA amount variability. In wide-range studies, this point can besubstituted by a realization of simultaneous analysis of several (usually 3-5)individuals. If one narrow and symmetrical peak is achieved, one representativeplant can be selected and further investigated.
12) exact chromosome number should be determined for the material analysed. Thispoint has become absolutely necessary when intraspecific variation is suspected(aneuploidy or a presence of accessory chromosomes may be responsible for thatkind of variation).
13) confirmation of true variability in nuclear DNA content requires additional piecesof inspection. Simultaneous analyses of samples supposed to differ in nuclearDNA content should be performed (bifurcated peak corroborates the theory of non-identical DNA amount). An employment of two reference standards (so that theDNA content of the sample is located in-between) is another advocated approach.The peak ratio of both reference standards should be (almost) the same in allanalyses, either with or without the sample.
14) each estimation should be supplemented by a herbarium voucher kept in publicherbarium
15) last but not least recommendation: the operator should stay cheerful all along theexperimentation ☺
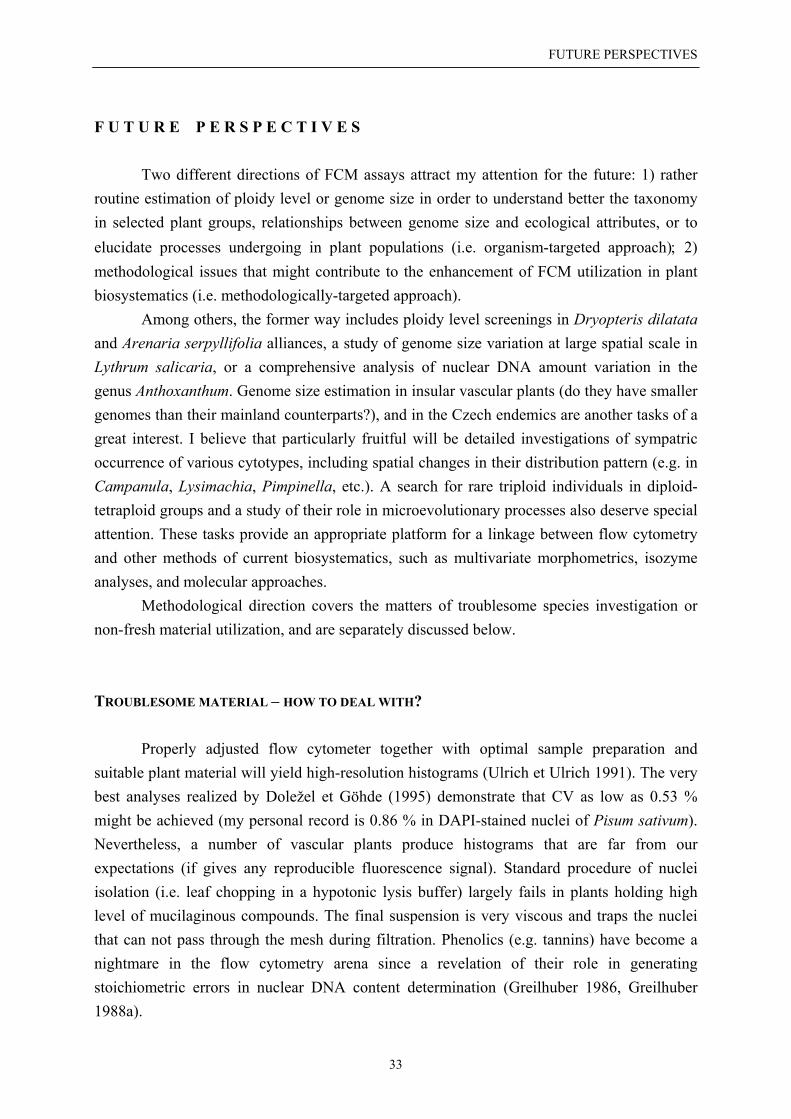
FUTURE PERSPECTIVES
33
F U T U R E P E R S P E C T I V E S
Two different directions of FCM assays attract my attention for the future: 1) ratherroutine estimation of ploidy level or genome size in order to understand better the taxonomyin selected plant groups, relationships between genome size and ecological attributes, or toelucidate processes undergoing in plant populations (i.e. organism-targeted approach); 2)methodological issues that might contribute to the enhancement of FCM utilization in plantbiosystematics (i.e. methodologically-targeted approach).
Among others, the former way includes ploidy level screenings in Dryopteris dilatataand Arenaria serpyllifolia alliances, a study of genome size variation at large spatial scale inLythrum salicaria, or a comprehensive analysis of nuclear DNA amount variation in thegenus Anthoxanthum. Genome size estimation in insular vascular plants (do they have smallergenomes than their mainland counterparts?), and in the Czech endemics are another tasks of agreat interest. I believe that particularly fruitful will be detailed investigations of sympatricoccurrence of various cytotypes, including spatial changes in their distribution pattern (e.g. inCampanula, Lysimachia, Pimpinella, etc.). A search for rare triploid individuals in diploid-tetraploid groups and a study of their role in microevolutionary processes also deserve specialattention. These tasks provide an appropriate platform for a linkage between flow cytometryand other methods of current biosystematics, such as multivariate morphometrics, isozymeanalyses, and molecular approaches.
Methodological direction covers the matters of troublesome species investigation ornon-fresh material utilization, and are separately discussed below.
TROUBLESOME MATERIAL – HOW TO DEAL WITH?
Properly adjusted flow cytometer together with optimal sample preparation andsuitable plant material will yield high-resolution histograms (Ulrich et Ulrich 1991). The verybest analyses realized by Doležel et Göhde (1995) demonstrate that CV as low as 0.53 %might be achieved (my personal record is 0.86 % in DAPI-stained nuclei of Pisum sativum).Nevertheless, a number of vascular plants produce histograms that are far from ourexpectations (if gives any reproducible fluorescence signal). Standard procedure of nucleiisolation (i.e. leaf chopping in a hypotonic lysis buffer) largely fails in plants holding highlevel of mucilaginous compounds. The final suspension is very viscous and traps the nucleithat can not pass through the mesh during filtration. Phenolics (e.g. tannins) have become anightmare in the flow cytometry arena since a revelation of their role in generatingstoichiometric errors in nuclear DNA content determination (Greilhuber 1986, Greilhuber1988a).
FUTURE PERSPECTIVES
34
When run into difficulties, following steps can be taken to enhance a quality of thehistogram:
1) choosing of another isolation and / or staining buffer. Our preferred method fornuclear DNA amount estimation is a two-step procedure originally described byOtto (1990). This approach gives optimal results in the majority of vascularplants. In some groups, a simplified one-step modification can be alternativelyused. LB01 buffer (Doležel et al. 1989) also works well with a variety of species,although it generally yields higher CVs. Tris-MgCl2 buffer (Pfosser 1995) provedto be successful e.g. in Arabidopsis sessions (i.e. taxon possessing very smallgenome). Relevant method for DNA amount determination in seeds (embryo +endosperm) was presented by Matzk et al. (2000). The histogram quality mightalso be significantly affected by a fluorochrome employed (DAPI generally givesbetter resolution than PI). Our results showed that PI-stained nuclei in Rubus spp.(Rosaceae) yielded hardly any reproducible signal in contrast to narrow peaksobtained after their staining with DAPI.
2) inclusion of antioxidants or chemical compounds preserving the nuclei integrity.2-mercaptoethanol is being routinely added into staining buffers to avoidpolyphenol oxidation (recommended concentration of 2 µl / ml). Yokoya et al.(2000) demonstrated that the presence of PVP-40 (at concentrations of at least 10mg / ml) significantly increased the fluorescence intensity and reduced the nucleardebris in the genus Rosa. Without PVP-40 addition, the peaks were oftenundetectable due to the phenolic interference with DNA staining. Therefore, theauthors supposed that the chemical assisted in maintaining the integrity of nuclearenvelope. Similarly, an addition of PVP-10 (1%) into the isolation bufferconsiderably improved histogram quality in Rubus (Thiem et Śliwińska 2003).
3) selection of different plant tissue that would produce acceptable histograms(instead of commonly used leaf laminas). Table 3 presents a list of sometroublesome genera investigated in our lab and tips how to cope with them.Chopping of leaf petioles or young stems is advisable in mucilaginous-richvascular plants (see Fig. 5), shrubby legumes, or some Crassulaceae. Tannin-related problems can be reduced in sessions operating with seeds or seedlings.However, preliminary results indicate that seeds are not suitable for nuclear DNAamount estimation as embryo-nuclei have different staining properties than nucleiisolated from leaves (possibly a consequence of different chromatin structure; seeRival et al. 1997). The fluorescence intensity of seed-nuclei was approximately 10– 20 percent higher than that of leaf-nuclei (observed in simultaneous analyseswith leaf tissue of the internal standard e.g. in Scilla, Lavatera or Marcetella).Further targeted work is essential to test whether an involvement of internalstandard seeds will eliminate this discrepancy. The concentration of tannins can
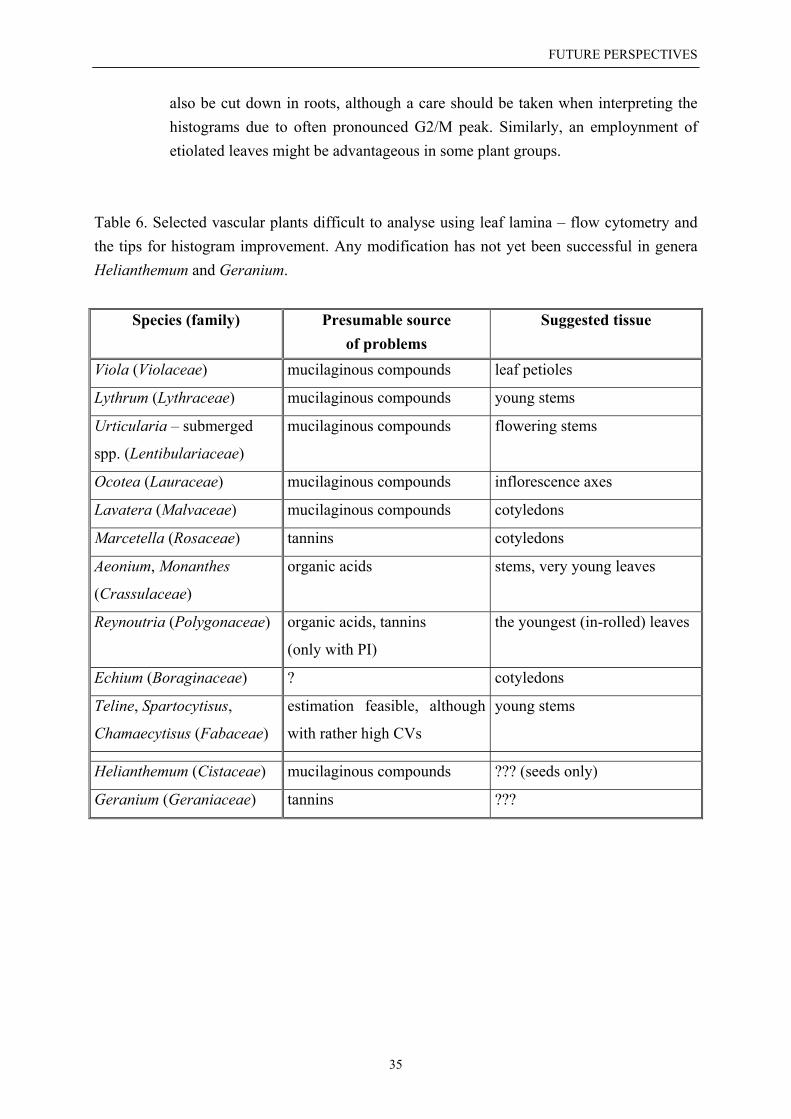
FUTURE PERSPECTIVES
35
also be cut down in roots, although a care should be taken when interpreting thehistograms due to often pronounced G2/M peak. Similarly, an employnment ofetiolated leaves might be advantageous in some plant groups.
Table 6. Selected vascular plants difficult to analyse using leaf lamina – flow cytometry andthe tips for histogram improvement. Any modification has not yet been successful in generaHelianthemum and Geranium.
Species (family) Presumable sourceof problems
Suggested tissue
Viola (Violaceae) mucilaginous compounds leaf petioles
Lythrum (Lythraceae) mucilaginous compounds young stems
Urticularia – submerged
spp. (Lentibulariaceae)
mucilaginous compounds flowering stems
Ocotea (Lauraceae) mucilaginous compounds inflorescence axes
Lavatera (Malvaceae) mucilaginous compounds cotyledons
Marcetella (Rosaceae) tannins cotyledons
Aeonium, Monanthes
(Crassulaceae)
organic acids stems, very young leaves
Reynoutria (Polygonaceae) organic acids, tannins
(only with PI)
the youngest (in-rolled) leaves
Echium (Boraginaceae) ? cotyledons
Teline, Spartocytisus,
Chamaecytisus (Fabaceae)
estimation feasible, although
with rather high CVs
young stems
Helianthemum (Cistaceae) mucilaginous compounds ??? (seeds only)
Geranium (Geraniaceae) tannins ???
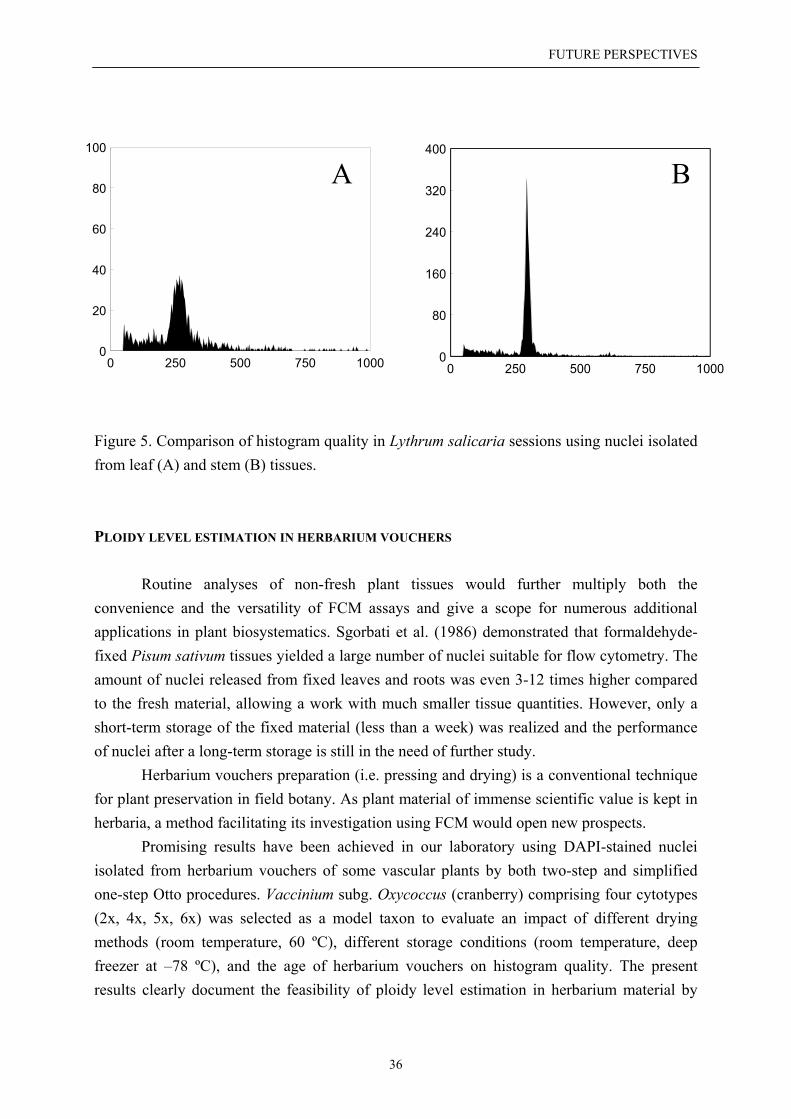
FUTURE PERSPECTIVES
36
0
80
160
240
320
400
0 250 500 750 10000
20
40
60
80
100
0 250 500 750 1000
A B
Figure 5. Comparison of histogram quality in Lythrum salicaria sessions using nuclei isolatedfrom leaf (A) and stem (B) tissues.
PLOIDY LEVEL ESTIMATION IN HERBARIUM VOUCHERS
Routine analyses of non-fresh plant tissues would further multiply both theconvenience and the versatility of FCM assays and give a scope for numerous additionalapplications in plant biosystematics. Sgorbati et al. (1986) demonstrated that formaldehyde-fixed Pisum sativum tissues yielded a large number of nuclei suitable for flow cytometry. Theamount of nuclei released from fixed leaves and roots was even 3-12 times higher comparedto the fresh material, allowing a work with much smaller tissue quantities. However, only ashort-term storage of the fixed material (less than a week) was realized and the performanceof nuclei after a long-term storage is still in the need of further study.
Herbarium vouchers preparation (i.e. pressing and drying) is a conventional techniquefor plant preservation in field botany. As plant material of immense scientific value is kept inherbaria, a method facilitating its investigation using FCM would open new prospects.
Promising results have been achieved in our laboratory using DAPI-stained nucleiisolated from herbarium vouchers of some vascular plants by both two-step and simplifiedone-step Otto procedures. Vaccinium subg. Oxycoccus (cranberry) comprising four cytotypes(2x, 4x, 5x, 6x) was selected as a model taxon to evaluate an impact of different dryingmethods (room temperature, 60 ºC), different storage conditions (room temperature, deepfreezer at –78 ºC), and the age of herbarium vouchers on histogram quality. The presentresults clearly document the feasibility of ploidy level estimation in herbarium material by
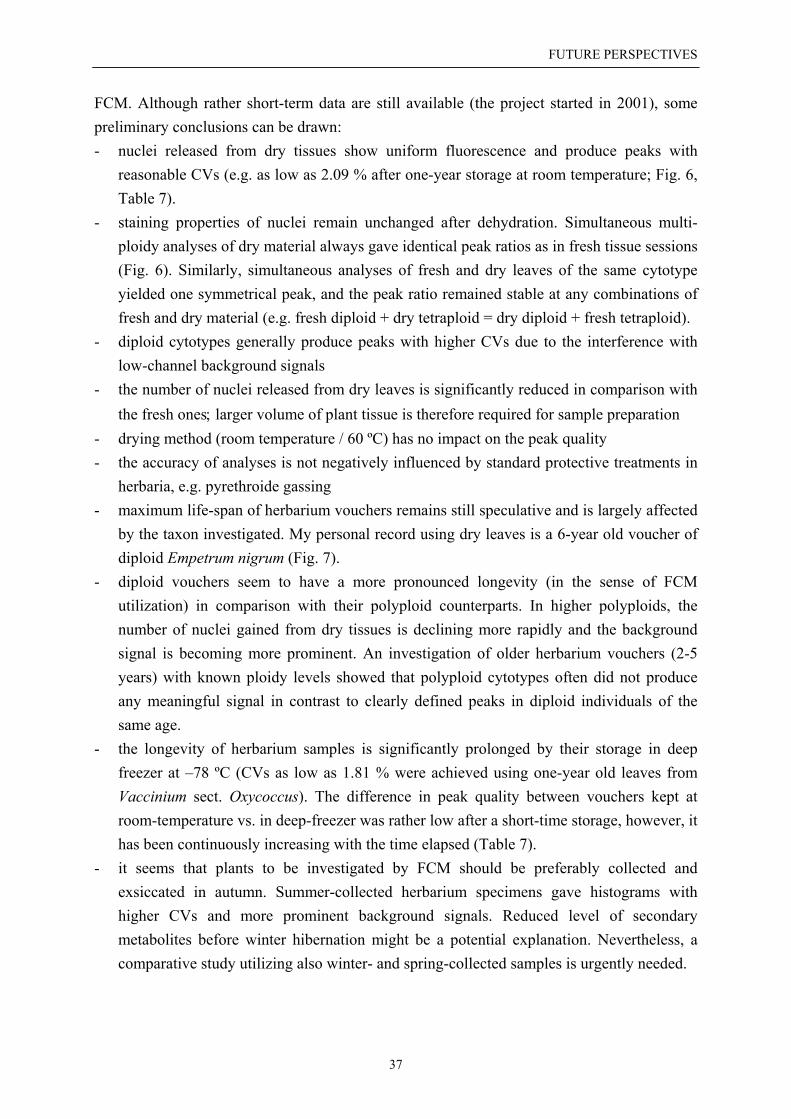
FUTURE PERSPECTIVES
37
FCM. Although rather short-term data are still available (the project started in 2001), somepreliminary conclusions can be drawn:- nuclei released from dry tissues show uniform fluorescence and produce peaks with
reasonable CVs (e.g. as low as 2.09 % after one-year storage at room temperature; Fig. 6,Table 7).
- staining properties of nuclei remain unchanged after dehydration. Simultaneous multi-ploidy analyses of dry material always gave identical peak ratios as in fresh tissue sessions(Fig. 6). Similarly, simultaneous analyses of fresh and dry leaves of the same cytotypeyielded one symmetrical peak, and the peak ratio remained stable at any combinations offresh and dry material (e.g. fresh diploid + dry tetraploid = dry diploid + fresh tetraploid).
- diploid cytotypes generally produce peaks with higher CVs due to the interference withlow-channel background signals
- the number of nuclei released from dry leaves is significantly reduced in comparison withthe fresh ones; larger volume of plant tissue is therefore required for sample preparation
- drying method (room temperature / 60 ºC) has no impact on the peak quality- the accuracy of analyses is not negatively influenced by standard protective treatments in
herbaria, e.g. pyrethroide gassing- maximum life-span of herbarium vouchers remains still speculative and is largely affected
by the taxon investigated. My personal record using dry leaves is a 6-year old voucher ofdiploid Empetrum nigrum (Fig. 7).
- diploid vouchers seem to have a more pronounced longevity (in the sense of FCMutilization) in comparison with their polyploid counterparts. In higher polyploids, thenumber of nuclei gained from dry tissues is declining more rapidly and the backgroundsignal is becoming more prominent. An investigation of older herbarium vouchers (2-5years) with known ploidy levels showed that polyploid cytotypes often did not produceany meaningful signal in contrast to clearly defined peaks in diploid individuals of thesame age.
- the longevity of herbarium samples is significantly prolonged by their storage in deepfreezer at –78 ºC (CVs as low as 1.81 % were achieved using one-year old leaves fromVaccinium sect. Oxycoccus). The difference in peak quality between vouchers kept atroom-temperature vs. in deep-freezer was rather low after a short-time storage, however, ithas been continuously increasing with the time elapsed (Table 7).
- it seems that plants to be investigated by FCM should be preferably collected andexsiccated in autumn. Summer-collected herbarium specimens gave histograms withhigher CVs and more prominent background signals. Reduced level of secondarymetabolites before winter hibernation might be a potential explanation. Nevertheless, acomparative study utilizing also winter- and spring-collected samples is urgently needed.
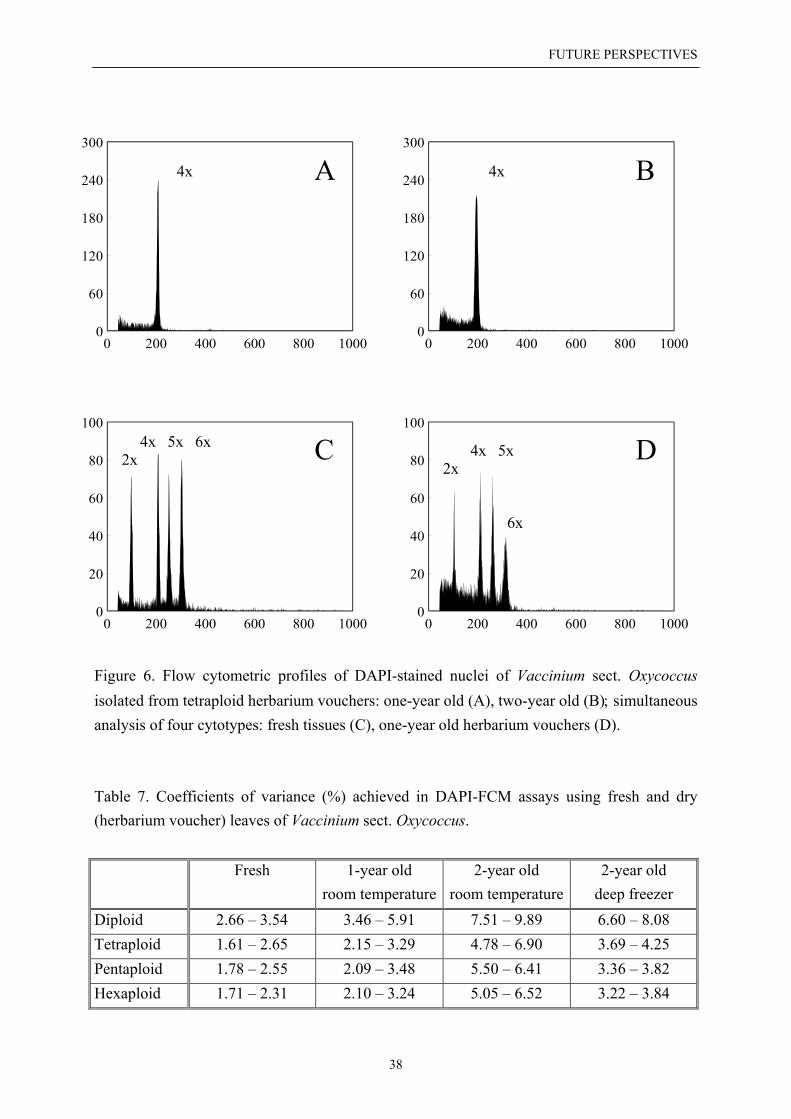
FUTURE PERSPECTIVES
38
0
60
120
180
240
300
0 200 400 600 800 10000
60
120
180
240
300
0 200 400 600 800 1000
0
20
40
60
80
100
0 200 400 600 800 10000
20
40
60
80
100
0 200 400 600 800 1000
4x 4x
2x4x 6x5x
2x4x
6x
5x
A
C
B
D
Figure 6. Flow cytometric profiles of DAPI-stained nuclei of Vaccinium sect. Oxycoccusisolated from tetraploid herbarium vouchers: one-year old (A), two-year old (B); simultaneousanalysis of four cytotypes: fresh tissues (C), one-year old herbarium vouchers (D).
Table 7. Coefficients of variance (%) achieved in DAPI-FCM assays using fresh and dry(herbarium voucher) leaves of Vaccinium sect. Oxycoccus.
Fresh 1-year oldroom temperature
2-year oldroom temperature
2-year olddeep freezer
Diploid 2.66 – 3.54 3.46 – 5.91 7.51 – 9.89 6.60 – 8.08Tetraploid 1.61 – 2.65 2.15 – 3.29 4.78 – 6.90 3.69 – 4.25Pentaploid 1.78 – 2.55 2.09 – 3.48 5.50 – 6.41 3.36 – 3.82Hexaploid 1.71 – 2.31 2.10 – 3.24 5.05 – 6.52 3.22 – 3.84
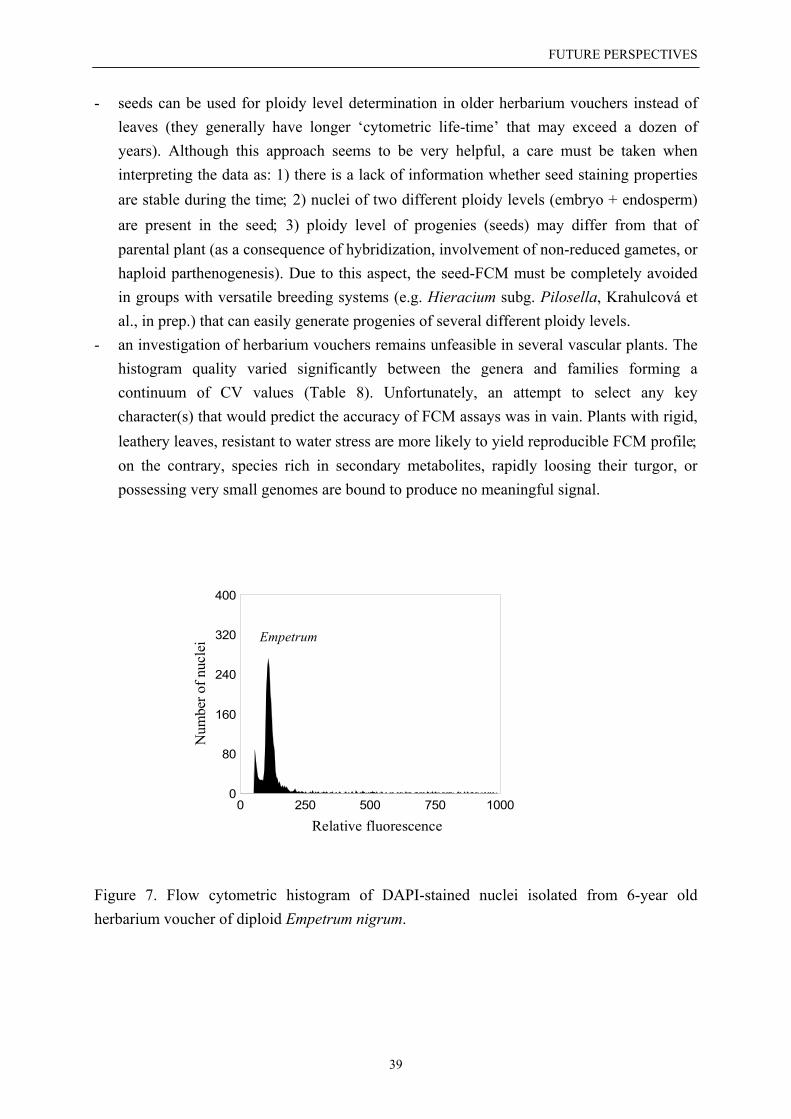
FUTURE PERSPECTIVES
39
0
80
160
240
320
400
0 250 500 750 1000
Relative fluorescence
Num
ber o
f nuc
lei Empetrum
- seeds can be used for ploidy level determination in older herbarium vouchers instead ofleaves (they generally have longer ‘cytometric life-time’ that may exceed a dozen ofyears). Although this approach seems to be very helpful, a care must be taken wheninterpreting the data as: 1) there is a lack of information whether seed staining propertiesare stable during the time; 2) nuclei of two different ploidy levels (embryo + endosperm)are present in the seed; 3) ploidy level of progenies (seeds) may differ from that ofparental plant (as a consequence of hybridization, involvement of non-reduced gametes, orhaploid parthenogenesis). Due to this aspect, the seed-FCM must be completely avoidedin groups with versatile breeding systems (e.g. Hieracium subg. Pilosella, Krahulcová etal., in prep.) that can easily generate progenies of several different ploidy levels.
- an investigation of herbarium vouchers remains unfeasible in several vascular plants. Thehistogram quality varied significantly between the genera and families forming acontinuum of CV values (Table 8). Unfortunately, an attempt to select any keycharacter(s) that would predict the accuracy of FCM assays was in vain. Plants with rigid,leathery leaves, resistant to water stress are more likely to yield reproducible FCM profile;on the contrary, species rich in secondary metabolites, rapidly loosing their turgor, orpossessing very small genomes are bound to produce no meaningful signal.
Figure 7. Flow cytometric histogram of DAPI-stained nuclei isolated from 6-year oldherbarium voucher of diploid Empetrum nigrum.
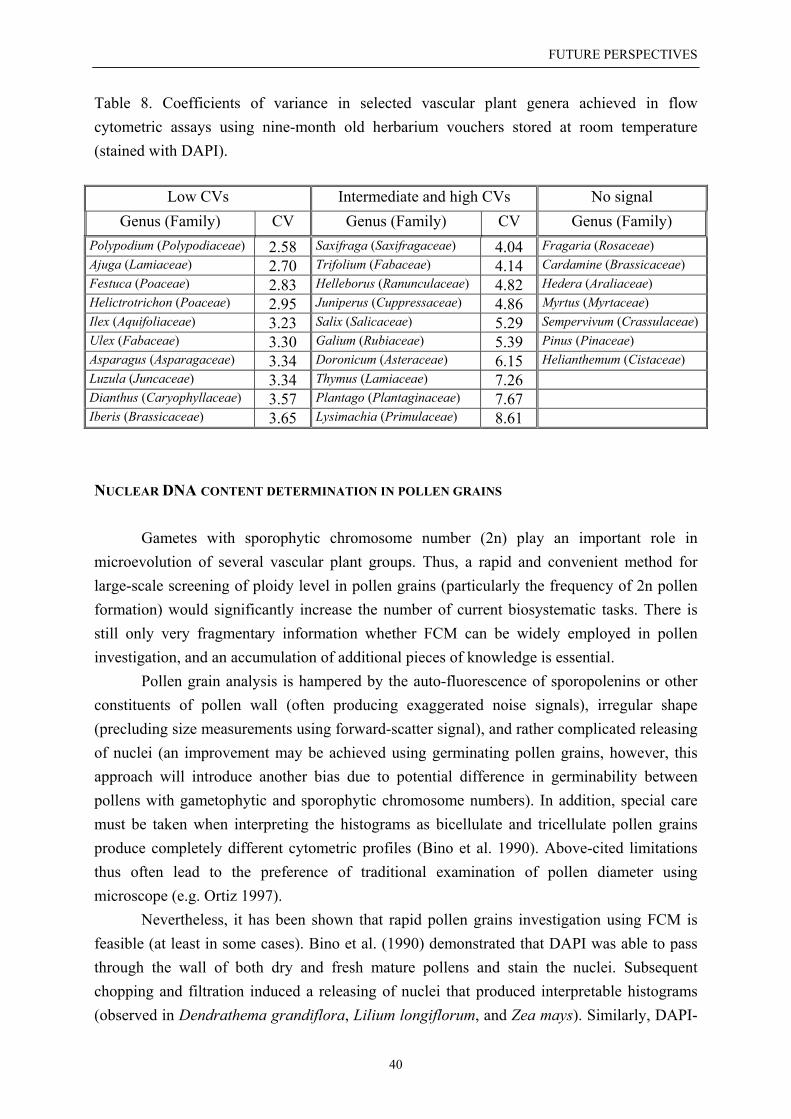
FUTURE PERSPECTIVES
40
Table 8. Coefficients of variance in selected vascular plant genera achieved in flowcytometric assays using nine-month old herbarium vouchers stored at room temperature(stained with DAPI).
Low CVs Intermediate and high CVs No signalGenus (Family) CV Genus (Family) CV Genus (Family)
Polypodium (Polypodiaceae) 2.58 Saxifraga (Saxifragaceae) 4.04 Fragaria (Rosaceae)Ajuga (Lamiaceae) 2.70 Trifolium (Fabaceae) 4.14 Cardamine (Brassicaceae)Festuca (Poaceae) 2.83 Helleborus (Ranunculaceae) 4.82 Hedera (Araliaceae)Helictrotrichon (Poaceae) 2.95 Juniperus (Cuppressaceae) 4.86 Myrtus (Myrtaceae)Ilex (Aquifoliaceae) 3.23 Salix (Salicaceae) 5.29 Sempervivum (Crassulaceae)Ulex (Fabaceae) 3.30 Galium (Rubiaceae) 5.39 Pinus (Pinaceae)Asparagus (Asparagaceae) 3.34 Doronicum (Asteraceae) 6.15 Helianthemum (Cistaceae)Luzula (Juncaceae) 3.34 Thymus (Lamiaceae) 7.26Dianthus (Caryophyllaceae) 3.57 Plantago (Plantaginaceae) 7.67Iberis (Brassicaceae) 3.65 Lysimachia (Primulaceae) 8.61
NUCLEAR DNA CONTENT DETERMINATION IN POLLEN GRAINS
Gametes with sporophytic chromosome number (2n) play an important role inmicroevolution of several vascular plant groups. Thus, a rapid and convenient method forlarge-scale screening of ploidy level in pollen grains (particularly the frequency of 2n pollenformation) would significantly increase the number of current biosystematic tasks. There isstill only very fragmentary information whether FCM can be widely employed in polleninvestigation, and an accumulation of additional pieces of knowledge is essential.
Pollen grain analysis is hampered by the auto-fluorescence of sporopolenins or otherconstituents of pollen wall (often producing exaggerated noise signals), irregular shape(precluding size measurements using forward-scatter signal), and rather complicated releasingof nuclei (an improvement may be achieved using germinating pollen grains, however, thisapproach will introduce another bias due to potential difference in germinability betweenpollens with gametophytic and sporophytic chromosome numbers). In addition, special caremust be taken when interpreting the histograms as bicellulate and tricellulate pollen grainsproduce completely different cytometric profiles (Bino et al. 1990). Above-cited limitationsthus often lead to the preference of traditional examination of pollen diameter usingmicroscope (e.g. Ortiz 1997). Nevertheless, it has been shown that rapid pollen grains investigation using FCM isfeasible (at least in some cases). Bino et al. (1990) demonstrated that DAPI was able to passthrough the wall of both dry and fresh mature pollens and stain the nuclei. Subsequentchopping and filtration induced a releasing of nuclei that produced interpretable histograms(observed in Dendrathema grandiflora, Lilium longiflorum, and Zea mays). Similarly, DAPI-
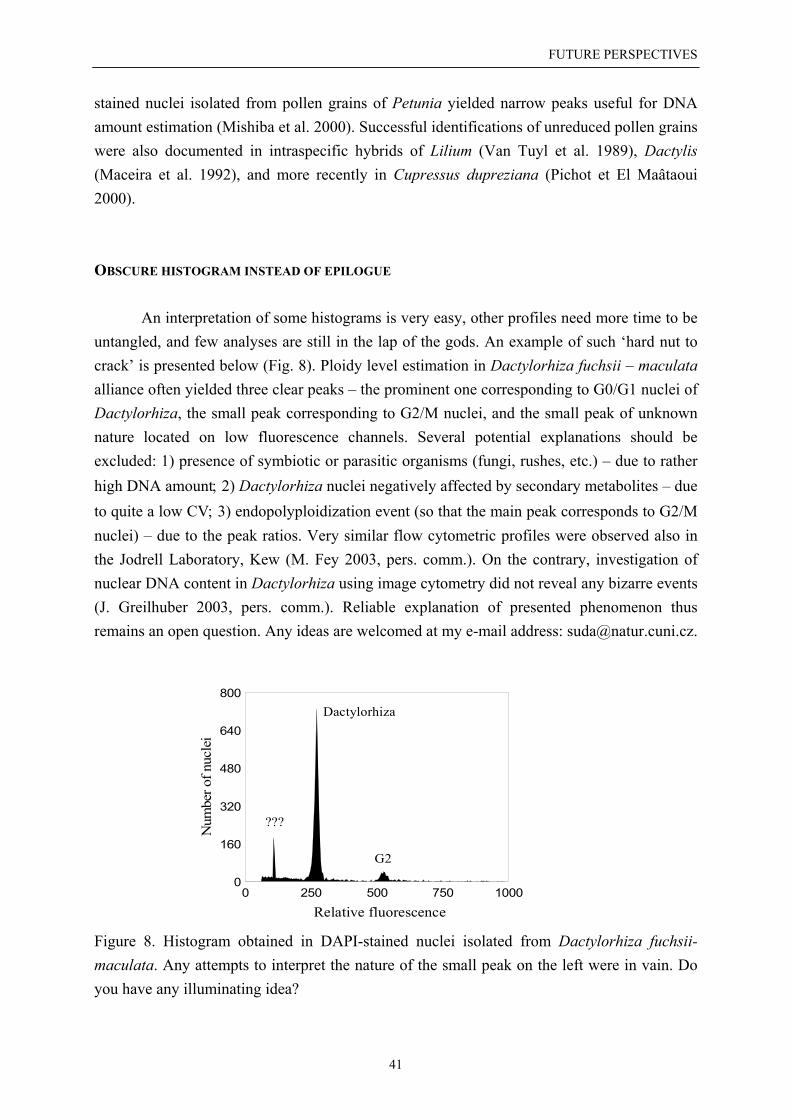
FUTURE PERSPECTIVES
41
0
160
320
480
640
800
0 250 500 750 1000
Relative fluorescence
Num
ber o
f nuc
lei
G2
Dactylorhiza
???
stained nuclei isolated from pollen grains of Petunia yielded narrow peaks useful for DNAamount estimation (Mishiba et al. 2000). Successful identifications of unreduced pollen grainswere also documented in intraspecific hybrids of Lilium (Van Tuyl et al. 1989), Dactylis(Maceira et al. 1992), and more recently in Cupressus dupreziana (Pichot et El Maâtaoui2000).
OBSCURE HISTOGRAM INSTEAD OF EPILOGUE
An interpretation of some histograms is very easy, other profiles need more time to beuntangled, and few analyses are still in the lap of the gods. An example of such ‘hard nut tocrack’ is presented below (Fig. 8). Ploidy level estimation in Dactylorhiza fuchsii – maculataalliance often yielded three clear peaks – the prominent one corresponding to G0/G1 nuclei ofDactylorhiza, the small peak corresponding to G2/M nuclei, and the small peak of unknownnature located on low fluorescence channels. Several potential explanations should beexcluded: 1) presence of symbiotic or parasitic organisms (fungi, rushes, etc.) – due to ratherhigh DNA amount; 2) Dactylorhiza nuclei negatively affected by secondary metabolites – dueto quite a low CV; 3) endopolyploidization event (so that the main peak corresponds to G2/Mnuclei) – due to the peak ratios. Very similar flow cytometric profiles were observed also inthe Jodrell Laboratory, Kew (M. Fey 2003, pers. comm.). On the contrary, investigation ofnuclear DNA content in Dactylorhiza using image cytometry did not reveal any bizarre events(J. Greilhuber 2003, pers. comm.). Reliable explanation of presented phenomenon thusremains an open question. Any ideas are welcomed at my e-mail address: [email protected].
Figure 8. Histogram obtained in DAPI-stained nuclei isolated from Dactylorhiza fuchsii-maculata. Any attempts to interpret the nature of the small peak on the left were in vain. Doyou have any illuminating idea?
REFERENCES
42
R E F E R E N C E S
Ajalin I., Kobza F. & Doležel J. (2002): Ploidy identification of doubled chromosome number plants in Viola xwittrockiana Gams. M 1-generation. – Hort. Sci. (Prague) 29: 35-40.
Arumuganathan E. & Earle E. D. (1991): Nuclear DNA content of some important plant species. – Plant Mol.Biol. Rep. 9: 208-218.
Auckland L. D., Johnston J. S., Price H. J. & Bridgwater F. E. (2001): Stability of nuclear DNA content amongdivergent and isolated populations of Fraser fir. – Can. J. Bot. 79: 1375-1378.
Bantin J., Matzk F. & Dresselhaus T. (2001): Tripsacum dactyloides (Poaceae): a natural model system to studyparthenogenesis. – Sex. Plant Reprod. 14: 219-226.
Baranyi M. & Greilhuber J. (1999): Genome size in Allium – In quest of reproducible data. – Ann. Bot. (London)83: 687-695.
Barow M. & Meister A. (2002): Lack of correlation between AT frequency and genome size in higher plants andthe effect of nonrandomness of base sequences on dye binding. – Cytometry 47: 1-7.
Barow M. & Meister A. (2003): Endopolyploidy in seed plants is differently correlated to systematics, organ, lifestrategy and genome size. In: Plant Genome Size Discussion Meeting. Programme & Abstracts: 3.Jodrell Laboratory, Royal Botanic Gardens, Kew.
Bashir A., Auger J. A. & Rayburn A. L. (1993): Flow cytometric DNA analysis of wheat-rye addition lines. –Cytometry 14: 843-847.
Bennett M. D. (1972): Nuclear DNA content and minimum generation time in herbaceous plants. – Proc. RoyalSoc. London B 181: 109-135.
Bennett M. D. & Leitch I. J. (1995): Nuclear DNA amounts in angiosperms. – Ann. Bot. (London) 76: 113-176.Bennett M. D. & Leitch I. J. (1997): Nuclear DNA amounts in angiosperms – 583 new estimates. – Ann. Bot.
(London) 80: 169-196.Bennett M. D. & Leitch I. J. (2001): Nuclear DNA amounts in Pteridophytes. – Ann. Bot. (London) 87: 335-345.Bennett M. D. & Leitch I. J. (2003): Plant DNA C-values database (release 2.0, Jan. 2003). –
http://www.rbgkew.org.uk/cval/homepage.html.Bennett M. D. & Smith J. B. (1976): Nuclear DNA amounts in angiosperms. – Phil. Trans. Royal Soc. London B
274: 227-274.Bennett M. D. & Smith J. B. (1991): Nuclear DNA amounts in angiosperms. – Phil. Trans. Royal Soc. London B
334: 309-345.Bennett M. D., Smith J. B. & Heslop-Harrison J. S. (1982): Nuclear DNA amounts in angiosperms. – Proc.
Royal Soc. London B 216: 179-199.Bennett M. D., Leitch I. J. & Hanson L. (1998): DNA amounts in two samples of angiosperm weeds. – Ann. Bot.
(London) 82 (Suppl. A): 121-134.Bennett M. D., Bhandol P. & Leitch I. J. (2000a): Nuclear DNA amounts in angiosperms and their modern uses
– 807 new estimates. – Ann. Bot. (London) 86: 859-909.Bennett M. D., Johnston S., Hodnett G. L. & Price H. J. (2000b): Allium cepa L. cultivars from four continents
compared by flow cytometry show nuclear DNA constancy. – Ann. Bot. (London) 85: 351-357.Berlyn G. P., Royte J. L. & Anoruo A. O. (1990): Cytophotometric differentiation of high elevation spruces:
physiological and ecological implications. – Stain Techn. 65: 1-14.Bino R. J., Van Tuyl J. M. & De Vries J. N. (1990): Flow cytometric determination of relative nuclear DNA
contents in bicellulate and tricellulate pollen. – Ann. Bot. (London) 65: 3-8.Bino R. J., Lanteri S., Verhoeven H. A. & Kraak H. L. (1993): Flow cytometric determination of nuclear
replication stages in seed tissues. – Ann. Bot. (London) 72: 181-187.
REFERENCES
43
Biradar D. P., Rayburn A. L. & Bullock D. G. (1993): Endopolyploidy in diploid and tetraploid maize (Zea maysL.). – Ann. Bot. (London) 71: 417-421.
Blakesley D., Allen A., Pellny T. K. & Roberts A. V. (2002): Natural and induced polyploidy in Acacia dealbataLink. and Acacia mangium Willd. – Ann. Bot. (London) 90: 391-398.
Bottini M. C. J., Greizerstein E. J., Aulicino M. B. & Poggio L. (2000). Relationships among genome size,environmental conditions and geographical distribution in natural populations of NW Patagonianspecies of Berberis L. (Berberidaceae). – Ann. Bot. (London) 86: 565-573.
Bretagnole F. & Thompson J. D. (1996): An experimental study of ecological differences in winter growthbetween sympatric diploid and autotetraploid Dactylis glomerata. – J. Ecol. 84: 343-351.
Brummer E. C., Cazcarro P. M. & Luth D. (1999): Ploidy determination of alfalfa germplasm accessions usingflow cytometry. – Crop Sci. 39: 1202-1207.
Brutovská R., Čellárová E. & Doležel J. (1998): Cytogenetic variability of in vitro regenerated Hypericumperforatum L. plants and their seed progenies. – Plant Sci. 133: 221-229.
Buitendijk J. H., Boon E. J. & Ramanna M. S. (1997): Nuclear DNA content in twelve species of AlstroemeriaL. and some of their hybrids. – Ann. Bot. (London) 79: 343-353.
Burton T. L. & Husband B. C. (1999): Population cytotype structure in the polyploid Galax urceolata(Diapensiaceae). – Heredity 82: 381-390.
Cáceres M. E., Matzk F., Busti A., Pupilli F. & Arcioni S. (2001): Apomixis and sexuality in Paspalum simplex:characterization of the mode of reproduction in segregating progenies by different methods. – Sex. PlantReprod. 14: 201-206.
Cavallini A. & Natali L. (1990): Nuclear DNA variability within Pisum sativum (Leguminosae):cytophotometric analyses. – Plant. Syst. Evol. 173: 179-185.
Cavallini A. & Natali L. (1994): Chromosome endoreduplication variability in cultivars of Pisum sativum L. andits relationship to basic genome size. – Cytobios 79: 181-188.
Cavallini A., Zolfino C., Cionini G., Cremonini R., Natali L., Sassoli O. & Cionini P. G. (1986): Nuclear DNAchanges within Helianthus annuus L.: cytophotometric, karyological and biochemical analyses. –Theor. Appl. Genet. 73: 20-26.
Cavallini A., Zolfino C., Natali L., Cionini G. & Cionini P. G. (1989): Nuclear DNA changes within Helianthusannuus L.: origin and control mechanism. – Theor. Appl. Genet. 77: 12-16.
Cavallini A., Natali L., Cionini G. & Gennai D. (1993): Nuclear DNA variability within Pisum sativum(Leguminosae): nucleotypic effects on plant growth. – Heredity 70: 561-565.
Cavallini A., Natali L., Giordani T., Durante M. & Cionini P. G. (1996): Nuclear DNA changes withinHelianthus annuus L.: variations in the amount and methylation of repetitive DNA within homozygousprogenies. – Theor. Appl. Genet. 92: 285-291.
Ceccarelli M., Falistocco E. & Cionini P. G. (1992): Variation of genome size and organization in hexaploidFestuca arundinacea. – Theor. Appl. Genet. 83: 273-278.
Ceccarelli M., Minelli S., Falcinelli M. & Cionini P. G. (1993): Genome size and plant development inhexaploid Festuca arundinacea. – Heredity 71: 555-560.
Ceccareli M., Minelli S., Maggini F. & Cionini P. G. (1995): Genome size variation in Vicia faba. – Heredity 74:180-187.
Ceccarelli M., Giordani T., Natali L., Cavallini A. & Cionini P. G. (1997): Genome plasticity during seedgermination in Festuca arundinacea. – Theor. Appl. Genet. 94: 309-315.
Cerbah M., Coulaud J., Brown S. C. & Siljak-Yakovlev S. (1999): Evolutionary DNA variation in the genusHypochaeris. – Heredity 82: 261-266.
Cerbah M., Mortreau E., Brown S., Siljak-Yakovlev S., Bertrand H. & Lambert C. (2001): Genome sizevariation and species relationships in the genus Hydrangea. – Theor. Appl. Genet. 103: 45-51.
REFERENCES
44
Costich D. E., Meagher T. R. & Yurkow E. J. (1991): A rapid means of sex identification in Silene latifolia byuse of flow cytometry. – Plant Mol. Biol. Rep. 9: 359-370.
Cremonini R., Colonna N., Stefani A., Galasso I. & Pignone D. (1994): Nuclear DNA content, chromatinorganization and chromosome banding in brown and yellow seeds of Dasypyrum villosum (L.) P.Candargy. – Heredity 72: 365-373.
Cullis C. A. (1985): Experimentally induced changes in genome size. In: Cavalier-Smith T. (ed.): The evolutionof genome size. John Wiley and Sons, Chichester, pp. 197-209.
Dagher-Kharrat M. B., Grenier G., Bariteau M., Brown S., Siljak-Yakovlev S. & Savouré A. (2001): Karyotypeanalysis reveals interspecific differentiation in the genus Cedrus despite genome size and basecomposition constancy. – Theor. Appl. Genet. 103: 846-854.
Darzynkiewicz Z., Bedner E., Li X., Gorzyca W. & Melamed M. R. (1999): Laser-scanning cytometry: A newinstrumentation with many applications. – Exp. Cell Res. 29: 1-12.
De Rocher E. J., Harkins K. R., Galbraith D. W. & Bohnert H. J. (1990): Developmentally regulated systemicendopolyploidy in succulents with small genomes. – Science 250: 99-101.
De Schepper S., Leus L., Mertens M., Debergh P., Van Bockstaele E. & De Loose M. (2001): Somaticpolyploidy and its consequences for flower coloration and flower morphology in azalea. – Plant CellRep. 20: 583-590.
Deumling B. & Clermont L. (1989): Changes in DNA content and chromosomal size during cell culture andplant regeneration of Scilla siberica: selective chromatin diminution in response to environmentalconditions. – Chromosoma 97: 439-448.
Dimitrova D., Ebert I., Greilhuber J. & Kozhuharov S. (1999): Karyotype constancy and genome size variationin Bulgarian Crepis foetida s.l. (Asteraceae). – Plant Syst. Evol. 217: 245-257.
Doležel J. (1991): Flow cytometric analysis of nuclear DNA content in higher plants. – Phytochem. analysis 2:143-154.
Doležel J. (1997a): Application of flow cytometry for the study of plant genomes. – J. Appl. Genet. 38: 285-302.Doležel J. (1997b): Flow cytometry – principles and applications in mutation breeding & practical exercises. In:
15th IAEA/FAO Interregional training course on advances in technologies for induced mutations incrops (C7-INT-5.143), 30 pp.
Doležel J. & Göhde W. (1995): Sex determination in dioecious plants Melandrium album and M. rubrum usinghigh-resolution flow cytometry. – Cytometry 19: 103-106.
Doležel J., Binarová P. & Lucretti S. (1989): Analysis of nuclear DNA content in plant cells by flow cytometry.– Biol. Pl. 31: 113-120.
Doležel J., Sgorbati S. & Lucretti S. (1992): Comparison of 3 DNA fluorochromes for flow cytometricestimation of nuclear-DNA content in plants. – Physiol. Pl. (Copenhagen) 85: 625-631.
Doležel J., Lucretti S. & Macas J. (1995): Flow cytometric analysis and sorting of plant chromosomes. In:Brandham P. E. & Bennett M. D. (eds.): Kew Chromosome Conference IV, Royal Botanic Gardens,Kew, pp. 185-200.
Doležel J., Greilhuber J., Lucretti S., Meister A., Lysák M. A., Nardi L. & Obermayer R. (1998): Plant genomesize estimation by flow cytometry: inter-laboratory comparison. – Ann. Bot. (London) 82 (Suppl. A):17-26.
Doležel J., Bartoš J. & Greilhuber J. (2003): Nuclear DNA content and genome size of trout and human (Letterto the Editor). – Cytometry 51A: 127-128.
Durrant A. & Jones T. W. A. (1971): Reversion of induced changes in amount of nuclear DNA in Linum. –Heredity 27: 431-439.
Ellul P., Boscaiu M., Vicente O., Moreno V. & Roselló J. A. (2002): Intra- and interspecific variation in DNAcontent in Cistus (Cistaceae). – Ann. Bot. (London) 90: 345-351.
REFERENCES
45
Emshwiller E. (2002): Ploidy levels among species in the 'Oxalis tuberosa alliance' as inferred by flowcytometry. – Ann. Bot. (London) 89: 741-753.
Evans G. M. (1968a): Nuclear changes in flax. – Heredity 23: 25-38.Evans G. M. (1968b): Induced chromosomal changes in Linum. – Heredity 23: 301-310.Evans G. M. & Rees H. (1971): Mitotic cycles in dicotyledons and monocotyledons. – Nature 233: 350-351.Evans G. M., Durrant A. & Rees H. (1966): Associated nuclear changes in the induction of flax genotrophs. –
Nature 212: 697-699.Felber-Girard M., Felber F. & Buttler A. (1996): Habitat differentiation in a narrow hybrid zone between diploid
and tetraploid Anthoxanthum alpinum. – New Phytol. 133: 531-540.Frediani M., Colonna N., Cremonini R., De Pace C., Delre V., Caccia R. & Cionini P. G. (1994): Redundancy
modulation of nuclear DNA sequences in Dasypyrum villosum. – Theor. Appl. Genet. 88: 167-174.Fridlender A., Brown S., Verlaque R., Crosnier M. T. & Pech N. (2002): Cytometric determination of genome
size in Colchicum species (Liliales, Colchicaceae) of the western Mediterranean area. – Plant Cell Rep.21: 347-352.
Galbraith D. W. (1989): Flow cytometric analysis of plant genomes. – In: EMBO practical course: Flowcytometry, a tool in cellular and molecular biology, Cologne, pp. 2-18.
Galbraith D. W., Harkins K. R., Maddox J. M., Ayres N. M., Sharma D. P. & Firoozabady E. (1983): Rapid flowcytometric analysis of the cell cycle in intact plant tissues. – Science 220: 1049-1051.
Galbraith D. W., Harkins K. R. & Knapp S. (1991): Systematic endopolyploidy in Arabidopsis thaliana. – PlantPhysiol. 96: 985-989.
Gatt M., Ding H., Hammett K. & Murray B. (1998): Polyploidy and evolution in wild and cultivated Dahliaspecies. – Ann. Bot. (London) 81: 647-656.
Givan A. L. (2001): Flow cytometry. First principles. 2nd edn. – Wiley-Liss, Inc., New York.Godelle B., Cartier D., Marie D., Brown S. C. & Siljak-Yakovlev S. (1993): Heterochromatin study
demonstrating the non-linearity of fluorimetry useful for calculating genomic base composition. –Cytometry 14: 618-626.
Graham M. J., Nickell C. D. & Rayburn A. L. (1994): Relationship between genome size and maturity group insoybean. – Theor. Appl. Genet. 88: 429-432.
Greenlee J. K. & Rai K. S. (1986): Interspecific hybridization and karyotype analysis in two species in the genusCollinsia. – Cytologia 51: 631-636.
Greenlee J. K., Rai K. S. & Floyd A. D. (1984): Intraspecific variation in nuclear DNA content in Collinsiaverna Nutt. (Scrophulariaceae). – Heredity 52: 235-242.
Greilhuber J. (1986): Severely distorted Feulgen DNA amounts in Pinus (Coniferophytina) after nonaditivefixations as a result of meristematic self-tanning with vacuole contents. – Can. J. Genet. Cytol. 28: 409-415.
Greilhuber J. (1988a): ‘Self-tanning’ – a new and important source of stoichiometric error in cytophotometricdetermination of nuclear DNA content in plants. – Plant. Syst. Evol. 158: 87-96.
Greilhuber J. (1988b): Critical reassessment of DNA content variation in plants. In: Brandham P. E. (ed.): Kewchromosome conference III. London: HMSO, pp. 39-50.
Greilhuber J. (1998): Intraspecific variation in genome size: a critical reassessment. – Ann. Bot. (London) 82(Supplement A): 27-35.
Greilhuber J. & Speta F. (1985): Geographic variation of genome size at low taxonomic levels in the Scillabifolia alliance (Hyacinthaceae). – Flora 176: 431-438.
Greihuber J. & Obermayer R. (1997): Genome size and maturity group in Glycine max (soybean). – Heredity 78:547-551.
Grime J. P. & Mowforth M. A. (1982): Variation in genome size – an ecological interpretation. – Nature 229:151-153.

REFERENCES
46
Grime J. P., Shacklock J. M. L. & Band S. R. (1985): Nuclear DNA contents, shoot phenology and species co-existence in a limestone grassland community. – New Phytol. 100: 434-445.
Han T. H., Van Eck H. J., De Jeu M. J. & Jacobsen E. (1999): Optimalization of AFLP fingerprinting oforganisms with a large-sized genome: a study on Alstroemeria spp. – Theor. Appl. Genet. 98: 465-471.
Hanson L., McMahon K. A., Johnson M. A. T. & Bennett M. D. (2001a): First nuclear DNA C-values for 25angiosperm families. – Ann. Bot. (London) 87: 251-258.
Hanson L., McMahon K. A., Johnson M. A. T. & Bennett M. D. (2001b): First nuclear DNA C-values foranother 25 angiosperm families. – Ann. Bot. (London) 88: 851-858.
Hanson L., Brown R. L., Boyd A., Johnson M. A. T. & Bennett M. D. (2003): First nuclear DNA C-values for28 angiosperm genera. – Ann. Bot. (London) 91: 1-8.
Hardy O. J., De Vanderhoeven S., Loose M. & Meerts P. (2000): Ecological, morphological and allozymicdifferentiation between diploid and tetraploid knapweeds (Centaurea jacea s.l.) in a contact zone of theBelgian Ardennes. – New Phytol. 146: 281-290.
Hardy O. J., De Loose M., Vekemans X. & Meerts P. (2001): Allozyme segregation and inter-cytotypereproductive barriers in the polyploid complex Centaurea jacea. – Heredity 87: 136-145.
Heenan P. B., Dawson M. I. & Bicknell R. A. (2002): Evidence for apomictic seed formation in Coprosmawaima (Rubiaceae). – New Zealand J. Bot. 40: 347-355.
Heller F. O. (1973): DNS-Bestimmung an Keimwurzeln von Vicia faba L. mit Hilfe der Impulscytophotometric.– Ber. Deutch. Bot. Ges. 86: 437-441.
Hülgenhof E., Weidhase R. A., Schlegel R. & Tewes A. (1988): Flow cytometric determination of DNA contentin isolated nuclei of cereals. – Genome 30: 565-569.
Husband B. C. & Schemske D. W. (1998): Cytotype distribution at a diploid-tetraploid contact zone inChamerion (Epilobium) angustifolium (Onagraceae). – Amer. J. Bot. 85: 1688-1694.
Chung J., Lee J.-H., Arumuganathan K., Graef G. L. & Specht J. E. (1998): Relationships between nuclear DNAcontent and seed and leaf size in soybean. – Theor. Appl. Genet. 96: 1064-1068.
Joarder I. O., Al-Saheal Y., Begum J. & Durrant A. (1975): Environments inducing changes in amount of DNAin flax. – Heredity 34: 247-253.
Johnson P. G., Riordan T. P. & Arumuganathan K. (1998): Ploidy level determinations in buffalograss clonesand populations. – Crop Sci. 38: 478-482.
Johnston J. S., Jensen A., Czeschin D. G. jun. & Price H. J. (1996): Environmentally induced nuclear 2C DNAcontent instability in Helianthus annuus (Asteraceae). – Amer. J. Bot. 83: 1113-1120.
Johnston J. S., Bennett M. D., Rayburn A. L., Galbraith D. W. & Price H. J. (1999): Reference standards fordetermination of DNA content of plant nuclei. – Amer. J. Bot. 86: 609-613.
Kato J. & Mii M. (2000): Differences in ploidy levels of inter-specific hybrids obtained by reciprocal crossesbetween Primula sieboldii and P. kisoana. –Theor. Appl. Genet. 101: 690-696.
Keeler K. H. & Davis G. A. (1999): Comparison of common cytotypes of Andropogon gerardii(Andropogoneae, Poaceae). – Amer. J. Bot. 86: 974-979.
Kenton A. Y., Rudall P. J. & Johnson A. R. (1986): Genome size variation in Sisyrinchium L. (Iridaceae) and itsrelationship to phenotype and habitat. – Bot. Gaz. 147: 342-354.
Kessler B. & Reches S. (1977): Structural and functional changes of chromosomal DNA during ageing andphase change in plants. – Chromosomes Today 6: 237-246.
König C., Ebert I. & Greilhuber J. (1987): A DNA cytophotometric and chromosome banding study in Hederahelix (Araliaceae), with reference to differential DNA replication associated with juvenile-adult phasechange. – Genome 29: 498-503.
Kowles R. V., Yerk G. L., Haas K. M. & Phillips R. L. (1997): Maternal effects influencing endoreduplication indeveloping endosperm of Zea mays. – Genome 40: 798-805.

REFERENCES
47
Kudo N. & Kimura Y. (2001a): Flow cytometric evidence for endopolyploidy in seedlings of some Brassicaspecies. – Theor. Appl. Genet. 102: 104-110.
Kudo N. & Kimura Y. (2001b): Flow cytometric evidence for endopolyploidization in cabbage (Brassicaoleracea L.) flowers. – Sex. Plant Reprod. 13: 279-283.
Lagunes-Espinoza L. C., Huyghe C., Bousseau D., Barre P. & Papineau J. (2000): Endoreduplication occursduring pod wall development in temperate grain legumes. – Ann. Bot. (London) 86: 185-190.
Laurie D. A. & Bennett M. D. (1985): Nuclear DNA content in the genera Zea and Sorghum. Intergeneric,interspecific, and intraspecific variation. – Heredity 55: 307-313.
Lee J.-H., Yen Y., Arumuganathan K. & Baenziger P. S. (1997): DNA content of wheat monosomic atinterphase estimated by flow cytometry. – Theor. Appl. Genet. 95: 1300-1304.
Leitch I. J. & Bennett M. D. (1997): Polyploidy in angiosperms. – Trends Plant Sci. 2: 470-476.Leitch I. J., Chase M. W. & Bennett M. D. (1998): Phylogenetic analysis of DNA C-values provides evidence
for a small ancestral genome size in flowering plants. – Ann. Bot. (London) 82 (Supplement A): 85-94.Leitch I. J., Hanson L., Winfield M., Parker J. & Bennett M. D. (2001): Nuclear DNA C-values complete
familial representation in gymnosperms. – Ann. Bot. (London) 88: 843-849.Lewis W. H., Oliver R. L. & Suda Y. (1967): Cytogeography of Claytonia virginica and its allies. – Ann.
Missouri Bot. Gard. 54: 153-171.Liebenberg H., Lubbinge J. & Fossey A. (1993): Cytotaxonomic studies in Themeda triandra Forssk.: IV. A
population cytogenetic study of a contact zone between tetraploid and hexaploid populations. – S. Afr. J.Bot. 59: 305-310.
Lysák M. A., Doleželová M., Horry J. P., Swennen R. & Doležel J. (1999): Flow cytometric analysis of nuclearDNA content in Musa. – Theor. Appl. Genet. 98: 1344-1350.
Lysák M. A., Rostková A., Dixon J. M., Rossi G. & Doležel J. (2000): Limited genome size variation in Sesleriaalbicans. – Ann. Bot. (London) 86: 399-403.
Maceira N. O., De Haan A. A., Lumaret R., Billon M. & Delay J. (1992): Production of 2n gametes in diploidsubspecies of Dactylis glomerata L. I. Occurrence and frequency of 2n pollen. - Ann. Bot. (London) 69:335-343.
MacGillivray C. W. & Grime J. P. (1995): Genome size predicts frost-resistance in British herbaceous plants –Implications for rates of vegetation response to global warning. – Funct. Ecol. 9: 320-325.
Matzk F., Meister A. & Schubert I. (2000): An efficient screen for reproductive pathways using mature seeds ofmonocots and dicots. – Plant J. 21: 97-108.
McArthur E. D. & Sanderson S. C. (1999): Cytogeography and chromosome evolution of subgenus Tridentataeof Artemisia (Asteraceae). – Amer. J. Bot. 86: 1754-1775.
Meister A. (2003): How does the fluorescence of DNA-specific dyes depend on base composition and basesequences? Comparison of the sequenced species Oryza sativa and Arabidopsis thaliana. In: PlantGenome Size Discussion Meeting. Programme & Abstracts: 19. Jodrell Laboratory, Royal BotanicGardens, Kew.
Michaelson M. J., Price H. J., Johnston J. S. & Ellison J. R. (1991): Variation of nuclear DNA content inHelianthus annuus (Asteraceae). – Amer. J. Bot. 78: 1238-1243.
Minelli S., Moscariello P., Ceccarelli M. & Cionini P. G. (1996): Nucleotype and phenotype in Vicia faba. –Heredity 76: 524-530.
Mishiba K. I. & Mii M. (2000): Polysomaty analysis in diploid and tetraploid Portulaca grandiflora. – Plant Sci.156: 213-219.
Mishiba K. I., Ando T., Mii M., Watanabe H., Kokubun H., Hashimoto G. & Marchesi E. (2000): Nuclear DNAcontent as an index character discriminating taxa in the genus Petunia sensu Jussieu (Solanaceae). –Ann. Bot. (London) 85: 665-673.
REFERENCES
48
Nagl W. (1976): DNA endoreduplication and polyteny understood as evolutionary strategies. – Nature 261: 614-615.
Nagl W. & Capesius I. (1976): Molecular and cytological characteristics of nuclear DNA and chromatin forangiosperm systematics: basic data for Helianthus annuus. – Plant Syst. Evol. 126: 221-237.
Nagl W., Frisch B. & Fröhlich E. (1979): Extra-DNA during floral induction? – Plant Syst. Evol., Suppl. 2: 111-118.
Nagl W., Jeanjour M., Kling H., Kühner S., Michels I., Müller T. & Stein B. (1983): Genome and chromatinorganization in higher plants. – Biol. Zentralbl. 102: 129-148.
Naumova T., Hayward M. D. & Wagenvoort M. (1999): Apomixis and sexuality in diploid and tetraploidaccessions of Brachiaria decumbens. – Sex. Plant Reprod. 12: 43-52.
Noirot M., Barre P., Louarn J., Duperray C. & Hamon S. (2000): Nucleus-cytosol interactions – a source ofstoichiometric error in flow cytometric estimation of nuclear DNA content in plants. – Ann. Bot.(London) 86: 309-316.
Obermayer R. & Greilhuber J. (1999): Genome size in Chinese soybean accessions – stable or variable? – Ann.Bot. (London) 84: 259-262.
Obermayer R., Leitch I. J., Hanson L. & Bennett M. D. (2002): Nuclear DNA C-values in 30 species double thefamilial representation in pteridophytes. – Ann. Bot. (London) 90: 209-217.
Obermayer R. & Greilhuber J. (2003): Genome size and fruit colour variation in Dasypyrum villosum. In: PlantGenome Size Discussion Meeting. Programme & Abstracts: 21. Jodrell Laboratory, Royal BotanicGardens, Kew.
Ohri D. (1998): Genome size variation and plant systematics. – Ann. Bot. (London) 82 (Suppl. A): 75-83.Ohri D., Fritsch R. M. & Hanelt P. (1998): Evolution of genome size in Allium (Alliaceae). – Plant Syst. Evol.
210: 57-86.Olszewska M. J. & Osiecka R. (1983): The relationship between 2C DNA content, life cycle type, systematic
position, and the dynamics of DNA endoreduplication in parenchyma nuclei during growth anddifferentiation of roots in some dicotyledonous herbaceous species. – Biochem. Physiol. Pflanzen 78:581-599.
Ormerod M. G. (1999): Flow cytometry. 2nd edn. – BIOS Scientific Publishers, Oxford.Ortiz R. (1997): Occurrence and inheritance of 2n pollen in Musa. – Ann. Bot. (London) 79: 449-453.Otto F. (1990): DAPI staining of fixed cells for high-resolution flow cytometry of nuclear DNA. In: Crissman H.
A. & Darzynkiewicz Z. (eds.): Methods in Cell Biology, Vol. 33. Academic Press, New York, 105-110.Otto F. & Tsou K. C. (1985): A comparative study of DAPI, DIPI and Hoechst 33258 and 33342 as
chromosomal DNA stains. – Stain Technol. 60: 7-11.Palomino G. & Sousa S. M. (2000): Variation of nuclear DNA content in the biflorus species of Lonchocarpus
(Leguminosae). – Ann. Bot. (London) 85: 69-76.Petit C., Lesbros P., Ge X. & Thompson J. D. (1997): Variation in flowering phenology and selfing rate across a
contact zone between diploid and tetraploid Arrhenatherum elatius (Poaceae). – Heredity 79: 31-40.Petit C., Bretagnolle F. & Felber F. (1999): Evolutionary consequences of diploid-polyploid hybrid zones in wild
species. – Trends Ecol. Evol. 14: 306-311.Pfosser M., Amon A., Lelley T. & Heberle-Bors E. (1995): Evaluation of sensitivity of flow cytometry in
detecting aneuploidy in wheat using disomic and ditelosomic wheat-rye addition lines. – Cytometry 21:387-393.
Pichot C. & El Maâtaoui M. (2000): Unreduced diploid nuclei in Cupressus dupreziana A. Camus pollen. –Theor. Appl. Genet. 101: 574-579.
Price H. J. & Johnston J. S. (1996): Influence of light on DNA content of Helianthus annuus L. – Proc. Natl.Acad. Sci. USA. 93: 11264-11267.
REFERENCES
49
Price H. J., Bachmann K., Chambers K. L. & Riggs J. (1980): Detection of intraspecific variation in nuclearDNA content in Microseris douglasii. – Bot. Gaz. 141: 195-198.
Price H. J., Chambers K. L. & Bachmann K. (1981a): Genome size variation in diploid Microseris bigelovii(Asteraceae). – Bot. Gaz. 142: 156-159.
Price H. J., Chambers K. L. & Bachmann K. (1981b): Geographic and ecological distribution of genomic DNAcontent in Microseris douglasii (Asteraceae). – Bot. Gaz. 142: 415-429.
Price H. W., Morgan P. W. & Johnston J. S. (1998): Environmentally correlated variation in 2C nuclear DNAcontent measurements in Helianthus annuus L. – Ann. Bot. (London) 82 (Suppl. A): 95-98.
Price H. J., Hoddnett G. & Johnston J. S. (2000): Sunflower (Helianthus annuus) leaves contain compounds thatreduce nuclear propidium iodide fluorescence. – Ann. Bot. (London) 86: 929-934.
Puite K. J. & Ten Broeke W. R. R. (1983): DNA staining of fixed and non-fixed plant protoplasts for flowcytometry with Hoechst 33342. – Plant Sci. Letters 32: 79-88.
Quarin C. L., Espinoza F., Martinez E. J., Pessino S. C. & Bovo O. A. (2001): A rise of ploidy level induces theexpression of apomixis in Paspalum notatum. – Sex. Plant Reprod. 13: 243-249.
Rayburn A. L., Price H. J., Smith J. D. & Gold J. R. (1985): C-band heterochromatin and DNA content in Zeamays. – Amer. J. Bot. 72: 1610-1617.
Rayburn A. L., Birdar D. P., Bullock D. G., Nelson R. L., Gourmet C. & Wetzel J. B. (1997): Nuclear DNAcontent diversity in Chinese soybean introductions. – Ann. Bot. (London) 80: 312-325.
Renno J. F., Schmelzer G. H. & De Jong J. H. (1995): Variation and geographical distribution of ploidy levels inPennisetum section Brevivalvula (Poaceae) in Burkina Faso, Benin and southern Niger. – Plant Syst.Evol. 198: 89-100.
Renzaglia K. S., Rasch E. M. & Pike L. M. (1995): Estimates of nuclear DNA content in bryophyte sperm cells:phylogenetic considerations. – Amer. J. Bot. 82: 18-25.
Rieseberg M., Kasper C., Reaedon K. F. & Scheper T. (2001): Flow cytometry in biotechnology. – Appl.Microbiol. Biotechnol. 56: 350-360.
Rival A., Beule T., Barre P., Hamon S., Duval Y. & Noirot M. (1997): Comparative flow cytometric estimationof nuclear DNA content in oil palm (Elaeis guineensis Jacq) tissue cultures and seed-derived plants. –Plant Cell Rep. 16: 884-887.
Serrato-Cruz M. Á., Hernández-Rodríguez M., Savidan Y. & Bárcenas-Ortega N. M. (2000): Contenido de ADNy nivel de ploidía en Tagetes spp. utilizando citómetro de flujo. DNA content and ploidy level inTagetes spp. using flow cytometry. – Nota Agrociencia 34: 729-734.
Sgorbati S., Levi M., Sparvoli E., Trezzi F. & Lucchini G. (1986): Cytometry and flow cytometry of 4´,6-diamidino-2-phenylindole (DAPI)-stained suspensions of nuclei released from fresh and fixed tissues ofplants. – Physiol. Pl. (Copenhagen) 68: 471-476.
Shapiro H. M. (1995): Practical flow cytometry. 3rd edn. – Wiley-Liss/John Wiley and Sons, Inc., New York.Schäffner K.-H. & Nagl W. (1979): Differential DNA replication involved in transition from juvenile to adult
phase in Hedera helix (Araliaceae). – Plant Syst. Evol., Suppl. 2: 105-110.Schwencke J., Bureau J.-M., Crosnier M.-T. & Brown S. (1998): Cytometric determination of genome size and
base composition of tree species of three genera of Casuarinaceae. – Plant Cell Rep. 18: 346-349.Siljak-Yakovlev S., Cerbah M., Coulaud J., Stoian V., Brown S. C., Zoldos V., Jelenic S. & Papes D. (2002):
Nuclear DNA content, base composition, heterochromatin and rDNA in Picea omorika and Picea abies.– Theor. Appl. Genet. 104: 505-512.
Siljak-Yakovlev S., Peccenini S., Muratovic E., Zoldos V., Robin O. & Vallès J. (2003): Chromosomaldifferentiation and genome size in three European mountain Lilium species. – Plant Syst. Evol. 236:165-173.
Singh K. P., Raina S. N. & Singh A. K. (1996): Variation in chromosomal DNA associated with the evolution ofArachis species. – Genome 39: 890-897.
REFERENCES
50
Swift H. (1950): The constancy of desoxyribose nuclei acid in plant nuclei. – Proc. Natl. Acad. Sci. USA 36:643-654.
Temsch E. M., Greilhuber J. & Krisai R. (1998): Genome size in Sphagnum (peat moss). – Bot. Acta 111: 325-330.
Temsch E. M. & Greilhuber J. (2000): Genome size variation in Arachis hypogaea and A. monticola re-evaluated. – Genome 43: 449-451.
Temsch E. M. & Greilhuber J. (2001): Genome size in Arachis duranensis – a critical study. – Genome 44: 826-830.
Thiem B. & Śliwińska E. (2003): Flow cytometric analysis of nuclear DNA content in cloudberry (Rubuschamaemorus L.) in vitro cultures. – Plant Sci. 164: 129-134.
Tusa N., Abbate L., Ferrante S., Lucretti S. & Scarano M.-T. (2002): Identification of zygotic and nucellarseedlings in Citrus interploid crosses by means of isozymes, flow cytometry and ISSR-PCR. – Cell.Mol. Biol. Letters 7: 703-708.
Ulrich I. & Ulrich W. (1991): High-resolution flow cytometry of nuclear DNA in higher plants. – Protoplasma165: 212-215.
Ulrich I., Fritz B. & Ulrich W. (1988): Application of DNA fluorochromes for flow cytometric DNA analysis ofplant protoplasts. – Plant Sci. 55: 151-158.
Vagera J., Paulíková D. & Doležel J. (1994): The development of male and female regenerants by in vitroandrogenesis in dioecious plant Melandrium album. – Ann. Bot. (London) 73: 455-459.
Van Dijk P., Hartog M. & Van Delden W. (1992): Single cytotype areas in autopolyploid Plantago media L. –Biol. J. Linn. Soc. 46: 315-331.
Van Tuyl J. M., De Vries J. N., Bino R. J. & Kwakkenbos A. A. (1989): Identification of 2n-pollen producinginterspecific hybrids of Lilium using flow cytometry. – Cytologia 54: 737-745.
Van’t Hof J. & Sparrow A. H. (1963): A relationship between DNA content, nuclear volume and minimummitotic cycle time. – Proc. Natl. Acad. Sci. USA 49: 897-902.
Vilhar B., Greilhuber J., Koce J. D., Temsch E. M. & Dermastia M. (2001): Plant genome size measurementwith DNA image cytometry. – Ann. Bot. (London) 87: 719-728.
Voglmayr H. (2000): Nuclear DNA amounts in mosses (Musci). – Ann. Bot. (London) 85: 531-546.Wakamiya I., Newton R. J., Johnston J. S. & Price H. J. (1993): Genome variation and environmental factors in
the genus Pinus. – Amer. J. Bot. 80: 1235-1241.Watson J. V. (1991): Introduction to flow cytometry. – Cambridge University Press, Cambridge.Watson J. V. (1992): Flow cytometry data analysis. Basic concepts and statistics. – Cambridge University Press,
Cambridge.Weiss H., Dobeš C., Schneeweiss G. M. & Greimler J. (2002): Occurrence of tetraploid and hexaploid cytotypes
between and within populations in Dianthus sect. Plumaria (Caryophyllaceae). – New Phytol. 156: 85-94.
Wetzel J. B., Aref S., Baligar V. C. & Rayburn A. L. (1999): A lack of nuclear DNA content variability amongwheat near isolines differing in aluminium response. – Ann. Bot. (London) 83: 725-728.
Winkelmann T., Sangwan R. S. & Schwenkel H.-G. (1998): Flow cytometric analysis in embryogenic and non-embryogenic callus lines of Cyclamen persicum Mill.: relation between ploidy level and competence forsomatic embryogenesis. – Plant Cell Rep. 17: 400-404.
Wyman J., Laliberté S. & Tremblay M.-F. (1997): Nuclear DNA content variation in seeds from 22 half-sibfamilies of Jack pine (Pinus banksiana, Pinaceae). – Amer. J. Bot. 84: 1351-1361.
Yokoya K., Roberts A. V., Mottley J., Lewis R. & Brandham P. E. (2000): Nuclear DNA amounts in roses. –Ann. Bot. (London) 85: 557-561.
Zonneveld B. J. M. (2001): Nuclear DNA contents of all species of Helleborus (Ranunculaceae) discriminatebetween species and sectional divisions. – Plant Syst. Evol. 229: 125-130.