Ambient vibration-based investigation of the Victory arch ... · of the updated model as a baseline...
8
1 INTRODUCTION Many of the reinforced concrete arch bridges built in Italy in the first half of the 20 th century or before still stand today. These bridges were obviously designed for live loads quite different from automobile traffic they carry today and often require a structural condition assessment. A good example is the Victory bridge (Santarella and Miozzi 1924), completed in 1923 and lo- cated about 75 km far from Milan. Within an advanced monitoring and maintenance program, the Province of Lecco (owner of the bridge) planned extensive investigations of the bridge, including: (a) review of the bridge history, with an emphasis on the structural modifications of 1984. A great amount of documents and design drawings has been found in the archives and both the original and the current geometry of the bridge were reconstructed with fair accuracy; (b) visual inspection and topographic survey of the bridge; (c) ambient vibration testing of the bridge; (d) live load static tests and laboratory tests on few cored samples of the bridge concrete to es- timate the strength and the elastic properties; (e) finite element modelling of the bridge in its present configuration, model updating and use of the updated model as a baseline model for the future monitoring of the structure; (f) design and installation on the bridge of a permanent Structural Health Monitoring (SHM) system. To date the tasks (a)-(c) and (e) have been completed and are addressed in the paper. Ambient vibration-based investigation of the "Victory" arch bridge C. Gentile and N. Gallino Polytechnic of Milan, Department of Structural Engineering, Milan, Italy ABSTRACT: The paper summarizes the dynamics-based assessment of an historic reinforced concrete arch bridge. The bridge, known as Victory bridge and originally constructed in 1923, spans 75.0 m over a deep valley in the Province of Lecco, Italy. The outlined investigation in- cluded ambient vibration testing, output-only modal identification, finite element modelling and updating of the uncertain structural parameters of the model. The experimental part of the study involved extensive measurement of ambient vibrations in- duced by traffic and several normal modes were identified by using two complementary tech- niques: the Frequency Domain Decomposition (frequency domain) and the Stochastic Subspace Identification (time domain). In the theoretical study, vibration modes were determined using a 3D finite element model of the bridge and the information obtained from the field tests, combined with a classic system identification technique, provided a linear elastic model, accurately fitting the modal parameters of the bridge in its present condition.
Transcript of Ambient vibration-based investigation of the Victory arch ... · of the updated model as a baseline...
1 INTRODUCTION
Many of the reinforced concrete arch bridges built in Italy in the first half of the 20th century or before still stand today. These bridges were obviously designed for live loads quite different from automobile traffic they carry today and often require a structural condition assessment. A good example is the Victory bridge (Santarella and Miozzi 1924), completed in 1923 and lo-cated about 75 km far from Milan.
Within an advanced monitoring and maintenance program, the Province of Lecco (owner of the bridge) planned extensive investigations of the bridge, including: (a) review of the bridge history, with an emphasis on the structural modifications of 1984. A
great amount of documents and design drawings has been found in the archives and both the original and the current geometry of the bridge were reconstructed with fair accuracy;
(b) visual inspection and topographic survey of the bridge; (c) ambient vibration testing of the bridge; (d) live load static tests and laboratory tests on few cored samples of the bridge concrete to es-
timate the strength and the elastic properties; (e) finite element modelling of the bridge in its present configuration, model updating and use
of the updated model as a baseline model for the future monitoring of the structure; (f) design and installation on the bridge of a permanent Structural Health Monitoring (SHM)
system. To date the tasks (a)-(c) and (e) have been completed and are addressed in the paper.
Ambient vibration-based investigation of the "Victory" arch bridge
C. Gentile and N. Gallino Polytechnic of Milan, Department of Structural Engineering, Milan, Italy
ABSTRACT: The paper summarizes the dynamics-based assessment of an historic reinforced concrete arch bridge. The bridge, known as Victory bridge and originally constructed in 1923, spans 75.0 m over a deep valley in the Province of Lecco, Italy. The outlined investigation in-cluded ambient vibration testing, output-only modal identification, finite element modelling and updating of the uncertain structural parameters of the model. The experimental part of the study involved extensive measurement of ambient vibrations in-duced by traffic and several normal modes were identified by using two complementary tech-niques: the Frequency Domain Decomposition (frequency domain) and the Stochastic Subspace Identification (time domain). In the theoretical study, vibration modes were determined using a 3D finite element model of the bridge and the information obtained from the field tests, combined with a classic system identification technique, provided a linear elastic model, accurately fitting the modal parameters of the bridge in its present condition.
64 ARCH’07 – 5th International Conference on Arch Bridges
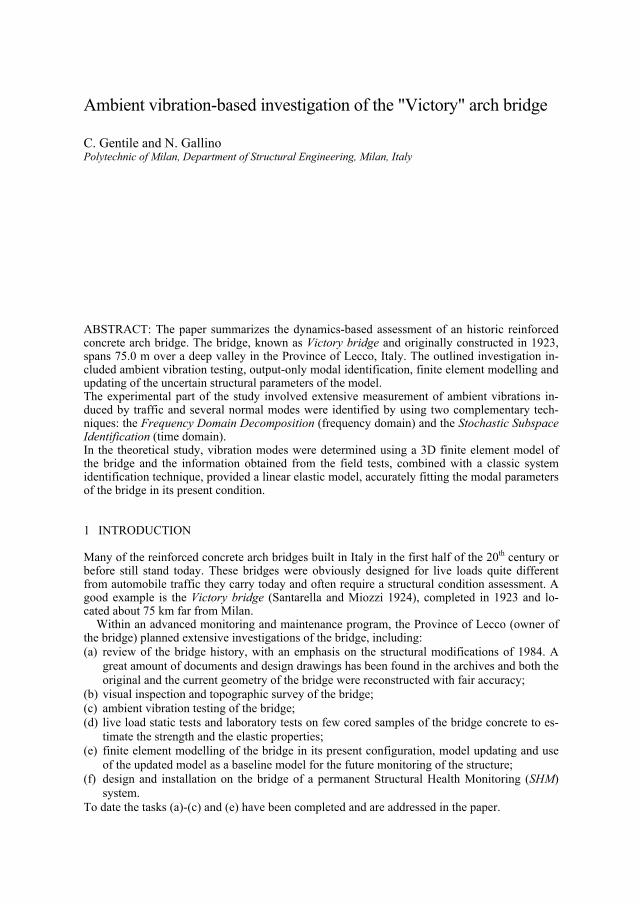
Figure 1 : Victory Bridge (Cremeno, Italy): geometry of the original structure (1923).
2 DESCRIPTION OF THE BRIDGE AND HISTORIC BACKGROUND
The investigated arch bridge (Santarella & Miozzi 1924) was designed in 1922 by Prof. A. Da-nusso (a great Italian Scholar of bridge engineering of the last century) and has been considered for a long time one of the most appreciable Italian examples of reinforced concrete (R.C.) arch bridges. The structure is known as Victory bridge because it is dedicated to the Italian soldiers who fell in the 1st World War.
The bridge is 75.0 m long and connects the small towns of Cremeno and Maggio, about 75 km far from Milan; the bridge overpasses the deep and impervious valley of the Pioverna Creek and substituted a pre-existent wooden suspension footbridge. Plan and elevation of the original bridge are shown in Fig. 1. The deck was 4.80 m wide and consisted of a cast in place R.C. slab supported by 4 longitudinal girders and 17 transverse floor beams. The parabolic arch structure consists of 2 independent solid arch ribs, transversally connected together with cross struts, hav-ing rise of about 20.0 m and clear span of 53.6 m. The two arches, with variable rectangular cross section, are canted inward to better resist to wind actions. The main girders of the deck are connected to the arches and to the foundation system by 7 couples of slender columns.
The structural architecture of the bridge was highly appreciated in consideration of the aes-thetic and structural shape of the arches, considered as brilliant and dared. In addition, the con-struction process was very fast since a provisional timber bridge was employed to support the centring of the arches: the construction of the bridge officially began on June 11th, 1923 and the centrings were removed on December 9th of the same year. The archives reported that the de-flection measured after the removal of the centrings was only 2.0 mm. The 28-days compressive strength of the concrete was in the range of 37.3−40.1 N/mm2. The reception load test consisted in the uniform loading of the deck by sand and gravel and the maximum load of 6.30 kN/m2 was attained with a deflection of about 1.5 mm.
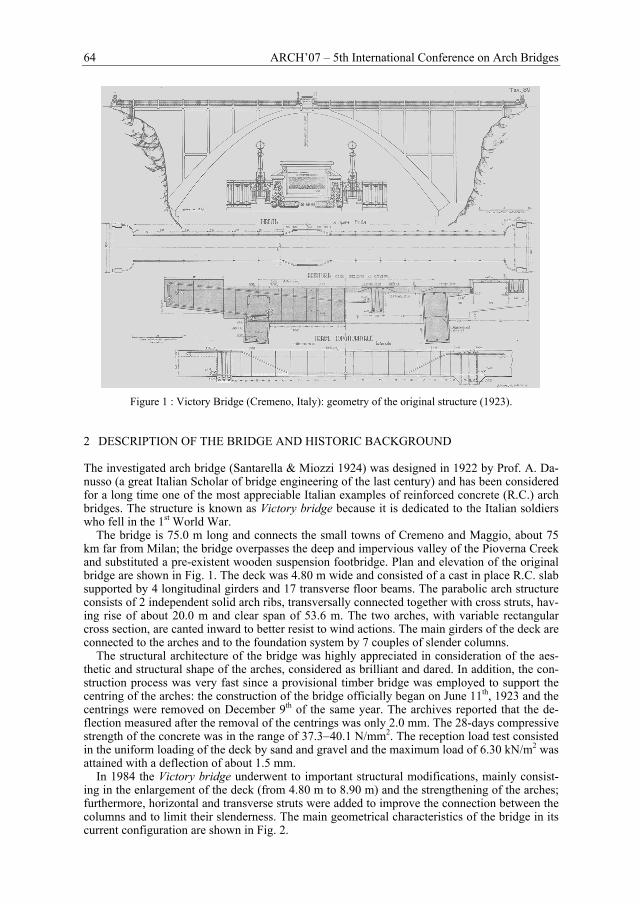
In 1984 the Victory bridge underwent to important structural modifications, mainly consist-ing in the enlargement of the deck (from 4.80 m to 8.90 m) and the strengthening of the arches; furthermore, horizontal and transverse struts were added to improve the connection between the columns and to limit their slenderness. The main geometrical characteristics of the bridge in its current configuration are shown in Fig. 2.
C. Gentile and N. Gallino 65
Figure 2 : Plan, elevation (dimensions in cm) and view of the Victory bridge after the strengthening.
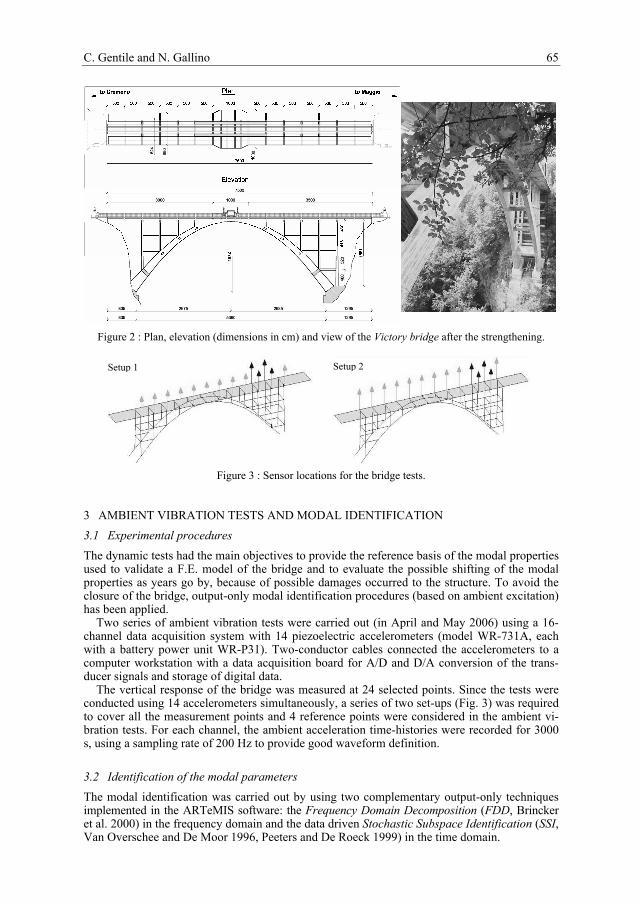
Figure 3 : Sensor locations for the bridge tests.
3 AMBIENT VIBRATION TESTS AND MODAL IDENTIFICATION 3.1 Experimental procedures The dynamic tests had the main objectives to provide the reference basis of the modal properties used to validate a F.E. model of the bridge and to evaluate the possible shifting of the modal properties as years go by, because of possible damages occurred to the structure. To avoid the closure of the bridge, output-only modal identification procedures (based on ambient excitation) has been applied.
Two series of ambient vibration tests were carried out (in April and May 2006) using a 16-channel data acquisition system with 14 piezoelectric accelerometers (model WR-731A, each with a battery power unit WR-P31). Two-conductor cables connected the accelerometers to a computer workstation with a data acquisition board for A/D and D/A conversion of the trans-ducer signals and storage of digital data.
The vertical response of the bridge was measured at 24 selected points. Since the tests were conducted using 14 accelerometers simultaneously, a series of two set-ups (Fig. 3) was required to cover all the measurement points and 4 reference points were considered in the ambient vi-bration tests. For each channel, the ambient acceleration time-histories were recorded for 3000 s, using a sampling rate of 200 Hz to provide good waveform definition.
3.2 Identification of the modal parameters The modal identification was carried out by using two complementary output-only techniques implemented in the ARTeMIS software: the Frequency Domain Decomposition (FDD, Brincker et al. 2000) in the frequency domain and the data driven Stochastic Subspace Identification (SSI, Van Overschee and De Moor 1996, Peeters and De Roeck 1999) in the time domain.
Setup 1 Setup 2
66 ARCH’07 – 5th International Conference on Arch Bridges
In the application of the FDD technique, the auto and cross spectra were evaluated using a frequency resolution of about 0.0244 Hz.
In the application of the SSI method, the data was fitted by stochastic subspace models of or-der between 2 and 100; inspection of the stabilization diagrams highlights that the observed dy-namic behaviour is well represented using model orders between 60 and 70.
3.3 Mode shapes correlation The two sets of mode shapes resulting from the application of FDD and SSI techniques were compared using the Modal Assurance Criterion (MAC, Allemang ad Brown 1983).
To correlate the results of finite element analysis and operational modal analysis, in addition to the MAC, the Normalized Modal Difference (NMD, Waters 1995) was also used. The NMD is related to the MAC by the following:
NMDMAC
MACA k B jA k B j
A k B j( , )
( , )
( , ), ,, ,
, ,φ φ
φ φ
φ φ=
− 1
(1)
In practice, the NMD is a close estimate of the average difference between the components of the two vectors φA,k, φB,j for example, a MAC of 0.950 implies a NMD of 0.2294, meaning that the components of vectors φA,k and φB,j differ on average of 22.94%. The NMD is much more sensitive to mode shape differences than the MAC and hence is used to better highlight the dif-ferences between highly correlated mode shapes. (a)
4 8 12 16 20-30
-20
-10
0
10
20
11.0818.9217.53
16.2814.67 SV1 SV2 SV3
13.6011.4510.08
8.42
7.06
SV
(dB)
frequency (Hz) (b)
4 8 12 16 20-30
-20
-10
0
10
20
5.13
11.0818.85
17.4816.1414.65
SV1 SV2 SV3
13.6211.4810.11
8.407.08
SV
(dB)
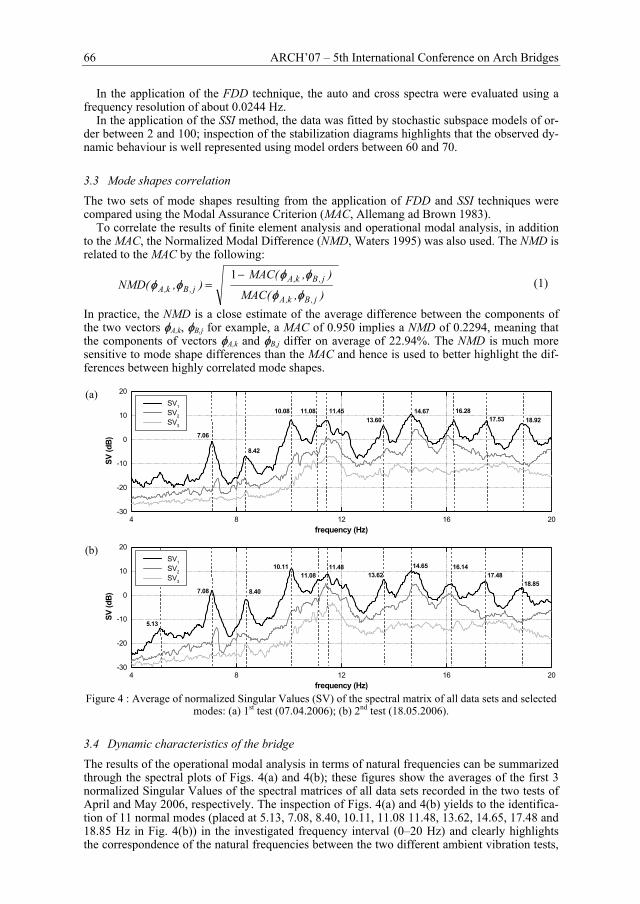
frequency (Hz) Figure 4 : Average of normalized Singular Values (SV) of the spectral matrix of all data sets and selected
modes: (a) 1st test (07.04.2006); (b) 2nd test (18.05.2006).
3.4 Dynamic characteristics of the bridge The results of the operational modal analysis in terms of natural frequencies can be summarized through the spectral plots of Figs. 4(a) and 4(b); these figures show the averages of the first 3 normalized Singular Values of the spectral matrices of all data sets recorded in the two tests of April and May 2006, respectively. The inspection of Figs. 4(a) and 4(b) yields to the identifica-tion of 11 normal modes (placed at 5.13, 7.08, 8.40, 10.11, 11.08 11.48, 13.62, 14.65, 17.48 and 18.85 Hz in Fig. 4(b)) in the investigated frequency interval (0–20 Hz) and clearly highlights the correspondence of the natural frequencies between the two different ambient vibration tests,

C. Gentile and N. Gallino 67
with the local maxima of Fig. 4(a) (1st test, April 2006) being placed practically at the same fre-quencies of those in Fig. 4(b) (2nd test, May 2006). The two curves of the first singular value are also very similar between the two tests, with the main difference being related to the spectral peak at 5.13 Hz, that is more clear in Fig. 4(b).
The observed modes can be basically arranged as bending (B) and torsion (T) modes of the deck. The first 8 mode shapes identified by the FDD method are represented in Fig. 5.
Table 1 summarizes the results obtained by applying the identification methods to the data of the 2nd test, showing: a) the natural frequencies (fFDD) identified by the FDD method; b) the aver-age and the standard deviation values of the identified natural frequencies (fSSI, σf) and modal damping ratios (ζSSI, σζ) identified by the SSI technique. Furthermore, Table 1 compares the corre-sponding mode shapes provided by the two identification procedures through the frequency dis-crepancy DF = |(fSSI−fFDD)/fSSI| and the MAC. The natural frequencies estimated by both methods are almost coincident. A similar correspondence is found also for most mode shapes, except for the bending modes B5 and B6; for this mode, the SSI method seems to provide a better estimation of the modal deflections, with the identified mode shapes being more regular and smooth.
Table 1 : Modal parameters identified by FDD and SSI techniques (2nd test).
FDD SSI FDD vs. SSI Mode fFDD fSSI σf ζSSI σζ DF MAC
Identifier (Hz) (Hz) (Hz) (%) (%) (%) B1 5.127 − − − − − − B2 7.080 7.087 0.018 1.14 0.201 0.10 0.9946 T1 8.398 8.437 0.092 1.07 0.622 0.46 0.9823 T2 10.107 10.067 0.023 0.90 0.172 0.40 0.9635 B3 11.084 11.028 0.025 1.79 0.927 0.51 0.9682 B4 11.475 11.453 0.019 0.73 0.096 0.19 0.9544 T3 13.623 13.631 0.028 0.96 0.129 0.06 0.9943 B5 14.648 14.629 0.059 1.40 0.423 0.13 0.8513 B6 16.138 16.213 0.002 1.61 0.508 0.46 0.7962 T4 17.480 17.497 0.068 1.25 0.162 0.10 0.9280 B7 18.848 18.832 0.032 1.45 0.288 0.08 0.9759
fFDD = 5.127 Hz fFDD = 7.080 Hz fFDD = 8.398 Hz
fFDD = 10.107 Hz fFDD = 11.084 Hz fFDD = 11.475 Hz
fFDD = 13.623 Hz fFDD = 14.648 Hz
Figure 5 : Selected vibration modes identified from ambient vibration data (FDD technique, 2nd test).

68 ARCH’07 – 5th International Conference on Arch Bridges
4 FINITE ELEMENT MODEL AND STRUCTURAL IDENTIFICATION
A 3D finite element model of the bridge was created using the commercially available MIDAS/Civil computer program. The linear elastic model (Fig. 6), based on the design draw-ings of the original bridge (Santarella and Miozzi 1924) and of the strengthening intervention, was formulated using the following assumptions: (a) four-node shell elements were used to represent the deck slab and the stiffening diaphragms
connecting the deck to the arches; (b) arches, girders, floor beams, columns and bracing members were modelled as tapered beam
elements; (c) the arch footings and the outer columns footings were considered as fixed; (d) since the longitudinal translation of the deck is partially prevented by the presence of as-
phalt backfill between the deck and the abutments, the boundary conditions between the deck and the abutments were modelled by a series of uniaxial springs oriented in the longi-tudinal direction and attached to both ends of the deck along each node;
(e) the Poisson's ratio of the concrete was held constant and equal to 0.20; (f) a weight per unit volume of 24.0 kN/m3 was assumed for the concrete of arches, girders,
floor beams, columns, bracing members and stiffening diaphragms; (g) an "equivalent" weight per unit volume of 27.0 kN/m3 was assumed for the deck concrete
slab in order to account for the effects of the asphalt pavement and walkways. The model results in a total of 1438 nodes, 1448 beam elements and 593 shell elements with
8576 active degrees of freedom. A preliminary dynamic analysis, was performed to check the similarity between experimental
and theoretical modal parameters; in this analysis, the concrete Young’s modulus was estimated at 35 GPa, based on the design data, while after some manual tuning, the resultant stiffness K of the longitudinal springs, placed at both ends of the deck, was assumed equal to 8.8×10⁵ kN/m. The correlation between the dynamic characteristics of the base model and the experimental re-sults is shown in columns (4)-(6) of Table 2 via the absolute frequency discrepancy, the MAC and the NMD. Table 2 shows a fairly good correlation for all modes, being a one-to-one corre-spondence between the mode shapes with MAC values greater than 0.66; in addition, the fre-quency discrepancy ranges between 2.20% and 5.74%. Hence, the correlation between theoreti-cal and experimental behaviour seems to provide a sufficient verification of the main assumptions adopted in the base model.
Successively, the distribution of the Young’s modulus over the entire bridge was updated. In order to limit the number of parameters in the structural identification procedure and to have a well-conditioned updating problem, a sensitivity analysis (that computes the sensitivity coefficient defined as the rate of change of a particular response quantity with respect to a change in a struc-tural parameter) has been conducted. Basing on the sensitivity analysis results, the bridge was di-vided in 6 regions (Fig. 7), with the elastic modulus of concrete being assumed as constant within each zone; since the sensitivity analysis clearly showed that the stiffness K only affects the fre-quency of the first mode, this parameter was not included in the updating procedure.
Figure 6 : 3D view of the F.E. model of the Victory bridge.
C. Gentile and N. Gallino 69
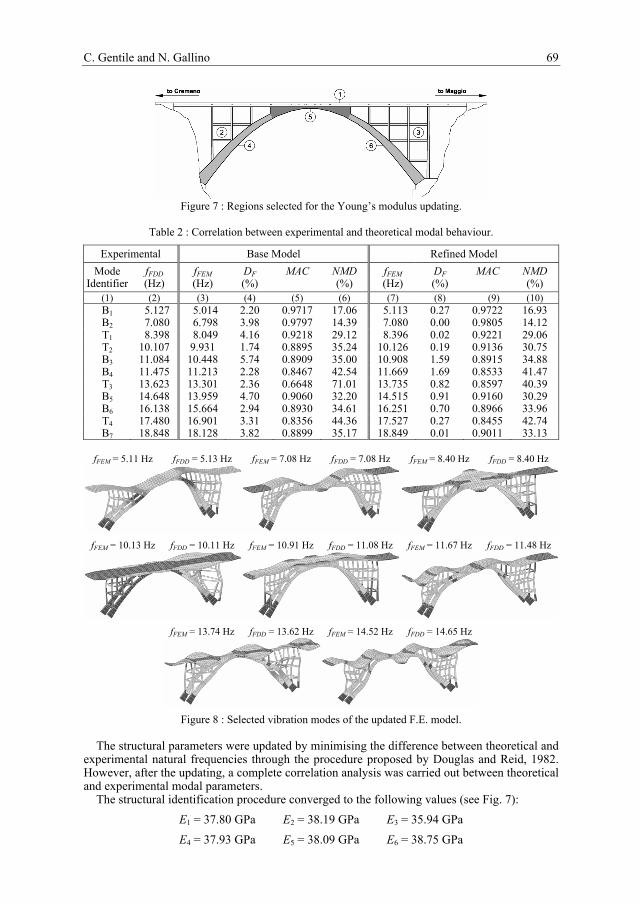
Figure 7 : Regions selected for the Young’s modulus updating.
Table 2 : Correlation between experimental and theoretical modal behaviour.
Experimental Base Model Refined Model Mode fFDD fFEM DF MAC NMD fFEM DF MAC NMD
Identifier (Hz) (Hz) (%) (%) (Hz) (%) (%) (1) (2) (3) (4) (5) (6) (7) (8) (9) (10) B1 5.127 5.014 2.20 0.9717 17.06 5.113 0.27 0.9722 16.93 B2 7.080 6.798 3.98 0.9797 14.39 7.080 0.00 0.9805 14.12 T1 8.398 8.049 4.16 0.9218 29.12 8.396 0.02 0.9221 29.06 T2 10.107 9.931 1.74 0.8895 35.24 10.126 0.19 0.9136 30.75 B3 11.084 10.448 5.74 0.8909 35.00 10.908 1.59 0.8915 34.88 B4 11.475 11.213 2.28 0.8467 42.54 11.669 1.69 0.8533 41.47 T3 13.623 13.301 2.36 0.6648 71.01 13.735 0.82 0.8597 40.39 B5 14.648 13.959 4.70 0.9060 32.20 14.515 0.91 0.9160 30.29 B6 16.138 15.664 2.94 0.8930 34.61 16.251 0.70 0.8966 33.96 T4 17.480 16.901 3.31 0.8356 44.36 17.527 0.27 0.8455 42.74 B7 18.848 18.128 3.82 0.8899 35.17 18.849 0.01 0.9011 33.13
fFEM = 5.11 Hz fFDD = 5.13 Hz fFEM = 7.08 Hz fFDD = 7.08 Hz fFEM = 8.40 Hz fFDD = 8.40 Hz
fFEM = 10.13 Hz fFDD = 10.11 Hz fFEM = 10.91 Hz fFDD = 11.08 Hz fFEM = 11.67 Hz fFDD = 11.48 Hz
fFEM = 13.74 Hz fFDD = 13.62 Hz fFEM = 14.52 Hz fFDD = 14.65 Hz
Figure 8 : Selected vibration modes of the updated F.E. model.
The structural parameters were updated by minimising the difference between theoretical and experimental natural frequencies through the procedure proposed by Douglas and Reid, 1982. However, after the updating, a complete correlation analysis was carried out between theoretical and experimental modal parameters.
The structural identification procedure converged to the following values (see Fig. 7): E1 = 37.80 GPa E2 = 38.19 GPa E3 = 35.94 GPa E4 = 37.93 GPa E5 = 38.09 GPa E6 = 38.75 GPa
70 ARCH’07 – 5th International Conference on Arch Bridges
The dynamic characteristics of the updated model are compared with the experimental data in columns (8)-(10) of Table 2. It can be observed that the updated model exhibits an excellent cor-respondence of its natural frequencies with the measured ones; it can be observed that the fre-quency discrepancy is lower than 1.0% for most modes while the maximum discrepancy is about 1.70%. Furthermore, the good match between measured and computed dynamic properties is confirmed by the MAC, with values ranging from about 0.846 to 0.981. As a further demonstra-tion, Fig. 8 shows the vibration modes of the model, corresponding to the experimental ones, previously shown in Fig. 5.
Basing on the above results, it can be stated that, despite both the complex structural layout of the bridge and the simplifying assumptions of the model, there is a good agreement with the experimental results for all identified modes. Furthermore, the identified values of concrete Young’s modulus, ranging between 35.94 GPa and 38.75 GPa, suggested a satisfactory quality of the concrete and a good state of preservation of the bridge.
5 CONCLUSIONS
A rational methodology for the dynamics-based assessment of r.c. arch bridges has been pre-sented and applied in the paper. The outlined approach (based on ambient vibration testing, out-put-only modal identification, F.E. modelling, sensitivity analysis and updating of the uncertain structural parameters of the model) seems to be especially suitable for arch bridges (where vis-ual inspection is usually very difficult) and in the framework of continuously operating SHM systems. The following conclusions can be drawn: 1. the ambient vibration tests allowed the identification of 11 mode shapes in the frequency
range 0−20 Hz, providing also estimates of the associated modal damping ratios; 2. an excellent agreement was found between the modal estimates obtained from the FDD and
SSI techniques in two successive series of tests; 3. in the analytical study, the application of the simple system identification technique provided a
linear elastic model, adequately representing the dynamic characteristics of the bridge; 4. the optimal values of the identified Young’s modulus suggested a satisfactory quality of the
concrete and a good state of preservation of the bridge.
ACKNOWLEDGEMENTS
The research was supported by the M.I.U.R. (Italian Ministry of University and Research), un-der grant Cofin 06, and the Lecco Province. Furthermore, the authors would like to thank Dr. Arch. E. Tosca for the valuable help in the historic studies of the bridge.
The authors would like to commemorate Profs. A. Danusso and F. Martinez y Cabrera, great Italian Scholars of Bridge Engineering at the Polytechnic of Milan, who designed the original bridge and the strengthening intervention, respectively.
REFERENCES
Allemang, R.J. and Brown, D.L. 1983. Correlation coefficient for modal vector analysis. Proc. 1st Int. Modal Analysis Conference (IMAC), p. 110-116.
Brincker, R., Zhang, L.M. and Andersen P. 2000. Modal identification from ambient responses using Fre-quency Domain Decomposition. Proc. 18th Int. Modal Analysis Conference (IMAC), p. 625-630.
Douglas, B.M. and Reid, W.H. 1982. Dynamic tests and system identification of bridges. J. Structural Div., ASCE, 108(10), p. 2295-2312.
Peeters, B. and De Roeck, G. 1999. Reference-based stochastic subspace identification for output-only modal analysis. Mechanical Systems and Signal Processing, 6(3), p. 855-878.
Santarella, L. and Miozzi, E. 1924. Italian bridges in reinforced concrete (in italian), Hoepli, Milano. Van Overschee, P. and De Moor, B. 1996. Subspace identification for linear systems: Theory, implemen-
tation, applications. Kluwer Academic Publishers. Waters, T.P. 1995. Finite element model updating using measured frequency response functions, Ph.D.
Thesis, Department of Aerospace Engineering, University of Bristol.