Airborne Lead in El Paso, Texas, USA
31
University of Texas at El Paso DigitalCommons@UTEP Open Access eses & Dissertations 2017-01-01 Airborne Lead in El Paso, Texas, USA Lisa Marie Paz University of Texas at El Paso, [email protected] Follow this and additional works at: hps://digitalcommons.utep.edu/open_etd Part of the Geology Commons is is brought to you for free and open access by DigitalCommons@UTEP. It has been accepted for inclusion in Open Access eses & Dissertations by an authorized administrator of DigitalCommons@UTEP. For more information, please contact [email protected]. Recommended Citation Paz, Lisa Marie, "Airborne Lead in El Paso, Texas, USA" (2017). Open Access eses & Dissertations. 519. hps://digitalcommons.utep.edu/open_etd/519
Transcript of Airborne Lead in El Paso, Texas, USA

University of Texas at El PasoDigitalCommons@UTEP
Open Access Theses & Dissertations
2017-01-01
Airborne Lead in El Paso, Texas, USALisa Marie PazUniversity of Texas at El Paso, [email protected]
Follow this and additional works at: https://digitalcommons.utep.edu/open_etdPart of the Geology Commons
This is brought to you for free and open access by DigitalCommons@UTEP. It has been accepted for inclusion in Open Access Theses & Dissertationsby an authorized administrator of DigitalCommons@UTEP. For more information, please contact [email protected].
Recommended CitationPaz, Lisa Marie, "Airborne Lead in El Paso, Texas, USA" (2017). Open Access Theses & Dissertations. 519.https://digitalcommons.utep.edu/open_etd/519

AIRBORNE LEAD IN EL PASO, TEXAS, USA
LISA MARIE PAZ
Master’s Program in Geology
APPROVED:
Nicholas Pingitore, Ph.D., Chair
Maria Amaya, Ph.D.
Richard Jarvis, Ph.D.
Charles Ambler, Ph.D.
Dean of the Graduate School

Copyright ©
by
Lisa Marie Paz
2017

DEDICATION
This work is dedicated to the greatest support system anyone could wish for: my parents who are
my heroes and role models, my husband, brother, sister-in-law, niece, nephew, and the two
greatest blessings in my life, my daughters. You all inspire me every single day.
Special thanks to the UTEP Geology Department for being a second home to me, and especially
Dr. Nicholas Pingitore for being a constant source of encouragement.

AIRBORNE LEAD IN EL PASO, TX, USA
by
LISA MARIE PAZ, B.S. Geological Sciences
MASTER’S THESIS
Presented to the Faculty of the Graduate School of
The University of Texas at El Paso
in Partial Fulfillment
of the Requirements
for the Degree of
MASTER OF SCIENCE
Geological Sciences
THE UNIVERSITY OF TEXAS AT EL PASO
December 2017

v
ACKNOWLEDGMENTS
This work was supported by grant number S11 ES013339 from the National Institute of
Environmental Health Sciences (NIEHS) and the National Institutes of Health (NIH). Its
contents are solely the responsibility of the authors and do not necessarily represent the official
views of the NIEHS or NIH. We appreciate the efforts and support of all the faculty and students
who participated in this NIEHS ARCH Program. We also thank the TCEQ and EPWU for their
cooperation in providing access to their property and electrical power for the siting of our air
samplers.

vi
ABSTRACT
Despite significant strides to minimize lead in our air, water, soil, food, homes, workplaces,
and consumer products, sporadic and systemic lead poisoning persists in industrial societies,
e.g., the contemporary Flint (Michigan, USA) municipal water tragedy. Because lead
exposure is cumulative, the sum of exposure from all sources, it is important to document
and update potential community or neighborhood exposure levels from such environmental
compartments as air, water, and housing. Here we present ambient airborne lead levels in El
Paso, Texas, USA, parsed by particulate matter (PM) size fraction, geography, and season.
Dichotomous samplers at 8 stations collected particulate matter continuously for 1-week
periods for nearly 4 years. Overall, airborne annual lead exposure throughout El Paso
County is low, well within US Environmental Protection Agency (EPA) guidelines. There is
considerably more lead in the coarse fraction (PM10-PM2.5) than in the fine fraction (PM2.5
and lower), indicating decreased effective human exposures because the coarse fraction does
not penetrate as deeply into the pulmonary system as finer particles. Re-entrained soil has
previously been identified as the source of airborne lead in El Paso; the concentration of
lead in the coarse PM is consistent with this observation. Seasonally, fall-winter lead levels
are highest, due to PM trapping by temperature inversions, followed by spring and summer.
Geospatially, higher lead levels characterize sampling stations in older and more
commercial neighborhoods, also consistent with published maps of soil lead levels
throughout the county. At present, airborne lead can be considered to be only a minor source
of lead exposure for typical El Paso residents.

vii
TABLE OF CONTENTS
ACKNOWLEDGMENTS ...............................................................................................................v
ABSTRACT ................................................................................................................................... vi
TABLE OF CONTENTS .............................................................................................................. vii
LIST OF TABLES ......................................................................................................................... ix
LIST OF FIGURES .........................................................................................................................x
LIST OF ILLUSTRATIONS ...........................................................................................................x
Chapter
1: INTRODUCTION .......................................................................................................................11.1 - Legacy of Lead Contamination in El Paso, Texas ......................................................... 2
1.2 – El Paso Geography .........................................................................................................3
1.3 – Rationale for Study ........................................................................................................3
2: MATERIALS AND METHODS.................................................................................................5
2.1 - Sampling .........................................................................................................................5
2.2 - Samples ...........................................................................................................................6
2.3 - Lead Determination ........................................................................................................6
2.4 - Data Compilation: Seasonality and Geography..............................................................7
3: RESULTS AND DISCUSSION ..................................................................................................8
3.1 - Data .................................................................................................................................8
3.2 - General Observations ...................................................................................................11
3.2.1 - Lead Levels and Air Quality Regulations ........................................................11
3.2.2 - Source of Lead ..................................................................................................12
3.3 - Geographic Trends .......................................................................................................12
3.4 - Seasonal Trends ............................................................................................................14
3.5 - Public Health Implications ...........................................................................................15
4: CONCLUSIONS .......................................................................................................................16

viii
REFERENCES ..............................................................................................................................17
CURRICULUM VITA ..................................................................................................................19

ix
LIST OF TABLES
Table 1. Description of 8 monitoring sites in El Paso, Texas. ........................................................ 5
x
LIST OF FIGURES
Figure 1. (Color online) Location map of El Paso, Texas .............................................................. 4
Figure 2. (Color online) Sample locations in El Paso County ....................................................... 6
Figure 3. (Color online) PMC lead levels by season and station ................................................... 9
Figure 4. (Color online) PMF lead levels by season and station .................................................. 10
Figure 5. (Color online) Comparison of lead in total suspended particulates for cities located in
the southwest U.S ......................................................................................................................... 11

1
1. INTRODUCTION
Airborne lead (Pb) contamination was a serious environmental health hazard in
industrialized countries through much of the 20th Century [1,2,3,4]. Leaded gasoline was the
dominant source, rivalled only in specific local areas by fugitive emissions from mining,
smelting, and working of this toxic metal, as well as incineration and such specific industries as
lead-acid battery and wheel weight manufacture. The addition of tetra-ethyl lead and related Pb-
based anti-knock compounds decreased in the US as catalytic converters, which would be
inactivated by lead deposition, were incorporated into new vehicles to reduce smog, starting in
1975 [5]. A consequent dramatic decrease in blood lead levels correlated closely with the
measured decrease in airborne lead over the next 15 or so years [6]. Similar decreases were
observed in other nations that switched to unleaded gasoline, a process that was completed in
most industrialized nations by 2000 and globally by 2015. The most dangerous aspect of human
exposure to lead occurs in young children, in whom lead acts as a powerful neurotoxin on the
developing brain and nerve system, even at quite low blood lead levels (BLL) [7,8,9]. Current
practice in the US, as enunciated by The Centers for Disease Control and Prevention (CDC),
employs a blood lead intervention threshold in children of ≥10 µg/dL. In the US average BLL in
children 1-5 years old has dropped from 15 to less than 1.5 µg/dL [10]. Nonetheless, some
researchers and activists argue that no levels of blood lead are safe [11]. In 2008 the US
Environmental Protection Agency (EPA) lowered the then current airborne lead standard by a
factor of 10, from 1.5 µg m-3 to a 3-month average below 0.15 µg m-3 in total suspended
particulate matter (TSP) [12,13]. The agency also relaxed the required monitoring for urban
areas since most were expected to meet the new, albeit stricter, regulation. Nonetheless, with a

2
decrease in the number of required urban monitors it is possible that in some cities there may be
persistent local “hot spots” that do not meet current regulations.
1.1. Legacy of Lead Contamination in El Paso, Texas
The city of El Paso, in far west Texas, USA, has a long history of exposure to lead due in
part to the presence for more than a century of a lead smelter sited approximately 3 km from the
urban downtown center. The smelter was constructed in 1887 to process ores from mines in
Mexico and the US Southwest. Over time it was chiefly a lead smelter and then a copper smelter.
Operations were suspended in 1999 and the smelter was demolished in 2013. The soil around the
smelter was contaminated with lead and arsenic, and children in Smeltertown, a workers’
residential community immediately adjacent to the property, were found to have exceedingly
high BLLs [14]. The children were treated and the settlement was razed. Extensive background
material on Smeltertown and the ASARCO smelter are found in [15,16].
With cessation of smelter operations and elimination of leaded gasoline, airborne lead in El Paso
has fallen dramatically [17]. Nonetheless, Pb-contaminated soils persist in the older areas of El
Paso, a legacy of smelting, gasoline, and other industrial activities [18,19]. Selected residential
yards in a small region near the smelter site were remediated under EPA supervision.
By speciating recent samples of airborne lead by synchrotron-based x-ray absorption
spectroscopy, re-entrained soil was found to be the dominant current source of the metal in the El
Paso air shed [20].

3
1.2. El Paso Geography
El Paso is located in the far west region of Texas, along the Rio Grande, which forms that
section of the USA- Mexico border (Figure 1). El Paso County hosts some 825,000 residents,
with an estimated 1,500,000 residents in contiguous Cd. Juarez, Chihuahua, Mexico. The climate
is Chihuahuan Desert, a high desert climate zone characterized by low rainfall and cool to cold
winter temperatures [21]. El Paso elevation is approximately 1150 m, with an average rainfall of
just under 25 cm, most of which occurs in brief mid-to-late-summer storms in the “monsoon”
season of July, August, and September. Strong winds and dust storms characterize the dry spring
season.
1.3. Rationale for Study
This study presents the results of lead analyses of a large number of dichotomous aerosol
samples, which split particulate matter (PM) samples into PM coarse (PM10 – PM2.5) and PM
fine (PM2.5 and finer). Because sampling was performed at numerous sites throughout the city
of El for periods of several years, the sample set can provide a robust picture of contemporary
exposure of the local citizenry to airborne lead.

4
Figure 1. (Color online) Location map of El Paso, Texas
5
2. MATERIALS AND METHODS
2.1. Sampling
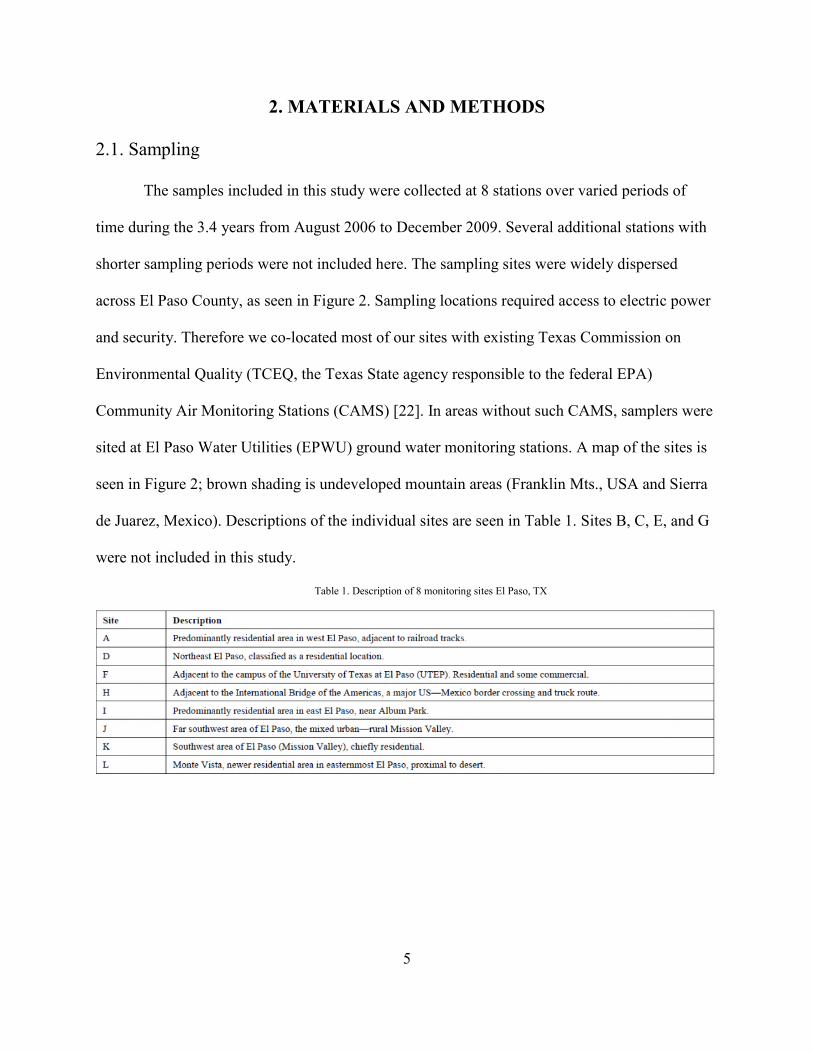
The samples included in this study were collected at 8 stations over varied periods of
time during the 3.4 years from August 2006 to December 2009. Several additional stations with
shorter sampling periods were not included here. The sampling sites were widely dispersed
across El Paso County, as seen in Figure 2. Sampling locations required access to electric power
and security. Therefore we co-located most of our sites with existing Texas Commission on
Environmental Quality (TCEQ, the Texas State agency responsible to the federal EPA)
Community Air Monitoring Stations (CAMS) [22]. In areas without such CAMS, samplers were
sited at El Paso Water Utilities (EPWU) ground water monitoring stations. A map of the sites is
seen in Figure 2; brown shading is undeveloped mountain areas (Franklin Mts., USA and Sierra
de Juarez, Mexico). Descriptions of the individual sites are seen in Table 1. Sites B, C, E, and G
were not included in this study.
Table 1. Description of 8 monitoring sites El Paso, TX

6
Figure 2. (Color online) Sample locations in El Paso, Texas
2.2. Samples
Thermo Electron Corporation Series 241 dichotomous samplers (Thermo Electron Corp.,
Waltham, MA, USA) collected PM samples on Teflon® filters over a sampling period of 1
week. Mass was determined by gravimetric analysis. U.S. EPA's Compendium Method IO-2.2
guided overall procedures [23], with specifics available in [24].
2.3. Lead Determination
Lead concentration was determined on a PANalytical Epsilon5 energy dispersive x-ray
fluorescence unit (XRF), an instrument specifically designed to meet the requirements of US
EPA Method IO-3.3 for elemental analysis of air filters [25]. NIST PM SRMs (US National

7
Institute for Standards and Technology, Standard Reference Materials) for particulate matter [26]
and Micromatter™ commercial thin-film single-element standards [27] were used for instrument
calibration. Analytical protocol was based on EPA Method IO-3.3 for XRF analysis of
suspended particulate matter [25].
2.4. Data Compilation: Seasonality and Geography
To assist in comparisons and interpretation, the weekly data were composited into 3
annual seasons, defined by changing wind patterns. For the purposes of this research, June 16
through October 15 represented the ‘summer’ season, which is most commonly associated with
high temperatures and intermittent brief monsoon rains (the North American Monsoon, bringing
moisture to the region from the Gulf of Mexico). October 16 through February 14 data were
designated as ‘winter,’ with area inversions typical for this part of the year. Nighttime freezing
temperatures are not uncommon in this Chihuahuan Desert climate, at an elevation of ~1200 m.
February 15 through June 15 was categorized as ‘spring,’ which is characterized by dry
conditions and large-scale wind events. Each season has distinct characteristics associated with
prevailing wind direction, temperature, and presence or absence of precipitation. Thus weekly
data were simplified by calculating the average mass of lead per cubic meter of air, in each
season, at each of the 8 sites, as averaged during a period of approximately four years. The
averages, organized based on season and geographic location, represent the total ambient
exposure of a person residing in a specific El Paso neighborhood during a specific time period.
This represents an important parameter in considering the health impact of different
neighborhoods on their residents.

8
3. RESULTS AND DISCUSSION
3.1. Data
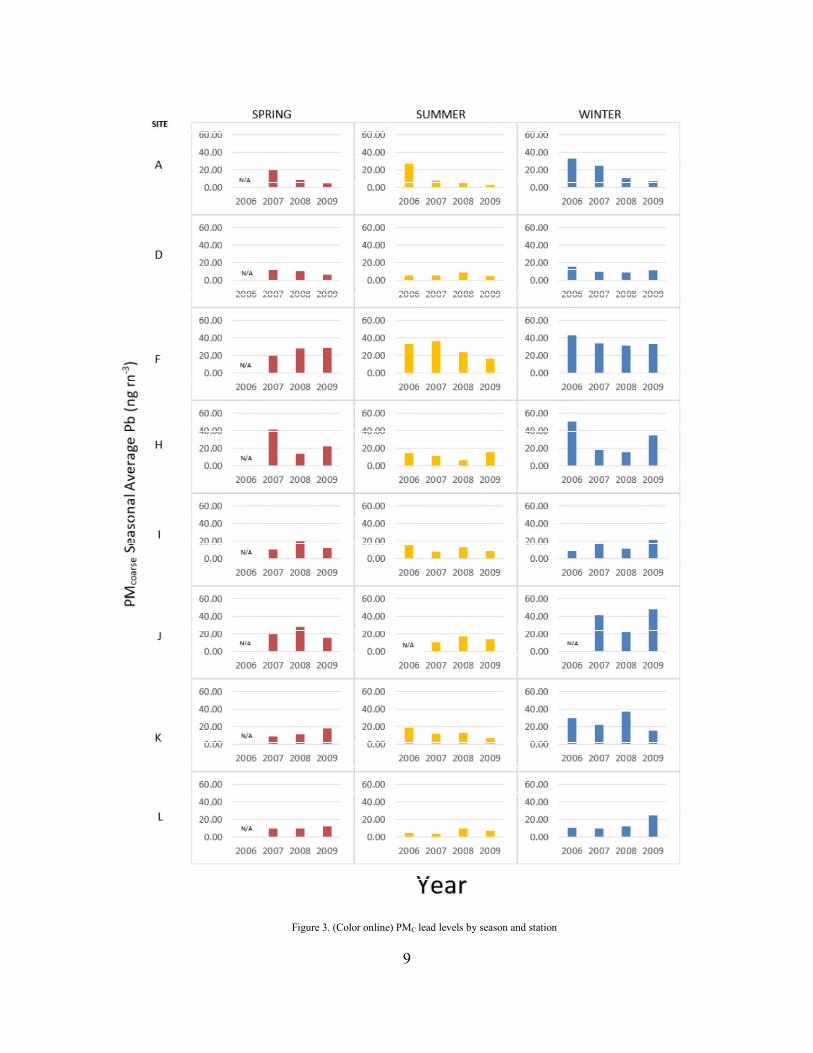
Figure 3 presents the seasonal averages of lead in PMC (PMcoarse) for all stations for all
years. Figure 4 presents the seasonal averages of lead in PMF (PMfine) for all stations for all
years. Note the change in vertical scales, where the PMC tops out at 60 ng m-3 and PMF tops out
at only 30 ng m-3. Thus differences between lead levels in coarse and fine PM are twice as great
as they appear visually. Had we plotted the PMF at the same scale as the PMC, differences within
the PMF data set would not have been visible.
9
Figure 3. (Color online) PMC lead levels by season and station

10
Figure 4. (Color online) PMF lead levels by season and station

11
Figure 5. (Color online) Comparison of lead in total suspended particulates for cities located in the southwest U.S.
3.2. General Observations
3.2.1. Lead Levels and Air Quality Regulations
Airborne lead was found to be well below the US EPA National Ambient Air Quality
Standards (NAAQS) for Lead (Pb) under the Clean Air Act of 0.15 micrograms Pb in total
suspended particles per cubic meter air as a 3-month average. The El Paso Pb values are seen to
have not exceeded an average of approximately 70 ng m-3, or .07 µg m-3, during any of our
averaged periods of approximately 4 months. Note that we used the sum of our PMC and PMF
measurements to derive 70 ng m-3 as a proxy for the TSP value used in the regulations.
Figure 5 presents a comparison of airborne lead levels in El Paso and 3 other cities in the region,
as well as the US average and US EPA standard [28,29]. Note that these values are based on TSP
samples collected by individual state agencies to comply with EPA Pb air monitoring
regulations. The values of our data for site F, as seen in Figs. 3 and 4, are in general agreement

12
with the Pb levels reported by the EPA. Our site F corresponds most closely to the urban core
sites used by TCEQ for Pb monitoring.
3.2.2. Source of Lead
The order-of-magnitude higher concentrations of lead in the PMC relative to those in the
PMF is striking. Anthropogenic lead sources, e.g., the automobile emissions formerly associated
with gasoline containing tetra-ethyl lead and related compounds or powdering old Pb-based
paints, typically are associated with the fine fraction of airborne PM. Here the presence of the
overwhelming majority of the lead in the PMC fraction indicates the lead does not have an
obvious current industrial, automotive, or other anthropogenic source. This observation is
consistent with an earlier investigation of the speciation of lead in El Paso PM. Using
synchrotron-based X-ray absorption spectroscopy (XAS), [20] demonstrated that virtually all the
airborne lead was in the same chemical form as that in the local soils, i.e., adsorbed to humic
acids or possibly such other soil components as clay particles. Thus the current airborne lead is a
legacy of earlier pollution from automobile exhaust, a local lead, zinc, and copper smelter
(shuttered in 1991), and other anthropogenic sources. The speciation and the particle size of that
lead changed with deposition and transformative chemical interactions within the local soil.
3.3. Geographic Trends
Sites F, H, and J stand out, in sequence, with the highest lead PM values. Site F is within
1.5 km of the former ASARCO smelter, adjacent to the University of Texas at El Paso, which is
built on land donated by ASARCO in the early 20th Century. The smelter was founded in 1887
to handle lead ores from the mines in northern Mexico, and later added copper and zinc
separations. It operated for more than a century, and ceased operations in 1999. The US EPA
found ASARCO a potentially responsible party for lead and arsenic contamination in the

13
neighborhoods surrounding the plant and undertook a cleanup of residential soils at some 1000
houses within a 5 km distance of the plant. In addition to soil contamination from the smelter,
site F lies close to Interstate Highway 10, Mesa Street—State Highway 20 (a heavily trafficked
commercial route), two railroads, and US Highway 62—Paisano Drive. Thus leaded gasoline
and railroad transport also contributed to a significant legacy burden of soil contamination in this
older part of El Paso’s urban core [18,19,30]. Inasmuch as chemical speciation indicates that re-
entrained soil is the dominant source of lead in current El Paso air [20], it is not surprising that
the highest lead levels are coterminous with the part of the city bearing the most lead-
contaminated soil.
Site H is in the Chamizal Memorial Monument, a small park located within 150 m of the US
Customs and Border Patrol Inspection Station at the foot of the International Bridge of the
Americas, a border crossing between El Paso, Texas, USA and Cd. Juarez, Chihuahua, Mexico.
Some 400 m past the Customs Station is US Highway 54. On two other sides the small park
borders US Highway 62 (50 m distant) and US Interstate Highway Loop 375—Cesar E. Chavez
Border Highway (150 m). In addition to the legacy of airborne lead deposition onto the soil from
vehicular traffic, the extremely busy bridge crossing has long been well known for traffic delays
in excess of one or two hours for entry into the United States. All vehicles are stopped at
multiple lanes in a toll-booth-type barricade and drivers and passengers subjected to a brief—or
extensive—questioning and vehicle scan or search. This process often causes backups of the
multi-lane traffic, with motors running, extending a kilometer or more across the bridge over the
Rio Grande into Mexico. Fallout from leaded gasoline was intense, and made more so by the
Mexican vehicle fleet that was older and less well tuned than its US counterpart. Further, leaded
gasoline was available in Mexico for some period of years after its regulation in the US. Not

14
surprisingly, lead contamination of the soil in this area was high and thus we find high lead PM
concentrations due to re-entrainment [19]. High airborne lead levels at Station J seem at first
anomalous since this is a lower-population-density region. However, the sampling station lies a
few hundred meters between two older thoroughfares, Socorro Road and Alameda Avenue—
State Highway 20, the latter a main commercial route. The site is less than a kilometer from a
large open-air trap and skeet range, a potential source of airborne lead fallout. In addition,
westerly winds, unblocked by any topographic features, drive urban dust from Cd. Juarez into
this area, yielding consistently high PM readings. Site K bears similarities to site J. It is located
proximal to, and downwind of, the Mexican border, adjacent to Border Highway—Interstate
Highway. Lead levels are toward the middle range of those at our sites. Lower levels of lead
were recorded at the remaining stations. Sites A, D, I, and L are in residential areas of the city,
with no special soils with high levels of legacy lead available for re-entrainment. Sites D and L,
despite highways within a kilometer of each, exhibit particularly low levels of lead, consistent
with their peripheral locations relative to urban development and its associated vehicular traffic
during the bygone leaded-gasoline era.
3.4. Seasonal Trends
In general, the highest levels of airborne lead are associated with the winter season for
PMC and, to a lesser degree, for PMF. Colder weather in El Paso often is accompanied by
inversions that trap PM in a stagnant layer of air ranging from 200-500 m thickness above
ground surface [31]. The higher PM loadings in winter result in higher lead values as well.
Although strong winds occur throughout the year, spring is regarded as the windy season in El
Paso, with occasional dust storms. It also is dry, typically with less than a few cm of rainfall.
Inasmuch as re-entrained soil is locally the dominant source of airborne lead, it is reasonable that
15
we observe higher lead levels in spring than in summer due to the higher loading of PM in the
air. Rainfall in the summer monsoon helps clear PM from the air and decrease re-entrainment of
Pb-contaminated soil.
3.5. Public Health Implications
In terms of public health, effective annual exposure of the typical El Paso resident falls
well below regulatory levels of concern, as elaborated earlier in section 3.2.1. But a more careful
parsing of the data indicates that effective exposure actually is much lower because most or
virtually all of the lead is contained in the PMC. It is well established that PMC can penetrate into
the deep lung and settle in the bronchioles and alveoli. However, PMF is even more effective at
penetrating the alveolus in the gas exchange region of the lung and thus these are classified as
respirable particles. PMF also includes the sub-micron particles, and nanoparticles that are
capable of entering the bloodstream. Exposure to the same chemical form or compound of lead
in finer particles would be expected to result in greater transfer of lead to the exposed individual
due to: 1) longer pulmonary retention time of the more deeply respired fine particles; 2) more
intimate contact of those particles with tissue and cells of the lung; and 3) higher surface-area-to-
volume ratio of the finer particles, resulting in easier chemical reaction and elemental exchange
with tissue (release and transfer of Pb to tissue).

16
4. CONCLUSIONS
Levels of airborne lead in El Paso, Texas are well within the limits established by US
EPA standards. The lead is concentrated in the PMC fraction, consistent with the previously
established contemporary source of re-entrained soil. Soil contamination is a legacy of leaded
gas use, over a century of emissions from a lead smelter within 2 km of downtown, powdering
lead building paint, and other traditional commercial and industrial sources. Seasonally, lead
levels are highest in the fall—winter due to atmospheric trapping by diurnal temperature
inversions. Levels are lowest in summer, and intermediate during spring. The geospatial
distribution of airborne Pb across El Paso reveals highest levels in older areas where soil lead
levels are highest. Overall, airborne lead should not represent a significant health consequence to
most of El Paso’s populations. Further, concentration of the lead in the PMC fraction suggests a
lower bioavailabilty of inhaled lead than would occur if the same amount of lead were
concentrated in the PMF fraction, which would penetrate more deeply into the pulmonary system.
17
REFERENCES
[1] Settle, D.M., Patterson, C.C., “Lead in albacore: Guide to lead pollution in Americans,”
Science, 207 (4436). 1167-1176, 1980.
[2] National Research Council, Lead in the Human Environment. Washington, D.C.: National
Academy Press, 1980.
[3] Needleman HL, editor. Human Lead Exposure. Boca Raton, FL: CRC Press; 1992.
[4] Bryce-Smith, D., Waldron, H.A., Landrigan, P.J., Whitworth, R.H., Baloh, R.W., Lansdown,
R.G., Clayton, B.E., Graham, P.J., Delves, H.T., “Blood-lead levels, behavior, and intelligence,”
The Lancet, 303(7867). 1166-1168, 1974.
[5] Davidson, C.I., Rabinowitz, M., “Lead in the environment: From sources to human
receptors,” Human Lead Exposure, H.L. Needleman HL, ed., pp. 65-86, Boca Raton: CRC,
1992.
[6] Annest, J., Dirkle, J., Makuc, C., Nesse, J., Bayse, D., et al., “Chronological trend in blood
lead levels between 1976 and 1980,” New England Journal Medicine, 308. 1373-1377, 1983.
[7] Needleman, H.L., Leviton, A., Bellinger, D., “Lead-associated intellectual deficits,” New
England Journal Medicine, 306. 367-368, 2002.
[8] ATSDR (Agency for Toxic Substances Disease Registry) “The Nature and Extent of Lead
Poisoning in Children in the United States: A Report to Congress,” Atlanta: US Department of
Health and Human Services, Public Health Service, ATSDR, 1998.
[9] Bellinger, D.C., Needleman, H.L., Leviton, A., Waternaux, C., Rabinowitz, M.B,, Nichols,
M.L., “Early sensory-motor development and prenatal exposure to lead,” Neurobehavioral
Toxicology and Teratology, 6. 387-402, 1984.
[10] CDC (Centers for Disease Control. “Lead,”
https://www.cdc.gov/nceh/lead/. [Accessed on 6/24/2017].
[11] Amaya, M.A., Jolly, K.W., Pingitore, N.E., “Blood lead in the 21st Century: The sub-
microgram challenge,” Journal Blood Medicine, 1. 71-78, 2010.
[12] US Environmental Protection Agency 2010 Lead (Pb) Air Monitoring Requirements &
2013 Method for Determination of Lead (Pb) in Total Suspended Particulate Matter Fact Sheets
US Environmental Protection Agency (2008b) Fact Sheet - Final Revisions to the National
Ambient Air Quality Standards for Lead. US Environmental Protection Agency2008bFact Sheet
- Final Revisions to the National Ambient Air Quality Standards for Lead. Available:
https://www.epa.gov/lead-air-pollution/2010-lead-pb-air-monitoring-requirements-2013-method-
determination-lead-pb-total. [Accessed on 5/31/2017].
[13] US Environmental Protection Agency National Ambient Air Quality Standards (NAAQS)
for Lead (Pb) Fact Sheets and Additional Information. Available: https://www.epa.gov/lead-air-
pollution/national-ambient-air-quality-standards-naaqs-lead-pb-fact-sheets-and-additional.
[Accessed on 5/31/2017].
[14] Landrigan, P.J., Gehlbach, S.H., Rosenblum, B.F., Shoults, J.M., Candelaria, R.M., Barthel,
W.F., Liddle, J.A., Smerk, A.L., Staehling, N.W., Sanders, J-D., “Epidemic lead absorption near
an ore smelter – The role of particulate lead,” New England Journal of Medicine, 292(3). 123-
129, 1975.
[15] Perales, M., Smeltertown: Making and Remembering a Southwest Border Community,
University of North Carolina Press, Chapel Hill, 2010.

18
[16] Sullivan, M., Tainted Earth: Smelters, Public Health, and the Environment, Rutgers
University Press, New Brunswick (NJ), 2014.
[17] Camacho Araujo, I.B., Airborne Lead in El Paso, Texas, 1977-1999, M.S. Thesis, The
University of Texas at El Paso, 2011.
[18] Barnes, B.B., Pingitore, N.E., Mackay, W., “Levels of Toxic Metals in El Paso Soils
proximal to Three Potential Industrial Point Sources,” The U.S. Mexican Border Environment:
Integrated Approach to Defining Particulate Matter Issues in the Paso del Norte Region, SCERP
Monograph Series, no. 12, R.M. Currey, K.E. Kelley, H.L.C. Meuzelaar, and A.F. Serafim, eds.,
Chapter V, Section 4, 152-161, 2005.
[19] Elkekli, A.R., Lead and Associated Heavy Metal Distribution, El Paso, Texas, Ph.D.
Dissertation, The University of Texas at El Paso, 2013.
[20] Pingitore Jr, N.E., Clague, J., Amaya, M.A., Maciejewska, B., Reynoso, J.J., “Urban
Airborne Lead: X-ray Absorption Spectroscopy Establishes Soil as Dominant Source,” Public
Library of Science One (PLoS One), 4(4). e5019, 2009.
http://www.plosone.org/article/info:doi/10.1371/journal.pone.0005019.
[21] https://en.wikipedia.org/wiki/El_Paso,_Texas. [Accessed on 6/-01/2017].
[22] https://www.tceq.texas.gov/airquality/airmod/data/site. [Accessed on 6/01/2017].
[23] EPA Method IO-2.2, Sampling of Ambient Air for PM10 Using an Andersen Dichotomous
Sampler, In Compendium of Methods for the Determination of Inorganic Compounds in
Ambient Air, EPA/625/R-96/010a, Environmental Protection Development, June 1999.
[24] Li, W-W., Orquiz, R., Pingitore Jr., N.E., Garcia, J.H., Espino, T.T., Gardea-Torresdey, J.,
Chow, J., Watson, J.W., “Analysis of temporal and spatial dichotomous PM air samples in the El
Paso-Cd. Juarez air quality basin,” Journal of Air and Waste Management Association, 51, 1511-
1560, 2001.
[25] EPA Method IO-3.3 Determination of Metals in Ambient Particulate Matter Using X-Ray
Fluorescence (XRF) Spectroscopy, In Compendium of Methods for the Determination of
Inorganic Compounds in Ambient Air, EPA/625/R-96/010a, Environmental Protection
Development, June 1999.
[26] https://www-s.nist.gov/srmors/browseMaterials.cfm?subkey=5&tableid=54. [Accessed on
6/01/2017].
[27] http://www.micromatter.com/xrf.php. [Accessed on 6/01/2017].
[28] South Coast Air Quality Management District (California, USA), http://www.aqmd.gov/.
[Accessed on 7/17/2017].
[29] US EPA, Air Data: Air Quality Data Collected at Outdoor Monitors Across the US,
https://www.epa.gov/outdoor-air-quality-data. [Accessed on 7/17/2017].
[30] Olvera, H.A., Garcia, M., Li, W-W., Yang, H., Amaya, M.A., Myers, O., Burchiel, S.W.,
Berwick, M., Pingitore, Jr., N.E., “Principal Component Analysis Optimization of a PM2.5 Land
Use Regression Model with Small Monitoring Network,” Science of the Total Environment, 425.
27-34, 2012.
[31] Webb, W.L., Mesometeorology at El Paso, Texas Western Press, The University of Texas at
El Paso, 1971, pp. 33-36.

19
CURRICULUM VITA
Lisa Marie Paz studied Geological Sciences at Boise State University, where she
participated in research under Dr. Mark Schmitz. She continued her studies at the University of
Texas at El Paso, where she earned her B.S. in Geological Sciences. Her undergraduate research,
Evolution of Melt in Southern New Mexico, was conducted under the guidance of Dr. Jasper
Konter. Currently, Mrs. Paz is a graduate student at the University of Texas at El Paso, where
she has participated in research and worked as a teaching assistant, teaching the lab component
of Introductory Geology. Mrs. Paz’s most recent work: Airborne Lead in El Paso, Texas, USA,
was published in 2017 in the Journal of Atmospheric Science, under the guidance of Dr.
Nicholas Pingitore.
Apart from her graduate work, Lisa Paz has earned her teaching license and works, full-
time, as an 8th
grade science teacher in El Paso, Texas. In her capacity as a science teacher, Mrs.
Paz has also earned her STEM certification in order to bolster classroom rigor in areas of
science, technology, engineering and mathematics.
Contact Information: [email protected]

20
Typist: Lisa Marie Paz