Agricultural Outlook Forum 2013 Managing Risk in … · Agricultural Outlook Forum 2013 Managing...
23
Agricultural Outlook Forum 2013 Managing Risk in the 21 st Century February 22, 2013 Session: Risk Management for Small & Socially Disadvantaged Farmers “Stand Up and Be Counted: Profile of Small and Socially Disadvantaged Farmers and Ranchers” Hubert Hamer, Chairman, Agricultural Statistics Board USDA, National Agricultural Statistics Service 1
Transcript of Agricultural Outlook Forum 2013 Managing Risk in … · Agricultural Outlook Forum 2013 Managing...
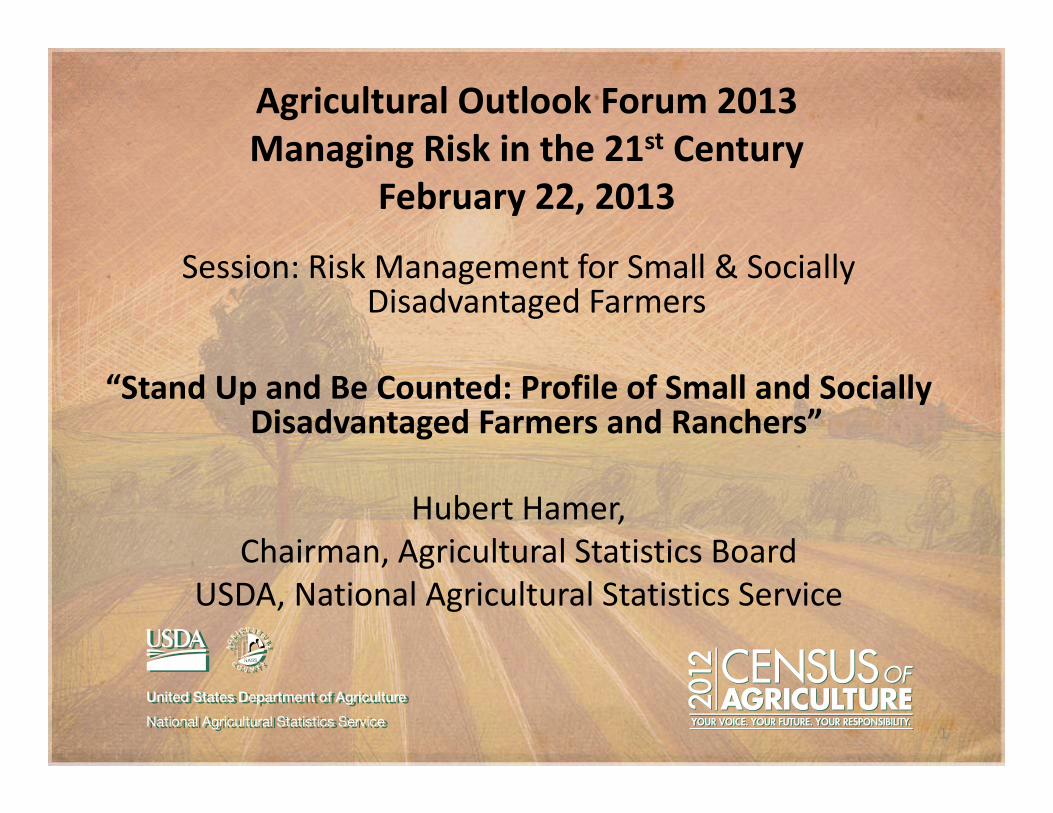
Agricultural Outlook Forum 2013 Managing Risk in the 21st Century
February 22, 2013
Session: Risk Management for Small & Socially Disadvantaged Farmers
“Stand Up and Be Counted: Profile of Small and Socially Disadvantaged Farmers and Ranchers”
Hubert Hamer, Chairman, Agricultural Statistics Board
USDA, National Agricultural Statistics Service
1
Census of Agriculture
• Census is conducted every 5 years• Mailed 3.0 million forms in December• NASS is in the middle of data collection until late Spring
• New data will be published in 2014; therefore, 2007 data is used in this presentation and compared with 2002 Census data
USDA Farm Definition
Any place from which $1,000 of agricultural products were produced and sold, or normally would have been sold, during the census year. Government payments are included.
U.S. Farm Numbers 2007 Census of Agriculture
• 2,204,792 farms & ranches
• 4 percent more than 2002
(2,128,982)
U.S. Farm Operators
• 3,337,450 operators on farms– An operator is a person making some day to day decisions for the operation
• Principal operators‐ number is equal to the number of farms (2,204,792)
• Census collects detailed characteristics for up to 3 operators per farm (including ethnicity)
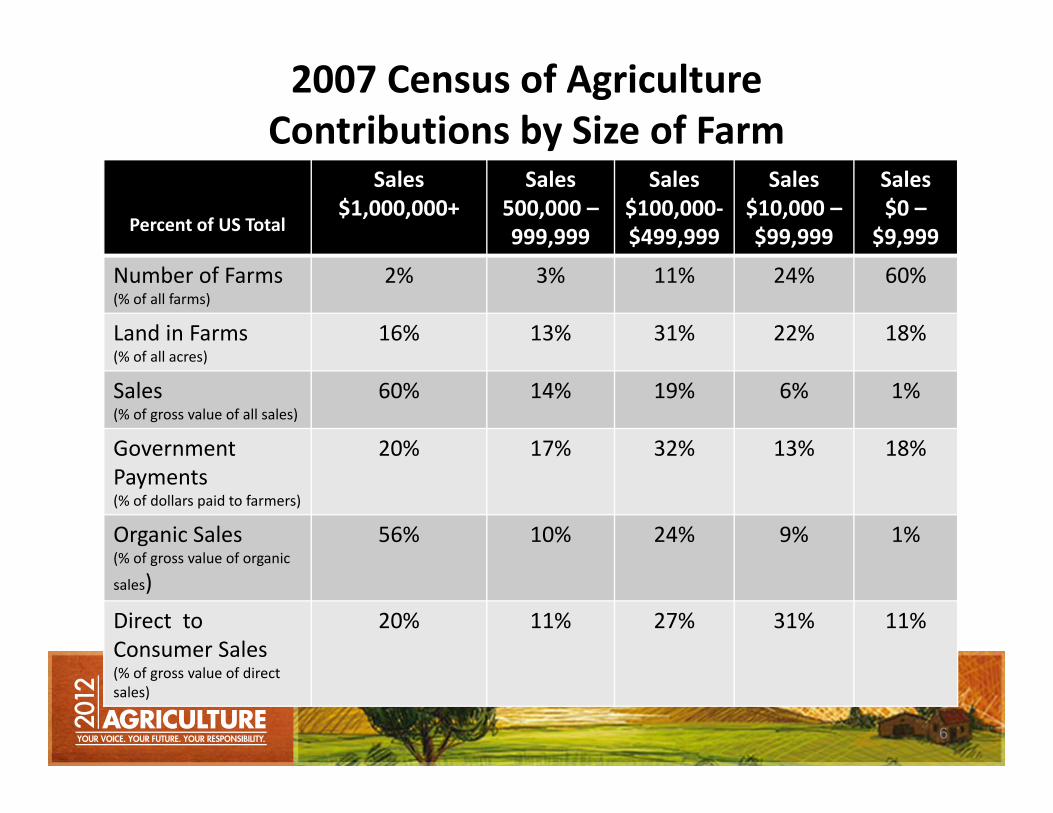
2007 Census of AgricultureContributions by Size of Farm
6
Percent of US Total
Sales$1,000,000+
Sales500,000 –999,999
Sales$100,000‐$499,999
Sales$10,000 –$99,999
Sales$0 –
$9,999
Number of Farms(% of all farms)
2% 3% 11% 24% 60%
Land in Farms(% of all acres)
16% 13% 31% 22% 18%
Sales(% of gross value of all sales)
60% 14% 19% 6% 1%
Government Payments(% of dollars paid to farmers)
20% 17% 32% 13% 18%
Organic Sales(% of gross value of organic
sales)
56% 10% 24% 9% 1%
Direct to Consumer Sales(% of gross value of direct sales)
20% 11% 27% 31% 11%
Definition of a Beginning Farmer or Rancher
7
USDA definition, used for program administration
Operator has not operated a farm or ranch, or
operator has operated a farm or ranch for not more
than 10 consecutive years
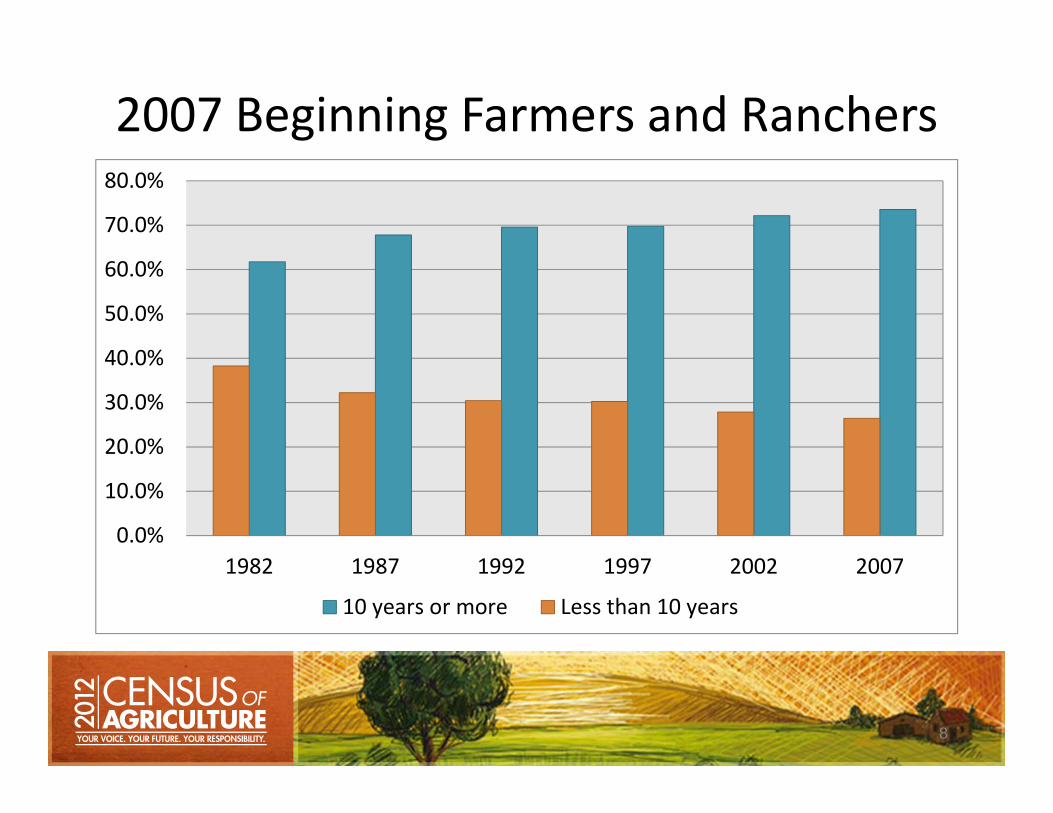
2007 Beginning Farmers and Ranchers
8
0.0%
10.0%
20.0%
30.0%
40.0%
50.0%
60.0%
70.0%
80.0%
200720021997199219871982
10 years or more Less than 10 years
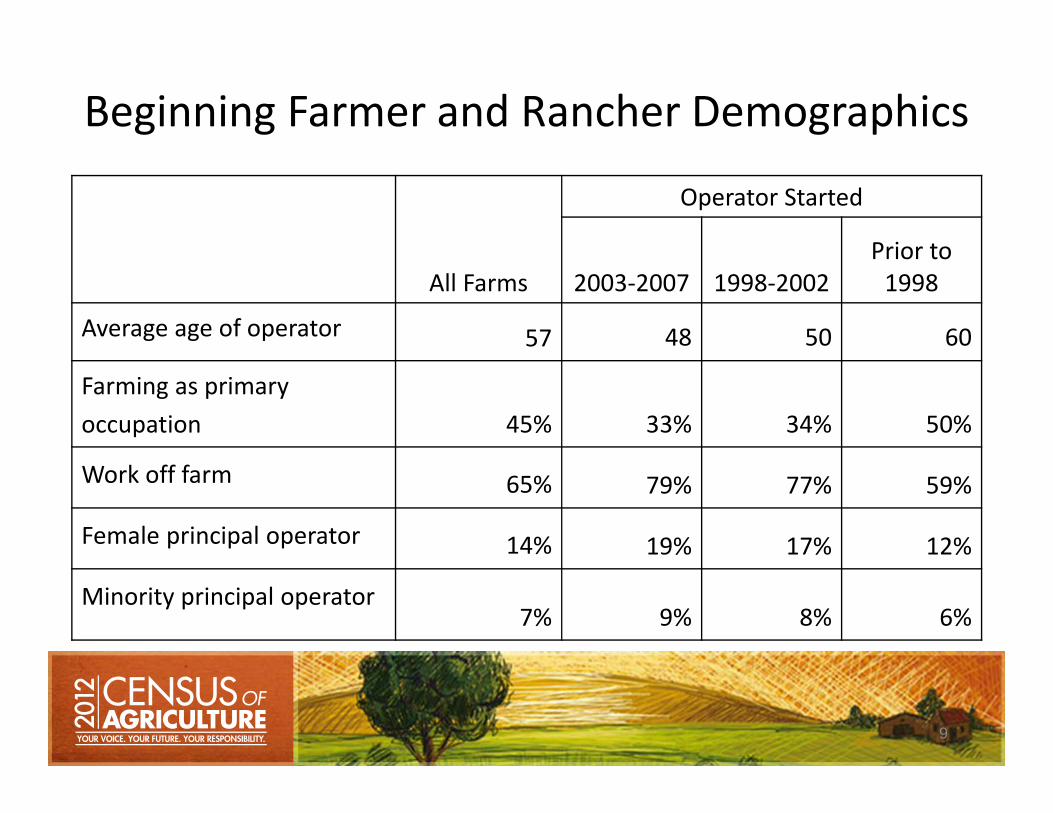
Beginning Farmer and Rancher Demographics
9
All Farms
Operator Started
2003‐2007 1998‐2002Prior to 1998
Average age of operator 57 48 50 60
Farming as primary occupation 45% 33% 34% 50%
Work off farm 65% 79% 77% 59%
Female principal operator 14% 19% 17% 12%
Minority principal operator7% 9% 8% 6%
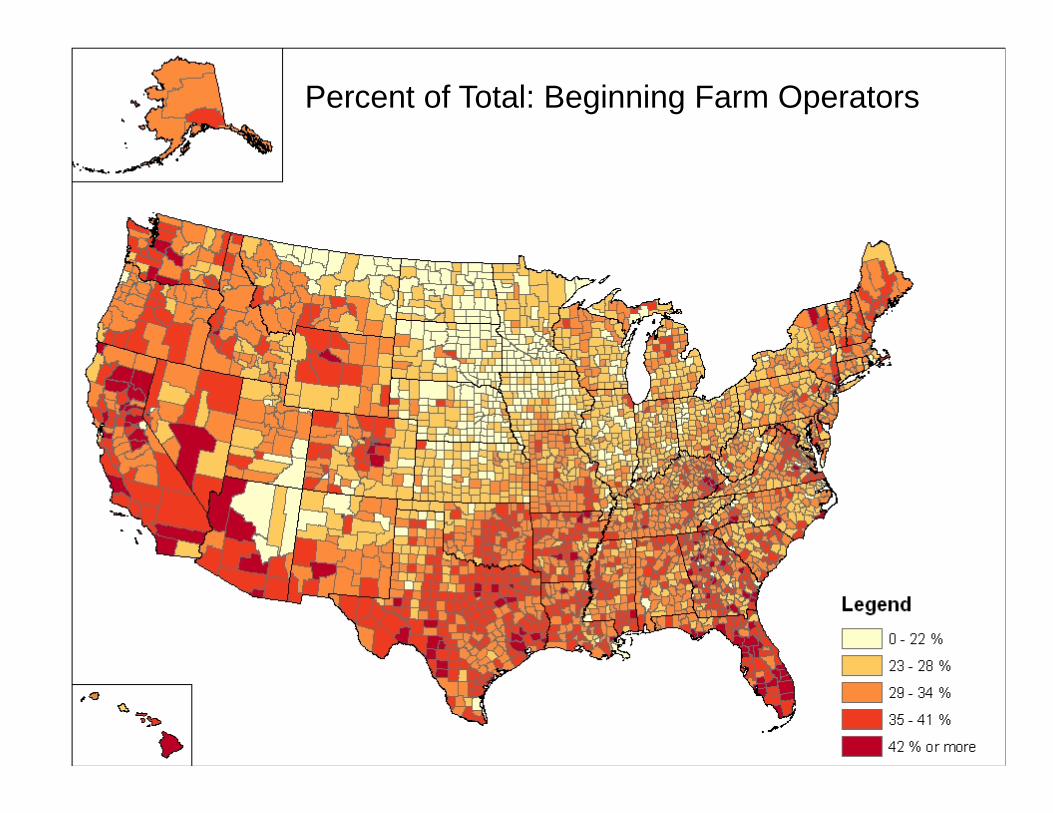
Percent of Total: Beginning Farm Operators
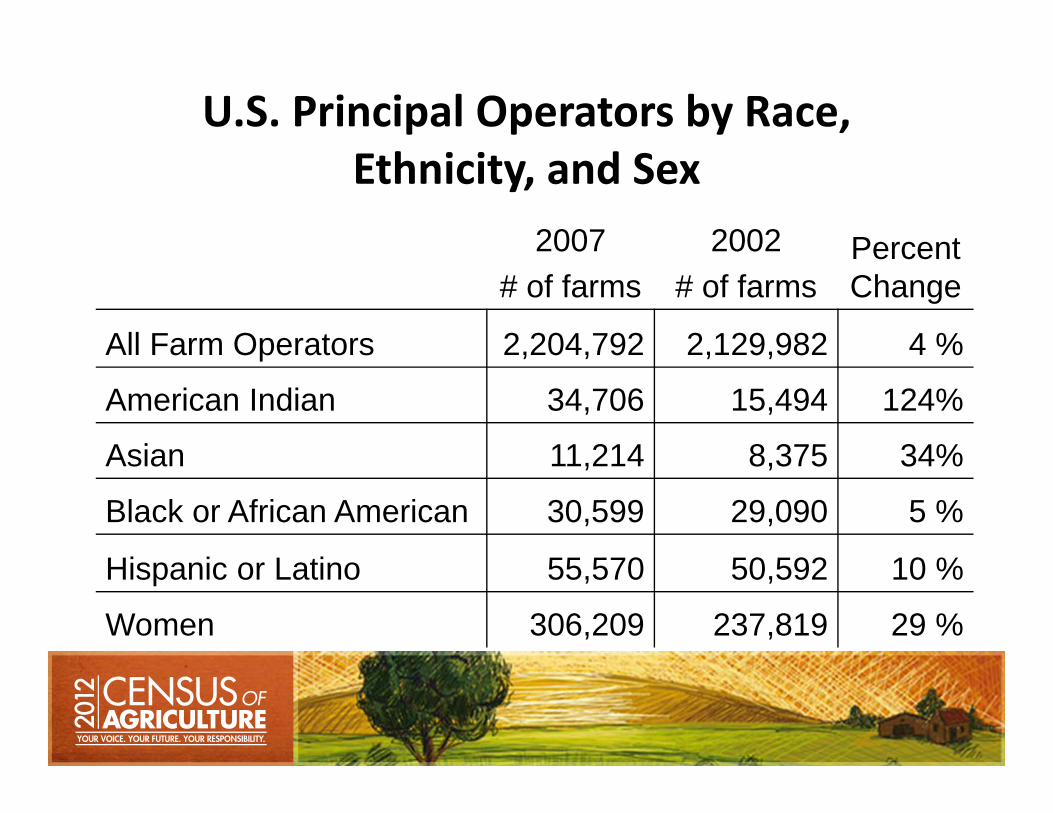
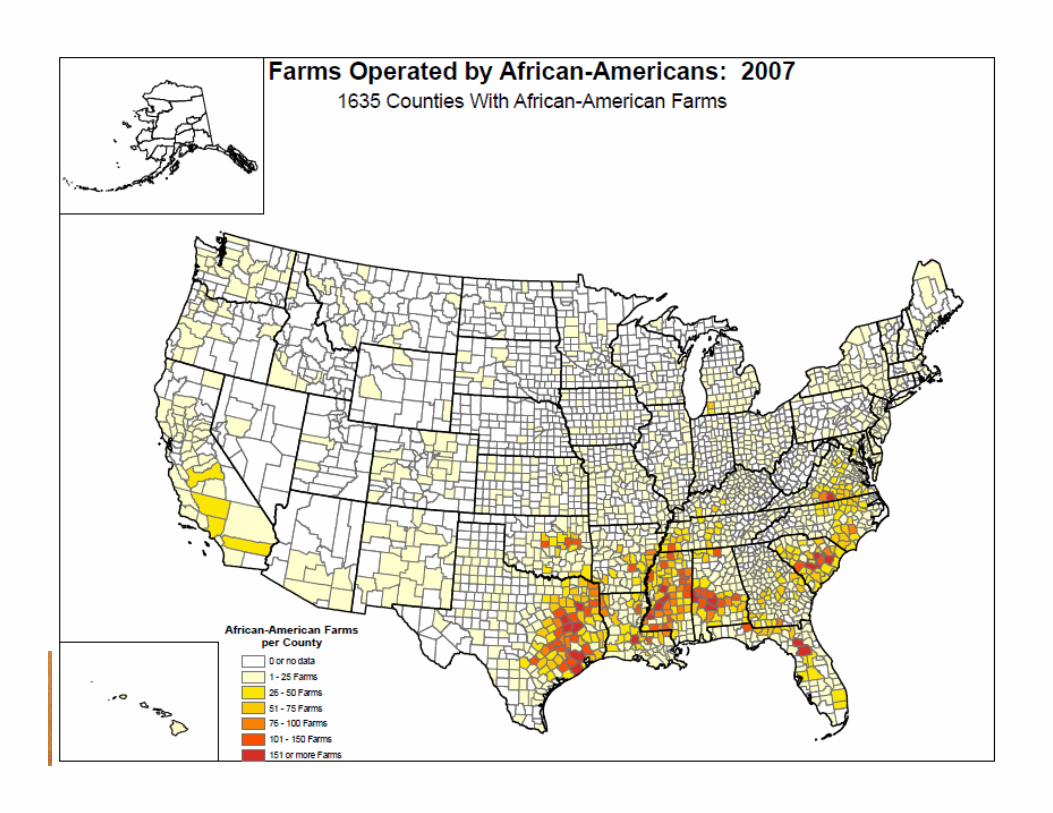
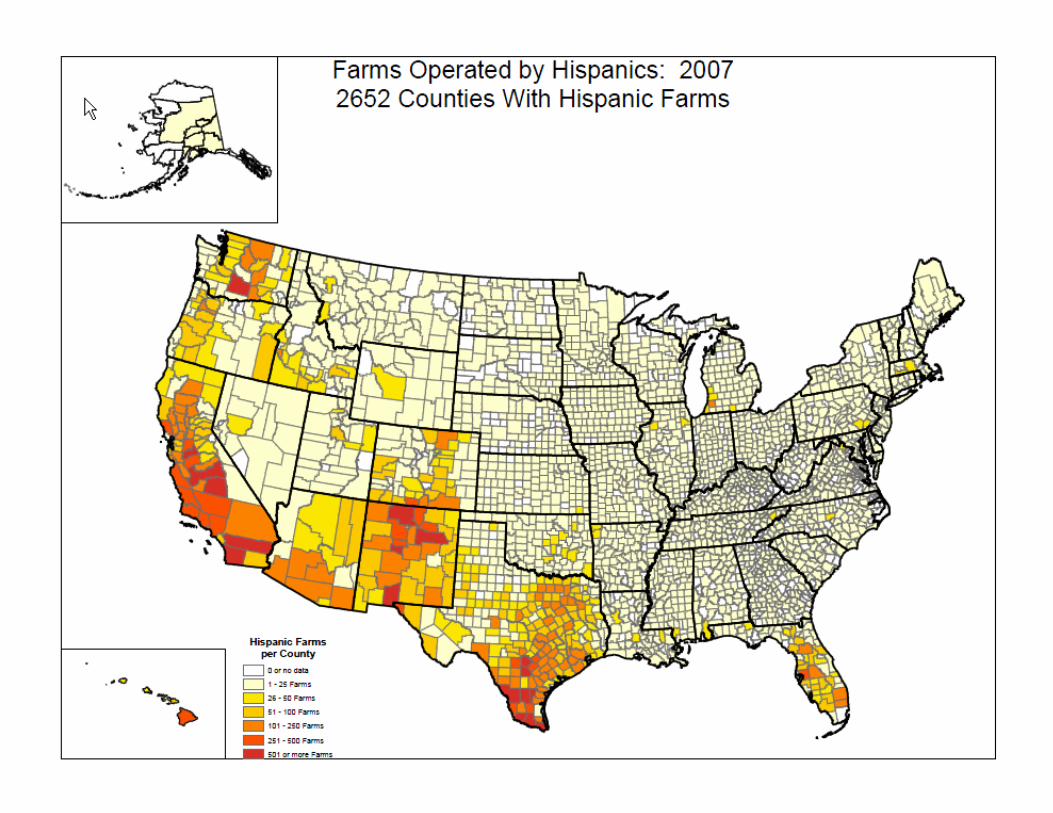
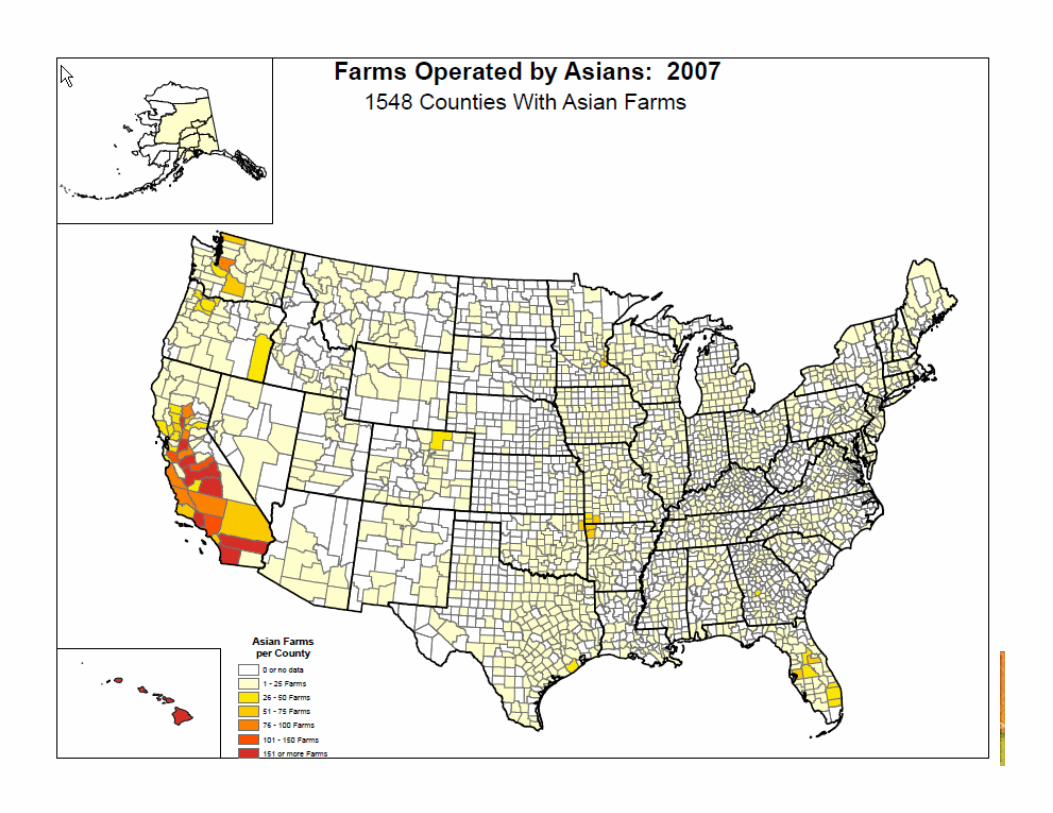
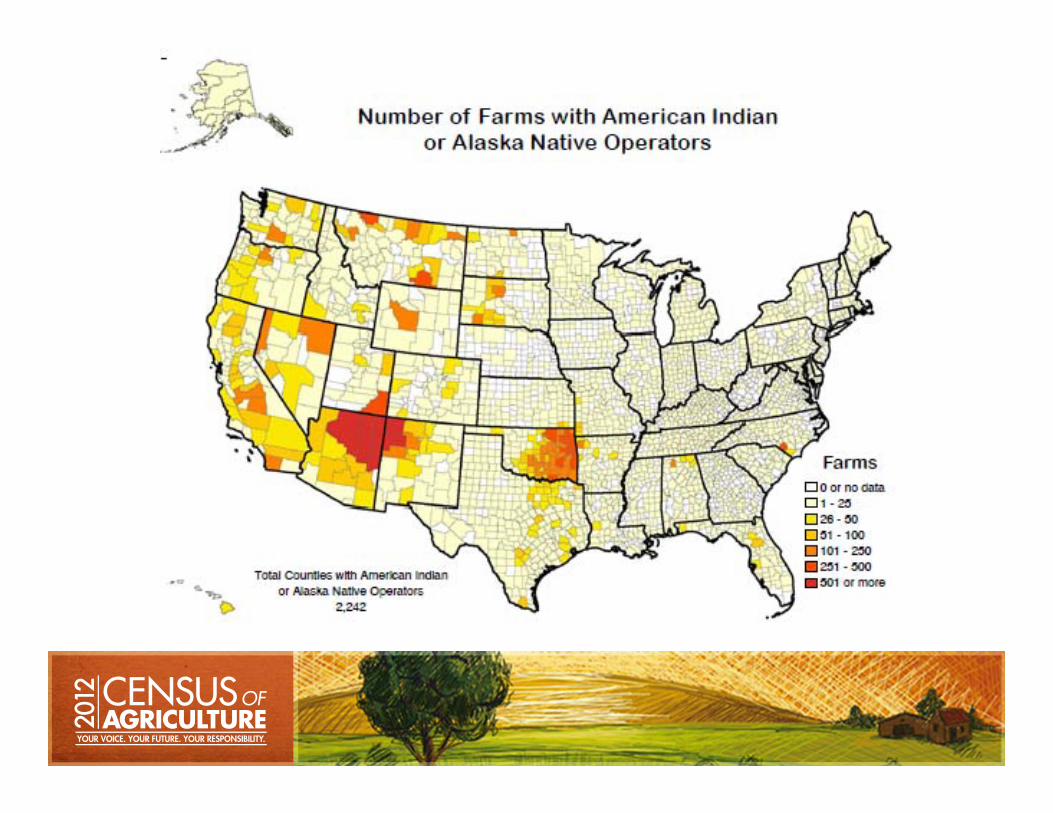
U.S. Principal Operators by Race, Ethnicity, and Sex
2007 # of farms
2002 # of farms
Percent Change
All Farm Operators 2,204,792 2,129,982 4 %
American Indian 34,706 15,494 124%
Asian 11,214 8,375 34%
Black or African American 30,599 29,090 5 %
Hispanic or Latino 55,570 50,592 10 %
Women 306,209 237,819 29 %
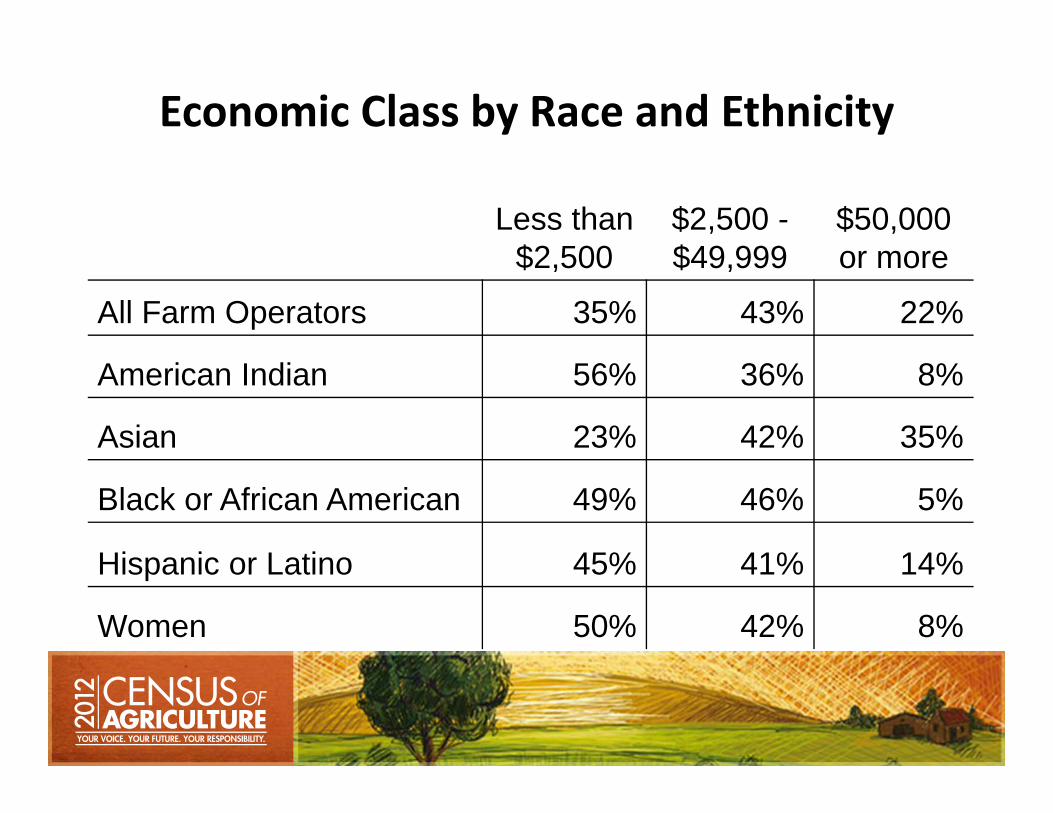
Economic Class by Race and Ethnicity
Less than $2,500
$2,500 -$49,999
$50,000 or more
All Farm Operators 35% 43% 22%
American Indian 56% 36% 8%
Asian 23% 42% 35%
Black or African American 49% 46% 5%
Hispanic or Latino 45% 41% 14%
Women 50% 42% 8%
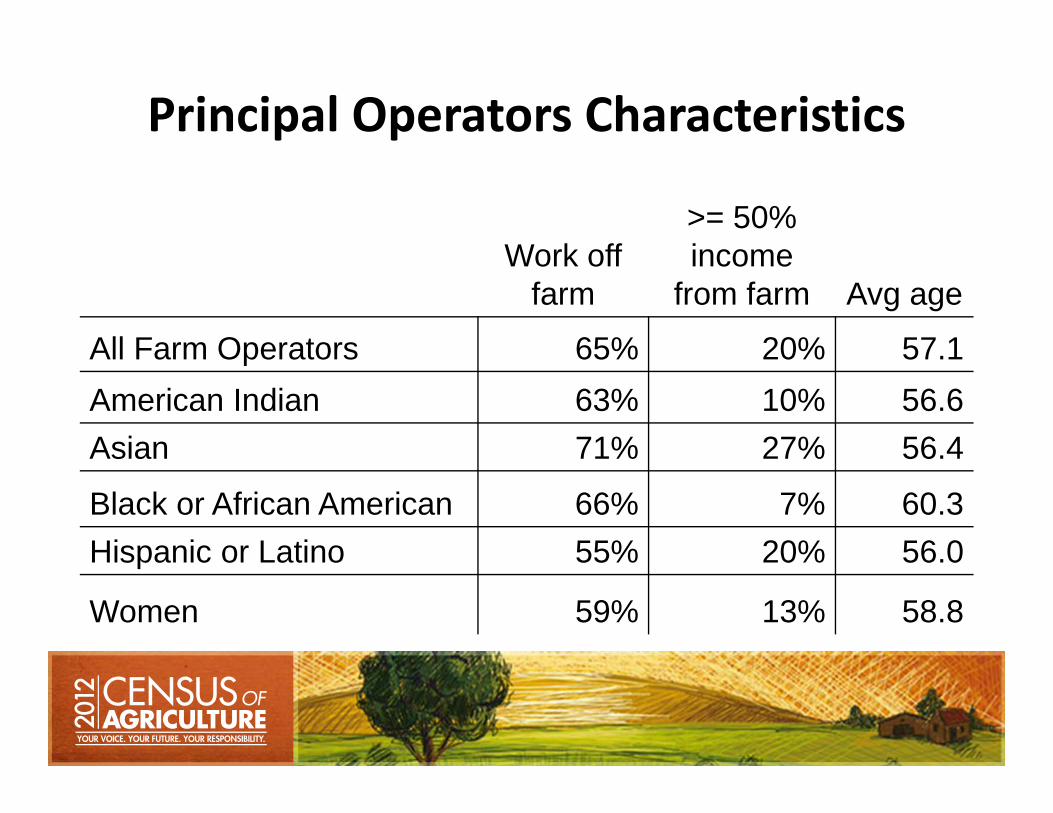
Principal Operators Characteristics
Work off farm
>= 50% income
from farm Avg age
All Farm Operators 65% 20% 57.1American Indian 63% 10% 56.6Asian 71% 27% 56.4
Black or African American 66% 7% 60.3Hispanic or Latino 55% 20% 56.0
Women 59% 13% 58.8
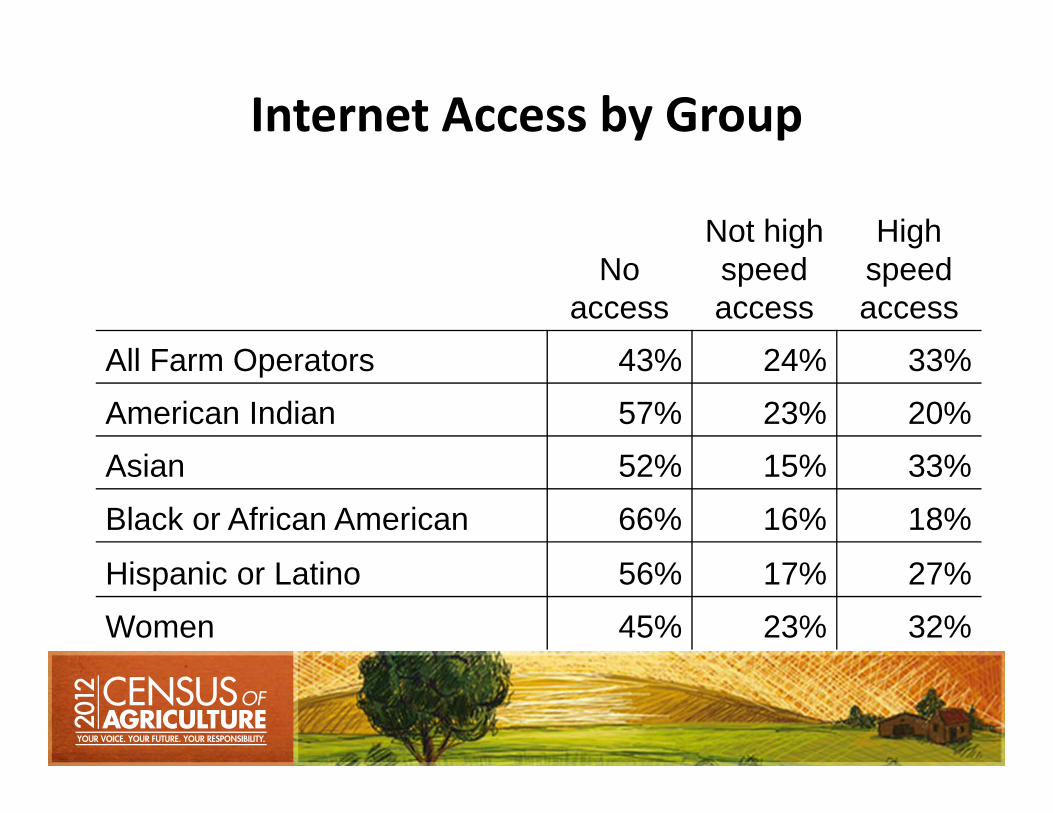
Internet Access by Group
No access
Not high speed access
High speed access
All Farm Operators 43% 24% 33%American Indian 57% 23% 20%Asian 52% 15% 33%
Black or African American 66% 16% 18%
Hispanic or Latino 56% 17% 27%Women 45% 23% 32%
Outreach Efforts• After the 2002 and continuing with the 2007 Census of Agriculture, NASS realized the coverage of minority and women farm operators was lower than for all operators
• NASS committed to more aggressive list building procedures such as working with Community‐based Organizations (CBOs) to better count all operators
Outreach Efforts
• NASS partnered with CBOs to provide hands‐on assistance and support to producers in filling out census forms
• NASS targeted media advertisements to improve census response rates
DID YOU KNOW that Ag Census Data are available by . . . .
Congressional District ?
Watershed?
Zip Code?
2012 Census Update
Total Receipts – 2/22/13
1,632,993– 56%
Follow-up Mailings:
February 14-27