OECD-FAO Agricultural Outlook...
73
OECD-FAO Agricultural Outlook 2008-2017 HIGHLIGHTS ORGANISATION FOR ECONOMIC CO-OPERATION AND DEVELOPMENT • The Outlook in Brief • Chapter 1. Overview • Chapter 2. Are High Prices here to Stay? • Annex A. Statistical Tables FOOD AND AGRICULTURE ORGANIZATION OF THE UNITED NATIONS
Transcript of OECD-FAO Agricultural Outlook...
OECD-FAOAgricultural Outlook
2008-2017
HIGHLIGHTS
ORGANISATION FOR ECONOMIC CO-OPERATION AND DEVELOPMENT
• The Outlook in Brief
• Chapter 1. Overview
• Chapter 2. Are High Prices here to Stay?
• Annex A. Statistical Tables
FOOD AND AGRICULTURE ORGANIZATIONOF THE UNITED NATIONS
Phase2.book Page 1 Monday, May 26, 2008 4:48 PM
ORGANISATION FOR ECONOMIC CO-OPERATION AND DEVELOPMENT
The OECD is a unique forum where the governments of 30 democracies work together to
address the economic, social and environmental challenges of globalisation. The OECD is also at
the forefront of efforts to understand and to help governments respond to new developments and
concerns, such as corporate governance, the information economy and the challenges of an
ageing population. The Organisation provides a setting where governments can compare policy
experiences, seek answers to common problems, identify good practice and work to co-ordinate
domestic and international policies.
The OECD member countries are: Australia, Austria, Belgium, Canada, the Czech Republic,
Denmark, Finland, France, Germany, Greece, Hungary, Iceland, Ireland, Italy, Japan, Korea,
Luxembourg, Mexico, the Netherlands, New Zealand, Norway, Poland, Portugal, the Slovak Republic,
Spain, Sweden, Switzerland, Turkey, the United Kingdom and the United States. The Commission of
the European Communities takes part in the work of the OECD.
OECD Publishing disseminates widely the results of the Organisation’s statistics gathering and
research on economic, social and environmental issues, as well as the conventions, guidelines and
standards agreed by its members.
Also available in French under the title:
Perspectives agricoles de l’OCDE et de la FAO 2008-2017
Corrigenda to OECD publications may be found on line at: www.oecd.org/publishing/corrigenda.
© OECD/FAO 2008
OECD freely authorises the use, including the photocopy, of this material for private, non-commercial purposes. Permission to photocopy portions
of this material for any public use or commercial purpose may be obtained from the Copyright Clearance Center (CCC) at [email protected] or the
Centre français d'exploitation du droit de copie (CFC) [email protected]. All copies must retain the copyright and other proprietary notices in their
original forms. All requests for other public or commercial uses of this material or for translation rights should be submitted to [email protected].
This work is published under the responsibilities of the Secretary-General of the OECD
and the Director General of FAO. The views expressed and conclusions reached in this reportdo not necessarily correspond to those of the governments of OECD member countries, orthe governments of the FAO member countries. The designations employed and the
presentation of material in this information product do not imply the expression of anyopinion whatsoever on the part of the Food and Agriculture Organization of the UnitedNations concerning the legal or development status of any country, territory, city or area or
of its authorities, or concerning the delimitation of its frontiers or boundaries.
FOREWORD
OECD-FAO AGRICULTURAL OUTLOOK 2008-2017 – © OECD/FAO 2008 3
Foreword
This is the fourth time that the Agricultural Outlook report has been prepared jointly by the
Organisation for Economic Co-operation and Development (OECD) and the Food and Agriculture
Organization (FAO) of the United Nations. The report draws on the commodity, policy and country
expertise of both Organisations in providing a longer-term assessment of future prospects in the
major world agricultural commodity markets.
The report is published annually, as part of a continuing effort to promote informed discussion
of emerging market and policy issues. This edition of the Agricultural Outlook offers an assessment
of agricultural markets covering cereals, oilseeds, sugar, meats, milk and dairy products over the
period 2008 to 2017. For the first time, it also includes an analysis of and projections for global
biofuel markets for bioethanol and biodiesel, facilitating the discussion of interactions between these
markets and those for the main agricultural feedstocks used in their production. The market
assessments for all the commodities are based on a set of projections that are conditional on specific
assumptions regarding macroeconomic factors, agricultural and trade policies and production
technologies; they also assume average weather conditions and longer-term productivity trends.
Using the underlying assumptions, the Agricultural Outlook presents a plausible scenario for the
evolution of agricultural markets over the next decade and provides a benchmark for the analysis of
agricultural market outcomes that would result from alternative economic or policy assumptions.
This year’s Outlook is set against a backdrop of exceptional increases in prices for many
agricultural commodities, and this has posed a considerable challenge in preparing the projections
and assessing the “durability” of the various influences shaping these prices. That is, which of the
factors that are driving up prices are temporary and which will prove to be more permanent
influences? How will they individually and collectively affect price levels, price trends and price
volatility in the future? How will markets react to currently high prices and a more uncertain price
outlook? What are the appropriate policy responses? This report comes at a very timely moment and
provides important information, with a view to enlightening the discussion on food-price increases,
their causes and their likely consequences for agricultural markets as well as for the policy-
formulation process.
The projections and assessments provided in this report are the result of close co-operation
between the OECD and the FAO Secretariats and national experts in member and some non-member
countries, and thus reflect the combined knowledge and expertise of this wide group of participants.
A jointly developed modelling system, based on the OECD’s Aglink and FAO’s Cosimo models,
facilitated the assurance of consistency in the projections. The fully documented Outlook database,
including historical data and projections, is available through the OECD-FAO joint Internet site
www.agri-outlook.org. Within the OECD, this publication is prepared by the Trade and Agriculture
Directorate, while at FAO, the Trade and Markets Division was responsible for the report.
Phase2.book Page 3 Monday, May 26, 2008 4:48 PM

FOREWORD
OECD-FAO AGRICULTURAL OUTLOOK 2008-2017 – © OECD/FAO 20084
Acknowledgements. This Agricultural Outlook was prepared by the following staffmembers of the OECD and FAO Secretariats:
At the OECD, the team of economic and market analysts of the OECD Trade and AgricultureDirectorate that contributed to this report consisted of Loek BOONEKAMP (team leader),Marcel ADENAUER, Céline GINER, Alexis FOURNIER, Franziska JUNKER, Garry SMITH,Pavel VAVRA (outlook co-ordinator) and Martin VON LAMPE.
Research and statistical assistance were provided by Armelle ELASRI, Alexis FOURNIER,Claude NENERT and Nicolas RUIZ. Secretarial services and co-ordination in reportpreparation was provided by Christine CAMERON, Nina DHUMAL, Anita LARI and StéfanieMILOWSKI. Technical assistance in the preparation of the Outlook database was providedby Frano ILICIC. Many other colleagues in the OECD Secretariat and member countrydelegations furnished useful comments on earlier drafts of the report. The contribution of JoeDEWBRE in reviewing and editing Chapter 2 of this report and Linda FULPONI in draftingBox 2.1 in that chapter is particularly acknowledged.
At FAO, the team of economists and commodity officers from the Commodities and TradeDivis ion contr ibuting to this edi t ion consisted of Abdolreza ABBASSIAN,El Mamoun AMROUK Concepcion CALPE, Kaison CHANG, Merritt CLUFF (team leader),P iero CONFORTI , Cheng FANG, Holger MATTHEY (base l ine co-ord inator) ,Adam PRAKASH, Grégoire TALLARD, Peter THOENES, Koji YANAGISHIMA, andCarola FABI from the Statistics Division. AliArslan GURKAN and Alexander SARRISinitiated support for FAO’s Cosimo modelling project.
Research assistance and database preparation was provided by Claudio CERQUILINI,Berardina FORZINETTI, John HEINE, Marco MILO, and Barbara SENFTER. Secretarialservices were provided by Rita ASHTON.
Chapter 2 of this report was drafted by Wyatt THOMPSON (University of Missouri) elaboratingon and analysing input from the OECD and FAO Secretariats, Pierre CHARLEBOIS(Agriculture and Agrifood Canada), Frank ROSE (Lewis University, formerly CBOT) and PatWesthoff (University of Missouri).
Finally, the assistance of the Executive Director of the International Sugar Organisation,Peter Baron and his staff in reviewing the sugar projections is gratefully acknowledged.
Phase2.book Page 4 Monday, May 26, 2008 4:48 PM
TABLE OF CONTENTS
OECD-FAO AGRICULTURAL OUTLOOK 2008-2017 – © OECD/FAO 2008 5
Table of contentsTable of contents
Acronyms and abbreviations . . . . . . . . . . . . . . . . . . . . . . . . . . . . . . . . . . . . . . . . . . . . . . . . . 7
The Outlook in Brief . . . . . . . . . . . . . . . . . . . . . . . . . . . . . . . . . . . . . . . . . . . . . . . . . . . . . . . . . 11
Chapter 1. Overview . . . . . . . . . . . . . . . . . . . . . . . . . . . . . . . . . . . . . . . . . . . . . . . . . . . . . . . . . . 13
The principal underlying assumptions. . . . . . . . . . . . . . . . . . . . . . . . . . . . . . . . . . . . . . 15Main trends in commodity markets . . . . . . . . . . . . . . . . . . . . . . . . . . . . . . . . . . . . . . . . 17
Main developments in trade in agricultural commodities . . . . . . . . . . . . . . . . . . . . . 23The outlook for world prices . . . . . . . . . . . . . . . . . . . . . . . . . . . . . . . . . . . . . . . . . . . . . . 25
Some major issues and uncertainties. . . . . . . . . . . . . . . . . . . . . . . . . . . . . . . . . . . . . . . 27The policy issues . . . . . . . . . . . . . . . . . . . . . . . . . . . . . . . . . . . . . . . . . . . . . . . . . . . . . . . . 28
What are appropriate policy responses? . . . . . . . . . . . . . . . . . . . . . . . . . . . . . . . . . . . . 29
Chapter 2. Are High Prices here to Stay? . . . . . . . . . . . . . . . . . . . . . . . . . . . . . . . . . . . . . . . . 31
Introduction . . . . . . . . . . . . . . . . . . . . . . . . . . . . . . . . . . . . . . . . . . . . . . . . . . . . . . . . . . . . 32Recent food commodity price hikes in an historical context . . . . . . . . . . . . . . . . . . . 38
Crop and vegetable oil price changes: what happened and what happens next? . . 39Uncertainties . . . . . . . . . . . . . . . . . . . . . . . . . . . . . . . . . . . . . . . . . . . . . . . . . . . . . . . . . . . 48
How important are the Outlook assumptions in determining future prices? . . . . . 49The bottom line . . . . . . . . . . . . . . . . . . . . . . . . . . . . . . . . . . . . . . . . . . . . . . . . . . . . . . . . . 53
Notes . . . . . . . . . . . . . . . . . . . . . . . . . . . . . . . . . . . . . . . . . . . . . . . . . . . . . . . . . . . . . . . . . . 54
Annex A. Statistical Tables . . . . . . . . . . . . . . . . . . . . . . . . . . . . . . . . . . . . . . . . . . . . . . . . . . . . 55
Boxes2.1. Measuring the impact of rising commodity prices on food prices . . . . . . . . . . . 33
2.2. Prices in cash and derivative markets . . . . . . . . . . . . . . . . . . . . . . . . . . . . . . . . . . . 372.3. How income growth affects commodity demand . . . . . . . . . . . . . . . . . . . . . . . . . 46
Tables1.1. Some decline in population growth . . . . . . . . . . . . . . . . . . . . . . . . . . . . . . . . . . . . . 15
2.1. Food price contribution to consumer price inflation (selected countries) . . . . . 362.2. Supply of wheat and coarse grains. . . . . . . . . . . . . . . . . . . . . . . . . . . . . . . . . . . . . . 39
2.3. Demand for wheat and coarse grains . . . . . . . . . . . . . . . . . . . . . . . . . . . . . . . . . . . 412.4. Supply of oilseed and vegetable oil . . . . . . . . . . . . . . . . . . . . . . . . . . . . . . . . . . . . . 42
2.5. Demand for vegetable oil . . . . . . . . . . . . . . . . . . . . . . . . . . . . . . . . . . . . . . . . . . . . . . 432.6. World coarse grain, wheat and vegetable oil market indicator ratios . . . . . . . . 45
A.1. Economic assumptions . . . . . . . . . . . . . . . . . . . . . . . . . . . . . . . . . . . . . . . . . . . . . . . 56A.2. World prices. . . . . . . . . . . . . . . . . . . . . . . . . . . . . . . . . . . . . . . . . . . . . . . . . . . . . . . . . 58
A.3. World trade projections . . . . . . . . . . . . . . . . . . . . . . . . . . . . . . . . . . . . . . . . . . . . . . . 60
Frontmatter Page 5 Monday, May 26, 2008 5:11 PM
TABLE OF CONTENTS
OECD-FAO AGRICULTURAL OUTLOOK 2008-2017 – © OECD/FAO 20086
A.4. World cereal projections . . . . . . . . . . . . . . . . . . . . . . . . . . . . . . . . . . . . . . . . . . . . . . 64
A.5. World oilseed projections . . . . . . . . . . . . . . . . . . . . . . . . . . . . . . . . . . . . . . . . . . . . . 65A.6. World meat projections . . . . . . . . . . . . . . . . . . . . . . . . . . . . . . . . . . . . . . . . . . . . . . . 66
A.7. World dairy projections (butter and cheese). . . . . . . . . . . . . . . . . . . . . . . . . . . . . . 68A.8. World dairy projections (powders and casein) . . . . . . . . . . . . . . . . . . . . . . . . . . . . 69
A.9. World sugar projections (in raw sugar equivalent) . . . . . . . . . . . . . . . . . . . . . . . . 70A.10. Biofuels projections : ethanol . . . . . . . . . . . . . . . . . . . . . . . . . . . . . . . . . . . . . . . . . . 71
A.11. Biofuels projections : biodiesel . . . . . . . . . . . . . . . . . . . . . . . . . . . . . . . . . . . . . . . . . 72
Figures1.1. World commodity prices at higher average levels . . . . . . . . . . . . . . . . . . . . . . . . . 141.2. Overall strong growth in world trade. . . . . . . . . . . . . . . . . . . . . . . . . . . . . . . . . . . . 23
1.3. Growth in world exports dominated by developing countries. . . . . . . . . . . . . . . 241.4. Outlook for world crop prices to 2017 . . . . . . . . . . . . . . . . . . . . . . . . . . . . . . . . . . . 25
1.5. Outlook for world livestock product prices to 2017 . . . . . . . . . . . . . . . . . . . . . . . . 252.1. Food commodity prices, 1971–2007 with projections to 2017. . . . . . . . . . . . . . . . 32
2.2. Food expenditure shares and per capita income . . . . . . . . . . . . . . . . . . . . . . . . . . 352.3. Deviations from trend of wheat and coarse grain yields . . . . . . . . . . . . . . . . . . . 40
2.4. Stocks-to-use ratios of maize and wheat . . . . . . . . . . . . . . . . . . . . . . . . . . . . . . . . 452.5. Sensitivity of projected world prices to changes in five key assumptions,
percentage difference from baseline values, 2017 . . . . . . . . . . . . . . . . . . . . . . . . . 502.6. Stochastic crop prices in 2008 and 2017 in nominal terms. . . . . . . . . . . . . . . . . . 52
Frontmatter Page 6 Monday, May 26, 2008 5:11 PM
ACRONYMS AND ABBREVIATIONS
OECD-FAO AGRICULTURAL OUTLOOK 2008-2017 – © OECD/FAO 2008 7
Acronyms and abbreviations
ACP African, Caribbean and Pacific countries
AMAD Agricultural Market Access DatabaseAUSFTA Australia and United States Free Trade Agreement
AI Avian InfluenzaBNGY Billion gallons per year
BNLY Billion litres per yearBSE Bovine Spongiform Encephalopathy
Bt Billion tonnesBTL Biomass to liquid
CAFTA Central American Free Trade AgreementCAP Common Agricultural Policy (EU)
CCC Commodity Credit CorporationCET Common External Tariff
CIS Commonwealth of Independent StatesCPI Consumer Price Index
CRP Conservation Reserve Program of the United StatesCMO Common Market Organisation for sugar (EU)
Cts/lb Cents per poundcwe Carcass weight equivalent
DBES Date-based Export SchemeDDA Doha Development Agenda
DDG Dried Distiller’s Grainsdw Dressed weight
EBA Everything-But-Arms Initiative (EU)ECOWAP West Africa Regional Agricultural Policy
ECOWAS Economic Community of West African StatesEISA Act Energy Independence and Security Act of 2007 (US)
EPAs Economic Partnership Agreements (between EU and ACP countries)ERS Economic Research Service of the US Department for Agriculture
est EstimateE85 Blends of biofuel in transport fuel that represent 85 percent of the fuel
volumeEU European Union
EU-15 Fifteen member states of the European Union EU-10 Ten new member states of the European Union from May 2004
EU-27 Twenty seven member states of the European Union (including Bulgaria and Romania from 2007)
FAO Food and Agriculture Organization of the United Nations
Phase2.book Page 7 Monday, May 26, 2008 4:48 PM
ACRONYMS AND ABBREVIATIONS
OECD-FAO AGRICULTURAL OUTLOOK 2008-2017 – © OECD/FAO 20088
FMD Foot and Mouth Disease
FOB Free on board (export price)FR Federal Reserve (US central bank)
FSRI ACT Farm Security and Rural Investment Act (US) of 2002FTA Free Trade Agreement
GDP Gross Domestic ProductG-10 Group of 10 countries (see Glossary)
G-20 Group of 20 developing countries (see Glossary)GDPD Gross Domestic Product Deflator
GHG Green House GasesGMO Genetically modified organism
HFCS High Fructose Corn SyrupHS Harmonised Commodity Description and Coding System
IEA International Energy Agencykt Thousand tonnes
LAC Latin America and the CaribbeanLa Niña Climatic condition associated with temperature of major sea currents
LDC’s Least Developed CountriesLICONSA Leche Industralizada
lw Live weightMERCOSUR Common Market of the South
MFN Most Favoured NationMha Million hectares
MPS Market Price SupportMt Million tonnes
MTBE Methyl Tertiary Butyl EtherNAFTA North American Free Trade Agreement
OECD Organisation for Economic Co-operation and DevelopmentOIE World Organisation for Animal Health
PCE Private Consumption ExpenditurePIK Payment in kind programme (US)
PROCAMPO Mexican Farmers Direct Support ProgrammePPP Purchasing Power Parity
PRRS Porcine Reproductive and Respiratory Syndrome
PSE Producer Support Estimatepw Product weight
R&D Research and Developmentrse Raw sugar equivalent
rtc Ready to cookRFS Renewable Fuels Standard in the US, which is part of the Energy Policy Act
of 2005 rwt Retail weight
SEAC Spongiform Encephalopathy Advisory CommitteeSFP Single Farm Payment scheme (EU)
SMP Skim milk powderSPS Sanitary and Phytosanitary measures
STRV Short Tons Raw Value
Phase2.book Page 8 Monday, May 26, 2008 4:48 PM
ACRONYMS AND ABBREVIATIONS
OECD-FAO AGRICULTURAL OUTLOOK 2008-2017 – © OECD/FAO 2008 9
t Tonnes
t/ha Tonnes/hectareTRQ Tariff rate quota
UK United KingdomUN The United Nations
URAA Uruguay Round Agreement on AgricultureUNCTAD United Nations Conference on Trade and Development
US United States of AmericaUSDA United States Department of Agriculture
VAT Value added taxv-CJD New Creutzfeld-Jakob-Disease
WAEMU West African Economic and Monetary UnionWMP Whole milk powder
WTO World Trade Organisation
Symbols
AUD Dollars (Australia) KRW Korean won ARS Pesos (Argentina) lb PoundBn Billion Mn MillionBRL Real (Brazil) MXN Mexican pesosCAD Dollars (Canada) NZD Dollars (New Zealand)CNY Yuan (China) p.a Per annumEUR Euro (Europe) RUR Ruble (Russia)gal Gallons THB Thai bahtHa Hectare USD Dollars (United States)hl Hectolitre ZAR South African rand INR Indian rupees
Phase2.book Page 9 Monday, May 26, 2008 4:48 PM

Phase2.book Page 10 Monday, May 26, 2008 4:48 PM
THE OUTLOOK IN BRIEF
OECD-FAO AGRICULTURAL OUTLOOK 2008-2017 – © OECD/FAO 2008 11
THE OUTLOOK IN BRIEF
● World reference prices in nominal terms for almost all agricultural commodities covered in this reportare at or above previous record levels (see Fig. 2.1). This will not last and prices will gradually come downbecause of the transitory nature of some of the factors that are behind the recent hikes. But there is
strong reason to believe that there are now also permanent factors underpinning prices that will work tokeep them both at higher average levels than in the past and reduce the long-term decline in real terms.Whether transitory or permanent, appropriate policy action for agricultural development and foraddressing the needs of the hungry and the poor needs to take account of both these characteristics.
● The dramatic increase in prices since 2005/06 is partly the result of adverse weather conditions in majorgrain-producing regions in the world, with spill-over effects on crops and livestock that compete for the
same land. In a context of low global stocks, these developments alone would have triggered strong pricereactions. These conditions are not new; they have happened in the past and prices have come downonce more normal conditions prevail and supply responds over time. The Outlook sees no reason tobelieve that this will not recur over the next few years.
● Once they have fallen from their current peaks, however, prices will remain at higher average levels overthe medium term than in the past decade. But the underlying forces that drive agricultural product
supply (by and large productivity gains) will eventually outweigh the forces that determine strongerdemand, both for food and feed as well as for industrial demand, most notably for biofuel production.Consequently, prices will resume their decline in real terms, though possibly not by quite as much as inthe past (see Figures 1.1, 1.4 and 1.5 in the Overview section).
● On the supply side, the Outlook expects continued yield growth for crops to be more important than newareas brought into cultivation in determining crop supply. Slowly increasing dairy and livestock yields
also support the increase in milk and meat production. A key assumption in the Outlook is somestrengthening of the US dollar against most currencies. In the countries affected by this change, this willreinforce domestic price incentives to increase production. These factors combine to sustain the growthof global agricultural production, although some of that impetus is abated by the supply-reducing effectof high oil prices that raise production costs.
● On the demand side, changing diets, urbanisation, economic growth and expanding populations aredriving food and feed demand in developing countries. Globally, and in absolute terms, food and feedremain the largest sources of demand growth in agriculture. But stacked on top of this is now the fast-growing demand for feedstock to fuel a growing bioenergy sector. While smaller than the increase in foodand feed use, biofuel demand is the largest source of new demand in decades and a strong factorunderpinning the upward shift in agricultural commodity prices.
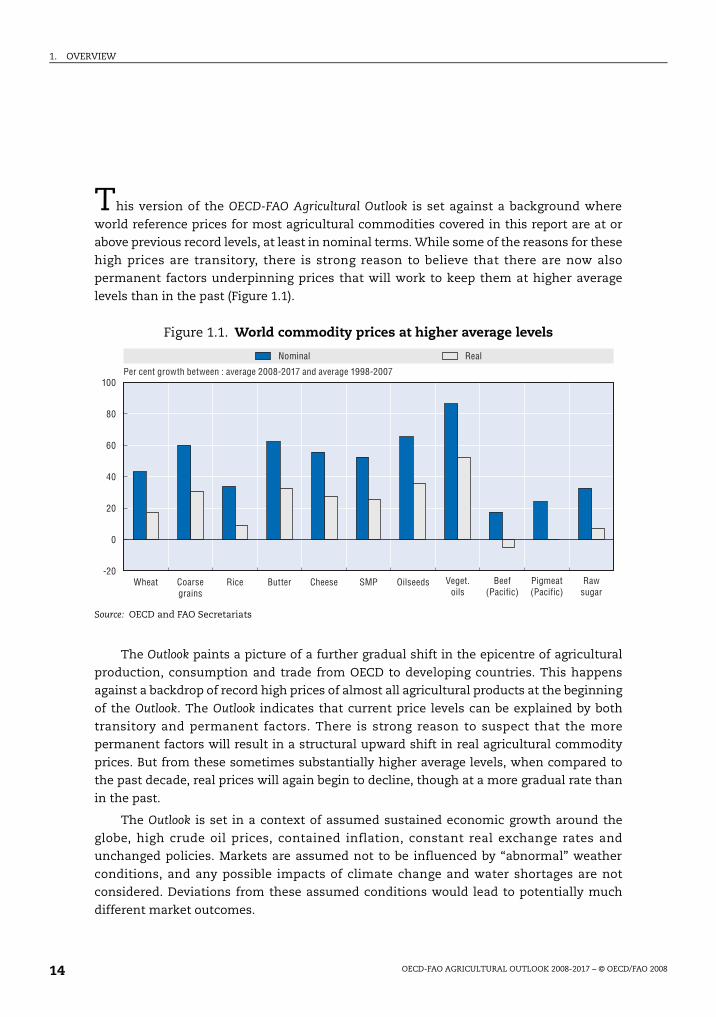
● As a result of these dynamics in supply and demand, the Outlook suggests that commodity prices – innominal terms – over the medium term will average substantially above the levels that prevailed in thepast 10 years. When the average for 2008 to 2017 is compared with that over 1998 to 2007, beef and porkprices may be some 20% higher; raw and white sugar around 30%; wheat, maize and skim milk powder40 to 60%; butter and oilseeds more than 60% and vegetable oils over 80%. Over the Outlook period, priceswill resume their decline in real terms, albeit at a slower rate. However, the impact of various supply and
demand factors on prices will differ across commodities.
● In addition, prices may also be more volatile than in the past: stock levels are not expected to bereplenished substantially over the Outlook; demand is becoming less sensitive to price changes at thefarm level as the commodity share in the final food bill falls and as industrial demand grows; weatherconditions and agricultural product supply may become more variable with climate change; andspeculative non-commercial investment funds enter or leave agricultural futures markets as profit
opportunities dictate.
Phase2.book Page 11 Monday, May 26, 2008 4:48 PM
THE OUTLOOK IN BRIEF
OECD-FAO AGRICULTURAL OUTLOOK 2008-2017 – © OECD/FAO 200812
● Within this overall context, the epicentre of global agriculture will further shift from the OECD towardsdeveloping countries. Both consumption and production are growing faster in developing countries forall products except wheat. By 2017, these countries are expected to dominate production and
consumption of most commodities, with the exception of coarse grains, cheese, and skim-milk powder.
● Corresponding shifts are also occurring in global trade patterns. Imports are growing most in developingcountries, and an increasing share of this growth is captured by larger exports from other emerging anddeveloping countries. Export growth in developing countries is greater, and sometimes very much so foralmost all products. However, while the share of OECD countries in world exports falls, these countriescontinue to dominate export trade for wheat, coarse grains, pork and all dairy products.
● High prices are good for some and bad for others. They are beneficial for many commercial producers inboth developed and developing countries. However, many farmers in developing countries are not linkedto markets and will draw little or no benefit from currently higher prices. But the poor, and in particularthe urban poor in net food importing developing countries, will suffer more. In many low-incomecountries, food expenditures average over 50% of income and the higher prices contained in this Outlookwill push more people into undernourishment.
● For the Least Developed Countries, especially the food-deficit group, the projections thus show greatlyincreased vulnerability and uncertain food supplies during an era of high commodity prices and high pricevolatility. This underscores the importance of developing their domestic supply capacity by improving theoverall environment in which agriculture operates through enhancing governance and administrativesystems and investing in education, training and extension services, research and development andphysical infrastructure. While these are longer-term remedies, it is important in the short term that
commodity trade functions efficiently to facilitate the allocation of available commodity supplies.
● This Outlook assumes unchanged agricultural and trade policies. The actual evolution of agriculturalcommodity and food prices, however, hinges importantly on future policy developments. In this context,increased humanitarian aid is needed to reduce the negative impact of high prices on the very poor, andthis could be done without any major impact on markets.
● Such effects would result, however, from trade-restricting policies such as export taxes and embargos.These may in the short term provide some relief to domestic consumers but in fact impose a burden ondomestic producers and limit their supply response, as well as contribute to global commodity marketuncertainty. Similarly, measures to protect domestic producers of agricultural commodities throughborder measures imposes a burden on domestic consumers; it would also restrict growth opportunitiesfor producers abroad.
● Policy support, as well as oil-price developments, will strongly influence the evolution of future demandfrom biofuel for agricultural commodity feedstocks. In this context, neither the US Energy Independenceand Security Act (EISA) nor proposals for a new EU bioenergy directive are taken into account. Changesin either, or new technological developments would also have a strong impact on projected world pricesfor agricultural commodities and for the availability for food and feed use. In this report, secondgeneration biofuels are not expected to be produced on a commercial basis over the Outlook period.
● Finally, over the longer term, agricultural supply is facing increased uncertainties and limitations to theamount of new land that can be taken into cultivation. Public and private investments in innovation andincreasing agricultural productivity, particularly in developing countries, would greatly improve supplyprospects by helping to broaden the production base and lessen the chance of recurring commodity pricespikes.
● This year’s Outlook has been prepared in an environment characterised by increased instability in
financial markets, higher food price inflation, signs of weakening global economic growth and food-security concerns. Although projections for agricultural commodity markets have always been subject toa number of uncertainties, these have taken on more importance in this year’s edition.
Phase2.book Page 12 Monday, May 26, 2008 4:48 PM

OECD-FAO Agricultural Outlook 2008-2017
© OECD/FAO 2008
13
Chapter 1
Overview
Phase2.book Page 13 Monday, May 26, 2008 4:48 PM
1. OVERVIEW
OECD-FAO AGRICULTURAL OUTLOOK 2008-2017 – © OECD/FAO 200814
This version of the OECD-FAO Agricultural Outlook is set against a background where
world reference prices for most agricultural commodities covered in this report are at orabove previous record levels, at least in nominal terms. While some of the reasons for these
high prices are transitory, there is strong reason to believe that there are now alsopermanent factors underpinning prices that will work to keep them at higher average
levels than in the past (Figure 1.1).
The Outlook paints a picture of a further gradual shift in the epicentre of agricultural
production, consumption and trade from OECD to developing countries. This happensagainst a backdrop of record high prices of almost all agricultural products at the beginning
of the Outlook. The Outlook indicates that current price levels can be explained by both
transitory and permanent factors. There is strong reason to suspect that the morepermanent factors will result in a structural upward shift in real agricultural commodity
prices. But from these sometimes substantially higher average levels, when compared tothe past decade, real prices will again begin to decline, though at a more gradual rate than
in the past.
The Outlook is set in a context of assumed sustained economic growth around the
globe, high crude oil prices, contained inflation, constant real exchange rates andunchanged policies. Markets are assumed not to be influenced by “abnormal” weather
conditions, and any possible impacts of climate change and water shortages are notconsidered. Deviations from these assumed conditions would lead to potentially much
different market outcomes.
Figure 1.1. World commodity prices at higher average levels
Source: OECD and FAO Secretariats
Nominal Real
Per cent growth between : average 2008-2017 and average 1998-2007
-20
0
20
40
60
80
100
Wheat Coarsegrains
Rice Butter Cheese SMP Oilseeds Veget.oils
Beef(Pacific)
Pigmeat(Pacific)
Rawsugar
Phase2.book Page 14 Monday, May 26, 2008 4:48 PM
1. OVERVIEW
OECD-FAO AGRICULTURAL OUTLOOK 2008-2017 – © OECD/FAO 2008 15
The principal underlying assumptions
Lower but sustained economic and population growth underpins demand
Economic activity at the beginning of the Outlook is slowing most notably in the US, theworld’s leading economy. The slowdown in the US and some other OECD economies is
occurring despite continuing robust economic conditions in many other parts of the world.Within this context, growth prospects for OECD countries in the short and longer term are
just above 2% (annual average). Robust activity levels in the main emerging economies areprojected to remain a major driver of global economic expansion in the near term. In the
medium and longer term a modest deceleration is projected. China and India will remaingrowth leaders among developing countries, with substantial market expansion and GDP
growth anticipated for both countries as they become further integrated into the globaleconomy and world trade.
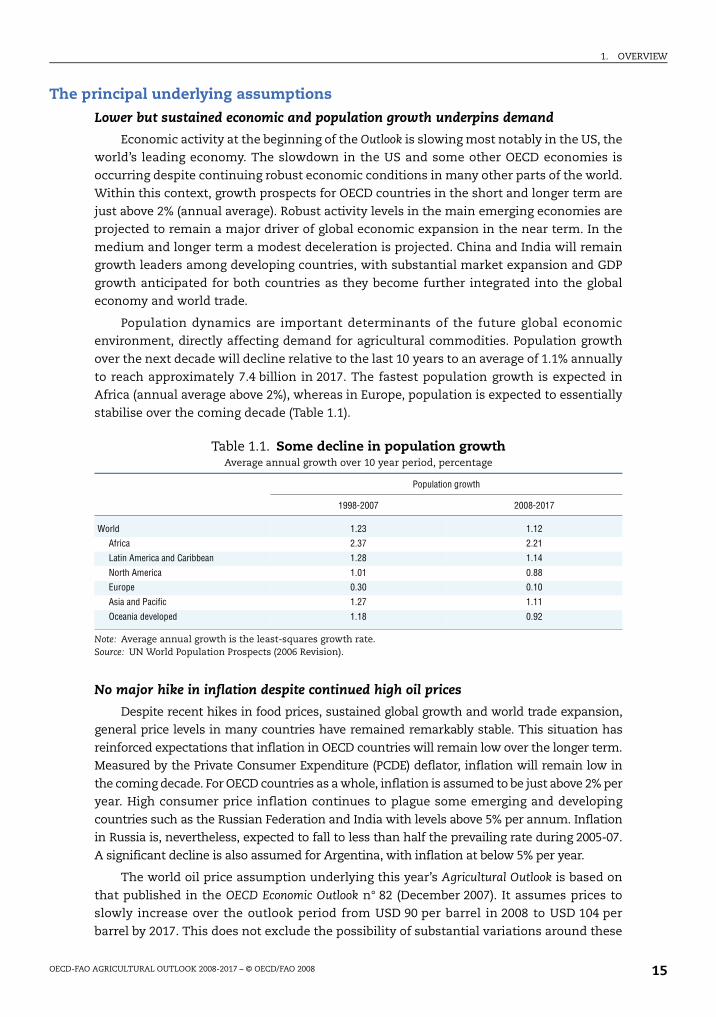
Population dynamics are important determinants of the future global economicenvironment, directly affecting demand for agricultural commodities. Population growth
over the next decade will decline relative to the last 10 years to an average of 1.1% annually
to reach approximately 7.4 billion in 2017. The fastest population growth is expected inAfrica (annual average above 2%), whereas in Europe, population is expected to essentially
stabilise over the coming decade (Table 1.1).
No major hike in inflation despite continued high oil prices
Despite recent hikes in food prices, sustained global growth and world trade expansion,general price levels in many countries have remained remarkably stable. This situation has
reinforced expectations that inflation in OECD countries will remain low over the longer term.Measured by the Private Consumer Expenditure (PCDE) deflator, inflation will remain low in
the coming decade. For OECD countries as a whole, inflation is assumed to be just above 2% peryear. High consumer price inflation continues to plague some emerging and developing
countries such as the Russian Federation and India with levels above 5% per annum. Inflationin Russia is, nevertheless, expected to fall to less than half the prevailing rate during 2005-07.
A significant decline is also assumed for Argentina, with inflation at below 5% per year.
The world oil price assumption underlying this year’s Agricultural Outlook is based on
that published in the OECD Economic Outlook n° 82 (December 2007). It assumes prices toslowly increase over the outlook period from USD 90 per barrel in 2008 to USD 104 per
barrel by 2017. This does not exclude the possibility of substantial variations around these
Table 1.1. Some decline in population growthAverage annual growth over 10 year period, percentage
Population growth
1998-2007 2008-2017
World 1.23 1.12
Africa 2.37 2.21
Latin America and Caribbean 1.28 1.14
North America 1.01 0.88
Europe 0.30 0.10
Asia and Pacific 1.27 1.11
Oceania developed 1.18 0.92
Note: Average annual growth is the least-squares growth rate.Source: UN World Population Prospects (2006 Revision).
Phase2.book Page 15 Monday, May 26, 2008 4:48 PM
1. OVERVIEW
OECD-FAO AGRICULTURAL OUTLOOK 2008-2017 – © OECD/FAO 200816
levels througout the period or within any given year. However, future oil prices are a major
uncertainty in the Outlook. Some analysts emphasise that high oil prices will slow demand,ultimately reducing the price of oil. Others argue that consumption, production and
processing capacities are relatively inelastic in the short term, sustaining continued high,or even further increasing, prices. This year’s Agricultural Outlook is based on the high-price
scenario. Pressure on oil prices has been maintained thus far as geopolitical tensionscombine with processing capacity constraints to keep global supply from the major oil
producers below effective demand.
Conditions remain favourable for further growth in biofuel production
For the first time, this Outlook specifically includes projections for supply, demand,trade and prices of ethanol and biodiesel derived from agricultural feedstock. The main
forces driving further growth in biofuel production are high crude oil prices and continuedpublic support, in particular in OECD countries. However, the latest bioenergy policy
changes in the EU and the US are not taken into consideration. Neither do the projections
and the assessed impacts on commodity markets take account of the possibility ofchanges in production technologies. Such changes would modify the economics of biofuel
production and affect the market and trade outcomes.
The US dollar is expected to strengthen against most currencies
Under an assumption of constant real exchange rates, inflation differentials vis-à-vis
the United States are the primary determinant of projections for exchange rates over the
Outlook period. This implies a strengthening of the US dollar against most currencies, evenif currently there are signs of a further weakening of the dollar in the short term. Over the
course of the Outlook period, the euro exchange rate is projected to remain stable. However,very low levels of inflation in Japan relative to the United States mean that the Yen is
expected to appreciate further. The currencies of high growth/high inflation countries suchas Brazil, India, Turkey and South Africa will depreciate most over the medium term.
The Outlook reflects policies in place in early 2008
Agricultural and trade policies play an important role in both domestic and
international markets for agricultural commodities and food products. While agriculturalpolicies are becoming increasingly decoupled from production decisions, non-agricultural
policies, such as those for instance with respect to energy, or the environment, are havinga growing impact on the agri-food sector. Policies influence the composition and levels of
both production and consumption, thereby creating (or sometimes correcting) marketdistortions and influencing prices. There is a tendency towards increased price
responsiveness on the supply side with ongoing policy reform in some OECD countries.Also, relatively elastic supply and demand in a growing number of developing countries,
coupled with an increasing share of these countries in world trade, is improvingadjustments in agricultural markets. As in the past, this Outlook assumes constant policies
over the period to 2017. This implies, notably, that any changes in the new US farmlegislation to replace the current FSRI Act, or in the EU’s Common Agricultural Policy as a
result of the scheduled “health check” or changes in trade policies reflecting a conclusionof the negotiation under the Doha Round, are not considered in this report. In addition,
neither the US Energy Independence and Security Act (EISA) nor proposals for a new EUbioenergy directive have been taken into account. However, recently increased export taxes
in Argentina are taken into consideration.
Phase2.book Page 16 Monday, May 26, 2008 4:48 PM
1. OVERVIEW
OECD-FAO AGRICULTURAL OUTLOOK 2008-2017 – © OECD/FAO 2008 17
Main trends in commodity markets
Grain markets set to remain tight
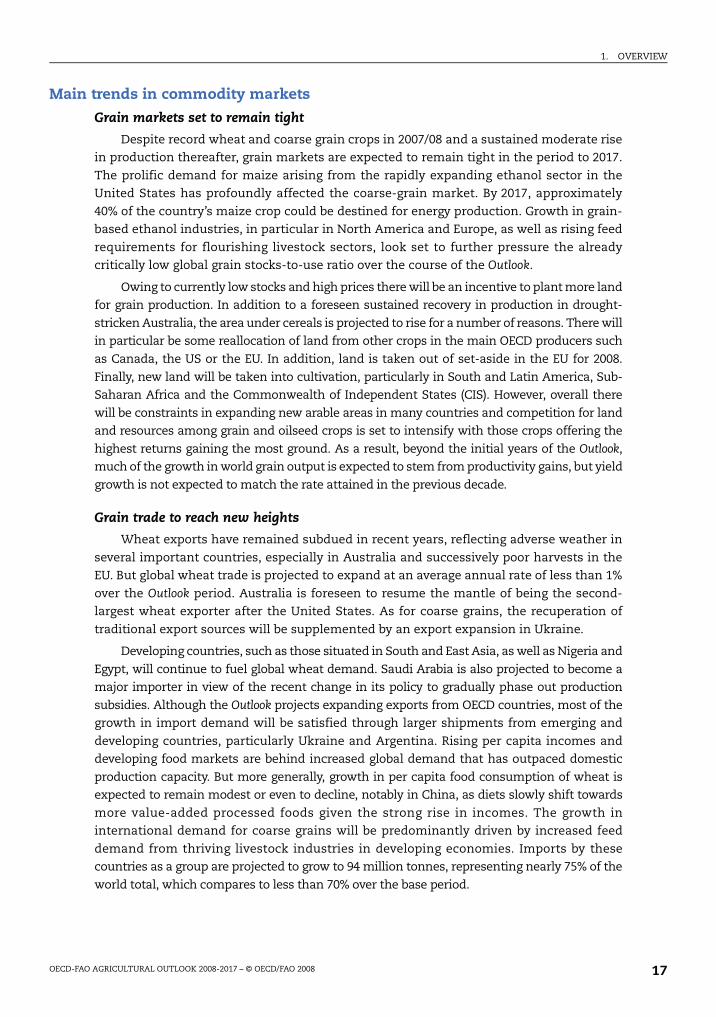
Despite record wheat and coarse grain crops in 2007/08 and a sustained moderate risein production thereafter, grain markets are expected to remain tight in the period to 2017.
The prolific demand for maize arising from the rapidly expanding ethanol sector in theUnited States has profoundly affected the coarse-grain market. By 2017, approximately
40% of the country’s maize crop could be destined for energy production. Growth in grain-based ethanol industries, in particular in North America and Europe, as well as rising feed
requirements for flourishing livestock sectors, look set to further pressure the alreadycritically low global grain stocks-to-use ratio over the course of the Outlook.
Owing to currently low stocks and high prices there will be an incentive to plant more landfor grain production. In addition to a foreseen sustained recovery in production in drought-
stricken Australia, the area under cereals is projected to rise for a number of reasons. There willin particular be some reallocation of land from other crops in the main OECD producers such
as Canada, the US or the EU. In addition, land is taken out of set-aside in the EU for 2008.
Finally, new land will be taken into cultivation, particularly in South and Latin America, Sub-Saharan Africa and the Commonwealth of Independent States (CIS). However, overall there
will be constraints in expanding new arable areas in many countries and competition for landand resources among grain and oilseed crops is set to intensify with those crops offering the
highest returns gaining the most ground. As a result, beyond the initial years of the Outlook,much of the growth in world grain output is expected to stem from productivity gains, but yield
growth is not expected to match the rate attained in the previous decade.
Grain trade to reach new heights
Wheat exports have remained subdued in recent years, reflecting adverse weather in
several important countries, especially in Australia and successively poor harvests in theEU. But global wheat trade is projected to expand at an average annual rate of less than 1%
over the Outlook period. Australia is foreseen to resume the mantle of being the second-largest wheat exporter after the United States. As for coarse grains, the recuperation of
traditional export sources will be supplemented by an export expansion in Ukraine.
Developing countries, such as those situated in South and East Asia, as well as Nigeria and
Egypt, will continue to fuel global wheat demand. Saudi Arabia is also projected to become amajor importer in view of the recent change in its policy to gradually phase out production
subsidies. Although the Outlook projects expanding exports from OECD countries, most of thegrowth in import demand will be satisfied through larger shipments from emerging and
developing countries, particularly Ukraine and Argentina. Rising per capita incomes anddeveloping food markets are behind increased global demand that has outpaced domestic
production capacity. But more generally, growth in per capita food consumption of wheat isexpected to remain modest or even to decline, notably in China, as diets slowly shift towards
more value-added processed foods given the strong rise in incomes. The growth ininternational demand for coarse grains will be predominantly driven by increased feed
demand from thriving livestock industries in developing economies. Imports by thesecountries as a group are projected to grow to 94 million tonnes, representing nearly 75% of the
world total, which compares to less than 70% over the base period.
Phase2.book Page 17 Monday, May 26, 2008 4:48 PM
1. OVERVIEW
OECD-FAO AGRICULTURAL OUTLOOK 2008-2017 – © OECD/FAO 200818
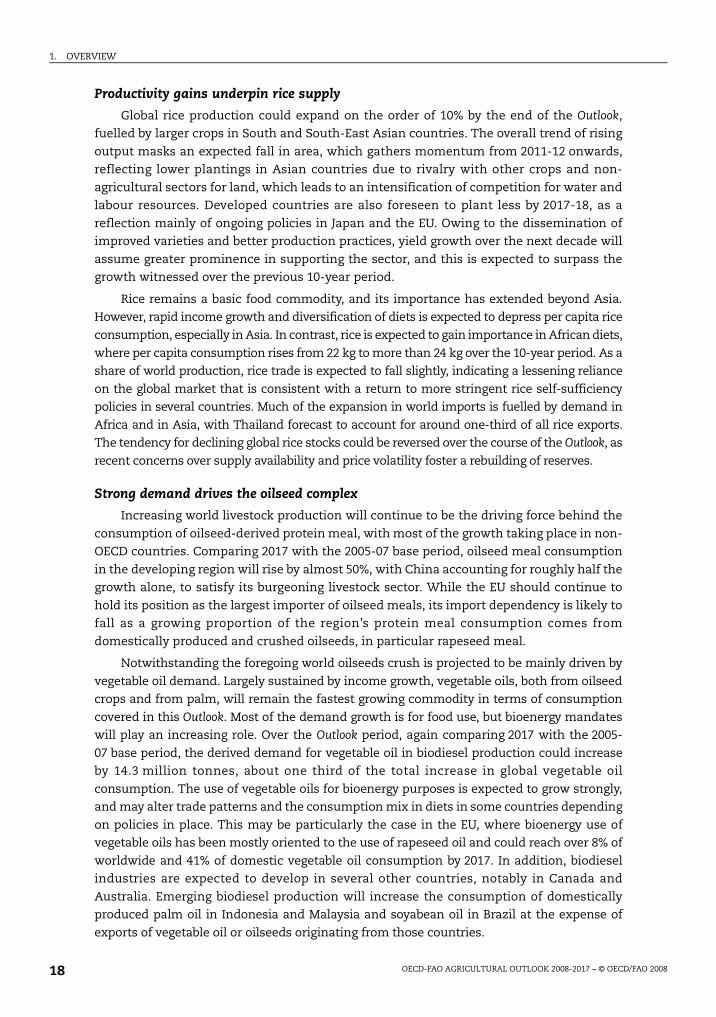
Productivity gains underpin rice supply
Global rice production could expand on the order of 10% by the end of the Outlook,fuelled by larger crops in South and South-East Asian countries. The overall trend of rising
output masks an expected fall in area, which gathers momentum from 2011-12 onwards,reflecting lower plantings in Asian countries due to rivalry with other crops and non-
agricultural sectors for land, which leads to an intensification of competition for water andlabour resources. Developed countries are also foreseen to plant less by 2017-18, as a
reflection mainly of ongoing policies in Japan and the EU. Owing to the dissemination ofimproved varieties and better production practices, yield growth over the next decade will
assume greater prominence in supporting the sector, and this is expected to surpass thegrowth witnessed over the previous 10-year period.
Rice remains a basic food commodity, and its importance has extended beyond Asia.However, rapid income growth and diversification of diets is expected to depress per capita rice
consumption, especially in Asia. In contrast, rice is expected to gain importance in African diets,
where per capita consumption rises from 22 kg to more than 24 kg over the 10-year period. As ashare of world production, rice trade is expected to fall slightly, indicating a lessening reliance
on the global market that is consistent with a return to more stringent rice self-sufficiencypolicies in several countries. Much of the expansion in world imports is fuelled by demand in
Africa and in Asia, with Thailand forecast to account for around one-third of all rice exports.The tendency for declining global rice stocks could be reversed over the course of the Outlook, as
recent concerns over supply availability and price volatility foster a rebuilding of reserves.
Strong demand drives the oilseed complex
Increasing world livestock production will continue to be the driving force behind the
consumption of oilseed-derived protein meal, with most of the growth taking place in non-OECD countries. Comparing 2017 with the 2005-07 base period, oilseed meal consumption
in the developing region will rise by almost 50%, with China accounting for roughly half thegrowth alone, to satisfy its burgeoning livestock sector. While the EU should continue to
hold its position as the largest importer of oilseed meals, its import dependency is likely tofall as a growing proportion of the region’s protein meal consumption comes from
domestically produced and crushed oilseeds, in particular rapeseed meal.
Notwithstanding the foregoing world oilseeds crush is projected to be mainly driven by
vegetable oil demand. Largely sustained by income growth, vegetable oils, both from oilseedcrops and from palm, will remain the fastest growing commodity in terms of consumption
covered in this Outlook. Most of the demand growth is for food use, but bioenergy mandateswill play an increasing role. Over the Outlook period, again comparing 2017 with the 2005-
07 base period, the derived demand for vegetable oil in biodiesel production could increaseby 14.3 million tonnes, about one third of the total increase in global vegetable oil
consumption. The use of vegetable oils for bioenergy purposes is expected to grow strongly,and may alter trade patterns and the consumption mix in diets in some countries depending
on policies in place. This may be particularly the case in the EU, where bioenergy use ofvegetable oils has been mostly oriented to the use of rapeseed oil and could reach over 8% of
worldwide and 41% of domestic vegetable oil consumption by 2017. In addition, biodieselindustries are expected to develop in several other countries, notably in Canada and
Australia. Emerging biodiesel production will increase the consumption of domesticallyproduced palm oil in Indonesia and Malaysia and soyabean oil in Brazil at the expense of
exports of vegetable oil or oilseeds originating from those countries.
Phase2.book Page 18 Monday, May 26, 2008 4:48 PM
1. OVERVIEW
OECD-FAO AGRICULTURAL OUTLOOK 2008-2017 – © OECD/FAO 2008 19
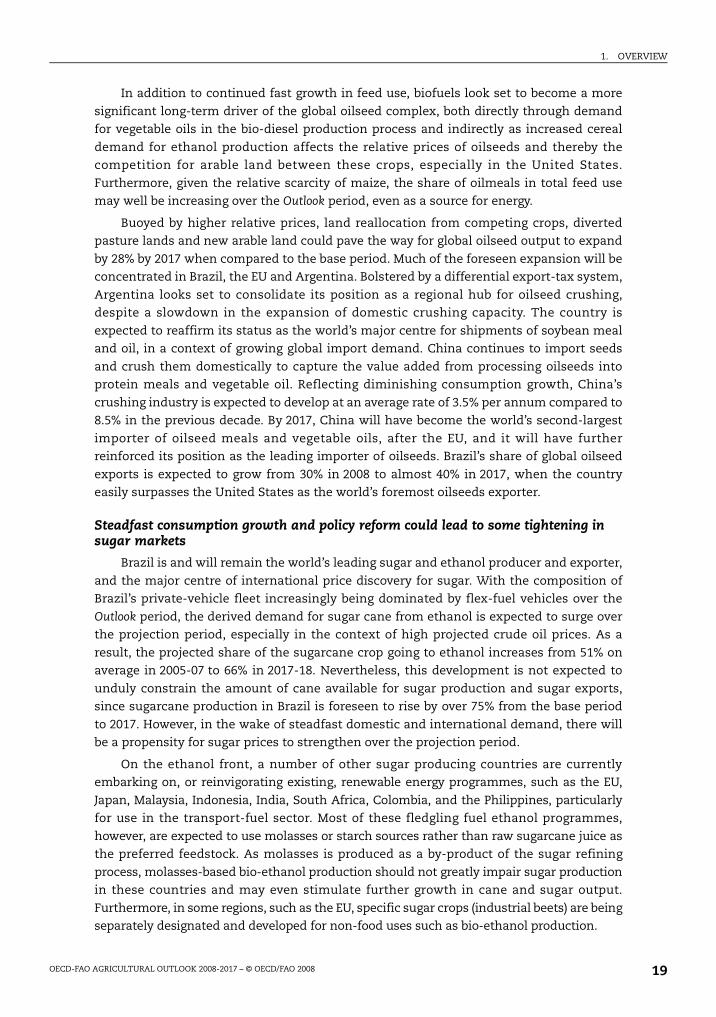
In addition to continued fast growth in feed use, biofuels look set to become a more
significant long-term driver of the global oilseed complex, both directly through demandfor vegetable oils in the bio-diesel production process and indirectly as increased cereal
demand for ethanol production affects the relative prices of oilseeds and thereby thecompetition for arable land between these crops, especially in the United States.
Furthermore, given the relative scarcity of maize, the share of oilmeals in total feed usemay well be increasing over the Outlook period, even as a source for energy.
Buoyed by higher relative prices, land reallocation from competing crops, divertedpasture lands and new arable land could pave the way for global oilseed output to expand
by 28% by 2017 when compared to the base period. Much of the foreseen expansion will beconcentrated in Brazil, the EU and Argentina. Bolstered by a differential export-tax system,
Argentina looks set to consolidate its position as a regional hub for oilseed crushing,despite a slowdown in the expansion of domestic crushing capacity. The country is
expected to reaffirm its status as the world’s major centre for shipments of soybean mealand oil, in a context of growing global import demand. China continues to import seeds
and crush them domestically to capture the value added from processing oilseeds intoprotein meals and vegetable oil. Reflecting diminishing consumption growth, China’s
crushing industry is expected to develop at an average rate of 3.5% per annum compared to8.5% in the previous decade. By 2017, China will have become the world’s second-largest
importer of oilseed meals and vegetable oils, after the EU, and it will have furtherreinforced its position as the leading importer of oilseeds. Brazil’s share of global oilseed
exports is expected to grow from 30% in 2008 to almost 40% in 2017, when the countryeasily surpasses the United States as the world’s foremost oilseeds exporter.
Steadfast consumption growth and policy reform could lead to some tightening in sugar markets
Brazil is and will remain the world’s leading sugar and ethanol producer and exporter,
and the major centre of international price discovery for sugar. With the composition ofBrazil’s private-vehicle fleet increasingly being dominated by flex-fuel vehicles over the
Outlook period, the derived demand for sugar cane from ethanol is expected to surge overthe projection period, especially in the context of high projected crude oil prices. As a
result, the projected share of the sugarcane crop going to ethanol increases from 51% onaverage in 2005-07 to 66% in 2017-18. Nevertheless, this development is not expected to
unduly constrain the amount of cane available for sugar production and sugar exports,since sugarcane production in Brazil is foreseen to rise by over 75% from the base period
to 2017. However, in the wake of steadfast domestic and international demand, there willbe a propensity for sugar prices to strengthen over the projection period.
On the ethanol front, a number of other sugar producing countries are currentlyembarking on, or reinvigorating existing, renewable energy programmes, such as the EU,
Japan, Malaysia, Indonesia, India, South Africa, Colombia, and the Philippines, particularlyfor use in the transport-fuel sector. Most of these fledgling fuel ethanol programmes,
however, are expected to use molasses or starch sources rather than raw sugarcane juice asthe preferred feedstock. As molasses is produced as a by-product of the sugar refining
process, molasses-based bio-ethanol production should not greatly impair sugar productionin these countries and may even stimulate further growth in cane and sugar output.
Furthermore, in some regions, such as the EU, specific sugar crops (industrial beets) are beingseparately designated and developed for non-food uses such as bio-ethanol production.
Phase2.book Page 19 Monday, May 26, 2008 4:48 PM
1. OVERVIEW
OECD-FAO AGRICULTURAL OUTLOOK 2008-2017 – © OECD/FAO 200820
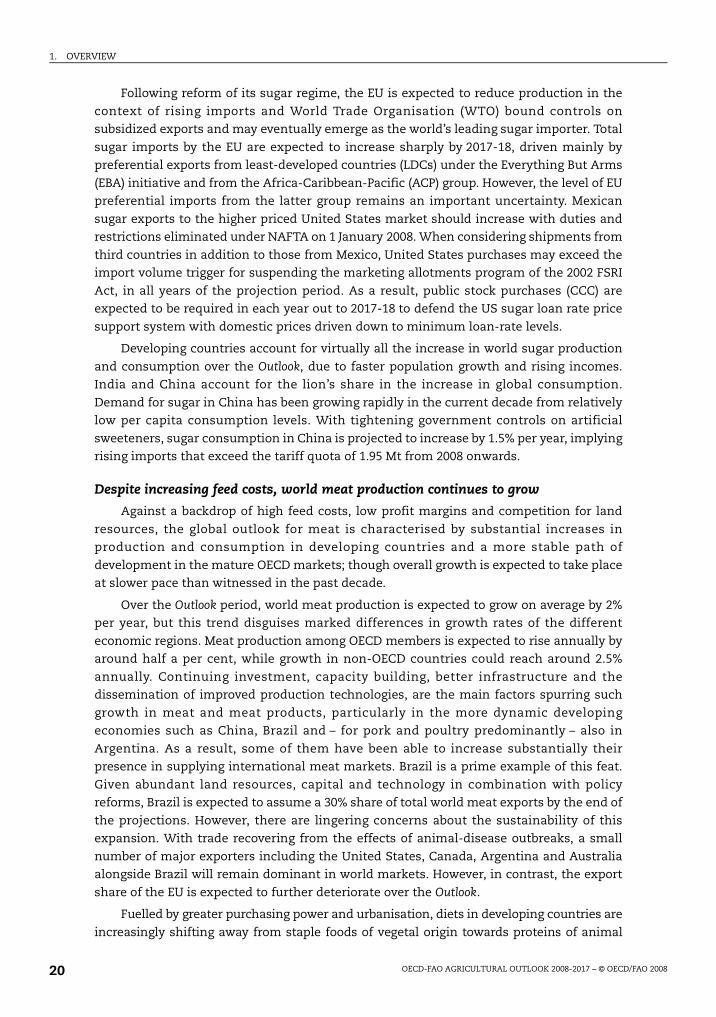
Following reform of its sugar regime, the EU is expected to reduce production in the
context of rising imports and World Trade Organisation (WTO) bound controls onsubsidized exports and may eventually emerge as the world’s leading sugar importer. Total
sugar imports by the EU are expected to increase sharply by 2017-18, driven mainly bypreferential exports from least-developed countries (LDCs) under the Everything But Arms
(EBA) initiative and from the Africa-Caribbean-Pacific (ACP) group. However, the level of EUpreferential imports from the latter group remains an important uncertainty. Mexican
sugar exports to the higher priced United States market should increase with duties andrestrictions eliminated under NAFTA on 1 January 2008. When considering shipments from
third countries in addition to those from Mexico, United States purchases may exceed theimport volume trigger for suspending the marketing allotments program of the 2002 FSRI
Act, in all years of the projection period. As a result, public stock purchases (CCC) areexpected to be required in each year out to 2017-18 to defend the US sugar loan rate price
support system with domestic prices driven down to minimum loan-rate levels.
Developing countries account for virtually all the increase in world sugar production
and consumption over the Outlook, due to faster population growth and rising incomes.India and China account for the lion’s share in the increase in global consumption.
Demand for sugar in China has been growing rapidly in the current decade from relativelylow per capita consumption levels. With tightening government controls on artificial
sweeteners, sugar consumption in China is projected to increase by 1.5% per year, implyingrising imports that exceed the tariff quota of 1.95 Mt from 2008 onwards.
Despite increasing feed costs, world meat production continues to grow
Against a backdrop of high feed costs, low profit margins and competition for land
resources, the global outlook for meat is characterised by substantial increases inproduction and consumption in developing countries and a more stable path of
development in the mature OECD markets; though overall growth is expected to take placeat slower pace than witnessed in the past decade.
Over the Outlook period, world meat production is expected to grow on average by 2%per year, but this trend disguises marked differences in growth rates of the different
economic regions. Meat production among OECD members is expected to rise annually byaround half a per cent, while growth in non-OECD countries could reach around 2.5%
annually. Continuing investment, capacity building, better infrastructure and thedissemination of improved production technologies, are the main factors spurring such
growth in meat and meat products, particularly in the more dynamic developingeconomies such as China, Brazil and – for pork and poultry predominantly – also in
Argentina. As a result, some of them have been able to increase substantially theirpresence in supplying international meat markets. Brazil is a prime example of this feat.
Given abundant land resources, capital and technology in combination with policyreforms, Brazil is expected to assume a 30% share of total world meat exports by the end of
the projections. However, there are lingering concerns about the sustainability of thisexpansion. With trade recovering from the effects of animal-disease outbreaks, a small
number of major exporters including the United States, Canada, Argentina and Australiaalongside Brazil will remain dominant in world markets. However, in contrast, the export
share of the EU is expected to further deteriorate over the Outlook.
Fuelled by greater purchasing power and urbanisation, diets in developing countries are
increasingly shifting away from staple foods of vegetal origin towards proteins of animal
Phase2.book Page 20 Monday, May 26, 2008 4:48 PM
1. OVERVIEW
OECD-FAO AGRICULTURAL OUTLOOK 2008-2017 – © OECD/FAO 2008 21
origin. Meat consumption in developing countries is expected to account for more than 80%
of global growth. Much of this expansion will take place in Asia and the Pacific region, andwill reflect in particular the rise in consumption of cheaper sources of animal protein, mainly
poultry and pork. Consumption of pork in particular is expected to rise in China where porkis traditionally the most important meat and where 2007 consumption was reduced due to
an outbreak of Porcine Reproductive and Respiratory Syndrome (PRRS). Import dependencyin meat products is likewise expected to grow in many dynamic developing countries as
burgeoning demand surpasses the domestic capacity for meat production throughout theduration of the Outlook. Among the developed countries, the Russian Federation is set to
remain the world’s largest net meat importer by 2017, followed closely by Japan.
Tightness in dairy market to ease
A pressing issue for the projections concerns how the global dairy industry will reactto the unprecedented price spikes across dairy products that were observed in 2007. There
is broad consensus that the industry has undergone structural change, where internationalmarkets have shifted from a supply-driven paradigm supported by distorting policies
which used these markets as a dumping ground for excess supplies, to a more demand-driven paradigm, responsive to market signals and consumer wants. The growing relative
importance of demand factors is further explained by urbanisation and higher incomeswhich have shifted diets in some developing economies towards a more diversified basket
of dairy products, encouraged by growth in dairy marketing and retailing channels.
The Outlook foresees that high international prices of dairy products will transmit
strong signals for supply response from both traditional and emerging exporters. Moreimportantly, where trade linkages allow higher prices to be transmitted to producers in
developing countries, they may create incentives for investment, expansion andrestructuring. This will help to reshape their industries, which will be increasingly geared
towards higher value-added processing of dairy products. Rising supply potential willenable future production growth and improved domestic marketing linkages, placing these
countries in a stronger competitive position in regional and global markets.
Milk production gains over the Outlook period will be overwhelmingly driven by output
growth in non-OECD countries. Dairy expansion in India, the largest producing country inthe world, will be especially marked, where surging demand growth will stimulate a strong
increase in milk and butter production. Driven by substantial yield gains, strong growth inmilk production is also expected in China. This contrasts with moderate growth in the
OECD area, where milk production increases mainly due to gains from Oceania and theUnited States and is chiefly constrained by domestic production controls in many other
countries. These supply developments constitute one of the more prominent trends in theOutlook for dairy markets.
Supply response, however, could be checked by higher production costs induced byboth higher feed and energy prices. These affect production, processing and distribution of
milk products, and will encourage the competitiveness of pasture-based systems. Theyalso will affect trade, as higher transportation costs put local production at greater
advantage. The evolution of world dairy markets will also be influenced by extensive policyinterventions and by internal food-security concerns, but also increasingly by
environmental constraints linked to high livestock populations, water availability andcompetition for pasture land. Increasingly, a higher production response in many countries
will come from higher yields as opposed to increased cattle numbers. A key for the dairy
Phase2.book Page 21 Monday, May 26, 2008 4:48 PM
1. OVERVIEW
OECD-FAO AGRICULTURAL OUTLOOK 2008-2017 – © OECD/FAO 200822
outlook is the potential for dairy markets to adjust in the presence of increased price
volatility and low global stock levels of dairy products.
OECD countries continue to dominate world dairy exports
World exports of dairy products are expected to grow for all products, with only a fewdeveloping countries able to affect the shares of traditional OECD exporters of Australia,
New Zealand and the EU. In the latter, export shares could decline substantially, in light ofa tight domestic market. Among the new exporters, Argentina is emerging as a dominant
player in markets for whole-milk powder (WMP) and cheese, supported by its rising milkproduction capacity. Similarly, Ukraine is expected to increase its presence on the export
markets mainly for cheese.
Import markets will remain rather fragmented compared to those for exports. The six
largest importers of dairy products are expected to cover less than 50% of the worldmarket. In China, despite a strong increase in milk-production, demand will continue to
outpace supply and imports are expected to grow over the Outlook, in particular for milkpowders, where China will become one of the leading importers. Russia is foreseen to
remain as the world’s most prominent importer of butter and cheese, with imports risingby more than 60% over the Outlook period compared with the 2005-07 base. Driven by milk-
reconstitution needs, global imports of milk powders will grow by over 3% annually overthe medium term, mostly in Asia and the Middle East.
Biofuel production and use on an upswing
Production and use of both ethanol and biodiesel have increased significantly inrecent years. Production of fuel ethanol tripled between 2000 and 2007, with the US and
Brazil accounting for the majority of this growth. However, a large number of othercountries either commenced renewable energy programmes or increased fuel ethanol
production in this period as well. Biodiesel output witnessed an even more pronouncedexpansion over the same period, having grown from less than one billion litres to almost
11 billion litres. Initially the EU accounted for more than 90% of global biodiesel production,but with increased biodiesel output in many other countries, in particular the US, its share
has declined to less than 60% in 2007.
Near-record prices for maize, wheat and vegetable oils at the start of the Outlook have
reduced the economic viability of biofuel production in many countries, despite strong public
support and increasing fossil fuel prices. Public support in the form of tax concessions and taxcredits, blending obligations and regulations, and import tariffs are widely applied to help
offset higher production costs of biofuels compared to fossil fuels. The one exception is bio-ethanol production from sugarcane in Brazil. In this case, lower world sugar prices associated
with a large global surplus have improved the economic viability and profitability of ethanolproduction in Brazil, which remains competitive with gasoline at a crude oil price of around
USD 35 per barrel. Most commodity prices are expected to fall from current highs over theOutlook period with larger crop production. Coupled with expected high crude oil and biofuel
prices over the next few years, the economic situation of biofuel producers should improvecompared to the situation in 2007 but remain less favourable than in 2005 and 2006.
Ethanol production to grow as prices stabilise at higher levels
Global ethanol production is projected to increase rapidly and to reach some125 billion litres in 2017, twice the quantity produced in 2007. World ethanol prices are
Phase2.book Page 22 Monday, May 26, 2008 4:48 PM
1. OVERVIEW
OECD-FAO AGRICULTURAL OUTLOOK 2008-2017 – © OECD/FAO 2008 23
expected to exceed USD 55 per hectolitre in 2009 as crude oil prices rise, but should fall
back to levels around USD 52-53 per hectolitre over the remainder of the projection periodas production capacity expands in a number of countries. Following increased mandates
international trade in ethanol is expected to grow rapidly to reach 6 billion litres in 2010and almost 10 billion litres by 2017, despite continuing trade protection. Most of this trade
will originate in Brazil, and will be destined for markets in the EU and the US.
Global biodiesel production and use to be driven mainly by public policy
Global biodiesel production is set to grow at slightly higher rates then for bioethanol –which maintains the largest share – to reach some 24 billion litres by 2017. This growth in
output occurs despite the fact that world biodiesel prices are expected to remain wellabove production costs of fossil diesel, and to stay within the range of USD 104-106 per
hectolitre, for most of the projection period. As in the case of ethanol, increased blendingmandates should stimulate demand and boost international trade in the initial years of the
Outlook. World trade is, however, projected to remain largely unchanged in following yearsdue to technical constraints in the use of palm-oil based biodiesel in the colder climates
and as production in the main consuming countries increases. Most of the trade shouldoriginate in Malaysia and Indonesia with the EU as the main destination.1
Main developments in trade in agricultural commodities
Rapid expansion of world trade overall, dominated by developing countries
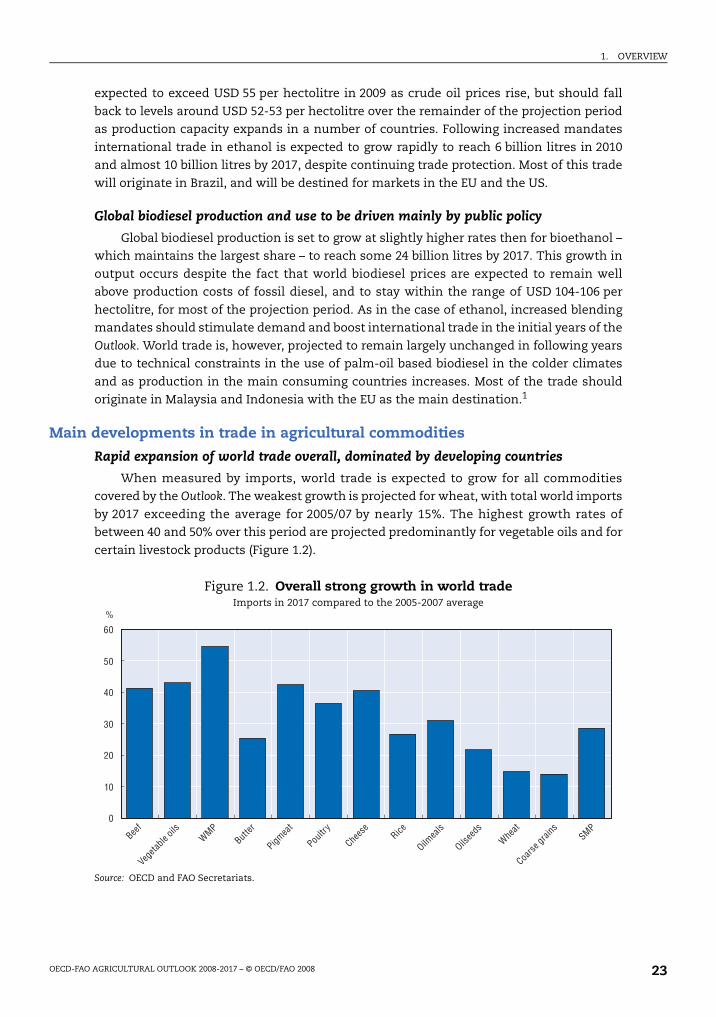
When measured by imports, world trade is expected to grow for all commoditiescovered by the Outlook. The weakest growth is projected for wheat, with total world imports
by 2017 exceeding the average for 2005/07 by nearly 15%. The highest growth rates ofbetween 40 and 50% over this period are projected predominantly for vegetable oils and for
certain livestock products (Figure 1.2).
Figure 1.2. Overall strong growth in world tradeImports in 2017 compared to the 2005-2007 average
Source: OECD and FAO Secretariats.
%
0
10
20
30
40
50
60
Beef
Vegeta
ble oi
lsWMP
Butter
Pigmea
t
Poultr
y
Chees
eRice
Oilmea
ls
Oilsee
dsWhe
at
Coarse
grain
sSMP
Phase2.book Page 23 Monday, May 26, 2008 4:48 PM
1. OVERVIEW
OECD-FAO AGRICULTURAL OUTLOOK 2008-2017 – © OECD/FAO 200824
When the focus is on crop imports, the projections show that for all crop products in
the Outlook, except vegetable oils, developing countries dominate the picture of tradeexpansion. For wheat, sugar, oilseeds and oilmeals, most of the growth takes place in Asian
developing countries. For oilseeds, import growth in Asia exceeds even total tradeexpansion and is offset to some extend by a decline in imports by OECD countries. For rice
and coarse grains, most of the growth in imports takes place in African developingcountries, and much of that in the LDCs.
Turning to imports of livestock products, the picture is much different. For therelatively expensive products such as beef, pork and cheese, import growth is dominated
by OECD countries. For poultry and milk powders, most of the growth in global imports isexplained by larger imports in Asian developing countries. While these countries also
represent over 40% of import growth for butter, the largest contribution to the tradeexpansion for this product is due to larger imports in the CIS countries.
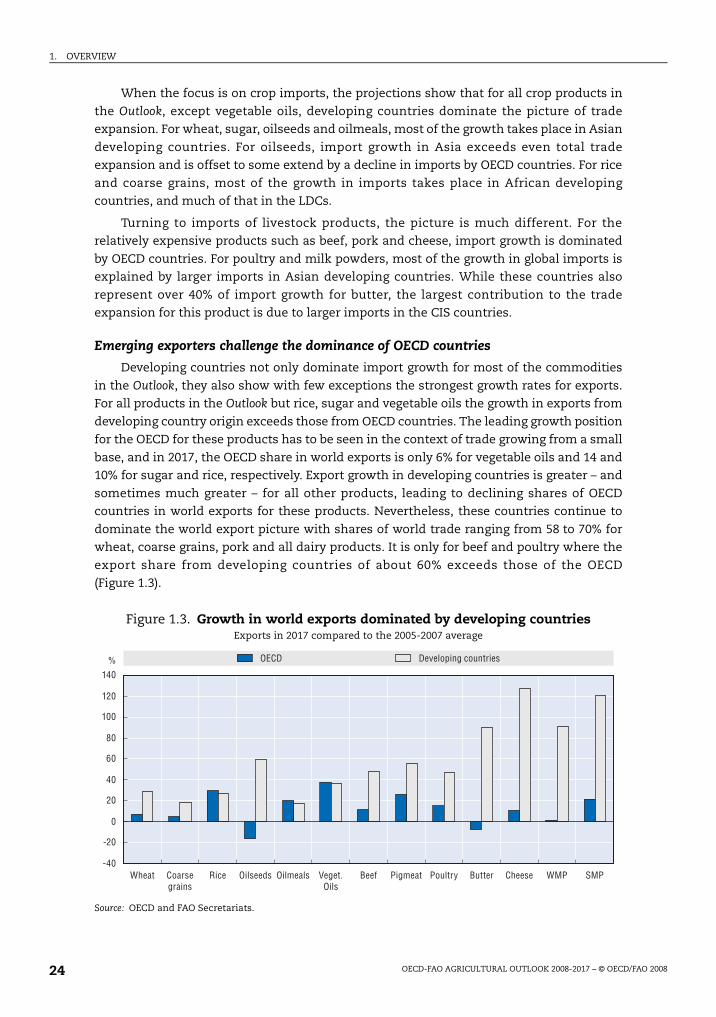
Emerging exporters challenge the dominance of OECD countries
Developing countries not only dominate import growth for most of the commodities
in the Outlook, they also show with few exceptions the strongest growth rates for exports.For all products in the Outlook but rice, sugar and vegetable oils the growth in exports from
developing country origin exceeds those from OECD countries. The leading growth positionfor the OECD for these products has to be seen in the context of trade growing from a small
base, and in 2017, the OECD share in world exports is only 6% for vegetable oils and 14 and10% for sugar and rice, respectively. Export growth in developing countries is greater – and
sometimes much greater – for all other products, leading to declining shares of OECDcountries in world exports for these products. Nevertheless, these countries continue to
dominate the world export picture with shares of world trade ranging from 58 to 70% forwheat, coarse grains, pork and all dairy products. It is only for beef and poultry where the
export share from developing countries of about 60% exceeds those of the OECD(Figure 1.3).
Figure 1.3. Growth in world exports dominated by developing countriesExports in 2017 compared to the 2005-2007 average
Source: OECD and FAO Secretariats.
OECD Developing countries%
-40
-20
0
20
40
60
80
100
120
140
Wheat Coarsegrains
Rice Oilseeds Oilmeals Veget.Oils
Beef Pigmeat Poultry Butter Cheese WMP SMP
Phase2.book Page 24 Monday, May 26, 2008 4:48 PM
1. OVERVIEW
OECD-FAO AGRICULTURAL OUTLOOK 2008-2017 – © OECD/FAO 2008 25
The outlook for world prices
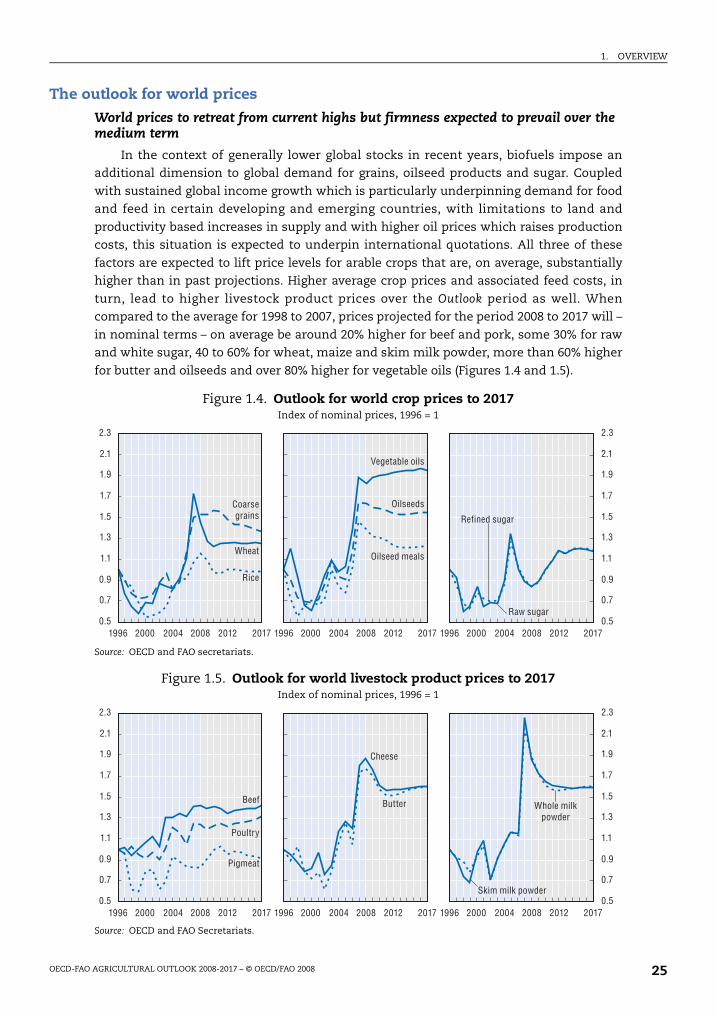
World prices to retreat from current highs but firmness expected to prevail over the medium term
In the context of generally lower global stocks in recent years, biofuels impose anadditional dimension to global demand for grains, oilseed products and sugar. Coupled
with sustained global income growth which is particularly underpinning demand for foodand feed in certain developing and emerging countries, with limitations to land and
productivity based increases in supply and with higher oil prices which raises productioncosts, this situation is expected to underpin international quotations. All three of these
factors are expected to lift price levels for arable crops that are, on average, substantiallyhigher than in past projections. Higher average crop prices and associated feed costs, in
turn, lead to higher livestock product prices over the Outlook period as well. Whencompared to the average for 1998 to 2007, prices projected for the period 2008 to 2017 will –
in nominal terms – on average be around 20% higher for beef and pork, some 30% for rawand white sugar, 40 to 60% for wheat, maize and skim milk powder, more than 60% higher
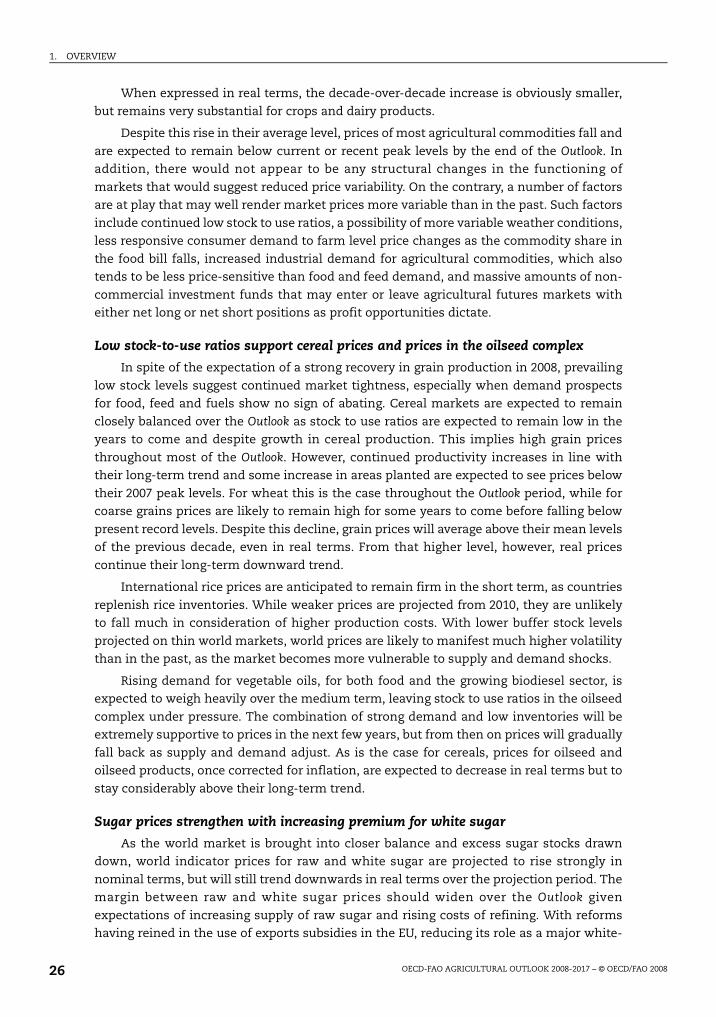
for butter and oilseeds and over 80% higher for vegetable oils (Figures 1.4 and 1.5).
Figure 1.4. Outlook for world crop prices to 2017Index of nominal prices, 1996 = 1
Source: OECD and FAO secretariats.
Figure 1.5. Outlook for world livestock product prices to 2017Index of nominal prices, 1996 = 1
Source: OECD and FAO Secretariats.
0.5
0.7
0.9
1.1
1.3
1.5
1.7
1.9
2.1
2.3
0.5
0.7
0.9
1.1
1.3
1.5
1.7
1.9
2.1
2.3
1996 2000 2004 2008 2012 2017 1996 2000 2004 2008 2012 2017 1996 2000 2004 2008 2012 2017
Coarsegrains
Wheat
Rice
Vegetable oils
Oilseeds
Oilseed meals
Raw sugar
Refined sugar
0.5
0.7
0.9
1.1
1.3
1.5
1.7
1.9
2.1
2.3
0.5
0.7
0.9
1.1
1.3
1.5
1.7
1.9
2.1
2.3
1996 2000 2004 2008 2012 2017 1996 2000 2004 2008 2012 2017 1996 2000 2004 2008 2012 2017
Beef
Poultry
Pigmeat
Cheese
Butter Whole milkpowder
Skim milk powder
Phase2.book Page 25 Monday, May 26, 2008 4:48 PM
1. OVERVIEW
OECD-FAO AGRICULTURAL OUTLOOK 2008-2017 – © OECD/FAO 200826
When expressed in real terms, the decade-over-decade increase is obviously smaller,
but remains very substantial for crops and dairy products.
Despite this rise in their average level, prices of most agricultural commodities fall and
are expected to remain below current or recent peak levels by the end of the Outlook. Inaddition, there would not appear to be any structural changes in the functioning of
markets that would suggest reduced price variability. On the contrary, a number of factorsare at play that may well render market prices more variable than in the past. Such factors
include continued low stock to use ratios, a possibility of more variable weather conditions,less responsive consumer demand to farm level price changes as the commodity share in
the food bill falls, increased industrial demand for agricultural commodities, which alsotends to be less price-sensitive than food and feed demand, and massive amounts of non-
commercial investment funds that may enter or leave agricultural futures markets witheither net long or net short positions as profit opportunities dictate.
Low stock-to-use ratios support cereal prices and prices in the oilseed complex
In spite of the expectation of a strong recovery in grain production in 2008, prevailing
low stock levels suggest continued market tightness, especially when demand prospectsfor food, feed and fuels show no sign of abating. Cereal markets are expected to remain
closely balanced over the Outlook as stock to use ratios are expected to remain low in theyears to come and despite growth in cereal production. This implies high grain prices
throughout most of the Outlook. However, continued productivity increases in line withtheir long-term trend and some increase in areas planted are expected to see prices below
their 2007 peak levels. For wheat this is the case throughout the Outlook period, while forcoarse grains prices are likely to remain high for some years to come before falling below
present record levels. Despite this decline, grain prices will average above their mean levelsof the previous decade, even in real terms. From that higher level, however, real prices
continue their long-term downward trend.
International rice prices are anticipated to remain firm in the short term, as countries
replenish rice inventories. While weaker prices are projected from 2010, they are unlikelyto fall much in consideration of higher production costs. With lower buffer stock levels
projected on thin world markets, world prices are likely to manifest much higher volatilitythan in the past, as the market becomes more vulnerable to supply and demand shocks.
Rising demand for vegetable oils, for both food and the growing biodiesel sector, isexpected to weigh heavily over the medium term, leaving stock to use ratios in the oilseed
complex under pressure. The combination of strong demand and low inventories will beextremely supportive to prices in the next few years, but from then on prices will gradually
fall back as supply and demand adjust. As is the case for cereals, prices for oilseed andoilseed products, once corrected for inflation, are expected to decrease in real terms but to
stay considerably above their long-term trend.
Sugar prices strengthen with increasing premium for white sugar
As the world market is brought into closer balance and excess sugar stocks drawndown, world indicator prices for raw and white sugar are projected to rise strongly in
nominal terms, but will still trend downwards in real terms over the projection period. Themargin between raw and white sugar prices should widen over the Outlook given
expectations of increasing supply of raw sugar and rising costs of refining. With reformshaving reined in the use of exports subsidies in the EU, reducing its role as a major white-
Phase2.book Page 26 Monday, May 26, 2008 4:48 PM
1. OVERVIEW
OECD-FAO AGRICULTURAL OUTLOOK 2008-2017 – © OECD/FAO 2008 27
sugar exporter, the white-sugar premium in future years should reflect more the cost of
further sugar refining.
Meat prices projected to stay above current averages, but dairy prices expected to gradually retreat from 2007 record levels
Given rising feed costs and strong meat demand in the major emerging economies,meat prices are expected to rise above historic levels in the medium term. Non-ruminant
production is notably affected by high cereal and oilseeds prices as low-priced distiller’sdry grains (DDGs) cannot easily be integrated into their feed rations. These higher input
costs are expected to result in increased meat prices over the next decade.
World dairy prices are expected to weaken somewhat over the next two years as
supply responds sufficiently to strong price incentives. While prices are anticipated todecline from currently high levels, the expectation is that they will remain firm over the
entire outlook and stay higher compared to the previous decade. As with the majority ofother agricultural commodity prices, when expressed in real terms the well-established
longer term falling trend was reversed radically in recent years. However, dairy productsare expected to resume a modest declining trend in future years, albeit from a much higher
level than in the past.
Some major issues and uncertaintiesThis year’s Outlook has been prepared in an environment characterised by increased
instability in financial markets, higher food price inflation, signs of weakening global
economic growth and food-security concerns. The commodity markets have showndramatic rises in prices across a range of commodities on a weekly basis, attracting the
attention of the daily press and stimulating discussion on the food-feed-fuel debate.Although projections for agricultural commodity markets have always been subject to a
number of uncertainties, these have taken on more importance in this year’s edition. As inthe past, weather conditions, animal-disease outbreaks, the macroeconomic environment
and domestic policies are all factors that will continue to affect agricultural marketoutcomes. The question for the forthcoming period is how these key factors and
uncertainties will change over time and to what extent they will change the marketoutlook. Some of these uncertainties are discussed in detail in a separate section in this
report.
On the supply side, weather-related production shocks have always been the single
most important factor for agricultural production and recent bad weather spells in severalimportant producing regions have been responsible for much of the supply shortages on
commodity crop markets. Is the recent spell of bad weather merely an episodic event, ordoes it foreshadow more systematic changes linked to global warming and more variable
weather patterns around the world? In the presence of high prices and the relatedincreased food security concerns, what is the scope for further productivity gains,
technological advances and breakthroughs in production and harvesting or for bringingnew areas into cultivation? In developing countries, what is the potential for the expected
plateau of higher average prices to be transmitted to domestic markets, reinvigoratingagricultural industries and improving their competitive position in local and international
markets? What will be the timing of the availability of second generation biofuelproduction technologies? Coupled with unforeseen changes in crude oil prices, how will
this affect the production of biofuels and agricultural commodity markets?
Phase2.book Page 27 Monday, May 26, 2008 4:48 PM
1. OVERVIEW
OECD-FAO AGRICULTURAL OUTLOOK 2008-2017 – © OECD/FAO 200828
The uncertainties on the demand side seem to be lesser as steady year-on-year
income driven consumption growth remains a basic feature of many commodity markets.Nevertheless, macroeconomic conditions are playing a crucial role for future market
developments and a slowdown in economic growth as compared to that assumed in theOutlook would moderate demand, international trade and agricultural commodity prices.
In addition, exchange rate developments could have an important influence on themarkets as a change in domestic currencies vis-à-vis the US dollar would affect
comparative advantages and domestic market responses given price changes oninternational markets. A particular uncertainty on the demand side of agricultural markets
is the growing presence and investments of non-commercial interests, such as financialfunds, in futures trading on commodity markets. To what extent is the growing demand for
financial derivatives affecting demand, risk management strategies and spot market pricesfor crops? And how will this further evolve in the future.
Policy interventions can also create uncertainty in commodity markets. Changes inbiofuel policies, either to raise or to lower domestic targets or to review current policy
incentives downwards, could be of major importance for agricultural markets given thatbiofuel production is one of the important factors lending strength to these markets over
the medium term. In more general terms, there will be changes to domestic policies in keyproducing and trading countries such as new farm legislation in the United States, any
changes that may results from the “health check” of the EU CAP or an eventual outcome tothe current round of the Doha multilateral trade negotiations. Such and other changes
have not been anticipated in this Outlook and would affect market outcomes. Finally, highinternational commodity prices have recently lead governments in several countries to
introduce measures to restrict exports. While such policies may in the short term providesome relief to domestic consumers, at the expense of some further belt tightening by their
neighbours, they impose a burden on domestic producers, dampen the supply response inthese countries, and aggravate the global commodity market situation.
The policy issuesThe key feature of this year’s Outlook is the record-high level of many agricultural
commodity prices. These are partly due to short-term factors such as drought in major
cereal-producing areas and speculative activity. Once the influence of these transitoryfactors is removed or changes, prices will fall from current highs. However, there are
factors at play that will keep prices well above average levels over the past decade. Theseinclude the steady growth in demand linked to population and income growth as well as
changing diets in emerging economies, in particular China and India. But there are alsofactors that are uncertain into the future: energy prices, the diversion of land and crops for
bioenergy, and climate change.
High prices are always good for some and bad for others. They are good for producers
of farm produce, including in many cases for the people they employ, even though highprices of cereals, for example, mean higher costs for producers of cereal-based animal
products. High prices are not only beneficial for some farmers in OECD countries, but mayalso be good news for commercial producers in developing countries. Insofar as those
higher prices more than offset higher energy and other input costs in these countries,higher farm incomes can have important multiplier effects and lead to higher income
levels in rural areas. For farm households producing mainly for their own consumption orfor local markets that are insulated from price fluctuations on national and international
Phase2.book Page 28 Monday, May 26, 2008 4:48 PM
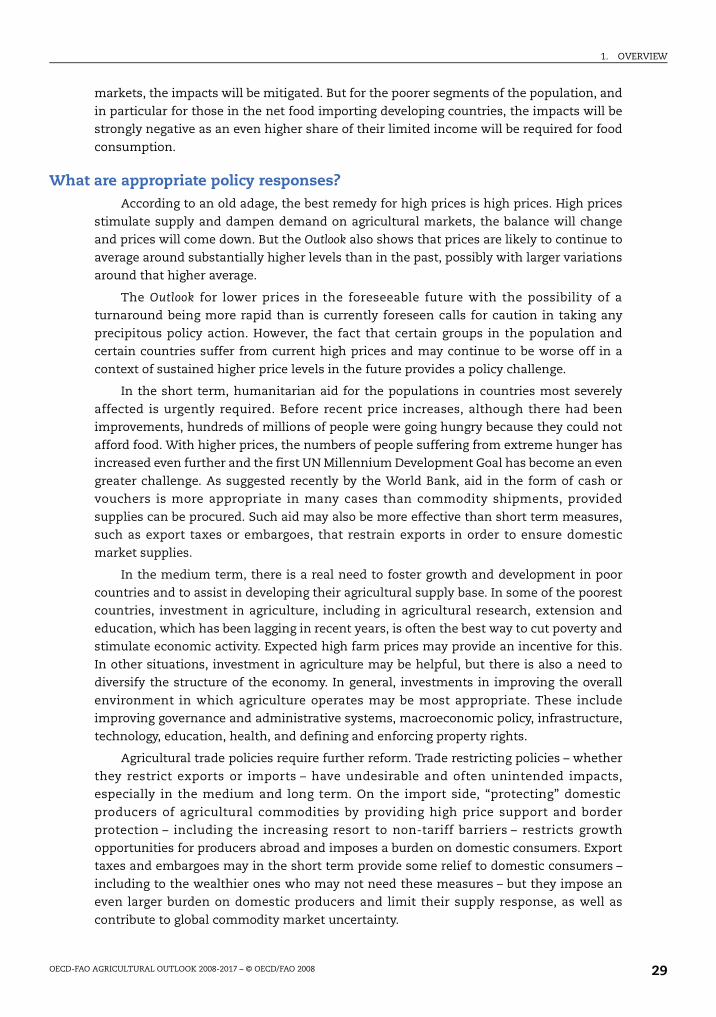
1. OVERVIEW
OECD-FAO AGRICULTURAL OUTLOOK 2008-2017 – © OECD/FAO 2008 29
markets, the impacts will be mitigated. But for the poorer segments of the population, and
in particular for those in the net food importing developing countries, the impacts will bestrongly negative as an even higher share of their limited income will be required for food
consumption.
What are appropriate policy responses?According to an old adage, the best remedy for high prices is high prices. High prices
stimulate supply and dampen demand on agricultural markets, the balance will changeand prices will come down. But the Outlook also shows that prices are likely to continue to
average around substantially higher levels than in the past, possibly with larger variationsaround that higher average.
The Outlook for lower prices in the foreseeable future with the possibility of aturnaround being more rapid than is currently foreseen calls for caution in taking any
precipitous policy action. However, the fact that certain groups in the population andcertain countries suffer from current high prices and may continue to be worse off in a
context of sustained higher price levels in the future provides a policy challenge.
In the short term, humanitarian aid for the populations in countries most severely
affected is urgently required. Before recent price increases, although there had beenimprovements, hundreds of millions of people were going hungry because they could not
afford food. With higher prices, the numbers of people suffering from extreme hunger hasincreased even further and the first UN Millennium Development Goal has become an even
greater challenge. As suggested recently by the World Bank, aid in the form of cash orvouchers is more appropriate in many cases than commodity shipments, provided
supplies can be procured. Such aid may also be more effective than short term measures,such as export taxes or embargoes, that restrain exports in order to ensure domestic
market supplies.
In the medium term, there is a real need to foster growth and development in poor
countries and to assist in developing their agricultural supply base. In some of the poorestcountries, investment in agriculture, including in agricultural research, extension and
education, which has been lagging in recent years, is often the best way to cut poverty andstimulate economic activity. Expected high farm prices may provide an incentive for this.
In other situations, investment in agriculture may be helpful, but there is also a need todiversify the structure of the economy. In general, investments in improving the overall
environment in which agriculture operates may be most appropriate. These includeimproving governance and administrative systems, macroeconomic policy, infrastructure,
technology, education, health, and defining and enforcing property rights.
Agricultural trade policies require further reform. Trade restricting policies – whether
they restrict exports or imports – have undesirable and often unintended impacts,especially in the medium and long term. On the import side, “protecting” domestic
producers of agricultural commodities by providing high price support and borderprotection – including the increasing resort to non-tariff barriers – restricts growth
opportunities for producers abroad and imposes a burden on domestic consumers. Exporttaxes and embargoes may in the short term provide some relief to domestic consumers –
including to the wealthier ones who may not need these measures – but they impose aneven larger burden on domestic producers and limit their supply response, as well as
contribute to global commodity market uncertainty.
Phase2.book Page 29 Monday, May 26, 2008 4:48 PM
1. OVERVIEW
OECD-FAO AGRICULTURAL OUTLOOK 2008-2017 – © OECD/FAO 200830
It is also necessary to examine more closely the causes and impacts of the recent price
increases. On the supply side, the link between production and yield shortfalls, climatechange and water availability warrants further analysis, both in terms of trends, variability
and risk. Investments in R&D, technology transfer and extension services, particularly inless developed economies, could do much to increase productivity and output and there
may be a role for governments to foster this, especially where there are wider publicbenefits. In addition, the future development of genetically modified organisms (GMOs)
also offers potential that could be further exploited, both to improve productivity and toenhance the attributes of crops destined for either food or non-food uses.
The largely policy driven nature of the rapid increase in the supply and demand forbiofuels is one of the reasons for current and future higher prices. OECD/IEA analysis to
date2 suggests that the energy security, environmental, and economic benefits of biofuelsproduction based on agricultural commodity feed stocks are at best modest, and
sometimes even negative, and are unlikely to be delivered by current policies alone.Alternative approaches may be considered that offer potentially greater benefits with less
of the unintended market impact, such as policies that encourage reduced energy demandand greenhouse-gas (GHG) emissions, provide for freer trade in biofuels, and accelerate
introduction of “second-generation” production technologies that do not rely upon currentcommodity feed stocks.
Notes
1. For a detailed analysis of the market impacts of biofuel policies, see OECD/IEA EconomicAssessment of Biofuel Support Policies (forthcoming).
2. For further details, see OECD/IEA Economic Assessment of Biofuel Support Policies (forthcoming).
Phase2.book Page 30 Monday, May 26, 2008 4:48 PM
OECD-FAO Agricultural Outlook 2008-2017
© OECD/FAO 2008
31
Chapter 2
Are High Prices here to Stay?
Phase2.book Page 31 Monday, May 26, 2008 4:48 PM
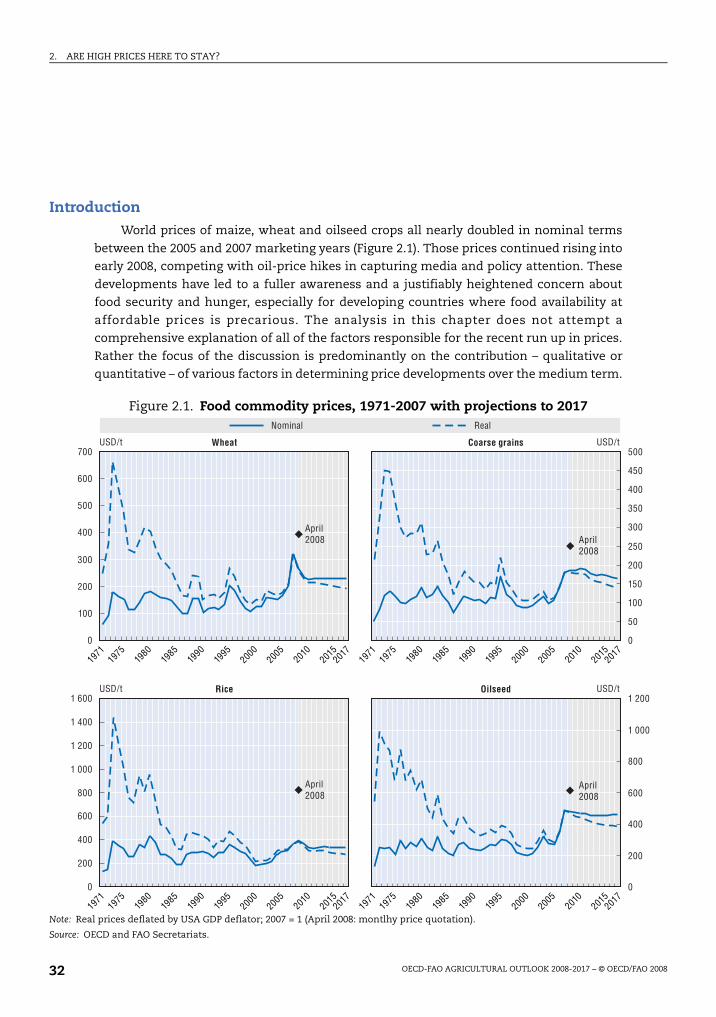
2. ARE HIGH PRICES HERE TO STAY?
OECD-FAO AGRICULTURAL OUTLOOK 2008-2017 – © OECD/FAO 200832
IntroductionWorld prices of maize, wheat and oilseed crops all nearly doubled in nominal terms
between the 2005 and 2007 marketing years (Figure 2.1). Those prices continued rising intoearly 2008, competing with oil-price hikes in capturing media and policy attention. These
developments have led to a fuller awareness and a justifiably heightened concern aboutfood security and hunger, especially for developing countries where food availability at
affordable prices is precarious. The analysis in this chapter does not attempt acomprehensive explanation of all of the factors responsible for the recent run up in prices.
Rather the focus of the discussion is predominantly on the contribution – qualitative orquantitative – of various factors in determining price developments over the medium term.
Figure 2.1. Food commodity prices, 1971-2007 with projections to 2017
Note: Real prices deflated by USA GDP deflator; 2007 = 1 (April 2008: montlhy price quotation).
Source: OECD and FAO Secretariats.
Nominal Real
0
100
200
300
400
500
600
700
0
50
100
150
200
250
300
350
400
450
500
0
200
400
600
800
1 000
1 200
0
200
400
600
800
1 000
1 200
1 400
1 600
April2008 April
2008
April2008
April2008
Wheat
Rice
Coarse grains
Oilseed
USD/t USD/t
USD/t USD/t
1971
1975
1980
1985
1990
1995
2015
2000
2005
2010
2017
1971
1975
1980
1985
1990
1995
2015
2000
2005
2010
2017
1971
1975
1980
1985
1990
1995
2015
2000
2005
2010
2017
1971
1975
1980
1985
1990
1995
2015
2000
2005
2010
2017
Phase2.book Page 32 Monday, May 26, 2008 4:48 PM
2. ARE HIGH PRICES HERE TO STAY?
OECD-FAO AGRICULTURAL OUTLOOK 2008-2017 – © OECD/FAO 2008 33
Meat and poultry prices have also seen increases during this period but only very
modest ones. There have been substantial increases in prices of dairy products in 2007although the pressure on the international dairy market has already abated somewhat. As
the international debate has focused recently on the implications of increases in cropmarkets, the primary focus of this chapter is on prices for cereals and oilseeds.
Agricultural commodity price increases have been a significant, but not the only,factor driving up the cost of food. High oil prices and the resulting higher costs of food
processing, transportation and distribution have driven food costs higher still. Food priceinflation is generally running well ahead of general price inflation but especially so in
many developing countries (Box 2.1). Higher food costs are of course more painful for
Box 2.1. Measuring the impact of rising commodity prices on food prices
Agricultural commodity price increases are making headlines and there is muchdebate and concern about what these extraordinary price increases mean for food
prices, particularly in developing countries. Policy makers have become extremelyconcerned by recent price developments because of the implications for consumers’ability to meet their most basic of needs, food. This is a critical issue for developingcountries where large portions of the population have income levels that are low or atsubsistence levels. But increasing prices reduces the purchasing power of incomes alsoin relatively high-income countries, where it will be the low-income groups that are
particularly affected. In general, households with low incomes are more heavilypenalized when the price of necessities rise because these absorb a larger share of theirincome.
The increase in food prices from a government perspective is however not generallymeasured by the change in one or two commodities or in one or two cities, but by a fixed
basket of foods consumed in urban areas of the entire country; this measure is known asthe food price index. Changes in the food price index are important because of theircontribution to overall inflation rates, that is, the change in the Consumer PriceIndex (CPI).a The impact of food prices on this indicator varies across countries accordingto the share of income which consumers allocate to food and the rate of increase of foodprices.
How important are commodity price increases for food prices?
The direct links between current commodity prices and retail food prices are oftendifficult to make without an analysis of the food production and distribution structure
as well as the relative costs of inputs. For importing countries, the link betweeninternational commodity prices in local currency depends on a number of factors,including exchange rates, transportation costs and border policies, as well as thestructure of the food distribution system. The local price of wheat for a consumer insuch countries is not simply the international price in USD at say US Gulf Ports, but theGulf Port price of wheat times the exchange rate plus the cost of transportation and
insurance to the point of delivery in addition to any import duties imposed by thecountry. So in this case, recent domestic price increases not only reflect the higherprice of wheat but also increased freight (transportation and insurance) costs, whichhave risen by 250% since early 2006, and are now at record high levels.b Nevertheless,price increases in domestic currency terms may be less than the increase in the dollarprice of wheat in countries where the US dollar has depreciated significantly vis-à-vis
their currency.
Phase2.book Page 33 Monday, May 26, 2008 4:48 PM
2. ARE HIGH PRICES HERE TO STAY?
OECD-FAO AGRICULTURAL OUTLOOK 2008-2017 – © OECD/FAO 200834
Box 2.1. Measuring the impact of rising commodity prices on food prices (cont.)
Trade policy measures such as import tariffs also add to the price of importedcommodities. These costs can be easily modified by governments so as to limit priceincreases, for instance, if governments adopt import tariffs which decrease automaticallyif the price of the imported commodity rises beyond a certain level, as in the case of ricefor Bangladesh, or even be suspended if the world price rises beyond a threshold level,
such as in Indonesia. These mechanisms function to moderate price increases once goodsreach the border. In the face of rising domestic prices of key commodities, exportingcountries may put in place export taxes or bans. India and Vietnam recently banned riceexports when prices reached what were deemed to be unacceptable levels in domesticmarkets.
Once commodities reach the domestic market, the issue of price transmission through
the supply chain to retail markets predominates. The link between commodity prices andretail food prices is a hotly debated issue, and depends on many factors that vary bycountry. In general, farm gate prices of agricultural commodities in many developedcountries account on average for 25 to 35% of the final retail price. While this is notnegligible, the share is often much less and varies across fresh and processed foods. Thehigher the degree of processing, the lower will be the share of the raw commodity in the
final price at retail. This means that food prices reflect not only commodity price changesbut also those of other inputs, in particular wages, energy, transport and storage. It alsomeans that depending on the circumstances, retail food prices can change by more or byless than what would be determined by the change in commodity prices if these factors donot change to the same degree.
In developing countries the share of processed goods in the food basket is generally
small, thus the increases in commodity prices are likely to be more directly transmittedthrough to retail prices. This fact, coupled with a larger share of income devoted to foodexpenditures, implies that the rise in agricultural commodity prices has a significantimpact on developing country consumers. Both of these elements will determine theextent of the contribution of food price changes to the overall CPI or inflation.
How important is the food component in the CPI?
The weight of the food component in the CPI varies significantly across countries,reflecting the structure of household expenditures. The food price component ranges from
less than 10% in the United States to over 30% in Turkey and Poland, but for the majority ofOECD countries food expenditure shares range between 13% and 20%. In developingcountries the share of food expenditure in the budget is much higher; for instance, it is 28%in China, 33% in India, and absorbs more than half of total household expenditures incountries such as Kenya at 51%, Haiti at 52%, Malawi at 58% and Bangladesh at 62%.
These observations confirm Engel’s Law, which displays an inverse relationship between
food expenditure shares and income (Figure 2.2). The implication is that for countrieswhere food expenditure accounts for an important share of income, high food prices willhave a negative impact on the purchasing power of incomes. In these countries, rising foodprices mean an erosion of the capacity to meet basic needs, and this is likely to become apotential source of political tensions and even violence. Low-income households are thosethat will be most affected by an increases in food prices. As the share of income they spend
on food is relatively high, they have little remaining income left to reallocate expenditurefrom other goods to meet food needs. They may simply be forced to consume less food andother basic necessities as a result of higher food prices.
Phase2.book Page 34 Monday, May 26, 2008 4:48 PM
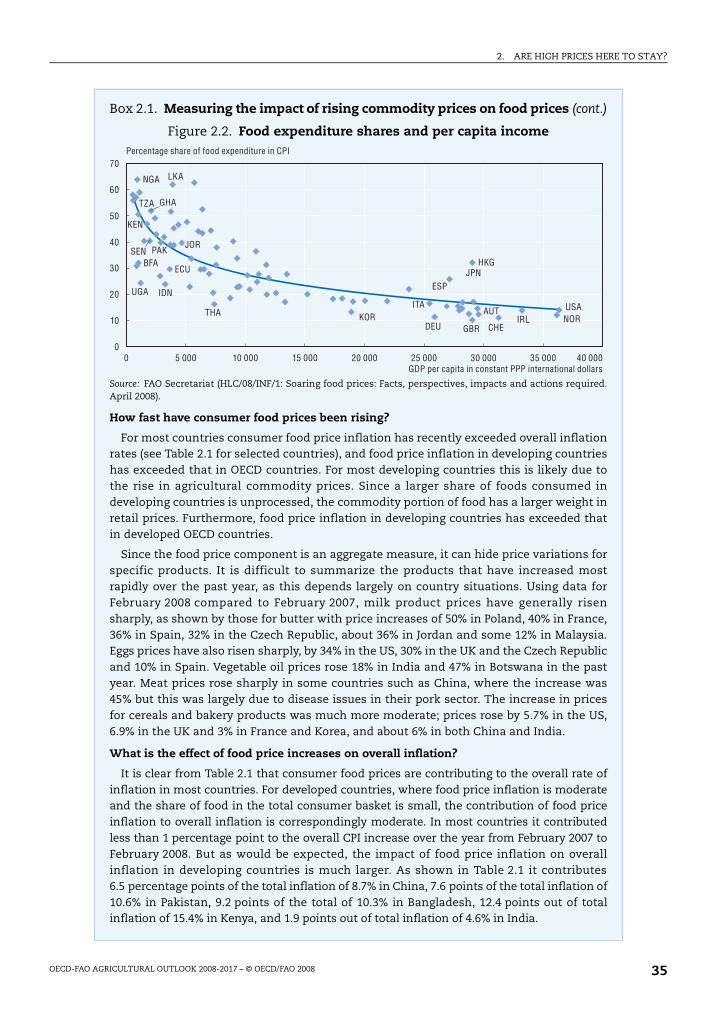
2. ARE HIGH PRICES HERE TO STAY?
OECD-FAO AGRICULTURAL OUTLOOK 2008-2017 – © OECD/FAO 2008 35
Box 2.1. Measuring the impact of rising commodity prices on food prices (cont.)
Figure 2.2. Food expenditure shares and per capita income
Source: FAO Secretariat (HLC/08/INF/1: Soaring food prices: Facts, perspectives, impacts and actions required.April 2008).
How fast have consumer food prices been rising?
For most countries consumer food price inflation has recently exceeded overall inflationrates (see Table 2.1 for selected countries), and food price inflation in developing countrieshas exceeded that in OECD countries. For most developing countries this is likely due tothe rise in agricultural commodity prices. Since a larger share of foods consumed indeveloping countries is unprocessed, the commodity portion of food has a larger weight inretail prices. Furthermore, food price inflation in developing countries has exceeded thatin developed OECD countries.
Since the food price component is an aggregate measure, it can hide price variations forspecific products. It is difficult to summarize the products that have increased mostrapidly over the past year, as this depends largely on country situations. Using data forFebruary 2008 compared to February 2007, milk product prices have generally risensharply, as shown by those for butter with price increases of 50% in Poland, 40% in France,36% in Spain, 32% in the Czech Republic, about 36% in Jordan and some 12% in Malaysia.Eggs prices have also risen sharply, by 34% in the US, 30% in the UK and the Czech Republicand 10% in Spain. Vegetable oil prices rose 18% in India and 47% in Botswana in the pastyear. Meat prices rose sharply in some countries such as China, where the increase was45% but this was largely due to disease issues in their pork sector. The increase in pricesfor cereals and bakery products was much more moderate; prices rose by 5.7% in the US,6.9% in the UK and 3% in France and Korea, and about 6% in both China and India.
What is the effect of food price increases on overall inflation?
It is clear from Table 2.1 that consumer food prices are contributing to the overall rate ofinflation in most countries. For developed countries, where food price inflation is moderateand the share of food in the total consumer basket is small, the contribution of food priceinflation to overall inflation is correspondingly moderate. In most countries it contributedless than 1 percentage point to the overall CPI increase over the year from February 2007 toFebruary 2008. But as would be expected, the impact of food price inflation on overallinflation in developing countries is much larger. As shown in Table 2.1 it contributes6.5 percentage points of the total inflation of 8.7% in China, 7.6 points of the total inflation of10.6% in Pakistan, 9.2 points of the total of 10.3% in Bangladesh, 12.4 points out of totalinflation of 15.4% in Kenya, and 1.9 points out of total inflation of 4.6% in India.
0
10
20
30
40
50
60
70
0 5 000 10 000 15 000 20 000 25 000 30 000 35 000 40 000GDP per capita in constant PPP international dollars
Percentage share of food expenditure in CPI
USANORIRL
CHE
AUT
HKGJPN
ESP
GBR
ITA
DEU
NGA LKA
SEN
THA
IDNUGA
KEN
TZA
PAKJOR
GHA
BFAECU
KOR
Phase2.book Page 35 Monday, May 26, 2008 4:48 PM
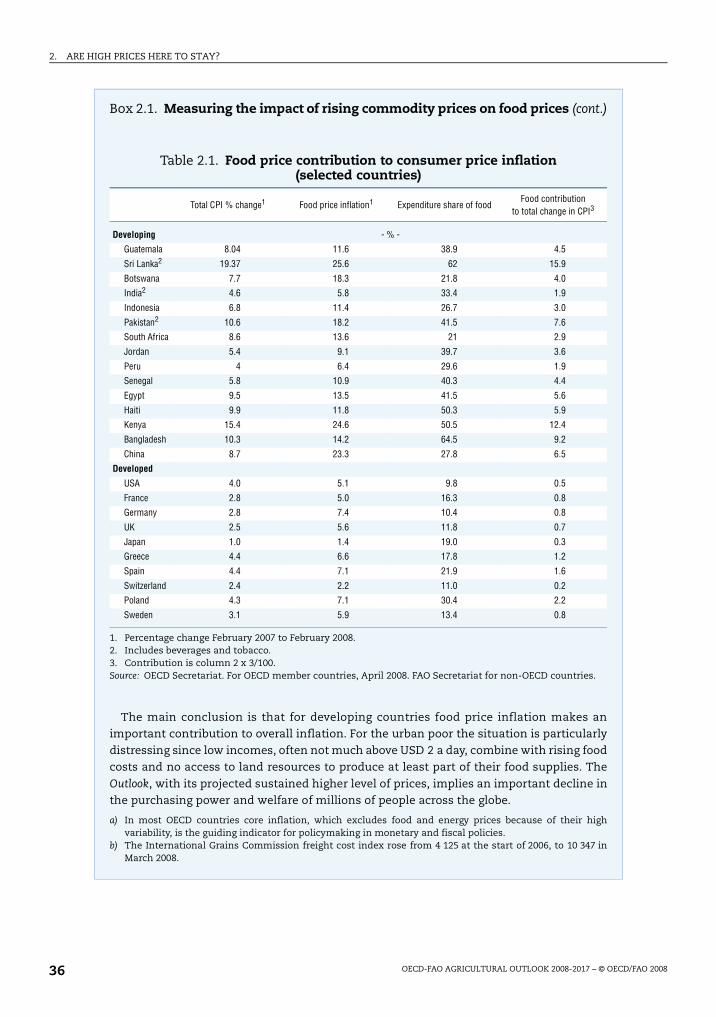
2. ARE HIGH PRICES HERE TO STAY?
OECD-FAO AGRICULTURAL OUTLOOK 2008-2017 – © OECD/FAO 200836
Box 2.1. Measuring the impact of rising commodity prices on food prices (cont.)
The main conclusion is that for developing countries food price inflation makes animportant contribution to overall inflation. For the urban poor the situation is particularlydistressing since low incomes, often not much above USD 2 a day, combine with rising foodcosts and no access to land resources to produce at least part of their food supplies. The
Outlook, with its projected sustained higher level of prices, implies an important decline inthe purchasing power and welfare of millions of people across the globe.
a) In most OECD countries core inflation, which excludes food and energy prices because of their highvariability, is the guiding indicator for policymaking in monetary and fiscal policies.
b) The International Grains Commission freight cost index rose from 4 125 at the start of 2006, to 10 347 inMarch 2008.
Table 2.1. Food price contribution to consumer price inflation (selected countries)
Total CPI % change1 Food price inflation1 Expenditure share of foodFood contribution
to total change in CPI3
Developing - % -
Guatemala 8.04 11.6 38.9 4.5
Sri Lanka2 19.37 25.6 62 15.9
Botswana 7.7 18.3 21.8 4.0
India2 4.6 5.8 33.4 1.9
Indonesia 6.8 11.4 26.7 3.0
Pakistan2 10.6 18.2 41.5 7.6
South Africa 8.6 13.6 21 2.9
Jordan 5.4 9.1 39.7 3.6
Peru 4 6.4 29.6 1.9
Senegal 5.8 10.9 40.3 4.4
Egypt 9.5 13.5 41.5 5.6
Haiti 9.9 11.8 50.3 5.9
Kenya 15.4 24.6 50.5 12.4
Bangladesh 10.3 14.2 64.5 9.2
China 8.7 23.3 27.8 6.5
Developed
USA 4.0 5.1 9.8 0.5
France 2.8 5.0 16.3 0.8
Germany 2.8 7.4 10.4 0.8
UK 2.5 5.6 11.8 0.7
Japan 1.0 1.4 19.0 0.3
Greece 4.4 6.6 17.8 1.2
Spain 4.4 7.1 21.9 1.6
Switzerland 2.4 2.2 11.0 0.2
Poland 4.3 7.1 30.4 2.2
Sweden 3.1 5.9 13.4 0.8
1. Percentage change February 2007 to February 2008.2. Includes beverages and tobacco.3. Contribution is column 2 x 3/100.Source: OECD Secretariat. For OECD member countries, April 2008. FAO Secretariat for non-OECD countries.
Phase2.book Page 36 Monday, May 26, 2008 4:48 PM
2. ARE HIGH PRICES HERE TO STAY?
OECD-FAO AGRICULTURAL OUTLOOK 2008-2017 – © OECD/FAO 2008 37
consumers in poorer segments of the population, in particular those in food-importing
developing countries, where the food bill constitutes a dominant share of total consumerexpenditures.
The causes of the price spike are complex and are attributable to a combination ofmutually reinforcing factors at play in international agricultural markets. The list includes:
droughts in key grain-producing regions; sharply increased biofuel demand for foodcommodities; rising oil prices and a continuing devaluation of the US dollar, the currency
in which indicator prices for the commodities of interest are typically quoted.1 Critically,these supply and demand developments occurred after there had already been a run-down
in stocks, which under more normal circumstances could have dampened pricemovements. Finally, the turmoil in commodity markets has occurred against the backdrop
of a severe world financial crisis that is widely believed to have sparked a substantialincrease in speculative interest in agricultural futures markets (Box 2.2).
Box 2.2. Prices in cash and derivative marketsa
Derivative-markets prices in the US, such as options and futures for wheat, soybeansand maize, are widely quoted as indicative prices and are the focus of much commercialactivity. Long-time participants have been surprised at recent increases and dailychanges – some daily changes in prices in 2008 have been greater than levels of prices afew years ago. New market participants are seen to bring vast amounts of money and some
observers question if they contribute to both the direction and variability of prices in thesemarkets.
A key concern now is the participation of new agents that are perceived to be motivatedby risk-diversification to the exclusion of serious assessment of price levels. Institutionalinvestors are known to be hedging other risk in their portfolios typically by taking long
positions (a commitment to buy) on near-by contracts, as opposed to short positions(commitments to sell). Data relating to the activities of non-commercial traders in the USderivatives markets provides some information about institutional investors’ tradingpatterns and scale.b Total open interest in maize, for example, has increased from0.66 million contracts in February 2005 to 1.45 million February 2008 during which periodnon-commercial traders’ share in opening interest in long positions increased from 17% to
43%. For wheat, contacts increased from 0.22 million to 0.45 million over this period andthe non-commercial traders’ share of opening long interest rose from 28% to 42%. Thepattern for soybeans is similar whereas sugar contract volumes increased over this periodbut non-commercial traders’ share in open long sugar positions remained at about a third.Monthly trading volumes have increased during this period by 85% for maize, 125% forwheat and 56% for soybeans, and by threefold for sugar. Supplemental data from this
source confirm that institutional investors tend to take one-sided (long or buying)positions, and that these entities, along with other non-traditional participants such asbanks, account for a growing share of the market.
Analysis of the role of institutional investors should not be reduced to the level ofcaricature. But a sound strategy for one firm may not be so wisely pursued by all. Theaggregate effect of all their activities may be upward pressure on derivative market prices
in the short term. The jury is still out on the longer term impacts on price levels. Butincreased price volatility seems a plausible result given the volume of these non-commercial investments and given the fact that they may move in and out off commoditytrading as alternative profit opportunities dictate.
Phase2.book Page 37 Monday, May 26, 2008 4:48 PM
2. ARE HIGH PRICES HERE TO STAY?
OECD-FAO AGRICULTURAL OUTLOOK 2008-2017 – © OECD/FAO 200838
The projections contained in this Outlook are based on implicit assumptions
concerning which of the contributory factors are temporary and which are permanent.Further analysis examines how variations in these assumptions affect the robustness of
the view that higher prices, though not as high as today’s levels, are here to stay.
Recent food commodity price hikes in an historical contextThe commodity price spikes witnessed in the last couple of years, and particularly
most recently, are exceptional when viewed from the perspective of the last decade or sobut not so much so when seen in a longer historical context. Figure 2.1 shows the evolution
of annual average world prices of wheat, coarse grains, rice and oilseeds from 1970 to 2007,with projections from 2008 to 2017. Monthly average prices for April 2008 are also included
to indicate most recent developments.2
For each commodity there are two lines, one tracing dollar-denominated nominal
prices and one tracing that same series adjusted for inflation (labelled “real” prices).Nominal price trends are convenient indicators of short-run price developments but to be
economically meaningful, longer-run price trends need to be looked at in inflationadjusted terms. The first thing to notice from these four graphs is that a high degree of
price volatility is characteristic of world food commodity markets, even when one looks atannual averages. Prices are typically sensitive to short run shocks to either supply and
demand because of, e.g., delays between production decisions and output and the resultingslow adjustment of quantities demanded to price changes. Volatility on international
markets is further enhanced by policy interventions that shift price risk away fromproducers or even outside of the country entirely.
The second thing to notice from the data plotted in Figure 2.1 is that the recent pricespike is neither the only, nor even the most important, one to occur in the last 30-plus
years. In inflation adjusted terms, today’s prices fall well short of peaks achieved in theearly 1970s, and neither current maize nor wheat prices are averaging much above levels
achieved as recently as the mid-1990s.
Of course, having weathered previous food commodity price storms does not negate
the need for or the urgency of policy action to deal with this one. However, deciding whichpolicy actions are most appropriate requires an understanding of the various forces driving
recent price moves and knowing which of those various forces may be assumed to betemporary and which are likely to be permanent features of future commodity markets.
Box 2.2. Prices in cash and derivative marketsa (cont.)
Ideally, derivative markets help pool information at low costs to help discover prices andprovide a venue for trading risk. The surge of new moneys invested into commoditymarkets by non-traditional sources is seen by some observers to test the institutionaldesigns of derivative markets and of the link between them and cash markets.
a) The material of this box is based on a contribution by Frank Rose, formerly Senior Vice-President, CBOT,now Assistant Professor, Lewis University.
b) Commitments of Traders Report, Commodity Futures Trading Commission.
Phase2.book Page 38 Monday, May 26, 2008 4:48 PM
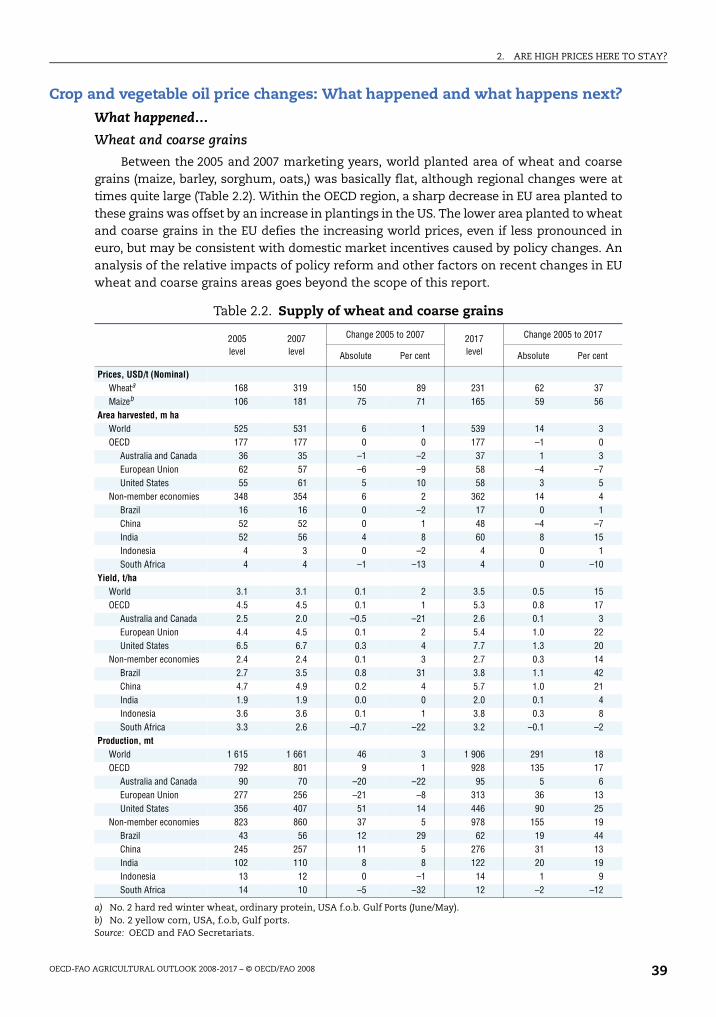
2. ARE HIGH PRICES HERE TO STAY?
OECD-FAO AGRICULTURAL OUTLOOK 2008-2017 – © OECD/FAO 2008 39
Crop and vegetable oil price changes: What happened and what happens next?
What happened…
Wheat and coarse grains
Between the 2005 and 2007 marketing years, world planted area of wheat and coarsegrains (maize, barley, sorghum, oats,) was basically flat, although regional changes were attimes quite large (Table 2.2). Within the OECD region, a sharp decrease in EU area planted tothese grains was offset by an increase in plantings in the US. The lower area planted to wheatand coarse grains in the EU defies the increasing world prices, even if less pronounced ineuro, but may be consistent with domestic market incentives caused by policy changes. Ananalysis of the relative impacts of policy reform and other factors on recent changes in EUwheat and coarse grains areas goes beyond the scope of this report.
Table 2.2. Supply of wheat and coarse grains
2005level
2007level
Change 2005 to 2007 2017level
Change 2005 to 2017
Absolute Per cent Absolute Per cent
Prices, USD/t (Nominal) Wheata 168 319 150 89 231 62 37Maizeb 106 181 75 71 165 59 56
Area harvested, m haWorld 525 531 6 1 539 14 3OECD 177 177 0 0 177 –1 0
Australia and Canada 36 35 –1 –2 37 1 3European Union 62 57 –6 –9 58 –4 –7United States 55 61 5 10 58 3 5
Non-member economies 348 354 6 2 362 14 4Brazil 16 16 0 –2 17 0 1China 52 52 0 1 48 –4 –7India 52 56 4 8 60 8 15Indonesia 4 3 0 –2 4 0 1South Africa 4 4 –1 –13 4 0 –10
Yield, t/haWorld 3.1 3.1 0.1 2 3.5 0.5 15OECD 4.5 4.5 0.1 1 5.3 0.8 17
Australia and Canada 2.5 2.0 –0.5 –21 2.6 0.1 3European Union 4.4 4.5 0.1 2 5.4 1.0 22United States 6.5 6.7 0.3 4 7.7 1.3 20
Non-member economies 2.4 2.4 0.1 3 2.7 0.3 14Brazil 2.7 3.5 0.8 31 3.8 1.1 42China 4.7 4.9 0.2 4 5.7 1.0 21India 1.9 1.9 0.0 0 2.0 0.1 4Indonesia 3.6 3.6 0.1 1 3.8 0.3 8South Africa 3.3 2.6 –0.7 –22 3.2 –0.1 –2
Production, mtWorld 1 615 1 661 46 3 1 906 291 18OECD 792 801 9 1 928 135 17
Australia and Canada 90 70 –20 –22 95 5 6European Union 277 256 –21 –8 313 36 13United States 356 407 51 14 446 90 25
Non-member economies 823 860 37 5 978 155 19Brazil 43 56 12 29 62 19 44China 245 257 11 5 276 31 13India 102 110 8 8 122 20 19Indonesia 13 12 0 –1 14 1 9South Africa 14 10 –5 –32 12 –2 –12
a) No. 2 hard red winter wheat, ordinary protein, USA f.o.b. Gulf Ports (June/May).b) No. 2 yellow corn, USA, f.o.b, Gulf ports.Source: OECD and FAO Secretariats.
Phase2.book Page 39 Monday, May 26, 2008 4:48 PM
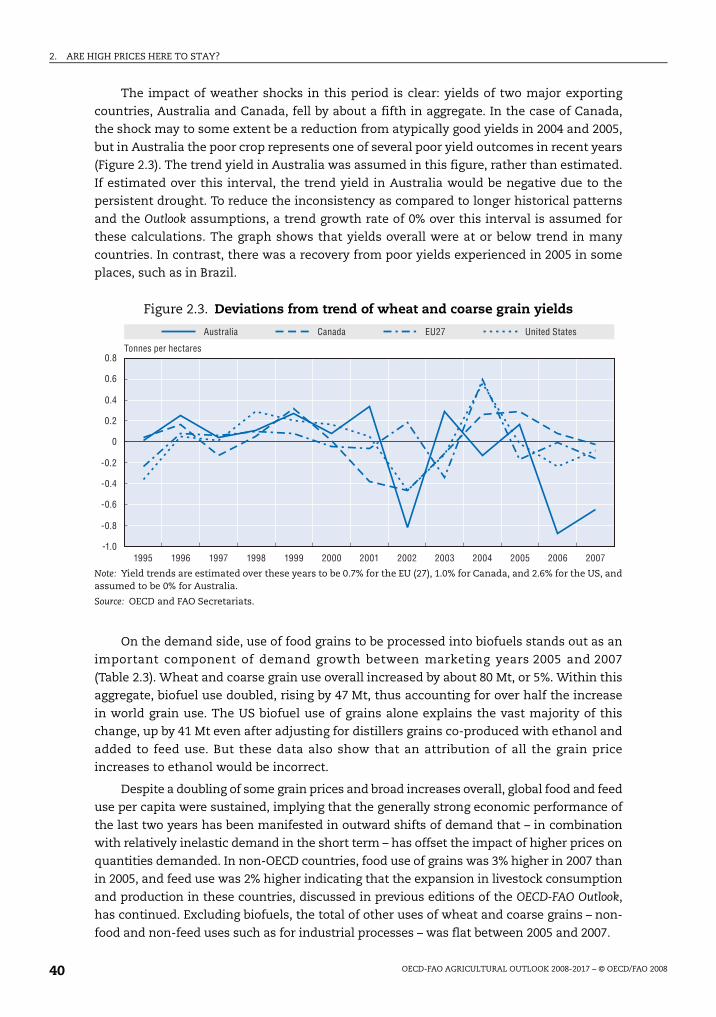
2. ARE HIGH PRICES HERE TO STAY?
OECD-FAO AGRICULTURAL OUTLOOK 2008-2017 – © OECD/FAO 200840
The impact of weather shocks in this period is clear: yields of two major exporting
countries, Australia and Canada, fell by about a fifth in aggregate. In the case of Canada,the shock may to some extent be a reduction from atypically good yields in 2004 and 2005,
but in Australia the poor crop represents one of several poor yield outcomes in recent years(Figure 2.3). The trend yield in Australia was assumed in this figure, rather than estimated.
If estimated over this interval, the trend yield in Australia would be negative due to thepersistent drought. To reduce the inconsistency as compared to longer historical patterns
and the Outlook assumptions, a trend growth rate of 0% over this interval is assumed forthese calculations. The graph shows that yields overall were at or below trend in many
countries. In contrast, there was a recovery from poor yields experienced in 2005 in someplaces, such as in Brazil.
On the demand side, use of food grains to be processed into biofuels stands out as animportant component of demand growth between marketing years 2005 and 2007
(Table 2.3). Wheat and coarse grain use overall increased by about 80 Mt, or 5%. Within thisaggregate, biofuel use doubled, rising by 47 Mt, thus accounting for over half the increase
in world grain use. The US biofuel use of grains alone explains the vast majority of thischange, up by 41 Mt even after adjusting for distillers grains co-produced with ethanol and
added to feed use. But these data also show that an attribution of all the grain priceincreases to ethanol would be incorrect.
Despite a doubling of some grain prices and broad increases overall, global food and feeduse per capita were sustained, implying that the generally strong economic performance of
the last two years has been manifested in outward shifts of demand that – in combinationwith relatively inelastic demand in the short term – has offset the impact of higher prices on
quantities demanded. In non-OECD countries, food use of grains was 3% higher in 2007 thanin 2005, and feed use was 2% higher indicating that the expansion in livestock consumption
and production in these countries, discussed in previous editions of the OECD-FAO Outlook,has continued. Excluding biofuels, the total of other uses of wheat and coarse grains – non-
food and non-feed uses such as for industrial processes – was flat between 2005 and 2007.
Figure 2.3. Deviations from trend of wheat and coarse grain yields
Note: Yield trends are estimated over these years to be 0.7% for the EU (27), 1.0% for Canada, and 2.6% for the US, andassumed to be 0% for Australia.
Source: OECD and FAO Secretariats.
Australia Canada EU27 United States
-1.0
-0.8
-0.6
-0.4
-0.2
0
0.2
0.4
0.6
0.8Tonnes per hectares
1995 1996 1997 1998 1999 2000 2001 2002 2003 2004 2005 2006 2007
Phase2.book Page 40 Monday, May 26, 2008 4:48 PM
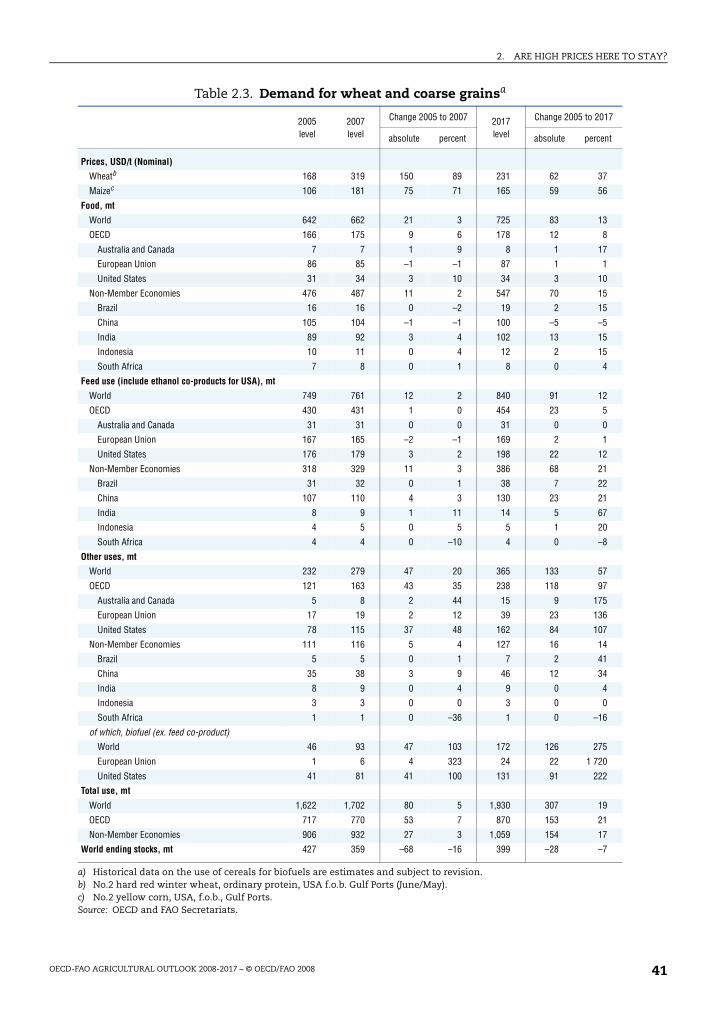
2. ARE HIGH PRICES HERE TO STAY?
OECD-FAO AGRICULTURAL OUTLOOK 2008-2017 – © OECD/FAO 2008 41
Table 2.3. Demand for wheat and coarse grainsa
2005level
2007level
Change 2005 to 2007 2017level
Change 2005 to 2017
absolute percent absolute percent
Prices, USD/t (Nominal)
Wheatb 168 319 150 89 231 62 37
Maizec 106 181 75 71 165 59 56
Food, mt
World 642 662 21 3 725 83 13
OECD 166 175 9 6 178 12 8
Australia and Canada 7 7 1 9 8 1 17
European Union 86 85 –1 –1 87 1 1
United States 31 34 3 10 34 3 10
Non-Member Economies 476 487 11 2 547 70 15
Brazil 16 16 0 –2 19 2 15
China 105 104 –1 –1 100 –5 –5
India 89 92 3 4 102 13 15
Indonesia 10 11 0 4 12 2 15
South Africa 7 8 0 1 8 0 4
Feed use (include ethanol co-products for USA), mt
World 749 761 12 2 840 91 12
OECD 430 431 1 0 454 23 5
Australia and Canada 31 31 0 0 31 0 0
European Union 167 165 –2 –1 169 2 1
United States 176 179 3 2 198 22 12
Non-Member Economies 318 329 11 3 386 68 21
Brazil 31 32 0 1 38 7 22
China 107 110 4 3 130 23 21
India 8 9 1 11 14 5 67
Indonesia 4 5 0 5 5 1 20
South Africa 4 4 0 –10 4 0 –8
Other uses, mt
World 232 279 47 20 365 133 57
OECD 121 163 43 35 238 118 97
Australia and Canada 5 8 2 44 15 9 175
European Union 17 19 2 12 39 23 136
United States 78 115 37 48 162 84 107
Non-Member Economies 111 116 5 4 127 16 14
Brazil 5 5 0 1 7 2 41
China 35 38 3 9 46 12 34
India 8 9 0 4 9 0 4
Indonesia 3 3 0 0 3 0 0
South Africa 1 1 0 –36 1 0 –16
of which, biofuel (ex. feed co-product)World 46 93 47 103 172 126 275
European Union 1 6 4 323 24 22 1 720
United States 41 81 41 100 131 91 222
Total use, mt
World 1,622 1,702 80 5 1,930 307 19
OECD 717 770 53 7 870 153 21
Non-Member Economies 906 932 27 3 1,059 154 17
World ending stocks, mt 427 359 –68 –16 399 –28 –7
a) Historical data on the use of cereals for biofuels are estimates and subject to revision.b) No.2 hard red winter wheat, ordinary protein, USA f.o.b. Gulf Ports (June/May).c) No.2 yellow corn, USA, f.o.b., Gulf Ports.Source: OECD and FAO Secretariats.
Phase2.book Page 41 Monday, May 26, 2008 4:48 PM
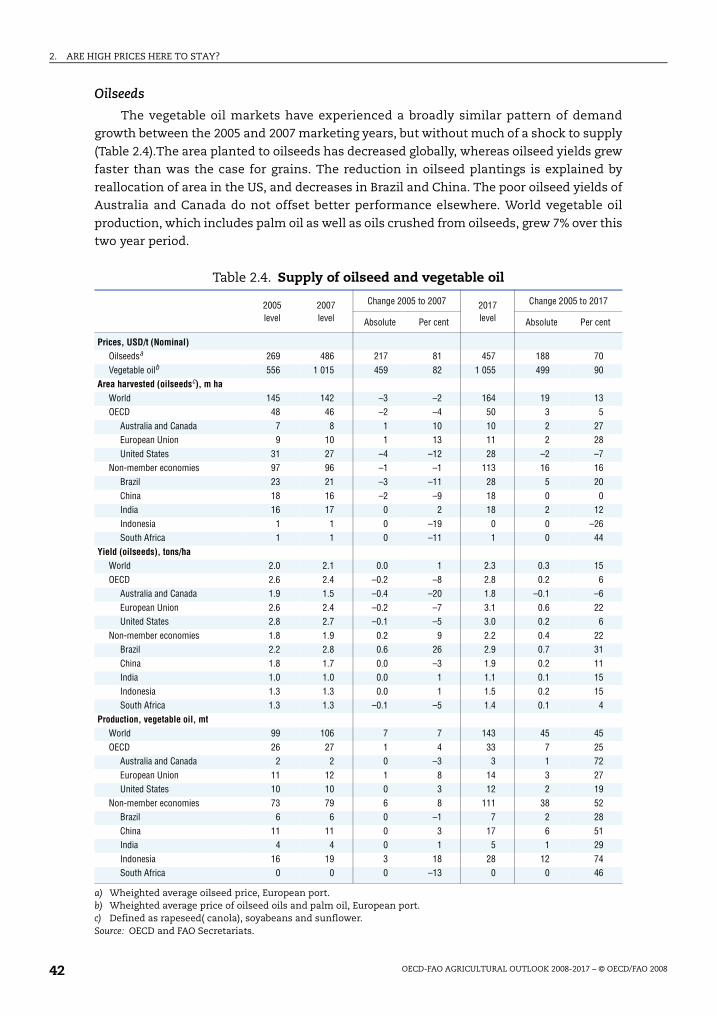
2. ARE HIGH PRICES HERE TO STAY?
OECD-FAO AGRICULTURAL OUTLOOK 2008-2017 – © OECD/FAO 200842
Oilseeds
The vegetable oil markets have experienced a broadly similar pattern of demandgrowth between the 2005 and 2007 marketing years, but without much of a shock to supply
(Table 2.4).The area planted to oilseeds has decreased globally, whereas oilseed yields grewfaster than was the case for grains. The reduction in oilseed plantings is explained by
reallocation of area in the US, and decreases in Brazil and China. The poor oilseed yields ofAustralia and Canada do not offset better performance elsewhere. World vegetable oil
production, which includes palm oil as well as oils crushed from oilseeds, grew 7% over thistwo year period.
Table 2.4. Supply of oilseed and vegetable oil
2005level
2007level
Change 2005 to 2007 2017level
Change 2005 to 2017
Absolute Per cent Absolute Per cent
Prices, USD/t (Nominal)Oilseedsa 269 486 217 81 457 188 70Vegetable oilb 556 1 015 459 82 1 055 499 90
Area harvested (oilseedsc), m haWorld 145 142 –3 –2 164 19 13OECD 48 46 –2 –4 50 3 5
Australia and Canada 7 8 1 10 10 2 27European Union 9 10 1 13 11 2 28United States 31 27 –4 –12 28 –2 –7
Non-member economies 97 96 –1 –1 113 16 16Brazil 23 21 –3 –11 28 5 20China 18 16 –2 –9 18 0 0India 16 17 0 2 18 2 12Indonesia 1 1 0 –19 0 0 –26South Africa 1 1 0 –11 1 0 44
Yield (oilseeds), tons/haWorld 2.0 2.1 0.0 1 2.3 0.3 15OECD 2.6 2.4 –0.2 –8 2.8 0.2 6
Australia and Canada 1.9 1.5 –0.4 –20 1.8 –0.1 –6European Union 2.6 2.4 –0.2 –7 3.1 0.6 22United States 2.8 2.7 –0.1 –5 3.0 0.2 6
Non-member economies 1.8 1.9 0.2 9 2.2 0.4 22Brazil 2.2 2.8 0.6 26 2.9 0.7 31China 1.8 1.7 0.0 –3 1.9 0.2 11India 1.0 1.0 0.0 1 1.1 0.1 15Indonesia 1.3 1.3 0.0 1 1.5 0.2 15South Africa 1.3 1.3 –0.1 –5 1.4 0.1 4
Production, vegetable oil, mtWorld 99 106 7 7 143 45 45OECD 26 27 1 4 33 7 25
Australia and Canada 2 2 0 –3 3 1 72European Union 11 12 1 8 14 3 27United States 10 10 0 3 12 2 19
Non-member economies 73 79 6 8 111 38 52Brazil 6 6 0 –1 7 2 28China 11 11 0 3 17 6 51India 4 4 0 1 5 1 29Indonesia 16 19 3 18 28 12 74South Africa 0 0 0 –13 0 0 46
a) Wheighted average oilseed price, European port.b) Wheighted average price of oilseed oils and palm oil, European port.c) Defined as rapeseed( canola), soyabeans and sunflower.Source: OECD and FAO Secretariats.
Phase2.book Page 42 Monday, May 26, 2008 4:48 PM
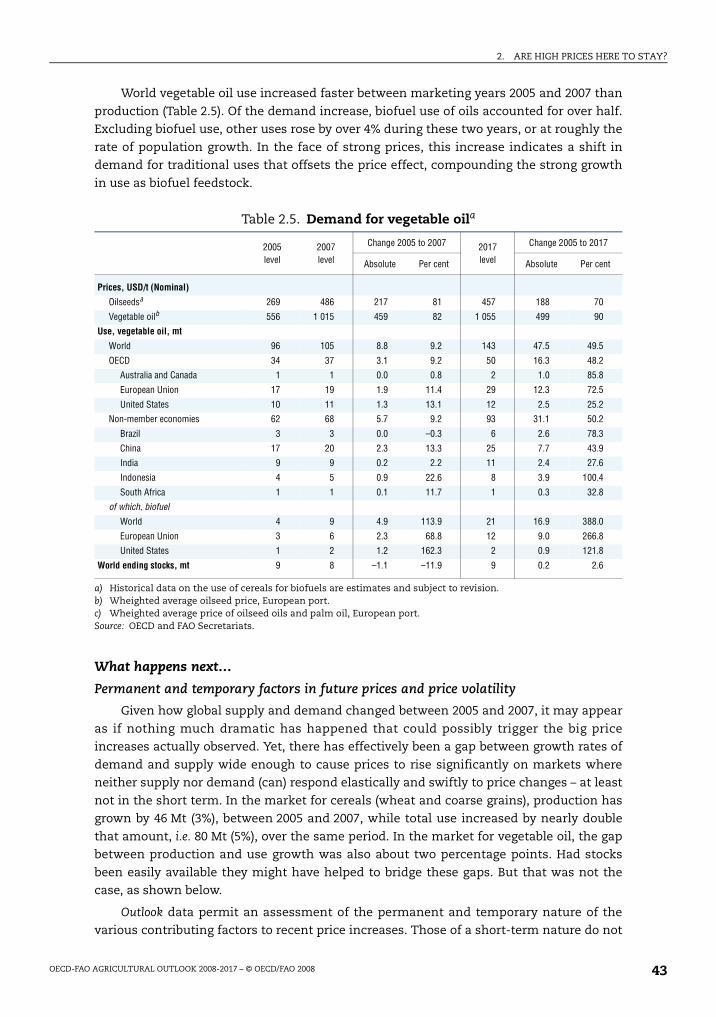
2. ARE HIGH PRICES HERE TO STAY?
OECD-FAO AGRICULTURAL OUTLOOK 2008-2017 – © OECD/FAO 2008 43
World vegetable oil use increased faster between marketing years 2005 and 2007 than
production (Table 2.5). Of the demand increase, biofuel use of oils accounted for over half.Excluding biofuel use, other uses rose by over 4% during these two years, or at roughly the
rate of population growth. In the face of strong prices, this increase indicates a shift indemand for traditional uses that offsets the price effect, compounding the strong growth
in use as biofuel feedstock.
What happens next…
Permanent and temporary factors in future prices and price volatility
Given how global supply and demand changed between 2005 and 2007, it may appear
as if nothing much dramatic has happened that could possibly trigger the big priceincreases actually observed. Yet, there has effectively been a gap between growth rates of
demand and supply wide enough to cause prices to rise significantly on markets whereneither supply nor demand (can) respond elastically and swiftly to price changes – at least
not in the short term. In the market for cereals (wheat and coarse grains), production hasgrown by 46 Mt (3%), between 2005 and 2007, while total use increased by nearly double
that amount, i.e. 80 Mt (5%), over the same period. In the market for vegetable oil, the gapbetween production and use growth was also about two percentage points. Had stocks
been easily available they might have helped to bridge these gaps. But that was not thecase, as shown below.
Outlook data permit an assessment of the permanent and temporary nature of thevarious contributing factors to recent price increases. Those of a short-term nature do not
Table 2.5. Demand for vegetable oila
2005level
2007level
Change 2005 to 2007 2017level
Change 2005 to 2017
Absolute Per cent Absolute Per cent
Prices, USD/t (Nominal)
Oilseedsa 269 486 217 81 457 188 70
Vegetable oilb 556 1 015 459 82 1 055 499 90
Use, vegetable oil, mt
World 96 105 8.8 9.2 143 47.5 49.5
OECD 34 37 3.1 9.2 50 16.3 48.2
Australia and Canada 1 1 0.0 0.8 2 1.0 85.8
European Union 17 19 1.9 11.4 29 12.3 72.5
United States 10 11 1.3 13.1 12 2.5 25.2
Non-member economies 62 68 5.7 9.2 93 31.1 50.2
Brazil 3 3 0.0 –0.3 6 2.6 78.3
China 17 20 2.3 13.3 25 7.7 43.9
India 9 9 0.2 2.2 11 2.4 27.6
Indonesia 4 5 0.9 22.6 8 3.9 100.4
South Africa 1 1 0.1 11.7 1 0.3 32.8
of which, biofuel
World 4 9 4.9 113.9 21 16.9 388.0
European Union 3 6 2.3 68.8 12 9.0 266.8
United States 1 2 1.2 162.3 2 0.9 121.8
World ending stocks, mt 9 8 –1.1 –11.9 9 0.2 2.6
a) Historical data on the use of cereals for biofuels are estimates and subject to revision.b) Wheighted average oilseed price, European port.c) Wheighted average price of oilseed oils and palm oil, European port.Source: OECD and FAO Secretariats.
Phase2.book Page 43 Monday, May 26, 2008 4:48 PM
2. ARE HIGH PRICES HERE TO STAY?
OECD-FAO AGRICULTURAL OUTLOOK 2008-2017 – © OECD/FAO 200844
affect future prices as in the Outlook they are not assumed to recur. But the permanent
factors are expected to influence the level and trends of future prices.
Recent negative yield shocks in key agricultural commodity-producing regions have
contributed to the price increase. This particular phenomenon can be viewed as temporary
in the Outlook, barring underlying climate change or water constraints that lead to
permanent reductions in yield.
Macroeconomic conditions have favoured higher world prices. Good economic growth
increased purchasing power in most countries during the recent past, leading to strongdemand growth for most agricultural commodities. Moreover, a weak USD typically leads to
higher USD-denominated prices of traded goods, as they will not be as expensive when pricedin other currencies – although prices of most commodities in most currencies are more
expensive than two years ago. This factor is assumed to be permanent in the Outlook. These arenot new factors, however, and, certainly GDP growth in developing countries has been a
feature of commodity markets for many years. These factors should be considered to slow the
decline in real prices in the future, not to lift average prices to permanently higher levels.
The oil price, and energy prices more generally, are important contributing factors to therecent increase in agricultural commodity prices. While the effects of higher oil prices on
biofuel demand may be the focus of discussion, traditional effects of energy prices, namelyon costs of commodity production and on costs of transportation, processing, distribution
and marketing intermediate and final products, are also important. In any case, the Outlook
assumptions reflect the widely held belief that the oil price increases are permanent and that
further gradual increases are likely. Higher oil prices result in a structural increase inagricultural production costs and contribute to lifting future prices to higher average levels.
Available data suggest that somewhat more than half of the increase in the quantityof demand for grains and vegetable oils between 2005 and 2007 was due to biofuels. Based
on Outlook assumptions of further modest increases in the price of oil, continuation ofpolicies that support for biofuel production and use and no dramatic technology change,
feedstock demand for biofuel production appears to represent a permanent factor. Whilebiofuel use of grains and vegetable oils is anticipated to represent a falling share of the
overall increase in demand for these food commodities, it is nevertheless a new source ofdemand which is seen as one of the factors lifting prices to higher average levels in the future.
Stocks of wheat, coarse grains and vegetable oil have fallen to low levels relative to use
(Figure 2.4), reducing the buffer against shocks in supply and demand. This has been onereason for the recent run-up in prices. During the 10-year outlook period stocks are
projected to remain low, implying that tight markets are a permanent factor in the Outlook.This should not lead to permanently higher prices but certainly provides the background
for more price volatility in the future.
There has recently also been a surge of new moneys invested into futures commodity
markets from non-traditional sources. The long-term aggregate effect of these activities onthe level of derivative market prices and related prices in cash markets is still very
uncertain. Adjustment in market procedures and participants’ behaviour argue that anyeffect on price levels will prove temporary relative to the 10-year Outlook. As these funds are
very large, however, and can and will move rapidly in and out of commodity markets asprofit opportunities dictate, this development may well be a new and permanent element in
future price volatility (Box 2.2).
Phase2.book Page 44 Monday, May 26, 2008 4:48 PM
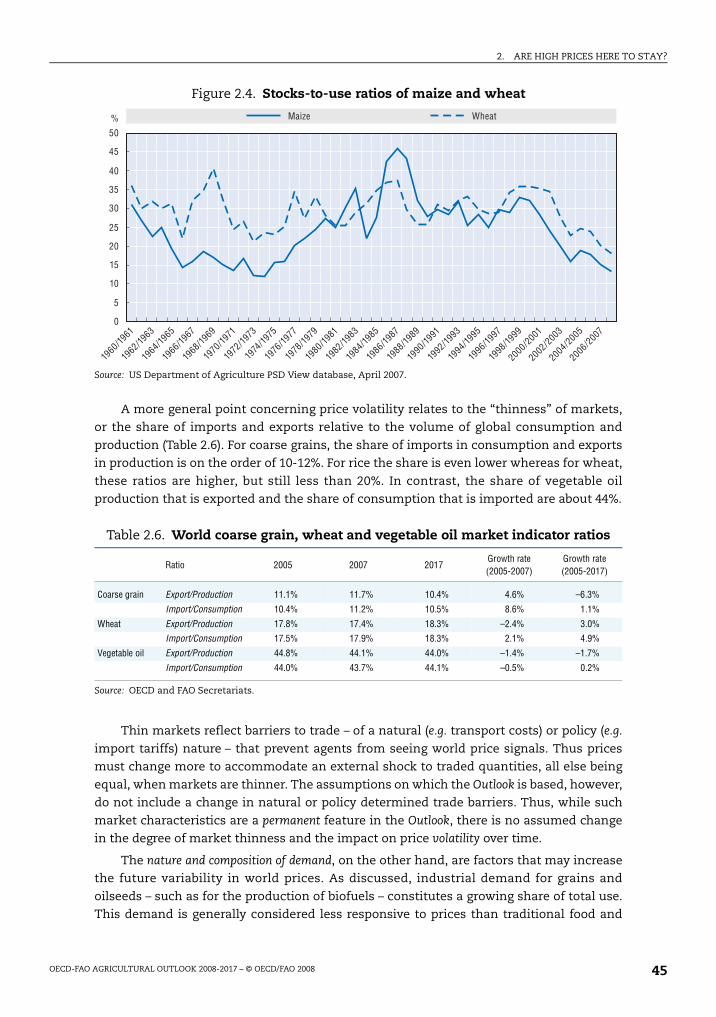
2. ARE HIGH PRICES HERE TO STAY?
OECD-FAO AGRICULTURAL OUTLOOK 2008-2017 – © OECD/FAO 2008 45
A more general point concerning price volatility relates to the “thinness” of markets,or the share of imports and exports relative to the volume of global consumption and
production (Table 2.6). For coarse grains, the share of imports in consumption and exportsin production is on the order of 10-12%. For rice the share is even lower whereas for wheat,
these ratios are higher, but still less than 20%. In contrast, the share of vegetable oilproduction that is exported and the share of consumption that is imported are about 44%.
Thin markets reflect barriers to trade – of a natural (e.g. transport costs) or policy (e.g.
import tariffs) nature – that prevent agents from seeing world price signals. Thus pricesmust change more to accommodate an external shock to traded quantities, all else being
equal, when markets are thinner. The assumptions on which the Outlook is based, however,do not include a change in natural or policy determined trade barriers. Thus, while such
market characteristics are a permanent feature in the Outlook, there is no assumed changein the degree of market thinness and the impact on price volatility over time.
The nature and composition of demand, on the other hand, are factors that may increasethe future variability in world prices. As discussed, industrial demand for grains and
oilseeds – such as for the production of biofuels – constitutes a growing share of total use.This demand is generally considered less responsive to prices than traditional food and
Figure 2.4. Stocks-to-use ratios of maize and wheat
Source: US Department of Agriculture PSD View database, April 2007.
Table 2.6. World coarse grain, wheat and vegetable oil market indicator ratios
Ratio 2005 2007 2017Growth rate (2005-2007)
Growth rate (2005-2017)
Coarse grain Export/Production 11.1% 11.7% 10.4% 4.6% –6.3%
Import/Consumption 10.4% 11.2% 10.5% 8.6% 1.1%
Wheat Export/Production 17.8% 17.4% 18.3% –2.4% 3.0%
Import/Consumption 17.5% 17.9% 18.3% 2.1% 4.9%
Vegetable oil Export/Production 44.8% 44.1% 44.0% –1.4% –1.7%
Import/Consumption 44.0% 43.7% 44.1% –0.5% 0.2%
Source: OECD and FAO Secretariats.
% Maize Wheat
0
5
10
15
20
25
30
35
40
45
50
1960/19
61
1962
/1963
1964/19
65
1966/19
67
1968/19
69
1970
/1971
1972
/1973
1974
/1975
1976
/1977
1978
/1979
1980/19
81
1982
/1983
1984/19
85
1986/19
87
1988/19
89
1990/19
91
1992/19
93
1994/19
95
1996/19
97
1998/19
99
2000/20
01
2002/20
03
2004/20
05
2006/20
07
Phase2.book Page 45 Monday, May 26, 2008 4:48 PM
2. ARE HIGH PRICES HERE TO STAY?
OECD-FAO AGRICULTURAL OUTLOOK 2008-2017 – © OECD/FAO 200846
feed demand. In addition, food demand elasticities may be further reduced by rising
incomes and more sophisticated food supply chains. Such changes are permanent elementsin the Outlook that may lead to greater volatility in future world prices (Box 2.3).
Box 2.3. How income growth affects commodity demand
Income growth has been strong and widespread in recent years, despite a slowdown ofthe US economy and some cases of poor economic performance. The consequence ishigher per capita income in many countries, including many non-OECD countries.Previous Outlook reports emphasized that rising incomes are associated with greaterdemand for food and a shift in the composition of food demand towards livestock
products, namely meats and dairy goods as well as fruits and vegetables, and away fromstaple crops. But they may also have other implications: less elastic demand, and new linksfrom energy prices to commodity and food markets.
Income growth tends to be simultaneous with urbanization. Many countries with thegreatest growth rate are also experiencing migration from rural areas to cities. As peoplemove away from rural centres of food production and as they rely more on the
infrastructure of countries and cities to deliver foods to their area, the marketing chainbetween commodity production and food consumption adapts. These changes may lead tolonger transportation, refrigeration, and other activities whose costs vary with energyprices, as well as wages and other costs that may themselves be affected indirectly byenergy prices. In short, food prices increasingly depend on oil and energy pricesindependently of commodity prices as income rises.
The share of commodity price in food price may also decrease as the marketing chainlengthens. In the US, the commodity cost component of the total food bill has fallen fromabout one-third in the 1960s to about one-fifth since the mid-1990s.a As the share ofcommodity costs in the food bill falls, the expected proportional change in food prices fora given percentage change in commodity costs decrease: a doubling of commodity prices
will have a greater effect on final food consumers if commodity costs initially alreadyaccounted for almost all of the food costs, whereas a similar doubling of commodity priceswould have a smaller proportional effect for food consumers if the commodity costs wereonly a small fraction of the total food bill. Thus, as income increases and market chainsextend, the responsiveness of demand to farm-level prices may decrease.
Economics of demand indicate that consumers tend to care less about prices of goods
that represent a small share of their budget. As incomes expand and the share of budgetsspent on a necessity like food fall, consumers are expected to be somewhat less sensitiveto price changes, and a shock to supply of a given size will require a greater price signal tocompel consumers to adjust their purchases. Higher incomes that tend to reduce demandelasticity may lead to greater variability in world prices.
This has certain implications. Greater income and purchasing power leading to less
sensitivity to prices means that fewer people are pushed into starvation by rising prices.But people who have not enjoyed anything like the average income growth rate will facemore variability in prices, including higher peaks, without the additional purchasingpower, and these groups will be worse off than before. Thus, higher food prices strainbudgets of the poor, even if food is still purchased.
a) US Economic Research Service (www.ers.usda.gov/data/FarmToConsumer/marketingbill.htm).
Phase2.book Page 46 Monday, May 26, 2008 4:48 PM
2. ARE HIGH PRICES HERE TO STAY?
OECD-FAO AGRICULTURAL OUTLOOK 2008-2017 – © OECD/FAO 2008 47
Wheat and coarse grains
The inventory of short-term and permanent factors and how these may affect futureprices helps to disentangle what may happen next in cereals and oilseed markets. Looking
ahead to marketing year 2017, the end of the Outlook period, wheat and maize prices areexpected to remain higher than in 2005, but not as high as in 2007. Area is not expected to
be a main source of new production, although some increase is expected. There is likely tobe a geographic reorientation of sorts, as the US focuses on grains and the EU on oilseeds
and the total area planted to wheat and coarse grains in the EU decreases. On a world scalewheat and coarse grain area is expected to increase some, but certainly not dramatically
despite the higher level of prices as compared to 2005. Yields are expected to grow alonghistorical trend patterns, but this assumption obscures two important caveats discussed
below: weather-related yield shocks will certainly occur, and the effect of higher prices onyields is unclear.
Demand for these grains to be used as feedstocks in biofuel production is not expected
to continue to expand at the rate of the last two years.3 However, cereal use for biofuelproduction is projected nearly to double from 2007 to 2017, though its share of the overall
increase in quantities of wheat and coarse grains used is expected to fall from about 60%to just over 40%. The US is likely to continue to be the centre of grain-based ethanol
production, assuming no new technologies displace current practices, but use in the EU islikely to expand, too. The larger part of the growth in use is explained by rising food and
feed demand particularly in non-OECD countries, where both categories rise by 15% onaverage or more whereas OECD food and feed uses increase at a lower rate. The assumed
continuation of strong economic growth of recent years underlies these shifts in graindemand.
Oilseeds
The baseline previews a strong vegetable oil price even as by 2017 oilseed prices (andoilseed meal prices) are expected to retreat from recent levels. The higher prices of 2007
bring about a supply response that results in more land allocated to this sector and goodyield growth. Area planted to oilseeds is expected to increase over the period, with some
growth in the OECD area, apart from the US, and strong growth should be seen in non-OECD countries. A large share of this growth is expected to take place in Brazil and
Argentina, but oilseed area will expand in Ukraine and Russia, too. During the projectionperiod, yield grows on average at the historical trend rate. Palm-oil production is expected
to grow quickly, increasing by two-fifths between 2007 and 2017.
Biofuel use of vegetable oils accounts for more than a third of the growth in vegetable
oil use from 2005 to 2017. This is very strong growth in percentage terms, as world biofueluse increases more than five-fold from the very small base in 2005. But the growth in other
uses amounts to an increase of about 33% over this period as well. These consumptionincreases worldwide take place at a nearly constant real world price, and while growth
rates vary widely, they are indicative of strengthening demand. Income growth drivesmuch of this expansion of demand, with non-OECD countries increasing their
consumption of vegetable oils by half in 2017 relative to 2005.
Phase2.book Page 47 Monday, May 26, 2008 4:48 PM
2. ARE HIGH PRICES HERE TO STAY?
OECD-FAO AGRICULTURAL OUTLOOK 2008-2017 – © OECD/FAO 200848
UncertaintiesThe foregoing paragraphs provided a discussion of the baseline results for cereals and
oilseeds prices over the Outlook period. Based on the projected developments in supply anddemand for these commodities, prices are expected to remain strong, albeit not as high as
what they currently are. But these outcomes reflect the assumptions underlying theprojections, and whether or not these assumptions become reality is uncertain. Some of
these uncertainties are first discussed qualitatively in the following paragraphs. The nextsection shows what the quantitative impact of some of these factors may be.
Commodity market volatility will continue, and the direction of changes is uncertain.The fact that prices currently are at historic peak levels does not mean that swings in the
other direction should be excluded. In the short term, low stocks-to-use ratios may lead togreater price movements for a given shock, either up or down. Higher income in most of
the world may lead not only to greater demand and a change in the composition ofdemand, but also to lower responsiveness of demand to price changes. Thin markets with
few stocks and increasingly inelastic components of total demand experience greater pricevolatility.
There will be shocks to yields and to macroeconomic conditions, including oil prices, thatincrease or decrease world prices. Crop harvests fail. Recent history abounds with
predictions of constant strong economic growth of a country into the future that have beenwide off the mark and a reduction in income leads to lower demand. Widespread
expectations of climate change lead to predictions of declining yields, and diminishingwater supplies lead to predictions of abandoned areas. Systemic and massive shocks are
often assumed to be negative. But there are also “risks” in the opposite direction. Goodweather can lead to exceptional yields, additional investments and technological
breakthroughs may improve yields more than expected, and economic growth can beatpredictions.
Policy response to the price situation is also an unknown. In response to concernsabout domestic prices, will more countries use trade policiesor domestic market interventions
in order to reduce the increases in their domestic prices? If countries insulate theirdomestic market from world prices through beggar-thy-neighbour policies, then world
prices will rise even further before the remaining countries that are paying or receivingthese prices adjust quantities of demand and supply so that markets balance. There is also
some uncertainty regarding future agricultural policies. For instance, there is the potential
for another world trade agreement and there are scheduled policy decisions, such as the USfarm bill that is pending at the time of writing or the ‘health check’ of the CAP to be
undertaken by the EU. Environmental policy continues to be a source of uncertainty.Producers in many key exporting countries meet standards that are intended to encourage
sustainable practices. Environmental policies introduced to address potential climatechange, e.g., carbon taxes or credits, could lead to rapid changes in the profitability of
farmland use and practices.
Biofuel policies are also a source of uncertainty. By the time of this publication, the
representation of key biofuel policies in some countries is already out of date in thisOutlook. An array of new US mandates and the potential consequences of an EU Directive
promoting larger quantities of biofuel use are not included. These or other policies topromote biofuel production and use, whether through mandate or subsidy, will lead to
greater purchases of feedstocks for biofuel production. Alternatively, of course, if policies
Phase2.book Page 48 Monday, May 26, 2008 4:48 PM
2. ARE HIGH PRICES HERE TO STAY?
OECD-FAO AGRICULTURAL OUTLOOK 2008-2017 – © OECD/FAO 2008 49
to support biofuel use and production are deferred, waived, or overwritten with lesser
efforts, then feedstock purchases will decline, reducing average prices in the future belowthe projections in this report.
Feedstock purchases may differ radically from current and projected patterns if new
biofuel production technologies become viable, through whatever combination of commercial
profit and subsidy. New processes that generate biofuels from feedstocks that do notdirectly compete with existing commercial crops, or are even co-products of such crops,
could lead to a departure from the Outlook, possibly a fairly radical one. But such apossibility is explored elsewhere by the OECD, as it raises complicated questions that defy
cursory analysis.
A key question is the long-run capacity of supply. One argument reiterates messages of
climate change and water overuse, suggests that yields are peaking, and sees little scopefor further supplies. Another argument emphasizes the potential of human innovation to
continue or even quicken yield trends, particularly when motivated by a high price, and theunrealized potential of countries that are still in stages of development that are associated
with low productivity. The Outlook is not the place to look for answers to these arguments.Neither is it a place to look for unconditional support for either case. Here, historical trends
in technology growth are assumed to continue into the medium-term future.
More generally, high prices are their own worst enemy. Price increases lead to supply and
demand responses, which lead to lower prices. A high price spurs producers to find newmeans of raising output, and encourages consumers to choose alternatives or to use goods
more effectively. It may take time to introduce extreme changes, such as new processes ofmaking a good, using a good for intermediate processing, introducing substitute goods or
adjusting lifestyles. The scale and delay of such responses to high prices are uncertain, butthat agents will respond in ways that work against sustained price increases is certain.
How important are the Outlook assumptions in determining future prices?After having argued qualitatively the impacts of a number of factors with uncertain
outcomes on the level and variability of prices, the discussion below tries to quantify some
of these effects. The recent spikes in food commodity prices surprised most economicforecasters, reminding us of the inherent vulnerability of projections to unanticipated
developments. The baseline assumptions of normal weather and stable economicperformance are necessary, but the future will not follow that smooth path. Negative and
positive yield shocks are a permanent feature of agricultural commodity markets. So, too,are macroeconomic shocks that reduce or raise income, alter exchange rates, and induce
or limit inflation. Similarly there is growing discussion over whether governments willcontinue to subsidise the conversion of food commodities to biofuel production with the
same enthusiasm as during recent years.
To give some idea of the sensitivity of the baseline to alternative assumptions
regarding these factors, the economic model underlying those projections was used toperform sensitivity analysis. Two kinds of simulations were performed. In one, five
versions of the baseline were simply reproduced, progressively replacing originalassumptions about key determining variables with plausible alternative values. In the
second, a stochastic simulation was undertaken wherein the assumptions of normalweather and a stable macroeconomic environment are replaced by a range of plausible
yield values and macroeconomic variables.
Phase2.book Page 49 Monday, May 26, 2008 4:48 PM
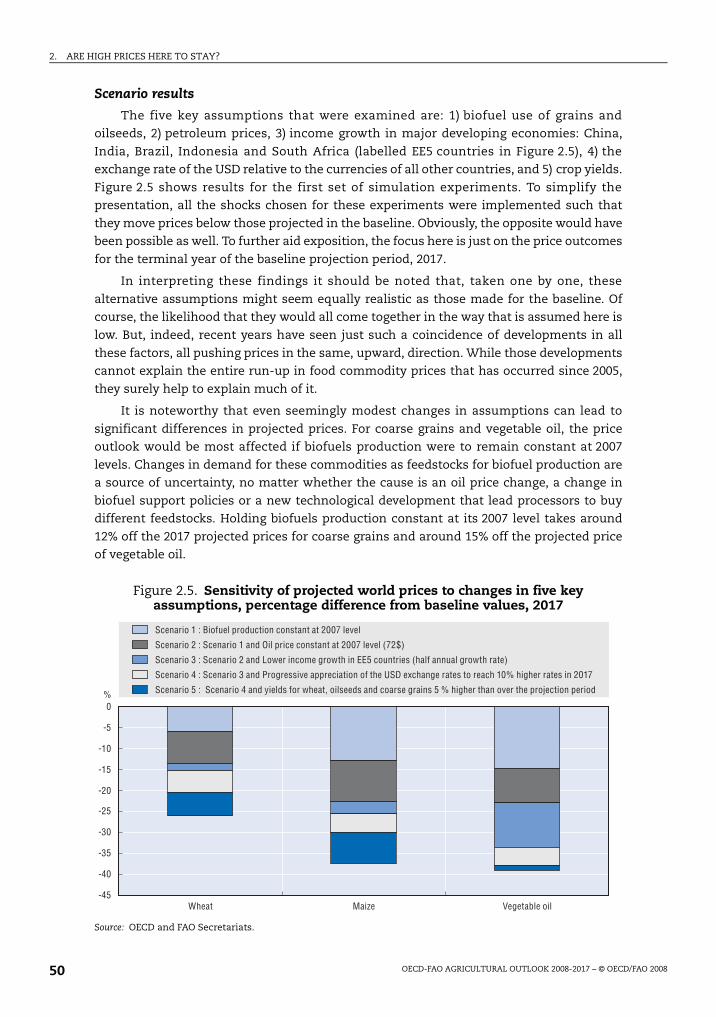
2. ARE HIGH PRICES HERE TO STAY?
OECD-FAO AGRICULTURAL OUTLOOK 2008-2017 – © OECD/FAO 200850
Scenario results
The five key assumptions that were examined are: 1) biofuel use of grains andoilseeds, 2) petroleum prices, 3) income growth in major developing economies: China,
India, Brazil, Indonesia and South Africa (labelled EE5 countries in Figure 2.5), 4) theexchange rate of the USD relative to the currencies of all other countries, and 5) crop yields.
Figure 2.5 shows results for the first set of simulation experiments. To simplify thepresentation, all the shocks chosen for these experiments were implemented such that
they move prices below those projected in the baseline. Obviously, the opposite would havebeen possible as well. To further aid exposition, the focus here is just on the price outcomes
for the terminal year of the baseline projection period, 2017.
In interpreting these findings it should be noted that, taken one by one, these
alternative assumptions might seem equally realistic as those made for the baseline. Ofcourse, the likelihood that they would all come together in the way that is assumed here is
low. But, indeed, recent years have seen just such a coincidence of developments in all
these factors, all pushing prices in the same, upward, direction. While those developmentscannot explain the entire run-up in food commodity prices that has occurred since 2005,
they surely help to explain much of it.
It is noteworthy that even seemingly modest changes in assumptions can lead to
significant differences in projected prices. For coarse grains and vegetable oil, the priceoutlook would be most affected if biofuels production were to remain constant at 2007
levels. Changes in demand for these commodities as feedstocks for biofuel production area source of uncertainty, no matter whether the cause is an oil price change, a change in
biofuel support policies or a new technological development that lead processors to buydifferent feedstocks. Holding biofuels production constant at its 2007 level takes around
12% off the 2017 projected prices for coarse grains and around 15% off the projected priceof vegetable oil.
Figure 2.5. Sensitivity of projected world prices to changes in five key assumptions, percentage difference from baseline values, 2017
Source: OECD and FAO Secretariats.
Scenario 1 : Biofuel production constant at 2007 level
Scenario 2 : Scenario 1 and Oil price constant at 2007 level (72$)
Scenario 3 : Scenario 2 and Lower income growth in EE5 countries (half annual growth rate)
Scenario 4 : Scenario 3 and Progressive appreciation of the USD exchange rates to reach 10% higher rates in 2017
Scenario 5 : Scenario 4 and yields for wheat, oilseeds and coarse grains 5 % higher than over the projection period
Wheat Maize Vegetable oil-45
-40
-35
-30
-25
-20
-15
-10
-5
0%
Phase2.book Page 50 Monday, May 26, 2008 4:48 PM
2. ARE HIGH PRICES HERE TO STAY?
OECD-FAO AGRICULTURAL OUTLOOK 2008-2017 – © OECD/FAO 2008 51
The second scenario shows that wheat, coarse grains and vegetable oil price
projections are all shown to be highly sensitive to petroleum-price assumptions. Thissheds light on the important role that the recent sharp escalation in crude oil prices is
playing in driving up food commodity costs. This single external factor not only is acrucially important feature of the macroeconomic context but also directly affects the
energy costs of agricultural production, transportation, and food processing. Manycountries tend to have better economic growth if the oil price is low, but others benefit
from a high oil price. Under the constant oil price assumption, the prices of maize andvegetable oil are about 10% lower and the wheat price falls 7% in 2017 when compared with
the baseline projection.
GDP growth in developing countries is a source of recent increases in demand that
many observers take to be a permanent feature of the medium-term future. Trend-lineextrapolations of 8-10% GDP growth in a country that are extended into the indefinite
future beg the question: when will this growth stop? The sensitivity of prices to increasesin GDP is tested with respect to the hypothetical case where the rate of growth in GDP is
reduced to half the rate assumed in the Outlook. This scenario gives wheat and coarsegrains prices that are only modestly (1 to 2%) below the baseline. For vegetable oils,
reflecting presumably a much higher income elasticity of the demand and a greaterinfluence of EE5 countries in world trade, the simulated price difference is over 10%.
These results may be less surprising than they seem on first sight. First, whileEE5 countries are rapid growth markets for wheat and coarse grains, they are still relatively
small players in world trade. This is not the case for vegetable oils, where China and Indiaare very large importers and where lower GDP growth has a substantial world price effect.
Second, this scenario does not take account of any second-round effects that lower incomegrowth in EE5 countries may have on economic growth elsewhere. So there may be some
downward bias to the outcomes presented here.
A fourth scenario was defined to simulate the results of a stronger US dollar. Thus,
USD exchange rates were progressively appreciated to reach rates in 2017 some 10% higherthan was assumed for the baseline. A stronger US dollar raises prices in domestic currency
terms in exporting countries, providing greater incentives to increase supplies. At the sametime, a stronger US dollar reduces the import demand in importing countries. The
combination of greater export supply and weaker import demand puts additionaldownward pressure on world prices. By 2017, wheat, coarse grain and vegetable oil prices
are all some 5% below the corresponding baseline projection.
The scenario under which cereals and oilseeds yields are assumed to be 5% higherleads to projected wheat and maize prices for 2017 that are 6 and 8% lower respectively
than the corresponding baseline value, but make little difference for projected vegetable oilprices. Yield trends are a source of great uncertainty. Some observers see constraints to
agricultural productivity owing to vanishing water resources and even greater potentialconstraints to agricultural production as a consequence of global warming. Global
warming is argued to lead directly to greater incidence of negative yield shocks andsustained negative pressure on production in heat stressed climatic zones. But yields may
actually increase in regions with moderate climates so the net effect on world productionis uncertain. Furthermore, it could lead to the introduction of policies such as carbon
trading that may also tend to reduce agricultural output by raising land and energy costs.
Phase2.book Page 51 Monday, May 26, 2008 4:48 PM
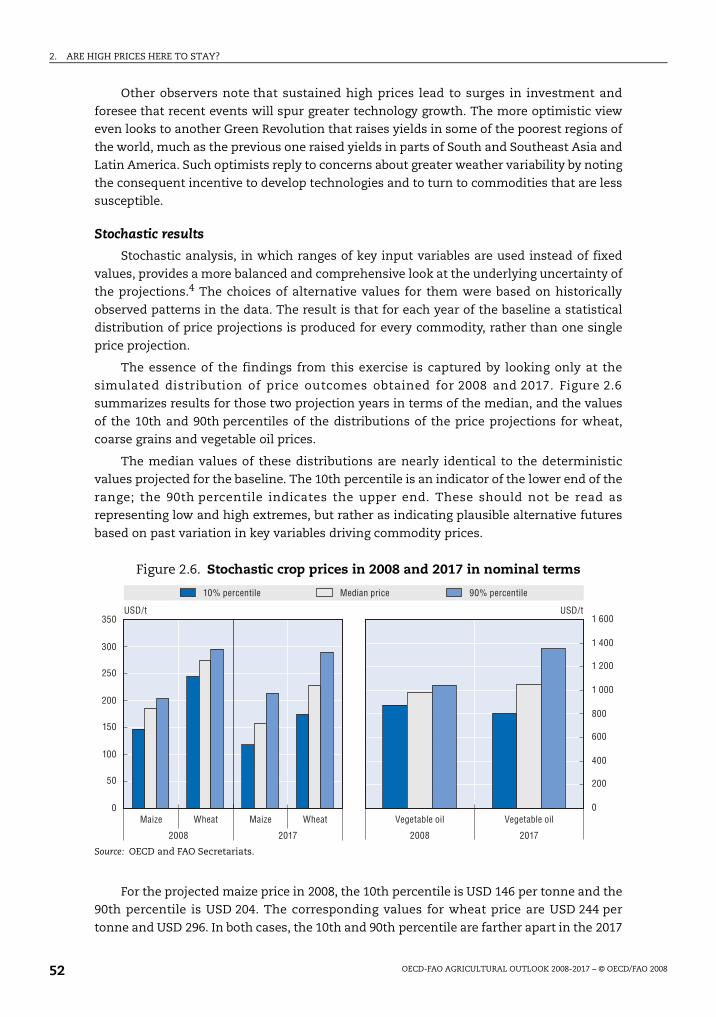
2. ARE HIGH PRICES HERE TO STAY?
OECD-FAO AGRICULTURAL OUTLOOK 2008-2017 – © OECD/FAO 200852
Other observers note that sustained high prices lead to surges in investment and
foresee that recent events will spur greater technology growth. The more optimistic vieweven looks to another Green Revolution that raises yields in some of the poorest regions of
the world, much as the previous one raised yields in parts of South and Southeast Asia andLatin America. Such optimists reply to concerns about greater weather variability by noting
the consequent incentive to develop technologies and to turn to commodities that are lesssusceptible.
Stochastic results
Stochastic analysis, in which ranges of key input variables are used instead of fixed
values, provides a more balanced and comprehensive look at the underlying uncertainty ofthe projections.4 The choices of alternative values for them were based on historically
observed patterns in the data. The result is that for each year of the baseline a statisticaldistribution of price projections is produced for every commodity, rather than one single
price projection.
The essence of the findings from this exercise is captured by looking only at the
simulated distribution of price outcomes obtained for 2008 and 2017. Figure 2.6summarizes results for those two projection years in terms of the median, and the values
of the 10th and 90th percentiles of the distributions of the price projections for wheat,coarse grains and vegetable oil prices.
The median values of these distributions are nearly identical to the deterministicvalues projected for the baseline. The 10th percentile is an indicator of the lower end of the
range; the 90th percentile indicates the upper end. These should not be read asrepresenting low and high extremes, but rather as indicating plausible alternative futures
based on past variation in key variables driving commodity prices.
For the projected maize price in 2008, the 10th percentile is USD 146 per tonne and the90th percentile is USD 204. The corresponding values for wheat price are USD 244 per
tonne and USD 296. In both cases, the 10th and 90th percentile are farther apart in the 2017
Figure 2.6. Stochastic crop prices in 2008 and 2017 in nominal terms
Source: OECD and FAO Secretariats.
10% percentile Median price 90% percentile
0
50
100
150
200
250
300
350
Maize Wheat Maize Wheat
2008 2017
0
200
400
600
800
1 000
1 200
1 400
1 600USD/t USD/t
Vegetable oil Vegetable oil
2008 2017
Phase2.book Page 52 Monday, May 26, 2008 4:48 PM
2. ARE HIGH PRICES HERE TO STAY?
OECD-FAO AGRICULTURAL OUTLOOK 2008-2017 – © OECD/FAO 2008 53
results than in 2008, reflecting the compounding effects of uncertainty in early years,
particularly as regards underlying trends. In both cases, the distribution shifts downward.The 10th percentile falls to USD 117 per tonne for maize and USD 174 per tonne for wheat,
whereas the 90th percentile changes little.
The lower level of the distribution in 2017 reflects the underlying assumptions of the
Outlook. The potential for deviations from those assumptions to result in either much loweror constant grain prices relative to current values based on the historical variations
represented here reflects the degree of uncertainty that is known and readily modelled.The distribution of vegetable oil prices in 2017 indicates that in that case, too, assumptions
of these projections and historical variations that are most readily measured imply thepotential for prices to be either one-fifth lower or two-fifths higher than the price projected
for 2008 in the Outlook.
The bottom lineIn this chapter, a number of temporary and permanent factors have been identified
which help to understand how future commodity prices are expected to evolve. On thebasis of the analysis, the response of this report to the question “Will prices remain as high
as they are today?” is “Very unlikely”. While prices can be expected to fall from currenthighs, and to resume a gradual decline, they are expected to do so from a higher level than
what is seen historically.
To summarise, the main factors that have contributed to the current spike and will
help to determine developments in the future can be summed up as follows:
● Demand has grown faster than supply because of, among other reasons, growth in
biofuels production.
● Supply would normally have grown more, but unfavourable weather conditions in some
important producing countries reduced production and export supplies to worldmarkets. Future supply response will be dampened by high oil prices.
● The sensitivity of demand to price changes appears to be falling for various reasons.Thus, a shock to supply of a given size will require a greater price change to bring about
the demand adjustment required to balance the market.
● At the same time, global stocks have declined to record-low levels over the last decade,
such that any variations in quantities produced and demanded cannot be buffered andhence have a proportionally much greater effect on market prices.
● The sharp increase of financial fund activity in futures commodity markets may havefurther contributed to the short term price hike, but the extent to which this has been
the case is uncertain.
● Border measures that have been taken by many countries in an effort to increase
domestic market supplies have reduced supplies on world markets, further magnifyingthe price increases.
These developments have combined to lift prices to very high levels. But an element ofuncertainty about future developments appears to have had a strong impact as well,
particularly recently, as both governments and investors are acting in ways that sometimescontribute to further price increases and future price volatility. Without these additional
influences, prices would most likely not have been as high as what they are in reality.
Phase2.book Page 53 Monday, May 26, 2008 4:48 PM
2. ARE HIGH PRICES HERE TO STAY?
OECD-FAO AGRICULTURAL OUTLOOK 2008-2017 – © OECD/FAO 200854
With respect to future price trends over the Outlook, scenario results have shown the
relative impact on prices of different assumptions with respect to macroeconomicdevelopments, exchange rates, oil prices, biofuel production and yield trends. When taken
together, these changed assumptions could lead to cereal and vegetable oil prices that aresome 25 to 40% lower than baseline values in 2017.
While these scenarios were implemented in a manner to reduce prices to demonstratetheir relative contribution, they may also occur in a different configuration that would lead
to prices being stronger than projected in the baseline. However, the stochastic analysisthat was carried out for this Outlook assessment suggests that at least for cereals, the
downside risk for prices in the future seems to be increasing.
Notes
1. Dollar-denominated prices have risen substantially, but the generally weakening dollar over thisperiod means that the price increases elsewhere have often been less pronounced than headlineprices might lead one to believe. With the exception of few countries, domestic and import cropprice increases have been substantial but somewhat less dramatic than in USD terms. Moreover,many countries, in both the OECD and non-OECD region intervene in agricultural markets withpolicies such as tariffs, leading to even lower transmission of changes in the prices of traded goodsto domestic markets.
2. Price projections for 2008 in the Outlook baseline clearly do not, and could not possibly, match therecent extreme price hike. The baseline, generated to provide an impression of possible mediumto longer-term market developments, necessarily has to abstract from some of the short-termfactors inherent in commodity markets. These can result in monthly price variations that aremuch larger than those that can be observed from annual averages which are used in the Outlook.
3. Note that the EISA in the United States and proposals for new mandates in the EU have not beentaken into account in this analysis.
4. Stochastic simulation techniques and output have been elaborated in previous Outlook reports.The annual projected values of yields and macroeconomic variables (including the petroleumprice) are not assumed to be single numbers in the projection period, as for the baseline. Rather,random perturbations in yield levels, trends, and in macroeconomic variables are drawn fromhistorically determined distributions, respecting to the greatest extent possible correlation amongerrors and relationships among macroeconomic variables. Several hundred such randomlydetermined values are fed into the model which is solved for each set. The output represents awide range of yield values and macroeconomic settings that may be relevant during the Outlookperiod. As an example, for the oil price in 2008, the 10th percentile is USD 73 per tonne and the 90thpercentile is USD 140. Details on how the partial stochastic analysis has been performed are givenin the Methodology section of the full Outlook report.
Phase2.book Page 54 Monday, May 26, 2008 4:48 PM
OECD-FAO Agricultural Outlook 2008-2017
© OECD/FAO 2008
55
ANNEX A
Statistical Tables
Phase2.book Page 55 Monday, May 26, 2008 4:48 PM
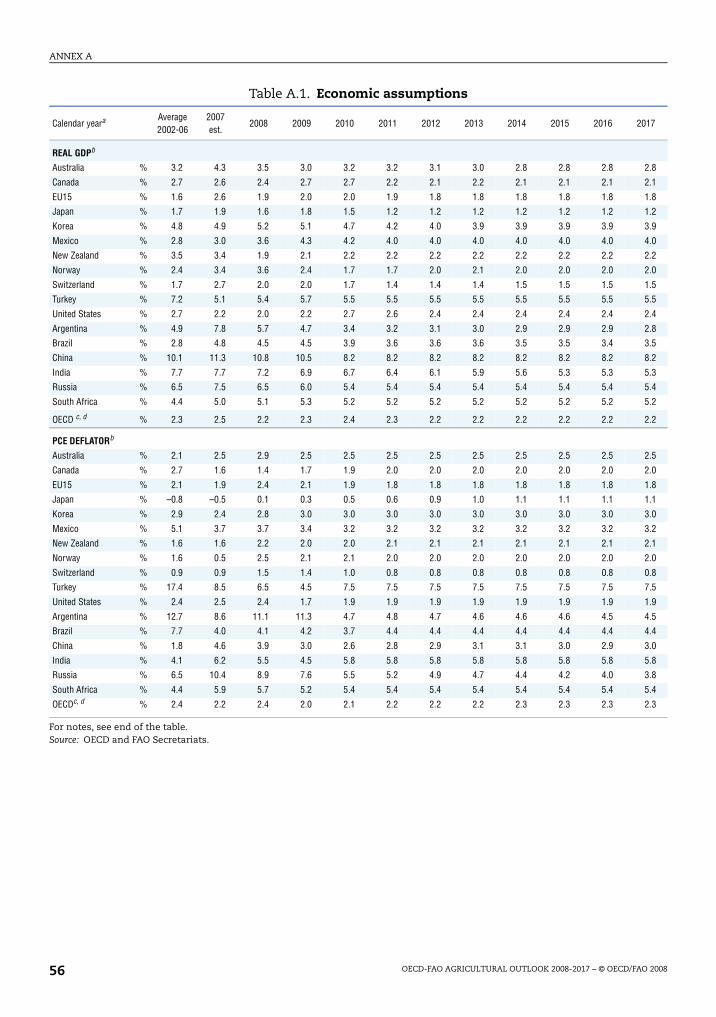
ANNEX A
OECD-FAO AGRICULTURAL OUTLOOK 2008-2017 – © OECD/FAO 200856
Table A.1. Economic assumptions
Calendar yeara Average2002-06
2007est.
2008 2009 2010 2011 2012 2013 2014 2015 2016 2017
REAL GDPb
Australia % 3.2 4.3 3.5 3.0 3.2 3.2 3.1 3.0 2.8 2.8 2.8 2.8
Canada % 2.7 2.6 2.4 2.7 2.7 2.2 2.1 2.2 2.1 2.1 2.1 2.1
EU15 % 1.6 2.6 1.9 2.0 2.0 1.9 1.8 1.8 1.8 1.8 1.8 1.8
Japan % 1.7 1.9 1.6 1.8 1.5 1.2 1.2 1.2 1.2 1.2 1.2 1.2
Korea % 4.8 4.9 5.2 5.1 4.7 4.2 4.0 3.9 3.9 3.9 3.9 3.9
Mexico % 2.8 3.0 3.6 4.3 4.2 4.0 4.0 4.0 4.0 4.0 4.0 4.0
New Zealand % 3.5 3.4 1.9 2.1 2.2 2.2 2.2 2.2 2.2 2.2 2.2 2.2
Norway % 2.4 3.4 3.6 2.4 1.7 1.7 2.0 2.1 2.0 2.0 2.0 2.0
Switzerland % 1.7 2.7 2.0 2.0 1.7 1.4 1.4 1.4 1.5 1.5 1.5 1.5
Turkey % 7.2 5.1 5.4 5.7 5.5 5.5 5.5 5.5 5.5 5.5 5.5 5.5
United States % 2.7 2.2 2.0 2.2 2.7 2.6 2.4 2.4 2.4 2.4 2.4 2.4
Argentina % 4.9 7.8 5.7 4.7 3.4 3.2 3.1 3.0 2.9 2.9 2.9 2.8
Brazil % 2.8 4.8 4.5 4.5 3.9 3.6 3.6 3.6 3.5 3.5 3.4 3.5
China % 10.1 11.3 10.8 10.5 8.2 8.2 8.2 8.2 8.2 8.2 8.2 8.2
India % 7.7 7.7 7.2 6.9 6.7 6.4 6.1 5.9 5.6 5.3 5.3 5.3
Russia % 6.5 7.5 6.5 6.0 5.4 5.4 5.4 5.4 5.4 5.4 5.4 5.4
South Africa % 4.4 5.0 5.1 5.3 5.2 5.2 5.2 5.2 5.2 5.2 5.2 5.2
OECD c, d % 2.3 2.5 2.2 2.3 2.4 2.3 2.2 2.2 2.2 2.2 2.2 2.2
PCE DEFLATORb
Australia % 2.1 2.5 2.9 2.5 2.5 2.5 2.5 2.5 2.5 2.5 2.5 2.5
Canada % 2.7 1.6 1.4 1.7 1.9 2.0 2.0 2.0 2.0 2.0 2.0 2.0
EU15 % 2.1 1.9 2.4 2.1 1.9 1.8 1.8 1.8 1.8 1.8 1.8 1.8
Japan % –0.8 –0.5 0.1 0.3 0.5 0.6 0.9 1.0 1.1 1.1 1.1 1.1
Korea % 2.9 2.4 2.8 3.0 3.0 3.0 3.0 3.0 3.0 3.0 3.0 3.0
Mexico % 5.1 3.7 3.7 3.4 3.2 3.2 3.2 3.2 3.2 3.2 3.2 3.2
New Zealand % 1.6 1.6 2.2 2.0 2.0 2.1 2.1 2.1 2.1 2.1 2.1 2.1
Norway % 1.6 0.5 2.5 2.1 2.1 2.0 2.0 2.0 2.0 2.0 2.0 2.0
Switzerland % 0.9 0.9 1.5 1.4 1.0 0.8 0.8 0.8 0.8 0.8 0.8 0.8
Turkey % 17.4 8.5 6.5 4.5 7.5 7.5 7.5 7.5 7.5 7.5 7.5 7.5
United States % 2.4 2.5 2.4 1.7 1.9 1.9 1.9 1.9 1.9 1.9 1.9 1.9
Argentina % 12.7 8.6 11.1 11.3 4.7 4.8 4.7 4.6 4.6 4.6 4.5 4.5
Brazil % 7.7 4.0 4.1 4.2 3.7 4.4 4.4 4.4 4.4 4.4 4.4 4.4
China % 1.8 4.6 3.9 3.0 2.6 2.8 2.9 3.1 3.1 3.0 2.9 3.0
India % 4.1 6.2 5.5 4.5 5.8 5.8 5.8 5.8 5.8 5.8 5.8 5.8
Russia % 6.5 10.4 8.9 7.6 5.5 5.2 4.9 4.7 4.4 4.2 4.0 3.8
South Africa % 4.4 5.9 5.7 5.2 5.4 5.4 5.4 5.4 5.4 5.4 5.4 5.4
OECDc, d % 2.4 2.2 2.4 2.0 2.1 2.2 2.2 2.2 2.3 2.3 2.3 2.3
For notes, see end of the table.Source: OECD and FAO Secretariats.
Phase2.book Page 56 Monday, May 26, 2008 4:48 PM
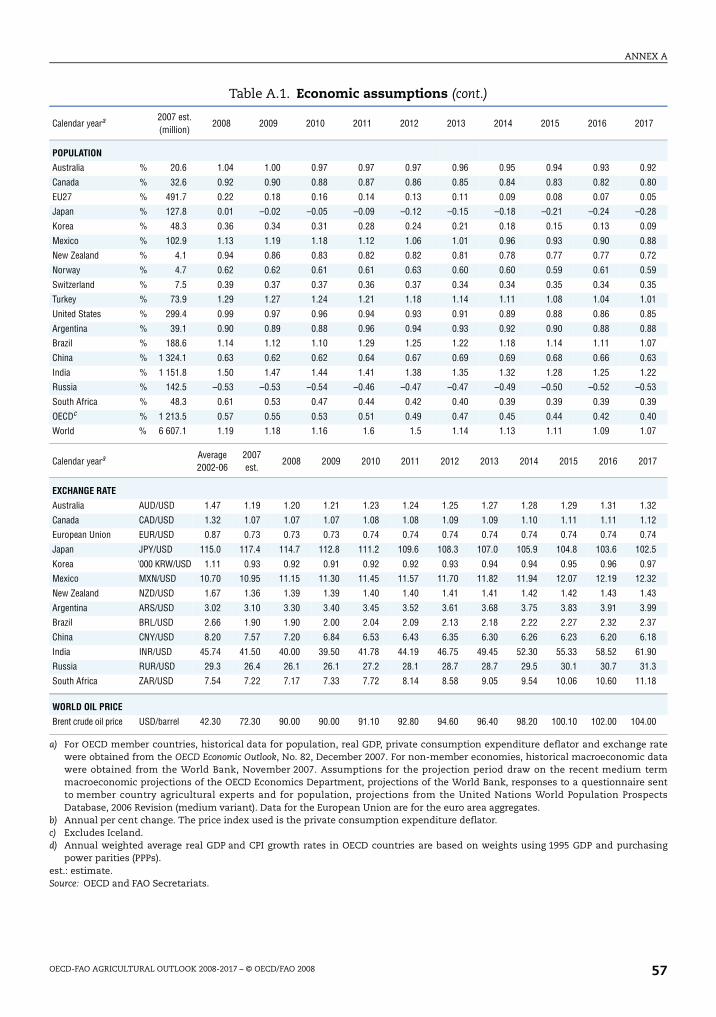
ANNEX A
OECD-FAO AGRICULTURAL OUTLOOK 2008-2017 – © OECD/FAO 2008 57
Table A.1. Economic assumptions (cont.)
Calendar yeara 2007 est.(million)
2008 2009 2010 2011 2012 2013 2014 2015 2016 2017
POPULATION
Australia % 20.6 1.04 1.00 0.97 0.97 0.97 0.96 0.95 0.94 0.93 0.92
Canada % 32.6 0.92 0.90 0.88 0.87 0.86 0.85 0.84 0.83 0.82 0.80
EU27 % 491.7 0.22 0.18 0.16 0.14 0.13 0.11 0.09 0.08 0.07 0.05
Japan % 127.8 0.01 –0.02 –0.05 –0.09 –0.12 –0.15 –0.18 –0.21 –0.24 –0.28
Korea % 48.3 0.36 0.34 0.31 0.28 0.24 0.21 0.18 0.15 0.13 0.09
Mexico % 102.9 1.13 1.19 1.18 1.12 1.06 1.01 0.96 0.93 0.90 0.88
New Zealand % 4.1 0.94 0.86 0.83 0.82 0.82 0.81 0.78 0.77 0.77 0.72
Norway % 4.7 0.62 0.62 0.61 0.61 0.63 0.60 0.60 0.59 0.61 0.59
Switzerland % 7.5 0.39 0.37 0.37 0.36 0.37 0.34 0.34 0.35 0.34 0.35
Turkey % 73.9 1.29 1.27 1.24 1.21 1.18 1.14 1.11 1.08 1.04 1.01
United States % 299.4 0.99 0.97 0.96 0.94 0.93 0.91 0.89 0.88 0.86 0.85
Argentina % 39.1 0.90 0.89 0.88 0.96 0.94 0.93 0.92 0.90 0.88 0.88
Brazil % 188.6 1.14 1.12 1.10 1.29 1.25 1.22 1.18 1.14 1.11 1.07
China % 1 324.1 0.63 0.62 0.62 0.64 0.67 0.69 0.69 0.68 0.66 0.63
India % 1 151.8 1.50 1.47 1.44 1.41 1.38 1.35 1.32 1.28 1.25 1.22
Russia % 142.5 –0.53 –0.53 –0.54 –0.46 –0.47 –0.47 –0.49 –0.50 –0.52 –0.53
South Africa % 48.3 0.61 0.53 0.47 0.44 0.42 0.40 0.39 0.39 0.39 0.39
OECDc % 1 213.5 0.57 0.55 0.53 0.51 0.49 0.47 0.45 0.44 0.42 0.40
World % 6 607.1 1.19 1.18 1.16 1.6 1.5 1.14 1.13 1.11 1.09 1.07
Calendar yeara Average2002-06
2007 est.
2008 2009 2010 2011 2012 2013 2014 2015 2016 2017
EXCHANGE RATE
Australia AUD/USD 1.47 1.19 1.20 1.21 1.23 1.24 1.25 1.27 1.28 1.29 1.31 1.32
Canada CAD/USD 1.32 1.07 1.07 1.07 1.08 1.08 1.09 1.09 1.10 1.11 1.11 1.12
European Union EUR/USD 0.87 0.73 0.73 0.73 0.74 0.74 0.74 0.74 0.74 0.74 0.74 0.74
Japan JPY/USD 115.0 117.4 114.7 112.8 111.2 109.6 108.3 107.0 105.9 104.8 103.6 102.5
Korea '000 KRW/USD 1.11 0.93 0.92 0.91 0.92 0.92 0.93 0.94 0.94 0.95 0.96 0.97
Mexico MXN/USD 10.70 10.95 11.15 11.30 11.45 11.57 11.70 11.82 11.94 12.07 12.19 12.32
New Zealand NZD/USD 1.67 1.36 1.39 1.39 1.40 1.40 1.41 1.41 1.42 1.42 1.43 1.43
Argentina ARS/USD 3.02 3.10 3.30 3.40 3.45 3.52 3.61 3.68 3.75 3.83 3.91 3.99
Brazil BRL/USD 2.66 1.90 1.90 2.00 2.04 2.09 2.13 2.18 2.22 2.27 2.32 2.37
China CNY/USD 8.20 7.57 7.20 6.84 6.53 6.43 6.35 6.30 6.26 6.23 6.20 6.18
India INR/USD 45.74 41.50 40.00 39.50 41.78 44.19 46.75 49.45 52.30 55.33 58.52 61.90
Russia RUR/USD 29.3 26.4 26.1 26.1 27.2 28.1 28.7 28.7 29.5 30.1 30.7 31.3
South Africa ZAR/USD 7.54 7.22 7.17 7.33 7.72 8.14 8.58 9.05 9.54 10.06 10.60 11.18
WORLD OIL PRICE
Brent crude oil price USD/barrel 42.30 72.30 90.00 90.00 91.10 92.80 94.60 96.40 98.20 100.10 102.00 104.00
a) For OECD member countries, historical data for population, real GDP, private consumption expenditure deflator and exchange ratewere obtained from the OECD Economic Outlook, No. 82, December 2007. For non-member economies, historical macroeconomic datawere obtained from the World Bank, November 2007. Assumptions for the projection period draw on the recent medium termmacroeconomic projections of the OECD Economics Department, projections of the World Bank, responses to a questionnaire sentto member country agricultural experts and for population, projections from the United Nations World Population ProspectsDatabase, 2006 Revision (medium variant). Data for the European Union are for the euro area aggregates.
b) Annual per cent change. The price index used is the private consumption expenditure deflator. c) Excludes Iceland. d) Annual weighted average real GDP and CPI growth rates in OECD countries are based on weights using 1995 GDP and purchasing
power parities (PPPs).est.: estimate.Source: OECD and FAO Secretariats.
Phase2.book Page 57 Monday, May 26, 2008 4:48 PM
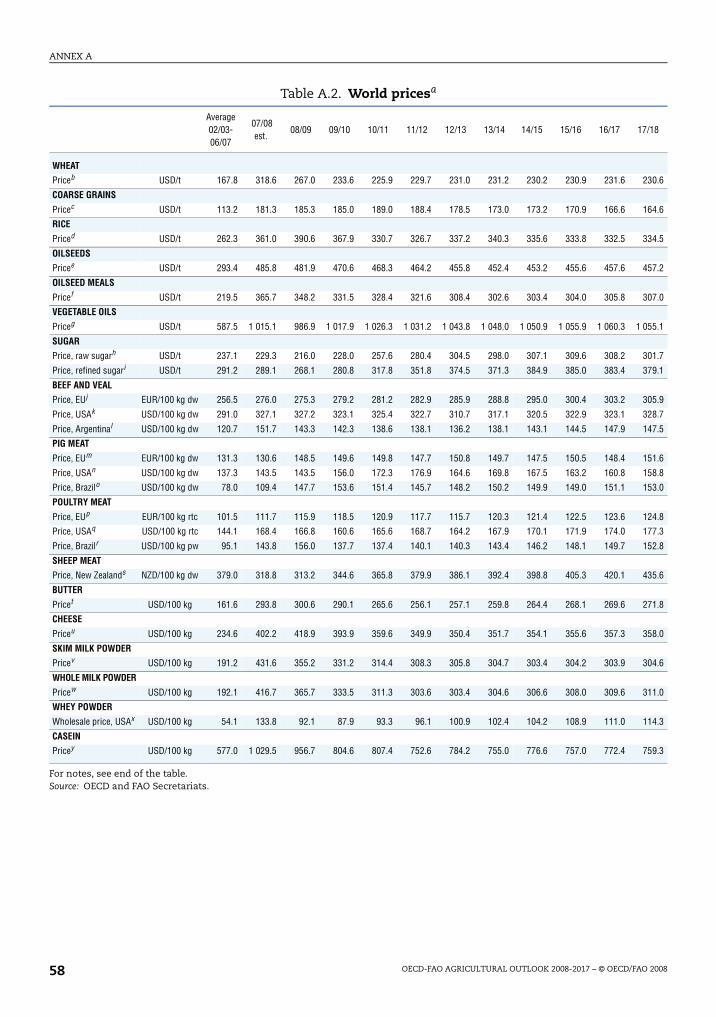
ANNEX A
OECD-FAO AGRICULTURAL OUTLOOK 2008-2017 – © OECD/FAO 200858
Table A.2. World pricesa
Average02/03-06/07
07/08est.
08/09 09/10 10/11 11/12 12/13 13/14 14/15 15/16 16/17 17/18
WHEAT
Priceb USD/t 167.8 318.6 267.0 233.6 225.9 229.7 231.0 231.2 230.2 230.9 231.6 230.6
COARSE GRAINS
Pricec USD/t 113.2 181.3 185.3 185.0 189.0 188.4 178.5 173.0 173.2 170.9 166.6 164.6
RICE
Priced USD/t 262.3 361.0 390.6 367.9 330.7 326.7 337.2 340.3 335.6 333.8 332.5 334.5
OILSEEDS
Pricee USD/t 293.4 485.8 481.9 470.6 468.3 464.2 455.8 452.4 453.2 455.6 457.6 457.2
OILSEED MEALS
Pricef USD/t 219.5 365.7 348.2 331.5 328.4 321.6 308.4 302.6 303.4 304.0 305.8 307.0
VEGETABLE OILS
Priceg USD/t 587.5 1 015.1 986.9 1 017.9 1 026.3 1 031.2 1 043.8 1 048.0 1 050.9 1 055.9 1 060.3 1 055.1
SUGAR
Price, raw sugarh USD/t 237.1 229.3 216.0 228.0 257.6 280.4 304.5 298.0 307.1 309.6 308.2 301.7
Price, refined sugari USD/t 291.2 289.1 268.1 280.8 317.8 351.8 374.5 371.3 384.9 385.0 383.4 379.1
BEEF AND VEAL
Price, EUj EUR/100 kg dw 256.5 276.0 275.3 279.2 281.2 282.9 285.9 288.8 295.0 300.4 303.2 305.9
Price, USAk USD/100 kg dw 291.0 327.1 327.2 323.1 325.4 322.7 310.7 317.1 320.5 322.9 323.1 328.7
Price, Argentinal USD/100 kg dw 120.7 151.7 143.3 142.3 138.6 138.1 136.2 138.1 143.1 144.5 147.9 147.5
PIG MEAT
Price, EUm EUR/100 kg dw 131.3 130.6 148.5 149.6 149.8 147.7 150.8 149.7 147.5 150.5 148.4 151.6
Price, USAn USD/100 kg dw 137.3 143.5 143.5 156.0 172.3 176.9 164.6 169.8 167.5 163.2 160.8 158.8
Price, Brazilo USD/100 kg dw 78.0 109.4 147.7 153.6 151.4 145.7 148.2 150.2 149.9 149.0 151.1 153.0
POULTRY MEAT
Price, EUp EUR/100 kg rtc 101.5 111.7 115.9 118.5 120.9 117.7 115.7 120.3 121.4 122.5 123.6 124.8
Price, USAq USD/100 kg rtc 144.1 168.4 166.8 160.6 165.6 168.7 164.2 167.9 170.1 171.9 174.0 177.3
Price, Brazilr USD/100 kg pw 95.1 143.8 156.0 137.7 137.4 140.1 140.3 143.4 146.2 148.1 149.7 152.8
SHEEP MEAT
Price, New Zealands NZD/100 kg dw 379.0 318.8 313.2 344.6 365.8 379.9 386.1 392.4 398.8 405.3 420.1 435.6
BUTTER
Pricet USD/100 kg 161.6 293.8 300.6 290.1 265.6 256.1 257.1 259.8 264.4 268.1 269.6 271.8
CHEESE
Priceu USD/100 kg 234.6 402.2 418.9 393.9 359.6 349.9 350.4 351.7 354.1 355.6 357.3 358.0
SKIM MILK POWDER
Pricev USD/100 kg 191.2 431.6 355.2 331.2 314.4 308.3 305.8 304.7 303.4 304.2 303.9 304.6
WHOLE MILK POWDER
Pricew USD/100 kg 192.1 416.7 365.7 333.5 311.3 303.6 303.4 304.6 306.6 308.0 309.6 311.0
WHEY POWDER
Wholesale price, USAx USD/100 kg 54.1 133.8 92.1 87.9 93.3 96.1 100.9 102.4 104.2 108.9 111.0 114.3
CASEIN
Pricey USD/100 kg 577.0 1 029.5 956.7 804.6 807.4 752.6 784.2 755.0 776.6 757.0 772.4 759.3
For notes, see end of the table.Source: OECD and FAO Secretariats.
Phase2.book Page 58 Monday, May 26, 2008 4:48 PM
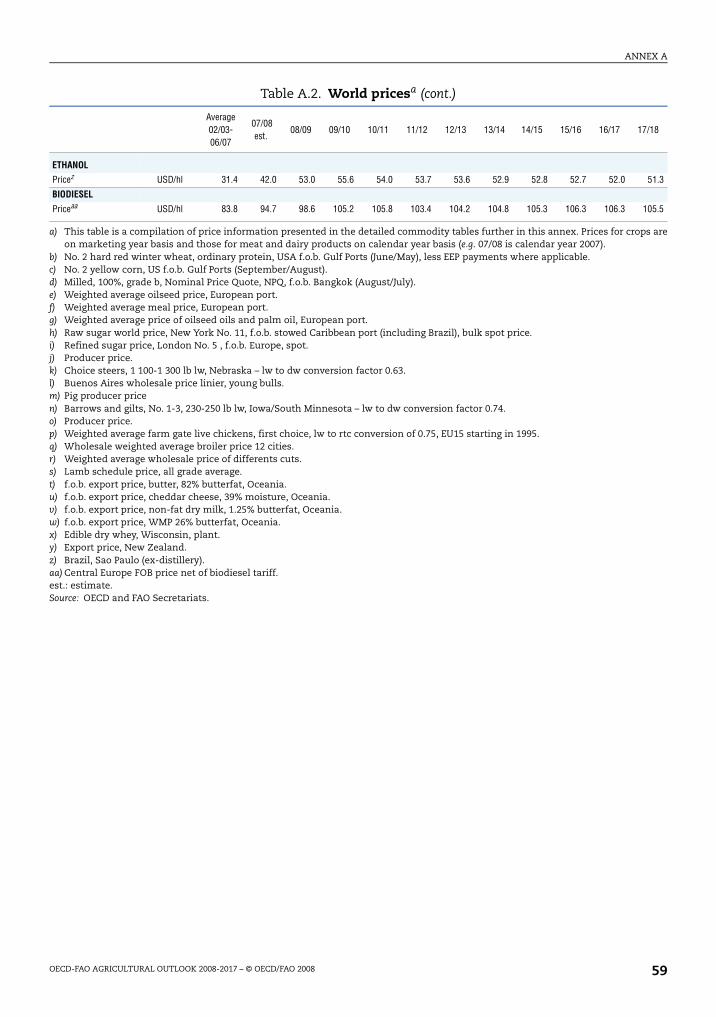
ANNEX A
OECD-FAO AGRICULTURAL OUTLOOK 2008-2017 – © OECD/FAO 2008 59
ETHANOL
Pricez USD/hl 31.4 42.0 53.0 55.6 54.0 53.7 53.6 52.9 52.8 52.7 52.0 51.3
BIODIESEL
Priceaa USD/hl 83.8 94.7 98.6 105.2 105.8 103.4 104.2 104.8 105.3 106.3 106.3 105.5
a) This table is a compilation of price information presented in the detailed commodity tables further in this annex. Prices for crops areon marketing year basis and those for meat and dairy products on calendar year basis (e.g. 07/08 is calendar year 2007).
b) No. 2 hard red winter wheat, ordinary protein, USA f.o.b. Gulf Ports (June/May), less EEP payments where applicable. c) No. 2 yellow corn, US f.o.b. Gulf Ports (September/August). d) Milled, 100%, grade b, Nominal Price Quote, NPQ, f.o.b. Bangkok (August/July). e) Weighted average oilseed price, European port. f) Weighted average meal price, European port. g) Weighted average price of oilseed oils and palm oil, European port. h) Raw sugar world price, New York No. 11, f.o.b. stowed Caribbean port (including Brazil), bulk spot price. i) Refined sugar price, London No. 5 , f.o.b. Europe, spot. j) Producer price. k) Choice steers, 1 100-1 300 lb lw, Nebraska – lw to dw conversion factor 0.63. l) Buenos Aires wholesale price linier, young bulls. m) Pig producer pricen) Barrows and gilts, No. 1-3, 230-250 lb lw, Iowa/South Minnesota – lw to dw conversion factor 0.74. o) Producer price. p) Weighted average farm gate live chickens, first choice, lw to rtc conversion of 0.75, EU15 starting in 1995. q) Wholesale weighted average broiler price 12 cities. r) Weighted average wholesale price of differents cuts. s) Lamb schedule price, all grade average. t) f.o.b. export price, butter, 82% butterfat, Oceania. u) f.o.b. export price, cheddar cheese, 39% moisture, Oceania. v) f.o.b. export price, non-fat dry milk, 1.25% butterfat, Oceania. w) f.o.b. export price, WMP 26% butterfat, Oceania. x) Edible dry whey, Wisconsin, plant. y) Export price, New Zealand. z) Brazil, Sao Paulo (ex-distillery). aa) Central Europe FOB price net of biodiesel tariff.est.: estimate.Source: OECD and FAO Secretariats.
Table A.2. World pricesa (cont.)
Average02/03-06/07
07/08est.
08/09 09/10 10/11 11/12 12/13 13/14 14/15 15/16 16/17 17/18
Phase2.book Page 59 Monday, May 26, 2008 4:48 PM
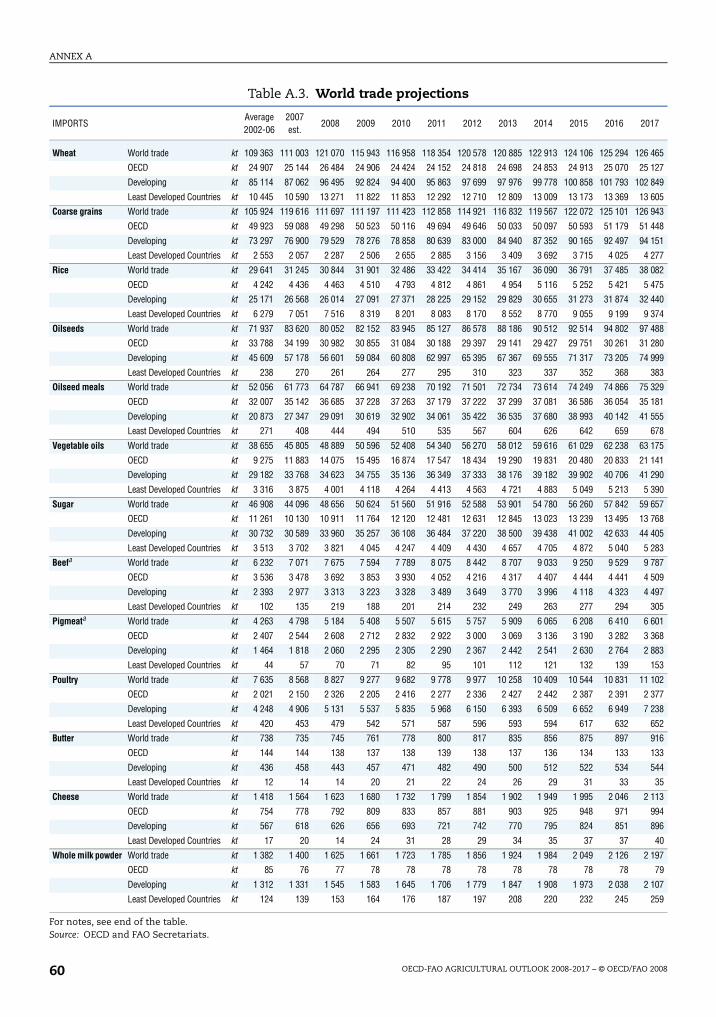
ANNEX A
OECD-FAO AGRICULTURAL OUTLOOK 2008-2017 – © OECD/FAO 200860
Table A.3. World trade projections
IMPORTSAverage2002-06
2007est.
2008 2009 2010 2011 2012 2013 2014 2015 2016 2017
Wheat World trade kt 109 363 111 003 121 070 115 943 116 958 118 354 120 578 120 885 122 913 124 106 125 294 126 465
OECD kt 24 907 25 144 26 484 24 906 24 424 24 152 24 818 24 698 24 853 24 913 25 070 25 127
Developing kt 85 114 87 062 96 495 92 824 94 400 95 863 97 699 97 976 99 778 100 858 101 793 102 849
Least Developed Countries kt 10 445 10 590 13 271 11 822 11 853 12 292 12 710 12 809 13 009 13 173 13 369 13 605
Coarse grains World trade kt 105 924 119 616 111 697 111 197 111 423 112 858 114 921 116 832 119 567 122 072 125 101 126 943
OECD kt 49 923 59 088 49 298 50 523 50 116 49 694 49 646 50 033 50 097 50 593 51 179 51 448
Developing kt 73 297 76 900 79 529 78 276 78 858 80 639 83 000 84 940 87 352 90 165 92 497 94 151
Least Developed Countries kt 2 553 2 057 2 287 2 506 2 655 2 885 3 156 3 409 3 692 3 715 4 025 4 277
Rice World trade kt 29 641 31 245 30 844 31 901 32 486 33 422 34 414 35 167 36 090 36 791 37 485 38 082
OECD kt 4 242 4 436 4 463 4 510 4 793 4 812 4 861 4 954 5 116 5 252 5 421 5 475
Developing kt 25 171 26 568 26 014 27 091 27 371 28 225 29 152 29 829 30 655 31 273 31 874 32 440
Least Developed Countries kt 6 279 7 051 7 516 8 319 8 201 8 083 8 170 8 552 8 770 9 055 9 199 9 374
Oilseeds World trade kt 71 937 83 620 80 052 82 152 83 945 85 127 86 578 88 186 90 512 92 514 94 802 97 488
OECD kt 33 788 34 199 30 982 30 855 31 084 30 188 29 397 29 141 29 427 29 751 30 261 31 280
Developing kt 45 609 57 178 56 601 59 084 60 808 62 997 65 395 67 367 69 555 71 317 73 205 74 999
Least Developed Countries kt 238 270 261 264 277 295 310 323 337 352 368 383
Oilseed meals World trade kt 52 056 61 773 64 787 66 941 69 238 70 192 71 501 72 734 73 614 74 249 74 866 75 329
OECD kt 32 007 35 142 36 685 37 228 37 263 37 179 37 222 37 299 37 081 36 586 36 054 35 181
Developing kt 20 873 27 347 29 091 30 619 32 902 34 061 35 422 36 535 37 680 38 993 40 142 41 555
Least Developed Countries kt 271 408 444 494 510 535 567 604 626 642 659 678
Vegetable oils World trade kt 38 655 45 805 48 889 50 596 52 408 54 340 56 270 58 012 59 616 61 029 62 238 63 175
OECD kt 9 275 11 883 14 075 15 495 16 874 17 547 18 434 19 290 19 831 20 480 20 833 21 141
Developing kt 29 182 33 768 34 623 34 755 35 136 36 349 37 333 38 176 39 182 39 902 40 706 41 290
Least Developed Countries kt 3 316 3 875 4 001 4 118 4 264 4 413 4 563 4 721 4 883 5 049 5 213 5 390
Sugar World trade kt 46 908 44 096 48 656 50 624 51 560 51 916 52 588 53 901 54 780 56 260 57 842 59 657
OECD kt 11 261 10 130 10 911 11 764 12 120 12 481 12 631 12 845 13 023 13 239 13 495 13 768
Developing kt 30 732 30 589 33 960 35 257 36 108 36 484 37 220 38 500 39 438 41 002 42 633 44 405
Least Developed Countries kt 3 513 3 702 3 821 4 045 4 247 4 409 4 430 4 657 4 705 4 872 5 040 5 283
Beefa World trade kt 6 232 7 071 7 675 7 594 7 789 8 075 8 442 8 707 9 033 9 250 9 529 9 787
OECD kt 3 536 3 478 3 692 3 853 3 930 4 052 4 216 4 317 4 407 4 444 4 441 4 509
Developing kt 2 393 2 977 3 313 3 223 3 328 3 489 3 649 3 770 3 996 4 118 4 323 4 497
Least Developed Countries kt 102 135 219 188 201 214 232 249 263 277 294 305
Pigmeata World trade kt 4 263 4 798 5 184 5 408 5 507 5 615 5 757 5 909 6 065 6 208 6 410 6 601
OECD kt 2 407 2 544 2 608 2 712 2 832 2 922 3 000 3 069 3 136 3 190 3 282 3 368
Developing kt 1 464 1 818 2 060 2 295 2 305 2 290 2 367 2 442 2 541 2 630 2 764 2 883
Least Developed Countries kt 44 57 70 71 82 95 101 112 121 132 139 153
Poultry World trade kt 7 635 8 568 8 827 9 277 9 682 9 778 9 977 10 258 10 409 10 544 10 831 11 102
OECD kt 2 021 2 150 2 326 2 205 2 416 2 277 2 336 2 427 2 442 2 387 2 391 2 377
Developing kt 4 248 4 906 5 131 5 537 5 835 5 968 6 150 6 393 6 509 6 652 6 949 7 238
Least Developed Countries kt 420 453 479 542 571 587 596 593 594 617 632 652
Butter World trade kt 738 735 745 761 778 800 817 835 856 875 897 916
OECD kt 144 144 138 137 138 139 138 137 136 134 133 133
Developing kt 436 458 443 457 471 482 490 500 512 522 534 544
Least Developed Countries kt 12 14 14 20 21 22 24 26 29 31 33 35
Cheese World trade kt 1 418 1 564 1 623 1 680 1 732 1 799 1 854 1 902 1 949 1 995 2 046 2 113
OECD kt 754 778 792 809 833 857 881 903 925 948 971 994
Developing kt 567 618 626 656 693 721 742 770 795 824 851 896
Least Developed Countries kt 17 20 14 24 31 28 29 34 35 37 37 40
Whole milk powder World trade kt 1 382 1 400 1 625 1 661 1 723 1 785 1 856 1 924 1 984 2 049 2 126 2 197
OECD kt 85 76 77 78 78 78 78 78 78 78 78 79
Developing kt 1 312 1 331 1 545 1 583 1 645 1 706 1 779 1 847 1 908 1 973 2 038 2 107
Least Developed Countries kt 124 139 153 164 176 187 197 208 220 232 245 259
For notes, see end of the table.Source: OECD and FAO Secretariats.
Phase2.book Page 60 Monday, May 26, 2008 4:48 PM
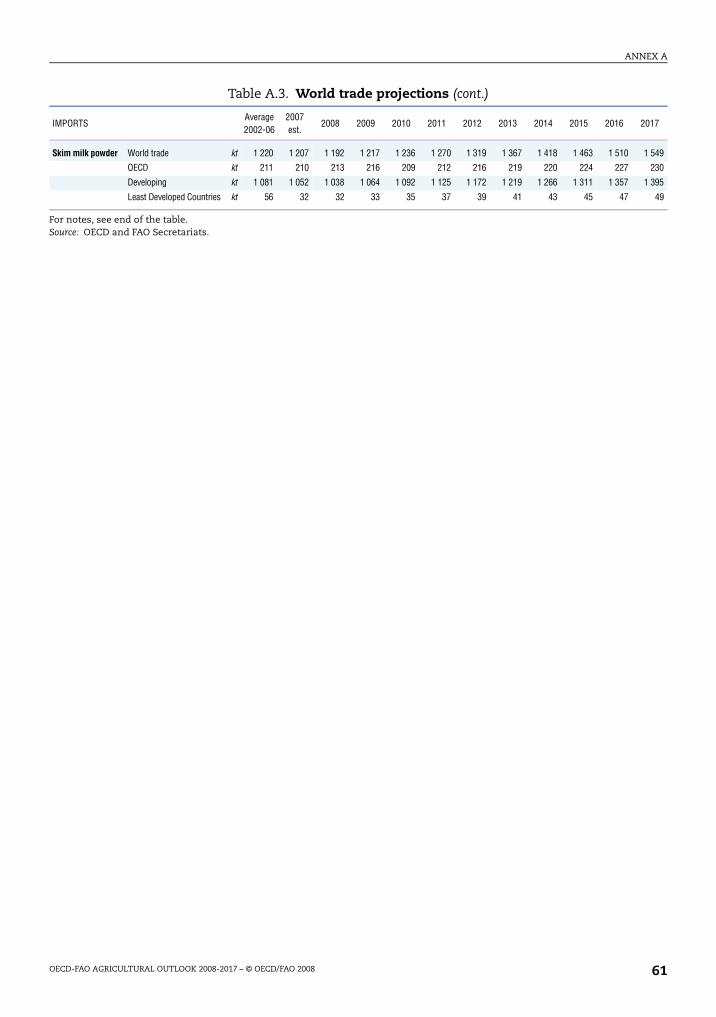
ANNEX A
OECD-FAO AGRICULTURAL OUTLOOK 2008-2017 – © OECD/FAO 2008 61
Skim milk powder World trade kt 1 220 1 207 1 192 1 217 1 236 1 270 1 319 1 367 1 418 1 463 1 510 1 549
OECD kt 211 210 213 216 209 212 216 219 220 224 227 230
Developing kt 1 081 1 052 1 038 1 064 1 092 1 125 1 172 1 219 1 266 1 311 1 357 1 395
Least Developed Countries kt 56 32 32 33 35 37 39 41 43 45 47 49
Table A.3. World trade projections (cont.)
IMPORTSAverage2002-06
2007est.
2008 2009 2010 2011 2012 2013 2014 2015 2016 2017
For notes, see end of the table.Source: OECD and FAO Secretariats.
Phase2.book Page 61 Monday, May 26, 2008 4:48 PM
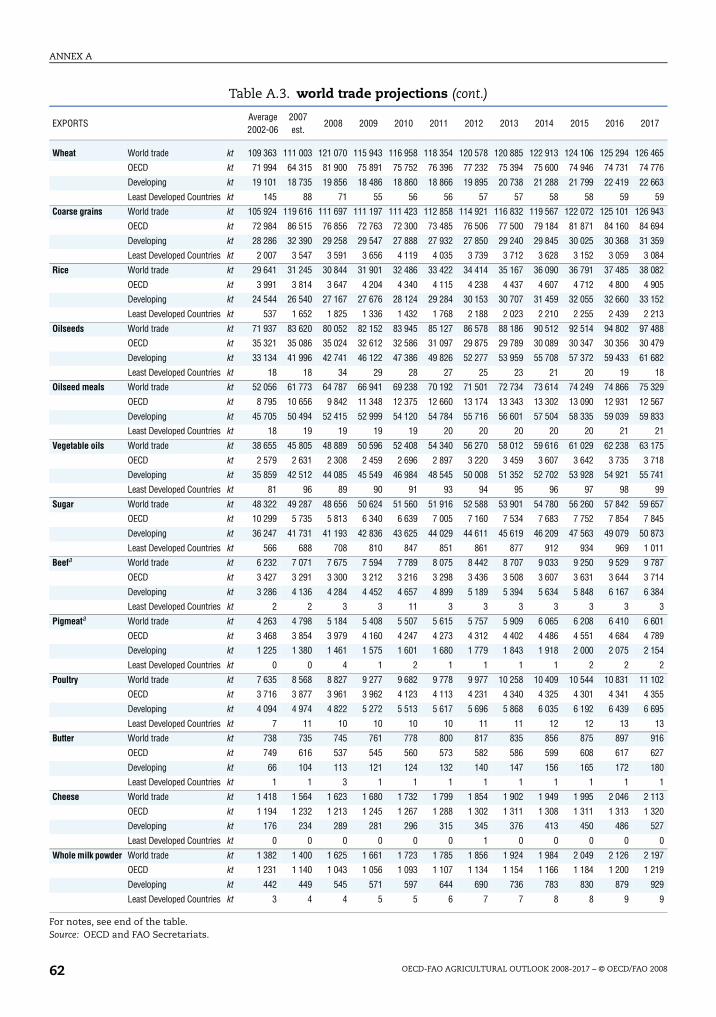
ANNEX A
OECD-FAO AGRICULTURAL OUTLOOK 2008-2017 – © OECD/FAO 200862
Table A.3. world trade projections (cont.)
EXPORTSAverage2002-06
2007est.
2008 2009 2010 2011 2012 2013 2014 2015 2016 2017
Wheat World trade kt 109 363 111 003 121 070 115 943 116 958 118 354 120 578 120 885 122 913 124 106 125 294 126 465
OECD kt 71 994 64 315 81 900 75 891 75 752 76 396 77 232 75 394 75 600 74 946 74 731 74 776
Developing kt 19 101 18 735 19 856 18 486 18 860 18 866 19 895 20 738 21 288 21 799 22 419 22 663
Least Developed Countries kt 145 88 71 55 56 56 57 57 58 58 59 59
Coarse grains World trade kt 105 924 119 616 111 697 111 197 111 423 112 858 114 921 116 832 119 567 122 072 125 101 126 943
OECD kt 72 984 86 515 76 856 72 763 72 300 73 485 76 506 77 500 79 184 81 871 84 160 84 694
Developing kt 28 286 32 390 29 258 29 547 27 888 27 932 27 850 29 240 29 845 30 025 30 368 31 359
Least Developed Countries kt 2 007 3 547 3 591 3 656 4 119 4 035 3 739 3 712 3 628 3 152 3 059 3 084
Rice World trade kt 29 641 31 245 30 844 31 901 32 486 33 422 34 414 35 167 36 090 36 791 37 485 38 082
OECD kt 3 991 3 814 3 647 4 204 4 340 4 115 4 238 4 437 4 607 4 712 4 800 4 905
Developing kt 24 544 26 540 27 167 27 676 28 124 29 284 30 153 30 707 31 459 32 055 32 660 33 152
Least Developed Countries kt 537 1 652 1 825 1 336 1 432 1 768 2 188 2 023 2 210 2 255 2 439 2 213
Oilseeds World trade kt 71 937 83 620 80 052 82 152 83 945 85 127 86 578 88 186 90 512 92 514 94 802 97 488
OECD kt 35 321 35 086 35 024 32 612 32 586 31 097 29 875 29 789 30 089 30 347 30 356 30 479
Developing kt 33 134 41 996 42 741 46 122 47 386 49 826 52 277 53 959 55 708 57 372 59 433 61 682
Least Developed Countries kt 18 18 34 29 28 27 25 23 21 20 19 18
Oilseed meals World trade kt 52 056 61 773 64 787 66 941 69 238 70 192 71 501 72 734 73 614 74 249 74 866 75 329
OECD kt 8 795 10 656 9 842 11 348 12 375 12 660 13 174 13 343 13 302 13 090 12 931 12 567
Developing kt 45 705 50 494 52 415 52 999 54 120 54 784 55 716 56 601 57 504 58 335 59 039 59 833
Least Developed Countries kt 18 19 19 19 19 20 20 20 20 20 21 21
Vegetable oils World trade kt 38 655 45 805 48 889 50 596 52 408 54 340 56 270 58 012 59 616 61 029 62 238 63 175
OECD kt 2 579 2 631 2 308 2 459 2 696 2 897 3 220 3 459 3 607 3 642 3 735 3 718
Developing kt 35 859 42 512 44 085 45 549 46 984 48 545 50 008 51 352 52 702 53 928 54 921 55 741
Least Developed Countries kt 81 96 89 90 91 93 94 95 96 97 98 99
Sugar World trade kt 48 322 49 287 48 656 50 624 51 560 51 916 52 588 53 901 54 780 56 260 57 842 59 657
OECD kt 10 299 5 735 5 813 6 340 6 639 7 005 7 160 7 534 7 683 7 752 7 854 7 845
Developing kt 36 247 41 731 41 193 42 836 43 625 44 029 44 611 45 619 46 209 47 563 49 079 50 873
Least Developed Countries kt 566 688 708 810 847 851 861 877 912 934 969 1 011
Beefa World trade kt 6 232 7 071 7 675 7 594 7 789 8 075 8 442 8 707 9 033 9 250 9 529 9 787
OECD kt 3 427 3 291 3 300 3 212 3 216 3 298 3 436 3 508 3 607 3 631 3 644 3 714
Developing kt 3 286 4 136 4 284 4 452 4 657 4 899 5 189 5 394 5 634 5 848 6 167 6 384
Least Developed Countries kt 2 2 3 3 11 3 3 3 3 3 3 3
Pigmeata World trade kt 4 263 4 798 5 184 5 408 5 507 5 615 5 757 5 909 6 065 6 208 6 410 6 601
OECD kt 3 468 3 854 3 979 4 160 4 247 4 273 4 312 4 402 4 486 4 551 4 684 4 789
Developing kt 1 225 1 380 1 461 1 575 1 601 1 680 1 779 1 843 1 918 2 000 2 075 2 154
Least Developed Countries kt 0 0 4 1 2 1 1 1 1 2 2 2
Poultry World trade kt 7 635 8 568 8 827 9 277 9 682 9 778 9 977 10 258 10 409 10 544 10 831 11 102
OECD kt 3 716 3 877 3 961 3 962 4 123 4 113 4 231 4 340 4 325 4 301 4 341 4 355
Developing kt 4 094 4 974 4 822 5 272 5 513 5 617 5 696 5 868 6 035 6 192 6 439 6 695
Least Developed Countries kt 7 11 10 10 10 10 11 11 12 12 13 13
Butter World trade kt 738 735 745 761 778 800 817 835 856 875 897 916
OECD kt 749 616 537 545 560 573 582 586 599 608 617 627
Developing kt 66 104 113 121 124 132 140 147 156 165 172 180
Least Developed Countries kt 1 1 3 1 1 1 1 1 1 1 1 1
Cheese World trade kt 1 418 1 564 1 623 1 680 1 732 1 799 1 854 1 902 1 949 1 995 2 046 2 113
OECD kt 1 194 1 232 1 213 1 245 1 267 1 288 1 302 1 311 1 308 1 311 1 313 1 320
Developing kt 176 234 289 281 296 315 345 376 413 450 486 527
Least Developed Countries kt 0 0 0 0 0 0 1 0 0 0 0 0
Whole milk powder World trade kt 1 382 1 400 1 625 1 661 1 723 1 785 1 856 1 924 1 984 2 049 2 126 2 197
OECD kt 1 231 1 140 1 043 1 056 1 093 1 107 1 134 1 154 1 166 1 184 1 200 1 219
Developing kt 442 449 545 571 597 644 690 736 783 830 879 929
Least Developed Countries kt 3 4 4 5 5 6 7 7 8 8 9 9
For notes, see end of the table.Source: OECD and FAO Secretariats.
Phase2.book Page 62 Monday, May 26, 2008 4:48 PM
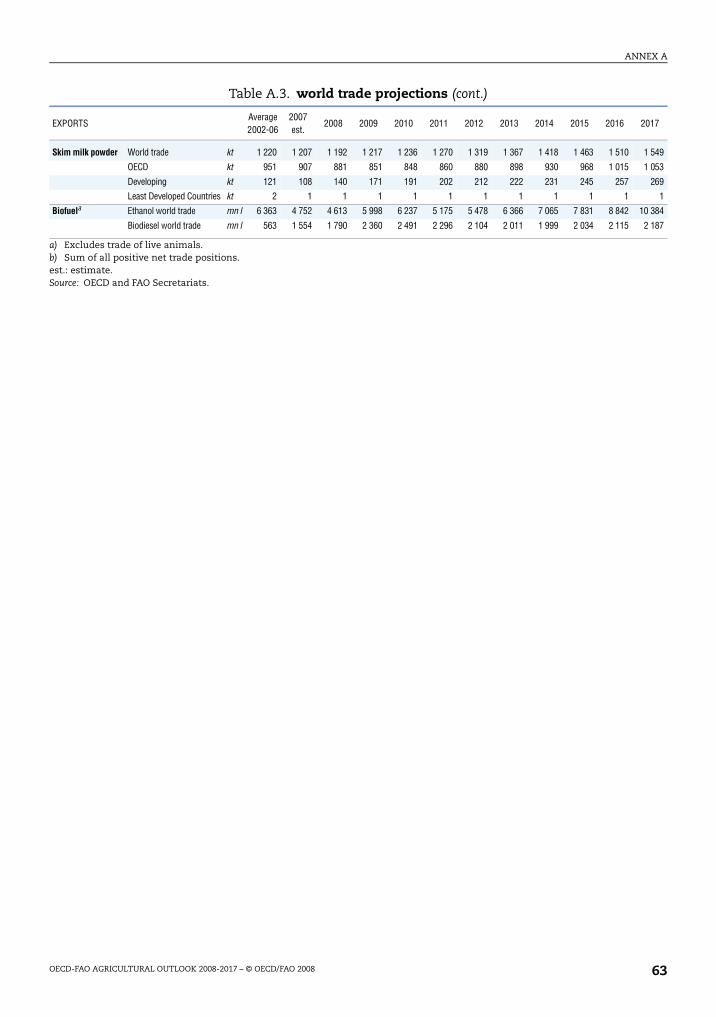
ANNEX A
OECD-FAO AGRICULTURAL OUTLOOK 2008-2017 – © OECD/FAO 2008 63
Skim milk powder World trade kt 1 220 1 207 1 192 1 217 1 236 1 270 1 319 1 367 1 418 1 463 1 510 1 549
OECD kt 951 907 881 851 848 860 880 898 930 968 1 015 1 053
Developing kt 121 108 140 171 191 202 212 222 231 245 257 269
Least Developed Countries kt 2 1 1 1 1 1 1 1 1 1 1 1
Biofuela Ethanol world trade mn l 6 363 4 752 4 613 5 998 6 237 5 175 5 478 6 366 7 065 7 831 8 842 10 384
Biodiesel world trade mn l 563 1 554 1 790 2 360 2 491 2 296 2 104 2 011 1 999 2 034 2 115 2 187
a) Excludes trade of live animals.b) Sum of all positive net trade positions.est.: estimate.Source: OECD and FAO Secretariats.
Table A.3. world trade projections (cont.)
EXPORTSAverage2002-06
2007est.
2008 2009 2010 2011 2012 2013 2014 2015 2016 2017
Phase2.book Page 63 Monday, May 26, 2008 4:48 PM
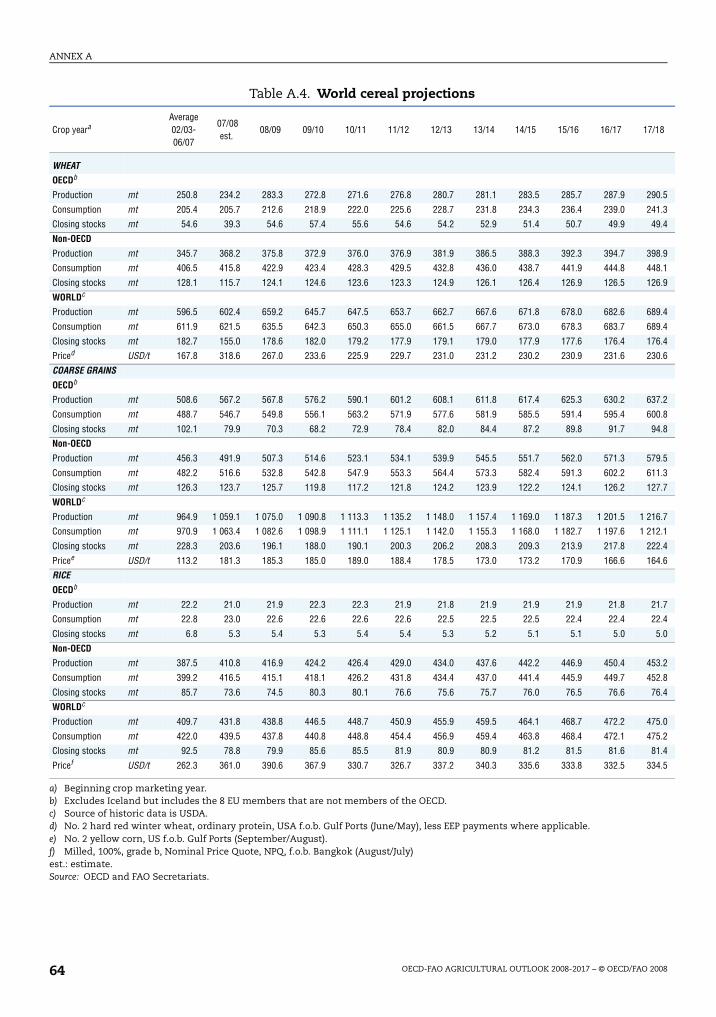
ANNEX A
OECD-FAO AGRICULTURAL OUTLOOK 2008-2017 – © OECD/FAO 200864
Table A.4. World cereal projections
Crop yearaAverage02/03-06/07
07/08est.
08/09 09/10 10/11 11/12 12/13 13/14 14/15 15/16 16/17 17/18
WHEATOECDb
Production mt 250.8 234.2 283.3 272.8 271.6 276.8 280.7 281.1 283.5 285.7 287.9 290.5
Consumption mt 205.4 205.7 212.6 218.9 222.0 225.6 228.7 231.8 234.3 236.4 239.0 241.3
Closing stocks mt 54.6 39.3 54.6 57.4 55.6 54.6 54.2 52.9 51.4 50.7 49.9 49.4
Non-OECD
Production mt 345.7 368.2 375.8 372.9 376.0 376.9 381.9 386.5 388.3 392.3 394.7 398.9
Consumption mt 406.5 415.8 422.9 423.4 428.3 429.5 432.8 436.0 438.7 441.9 444.8 448.1
Closing stocks mt 128.1 115.7 124.1 124.6 123.6 123.3 124.9 126.1 126.4 126.9 126.5 126.9
WORLDc
Production mt 596.5 602.4 659.2 645.7 647.5 653.7 662.7 667.6 671.8 678.0 682.6 689.4
Consumption mt 611.9 621.5 635.5 642.3 650.3 655.0 661.5 667.7 673.0 678.3 683.7 689.4
Closing stocks mt 182.7 155.0 178.6 182.0 179.2 177.9 179.1 179.0 177.9 177.6 176.4 176.4
Priced USD/t 167.8 318.6 267.0 233.6 225.9 229.7 231.0 231.2 230.2 230.9 231.6 230.6
COARSE GRAINS
OECDb
Production mt 508.6 567.2 567.8 576.2 590.1 601.2 608.1 611.8 617.4 625.3 630.2 637.2
Consumption mt 488.7 546.7 549.8 556.1 563.2 571.9 577.6 581.9 585.5 591.4 595.4 600.8
Closing stocks mt 102.1 79.9 70.3 68.2 72.9 78.4 82.0 84.4 87.2 89.8 91.7 94.8
Non-OECD
Production mt 456.3 491.9 507.3 514.6 523.1 534.1 539.9 545.5 551.7 562.0 571.3 579.5
Consumption mt 482.2 516.6 532.8 542.8 547.9 553.3 564.4 573.3 582.4 591.3 602.2 611.3
Closing stocks mt 126.3 123.7 125.7 119.8 117.2 121.8 124.2 123.9 122.2 124.1 126.2 127.7
WORLDc
Production mt 964.9 1 059.1 1 075.0 1 090.8 1 113.3 1 135.2 1 148.0 1 157.4 1 169.0 1 187.3 1 201.5 1 216.7
Consumption mt 970.9 1 063.4 1 082.6 1 098.9 1 111.1 1 125.1 1 142.0 1 155.3 1 168.0 1 182.7 1 197.6 1 212.1
Closing stocks mt 228.3 203.6 196.1 188.0 190.1 200.3 206.2 208.3 209.3 213.9 217.8 222.4
Pricee USD/t 113.2 181.3 185.3 185.0 189.0 188.4 178.5 173.0 173.2 170.9 166.6 164.6
RICE
OECDb
Production mt 22.2 21.0 21.9 22.3 22.3 21.9 21.8 21.9 21.9 21.9 21.8 21.7
Consumption mt 22.8 23.0 22.6 22.6 22.6 22.6 22.5 22.5 22.5 22.4 22.4 22.4
Closing stocks mt 6.8 5.3 5.4 5.3 5.4 5.4 5.3 5.2 5.1 5.1 5.0 5.0
Non-OECD
Production mt 387.5 410.8 416.9 424.2 426.4 429.0 434.0 437.6 442.2 446.9 450.4 453.2
Consumption mt 399.2 416.5 415.1 418.1 426.2 431.8 434.4 437.0 441.4 445.9 449.7 452.8
Closing stocks mt 85.7 73.6 74.5 80.3 80.1 76.6 75.6 75.7 76.0 76.5 76.6 76.4
WORLDc
Production mt 409.7 431.8 438.8 446.5 448.7 450.9 455.9 459.5 464.1 468.7 472.2 475.0
Consumption mt 422.0 439.5 437.8 440.8 448.8 454.4 456.9 459.4 463.8 468.4 472.1 475.2
Closing stocks mt 92.5 78.8 79.9 85.6 85.5 81.9 80.9 80.9 81.2 81.5 81.6 81.4
Pricef USD/t 262.3 361.0 390.6 367.9 330.7 326.7 337.2 340.3 335.6 333.8 332.5 334.5
a) Beginning crop marketing year. b) Excludes Iceland but includes the 8 EU members that are not members of the OECD. c) Source of historic data is USDA. d) No. 2 hard red winter wheat, ordinary protein, USA f.o.b. Gulf Ports (June/May), less EEP payments where applicable. e) No. 2 yellow corn, US f.o.b. Gulf Ports (September/August). f) Milled, 100%, grade b, Nominal Price Quote, NPQ, f.o.b. Bangkok (August/July)est.: estimate.Source: OECD and FAO Secretariats.
Phase2.book Page 64 Monday, May 26, 2008 4:48 PM
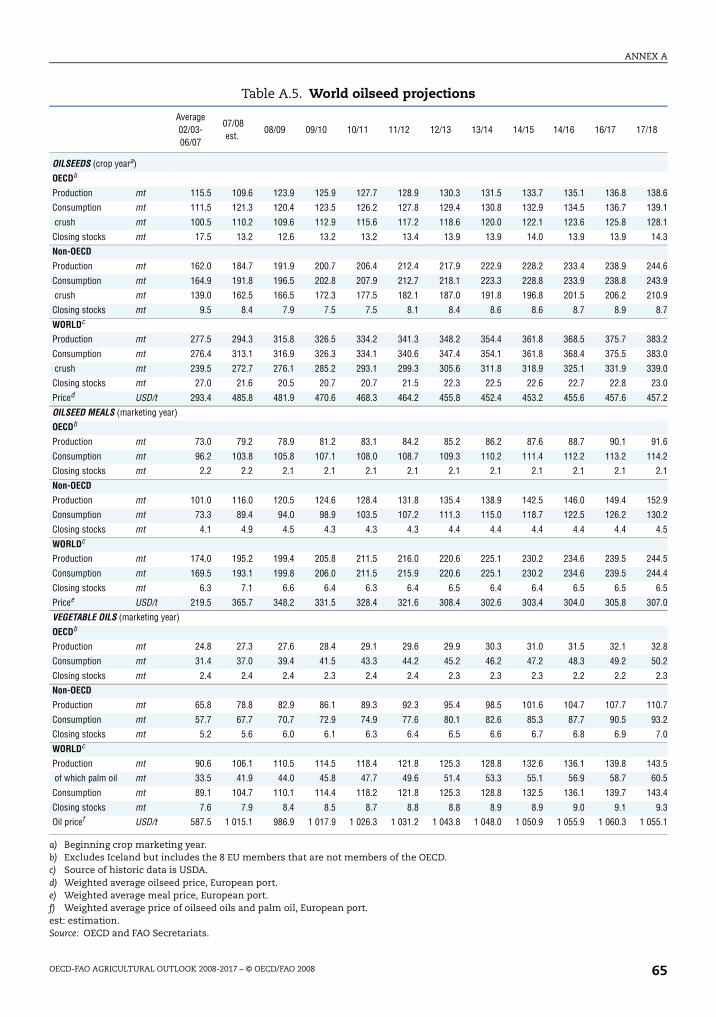
ANNEX A
OECD-FAO AGRICULTURAL OUTLOOK 2008-2017 – © OECD/FAO 2008 65
Table A.5. World oilseed projections
Average02/03-06/07
07/08est.
08/09 09/10 10/11 11/12 12/13 13/14 14/15 14/16 16/17 17/18
OILSEEDS (crop yeara)
OECDb
Production mt 115.5 109.6 123.9 125.9 127.7 128.9 130.3 131.5 133.7 135.1 136.8 138.6
Consumption mt 111.5 121.3 120.4 123.5 126.2 127.8 129.4 130.8 132.9 134.5 136.7 139.1
crush mt 100.5 110.2 109.6 112.9 115.6 117.2 118.6 120.0 122.1 123.6 125.8 128.1
Closing stocks mt 17.5 13.2 12.6 13.2 13.2 13.4 13.9 13.9 14.0 13.9 13.9 14.3
Non-OECD
Production mt 162.0 184.7 191.9 200.7 206.4 212.4 217.9 222.9 228.2 233.4 238.9 244.6
Consumption mt 164.9 191.8 196.5 202.8 207.9 212.7 218.1 223.3 228.8 233.9 238.8 243.9
crush mt 139.0 162.5 166.5 172.3 177.5 182.1 187.0 191.8 196.8 201.5 206.2 210.9
Closing stocks mt 9.5 8.4 7.9 7.5 7.5 8.1 8.4 8.6 8.6 8.7 8.9 8.7
WORLDc
Production mt 277.5 294.3 315.8 326.5 334.2 341.3 348.2 354.4 361.8 368.5 375.7 383.2
Consumption mt 276.4 313.1 316.9 326.3 334.1 340.6 347.4 354.1 361.8 368.4 375.5 383.0
crush mt 239.5 272.7 276.1 285.2 293.1 299.3 305.6 311.8 318.9 325.1 331.9 339.0
Closing stocks mt 27.0 21.6 20.5 20.7 20.7 21.5 22.3 22.5 22.6 22.7 22.8 23.0
Priced USD/t 293.4 485.8 481.9 470.6 468.3 464.2 455.8 452.4 453.2 455.6 457.6 457.2
OILSEED MEALS (marketing year)
OECDb
Production mt 73.0 79.2 78.9 81.2 83.1 84.2 85.2 86.2 87.6 88.7 90.1 91.6
Consumption mt 96.2 103.8 105.8 107.1 108.0 108.7 109.3 110.2 111.4 112.2 113.2 114.2
Closing stocks mt 2.2 2.2 2.1 2.1 2.1 2.1 2.1 2.1 2.1 2.1 2.1 2.1
Non-OECD
Production mt 101.0 116.0 120.5 124.6 128.4 131.8 135.4 138.9 142.5 146.0 149.4 152.9
Consumption mt 73.3 89.4 94.0 98.9 103.5 107.2 111.3 115.0 118.7 122.5 126.2 130.2
Closing stocks mt 4.1 4.9 4.5 4.3 4.3 4.3 4.4 4.4 4.4 4.4 4.4 4.5
WORLDc
Production mt 174.0 195.2 199.4 205.8 211.5 216.0 220.6 225.1 230.2 234.6 239.5 244.5
Consumption mt 169.5 193.1 199.8 206.0 211.5 215.9 220.6 225.1 230.2 234.6 239.5 244.4
Closing stocks mt 6.3 7.1 6.6 6.4 6.3 6.4 6.5 6.4 6.4 6.5 6.5 6.5
Pricee USD/t 219.5 365.7 348.2 331.5 328.4 321.6 308.4 302.6 303.4 304.0 305.8 307.0
VEGETABLE OILS (marketing year)
OECDb
Production mt 24.8 27.3 27.6 28.4 29.1 29.6 29.9 30.3 31.0 31.5 32.1 32.8
Consumption mt 31.4 37.0 39.4 41.5 43.3 44.2 45.2 46.2 47.2 48.3 49.2 50.2
Closing stocks mt 2.4 2.4 2.4 2.3 2.4 2.4 2.3 2.3 2.3 2.2 2.2 2.3
Non-OECD
Production mt 65.8 78.8 82.9 86.1 89.3 92.3 95.4 98.5 101.6 104.7 107.7 110.7
Consumption mt 57.7 67.7 70.7 72.9 74.9 77.6 80.1 82.6 85.3 87.7 90.5 93.2
Closing stocks mt 5.2 5.6 6.0 6.1 6.3 6.4 6.5 6.6 6.7 6.8 6.9 7.0
WORLDc
Production mt 90.6 106.1 110.5 114.5 118.4 121.8 125.3 128.8 132.6 136.1 139.8 143.5
of which palm oil mt 33.5 41.9 44.0 45.8 47.7 49.6 51.4 53.3 55.1 56.9 58.7 60.5
Consumption mt 89.1 104.7 110.1 114.4 118.2 121.8 125.3 128.8 132.5 136.1 139.7 143.4
Closing stocks mt 7.6 7.9 8.4 8.5 8.7 8.8 8.8 8.9 8.9 9.0 9.1 9.3
Oil pricef USD/t 587.5 1 015.1 986.9 1 017.9 1 026.3 1 031.2 1 043.8 1 048.0 1 050.9 1 055.9 1 060.3 1 055.1
a) Beginning crop marketing year. b) Excludes Iceland but includes the 8 EU members that are not members of the OECD. c) Source of historic data is USDA. d) Weighted average oilseed price, European port. e) Weighted average meal price, European port. f) Weighted average price of oilseed oils and palm oil, European port. est: estimation.Source: OECD and FAO Secretariats.
Phase2.book Page 65 Monday, May 26, 2008 4:48 PM
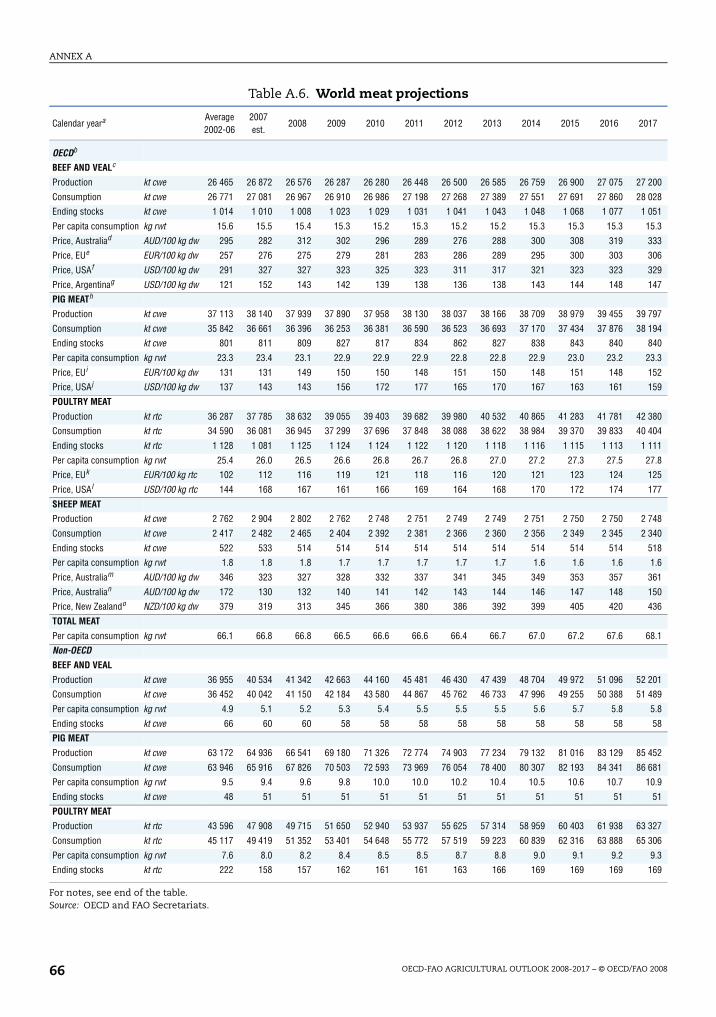
ANNEX A
OECD-FAO AGRICULTURAL OUTLOOK 2008-2017 – © OECD/FAO 200866
Table A.6. World meat projections
Calendar yeara Average2002-06
2007est.
2008 2009 2010 2011 2012 2013 2014 2015 2016 2017
OECDb
BEEF AND VEALc
Production kt cwe 26 465 26 872 26 576 26 287 26 280 26 448 26 500 26 585 26 759 26 900 27 075 27 200
Consumption kt cwe 26 771 27 081 26 967 26 910 26 986 27 198 27 268 27 389 27 551 27 691 27 860 28 028
Ending stocks kt cwe 1 014 1 010 1 008 1 023 1 029 1 031 1 041 1 043 1 048 1 068 1 077 1 051
Per capita consumption kg rwt 15.6 15.5 15.4 15.3 15.2 15.3 15.2 15.2 15.3 15.3 15.3 15.3
Price, Australiad AUD/100 kg dw 295 282 312 302 296 289 276 288 300 308 319 333
Price, EUe EUR/100 kg dw 257 276 275 279 281 283 286 289 295 300 303 306
Price, USAf USD/100 kg dw 291 327 327 323 325 323 311 317 321 323 323 329
Price, Argentinag USD/100 kg dw 121 152 143 142 139 138 136 138 143 144 148 147
PIG MEATh
Production kt cwe 37 113 38 140 37 939 37 890 37 958 38 130 38 037 38 166 38 709 38 979 39 455 39 797
Consumption kt cwe 35 842 36 661 36 396 36 253 36 381 36 590 36 523 36 693 37 170 37 434 37 876 38 194
Ending stocks kt cwe 801 811 809 827 817 834 862 827 838 843 840 840
Per capita consumption kg rwt 23.3 23.4 23.1 22.9 22.9 22.9 22.8 22.8 22.9 23.0 23.2 23.3
Price, EUi EUR/100 kg dw 131 131 149 150 150 148 151 150 148 151 148 152
Price, USAj USD/100 kg dw 137 143 143 156 172 177 165 170 167 163 161 159
POULTRY MEAT
Production kt rtc 36 287 37 785 38 632 39 055 39 403 39 682 39 980 40 532 40 865 41 283 41 781 42 380
Consumption kt rtc 34 590 36 081 36 945 37 299 37 696 37 848 38 088 38 622 38 984 39 370 39 833 40 404
Ending stocks kt rtc 1 128 1 081 1 125 1 124 1 124 1 122 1 120 1 118 1 116 1 115 1 113 1 111
Per capita consumption kg rwt 25.4 26.0 26.5 26.6 26.8 26.7 26.8 27.0 27.2 27.3 27.5 27.8
Price, EUk EUR/100 kg rtc 102 112 116 119 121 118 116 120 121 123 124 125
Price, USAl USD/100 kg rtc 144 168 167 161 166 169 164 168 170 172 174 177
SHEEP MEAT
Production kt cwe 2 762 2 904 2 802 2 762 2 748 2 751 2 749 2 749 2 751 2 750 2 750 2 748
Consumption kt cwe 2 417 2 482 2 465 2 404 2 392 2 381 2 366 2 360 2 356 2 349 2 345 2 340
Ending stocks kt cwe 522 533 514 514 514 514 514 514 514 514 514 518
Per capita consumption kg rwt 1.8 1.8 1.8 1.7 1.7 1.7 1.7 1.7 1.6 1.6 1.6 1.6
Price, Australiam AUD/100 kg dw 346 323 327 328 332 337 341 345 349 353 357 361
Price, Australian AUD/100 kg dw 172 130 132 140 141 142 143 144 146 147 148 150
Price, New Zealando NZD/100 kg dw 379 319 313 345 366 380 386 392 399 405 420 436
TOTAL MEAT
Per capita consumption kg rwt 66.1 66.8 66.8 66.5 66.6 66.6 66.4 66.7 67.0 67.2 67.6 68.1
Non-OECD
BEEF AND VEAL
Production kt cwe 36 955 40 534 41 342 42 663 44 160 45 481 46 430 47 439 48 704 49 972 51 096 52 201
Consumption kt cwe 36 452 40 042 41 150 42 184 43 580 44 867 45 762 46 733 47 996 49 255 50 388 51 489
Per capita consumption kg rwt 4.9 5.1 5.2 5.3 5.4 5.5 5.5 5.5 5.6 5.7 5.8 5.8
Ending stocks kt cwe 66 60 60 58 58 58 58 58 58 58 58 58
PIG MEAT
Production kt cwe 63 172 64 936 66 541 69 180 71 326 72 774 74 903 77 234 79 132 81 016 83 129 85 452
Consumption kt cwe 63 946 65 916 67 826 70 503 72 593 73 969 76 054 78 400 80 307 82 193 84 341 86 681
Per capita consumption kg rwt 9.5 9.4 9.6 9.8 10.0 10.0 10.2 10.4 10.5 10.6 10.7 10.9
Ending stocks kt cwe 48 51 51 51 51 51 51 51 51 51 51 51
POULTRY MEAT
Production kt rtc 43 596 47 908 49 715 51 650 52 940 53 937 55 625 57 314 58 959 60 403 61 938 63 327
Consumption kt rtc 45 117 49 419 51 352 53 401 54 648 55 772 57 519 59 223 60 839 62 316 63 888 65 306
Per capita consumption kg rwt 7.6 8.0 8.2 8.4 8.5 8.5 8.7 8.8 9.0 9.1 9.2 9.3
Ending stocks kt rtc 222 158 157 162 161 161 163 166 169 169 169 169
For notes, see end of the table.Source: OECD and FAO Secretariats.
Phase2.book Page 66 Monday, May 26, 2008 4:48 PM
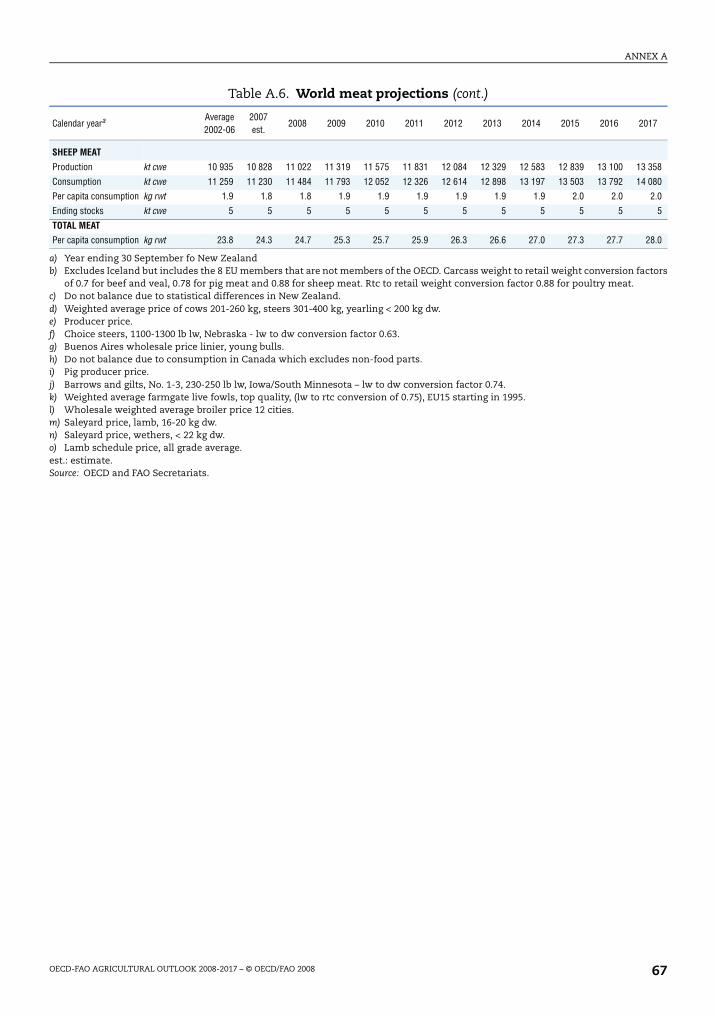
ANNEX A
OECD-FAO AGRICULTURAL OUTLOOK 2008-2017 – © OECD/FAO 2008 67
SHEEP MEAT
Production kt cwe 10 935 10 828 11 022 11 319 11 575 11 831 12 084 12 329 12 583 12 839 13 100 13 358
Consumption kt cwe 11 259 11 230 11 484 11 793 12 052 12 326 12 614 12 898 13 197 13 503 13 792 14 080
Per capita consumption kg rwt 1.9 1.8 1.8 1.9 1.9 1.9 1.9 1.9 1.9 2.0 2.0 2.0
Ending stocks kt cwe 5 5 5 5 5 5 5 5 5 5 5 5
TOTAL MEAT
Per capita consumption kg rwt 23.8 24.3 24.7 25.3 25.7 25.9 26.3 26.6 27.0 27.3 27.7 28.0
a) Year ending 30 September fo New Zealand b) Excludes Iceland but includes the 8 EU members that are not members of the OECD. Carcass weight to retail weight conversion factors
of 0.7 for beef and veal, 0.78 for pig meat and 0.88 for sheep meat. Rtc to retail weight conversion factor 0.88 for poultry meat. c) Do not balance due to statistical differences in New Zealand. d) Weighted average price of cows 201-260 kg, steers 301-400 kg, yearling < 200 kg dw. e) Producer price. f) Choice steers, 1100-1300 lb lw, Nebraska - lw to dw conversion factor 0.63. g) Buenos Aires wholesale price linier, young bulls. h) Do not balance due to consumption in Canada which excludes non-food parts. i) Pig producer price. j) Barrows and gilts, No. 1-3, 230-250 lb lw, Iowa/South Minnesota – lw to dw conversion factor 0.74. k) Weighted average farmgate live fowls, top quality, (lw to rtc conversion of 0.75), EU15 starting in 1995. l) Wholesale weighted average broiler price 12 cities. m) Saleyard price, lamb, 16-20 kg dw. n) Saleyard price, wethers, < 22 kg dw.o) Lamb schedule price, all grade average.est.: estimate.Source: OECD and FAO Secretariats.
Table A.6. World meat projections (cont.)
Calendar yeara Average2002-06
2007est.
2008 2009 2010 2011 2012 2013 2014 2015 2016 2017
Phase2.book Page 67 Monday, May 26, 2008 4:48 PM
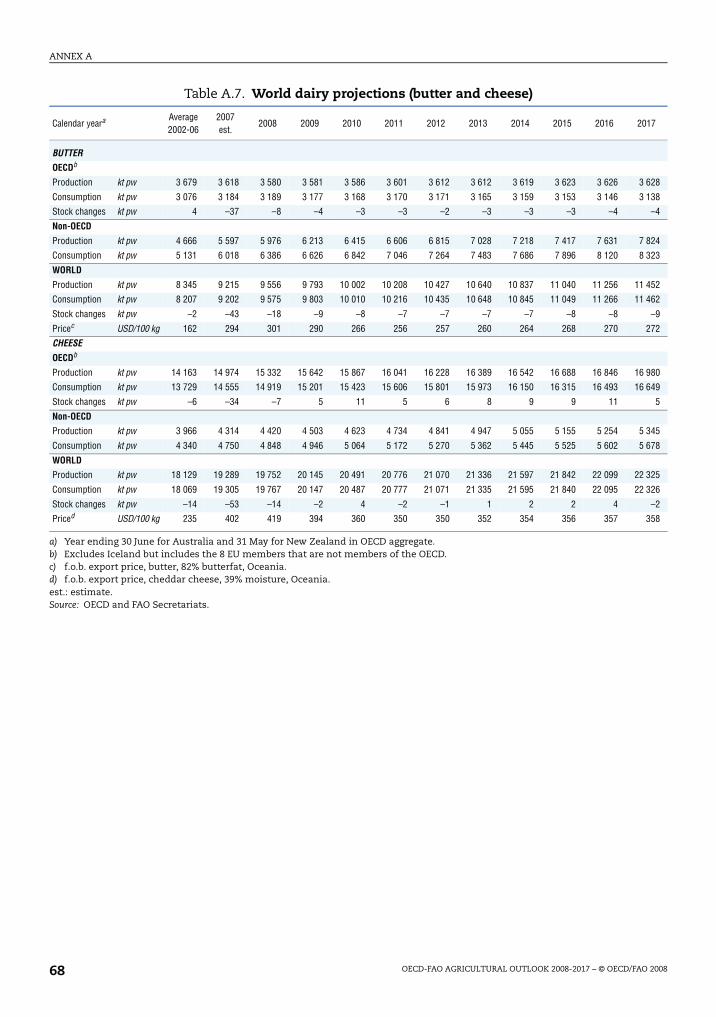
ANNEX A
OECD-FAO AGRICULTURAL OUTLOOK 2008-2017 – © OECD/FAO 200868
Table A.7. World dairy projections (butter and cheese)
Calendar yeara Average2002-06
2007est.
2008 2009 2010 2011 2012 2013 2014 2015 2016 2017
BUTTEROECDb
Production kt pw 3 679 3 618 3 580 3 581 3 586 3 601 3 612 3 612 3 619 3 623 3 626 3 628
Consumption kt pw 3 076 3 184 3 189 3 177 3 168 3 170 3 171 3 165 3 159 3 153 3 146 3 138
Stock changes kt pw 4 –37 –8 –4 –3 –3 –2 –3 –3 –3 –4 –4
Non-OECD
Production kt pw 4 666 5 597 5 976 6 213 6 415 6 606 6 815 7 028 7 218 7 417 7 631 7 824
Consumption kt pw 5 131 6 018 6 386 6 626 6 842 7 046 7 264 7 483 7 686 7 896 8 120 8 323
WORLD
Production kt pw 8 345 9 215 9 556 9 793 10 002 10 208 10 427 10 640 10 837 11 040 11 256 11 452
Consumption kt pw 8 207 9 202 9 575 9 803 10 010 10 216 10 435 10 648 10 845 11 049 11 266 11 462
Stock changes kt pw –2 –43 –18 –9 –8 –7 –7 –7 –7 –8 –8 –9
Pricec USD/100 kg 162 294 301 290 266 256 257 260 264 268 270 272
CHEESE
OECDb
Production kt pw 14 163 14 974 15 332 15 642 15 867 16 041 16 228 16 389 16 542 16 688 16 846 16 980
Consumption kt pw 13 729 14 555 14 919 15 201 15 423 15 606 15 801 15 973 16 150 16 315 16 493 16 649
Stock changes kt pw –6 –34 –7 5 11 5 6 8 9 9 11 5
Non-OECD
Production kt pw 3 966 4 314 4 420 4 503 4 623 4 734 4 841 4 947 5 055 5 155 5 254 5 345
Consumption kt pw 4 340 4 750 4 848 4 946 5 064 5 172 5 270 5 362 5 445 5 525 5 602 5 678
WORLD
Production kt pw 18 129 19 289 19 752 20 145 20 491 20 776 21 070 21 336 21 597 21 842 22 099 22 325
Consumption kt pw 18 069 19 305 19 767 20 147 20 487 20 777 21 071 21 335 21 595 21 840 22 095 22 326
Stock changes kt pw –14 –53 –14 –2 4 –2 –1 1 2 2 4 –2
Priced USD/100 kg 235 402 419 394 360 350 350 352 354 356 357 358
a) Year ending 30 June for Australia and 31 May for New Zealand in OECD aggregate. b) Excludes Iceland but includes the 8 EU members that are not members of the OECD. c) f.o.b. export price, butter, 82% butterfat, Oceania. d) f.o.b. export price, cheddar cheese, 39% moisture, Oceania. est.: estimate.Source: OECD and FAO Secretariats.
Phase2.book Page 68 Monday, May 26, 2008 4:48 PM
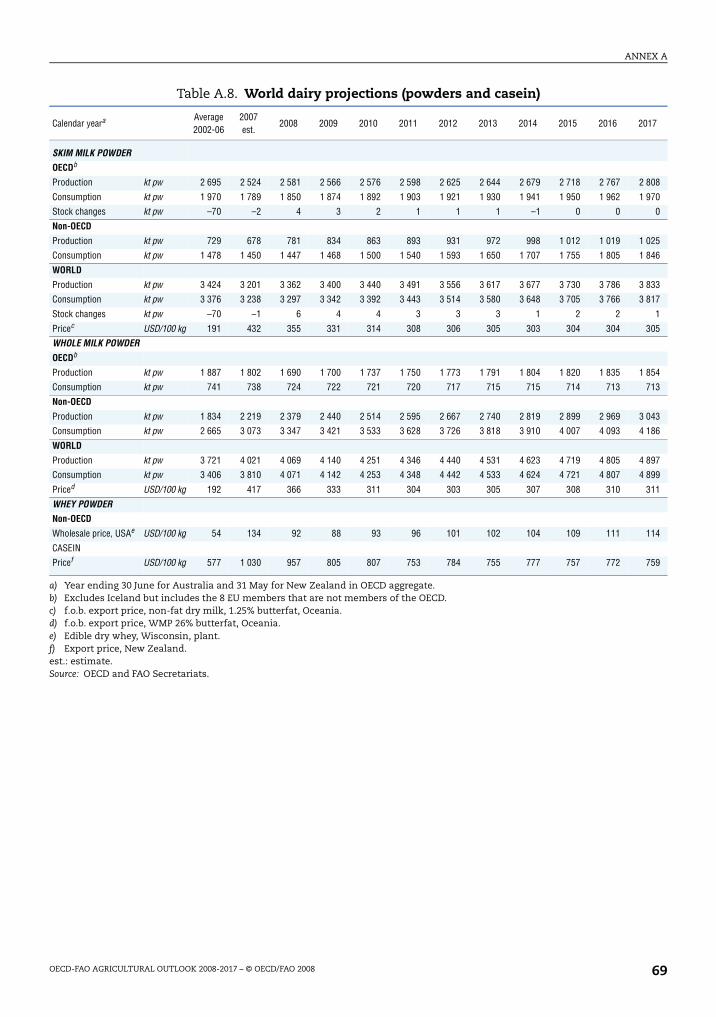
ANNEX A
OECD-FAO AGRICULTURAL OUTLOOK 2008-2017 – © OECD/FAO 2008 69
Table A.8. World dairy projections (powders and casein)
Calendar yeara Average2002-06
2007est.
2008 2009 2010 2011 2012 2013 2014 2015 2016 2017
SKIM MILK POWDEROECDb
Production kt pw 2 695 2 524 2 581 2 566 2 576 2 598 2 625 2 644 2 679 2 718 2 767 2 808
Consumption kt pw 1 970 1 789 1 850 1 874 1 892 1 903 1 921 1 930 1 941 1 950 1 962 1 970
Stock changes kt pw –70 –2 4 3 2 1 1 1 –1 0 0 0
Non-OECD
Production kt pw 729 678 781 834 863 893 931 972 998 1 012 1 019 1 025
Consumption kt pw 1 478 1 450 1 447 1 468 1 500 1 540 1 593 1 650 1 707 1 755 1 805 1 846
WORLD
Production kt pw 3 424 3 201 3 362 3 400 3 440 3 491 3 556 3 617 3 677 3 730 3 786 3 833
Consumption kt pw 3 376 3 238 3 297 3 342 3 392 3 443 3 514 3 580 3 648 3 705 3 766 3 817
Stock changes kt pw –70 –1 6 4 4 3 3 3 1 2 2 1
Pricec USD/100 kg 191 432 355 331 314 308 306 305 303 304 304 305
WHOLE MILK POWDER
OECDb
Production kt pw 1 887 1 802 1 690 1 700 1 737 1 750 1 773 1 791 1 804 1 820 1 835 1 854
Consumption kt pw 741 738 724 722 721 720 717 715 715 714 713 713
Non-OECD
Production kt pw 1 834 2 219 2 379 2 440 2 514 2 595 2 667 2 740 2 819 2 899 2 969 3 043
Consumption kt pw 2 665 3 073 3 347 3 421 3 533 3 628 3 726 3 818 3 910 4 007 4 093 4 186
WORLD
Production kt pw 3 721 4 021 4 069 4 140 4 251 4 346 4 440 4 531 4 623 4 719 4 805 4 897
Consumption kt pw 3 406 3 810 4 071 4 142 4 253 4 348 4 442 4 533 4 624 4 721 4 807 4 899
Priced USD/100 kg 192 417 366 333 311 304 303 305 307 308 310 311
WHEY POWDERNon-OECD
Wholesale price, USAe USD/100 kg 54 134 92 88 93 96 101 102 104 109 111 114
CASEIN
Pricef USD/100 kg 577 1 030 957 805 807 753 784 755 777 757 772 759
a) Year ending 30 June for Australia and 31 May for New Zealand in OECD aggregate. b) Excludes Iceland but includes the 8 EU members that are not members of the OECD. c) f.o.b. export price, non-fat dry milk, 1.25% butterfat, Oceania. d) f.o.b. export price, WMP 26% butterfat, Oceania. e) Edible dry whey, Wisconsin, plant. f) Export price, New Zealand.est.: estimate.Source: OECD and FAO Secretariats.
Phase2.book Page 69 Monday, May 26, 2008 4:48 PM
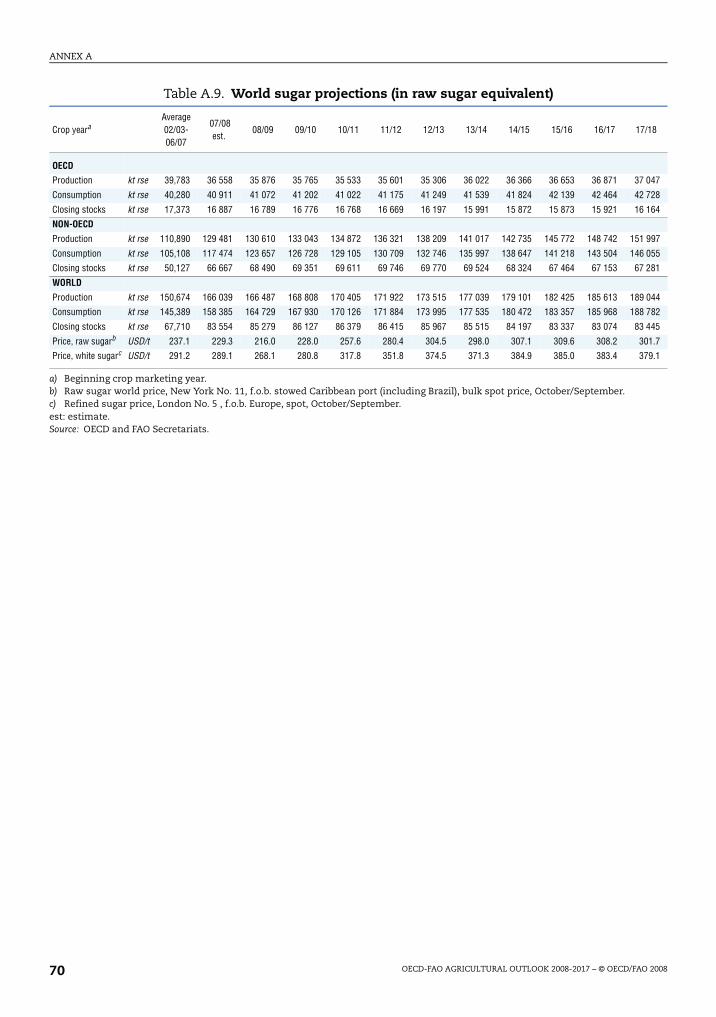
ANNEX A
OECD-FAO AGRICULTURAL OUTLOOK 2008-2017 – © OECD/FAO 200870
Table A.9. World sugar projections (in raw sugar equivalent)
Crop yearaAverage02/03-06/07
07/08est.
08/09 09/10 10/11 11/12 12/13 13/14 14/15 15/16 16/17 17/18
OECD
Production kt rse 39,783 36 558 35 876 35 765 35 533 35 601 35 306 36 022 36 366 36 653 36 871 37 047
Consumption kt rse 40,280 40 911 41 072 41 202 41 022 41 175 41 249 41 539 41 824 42 139 42 464 42 728
Closing stocks kt rse 17,373 16 887 16 789 16 776 16 768 16 669 16 197 15 991 15 872 15 873 15 921 16 164
NON-OECD
Production kt rse 110,890 129 481 130 610 133 043 134 872 136 321 138 209 141 017 142 735 145 772 148 742 151 997
Consumption kt rse 105,108 117 474 123 657 126 728 129 105 130 709 132 746 135 997 138 647 141 218 143 504 146 055
Closing stocks kt rse 50,127 66 667 68 490 69 351 69 611 69 746 69 770 69 524 68 324 67 464 67 153 67 281
WORLD
Production kt rse 150,674 166 039 166 487 168 808 170 405 171 922 173 515 177 039 179 101 182 425 185 613 189 044
Consumption kt rse 145,389 158 385 164 729 167 930 170 126 171 884 173 995 177 535 180 472 183 357 185 968 188 782
Closing stocks kt rse 67,710 83 554 85 279 86 127 86 379 86 415 85 967 85 515 84 197 83 337 83 074 83 445
Price, raw sugarb USD/t 237.1 229.3 216.0 228.0 257.6 280.4 304.5 298.0 307.1 309.6 308.2 301.7
Price, white sugarc USD/t 291.2 289.1 268.1 280.8 317.8 351.8 374.5 371.3 384.9 385.0 383.4 379.1
a) Beginning crop marketing year. b) Raw sugar world price, New York No. 11, f.o.b. stowed Caribbean port (including Brazil), bulk spot price, October/September. c) Refined sugar price, London No. 5 , f.o.b. Europe, spot, October/September.est: estimate.Source: OECD and FAO Secretariats.
Phase2.book Page 70 Monday, May 26, 2008 4:48 PM
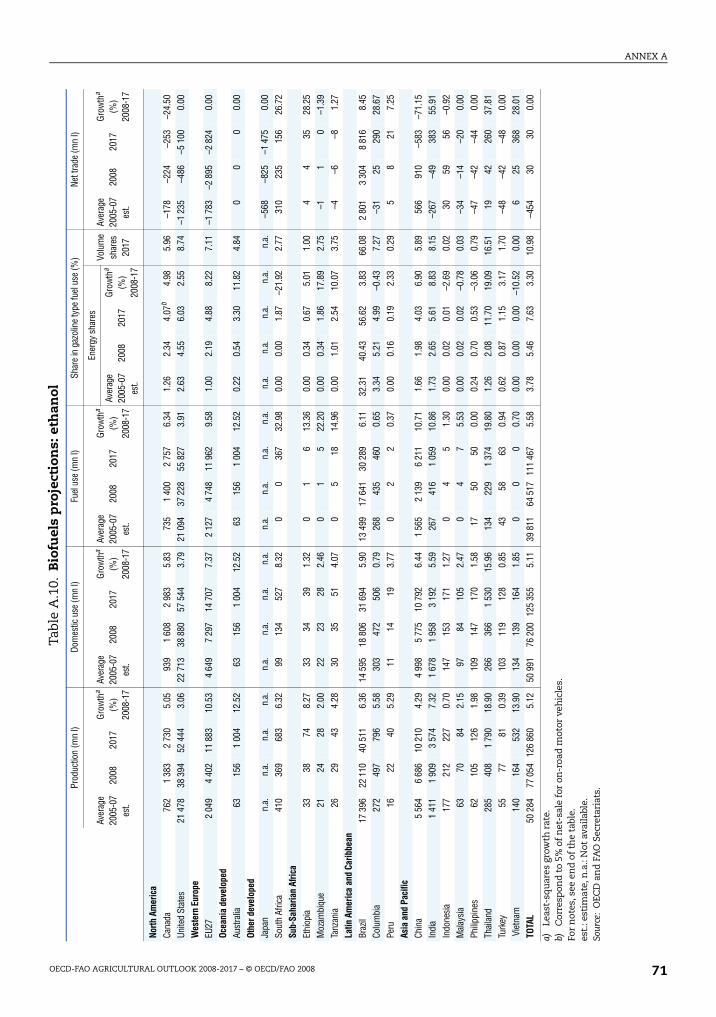
ANNEX A
OECD-FAO AGRICULTURAL OUTLOOK 2008-2017 – © OECD/FAO 2008 71
Tabl
e A
.10.
Bio
fuel
s p
roje
ctio
ns:
eth
anol
Prod
uctio
n (m
n l)
Dom
estic
use
(mn
l)Fu
el u
se (m
n l)
Shar
e in
gaz
olin
e ty
pe fu
el u
se(%
)Ne
t tra
de (m
n l)
Aver
age
2005
-07
est.
2008
2017
Grow
tha
(%)
2008
-17
Aver
age
2005
-07
est.
2008
2017
Grow
tha
(%)
2008
-17
Aver
age
2005
-07
est.
2008
2017
Grow
tha
(%)
2008
-17
Ener
gy s
hare
sVo
lum
e sh
ares
20
17
Aver
age
2005
-07
est.
2008
2017
Grow
tha
(%)
2008
-17
Aver
age
2005
-07
est.
2008
2017
Grow
tha
(%)
2008
-17
North
Am
eric
aCa
nada
762
1 38
32
730
5.05
939
1 60
82
983
5.83
735
1 40
02
757
6.34
1.26
2.34
4.07
b4.
985.
96–1
78–2
24–2
53–2
4.50
Unite
d St
ates
21 4
7838
394
52 4
443.
0622
713
38 8
8057
544
3.79
21 0
9437
228
55 8
273.
912.
634.
556.
032.
558.
74–1
235
–486
–5 1
000.
00W
este
rn E
urop
eEU
272
049
4 40
211
883
10.5
34
649
7 29
714
707
7.37
2 12
74
748
11 9
629.
581.
002.
194.
888.
227.
11–1
783
–2 8
95–2
824
0.00
Ocea
nia
deve
lope
dAu
stra
lia63
156
1 00
412
.52
6315
61
004
12.5
263
156
1 00
412
.52
0.22
0.54
3.30
11.8
24.
840
00
0.00
Othe
r dev
elop
edJa
pan
n.a.
n.a.
n.a.
n.a.
n.a.
n.a.
n.a.
n.a.
n.a.
n.a.
n.a.
n.a.
n.a.
n.a.
n.a.
n.a.
n.a.
–568
–825
–1 4
750.
00So
uth
Afric
a41
036
968
36.
3299
134
527
8.32
00
367
32.9
80.
000.
001.
87–2
1.92
2.77
310
235
156
26.7
2Su
b-Sa
haria
n Af
rica
Ethi
opia
3338
748.
2733
3439
1.32
01
613
.36
0.00
0.34
0.67
5.01
1.00
44
3528
.25
Moz
ambi
que
2124
282.
0022
2328
2.46
01
522
.20
0.00
0.34
1.86
17.8
92.
75–1
10
–1.3
9Ta
nzan
ia26
2943
4.28
3035
514.
070
518
14.9
60.
001.
012.
5410
.07
3.75
–4–6
–81.
27La
tin A
mer
ica
and
Carib
bean
Braz
il17
396
22 1
1040
511
6.36
14 5
9518
806
31 6
945.
9013
499
17 6
4130
289
6.11
32.3
140
.43
56.6
23.
8366
.08
2 80
13
304
8 81
68.
45Co
lum
bia
272
497
796
5.58
303
472
506
0.79
268
435
460
0.65
3.34
5.21
4.99
–0.4
37.
27–3
125
290
28.6
7Pe
ru16
2240
5.29
1114
193.
770
22
0.37
0.00
0.16
0.19
2.33
0.29
58
217.
25As
ia a
nd P
acifi
cCh
ina
5 56
46
686
10 2
104.
294
998
5 77
510
792
6.44
1 56
52
139
6 21
110
.71
1.66
1.98
4.03
6.90
5.89
566
910
–583
–71.
15In
dia
1 41
11
909
3 57
47.
321
678
1 95
83
192
5.59
267
416
1 05
910
.86
1.73
2.65
5.61
8.83
8.15
–267
–49
383
55.9
1In
done
sia
177
212
227
0.70
147
153
171
1.27
04
51.
300.
000.
020.
01–2
.69
0.02
3059
56–0
.92
Mal
aysi
a63
7084
2.15
9784
105
2.47
04
75.
530.
000.
020.
02–0
.78
0.03
–34
–14
–20
0.00
Philip
pine
s62
105
126
1.98
109
147
170
1.58
1750
500.
000.
240.
700.
53–3
.06
0.79
–47
–42
–44
0.00
Thail
and
285
408
1 79
018
.90
266
366
1 53
015
.96
134
229
1 37
419
.80
1.26
2.08
11.7
019
.09
16.5
119
4226
037
.81
Turk
ey55
7781
0.39
103
119
128
0.85
4358
630.
940.
620.
871.
153.
171.
70–4
8–4
2–4
80.
00 V
ietn
am
140
164
532
13.9
013
413
916
41.
850
00
0.70
0.00
0.00
0.00
–10.
520.
006
2536
828
.01
TOTA
L50
284
77 0
5412
6 86
05.
1250
991
76 2
0012
5 35
55.
1139
811
64 5
1711
1 46
75.
583.
785.
467.
633.
3010
.98
–454
3030
0.00
a)Le
ast-
squ
ares
gro
wth
rat
e.b)
Cor
resp
ond
to
5% o
f n
et-s
ale
for
on-r
oad
mot
or v
ehic
les.
For
not
es, s
eeen
d o
f th
e ta
ble.
est.
: est
imat
e, n
.a.:
Not
ava
ilabl
e.So
urce
:O
ECD
an
d F
AO
Sec
reta
riat
s.
Phase2.book Page 71 Monday, May 26, 2008 4:48 PM
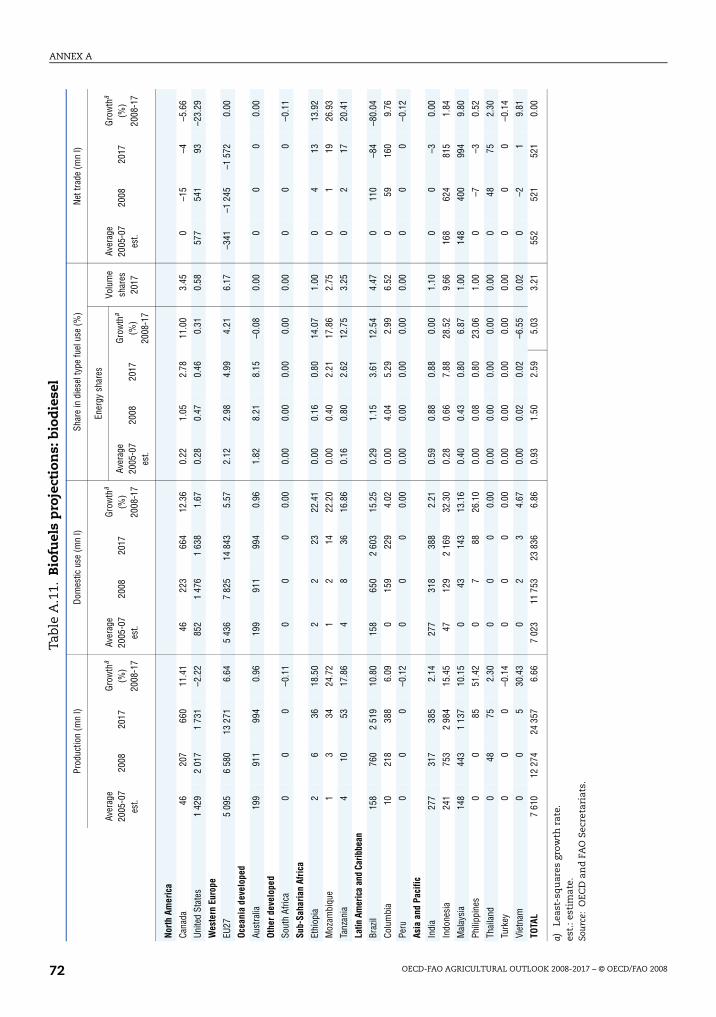
ANNEX A
OECD-FAO AGRICULTURAL OUTLOOK 2008-2017 – © OECD/FAO 200872
Tabl
e A
.11.
Bio
fuel
s p
roje
ctio
ns:
bio
die
sel
Prod
uctio
n (m
n l)
Dom
estic
use
(mn
l)Sh
are
in d
iese
l typ
e fu
el u
se (%
)N
et tr
ade
(mn
l)
Aver
age
2005
-07
est.
2008
2017
Gro
wth
a (%
) 20
08-1
7
Aver
age
2005
-07
est.
2008
2017
Grow
tha
(%)
2008
-17
Ener
gy s
hare
sVo
lum
e sh
ares
20
17
Aver
age
2005
-07
est.
2008
2017
Gro
wth
a (%
) 20
08-1
7
Aver
age
2005
-07
est.
2008
2017
Gro
wth
a (%
) 20
08-1
7
Nort
h Am
eric
a
Cana
da46
207
660
11.4
146
223
664
12.3
60.
221.
052.
7811
.00
3.45
0–1
5–4
–5.6
6
Unite
d St
ates
1 42
92
017
1 73
1–2
.22
852
1 47
61
638
1.67
0.28
0.47
0.46
0.31
0.58
577
541
93–2
3.29
Wes
tern
Eur
ope
EU27
5 09
56
580
13 2
716.
645
436
7 82
514
843
5.57
2.12
2.98
4.99
4.21
6.17
–341
–1 2
45–1
572
0.00
Ocea
nia
deve
lope
d
Aust
ralia
199
911
994
0.96
199
911
994
0.96
1.82
8.21
8.15
–0.0
80.
000
00
0.00
Othe
r dev
elop
ed
Sout
h Af
rica
00
0–0
.11
00
00.
000.
000.
000.
000.
000.
000
00
–0.1
1
Sub-
Saha
rian
Afri
ca
Ethi
opia
26
3618
.50
22
2322
.41
0.00
0.16
0.80
14.0
71.
000
413
13.9
2
Moz
ambi
que
13
3424
.72
12
1422
.20
0.00
0.40
2.21
17.8
62.
750
119
26.9
3
Tanz
ania
410
5317
.86
48
3616
.86
0.16
0.80
2.62
12.7
53.
250
217
20.4
1
Latin
Am
eric
a an
d Ca
ribbe
an
Braz
il15
876
02
519
10.8
015
865
02
603
15.2
50.
291.
153.
6112
.54
4.47
011
0–8
4–8
0.04
Colu
mbi
a10
218
388
6.09
015
922
94.
020.
004.
045.
292.
996.
520
5916
09.
76
Peru
00
0–0
.12
00
00.
000.
000.
000.
000.
000.
000
00
–0.1
2
Asia
and
Pac
ific
Indi
a27
731
738
52.
1427
731
838
82.
210.
590.
880.
880.
001.
100
0–3
0.00
Indo
nesi
a24
175
32
984
15.4
547
129
2 16
932
.30
0.28
0.66
7.88
28.5
29.
6616
862
481
51.
84
Mal
aysi
a14
844
31
137
10.1
50
4314
313
.16
0.40
0.43
0.80
6.87
1.00
148
400
994
9.80
Phili
ppin
es0
085
51.4
20
788
26.1
00.
000.
080.
8023
.06
1.00
0–7
–30.
52
Thai
land
048
752.
300
00
0.00
0.00
0.00
0.00
0.00
0.00
048
752.
30
Turk
ey0
00
–0.1
40
00
0.00
0.00
0.00
0.00
0.00
0.00
00
0–0
.14
Viet
nam
0
05
30.4
30
23
4.67
0.00
0.02
0.02
–6.5
50.
020
–21
9.81
TOTA
L7
610
12 2
7424
357
6.66
7 02
311
753
23 8
366.
860.
931.
502.
595.
033.
2155
252
152
10.
00
a)Le
ast-
squ
ares
gro
wth
rat
e.es
t.: e
stim
ate.
Sou
rce:
OEC
D a
nd
FA
O S
ecre
tari
ats.
Phase2.book Page 72 Monday, May 26, 2008 4:48 PM
OECD PUBLICATIONS, 2, rue André-Pascal, 75775 PARIS CEDEX 16
PRINTED IN FRANCE
(00 2008 73 1 P) – No. 88801 2008
Phase2.book Page 73 Monday, May 26, 2008 4:48 PM