Indian Agricultural Outlook Rabi Season
30
Indian Agricultural Outlook Rabi Season March 7, 2017 NCAER Research Team
Transcript of Indian Agricultural Outlook Rabi Season

Indian Agricultural Outlook
Rabi Season
March 7, 2017
NCAER Research Team

Team Members
Rajesh Chadha, A. Govindan, V.P. Ahuja, Laxmi Joshi, Charu
Jain, Tarujyoti Buragohain and Anusha
and
Shashanka Bhide, Director, MIDS, Chennai
Parmod Kumar, Professor, ISEC, Bangalore
Structure of the Rabi Outlook Report
I. Coverage
II. Global Outlook
III. Domestic Outlook
IV. Implications and concluding remarks

I. COVERAGE
Commodities for study
• Rice
• Wheat
• Coarse grains
• Pulses
• Edible Oilseeds and Oils
• Sugarcane and Sugar
• Potato
• Onion
• Banana
• Milk
Coverage of the Study
• Global trends of production consumption, trade,
stocks and prices
• Domestic production, utilisation, trade and
prices:
– Past trends and assessment of the Rabi season
2017

II. GLOBAL OUTLOOK
Global Situation and Outlook
• The global economy is estimated to have further
weakened in 2016
• The lacklustre performance of the global economy
in recent years has weakened trade growth
• India’s exports of agriculture and allied products
declined by 2.7 per cent in April-December 2016.
Imports picked up by 6.1 per cent.
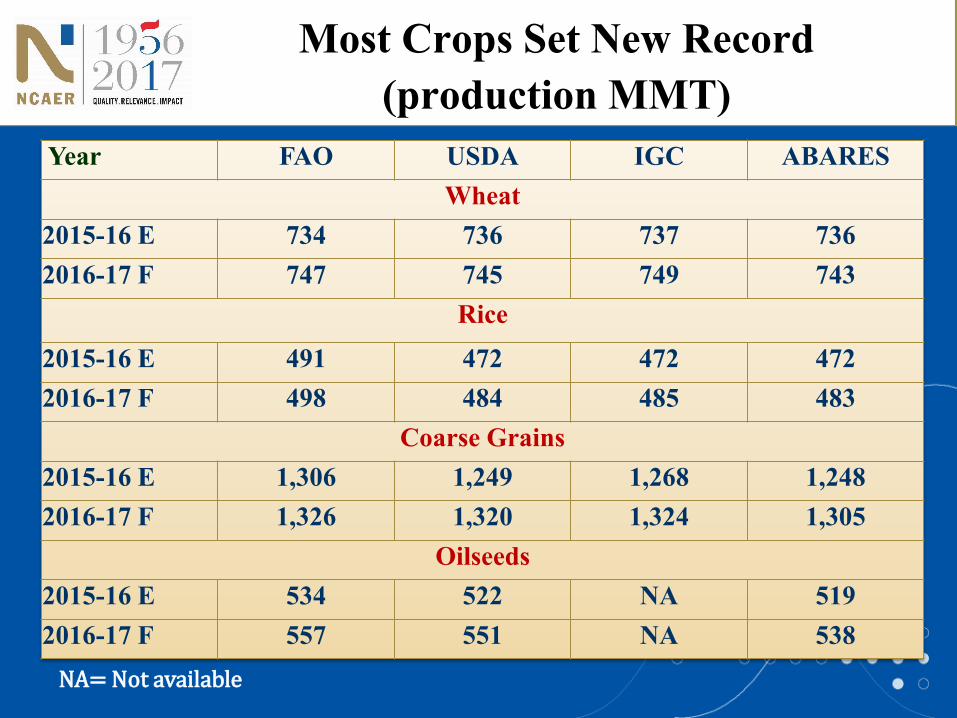
Most Crops Set New Record
(production MMT)
NA= Not available
Year FAO USDA IGC ABARES
Wheat
2015-16 E 734 736 737 736
2016-17 F 747 745 749 743
Rice
2015-16 E 491 472 472 472
2016-17 F 498 484 485 483
Coarse Grains
2015-16 E 1,306 1,249 1,268 1,248
2016-17 F 1,326 1,320 1,324 1,305
Oilseeds
2015-16 E 534 522 NA 519
2016-17 F 557 551 NA 538
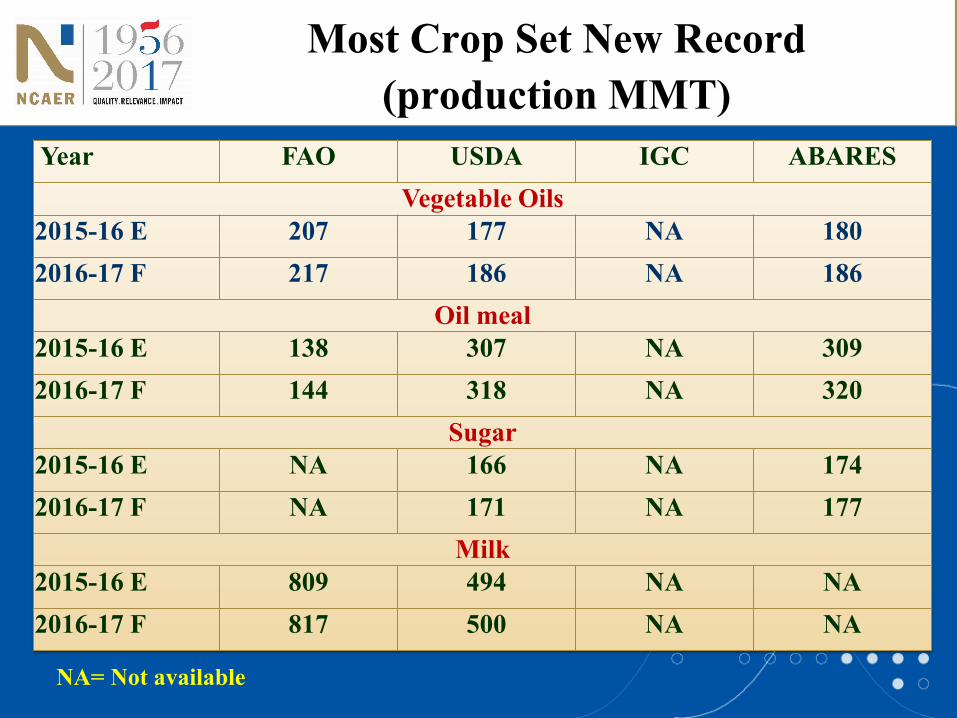
Most Crop Set New Record
(production MMT)
NA= Not available
Year FAO USDA IGC ABARES
Vegetable Oils
2015-16 E 207 177 NA 180
2016-17 F 217 186 NA 186
Oil meal
2015-16 E 138 307 NA 309
2016-17 F 144 318 NA 320
Sugar
2015-16 E NA 166 NA 174
2016-17 F NA 171 NA 177
Milk
2015-16 E 809 494 NA NA
2016-17 F 817 500 NA NA
NA= Not available
Global Production in 2016-17
(compared to 2015-16 level)
• Significant increase in production of wheat, rice,
and coarse grains
• Modest increase in production of oilseeds, oil,
oil meal, sugar and milk
• Pulse production outlook in major exporting
countries better than in 2015-16
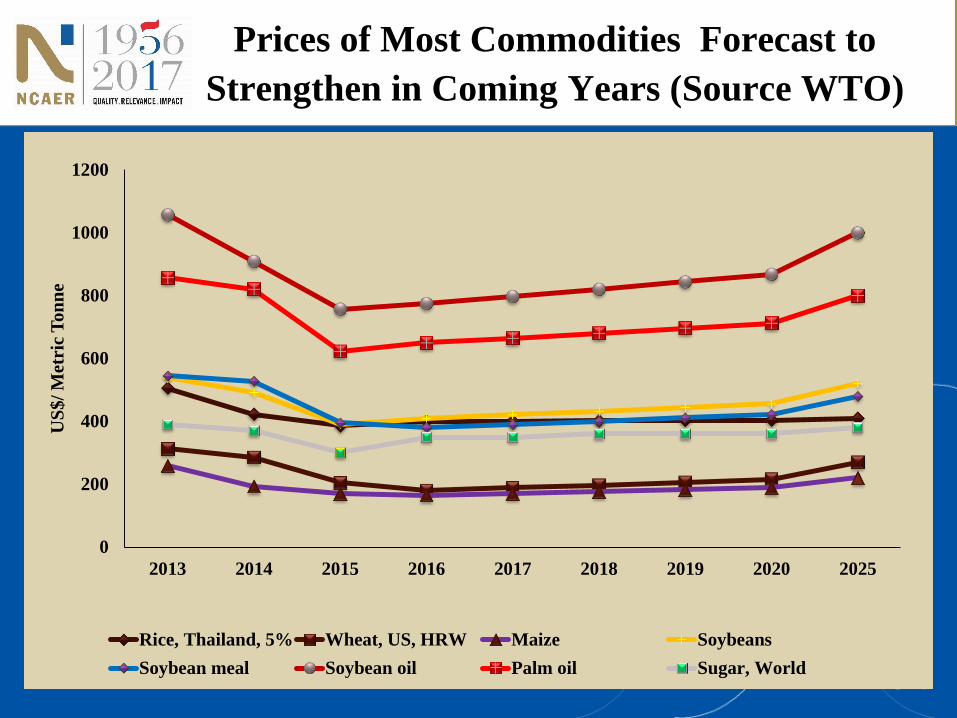
Prices of Most Commodities Forecast to
Strengthen in Coming Years (Source WTO)
0
200
400
600
800
1000
1200
2013 2014 2015 2016 2017 2018 2019 2020 2025
US
$/
Met
ric
To
nn
e
Rice, Thailand, 5% Wheat, US, HRW Maize Soybeans
Soybean meal Soybean oil Palm oil Sugar, World

III. DOMESTIC OUTLOOK
Rabi Outlook Mixed
• Monsoon (June-Sep 2016) rainfall near normal,
7 per cent below LPA
• Below normal post-monsoon rains, poor winter
rains and early rise in temperature
• Lower than normal water level in major
reservoirs
• Significant increase in the Minimum Support
Prices of pulses and oilseeds and moderate
increase in wheat
Domestic Outlook
• Agriculture sector is projected to register a healthy growth rate of 4.1
percent from the drought-impacted growth rate of 2 per cent in 2015-
16
• After a record or near record production of most Kharif crops in 2016-
17, thanks to favourable monsoon rains after two years of deficient
monsoon rains, India is heading for a record or near record production
of most Rabi crops
• The government is working seriously for the betterment of farmers
and farming through various innovative programs which include the
Pradhan Mantri Krishi Sinchai Yojana (PMKSY), creation of a
National Market for Agricultural produce through electronic platform
(eNAM), and the Pradhan Mantri Fasal Bima Yojana (PMFBY) and is
aiming at doubling farmers' income by 2022-23
Projected Range for Output
The 2016-17 Rabi Production was derived based on two
approaches
• Trend growth rate, the monsoon deviation from the LPA (7 per cent below
LPA) and the incidence of El Nino in a year using a dummy variable and a
cyclical trend variable in the case of sugarcane; in the case of rice and
kharif pulses, a dummy variable is used for the period 2011-12 to 2015-16,
individually to reflect the rise in output that was not captured by the trend
and may reflect some of the shifts in production across states besides
productivity improvements.
• No El Nino effect was specifically captured but crop specific rainfall
indices were used to assess output based on assumption regarding monsoon
period rainfall (kharif crops) and Post monsoon (for Rabi). In the case of
onion, potato, banana and milk the second approach was used for
estimation in which overall June-September rainfall was used as an
explanatory variable rather than commodity specific rainfall index.
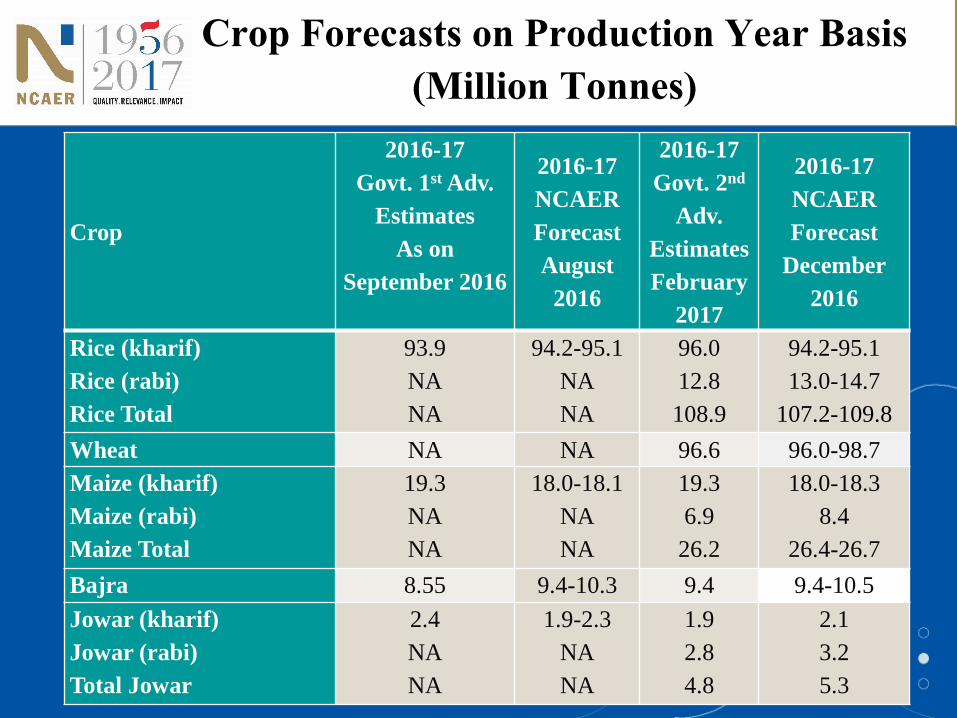
Crop Forecasts on Production Year Basis
(Million Tonnes)
Crop
2016-17
Govt. 1st Adv.
Estimates
As on
September 2016
2016-17
NCAER
Forecast
August
2016
2016-17
Govt. 2nd
Adv.
Estimates
February
2017
2016-17
NCAER
Forecast
December
2016
Rice (kharif)
Rice (rabi)
Rice Total
93.9
NA
NA
94.2-95.1
NA
NA
96.0
12.8
108.9
94.2-95.1
13.0-14.7
107.2-109.8
Wheat NA NA 96.6 96.0-98.7
Maize (kharif)
Maize (rabi)
Maize Total
19.3
NA
NA
18.0-18.1
NA
NA
19.3
6.9
26.2
18.0-18.3
8.4
26.4-26.7
Bajra 8.55 9.4-10.3 9.4 9.4-10.5
Jowar (kharif)
Jowar (rabi)
Total Jowar
2.4
NA
NA
1.9-2.3
NA
NA
1.9
2.8
4.8
2.1
3.2
5.3
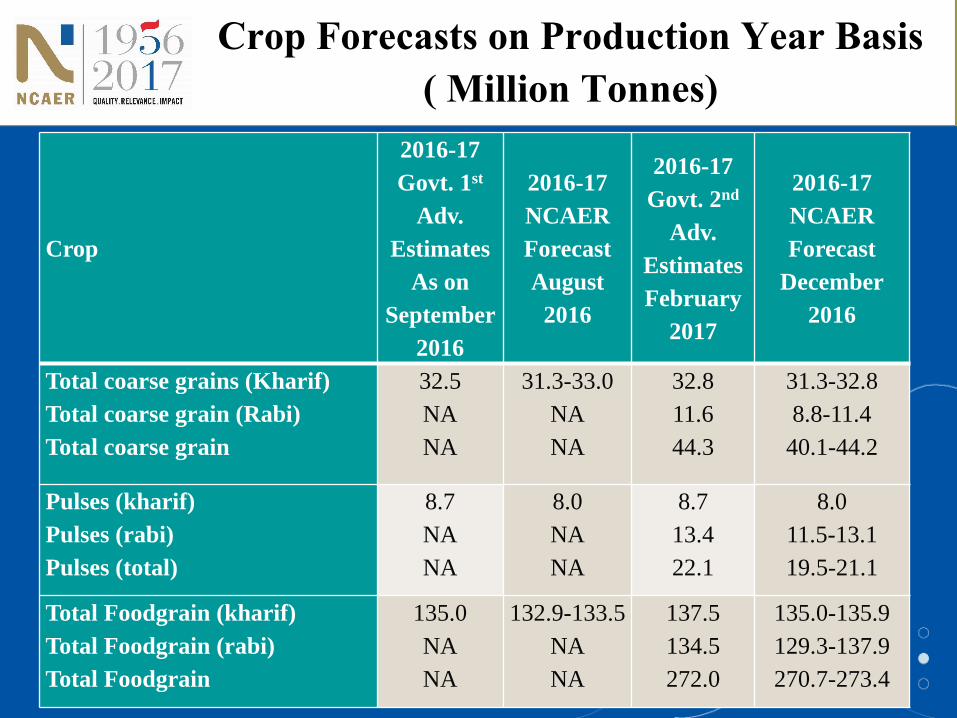
Crop Forecasts on Production Year Basis
( Million Tonnes)
Crop
2016-17
Govt. 1st
Adv.
Estimates
As on
September
2016
2016-17
NCAER
Forecast
August
2016
2016-17
Govt. 2nd
Adv.
Estimates
February
2017
2016-17
NCAER
Forecast
December
2016
Total coarse grains (Kharif)
Total coarse grain (Rabi)
Total coarse grain
32.5
NA
NA
31.3-33.0
NA
NA
32.8
11.6
44.3
31.3-32.8
8.8-11.4
40.1-44.2
Pulses (kharif)
Pulses (rabi)
Pulses (total)
8.7
NA
NA
8.0
NA
NA
8.7
13.4
22.1
8.0
11.5-13.1
19.5-21.1
Total Foodgrain (kharif)
Total Foodgrain (rabi)
Total Foodgrain
135.0
NA
NA
132.9-133.5
NA
NA
137.5
134.5
272.0
135.0-135.9
129.3-137.9
270.7-273.4
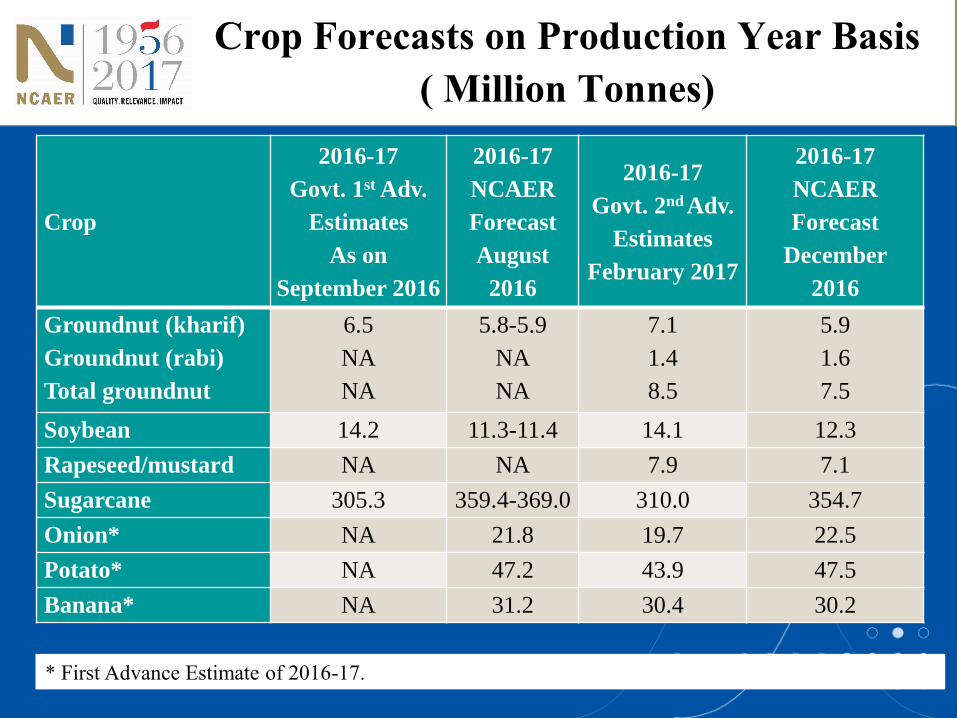
Crop Forecasts on Production Year Basis
( Million Tonnes)
Crop
2016-17
Govt. 1st Adv.
Estimates
As on
September 2016
2016-17
NCAER
Forecast
August
2016
2016-17
Govt. 2nd Adv.
Estimates
February 2017
2016-17
NCAER
Forecast
December
2016
Groundnut (kharif)
Groundnut (rabi)
Total groundnut
6.5
NA
NA
5.8-5.9
NA
NA
7.1
1.4
8.5
5.9
1.6
7.5
Soybean 14.2 11.3-11.4 14.1 12.3
Rapeseed/mustard NA NA 7.9 7.1
Sugarcane 305.3 359.4-369.0 310.0 354.7
Onion* NA 21.8 19.7 22.5
Potato* NA 47.2 43.9 47.5
Banana* NA 31.2 30.4 30.2
* First Advance Estimate of 2016-17.
Food Inflation Dips
• Y-o-Y food WPI inflation peaked at 12.6 per cent
in July 2016, exhibited a downward trend
plummeting to -0.6 per cent in January 2017, the
lowest level since September 2015, significantly
lower than the food inflation of 6.5 per cent a year
ago.
• CPI-based food inflation also dipped to 0.5 per
cent in January 2017, lower than 1.4 per cent
recorded in December, and 6.9 per cent a year ago.
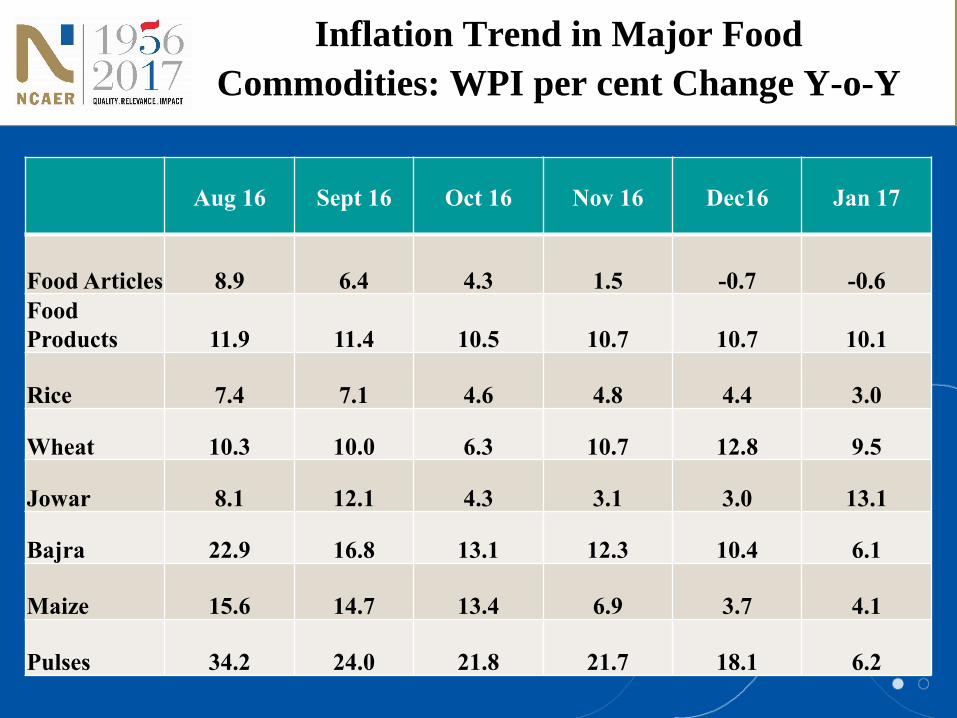
Inflation Trend in Major Food
Commodities: WPI per cent Change Y-o-Y
Aug 16 Sept 16 Oct 16 Nov 16 Dec16 Jan 17
Food Articles 8.9 6.4 4.3 1.5 -0.7 -0.6
Food
Products 11.9 11.4 10.5 10.7 10.7 10.1
Rice 7.4 7.1 4.6 4.8 4.4 3.0
Wheat 10.3 10.0 6.3 10.7 12.8 9.5
Jowar 8.1 12.1 4.3 3.1 3.0 13.1
Bajra 22.9 16.8 13.1 12.3 10.4 6.1
Maize 15.6 14.7 13.4 6.9 3.7 4.1
Pulses 34.2 24.0 21.8 21.7 18.1 6.2
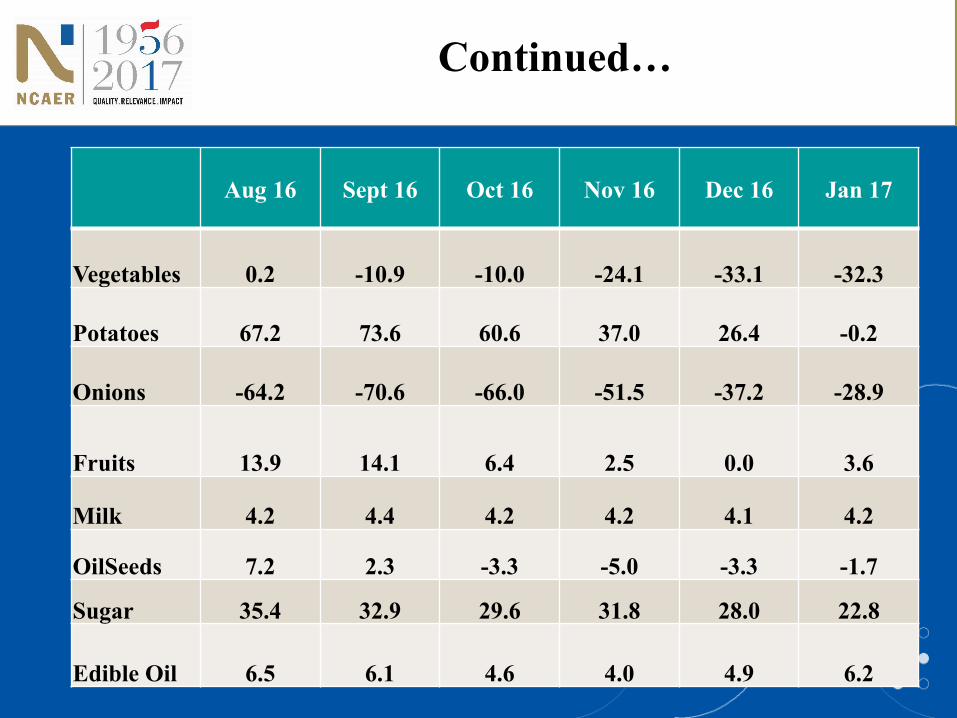
Continued…
Aug 16 Sept 16 Oct 16 Nov 16 Dec 16 Jan 17
Vegetables 0.2 -10.9 -10.0 -24.1 -33.1 -32.3
Potatoes 67.2 73.6 60.6 37.0 26.4 -0.2
Onions -64.2 -70.6 -66.0 -51.5 -37.2 -28.9
Fruits 13.9 14.1 6.4 2.5 0.0 3.6
Milk 4.2 4.4 4.2 4.2 4.1 4.2
OilSeeds 7.2 2.3 -3.3 -5.0 -3.3 -1.7
Sugar 35.4 32.9 29.6 31.8 28.0 22.8
Edible Oil 6.5 6.1 4.6 4.0 4.9 6.2
Commodities Influencing Food Price
Inflation
• Food commodities contributing to the weakening of
food inflation are rice, pulses, fruits and vegetables,
oilseeds, vegetable oils and onion
• Potato price inflation, however, continued to remain
strong. Wheat price also strengthens
• Pulses, onion, and potato prices (measured by WPI)
exhibited high degree of volatility, whereas most
cereals, milk, and vegetable oils showed low volatility
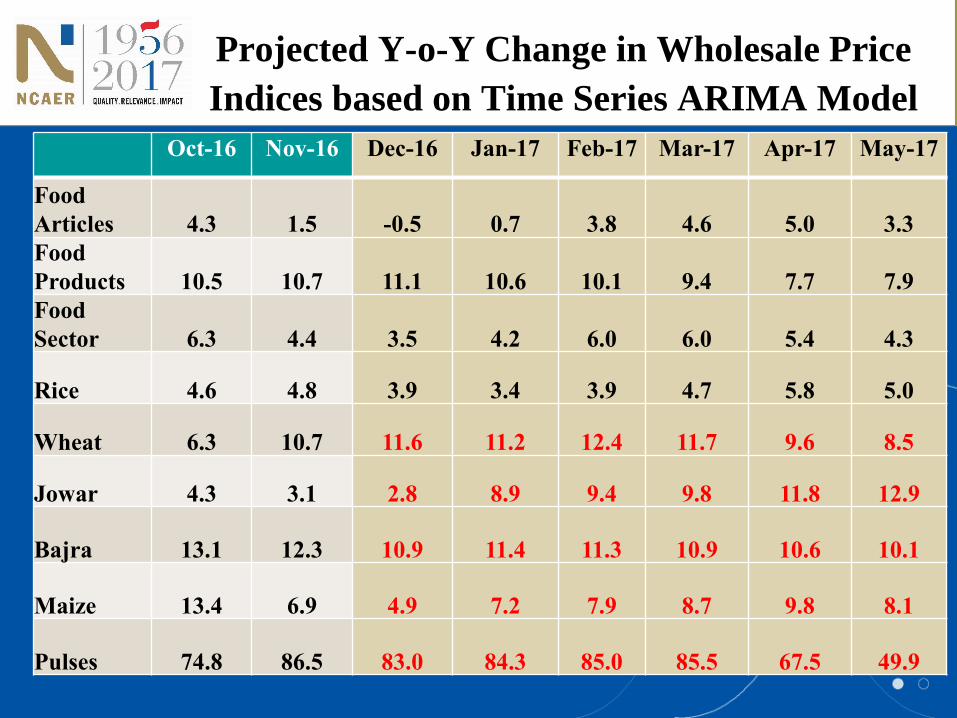
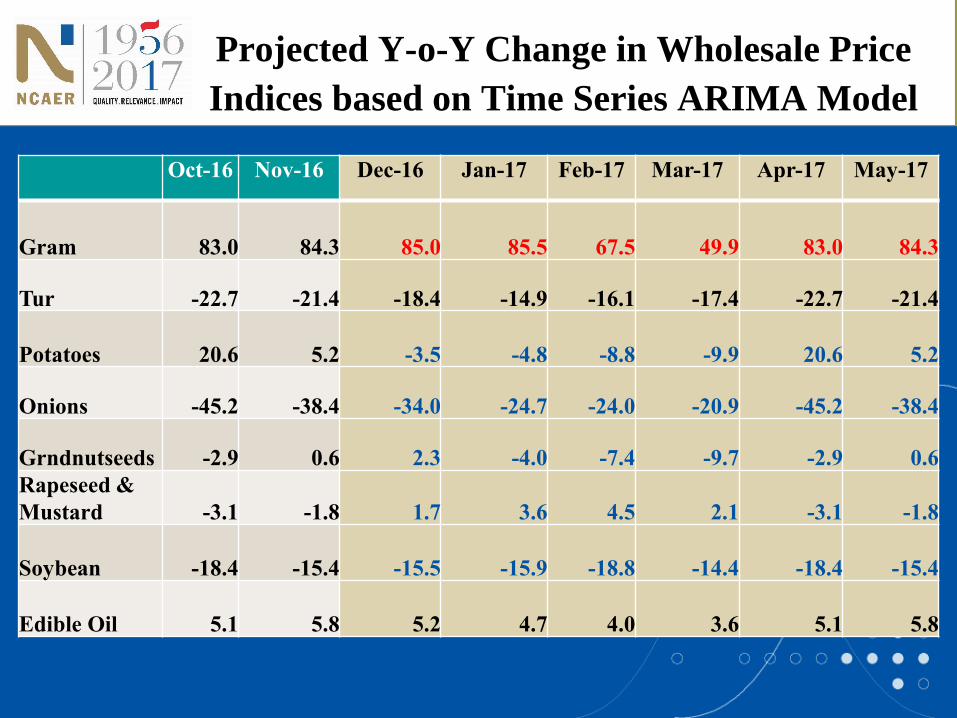
Projected Y-o-Y Change in Wholesale Price
Indices based on Time Series ARIMA Model
Oct-16 Nov-16 Dec-16 Jan-17 Feb-17 Mar-17 Apr-17 May-17
Food
Articles 4.3 1.5 -0.5 0.7 3.8 4.6 5.0 3.3
Food
Products 10.5 10.7 11.1 10.6 10.1 9.4 7.7 7.9
Food
Sector 6.3 4.4 3.5 4.2 6.0 6.0 5.4 4.3
Rice 4.6 4.8 3.9 3.4 3.9 4.7 5.8 5.0
Wheat 6.3 10.7 11.6 11.2 12.4 11.7 9.6 8.5
Jowar 4.3 3.1 2.8 8.9 9.4 9.8 11.8 12.9
Bajra 13.1 12.3 10.9 11.4 11.3 10.9 10.6 10.1
Maize 13.4 6.9 4.9 7.2 7.9 8.7 9.8 8.1
Pulses 74.8 86.5 83.0 84.3 85.0 85.5 67.5 49.9
Projected Y-o-Y Change in Wholesale Price
Indices based on Time Series ARIMA Model
Oct-16 Nov-16 Dec-16 Jan-17 Feb-17 Mar-17 Apr-17 May-17
Gram 83.0 84.3 85.0 85.5 67.5 49.9 83.0 84.3
Tur -22.7 -21.4 -18.4 -14.9 -16.1 -17.4 -22.7 -21.4
Potatoes 20.6 5.2 -3.5 -4.8 -8.8 -9.9 20.6 5.2
Onions -45.2 -38.4 -34.0 -24.7 -24.0 -20.9 -45.2 -38.4
Grndnutseeds -2.9 0.6 2.3 -4.0 -7.4 -9.7 -2.9 0.6
Rapeseed &
Mustard -3.1 -1.8 1.7 3.6 4.5 2.1 -3.1 -1.8
Soybean -18.4 -15.4 -15.5 -15.9 -18.8 -14.4 -18.4 -15.4
Edible Oil 5.1 5.8 5.2 4.7 4.0 3.6 5.1 5.8

IV. IMPLICATIONS AND
CONCLUDING REMARKS
India and the Global Scenario
• Global supplies of major food commodities are
adequate to meet overall demand and continue to
remain less volatile
• Global prices, mostly of sugar and oilseeds and
products likely to remain firm in 2017
• Exports of agricultural commodities from India could
face tough competition
• Weakening exchange rate of the rupee implies imports
maintain upward pressure on domestic prices
Implications for India
• In view of the shrinking government wheat stocks, projected to dip
to 6.5 million tonnes on April 1, 2017, the lowest April 1 stocks
level since 2008, and strengthening domestic wheat prices, large
scale wheat imports are taking place on private account. As global
wheat prices are likely to strengthen, imports are likely to become
costlier
• The recent weakening Indian rupee exchange rate against U.S.
dollar will also prove disadvantageous for Indian consumers of
food items such as vegetable oils and pulses but should support
exports
Concluding Remarks (India)
• After record or near record production of most Kharif crops in
2016-17, thanks to favourable monsoon rains in 2016 after two
years of deficient monsoon rains, India is heading for a record or
near record production of Rabi crops.
• Agriculture sector is projected to register a robust growth rate of
4.1 per cent from the drought- reduced growth rate of 2 per cent in
2015-16.
• The government is working seriously for the betterment of farmers
and farming through various innovative programs with the aim of
doubling farmers’ income in five years.
• Higher inflation expected in the next six months for rice, jowar,
maize, rapeseed and mustard, and a decline in the prices of wheat,
pulses, potato and onion.

Thank You