AD-A277 181
138
AD-A277 181 DIGISONDE 256 GENERAL DESCRIPTION OF THE COMPACT DIGITAL IONOSPHERIC $OUNDER K. Biblo S.W. Reinisch, O.F. Kitrosser ., .. I" / DECEMBER 11I FIRST EDITION 94-08534 UNIVERSITY OF LOWELL I CENTER FOR ATMOSPHERIC RESEARCH 450 Aiken Street Lowell, Massachusetts 011S4 '7 ,rA.YtPz-.t tI 0 v~
Transcript of AD-A277 181
AD-A277 181
DIGISONDE 256
GENERAL DESCRIPTION OF THE
COMPACT DIGITAL IONOSPHERIC $OUNDER
K. Biblo S.W. Reinisch, O.F. Kitrosser ., ..
I" /
DECEMBER 11I
FIRST EDITION94-08534
UNIVERSITY OF LOWELLI CENTER FOR ATMOSPHERIC RESEARCH
450 Aiken Street
Lowell, Massachusetts 011S4
'7
,rA.YtPz-.t tI 0 v~

DISCLAIMER NOTICI
THIS DOCUMENT IS BEST
QUALITY AVAILABLE. THE COPY
FURNISHED TO DTIC CONTAINED
A SIGNIFICANT NUMBER OF
PAGES WHICH DO NOT
REPRODUCE LEGIBLY.
TABLE OF CONTENTS
PEwe
SUMMARY I
1.0 INTRODUCTION 3
2.0 ORGANIZATION OF THE DIGISONDE 256 SYSTEM 5
2.1 Remote Operation 5
2.2 Phase Code and Bistatic Sounding
Synchronization 9
2.3 Maintenance 9
2.4 Calibration 9
2.5 Testing 12
2.6 Analog Monitoring 12
2.7 Other Applications 14
2.8 Acknowledgement 14
3.0 THE MAIN DIGISONDE CHASSIS 15
3.1 The Controller Microcomputer 15
3. 1.1 Description of the Controller
3.1.2 Programming of the Digisonde 256 18
3.2 Central Complex Correlator 26
3.3 Basic Timing and Data Flow 30
3.4 Interface Cards 42
3.5 Analog Cardt so
3.6 Output Computer 55
3.6.1 Processing of Ionogram Data 56
3.6.2 Tape Recording of Ionogram Data 57
3.6.3 Printing of Ionograms 59
3.6.4 Tape Recording of Drift Data 63
3.6.5 Realtime Printing of Drift Spectra 66
4.0 PERIPHERALS 69
4.1 Transmitter 69
4.1.1 Rack 69
4. 1.Z Final Amplifier 70
. . Pulse Power 70
4.1.4 Delay Line 72
4.1.5 Operation and Maintenance 73
4.2 Antenna Switch 76
4.3 Realtime lonogram Scaler 78
4.4 Magnetic Tape Drive so
4.5 Hardcopy Plotter 83
4.6 Ionogram Display and Film Recording 84
5.0 SPECIFICATIONS FOR DIGISONDE 256 85
6.0 REFERENCES 103
iv

LIST OF FIGURES
Figure No, Page
2.1 Digisonde 256 6
2.2 Digisonde 256 with Peripherals 7
2.3 Digisonde 256 Block Diagram 8
2.4 Alternating Vertical and
Oblique Soundings 10
2.5 Calibration Ionogram It
2.6 Film Recording Format 13
3.1 Main Digisonde Chassis; Top View 16
3.2 Main Digisonde Chassis; Bottom View 17
CORE Block Diagram 31
3.4 Octant for Phase * 38
3.5 Command Timing 41
3.6 B-Pulse Phase Code Leakage 47
3.7 Frequency Synthesis 52
3.8 RF Transceiver 54
3.9 Digicoder Fonts 64
4.1 Shunt M-Derived Low-Pass Filter 71
4.2 2 x 7 Turnstile Antenna Layout 77
4.3 Error Distribution Function for foF2 81
|. . , .~
K 1)I.
V.jv
LIST OF TABLES
Table No.
3.1 Time Correction Table 21
3.2 Drift Doppler Range and Resolution 28
3.3 Trig Argument Depending on Sample Number
N, Doppler Line Number D and Doppler
Spacing T3 33
3.4 DGS 256 Sample Advance 34
3.5 DGS 256-10 Log Trig Scaling 2I
3.6 Log Trig Function in Hexadecimal Notation 37
3.7 Binary Log Table 43
3.8 Log Magnitude Correction C and Phase * 44
3.9 Scope Monitor Program 46
3.10 64, 2 x 32 and 4 x 16 Pulse Sequence Codes
and Second and Third Window Correlation 49
3.11 Tape Recording Command P1 58
3.12a Record Format on Magnetic Tape for
PI = 1 (Routine MMM) 60
3. 12b Record Format on Magnetic Tape for P1 = 2 60
3.12c Record Format on Magnetic Tape for P1 = 3 60
3.12d Record Format on Magnetic Tape for PI = 4 60
3.13a Preface for Tape Recording 61
3.13b Preface for Tape Recording (Continued) 62
3.14 Ponogram On-Line Printing 65
3.15 Drift On-Line Printing 68
4.1 2 x 7 Antenna Switch DGS 18PS-B7
5.1A DOS 256 Sounding Time Per Frequency in
onogram F
5.1B DGS 256 Sounding Time Per Frequency in
.onogram 87
AC DoGS 256 Sounding Time Per Frequency in
5onog ram 88
5onD DOGS 6 Sounding Time Per Frequency 'n
lonogram 89
Vii
5.2 Frequency Steps DGS 256 90
5.3 DGS ?56 Number of Samples. Pulse
Rate and Width 91
5.4 Useful One and Two Chip Codes for
DGS 256 92
5.5 Receiver Attenuation in 6 (dBI Increments 94
5.6 DGS 256 Sample Ranges 95
5.7 DGS 256 lonogram Tasks 96
5.8 Definition of Antennas and Antenna
Configuration DGS 256-08 Antenna Drive 97
5.9 Zenith, Azimuth Angle and Polarization
Sequences for lonogram Mode DGS 256-08
Antenna Drive 98
5.10 DGS 256 lonogram Start 100
5.11 DGS 256 Drift Tasks 102
/
viii

GENERAL :.3SCRIPTION OF TlIl
COMPACT DIGITAL IONOSPHERIC SOUNDER PIGISONDE 256
K. Bibl, B.W. Reinisch, D.F. Kitro.ser
SUMMARY
After the technical and operational success of the earlier digital
ionosondes the new Digisonde 256 concept was chosen to combine the
simplicity of the Standard Digital Ionosonde DGS 128P with the
flexibility and the fast preprocessing speed of the Universal Digisonde
128PS. Contained in a standard 7-inch high chassis the Digisonde
256 includes a precise and fast digital frequency synthesizer, .i
transceiver for the frequ'ncy range from 0.4 to 30 MHz with
front-end tuning, a high-speed digitizer, a versatile multichannel
complex spectrum analyzer and a complete timing unit. These
subsystems are controlled by a built-in front-end microcomputer which
also programs the enclosed output microcomputer to optimize and
format the data for display and recording on magnetic tape and hard
copy.
Necessary peripheral equipment are a thermal dot printer and a
wide-band pulse transmitter, while the 2 x 7 antenna switch, the
magnetic tape recorder, the plasma display, and a post-processing
computer for automatic ionogram scaling are considered optional
peripherals.
Since the received data are multi-dimensional and the ionosphere
and the background noise and interference are extremely variable
with time and location, a system useful at any time and any location
on earth must fulfill very exacting specifications. When automatic
reduction of the ionospheric parameters is required even under
adverse conditions, all signal properties must be measured. Coherent
spectral integration and pulse coding are important for maximum
signal-to-noise improvements in cases of high interference conditions,
small transmitting antennas or low transmitter power limits. In snitc
of the complexity necessary for automatic recognition of polarization.
1
1.0 INTRODUCTION
The Center for Atmospheric Research of the University of Lowell
(ULCAR) gained substantial experience in the design and operation of
several digital sounding systems: a fixed frequency sounder for the
AFCRL aircraft (1q66), the Kinesende built for NOAA (1967), the Low
Frequency Sounder (1968) built for AFCRL, the Digisonde 128 (1970)
which was and is in use at several ionospheric stations of
AFCRL/AFGL and other institutes in U.S.A., Canada and Europe, the
Standard Digisonde 128P (1974) operating in Italy and Greece, the
Universal Digisorde 128PS (developed for DNA and AFGL, 'A??) and
the DM',SP Spacecraft prototype (built for RCA, 1970).
Triggered by a request for a bid by the Rutherford and
Appleton Laboratories, England, and the need of the Institut Royal
Meteorologiquc to improve its Digisonde system for monitoring thne
ionospheric motions we have conceived the new Digisonde 256. It
:ncludes all the features of the Universal Digisonde 128PS, used a-
scientific instruments in the equatorial and the aurora! regions of the
earth, but is even more compact than the Standard Digisonde 12SP
which was mainly meant for routine observation of the ionosphere.
All the experience acquired with the prototype Digisonde 12FS
installed for a year at Kwajalein, a Marshall Island in the West Pacific
near the geomagnetic equator, and the other two Digisondes 12SPS
installed at the AFGL Goose Bay Ionospheric Observatory in Labrador
and in the AFGL KC 135 airciaft to monitor the aurora ionosphere,
contributcd to the new design which has improved versati:ltv,
dynamic range and precision. By implementing two microprocessors
(type 8085) the programming procedure and the data output selection
have been simplified for the operator.
ULCAR has extensi-.e expuri'nce in automatic recognition of the
main echo traces in the onogramb (Reinisch et a!, 1981; Reinisch and
Huang, 1982) even under disturbed ionospheric conditions frequently
observed in the auroral zone and during equatorial nights (Bib!,
DoppIer speed and oblicity of the ionospheric echoes, the operation
anti the programming of the sounder are simple because of the
built-in microcomputers.
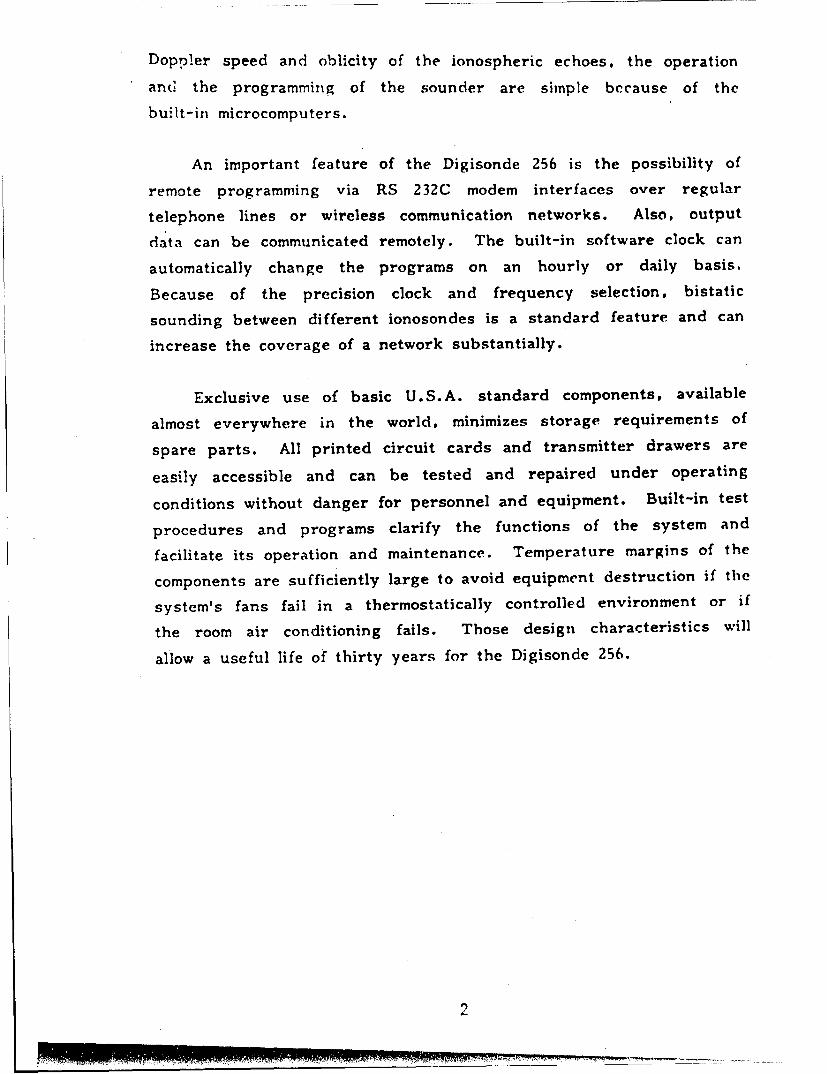
An important feature of the Digisonde 256 is the possibility of
remote programming via RS 232C modem interfaces over regular
telephone lines or wireless communication networks. Also, output
data can be communicated remotely. The built-in software clock can
automatically change the programs on an hourly or daily basis.
Because of the precision clock and frequency selection, bistatic
sounding between different ionosondes is a standard feature and can
increase the coverage of a network substantially.
Exclusive use of basic U.S.A. standard components, available
almost everywhere in the world, minimizes storage requirements of
spare parts. All printed circuit cards and transmitter drawers are
easily accessible and can be tested and repaired under operating
conditions without danger for personnel and equipment. Built-in test
procedures and programs clarify the functions of the system and
facilitate its operation and maintenance. Temperature margins of the
components are sufficiently large to avoid equipment destruction if the
system's fans fail in a thermostatically controlled environment or if
the room air conditioning fails. Those design characteristics will
allow a useful life of thirty years for the Digisonde 256.
1.0 INTRODUCTION
The Center for Atmospheric Research of the University of Lowell
(ULCAR) gained substantial experience in the design and operation of
several digital sounding systems: a fixed frequency sounder for the
AFCRL aircraft (1966), the Kinesonde built for NOAA (1967), the Low
Frequency Sounder (1968) built for AFCRL, the Digisonde 128 (1970)
which was and is in use at several ionospheric stations of
AFCRL/AFGL and other institutes in U.S.A., Canada and Europe, the
Standard Digisonde 128P (1974) operating in Italy and Greece, the
Universal Digisonde 128PS (developed for DNA, and AFGL, 1977) and
the DMSP Spacecraft prototype (built for RCA, 1979).
Triggered by a request for a bid by the Rutherford and
Appleton Laboratories, England, and the need of the Institut Royal
Meteorologique to improve its Digisonde system for monitoring the
ionospheric motions we have conceived the new Digisonde 256. It
includes all the features of the Universal Digisonde 128PS, used as
scientific instruments in the equatorial and the auroral regions of the
earth, but is even more compact than the Standard Digisonde 128P
which was mainly meant for routine observation of the ionosphere.
All the experience acquired with the prototype Digisonde 128PS
installed for a year at Kwajalein, a Marshall Island in the West Pacific
near the geomagnetic equator, and the other two Digisondes 128PS
installed at the AFGL Goose Bay Ionospheric Observatory in Labrador
and in the AFGL KC 135 aircraft to monitor the aurora ionosphere,
contributed to the new design which has improved versatility,
dynamic range and precision. By implementing two microprocessors
(type 8085) the programming procedure and the data output selection
have been simplified for the operator.
ULCAR has extensive experience in automatic recognition of the
main echo traces in the ionograms (Reinisch et al, 1981; Reinisch and
Huang, 1982) even under disturbed ionospheric conditions frequently
observed in the auroral zone and during equatorial nights (Bibl,
3
1980). It is easy nowadays to build simple ionosondes which work
well at quiet mid-latitude locations where the interference level is 30
dB less than in the Eastern United States or 40 dB less than in
Europe (Rush, 1981). But substantial sophistication is necessary in
the design of a modern ionosonde capable of automatic trace
recognition and ionospheric parameter extraction even in the presence
of high interference levels and complex ionospheric conditions. It is
not only the challenge of the interference but also the complexity and
the dynamic range of the aurora echoes (High Latitude Supplement to
the URSI Handbook on Ionogram Interpretation and Reduction, 1975)
which require truth in the recorded amplitudes and the other signal
parameters, as polarization, Doppler and incidence angle.
Although the Digisonde 256 is optimized for scientific
investigations in many different applications, its operation is so simple
and reliable that it can be tended by unskilled operators or used at
unmanned stations.
4
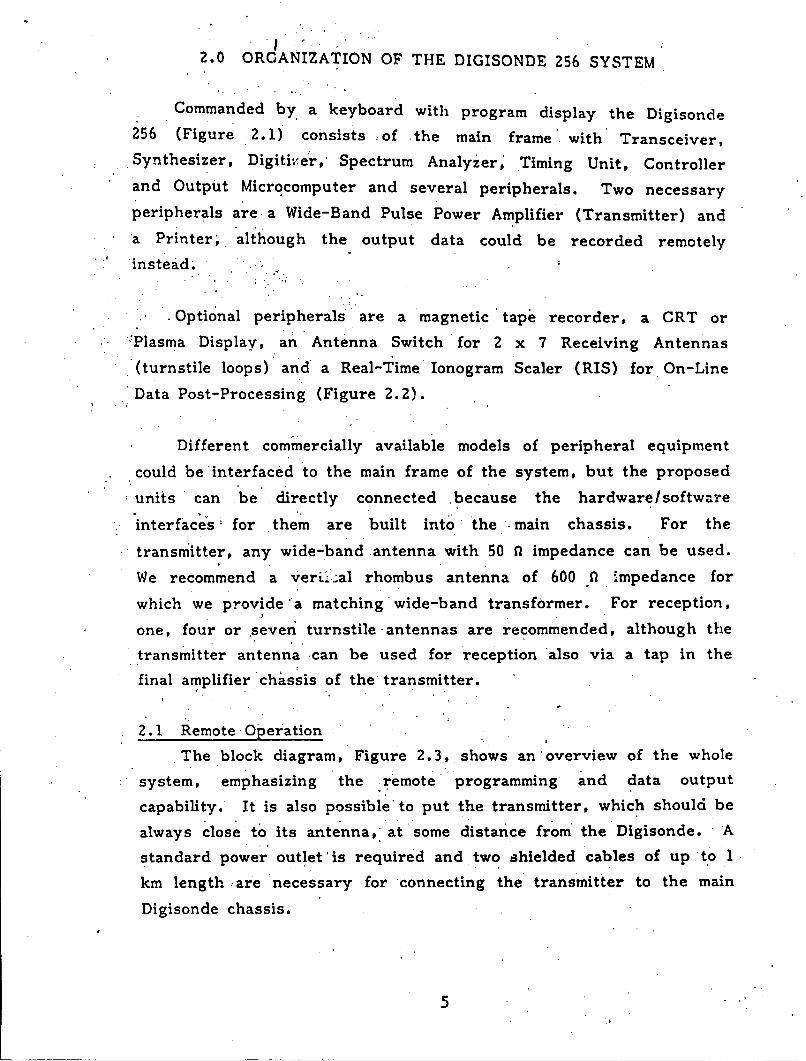
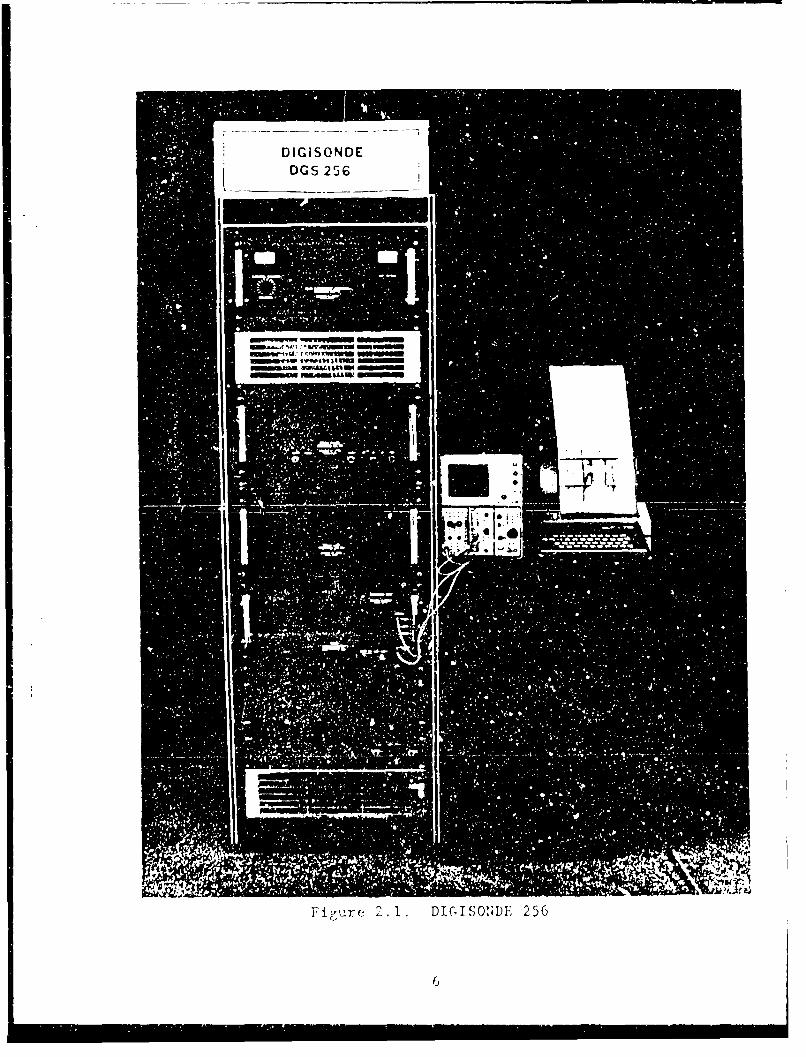
2.0 ORGANIZATION OF THE DIGISONDE 256 SYSTEM
Commanded by. a keyboard with program display the Digisonde
256 (Figure 2.1) consists ,of the main frame' with' Transceiver,
Synthesizer, Digiti,:er,' Spectrum Analyzer, Timing Unit, Controller
and Output Microcomputer and several peripherals. Two necessary
peripherals are a Wide-Band Pulse Power Amplifier (Transmitter) and
'a Printer;. although the output data could be recorded remotely
instead. .
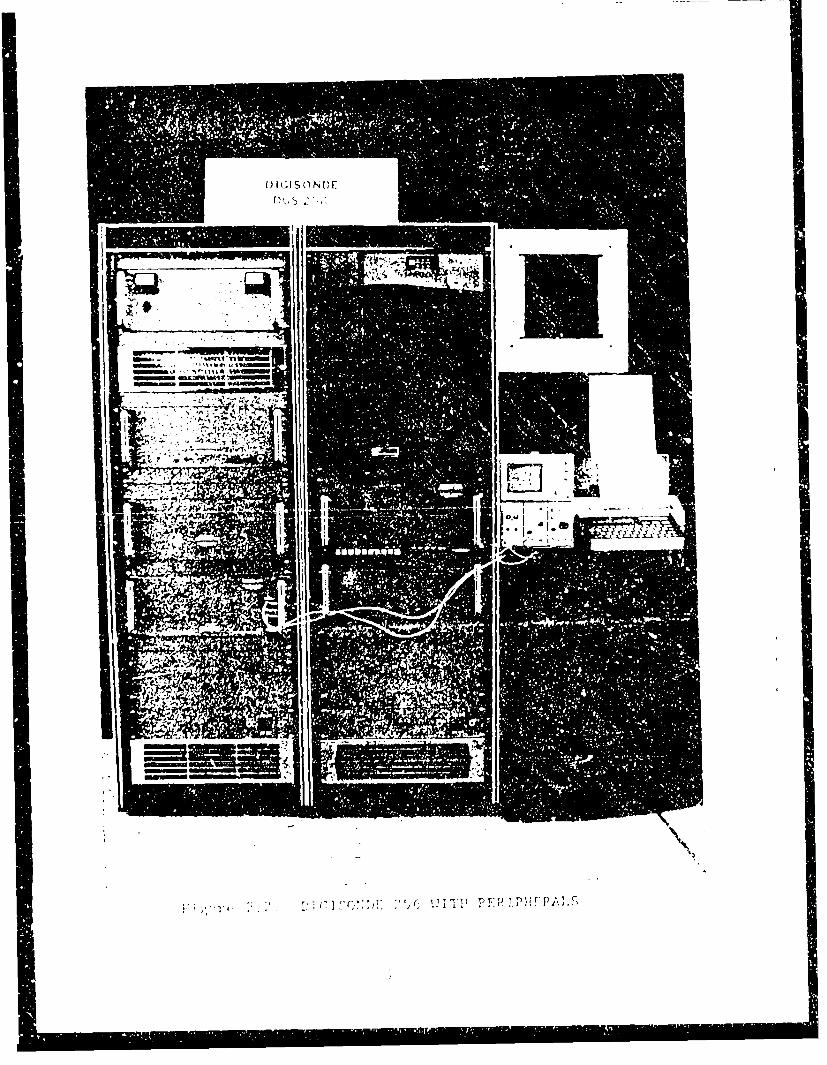
Optional peripherals are a magnetic tape recorder, a CRT or
'Plasma Display, an Antenna Switch for 2 x 7 Receiving Antennas
(turnstile loops) and a Real-Time Ionogram Scaler (RIS) for On-Line
Data Post-Processing (Figure 2.2).
Different commercially available models of peripheral equipment
could be interfaced to the main frame of the system, but the proposed
units can be. directly connected because the hardware/software.interfaces: for them are built into the main chassis. For the
transmitter, any wide-band antenna with 50 n impedance can be used.
We recommend a VerL ..al rhombus antenna of 600 f1 Impedance for
which we provide 'a matching wide-band transformer. For reception,
one, four or seven turnstile: antennas are recommended, although the
transmitter antenna -can be used for reception also via a tap in the
final amplifier chassis of the transmitter.
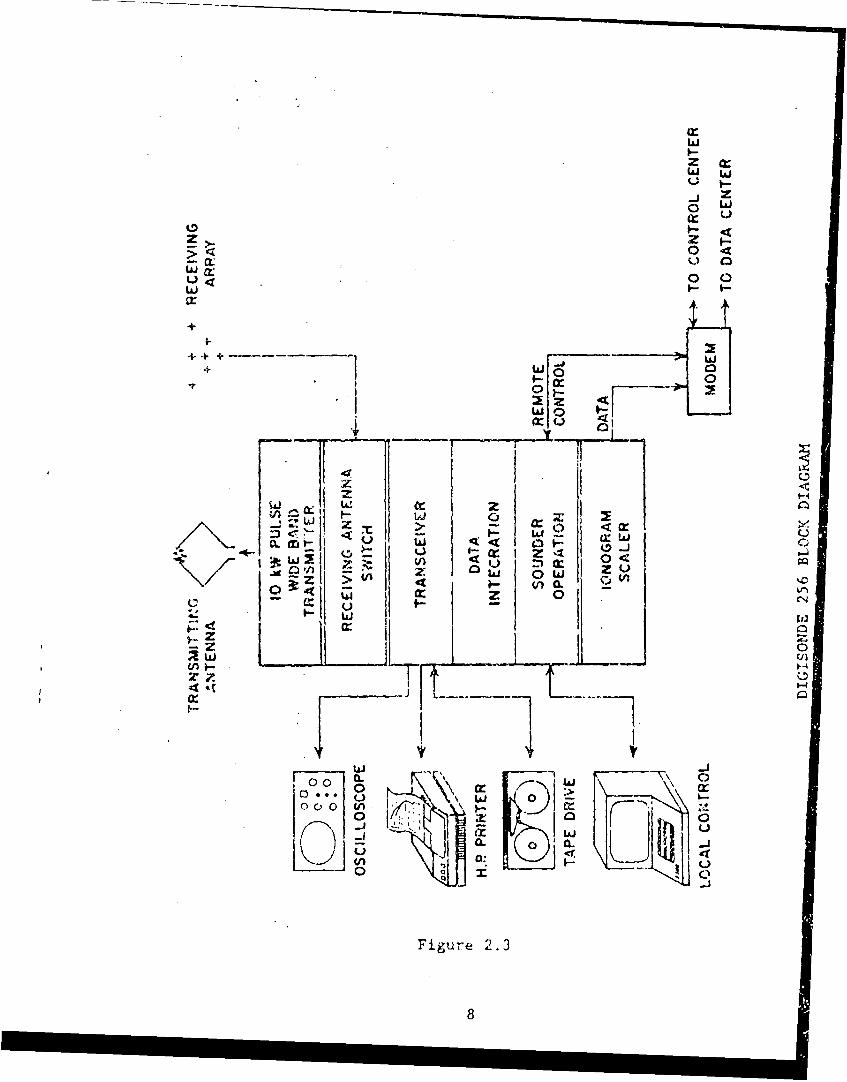
2.1 Remote- Operation
The block diagram, Figure 2.3, shows an overview of the whole
system, emphasizing the remote programming and data output
capability. It is also possible to put the transmitter, which should be
always close to its antenna, at some distance from the Digisonde. 'A
standard power outlet'is required and two shielded cables of up 'to 1
km length are necessary for connecting the transmitter to the main
Digisonde chassis.
5
FigurNE 2 .DCTOD 5
DGS 256
*~~~~ G. 0 NU 'ri A;U I ryTITA.
t:
Z a:
z z
U:
00:
+ 00
4 cc
a:(al
0 0 1- cc I z
-z LJ i-V)CUj ix
ww7. U
0)w
y~jj
Figure 2.3
8
2.2 Phase Code and Bistatic Sounding Synchronization
To form a network of sounders and thus increase the coverage
area of the stations, the Digisonde 256 is built specifically with
oblique bistatic sounding as an important feature. It has a pulse
sequence code which is dependent on the sample length (16 or 32integrated pulses) and the number of interlaced antenna directions.
To optimize the integration gain the number of used pulses should notdecrease with the time delay of bistatic propagation. If the phase
code starts with a sequence right after three equal (positive) phase
decisions the last three of the prerun pulses which are used locally
for establishing the gain can be used remotely as three delayed range
windows. Alternating vertical and oblique sounding records are
displayed on Figure 2.4.
2.3 Maintenance
Because of its reliability the Digisonde 256 :an operate unmanned
for a long time. Certainly paper and magnetic tape supply must be
provided adequately, if local recording is required.
The filters of the fans should be cleaned monthly if the aircontains dust or sand. Air-conditioning is recommended for many
locations and a temperature warning system should be installed if the
system is not regularly attended.
2.4 Calibration
A self-calibration mode of operation tests and calibrates the
entire analog and digital system. In this mode a small fraction of thetranslator RF output is leaked into the. receiver. The digitizing
range is shifted over the transmitter pulse (5= 1), the correct phase
code is selected (X = 4), and an ionogram scan is made. To prepare
the self-calibration mode a toggle switch on top of card 40 must be
set to Calibration. Figure 2.5 shows the resultant "calibration
ionogram" for H = 0 (2.5 km height increments), E = 1 (10 kmdelay), W = 2 (20 km pulse width) and Q = 0 (200 kHz frequency
increments). It is recommended to carry out this closed loop
9

~.I v I
-x --- -
Figure 2 . 4 . ALTERNATING VERTICAL AN~D OBLIQUE SOUNDINGS
16

............... ~ ~ ~ ~ . . . . . . . . . I. . . . . . . .. J. W .
.... .. ... ... I . . . .I. . . . . . . . . . .... !A O P
... .. . . . . . I . .. . . . . . . . . . . ...... .A " *
+ .i
* . . . . . . . . .A3**um
.. .. ..... . . ..... . .. . .. ............. a.......
... . . .. ... ... ..............
V. .s . i ii
-.. . . . . .. . . ... ... .. .
. . .0 Aoi l. .
.* . .
22212~~~~~~~~~~~~ls II212222 z222222222~~1"~i 115 1'' 'LI iVI
..... .............. .................................. ............
... .... ................. ......... I .......... * ......... "I225Q
.................
Figure 2. 5

calibration routinely. Automatic time controlled calibration can be
provided as an opticn.
2.5 Testing
The digital integration algorithm and magnitude generation can
be tested with built-in or external analog signals of 12.6 MHz. A
calibrated attenuator (which, together with a HF oscilloscope
possessing storage capability, should be standard test equipment for
each ionosonde station) must be connected between the test output
225T and the 225 kHz input 225S of the Processing Controller. Thus,
the log compression, the phase accuracy, the analog-to-digital
conversions and the spectral integration can be tested.
This calibration shows the optimum range of 60 dB in which the
log compression produces an output signal that changes linearly with
the attenuation in dB. The Test card 40 permits phase changes of
the calibration signal in 32 equal steps of i1.251 for the 225 kHz
pulse or CW signal produced by dividing 12.6 MHz by 56. An
external source of 12.6 MHz with good stability (10 ) simulates
Doppler shifted data if amplitude modulated by the transmitter pulse
trigger. Calibration of the range and resolution of the Doppler
analysis can be performed if the external frequency source is even
more precise (10-8).
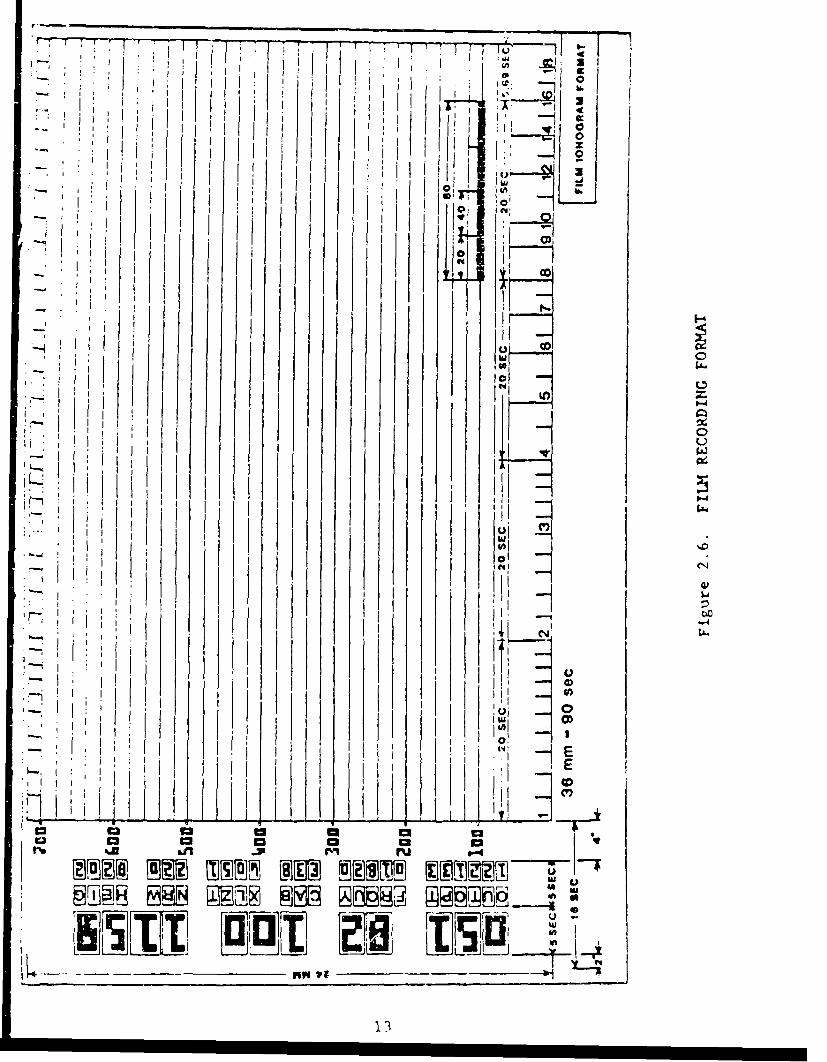
2.6 Analog Monitoring
Although the DGS 256 is optimized for local and remote digital
recording on magnetic tape and hard copy, it is possible to use the
front panel outputs: Trigger (C) for trigger and Channel B for
intensity modulation (B) of an oscilloscope monitoring the output
computer processed data, in parallel to the customer-supplied
oscilloscope recording using a continuously moving camera. The
format of the ionogram is presented in Figure 2.6. At the data
transfer time another output produces a sawtooth function
synchronized with the selected data output provided by the output
computer. Thus either a one-dimensional sweep for an A-scan or a
two-dimensional ionogram display can be realized with the height
12
1-n'
m a- u V -
VOIN 111M AN g R1,08KmmM~j--,O
LIS 115 r'1Ti1 Al
.113

marks and the sigtial amplitudes (Channel B) added for Z-modulation
of the long- persistence oscilloscope. In addition to immediate
inspection of the ionospheric conditions the ionogram display can be
used to create ionospheric movies.
2.7 Other Applications
In addition to ionospheric monitoring and research many other
applications seem to be possible for the Digisonde 256. Most obvious
are the multifrequency monitoring of the sea state by direct and
ionospherically reflected sea scatter and infrasonic sounding using the
same frequency but much shorter wavelengths (or investigations of
liquids and solids. Very challenging is a combined radio and acoustic
experiment to probe the lower and middle atmosphere.
2.8 Acknowledgement
Significant inputs to the sounder specifications have been made
by J. Duchau, J. '.'aaramaa and R. Gowell, U.S. Air Force
Geophysics Laboratory, and G. Sales, Rome Air Development
Command, Hanscom Air Force Base, Bedford, MA. Kelp in the
hardware design and testing by X. Qiu and R. Bemis (ULCAI ) is
acknowledged. Firmware programs have been developed by E. Li and
T. Peng (ULCAR). Drawings and printed circuit artwork were
prepared by A. Cognac. S. Johnson composed the brochure.
14
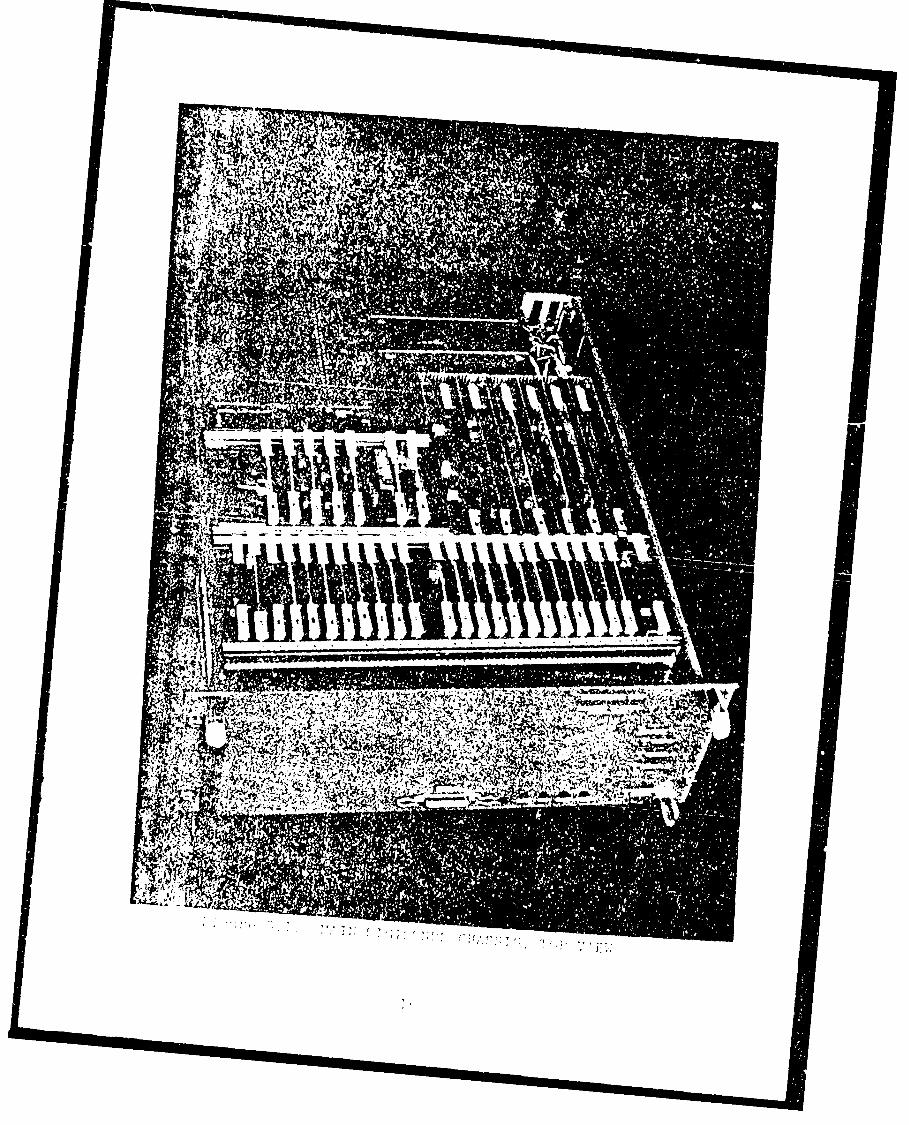
3.0 THE MAIN DIGISONDE CHASSIS
As explained in Section 2.0 the main Digisonde chassis (Figures
3.1 and 3.2) contains the frequency synthesizer. the transceiver, the
spectrum analyzer, the fast timing units, the Controller Computer and
the Output Computer. The chassis can operate self-contained with
two fans in the front panel. But normally it will be mounted either
in the Tape Recorder Rack or in the Transmitter Rack.
A separate keyboard terminal with a LCD display of 64
characters is provided. This terminal, connected to the Controller
Microcomputer, monitors the Digisonde operation and permits
modification -)f its programs and schedules.
3.1 The Controller Microcomputer
As an interface between the serial RS 232C port which connects
to the telephone line or the prograrrming keyboard terminal the
Controller interprets commands received from the port and acts upon
them controlling the Digisonde as well as displaying the significant
program parameters and/or the time and sounding frequency
information. The Controller consists of three standard industrial
cards containing the Intel 8085 CPU, standard RAM and EPROM chips
and serial Input/Output services (card 01) for the RS 232C port.
Their address/data bus is connected to I/O ports on four cards of
the Central Complex Correlator (CORE) as well as on the Output
Computer (OUTCO). The computer codes for the microprocessor
(hereafter referred to as software) are stored and accessed as
firmware in PROMs on cards 02 and 03.
3.1.1 Description of the Controller
The Controller software generates the operational c -. t-ol words
(repetition rate, pulse width, sounding frequen,. t, antenna
configuration, phase code, etc.) and transfers them (.) -.ORE on a
6-line extension of the Controller Computer add:'ess/data bus.
Updating of the control words occurs every 1/8 second, initiated by
an interrupt command arriving from the CORE timing unit. This
15
.6h

jet43 ____
AK/
X r AIPJI
il/
Al/
..... ... .I
precise (1 part per 10 per day) command also advances the software
clock. Since the sounding frequencies are software-selected any
desired sequence can be realized. Linear and logarithmic sequences
with selectable step sizes are provided for regular ionograms.
Optionally, a quasi-random frequency sequence could be employed by
adding a look-up table to the software.
Ten different sets of ionosonde operating programs, each set
consisting of an A, B arnd C ionogram and a drift program G, and
three fixed frequency programs F are stored permanently in one of
the Controller PROM's (the program PROM). Three of the ten sets
and one of the fLxed frequency programs can be loaded into the
working memory RAM for possible modification and subsequent
execution.
3.1.2 Programming of the Digisonde Z56
Since the handheld keyboard display changes automatically with
the Controller parameters or the part of the program to be modified,
changes are executed very easily with the keyboard. The following
explains the commard words and summarizes the associated software.
More detailed information is contained in the software listings.
Commands typed on the keyboard overwrite the normal display.
At the end of the command the CARRIAGE RETURN key is pushed
executing the command and clearing the command word from the
display. If the command is rejected for any reason, the message
"INPUT ERROR" appears on the display. The operator clears this
error message by typing the carriage return again. In all of the
commands described below only the first three letters are significant
although no harm is done by typing the full word.
DISPLAY - shows on the display the actual frequency of a
running ionogram or the preceding ionogram if the Digisonde is not
running, the time, the ionogram type [A, B, C, F (for fixed
frequency)I or G (ior Drift). the program set number (1, 2. or 3).
the beginning frequency of the ionogram (FR), the frequency step
parameter Q, the end frequency (UY) and the other ionogram
program parameters CABXLZTNRWHEIGO. The actual gain in -6 dB
steps (0 to 8) and the searched frequency (1 to 3), selected for
minimum interference, are read from the CORE and displayed under
the flashing G and I positions.
The only parameter which can be modified (by use of an "equal
sign" command, described later) in the DISplay mode is the letter"O"t. 1101" selects automatic operation of the ionosonde interleaving A,
B, and C scanning ionogram programs according to fifteen different
schedules which repeat every hour. There are three "O"'s, one for
each of the three program sets. The "0" appropriate to the program
set (1, 2 or 3) shown on the display is the "O" which is displayed
and is also the one which can be modified. The "0" parameter can
also be specified by the World Day function. The exact meaning of
all of the "0" parameters is described in Table 5.10. Note that 0 = 0
means no automatic start and an 0 = 7 is the default setting, one C
ionogram on the hour (actually HH:59:16). 0 = 8 is reserved for a
user specified program which is stored in RAM.
08A, 08B, 08C commands allow the user to construct a special
secuence for 0 = 8 with A, B and C ionograms respectively. Typing
08A, for example, shows on the terminal display all of the A ionogram
starting times in the 0 = 8 sequence. To add a starting time use an
equal sign command. The parameter being changed is A, B, or C
depending on whether 08A, O8B, or 08C had been the command.
There are six (Al . . . . A6, for example) possible starting times
for each A, B or C program. Specifying a starting time of 60
(minutes) for any location deletes the starting time at that location
from the list.
TIME shows the actua! time along with a time-setting-buffer.
Equal sign commands (described later) allow modification of the time
setting buffer. The complete actual time includes two digits for year,
three digits for day and two difits each for hours, minutes, and
seconds. Also in the TIME mode the parameter K may be set. When
19
K is other than zero (see Table 3.1) it causes the dividers in the
CORE timing unit to depart from the correct divisor and thus effect a
lag or lead of the clock with respect to a standard reference signal
such as WWV. Timing can be adjusted with ten microseconds
resolution in this manner, an important consideration if bistatic
sounding is contemplated.
SET - when in the TIME mode typing SET causes the time in the
time-setting-buffer to be transferred into the actual clock of the
system at the moment of the carriage return.
LOAD - moves a specified set of programs from permanent PROM
storage into RAM where they are accessible to PROGRAM and RUN
operations. In the operating RAM at any one time there are three
sets of programs (1, 2 and 3) and one fixed frequency program (F).
Each set of programs consists of an A, B, C (scanning ionogram) and
G (drift) program. The sets permanent in PROM are numbered 11,
12, ... , 20. The three permanently stored fixed frequency programs
are numbered 21, 22, 23. For example the command "LOAD 1 13" or
"LOAD 13 1" moves the number 13 PROM program into RAM as set 1.
LOAD 21 moves the number 21 fixed frequency program into RAM as
the fixed frequency program, F.
At power up or at system reset, sets 11, 12, 13 are loaded
automatically as program sets 1, 2 and 3. Aftpr the user of the
Digisonde has experience with local conditions and r'equirements the
parameters in these default sets can be altered by ordering a
replacement program PROM from ULCAR. After the LOAD command is
executed, the terminal display shows which of the permanent PROM
sets are loaded into RAM as sets 1, 2, 3 or F. This type of display
can be activated also by typing only LOAD followed by a carriage
return.
SET - Typing SET 1, SET 2 or SET 3 changes the active
program set number accordingly. The automatic operation controlled
by the "0" parameter selects only A, B, or C scanning ionograms
20
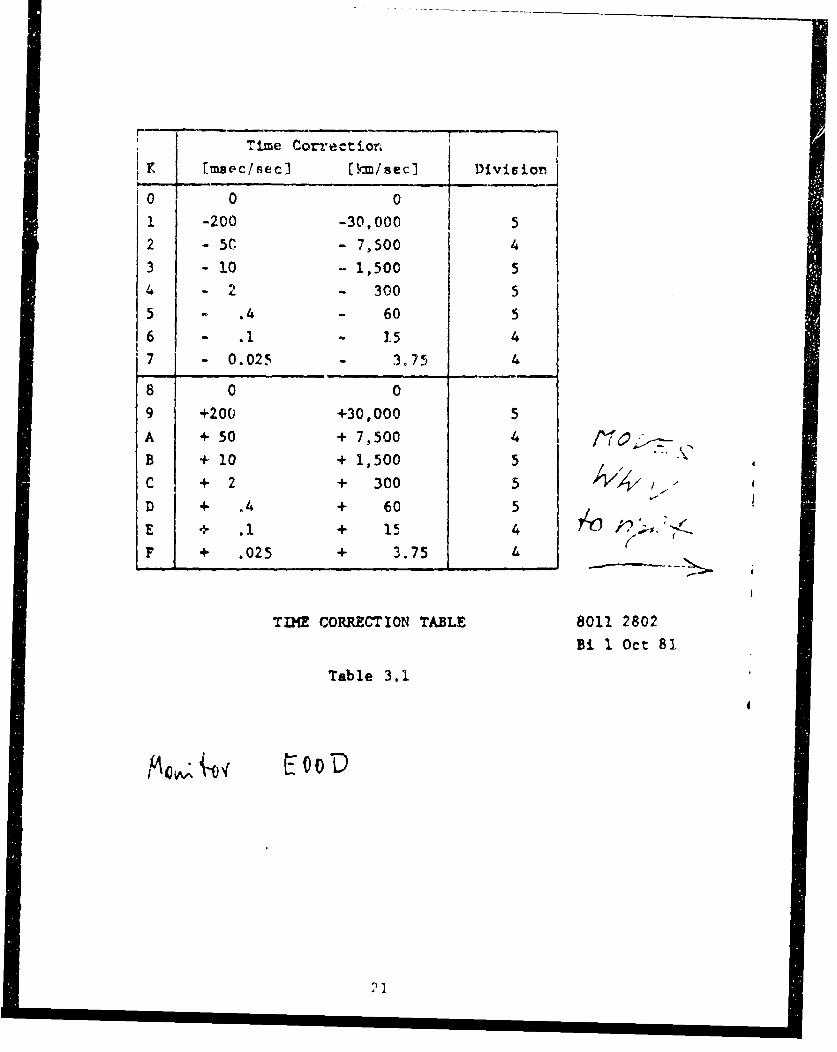
Time Correction[mseclec] [kmlsec] Division
0 0 01 -200 -30,000 52 - 5C - 7,500 4
3 - 10 - 1,500 5
4 - - 300 55 - .4 - 60 5
6 - .1 - 3.5 4
7 - 0.025 - 3.75 4
8 0 09 +200 +30,000 5
A + 50 + 7,500 4B + 10 + 1,500 5
C + 2 + 300 5D + .4 + 60 5
+ .1 + 15 4
F + .025 + 3.75 L (
TIM CORRECTION TABLE 8011 2802
Bi 1 Oct 81
Table 3.1
21

within a particular SET in a sequence which repeats every hour.
The number oi the active program set (as well as the "O' parameter)
can be changed by the World Day function which is programrried
through the WDAY command described later. The World Day function
can change the program SET number on either a diurnal basis (for
example - change sets for different day and night operation) or make
a change of SET number on a particular day and hour.
PROGRAM - allows the display of all the parameters associated
with any one of the thirteen programs stored in RAM at any one time.
All of the ionosonde oper.ting parameters as well as options for the
output computer and its peripherals are displayed and may be
modified. For example, the commands PROgram Al. PROgram C3,
PROgram G2. or PROgram F each refer to a particular ionosonde
operating program in each of which pararrmeters can be changed with
the equal sign comrr -nds. Even though the PROGRAM command
includes a reference to a particular program SET number, the
program SET number selected by the Digisonde is unaffected. This
allows modifying a new SET with PROGRAM which is not the current
operating SET prior to the actual selection of the new SET.
FIXED is equivalent to typing the command PROgram F.
RUN - starts the manual operation of the Digisonde. Typing
RUN followed immediately by a carriage return causes the last
prograrn which ran to be repeated. Typing RUN A. RUN B, RUN C.
RUN G or RUN F causes the specified program in the program set
currently in use by the Digisonde to run. Typing RUN Al. RUN C3.
etc. also effects a change of program SET number if the number
tapped is different from the current program set. Note that this
manual RUN command acts immediately, within the next 1/8 second in
the case of drift (RUN G) or on the whole second for all the other
programs; no memory is retained of what the Digisonde was doing
prior to the command.
22
When operation starts automatically based on the "0" parameter
while the Digisonde is in the fixed frequency or drift mode of
operation, after the automatically selected scanning ionogram is
completed the operation reverts back to the fixed or drift operation.
In the case of automatically selected &canning A, B. or C
ionogram operation, the first transmitted pulse occurs at 16 seconds
after the exact minute or 1/2 minute at which the automatic operation
was selected. The 16 seconds allow enough film motion to record a
heading on film prior to the ionogram. By typing RUH instead of
RUN for a manually started ionogram th. same 16 seconds delay can
be achieved.
STOP immediately terminates a scanning (i.e. A, B or C)
ioriogram program which may be running. If the scanning ionogram
program had been selected automatically the drift or fixed frequency
operation would begin again if either had been selected prior to the
automatic start of the scanning program. STOP F or STOP C (or just
STOP if in FIXed or DRIft mode) stops fixed frequency or drift
operation.
DRIFT changes the display to show the four frequencies, heights
and gains specified in the G (drift) program for the program set
which is currently selected. When the DRIft display is selected, the
four frequencies, heights and gains may be modified by the Equal
Sign commands. If the command RUN is typed while DRift is
displayed the Digisonde commences with the drift program, i.e. it is
not necessary to type the full command RUN GI, RUN G2 or RUN G3.
WDAY (World Day) command selects a display of the world day
buffer in which the day numbers and hours for up to three possible
times are stored. These are the times at which the program SET
number and automatic schedule parameter, '0", can be changed
according to the SET and "C" parameters following the three
respective times. If a day number zero is specified. then the chance
occurs every day at the hour set into the buffer allowing diurral
23
changes to the operating ionosonde programs as well. The parameters
in the World Day buffer are changed through use of the equal sign
command. Specifying SET 0 (S1 = 0 for example) causes the software
to ignore that entry into the World Day buffer. This World Day
function can be used to change, only the Q00 parameter if desired.
TTY command changes the serial output of the controller
computer to a format suitable for a printing terminal. The display is
not continually refreshed but rather is reprinted upon every carriage
return received. The baud rate may have to be reset on the SIO
card 01 according to the terminal actually in use. The serial I/O is
standard RS 232; to drive a mechanical teletype (ASR-33 for example)
directly from the port a current loop adapter would be required.
CRT command changes the serial output to a format. suitable for
a video CRT type terminal. The complete display is refreshed
repeatedly so that a baud rate of at least 1200 Baud is necessary if a
rapidly responding display is desired.
TTM command changes the serial output back to the format
suitable for the supplied TransTerm LCD terminal. This terminal
presents a rapidly responding display even at 300 Baud since its
addressing capability allows the controller computer to rewrite only
the characters which change in the display.
Equal Sign Commands are commands whic:h allow replacement or
modification of stored parameters. An equal sign command must have
an = sign in it, hence the name. For convenience, instead of the"equal sign" key the "semicolon" key can also be used thus avoiding
the simultaneous operation of the "shift" key necessary to make an
equal sign. Only parameters which are displayed can be altered by
the equal sign command so that one sees the changes effected by the
command in the display. The parameter to be changed is identified
by one letter; it may be followed by a digit if the same letter is used
repeatedly such as in drift mode where there are four frequencies.
four heights and four gains displayed. Also in the 08A, 08B and
24
08C modes the parameters A, B, C respectively must have one of the
digits I to 6 following the letter.
There are three options for altering a parameter with an equal
sign command. Using frequency in the drift mode as an example. Fl
= 12.36 replaces the first frequency with 12.36; F2 = *.10 increases
the second frequency by 0.10 MHz; F4 = -1.56 decreases the fourth
frequency b' 1.56 MHz.
The computer software knows how many decimal places to use in
all cases. Any excess digits to the right of a decimal point are
ignored. Any excess digits to the left of a decimal point cause an
input error. Most parameters are single digits and typing R = 3, for
example. without a decimal point is adequate. The aforementioned
drift frequency with two digits each side of the decimal point is the
most exotic use of this fixed point data entry scheme.
Many of the single digit parameters can have hexadecimal values,
i.e. values, 0 .... 15 ( 0 .... 9, A .... F). With these it is
allowable to type either R B or R = 11, for example: the display on
the terminal will show the parameter B under the R in either case.
You may type the letters A ... F for the multidigit parameters also
but this may result in nonsense. The on'y exception is for Height in
the drift mode. Typing H3 = F90 or H3 = !i,90 will both set the third
height gate to 1590 km. The display in this example will show F90
since there is room only for the three digi*s.
There are some further commands which are not controls for the
Digisonde per se. but for the peripherals connected to the output
computer (OUTCO).
FWD - th _ forward command simply causes the tape recorder to
run forward as a convenience when searching for a particular
ionogram during playback of a tape.
REV - same as the FWD command but in reverse.
25

STOP - causes the tape recorder to stop all activity except the
writinb of data which is controlled by output options in a Digisonde
operating program. If the STOP command is used when the tape
recorder is in motion (generally during a playback operation) it will
have effect only on the tape recorder. If used when the tape
recorder is not running in a operation initiated by commands FWD,
REV. READ or REW then STOP has the usual effect of stopping a
running lonogram, fixed frequency or the drift operation.
EOF puts an end of file on the tape after the last record read or
writ'en. if the tape has gone past the End of Tape marker (EOT)
then the tape is backspaced one record and an EOF written there.
REW rewinds the tape completely (not just to the load point)
leaving the reel ready for demounting.
READ - reads a tape, processes the data being read, and prints
it out.
3.2 Central Complex Correlator
The Central Complex Correlator (CORE) resembles the Processing
Controller of the Digisonde 1Z8PS (Bibl and Reinisch, 1978). It is,
however, packaged in much less card space using more advanced
random access memory (RAM) chips. A high resolution (12 bit) AID
converter allows linear amplitude digitization with the full dynamic
range of 64 dB and reasonable phase resolution at low amplitudes.
The dynamic range of the Integrator is increased to 96 dB; thi
permits a full dynamic range of at least 60 dB in those operational
modes where the input data are scaled down by 36 dB to accommodate
2 x 512 integrated samples. Since noise and some Doppler variations
are always present the actual dynamic range is actually larger than 60
dB for the processed data. Readout accuracy can be 3(32 dB for the
larger amplitudes and 1.41 resolution of the signal phase for each
doppler line. While the large dynamic range is of paramount
importance for many occasions. the available accuracy will rarely be
used.
26
Utilization of microprocessors and other large-scile integrated
circuits allowed consolidation of the programming functions, the
digitization, integration and spectrum analysis in one-half of a card
file.
In the Drift mode, the CORE digitizes multiplexed time series
from one to seven antennas and one to four frequencies for a
maximum of 16 channels. For each antenna up to four channels are
provided for which the operating frequency, the receiver gain and
the height range settings are independently selectable. The sequence
of those settings is automatically switched after each group of pulses;
the signals from the first pulse of each group is received with loop
antenna 1, the second with antenna 2. etc.
For full Drift analysis, the Digisonde 256 requires a special
receiving antenna array and antenna switches. Conversely, in the 4
ionogram mode the Digisonde employs this antenna system by
connecting all used antennas parallel as a phaeed array and receives
the benefits of a circularly polarized directional receiving antenna
array. The Drift mode can be used for multiple fixed-frequency
absorption measurements, if only one receiving antenna is available (L
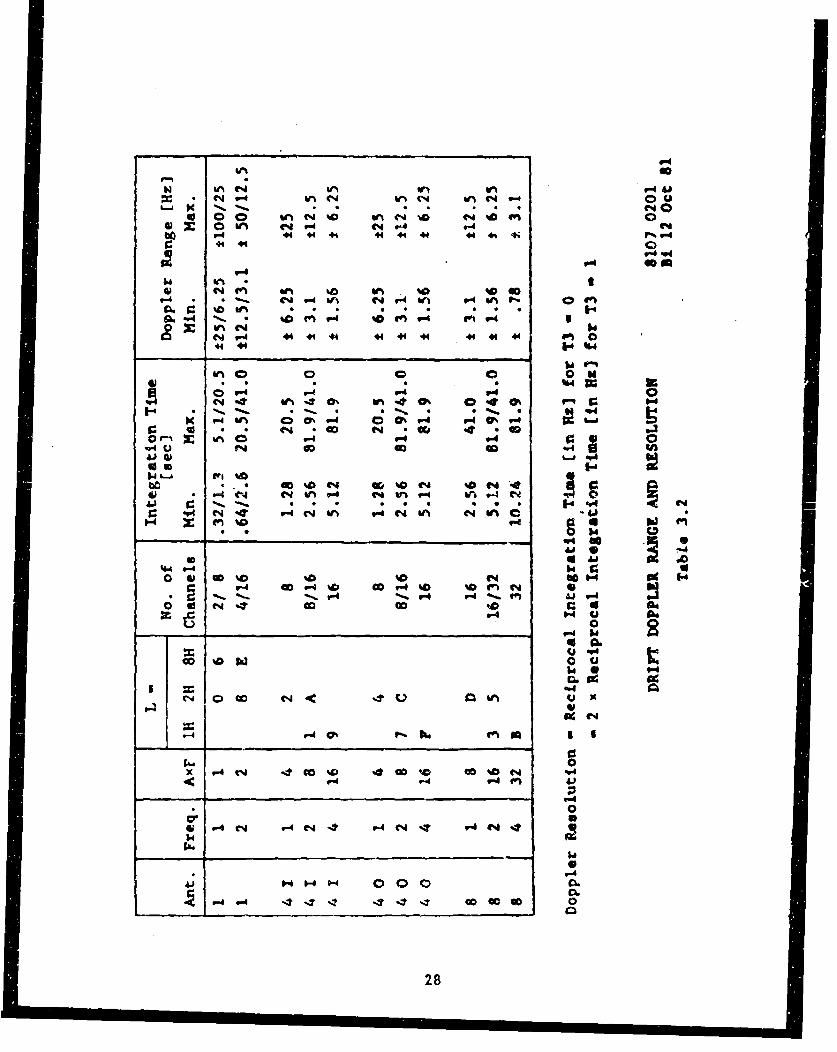
6 or E; see Table 5. 11). The full Doppler spectrum of the received
echo amplitudes is recorded, as indicated in Table 3.2.
The ionograms serve as a diagnostic tool for optimizing the
program parameters in the Drift mode. Preferably one would
alternate between the normal ionogram operation and multi-antennae
Doppler measurement.
In the lonogram mode, the CORE creates all necessary timing
functions for the transmitter pulse and for the 128 or 256 consecutive
sampling ranges, the sequences of the phase codes for the transmitter
and the receiver phases and the translation of the digital frequency
commands from the Controller for the analog circuits.
Il7
%.%4
V~h NV-4 wd
N v9c u-,-
%4.
04 w h W 0% 0% OW
C4 *0 4 a goA v-4 re4t %
.* * doa 4 q& N 0 0~ 4 14 rOr-' in0 "A4 4 W-4 &n v4 (N
A* * l. . . * W; * p.4Z1 44 C14r4 4 in V r4 kf% a0 %D e4t 94 V a. N f44
0 4 Ndo o 4
0.-4'0~v- Ow4O *wrd 4
t011
CJ 4
~1
0
v.4 eq 4 C4 %v
P4Mo -4 000 C6.CL.
'd v4?- co C c 0
28

CONTINUOUS OR FINITE LENGTH DRIFT MEASUREMENT
The "frequency" input parameter in a DRIFT program
specifies the number of drift measurements (cases). Similar
to the modification mode for FIXED frequency programs, a maxi-
mum number of 49 measurements is achieved by a 0.49 MHz fre-
quency. While a frequency set equal to 0.00 MHz in a DRIFT
program indicates continuous DRIFT measurement. The four ac-
tual sounding frequencies in DRIFT are still set in the DRIFT
bu'ffer.
For Doppler measurements in the Drift mode one, two or four
frequencies are selected and the respective height gates set to
monitor the desired echoes. These gates can be set by one
hexadecimal and two decimal characters as I km unit numlbers; but
the actual range increments have 2-1/2 km step size. The four
programmed values are consecutively scanned, as to provide that each
group of pulses is transmitted and received at a different frequency
and the echo digitized at a different height range. By selecting the
same frequency in two or more consecutive units, different height
gates at the same frequency can be selected; in normal operation, one
height gate at each frequency is sufficient for drift measurements
where four antennas are consecutively fed to the receiver. To speed
up integration, two ranges can be set within the same transmitter
pulse in one or two frequency operation. 113 can be programmed as
second height for frequency I and 114 can be programmed as second
height for frequency 2. For this mode of operation L = 0, 2. 4. 5,
A, C or D (see Tables 3.2 and 5.11).
Under normal conditions the Drift mode, i.e. the multiple
fixed-frequency operation on switched receiving antennas. is
alternated with the Ionogram mode in a complete cycle of either 1.0.
2.5, 5, 10 or 15 min. In the fast cycle, ionograms of up to 80 sec
(i.e. 0 to 16 MHz in 100 kHz increments and 1/2 sec integration, or 2
to 10 MHz with 50 kHz stepping) are possible each 2.5 min, allowing
64 sec for the drift measurement. In the 15 min cycle much longer
ionograms are permitted for oblique sounding and fine spectral
analysis with multiple antenna direction steering; but the drift
measurements should not be interrupted for more than 5 min.
Although wide flexibility is provided with regard to program
starts and lengths, use of certain standard start times is
recommended for background ionogram information on a routine basis.
For *that reason the Digisonde 256 contains a complete digital clock in
software with starting times at preprogrammedI minut.es and seconds.
These programmed starts are suppressed when an ienogram in r,,
finished before the next wants tn start. This overriding feature is
29

also applied in the sequence between ionogram and drift operation. ifthe RUN G1 command has been issued Drift measurements start
immediately after each ionogram and get switched off by the next
programmed ionogram.
3.3 Basic Timing and Data Flow
The CORE comprises 14 printed circuit cards. Most cards have
a single, well defined, function to minimize interconnections andfacilitate testing. Figure 3.3 shows the block diagram of the chassis
indicating all printed circuit cards, their functional names and the
principal interconnections, as well as the main input and output
functions.
The CORE file operates -from a 12.6 MHz frequency sourcelocated in the Analog file of the Digisonde. The Command card 09
buffers the sinusoidal input and provides the first dividers
generating 6.3 and 2.1 MHz as well as 60 and 30 kHz frequency
sources. The card creates the basic time chains of pulses for the
digitizing as well as for the interlaced integration including alltrigonometric function generation, averaging, multiplication and
summation. The 300 kHz output provides also Clock Synchronization.
Its output is a possibly modified 300 kHz which is divided further by
5 and 2 and fed to the Rate card. The Rate card 06 decodes and
stores the values of the program characters K, W, R, N and T.
Controlled by the R program the Rate card produces either 50, 100 or
200 Hz pulse repetition rate. This card determines also the width of
the transmitter pulse cohtrolled by the W function, as well as the
group of pulses prior to the actual integration for finding frequencies
with low interference, dependent on the value of the program
parameter I.
The search around the assigned sounding frequency for the
frequency with the lowest interference level is executed on the Search
card 11. Also on this card is the Automatic Gain Control (AGC)
which selects for each frequency one of four levels, spaced by 6 dB,
30

WN
LEa
is 44 li
0)~C 9-4--b4 -4
-4 F ~ -,4 CC_ V 1-
>44
c: gi o~ Q.o'-
v-44
=- 14 UJJ- >4 w.4 0
COo -4t -- w. :-3.J (~
0)l- 40 (Z) en F4
- 50 04 . 0
z L)
-4-
v: o c ) "
P-4
j-41- 0. ) i
0)L CIO~ 4
LL- .,' C0'- g;4 4 -
t4 C-4 14f-C) -
- 4 0
0 000 1
Figur 3.3-COR 04-)Y 1)R -'
+ 3i4 . .
dependent on the amplitudes of interference and signal for each
frequency (Table 5.5).
To display the raw digitized data prior to integration, a switchon the Search card channels either the sum Cn of the log sampleweight (Hanning) and the log sine or log cosine of the trigonometric
spectral weighting function or the log Product function Qn onto theDisplay bus In for display on channel B or test printout. If only thedigitizer sine and cosine data samples should be tested the Log Trig
crd 10 can be replaced by a dummy card which puts a weight of 1.0
onto the input of card 12.
The I parameter modifying the use and the spread of thefrequency spacing of the searched frequencies (Table 5.7b) is storedon the Spacing card 07 where also the H and the E parameters arestored. All the three parameters HEI need quadruple storage sincethey serve as range parameters in the drift mode permitting
interlaced scanning of four ranges almost simultaneously. In theIonogram mode, however, H determines the spacing and E the
beginning of the range samples (Table 5.6).
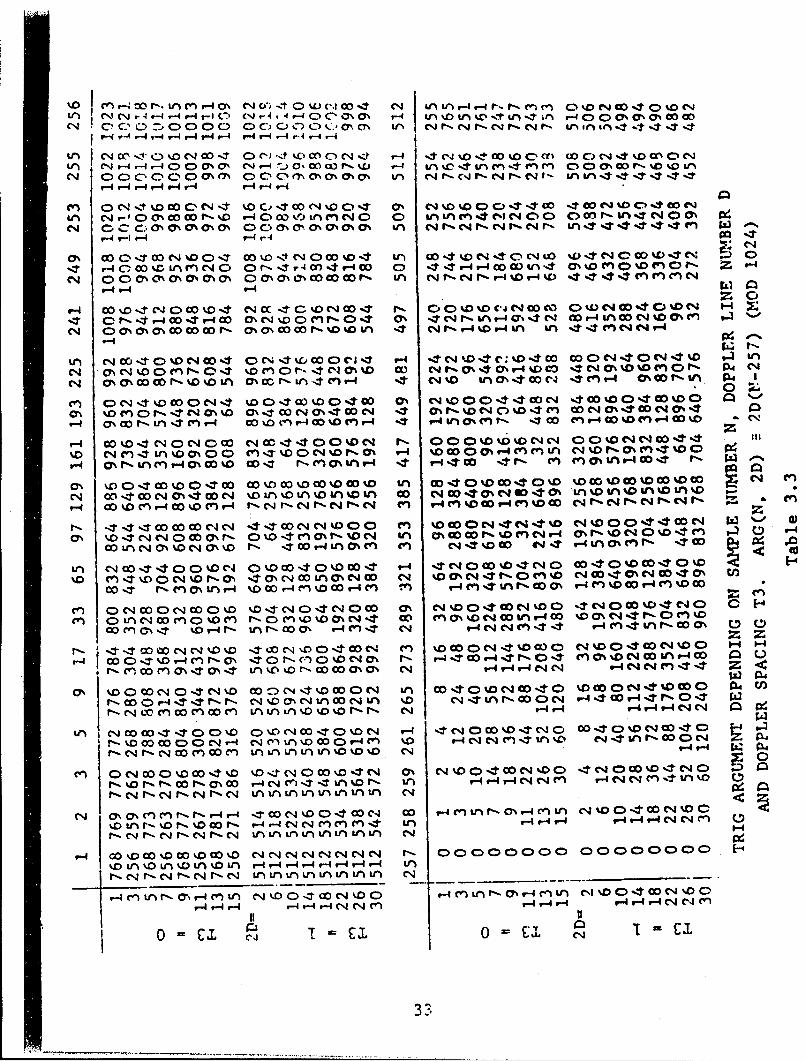
One of the most interesting schemes of the basic design is the
fast production of the 128 angular arguments (one for each Doppler
frequency) at each data sample (Table 3.3). A sample counter outputis successively multiplied with all used w values by adding in a loop
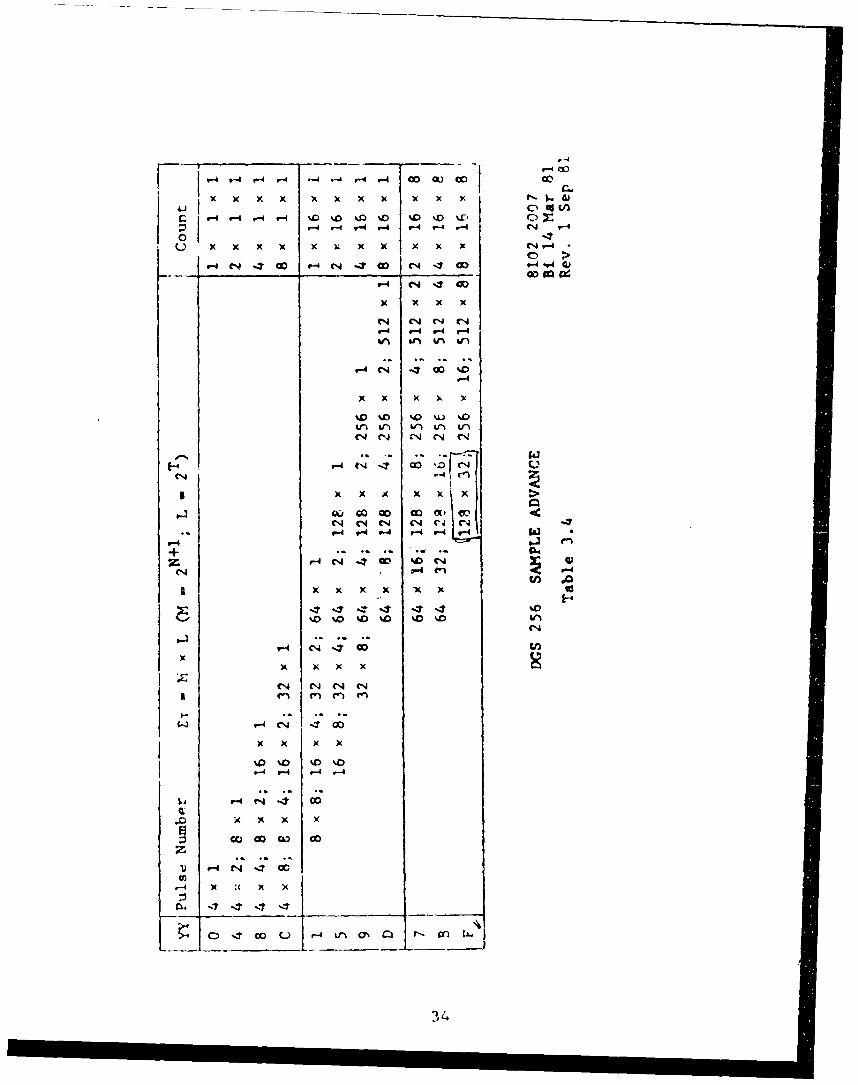
mthe counter output for the nth sample Argn1] to its preceding sum:Argnon .ArI w-li + Arlh [1. This function is created on the LogTrig card 10. Controlled by the T and N characters of the program,
the Sample Counter is updated with 1 to 8 clock pulses for eachtransmitter pulse. Since the counter input is switched also toby-pass a divider by 8 and/or a divider by 16, the counter stepsalways through its full count during the integration time (see Table
3.4).
Unequal spacing of the Doppler lines near zro rrequency, one
of the limitations of the DGS 128PS system. has been overcome in the
32
% v) 00 c .- r-. UC'm f-4Ocy e (~CA t 0: w.VC-. o .1 I! i r - - -P 4N \I C'O % CI % 0%0 C%4U) CN v- .4 r-4.~,4~~ C--4 t .: J 4 - -4D C' 0 \ r-4 L %- ~. Ul % r I ,T in r- )o0 0\o'0% 0 0
C-4c Co oc Co:AC)C 3 C C)C.)C)C) 4., (\ cy% irn CNr- "r- C14 - CNJf- I nt l , -.T .1
r-4 N -t4 -4- v-4%0- N- r-4~ Q~%.L -4i -4 000 CO-
(n "P4 - 4 C 0% 01~eJ 4 'C r- - O C .O0 r- %L).O C.44X r- n% , nen- "C - ONID -0 %ID W
P-4 ,-I .-4 ,-4 r--i
0% co 0 -- 00C-4% 0 I- )- I 0-I NC o% tr) CO I % " ON.4'.C%j L0%a: Co.4 N0WD % e . 0%:T r- O, D% nM 4C,(r-.I 4 O%T 44 OD C .1 r4 r-4 CE) In-4 C7 DC ) DMC)P Z *4
C>N NC 00 S 0ON (% C\0 O 7 00 TCOD CI 0r-Il -"r ,-I %0 -I V * : .44 4C MC-4rp4 V-4 V-490 Cz C.
.-4 co %o0. 4 oo %D-. c4cIc0c-4 OD~ %tCDC t r" 0 )% DC- I I 0 C >C.40-* C.)% 1-4
%10r- --4 00 .1 -4 O ' 4) MP 0%0%;t 0% %T " -40n I% %"O4N Itn0 0C 4 DO 0%e
.- I
U, V c N-1 c%0 0C4 1C 04 -t %L,,00 C. C,3% 9-o4rD ~3C:O4 co 00 *C CON.tO4' I Inm N 0%0C)m'P- 0 4 %D C4 )f-W 9m% . llP 0%, ' -4%D CO %Zt NI0% 0 D M 00P- P4 C4
C.4Cy ON% OD 0N. 0 0 n N rr-I.4 4CO ~ j% in O0..-0 C4oOO.~D -. nr %00r n0
9-4 \c I n-Ie - o% cD.N0OI N -4 oDMv-4-.100v In 00 r c Mr-DWDCNN40 o0ON0W
% -n % D (D0%0 C'. M N.I~0 -T% >9 O -4 0. 00 M r-I MW NC4 . O %0r-0 - I )V9-4 P, W Mr,-4 CY% 0 .COa I-ln0%UIn4 %I r.4. %-T 0 * C cn r0)%U %nOV 4 Cc- %:r f'
W) oD4'o.c ,tDOO~ C> %0 COo C % % o O'CD ~ D CO %I N
N o" c &~4CY% t o" 0n% In %,D n%0, in co eqGo0% " s a-0% In U0U % %%D VI%D
""1 00 %DM -40 % C NIr-C4r-C r C rN M9 v-4 M %0 00 -4C9M'.D 0 I f-N N en
I-so ocoV :r .- co " J'.D 00 cn % o CON4..t " -t D C4 DO0 W oz co' -T4C"% "DoNco a\ r- Co D4 m ,0%I- D "I 0% CI~O r % n V 4 0% D 0 .Co %D 4 ~ -4
Co In % % M%D% -T 04t0 - InM " M Cq4%D~ ODeq4 r4 In a .4aI r-TCD<ca
ul 00%3 4 0 0 %D00 C14 0 %D 0-T0 %D ' 9-I4 4 0 CO%0 4 C C0 0 CO -t0' %D%D C . % C "%D - ON%* C\ " CWj0%N "CIN ~%D %4 4 %. 0 c" 0 e O '0N o%:0% V
00 r- Cy\ j " %00-4 M10C - w - "* LM rir-CO "~4 % 0 -4M%00 =r
Mv 0N>" o 0o c0C)%DD O4 "0 4 " 0 0 0% IN %DC>4 CO D0 -TN0 "40 C0 %0% ' H
co%. '.O\,T D-4 P Irl - 000% m -9.T N1 t4Nv..1 9- n O0% 0 C
*f'- 4., co004 00".0 co0% %0c N) ,-T-v-N %0Nt'.. a)0C D0 e D0 -
f- -1c 0 O N 4 inO %0fl C GO 0\ C N V-44"4 -4 -4 4 ,- 4 -c
mA NDC 00 1 Dc o C4 440' 0D% O 0 In0N 0- .OC%OID-t0 00 0I%* %D CO0 0
r--t4 MCO M00M InI LM U% %D 0,-( VA0 9-4C9.U'C -4Uv- v-
r. -NCN o CV)0CV) f) O'.I I D D-D N C1 -4 r-I
%o In r r'. oor-- r-I 4 Cq " n m en -t wl 4 U, -4 -4 9--4r4NN C14CI
r-4 oo %D oo %o coNNN t. 00000 0000000qc c qC4C4 Nr C C Dooao )C D0 CDC H%D ~ U U'D U%% n% , 0I r- 4 f-4 -4 r-4 r-4 U,
4 en4l , IA n C.D C 00'.%D0- V~-).--0% r-4 Cn I - \S'0 0 4 C14%0 0
f- 9- O=-4 4r4r4C4C4C -4r - 4r -
33
.,-4 '-4
xx x x x~ x x 0 .4ru-4 v-4 r-4 -4 %.Q) '0 %D0 %0 %D %0 %.0 r-
I 74 ,-4 -4 #-4 '-4 7-4 CN VA.
x X x x x x x )( X x x -
V-4 C*4 aD -4 7- * 7-4 I-4
coP-4P44
V-4 C* -S O
w(t &n WN
-4-
C14.~ -4N
x x x X x x Ex0
$--I Go0 Go% '000
V-4 en
+ 4 C;- C'-
(14 "4 7-4 V-d
r.~En .0 ~-
0-.? 0 )r4 ;r r-C i
w-44

DGS 256. For narrow spectrum spacing the trigonometric functions
are taken at odd multiples of one-half Doppler unit: i.e. at ±1/2;±3/2; ±5/2; ±7/2, etc. times the reciprocal sample length. Thus onlyone-half period of the trigonometric function is covered for the firstDoppler measurement and 3/2 for the next, etc. To arrive at zero
phase in the middle of the sampling period the basic argument counteris set to 2700, bringing the counter over 3600 (= 00) to 900 at theend of the sampling period. In reality the count is produced by a 12bit binary counter. The total argument for the Doppler channel "6 isproduced by adding m times the basic angular count.
While the counter must go through all significant positions forthe sampies at each channel, corresponding to one-half cycle for the
argument at the lowest frequency 61 = 1/2 it is important thatsignificant bits can be accumulated for data points within a sample,
measuring the behavior of the different antennas.
Dependent on the W3-bit of the program a cos 2 function isproduced on the Log Trig card too, for weighting the data samples.Also the scaling, de;,endent on W3, the number of integrated pulses Nand the number of samples per pulse (W2) is performed on this card,
see Table 3.5.
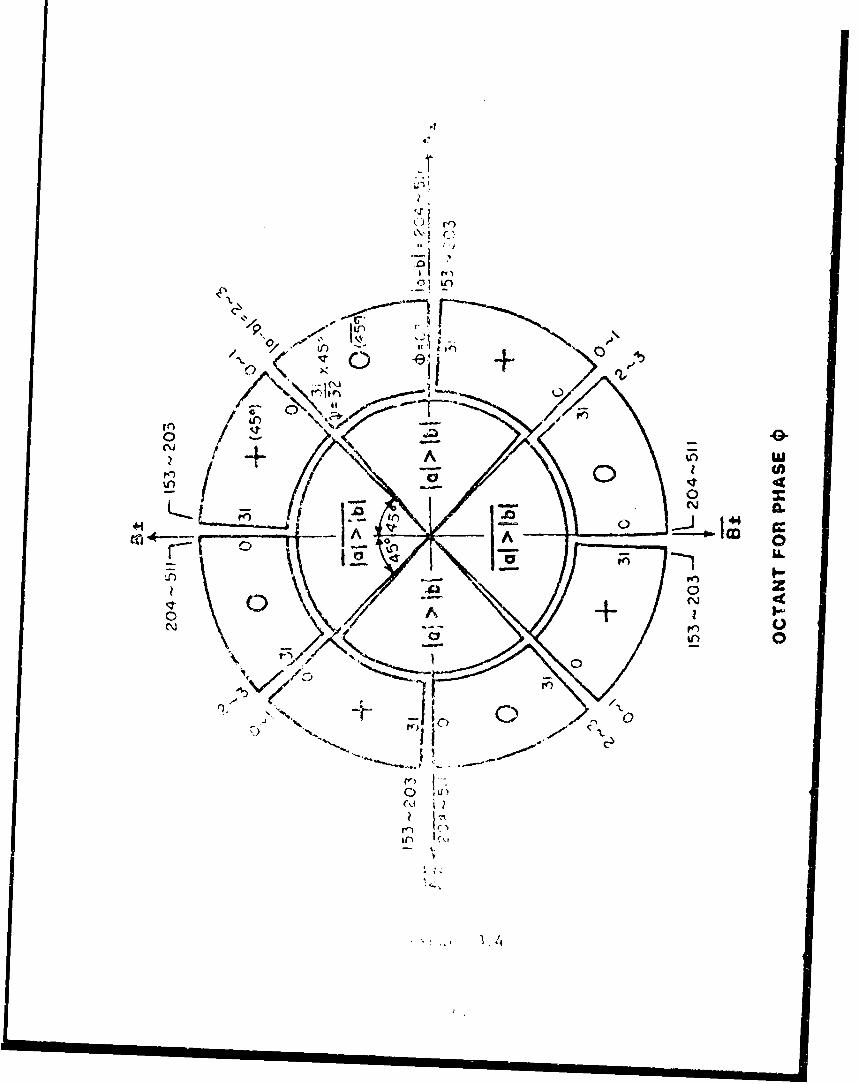
To permit the same look-up table for the sine and cosine
functions two argument functions are actually created, 900 apart.The same binary log sine table (Table 3.6) is used for thetrigonometric as well as for the Hanning weighting. As Figure 3.4shows, the full period of the argument is divided into fourquadrants, determined by the two highest bits of the argument. Toavoid errors in the production of the trigonometric function all 12 bitsof the timing function are added. The sine and cosine output of theSine Table can be independently read if B = 2 and Z = 0 to 7 or 8 to
F.
Hanning weighting reduces the sin x ringing caused by theXlimited sample length. The weighted sequence decreases the leakage
35

Double Scaling
N Sampling Hanning Pulses Samples Weight (6 dB]
0 ++ +
0 0+ 0 4 L 8
0 +6o o - :
2~3 + 1
0 0 48 F 0
+ + - - -10 + 16 H 0
2 82
30 0 181 F 01
o + 16 -0 + 32 H -1
++ 1-0 0 3L6 F -2+ 0 32 -2
+ + 64 -2
+128F5/9/C ++64 18-
0 0 64 F -+ 0 128 -4
1 0 + 128 -3+ + 256 H 4
6/A/D 00128 18-+ 0 256 F
+ 256 H-4+ j + 512 -5
7/B/E 2560 0 256 F -5+ 0 512 F
o + 512 -54 + 1024 -68/F 512
0 0 512 -6+ 0 F
DGS 256-10 LOG TPIG SCALING 8103 1201Bi I Sep 81
Table 3.5
36

xx. li x: c, :) 0 _ (1 OD"- 14 : rj C-I ti mtf"Lv% 0 L rZ r-w wccLLI 34 X. 4 W 1-4 .'jC) f~) < ') 0 C,) N ('I %- 0 PQf, )C) 1,, W LAW l' . t 1&
1- 4 P4~. P- l' P z , - F , X loI, P z.I- fq - .(A Dw
-: N%)C, o- oc K4 co CC)OLVI rsOL t ., u. WL.I-- r ., 2 :, . ,- 44pr, ,..L)r, E, Lr..fx g& r% b za Lr. I. a.0:.
Ul a tnEn Cr v-l '-M C) Q 4 - 0 [- % fj f- c r- % e WD ( f' 9 tZ93 44 co(J
v UlU u . n00 - ,- TCIa 7 r 4I r - 0nV -<04 4 09
M. if 0 11 4rLIJ1;) k,0% % - % 7 pl4 1LC4 Ut Va4 ,- -1
4x & r 1 4r-9 40 QX O Nr % C nC Y 000c .Wr4944 X x $41J L
~~fE rra rL P.r--[r[14zdrr'ZP4 Ex U
~~Z4 14 a - ..
fx,~ ~ ~ ~ ~ ~ ~ ~ ~ ~ ~~~e- r4~ 0 c Dr Q-t z 1 - Z %0 400 UIC 0r V 4u.~w4I L rx Fwp )P %r---9 1 -%p ) 49494D 2 3 1
~ -'4
%0~~~ ~ ~ U.0 -4I-e - np omc i % n i %L u
X 4144 4 f. W9LI W AQ0% 0 I P-4U r. 0%4 U ) g r4W g 9Z 44 W t U4 en -;z4 4 44 x4 r gar t W 4 44W 4 tu sd 4 C
rra.r ~ fX rr 0
X- Lx 0.-W W 4Li0MMMt aM C%-c9.L
K L % (,,:A EL- w-~ ~r r- L4 49r-r. rz. 9% zI 4Iz 4r-. r [r f-I'4.f r -r. &[.I. tv4-1 X
0~~~~~~ ~t j4 C ~ N Q ) <r3TX~)C
M ;l;4 9 -'C A%0E - o -CIP-r4% WC%- Cj g or- 40 t nM0 494 4
[L 24 .L- %4r4p z !)p a4 OI V100tIII % ou mw 4ww uW i 3, I- C
-ti
A-yi (
:~+;
Ln~
- -0-
ILNInCOI
~jA
.~J1 14~
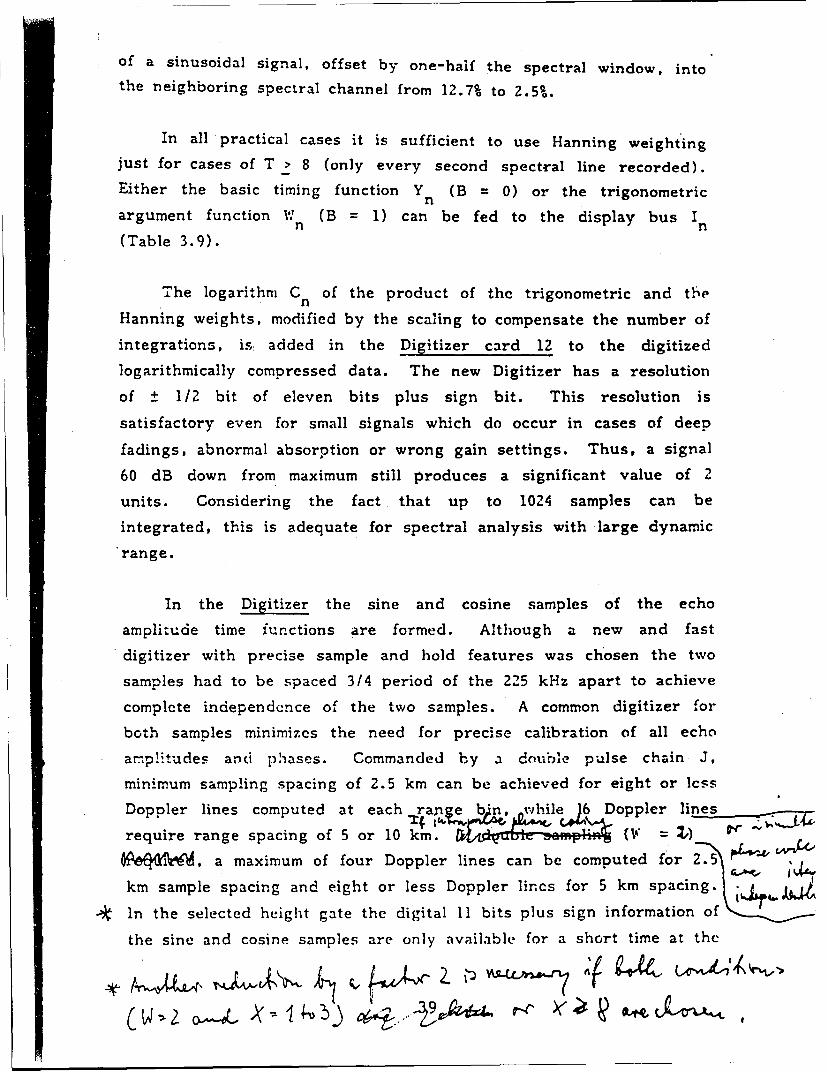
of a sinusoidal signal, offset by one-half the spectral window, into
the neighboring spectral channel from 12.7% to 2.5%.
In all practical cases it is sufficient to use Hanning weighting
just for cases of T > 8 (only every second spectral line recorded).
Either the basic timing function Y (B = 0) or the trigonometricnargument function W (B = 1) can be fed to the display bus In n
(Table 3.9).
The logarithm C n of the product of the trigonometric and tbe
Hanning weights, modified by the scaling to compensate the number of
integrations, is added in the Digitizer card 12 to the digitized
logarithmically compressed data. The new Digitizer has a resolution
of t 1/2 bit of eleven bits plus sign bit. This resolution is
satisfactory even for small signals which do occur in cases of deep
fadings, abnormal absorption or wrong gain settings. Thus, a signal
60 dB down from maximum still produces a significant value of 2
units. Considering the fact that up to 1024 samples can be
integrated, this is adequate for spectral analysis with large dynamic
range.
In the Digitizer the sine and cosine samples of the echo
amplitude time functions are formed. Although a new and fast
digitizer with precise sample and hold features was chosen the two
samples had to be spaced 3/4 period of the 225 kHz apart to achieve
complete independence of the two samples. A common digitizer for
both samples minimizes the need for precise calibration of all echo
ar.,p.tudes and phases. Commanded by a double pulse chain J,
minimum sampling spacing of 2.5 km can be achieved for eight or less
Doppler lines computed at each ranieb~e , bnwhile 16 Doppler lines
require range spacing of 5 or 10 kmn. Z) ( =
.a maximum of four Doppler lines can be computed for 2.55 4& S ,,
km sample spacing and eight or less Doppler lincs for 5 km spacing.
-* in the selected height gate the digital 11 bits plus sign information off
the sine and cosine samples are only available for a short time at the
2o - Z i &
cuJpf the diyi:,'.,r .,.nc .i:. t Ij! 't'ole be sfJ)td in a quadruple
storage regic-.!-
The Log ProtN!,!: Q no form: o ;,, :he D)igi tizer card. are fed to
the Iniegrator ci, o i ' whili t he- d:,t.t stored in the
Accumulator card I; by addisig to, ff.-7 s;tored sum of the 128 x 8 x 4
products a new p:.,.liut for on-, rJ' 11w 16 channeh; in one of the 128
range bins.
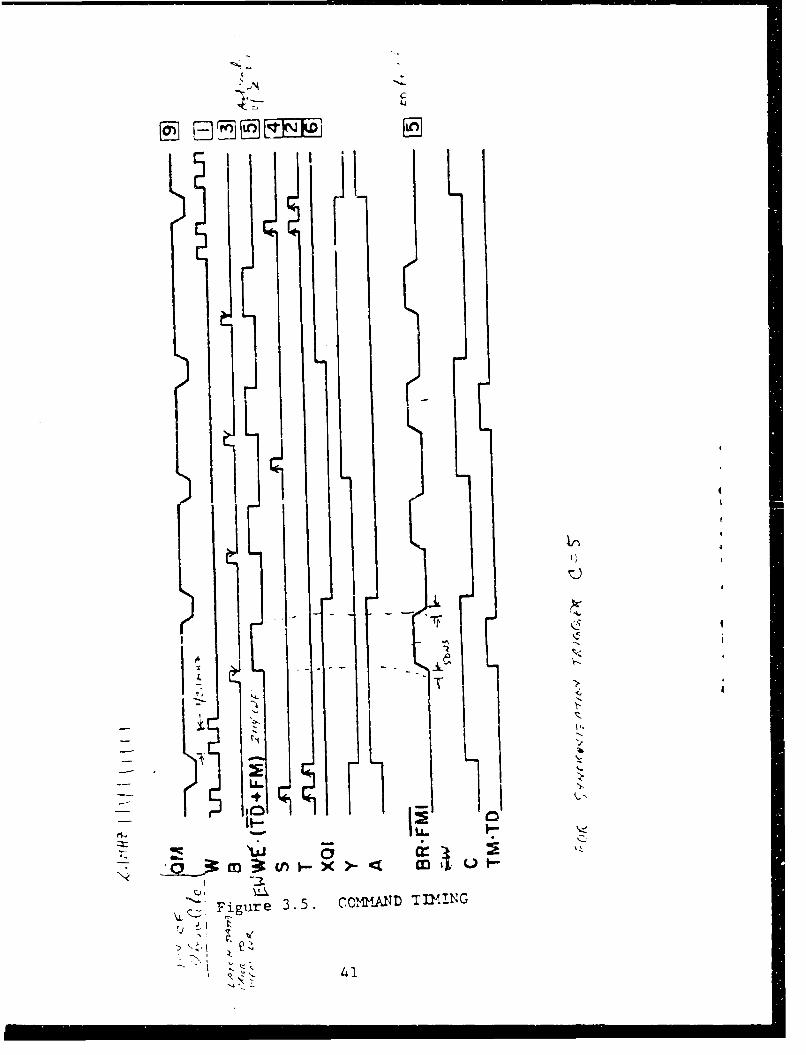
Each 20 bit word is read out of the memory of the Accumulator
card and added to the lincarized Log Product from the Digitizer card.
This sum is temporarily stored in "' flip-flops and written back at
the same memory addre: s. Tinting by a 24 position counter (see
Figure 3.5) is optimized to accept even the slowtest version of the
2114 RAM chips.
Large solid state low power storage has become available with the
advent of LSI memory chips. ULCAR built one of the first operating
solid-state flip-flop random access memories for the Low-Frequency
Sounder (1968). Ior applications where reformatting of long digital
data time series is necessary, the new 1024 x 4 bit per chip RAMs
are ideally suited. They require almost as little power as dynamic
registers and have high speed and better interface capabilities. Thus
the data can be read out as a sequence of ranges for each of the 16
channels with different Dopplers and antenna configurations, while
during the integration process all )oppler line products of a range
bin are produced first before the ranges and the antenna
configurations are changed.
The Log Sum card ]5 carries out first the sunI and then in a
second scan the difference of two adjacent products:
a. - (-Xi) x cos(wmtn) + Y x sin(W t ) for the real spectraln m n n in n
componetif; of the positive Dopplers.
Best Available Copy40
.p.4
' ii
I.Ii
4
I'
*1r
-I
iO L~IJ
'A
K
~ Figure 3.5. CC~4A~D TD4!NG.~l
11
21
41
b. Y x cos(w t ) + (-Xn) x sin(wmtn) for the imaginary spectralcomponents of the positive Dopplers.
C. - (-X n ) x cos(Wt) - Y x sin(w tn) for the real spectral
components of the negative Dopplers.
d. Yn x cos(Wmtn) - (-X ) x sin(w t ) for the imaginary spectraln m nn m ncomponents of the negative Dopplers.
In order to suppress the leak-through at the mirror Doppler
frequencies the sums and differences should be formed with maximum
possible accuracy. For that reason 14 bits plus sign from the 20 bits
of the Accumulating Memory are selected with the weights from I to
8192.
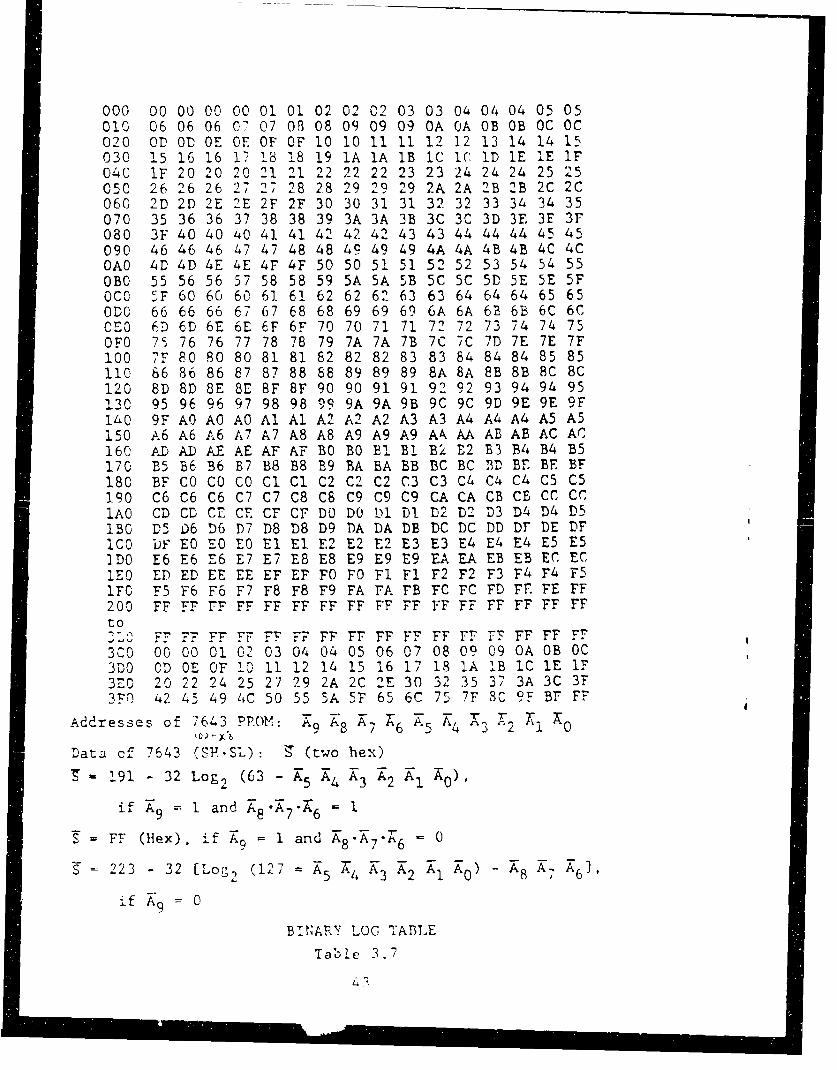
After logarithmic compression (see Table 3.7.) the Log Sum
output produces a sign bit and nine magnitude bits with 3/16 dB
resolution, 0 to 95 13/16 dB. Thus more than 60 dB dynamic range
for the spectral amplitudes is sufficiently covered.
On the Magnitude card 16 an algorithm, developed for the
Digisonde 128 calculates from the log-real and log-imaginary
components the log-magnitude and the phase. The difference in the
magnitude of both components is the key to correct the larger of both
log components by between 0 and 3 dB. This is shown on Table
3.8A.
Because the log-magnitude has nine significant bits, the
Magnitude card has the same output format as the Log Sum card.
The difference in magnitude of the log-real and log-imaginary
component (jAI-IBI), created on the Magnitude card, also produces
the phase value. Phase is presented in a 8-bit linear scale with
3600:256 = 1.406250 resolution. Dependence of the Phase on IAI-IBand the sign of the log-real (A) and the sign of the log-imaginary
(B) components is presented in Table 3.8B. The phase is alternated
with the magnitude on the eight most significant bits of the Magnitude
42
000 00 00 00 00 01 01 02 02 02 03 03 04 04 04 05 05010 06 06 06 07 07 O 08 09 09 09 OA OA OB OB OC OC020 OD O 0O E OF OF 10 10 11 11 12 12 13 14 14 15030 15 16 16 17 18 18 19 1A 1A IB IC IC 1D IE IE IF040 IF 20 20 20 21 21 22 22 22 23 23 24 24 24 25 25050 26 26 26 27 27 28 28 29 29 29 2A 2A 2B 2B 2C 2C060 2D 2D 2E 2E 2F 2F 30 30 31 31 32 32 33 34 34 35070 35 36 36 37 38 38 39 3A 3A 3B 3C 3C 3D 3E 3E 3F080 3F 40 40 40 41 41 42 42 42 43 43 44 44 44 45 45090 46 46 46 47 47 48 48 49 49 49 4A 4A 4B 4B 4C 4COAO 4D 4D 4E 4E 4F 4F 50 50 51 51 52 52 53 54 54 55OB0 55 56 56 57 58 58 59 5A 5A SB 5C SC 5D 5E 5E 5F0C0 SF 60 60 60 61 61 62 62 62 63 63 64 64 64 65 65ODO 66 66 66 67 67 68 68 69 69 69 6A 6A 6B 6B 6C 6CCEO 6D 6D 6E 6E 6F 6F 70 70 71 71 72 72 73 74 74 75OFO 75 76 76 77 78 78 79 7A 7A 7B 7C 7C 7D 7E 7E 7F100 7F 80 80 80 81 81 82 82 82 83 83 84 84 84 85 85110 66 86 86 87 87 88 88 89 89 89 8A 8A 8B 8B 8C 8C120 8D 8D 8E 8E 8F 8F 90 90 91 91 92 92 93 94 94 95130 95 96 96 97 98 98 99 9A9A 9B 9C 9C 9D 9E 9E 9F140 9F A AOA A1 AI A2 A2 A2 A3 A3 AA4 A4 A5 A5150 A6 A6 A6 A7 A7 A8 A8 A9 A9 A9 AAl AA AB AB AC AC160 AD AD AE AE AF AF BO BO BI B! B2 B2 B3 B4 B4 B5170 B5 B6 B6 B7 B8 B8 B9 BA BA BB BC BC BD BE BE BF180 BF CO CO CO Cl Cl C2 C2 C2 C3 C3 C4 C4 C4 C5 C5190 C6 C6 C6 C7 C7 C8 C8 C9 C9 C9 CA CA CB CB CC CClAO CD CD CE C. CF CF DO DO Dl D! T2 D2 D3 D4 D4 D51B0 D5 D6 D6 D7 D8 D8 D9 T)A DA DB DC DC DD DF DE DFIC0 -bF EO EQ 0 El El E2 E2 E2 E3 E3 E4 E4 E4 E5 E5ID0 E6 E6 E6 E7 E7 E8 E8 E9 E9 E9 EA EA EB EB EC EClE0 ED ED EE EE EF EF FO FO F1 F1 F2 F2 F3 F4 F4 F5IFO F5 F6 F6 F7 F8 F8 F9 FA FA FB FC FC FD FE FE FF200 FF FF FF FF FF FF FF FF FF FF FF FF FF FF FFto
F r F FF F F? F FT FF FF FF F' F. FF FF Fr3C0 00 00 01 02 03 04 04 05 06 07 08 09 09 OA 0B 0C3D0 CD 0E OF 10 11 12 14 15 16 17 18 IA IB IC IE IF3E0 20 22 24 25 27 29 2A 2C 2E 30 32 35 37 3A 3C 3F3F0 42 45 49 4C 50 55 5A 5F 65 6C 75 7F 8C 9F BF FF
Addresses of '643 PROM: T TS A7 T6 A5 A4 3 -.2 Tl 0
Data of 7643 (SP.SL): T (two he%)
191 - 32 Log 2 (63 - A5 A4 A3 A2 A1 T 0),if A9 =- I and A8 .A7 - K6 = I
S= FF (Hex), if T9 = 1 and A8 A7 - 6 0
223 - 32 [Log, (127 A5 4 A3 A2 A1 A0 ) - A8 A7 A6
if A9 - 0
BI NARY LOG TABLE
Table 3.7
4?

32 IAI- iI C - 16 Log 2 [I + 21 1, tan
AI - BI C (3 dB) A- JBI (i-)
0, 1 16 O, 322, 3 15 2, 3 314, 5 14 4, 5 306, 7 13 6,7 29
8. 9, 10 12 8, 9, 10 2811, 12 1I 1, 12 27
13, 14, 15 10 13, 14 2616, 17, 18 9 15, 16, 17 2519 - 22 8 18, 19 2423 - 25 7 20, 21, 22 2326- 30 6 23, 24 2231- 35 5 25, 26, 27 2136- 41 4 28, 29, 30 2042- 50 3 31, 32, 33 1951 - 62 2 34, 35, 36 1863- 88 1 37, 38, 39 1789 - 511 0 40, 41, 42
43, 44, 45 1546 - 49 1450 - 53 1354 - 57 158 - 61 1!
62 - 66 I67 - 71 972 - 77 878 - 84 785 - 92 693 - 101 5
102 - 113 4114 - 128 3129 - 152 2153 - 203 1204 - 511 0
A Log Real and
B = Log Imag. of Spectral Amplitudes in dB
Table 3.8. LOG MACNITUDE CORRECTION C AND PHASE t
44
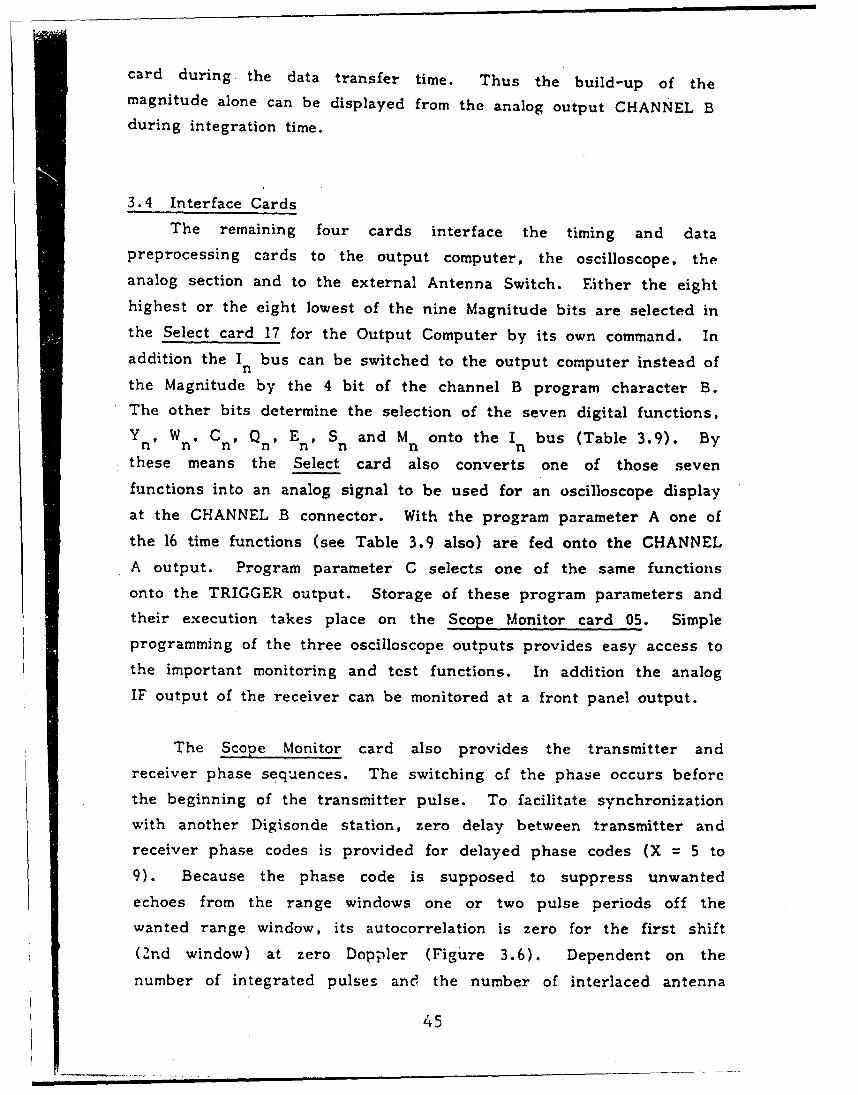
card during the data transfer time. Thus the build-up of themagnitude alone can be displayed from the analog output CHANNEL B
during integration time.
3.4 Interface Cards
The remaining four cards interface the timing and datapreprocessing cards to the output computer, the oscilloscope, the
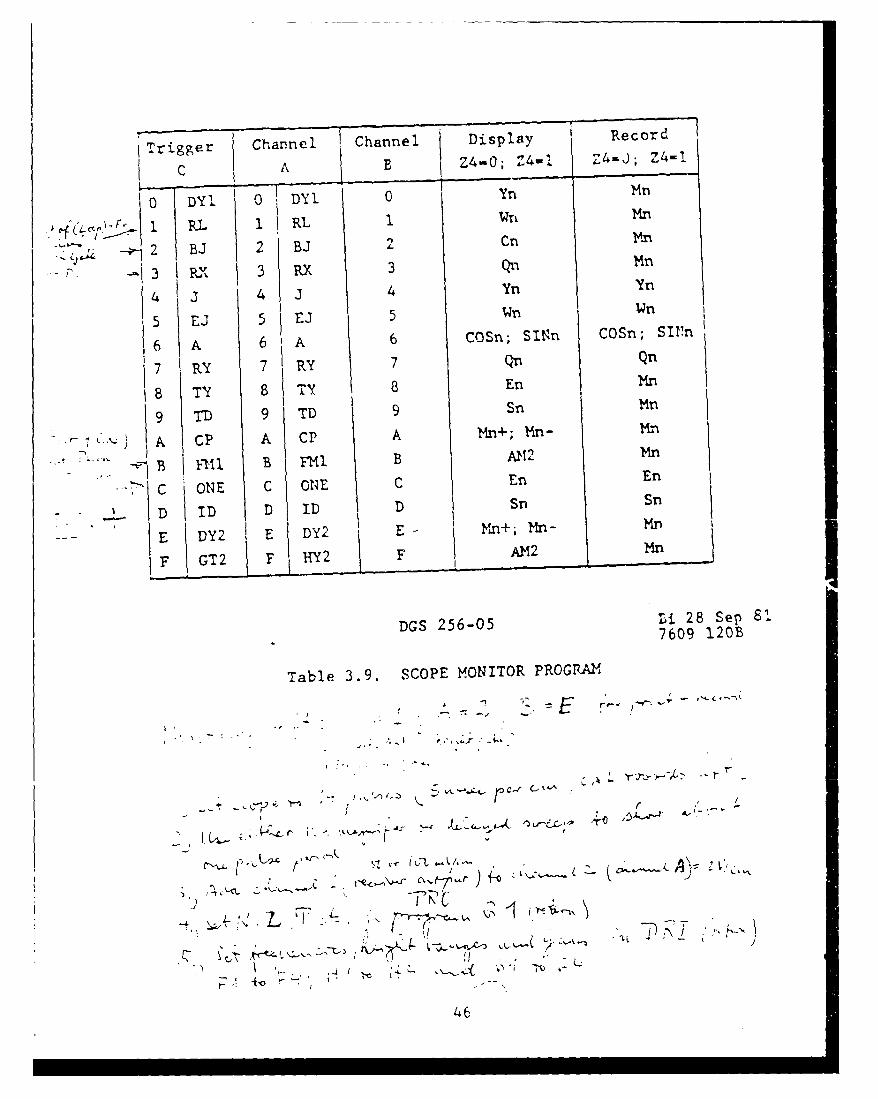
analog section and to the external Antenna Switch. Either the eighthighest or the eight lowest of the nine Magnitude bits are selected inthe Select card 17 for the Output Computer by its own command. Inaddition the I bus can be switched to the output computer instead ofn
the Magnitude by the 4 bit of the channel B program character B.The other bits determine the selection of the seven digital functions,Y Wn Cn Qn E ,S and M onto the I bus (Table 3.9). Byn p n n n n n°
these means the Select card also converts one of those seven
functions into an analog signal to be used for an oscilloscope displayat the CHANNEL B connector. With the program parameter A one ofthe 16 time functions (see Table 3.9 also) are fed onto the CHANNELA output. Program parameter C selects one of the same functions
onto the TRIGGER output. Storage of these program parameters andtheir execution takes place on the Scope Monitor card 05. Simpleprogramming of the three oscilloscope outputs provides easy access tothe important monitoring and test functions. In addition the analog
IF output of the receiver can be monitored at a front panel output.
The Scope Monitor card also provides the transmitter andreceiver phase sequences. The switching cf the phase occurs beforethe beginning of the transmitter pulse. To facilitate synchronizationwith another Digisonde station, zero delay between transmitter andreceiver phase codes is provided for delayed phase codes (X = 5 to9). Because the phase code is supposed to suppress unwantedechoes from the range windows one or two pulse periods off thewanted range window, its autocorrelation is zero for the first shift
(2nd window) at zero Doppler (Figure 3.6). Dependent on thenumber of integrated pulses ane the number of interlaced antenna
45
Trigger Channel Channel Display Record
C A B Z4-0; Z4-J Z4-0; Z4-1
0 DY_ 0 DY1 0 Yn Mn
1 RL 1 RL WT Mn
' -! 2 BJ 2 BJ 2 Cn Wi
•3 R , 3 RX 3 Qn Mn
4 J 4 j 4 Yn Yn
5 EJ 5 EJ 5 Wn Wn
6 A 6 A 6 COSn; SINn COSn; SI11n
7 RY 7 RY 7 Qn Qn
8 TY 8 TY B En Mn
9 TD 9 TD 9 Sn Mn
--c .\ jIA CP A CP A Mn+; Mn-n
B 1 1,1 B FvI B All"
C ONE C ONE C En En
- - D ID D ID Sn Sn
E DY2 E DY2 E- Mn+; Mn- Mn
F GT2 F 1 Y2 F AM2 Mn
DGS 256-05 Bi 28 Sep 817609 120B
Table 3.9. SCOPE MONITOR PROGRAM
.-
rr
-
46,& w. '
*'\
-&<-
46
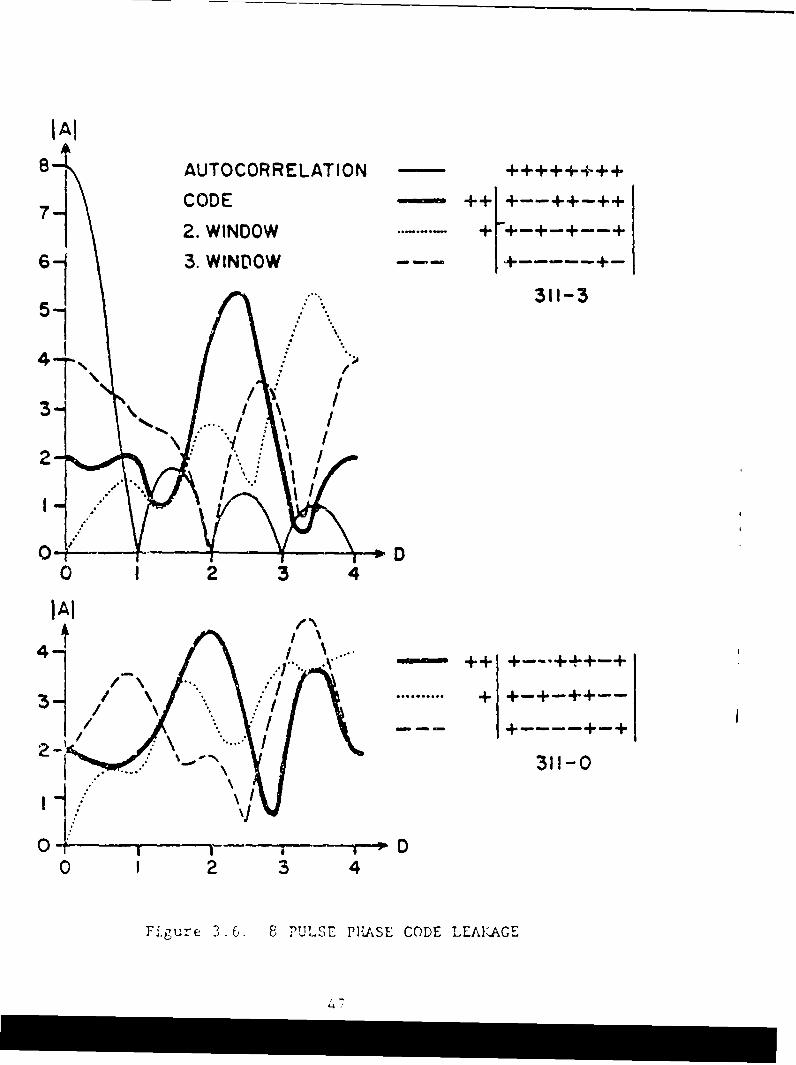
8 AUTOCORRELATION -++++
7-CODE ++ +--++-++
2. WINDOW + +-+-+--+
61 3. WINDOW --------
311-3
D
0 1 2 3 4
JAI4-+++-.++-:11 ............. + +- ++ -
****~***311-0
0-D0 2 3 4
Fgure 36. 8 PULSE PHIASE CODE LEA1KAGE
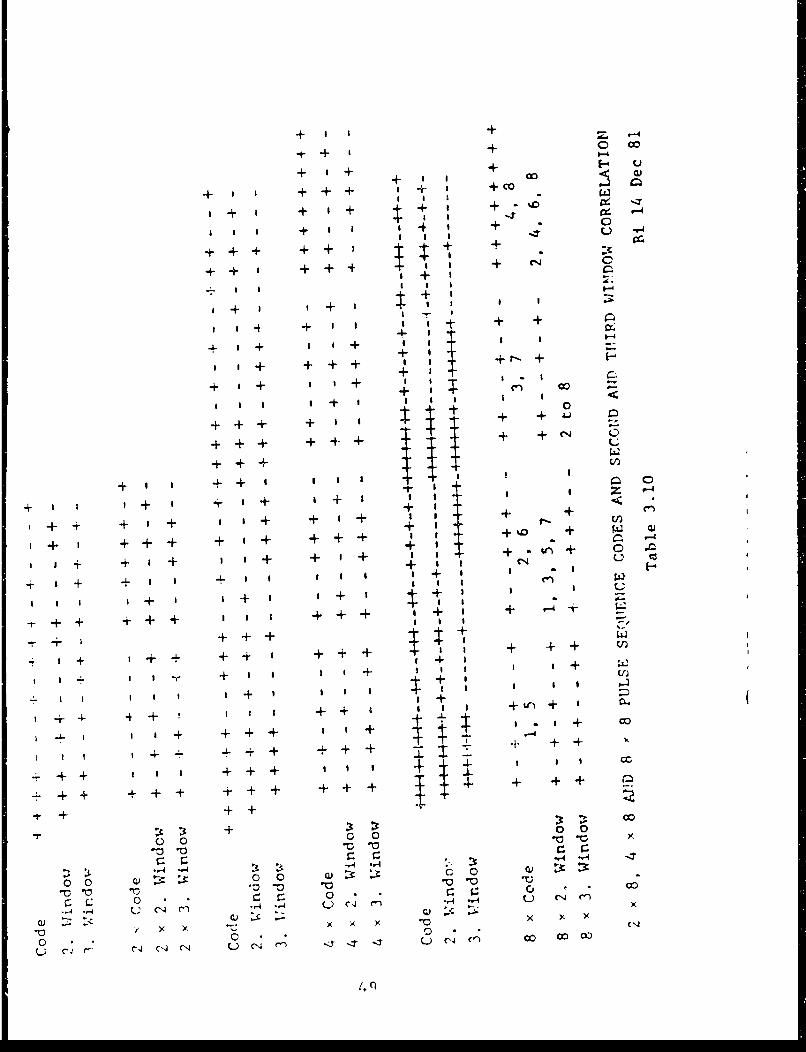
directions, the phase code (Table 3.10) is different from that of the
earlier Digisondes because of the applied weighting during spectralintegration. ' munication with oher ...... t-
A limited size of the subcodes is important if either the signal orthe interference is not stationary during sampling time. Therefore,in addition to suppressing the out-of-range echoes completely, the
phase code also reduces coherent interference considerably, especially
if it has the same frequency or if it lies on a pulse repetitionsideband of the sounding. Then almost the full coherent detectiongain can be realized, bringing the effective bandwidth from 20 kHz(reciprocal pulse width) down to a combination of frequencies with
individual widths in the order of 1 Hz dependent on the integrationtime. Because of the maximum residual values of the correlationfunction of the phase code (-5.0%) this is not true for all interferencefrequencies. The detection gain also depends on the modulation and
stationarity of the interference and the number and spacing of theDoppler channels of the 4igisonde. If long range echoes
(backscatter) are desired the D phase code is Z € andthe three last prerun pulses of the remote sounder can be used forreception during spectral integration time (X = 5"to 7). The phasecode is switched off for X = 0. Normal position is X = 4 with
C&
On card 08 is the interface between the CORE and the AntennaSwitch. This Antenna Drive card combines the timing functions Bnwith the program functions L n Z and T . To'. ther they providen' n n -
the momentary decision of the selection of the different antennas andtheir delays and polarization. Table 5.8 indicates the definition of
the different antennas, the beam direction and the polarizations and
also the meaning of program parameter L n as starting azimuth of an
antenna sequence while Table 5.9 gives the azimuth spacing of theantenna sequence expressed by Z . T determines the number of then nscanned antenna directions and the use of the overhead beam for
(T < 8) or (T = A, E) x (Z 7 or F).
48
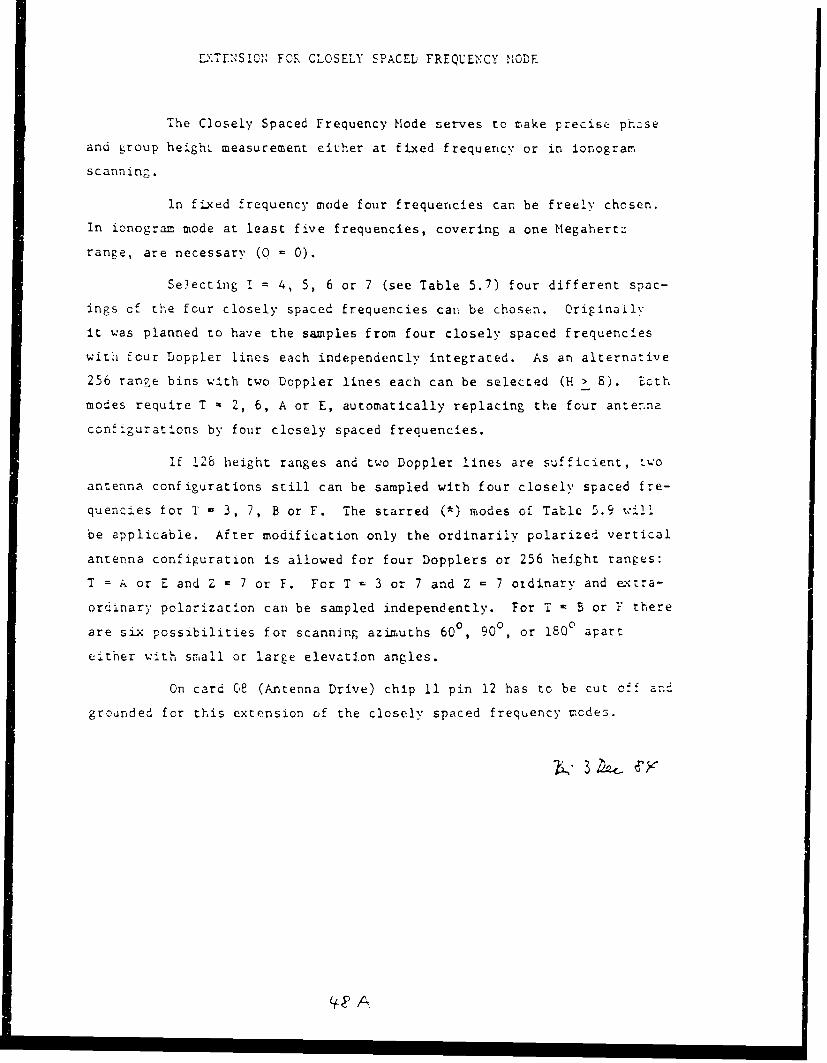
E:TENSION FOR CLOSELY SPACED FREQUENCY MODE
The Closely Spaced Frequency Mode serves to make precise ph2se
and group heighL measurement eiLher at fixed frequency or in ionograr
scanning.
In fixed frequency mode four frequencies can be freely chosen.
In ionogram mode at least five frequencies, covering a one Megahertz
range, are necessary (0 - 0).
Selecting ! = 4, 5, 6 or 7 (see Table 5.7) four different spac-
ings of the four closely spaced frequencies can be chosen. Originailv
it was planned to have the samples from four closely spaced frequencies
with four Doppler lines each independently integrated. As an alternative
256 range bins with two Doppler lines each can be selected (F > 8). Ecth
modes require T - 2, 6, A or E, automatically replacing the four anten.na
conf:gurations by four closely spaced frequencies.
If 128 height ranges and two Doppler lines are sufficient, two
antenna configurations still can be sampled with four closely spaced fre-
quencies for T = 3, 7, B or F. The starred (*) modes of Table 5.9 will
be applicable. After modification only the ordinarily polarized vertical
antenna configuration is allowed for four Dopplers or 256 height ranges:
T = A or E and Z = 7 or F. For T - 3 or 7 and Z - 7 oidinary and extra-
ordLnary polarization can be sampled independently. For T - B or F there
are six possibilities for scanning azimuths 600, 900, or 1800 apart
either with small or large elevation angles.
On card 08 (Antenna Drive) chip 11 pin 12 has to be cut off an
grounded for this extension of the closely spaced frequency rcdes.
I.3
L .
+ I V -4
++ c u
+ + -+II I + m+ + + + I
++ + + + a +
+ 4 +
+ + a + + +I I + -
I a -a- - .94 -,4 + + +
+ + + r-44' 4+4 + + ++ + +
a 4 a I +i I I -
+ + ++ + + +
+ + I C-
+ I 1
+ + +
:L
+ I + + + ++ + - "
+ +
+ + + I+
, - + a a a a 4
--- + ++ + I + + + I I + , + -
+ +a
++ + + a a+ + + + I a-r- + 0)+ +
a a + 4 - " -- + + + I II +
+ + + I + I- -t- +
S + + ++ + + + + + + + + -4 a
+ ++ + + + + a a
S + + + a + + a
a, . a N a 4, -+ a a' 4 -4- " 0
44+
It .I I' I I + X}X x )
+4 4+
+ + +0
00 +0 00 0
00 00+ 0)t 0
Co 0 0 0 ,* 0
-- 9 t . ,4 -N 4 -r4.4 U C' a4 -4U ( *
/~~ 0( )'. c.) 0X )
0 0 G o
qi %
C) .g00 (oOC- 'J C1 1
Frequency card 04 decodes and stores one or four frequencies
and the program parameters I and G. It also feeds back to the input
computer the momentary frequency selected in Search Mode and the
actual gain selected by the Automatic Gain Control.
In drift mode the actual frequency is switched very fast between
the four stored values. The stored digital values are fed to the
Synthesizer cards and the Transceiver tuning in ionogram and drift
mode.
3.5 Analog Cards
To facilitate testing and calibration of the digitization and data
processing the analog 225 kHz signal arriving from the Sounding
Transceiver can be replaced by an output of the Calibration card 40.
Dividing the 12.6 MHz square wave function by 7/2 produces 3.b
MHz. A counter to 16, preset by a phase switch, starts a 225 kHz
oscillation after the beginning of the transmitter pulse. A binary
switch permits a total of 16 equally spaced (11.250) phase positions
for the calibration signal. An auxiliary external attenuator improves
the shape of the resulting sinusoidal signal 'and permits variation of
the calibration signal amplitude. Additionlly' the phase can be
changed by 1800, an external Synthesizer source can be selected and
the internal source can be pulse modulated or switched off.
All frequencies are derived from a crystal controlled oscillator-o
which has a stability of ±1 x 10 ' per day. This quartz oscillator is
located on the Source card 33. In the Freauency S-ntax card 34.
the 16 ',M,,.z square wave is divided by 80. ". s,%.n outputs of this
divider are fed as addresses to three PROM chips with five addresses
plus enable each. Six of their paralleled outputs are used as phase
switches for the 16 MHz square wave to create almost symmetric
rectangular waves of the following frequencies: 12.6; 13.0; 13.4;
13.8; 14.2 and 14.6 MHz. Low-Q quartz filters smooth those
rectan gular wavts to perfect sine waves of the respective
frequencies.
50
In the Frequency Switch card 35 one of four, respectively five,
frequencies from this set of six frequencies is selected for each of
the four fixed frequencies F.F.0; F.F.1; F.F.2, and F.F.3. For
F.F.0 one of the frequencies 12.6 to 14.2 MHz is divided by 4 and
mixed with 13.4 MHz to produce 16.55 to 16.95 MHz which is divided
and mixed further in the Small SteRs card to produce the 5 kHz
increments. For F.F.1 one of the frequencies 13.4 to 14.6 MHz is
divided by 16 to produce 50 klIz increments in the oscillator
frequenc:, for F.F.2 one of thc freouencies 13.(l to 14.2 .Iz is
divided by four to prouuce the 200 kHlz increments and for F.F.3 one
of the five frequencies between 13.0 and 14.6 M-z is selected
unchanged to p'educe the 800 kllz increments for the oscillator
frequencies between 14.1 and 18.1 NHz.
On the Small Steps card 36 steps of 5 kHz are created by
dividing F.F.0 by 5 producing 3.31 and 3.39 MHz. One of those
frequencies is mixed with either 8.0 or 8.1 MHz. The latter is
produced by mixing 13.0/2 with 16.0/10 MHz. The sum of F.F.0/I
and 8.0 or 8.1 MHz, covering the range from 11.31 to 11.49 MHz (see
Figure 3.7), is divided by eight to produce one of the frequencies
between 1.41375 and 1.43625 in 2.5 kHz increments. As Figure 3.7
shows, this frequency is first mixed with F.F.1 and then their
filtered sum with F.I.2 on the Frequency Synthesizer card 41.
On the Tuning card 42 the filtered output of the Frequency
Synthesizer card 2P is mixed with F.F.3. The difference frequency is
filter-ci in two digitally tuned circuits with 9.01 MHz increments.
cotn- led by a P1)M,.. This tuned frequency in tl. range from 7.05
to 9.05 MHz is doubled on the Oscillator card 43 after mixing with
either 10, 12, 14, 16, 18, 20, 22 or 24 MHz to produce the tracking
oscillator 34.1 MHz higher than the desired radio frequency (RF).
To obtain the transmitter frequency, this tracking oscillator
frequency is mixed with a fixed frequency pulsed oscillator of 34.1
MHz, generated on the Small Steps card as the mixing product of 8.1
and the harmonic of 13.0 MHz. T&r. 3L(.1 h Kt7 ( e -iL
~OA.~ ~ L~A~ 'Fr W'=2 Are"&
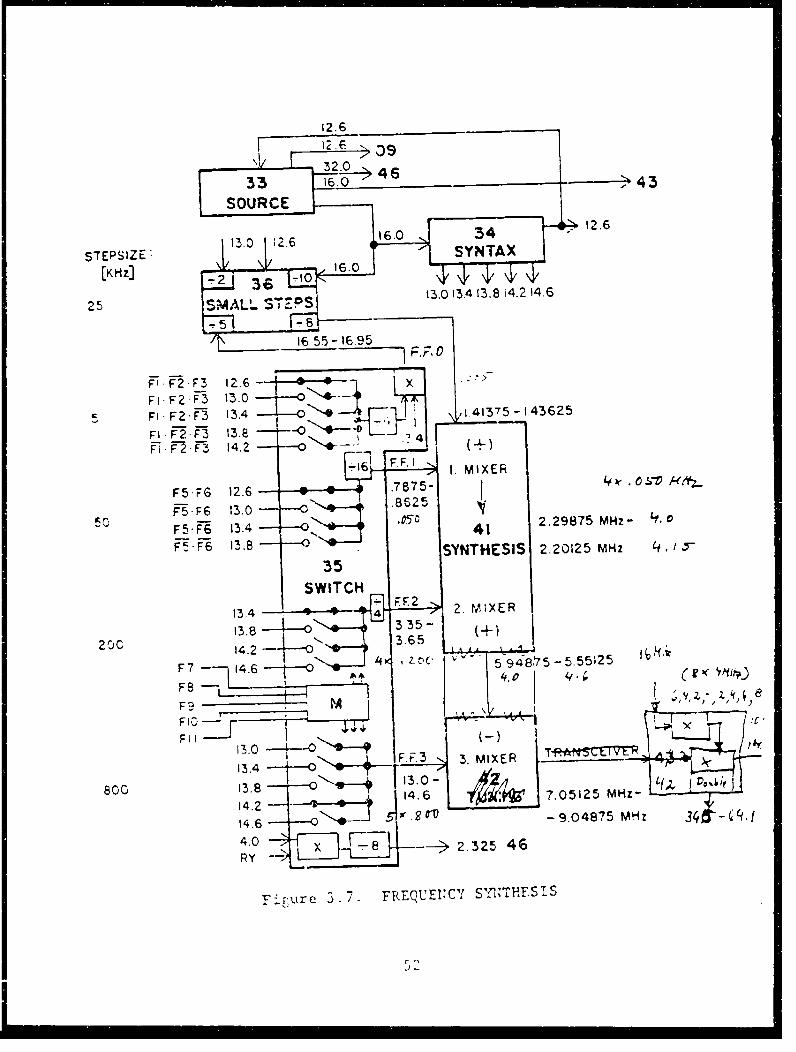
2.6
\! [- 32.O0 9 =
STEPSIZE S7EPIZE 13. TZ 6.0SYNTAX
25 [SAL 3 ST7PS 13.0 13.4 13.814.214.6
-7, 6 .5 - 1 6 .9 5 F ri0
FF2 -F3 1-FI-F2 F3 13.0
5 Fl. F2 F3 13.4 -- C1.41375 -1.43625
FIF2 3 13.8.F-'F.3 14.2 ---- "- -. ;. +
FF6 IF. MIXER
F5.;G 12.6 :_ .7875-
-5 F6 12.0 .862555 -F 13.0 05 0 2 .298 75 M H z- L , o
F5F6 13.4 41
FS F6 13.8 -- SYNTHESIS 2.20125 MHZ f-" ,F
35
SWITCH
13.4 4_ _ ' F.2 2. MIXER---3. - ,, 335- "+)-"
200 4. 3.65 1 - , . d-
F7 1,4.6 -- , ' 594 75 -5.55125 I, -
F8 4, 4
F9 M T It
13.0 F 3 3. MIXER
13.4 LI1.0-
800 14.6 7.05125 MHz-
14.2 -
14.6 Mr v rv ~ - 9.04875 MHz
-. 0 > '_8' - _ 2.325 46
RY
F irure 3. i FREQUEnCY SY1I THF.SIS
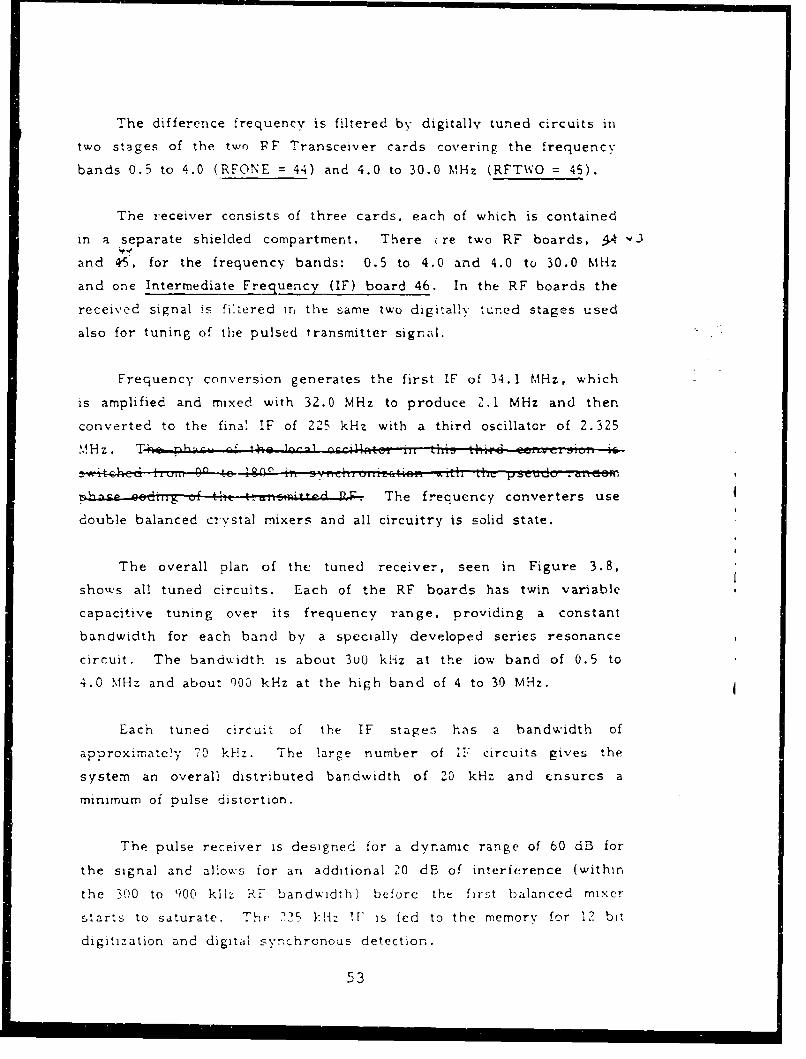
The difference frequency is filtered by digitally tuned circuits in
two stages of the two PF Transceiver cards covering the frequency
bands 0.5 to 4.0 (RFONE = 44) and 4.0 to 30.0 MHz (RFTWO = 45).
The receiver consists of three cards, each of which is contained
in a separate shielded compartment. There ire two RF boards, .4 %'3
and 45. for the frequency bands: 0.5 to 4.0 and 4.0 to 30.0 MHz
and one Intermediate Frequency (IF) board 46. In the RF boards the
received signal is filtered in the same two digitally tuned stages used
also for tuning of the pulsed transmitter signal.
Frequency conversion generates the first IF of 34.1 MHz, which
is amplified and mixed with 32.0 MHz to produce 2.1 MHz and then
converted to the final IF of 225 kHz with a third oscillator of 2.325
,.!Hz. T - c h ''' ,e - lu.... , , th- r- l z.... - r i-
""h = ~ , ....... P' RF-The frequency converters use
double balanced ciyvstal mixers and all circuitry is solid state.
The overall plan of the tuned receiver, seen in Figure 3.8,
shows all tuned circuits. Each of the RF boards has twin variable
capacitive tuning over its frequency range, providing a constant
bandwidth for each band by a specially developed series resonance
circuit. The bandwidth is about 3ut khz at the iow band of 0.5 to
4.0 NMHz and about q00 kHz at the high band of 4 to 30 MHz.
Each tuned circu.it of the IF stages has a bandwidth of
approximately 70 khz. The large number of 1:"" circuits gives the
system an overall distributed bandwidth of 20 kHz and ensures a
minimum of pulse distortion.
The pulse receiver is designed for a dynamic range of 60 dB for
the signal and allows for an additional 20 dE of interference (within
the 300 to 900 kliz R- bandwidth) before the first balanced mixer
starts to saturate. The 225 1-H !F" is fed to the memory for 12 bit
digitization and digital sy."hronous detection.
53
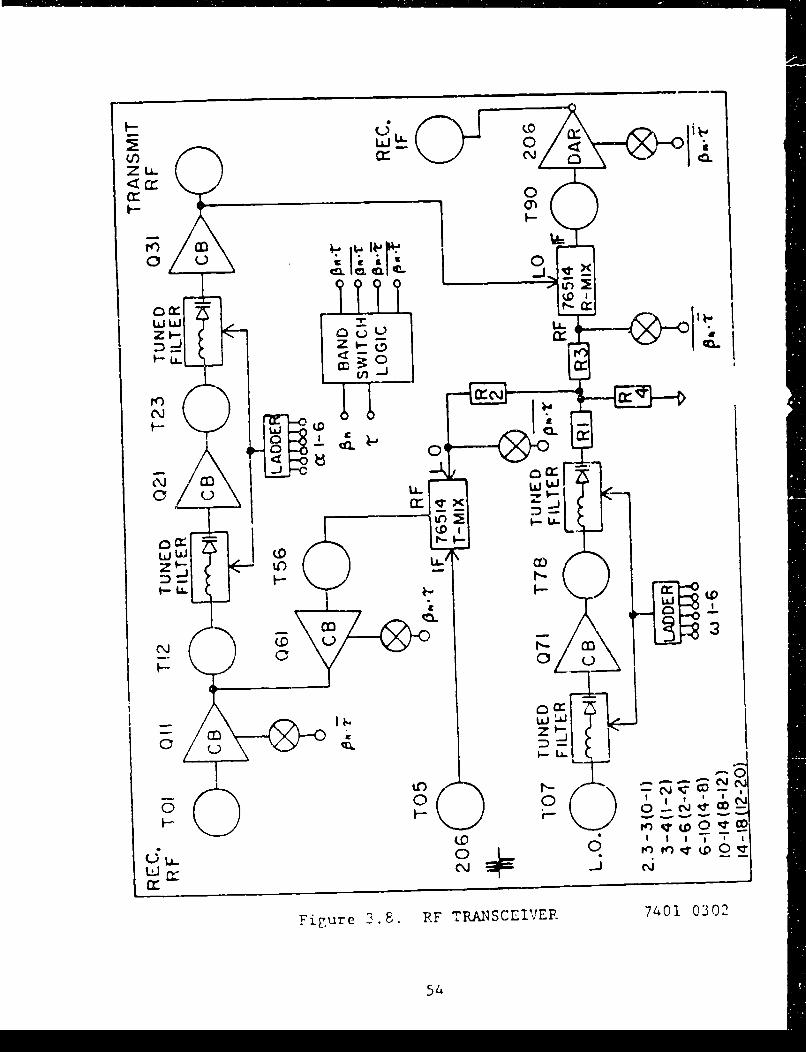
CCIO
z U-
or 0
/C,3
.- s .c-
z t5U- < w 0
cr
(iue38DFT~SEVP 4100
LL) C4
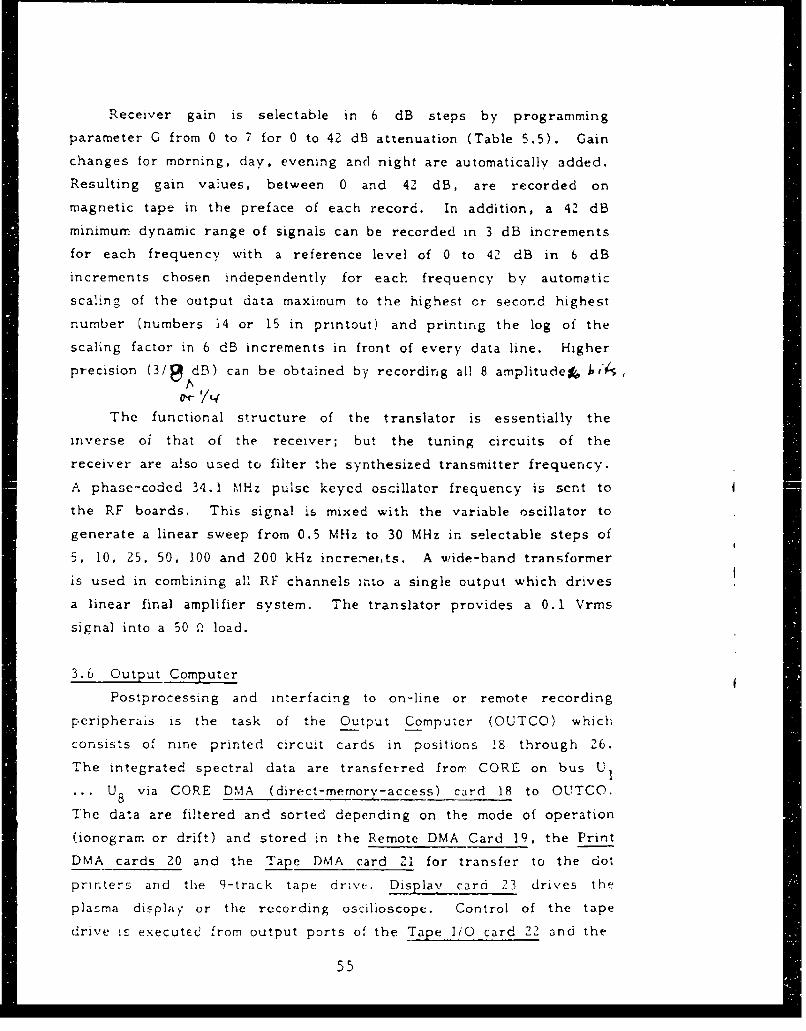
Receiver gain is selectable in 6 dB steps by programming
parameter G from 0 to 7 for 0 to 42 dB attenuation (Table 5.5). Gain
changes for morning, day, evening and night are automatically added.
Resulting gain values, between 0 and 42 dB, are recorded on
magnetic tape in the preface of each record. In addition, a 42 dB
minimum dynamic range of signals can be recorded in 3 dB increments
for each frequency with a reference level of 0 to 42 dB in 6 dB
increments chosen independently for each frequency by automatic
scaling of the output data maximum to the highest or second highest
number (numbers i4 or 15 in printout) and printing the log of the
scaling factor in 6 dB increments in front of every data line. Higher
precision (3/0 dB5) can be obtained by recording all 8 amplitude,
The functional structure of the translator is essentially the
inverse oi that of the receiver; but the tuning circuits of the
receiver are also used to filter the synthesized transmitter frequency.
A phase-coded 34.1 MlHz pulse keyed oscillator frequency is sent to
the RF boards. This signal is mixed with the variable oscillator to
generate a linear sweep from 0.5 MHz to 30 MHz in selectable steps of
5, 10, 25, 50, 100 and 200 kHz incremehts. A wide-band transformer
is used in combining al RF channels into a single output which drives
a linear final amplifier system. The translator provides a 0.1 Vrms
signal into a 50 £. load.
3.6 Output Computer
Postprocessing and interfacing to on-line or remote recording
peripherals is the task of the Output Computer (OUTCO) which
consists of nine printed circuit cards in positions 18 through 26.
The integrated spectral data are transferred from CORE on bus U1
U8 via CORE DMA (direct-memory-access) card 18 to OUTCO.
The data are filtered and sorted depending on the mode of operation
(ionogram or drift) and stored in the Remote DMA Card 19, the Print
DMA cards 20 and the Tape DMA card 21 for transfer to the dot
printers and the 9-track tape drive. Display card 23 drives the
plasma display or the recording oscilloscope. Control of the tape
drive is executed from output ports of the Tape IiO card 22 and the
55
I/0 Strobe card 26 which also decodes other strobe pulses for the
printer and the display.
The Memory Out card 24 and the Output CPU card 25 are the
same as those of the input computer, but contain different firmware.
By exchanging the memory chips they could be used to test the input
computer.
3.6. 1 Processing of lonogram Data
CORE outputs 16 data channels at a clock rate of 500 kHz for
each transmitted ionogram frequency. Each data channel contains 128
amplitude and 128 phase bytes (8 bits each), representing the
complex amplitudes for 12S height ranges. The nature of the data
channe!s is determined 'y the ionogram program. An exarm~ple of a
useful channel distribution would be eight channel:; each for the
ordinary and the extraordinary wave polarization, with eight Doppler
lines for each polarization. Frcq-'ently, two channeis will be linked
together to form an array of 256 height ranges (hence the name
Digisonde 256), still allowing to monitor eight different parameters
(polarization, Doppler, incidence angle).
For routine operation it is impractical to record all 16 channels,
i.e. 4K bytes requiring 2.56" of magnetic tape for each frequency.
Only about 90 full information ionograms with 120 frequencies each
car, be recorded on a 2400' tape. In this "dump" mode, provided for
special investigations, the complete data are recorded on magnetic
tape and/or the printer.
For man'y observations it suffices to collect the relevant
information from the 16 channels and to form one 128 or Z56 bin dual
array, i.e. one amplitude and one status array. The data selection
process use,- the maximum method developed for the Digisor.'.e 128PS.
For each range bin the channel with the largest amplitude gives the
complex amplitude and the channel number to the output array. The
procedure rcsults in one multi-parameter ionograrn.
C4
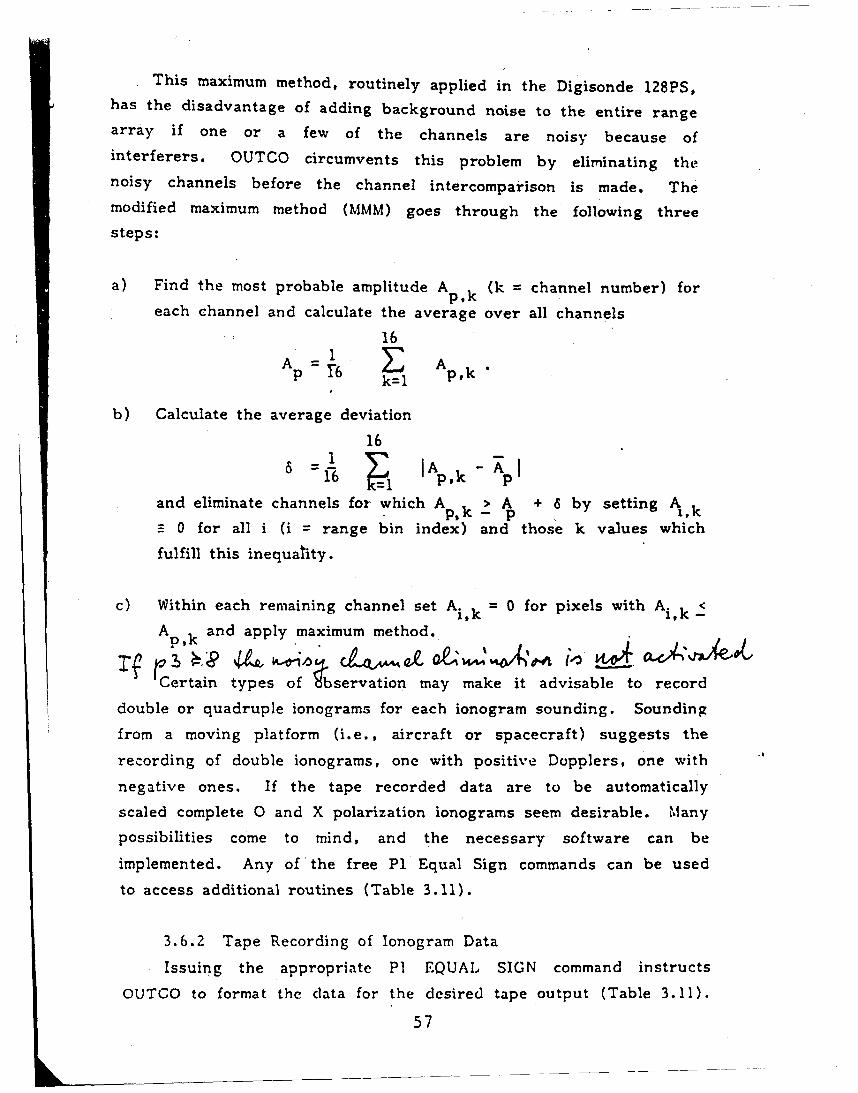
This maximum method, routinely applied in the Digisonde 128PS,has the disadvantage of adding background noise to the entire range
array if one or a few of the channels are noisy because of
interferers. OUTCO circumvents this problem by eliminating the
noisy channels before the channel intercomparison is made. The
modified maximum method (MMM) goes through the following three
steps:
a) Find the most probable amplitude Apk (k = channel number) for
each channel and calculate the average over all channels
16
A =1Ap T6 k=1 p,k
b) Calculate the average deviation
16
6 E ~2 JA - A16 k=1 p,k p
and eliminate channels for which Apk A + 6 by setting Ak
F 0 for all i (i = range bin index) and those k values which
fulfill this inequahty.
c) Within each remaining channel set Ai,k = 0 for pixels with Ai,k _Ap k and apply maximum method.
Certain types of dbservation may make it advisable to record
double or quadruple ionograms for each ionogram sounding. Soundingfrom a moving platform (i.e., aircraft or spacecraft) suggests the
recording of double ionograms, one with positive Dopplers, one with
negative ones. If the tape recorded data are to be automatically
scaled complete 0 and X polarization ionograms seem desirable. Manypossibilities come to mind, and the necessary software can be
implemented. Any of the free P1 Equal Sign commands can be used
to access additional routines (Table 3.11).
3.6.2 Tape Recording of lonogram Data
Issuing the appropriate PI EQUAL SIGN command instructs
OUTCO to format the data for the desired tape output (Table 3.11).
57
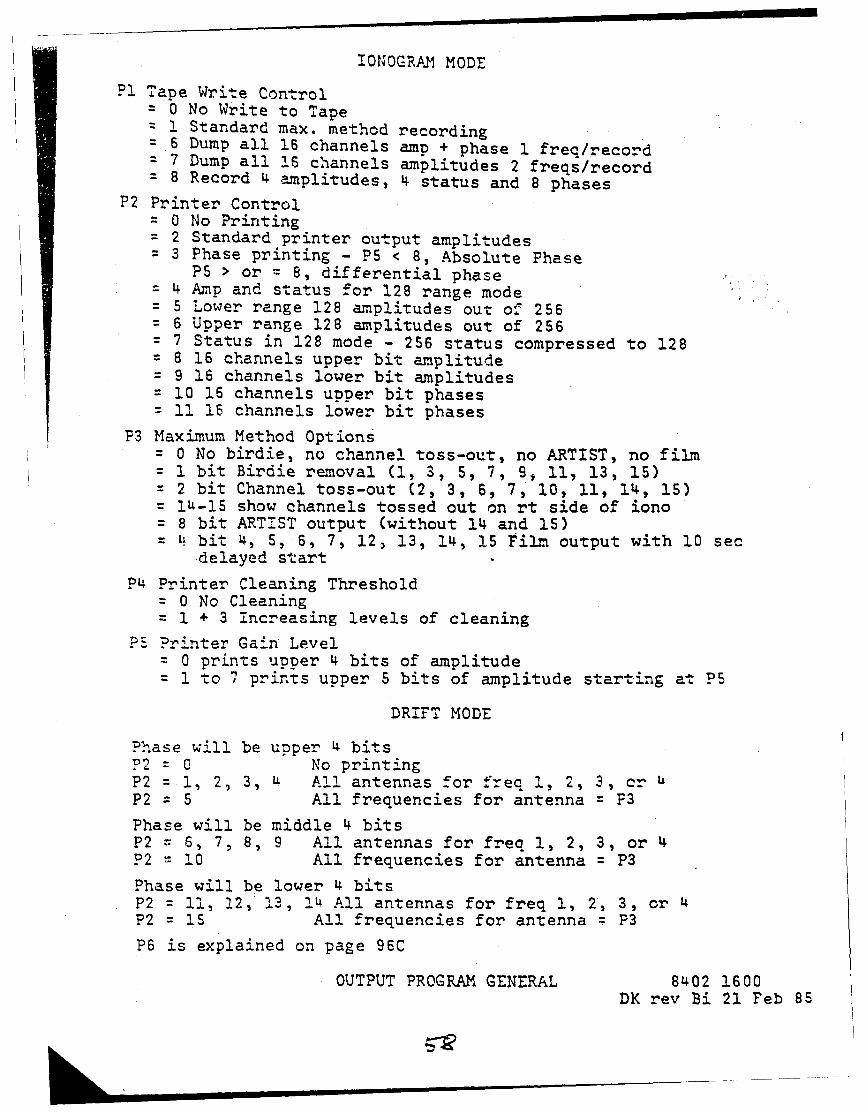
!0NOGRA1 MODE
Pl Tape Write Control= 0 No Write to Tape- I Standard max. method recording
6 6 Dump all 16 channels amp + phase 1 freq/record7 Dump all 16 channels amplitudes 2 freqs/record8 Record 4 amplitudes, 4 status and 8 phases
P2 Printer Control= 0 No Printing= 2 Standard printer output amplitudes= 3 Phase printing - PS < 8, Absolute Phase
PS > or = 8, differential phase4 Amp and status for 128 range mode
= 5 Lower range 128 amplitudes out of 256= 6 Upper range 128 amplitudes out of 256= 7 Status in 128 mode - 256 status compressed to 128
8 16 channels upper bit amplitude9 16 channels lower bit amplitudes10 16 channels upper bit phases1i 16 channels lower bit phases
P3 Maximum Method Options= 0 No birdie, no channel toss-out, no ARTIST, no film= 1 bit Birdie removal (1, 3, 5, 7, 9, 11, 13, 15)= 2 bit Channel toss-out (2, 3, 6, 7, 10, 11, 14, 15)= 14-15 show channels tossed out on rt side of iono= 8 bit ARTIST output (without 14 and 15)= l bit 4, 5, 6, 7, 12, 13, 14, 15 Film output with 10 sec
,delayed start
P4 Printer Cleaning Threshold* 0 No Cleaning1 1 + 3 increasing levels of cleaning
PS Printer Gain Level0 prints upper 4 bits of amplitude1 to 7 prints upper 5 bits of amplitude starting at PS
DRIFT MODE
Phase will be upper 4 bitsP2 =0 No printingP2 1 1, 2, 3, 4 All antennas for freq I, 2, 3, cr LP2 = 5 All frequencies for antenna = F3
Phase will be middle 4 bitsP2 6, 7, 8, 9 All antennas for freq 1, 2, 3, or 4P2 10 All frequencies for antenna = P3
Phase will be lower 4 bitsP2 = I, 2, 13, 14 All antennas for freq 1, 2, 3, or 4P2 = 15 All frequencies for antenna P3
P6 is explained on page 96C
OUTPUT PROGRAM GENERAL 8402 1600DK rev Bi 21 Feb 85
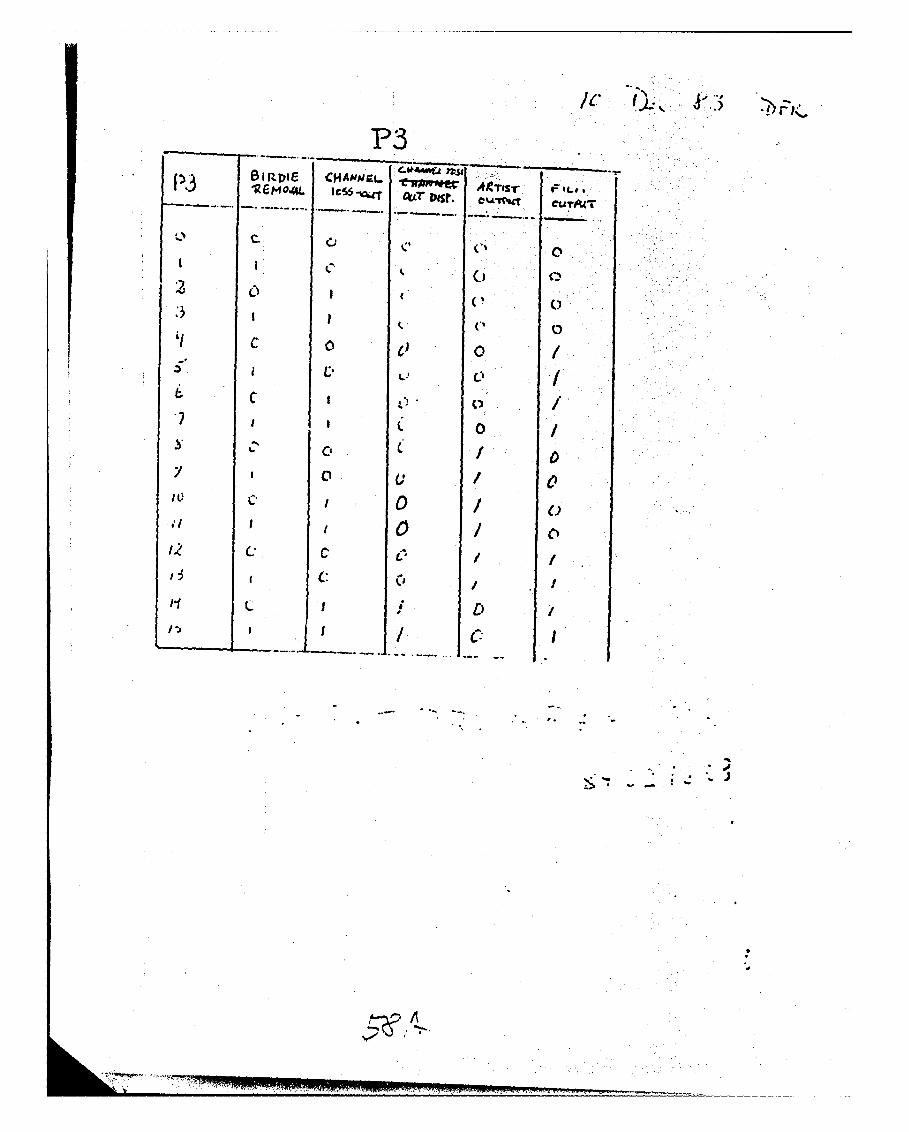
R3 BIzTI M j4ADJ4L AIresr
-*I CUT Ote C
it)
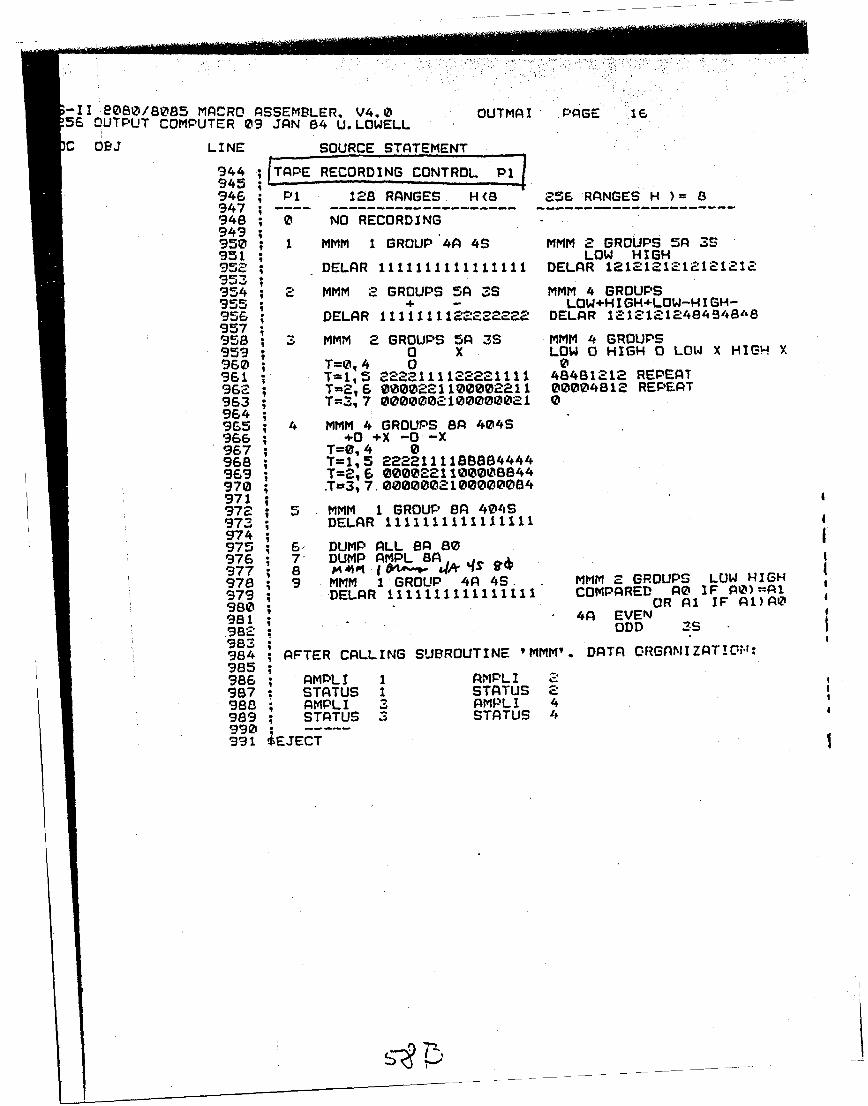
-II e080/8085 MACRO ASSEMBLER. V4.0 OUTMAI PAGE 16
56 OUTPUT COMPUTER 09 JAN 84 U. LOWELL
C OPJ LINE SOURCE STATEMENT
94 '1 E RECORDING CONTROL P
946 P1 128 RANGES H(8 256 RANGES H )= 8947 -948 ; 0 NO RECORDING949950; 1 MMM 1 GROUP 4A 4S MMM 2 GROUPS 5A 3S951 ; LOW HIGH952 ; DELAR 1111111111111111 DELAR 1212121212121212953954; 2 MMM 2 GROUPS 5A 3S MMM 4 GROUPS955 + - LOW+HIGH+LOW-HIGH-956 ; DELAR 1111111122222222 DELAR 12121212484S4848957958 ; MMM 2 GROUPS 5A 3S MMM 4 GROUPS959; 0 X LOW 0 HIGH 0 LOW X HIGH X960 ; T=, 4 0 0961 T=115 2222111122221111 48481212 REPEAT962 ; T=2,6 0000221100002211 00004812 REPEAT963 ; T=3,7 0000002100000021 0964965 ; 4 MMM 4 GROUPS SA 404S966; +0 +X -0 -X967 ; T=0,4 0968 ; T=1,5 2222111188884444969 ; T=2,6 0000221100008844970 ; .T=3, 7 0000002100000084971972 ; 5 MMM 1 GROUP SA 401tS973 ; DELAR 11111111111i1111974;975 6, DUMP ALL BA 80976 7' DUMP AMPL SA977; 8 $4 A ,4 1 &1H978 ; 9 MMM 1'GROUP 4A 4S. MMM 2 GROUPS LOW HIGH979 ; DELAR 1111111111111111 COMPARED AO IF AO) A1980 ; OR Al IF A1)AO981 ; 4A EVEN
982-' ODD zS983'984 ; AFTER CALLING SUBROUTINE 'MMM'. DATA ORGANIZATW4'r:985;986; AMPLI 1 AMPLI "987 : STATUS 1 STATUS 2988 ; AMPLI 3 AMPLI 4989; STATUS 3 STATUS 4 6
990 -E -991 iEJECT

The channel number is referred to as status. Commands P1 = 0 to P1
" 4 are preprogrammed, while S to 15 can be specified by the user.
Recording format PI 1 1 is considered the routine format and is
stored as default value. Approximately 2000 ionograms (128 range
bins/frequency and 120 frequencies/ionogram) can be stored on a
400' tape in the PI = I mode. For quarter-hour ionograms this
corresponds to one tape every 20 days.
The record length is fixed at 4K bytes, i.e. 4096 x 8 bits; odd
parity is used. The data are coded in binary format, the preface
and the header in BCD format. The record format for the routine
MMM mode (P1 = 1) is shown in Table 3.12a. A 76-byte preface
preceeds 30 data arrays representing either 30 sounding frequencies
with 128 range bins or 15 frequencies with 256 bins. Each array of
128 bytes has a 6 byte header: four digits give the frequency in kHz
(the tens of MHz are given in the main preface), one byte for the
gain, and one byte for the units of seconds.
The record format for P1 = 2 is similar, except two arrays of (6
+ 128) bytes each are provided for each sounding frequency, the
first array containing the amplitudes, the second the phase and the
status (Table 3.12b). For ionograms with 256 range bins per
frequency, only seven frequencies are contained in one record, and
the last two arrays in the record are dummies.
The record format for the dump modes, P1 = 3 and 4, is shown
in Tables 3.12c and d. In the first 76 bytes the preface is written
replacing the lowest four bits of the data. The ionogram preface,
written in BCD format, is explained in Table 3.13.
3.6.3 Printing of Ionograms
The on-line thermal plotter is controlled by the EQUAL SIGN
command P2. The plotter is used as a printcr by generating
character patterns in OUTCO, either the conventional alpha-numeric
font, or the patented (Bib]. 1974), optically weighted font (Optifont)
which was deveioped especially for the Digisonde ionograms
59
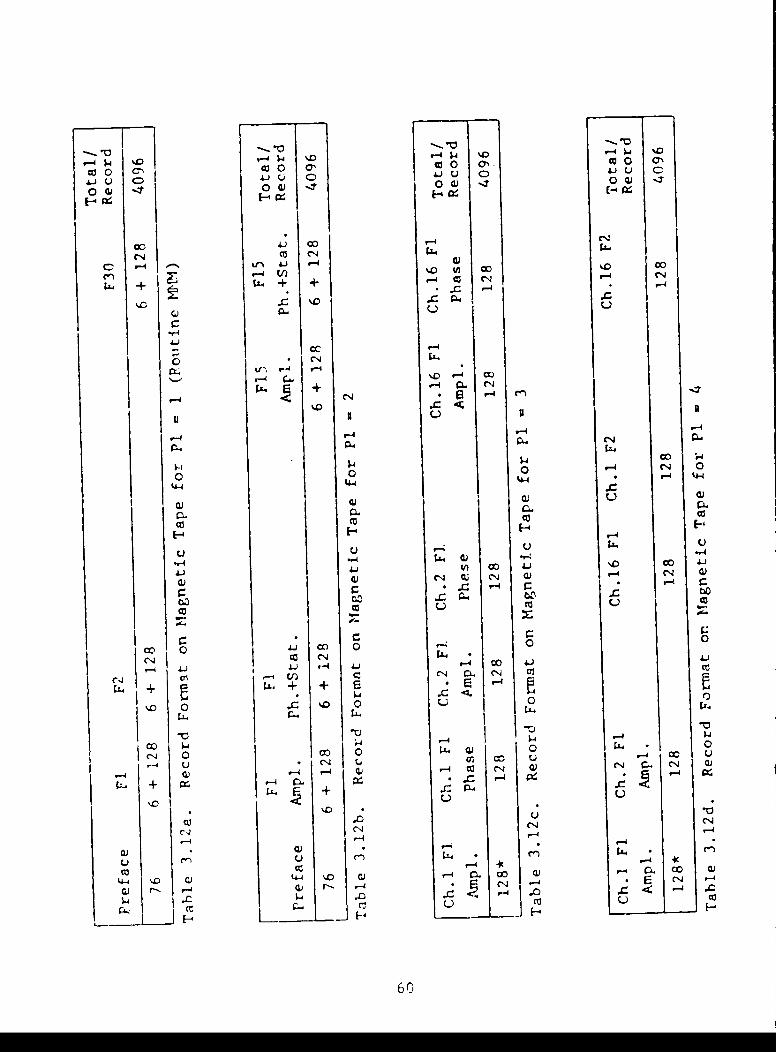
00' 000 0' 0 000~~4 L)' 0 J )SU C4u C)4 %D -4
0 CD I 0-) Q 0
E-
r -4 "~ J'r-4 V) %.0 W) 00 0.
~+ + -.
r-4
- -4
cc. r-4
0 CN
+ 0. )
eq 0
0. 0O 0-
0)~c co ~N 0
0 U"A "-4
0) 00 01
r-4C
co. 0 .. OD 0
-i -4A t4 A
-4 )C C4 CL (j 0
. + + +j ,-i c4
01 'D o
C 0 co 0 0.) u
-4 -4 -4-4c
-4-
L) - 4
~~oIC- ca4'. )- ~ O C ~ O 0
[)r~ -4 J ' -4 ( JE ( -
60
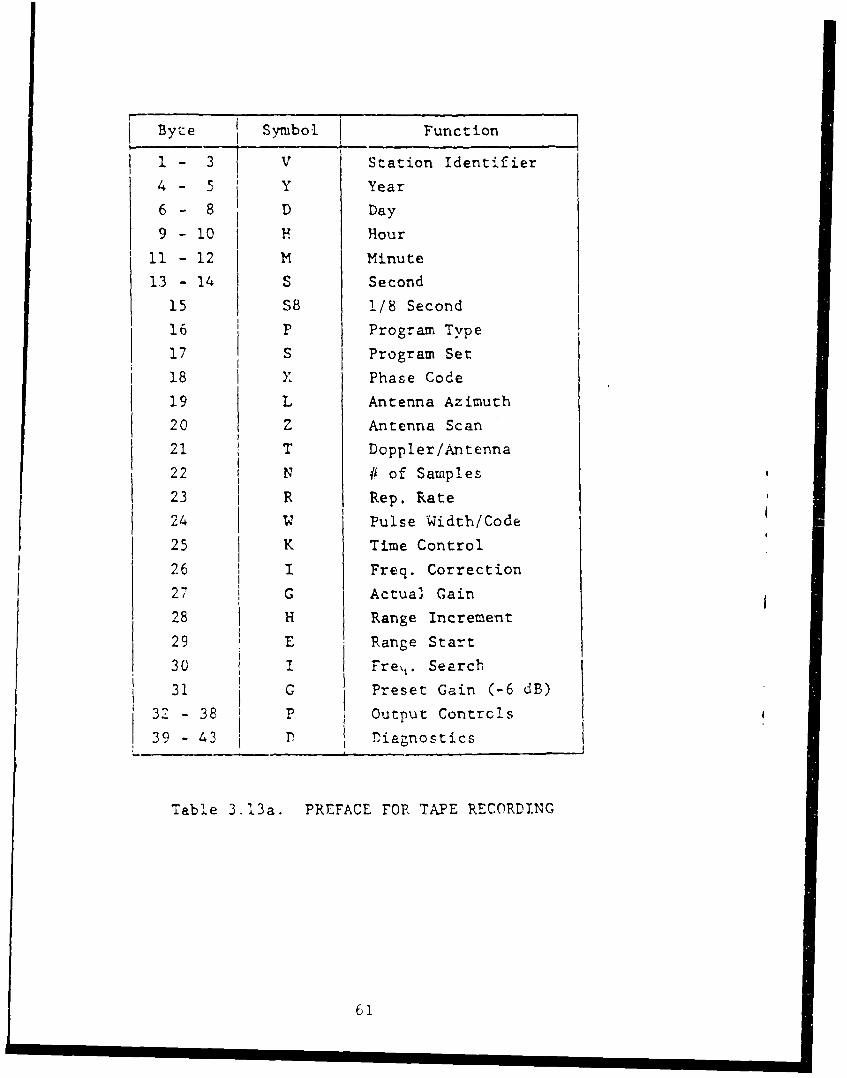
B7ye Symbol Function
1 - 3 V Station Identifier
4 - 5 Y Year
6 - 8 D Day
9 - 10 H Hour
11 - 12 M Minute
13 - 14 S Second
15 S8 1/8 Second
16 P Program Type
17 S Program Set
18 X Phase Code
19 L Antenna Azimuth
20 Z Antenna Scan
21 T Doppler/Antenna
22 N # of Samples
23 R Rep. Rate
24 W Pulse Width/Code
25 K Time Control
26 I Freq. Correction
27 G Actual Gain
28 H Range Increment
29 E Range Start
30 I Fre,. Search
31 G 'Preset Gain (-6 dB)
3 - 38 output Contrcls309 - 43 D iagnostics
Table 3,13a. PREFACE FOR TAPE RECORDING
61
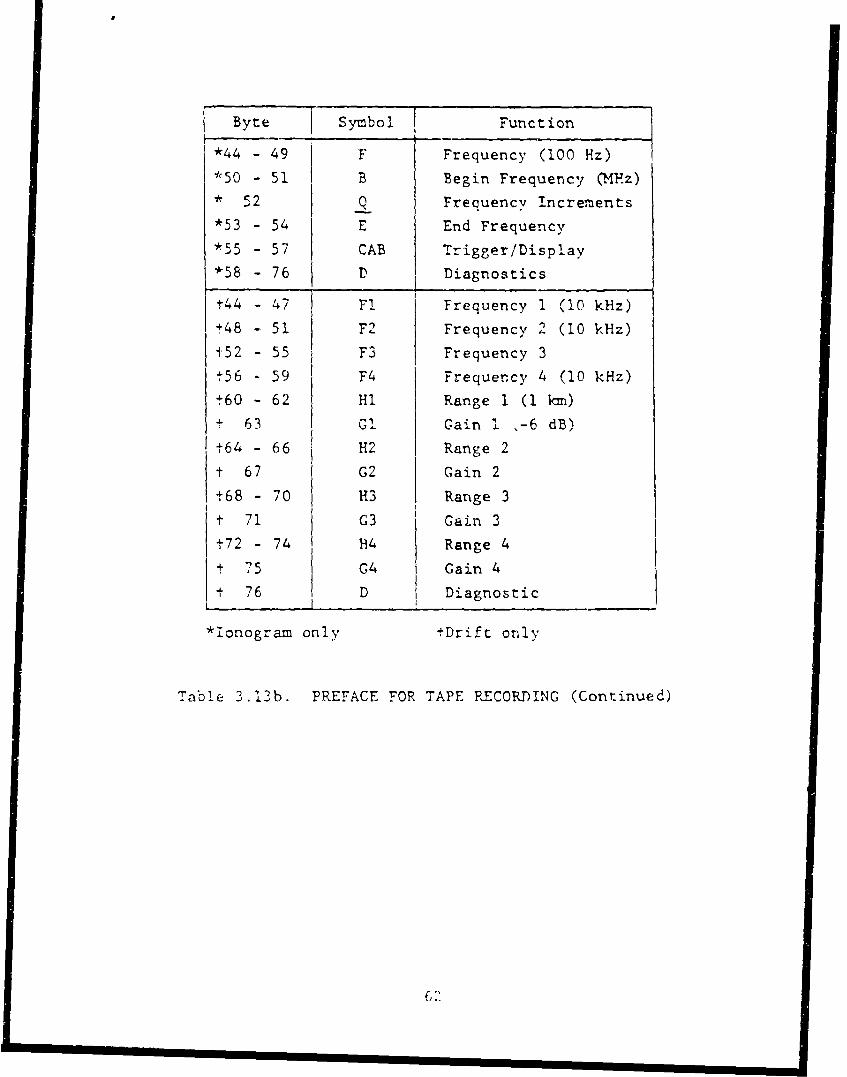
Byte Symbol Function
*44 - 49 F Frequency (100 Hz)
*50 - 51 B Begin Frequency (MP1z)
* 52 Q Frequency Increments
*53 - 54 E End Frequency
*55 - 57 CAB Trigger/Display
*58 - 76 D Diagnostics
t44 - 47 F1 Frequency 1 (10 kHz)
+48 - 51 F2 Frequency 2 (10 kHz)
152 - 55 F3 Frequency 3
i56 - 59 F4 Frequency 4 (10 kHz)
t60 - 62 HI Range 1 (1 km)± 63 Gl Gain .-6 dB)
t64 - 66 H2 Range 2
t 67 G2 Gain 2
t68 - 70 H3 Range 3t 71 G3 Gain 3
t72 - 74 114 Range 4
t 75 G4 Gain 4
t 76 D Diagnostic
*Ionogram only tDrift only
Table 3.13b. PREFACE FOR TAPE RECORDING (Continued)
£6:
(Patenaude et al, 1970). A sample ionogram is shown in Figure 3.9.
The amplitude values are given for 128 height ranges, and each data
array is preceded by the header containing frequency, receiver gain,
the units of the seconds, and the printing gain. If the full Optifont,
based on a 6 x 4 matrix, is used only 128 pixels can be displayed
across the page. Table 3.14 shows the different printing formats
that are provided. The * indicates proposed formats for which no
software is available yet.
The signal amplitudes are printed in multiples of 3 dB. The
sixteen levels cf the Optifont cover a dynamic range of 45 dB. The
"printing gain", shown at the beginning of each data line, has been
subtracted from all amplitude values, so that the largest amplitudes
are not exceeding the value 45 dB, printed as a 15. The 16 level
printing gain is also given in multiples of 3 dB, assuring a total
dynamic range of 90 dB.
Any blank pixel in the amplitude ionogram has a correspondingblank pixel in the status ionogram. Dynamic cleaning could be
applied prior to printing the array by setting an amplitude threshold
equal to the most probable amplitude.
3.6.4 Tape Recording of Drift Data
At the end of each drift measurement CORE transfers a number
of Doppler spectra to CORE DMA card 18. The number of channels is
controlled by drift preface character L (see Table 5.11) and can vary
from 2 (L = 0) to 32 (L = B). The number of spectral lines per
channel can vary from 32 to 256 (Table 5.11). Each spectral line
Shdas consists of 2 bytes, one for the amplitude, one for the
phase. The total number of bytes per case will be between 128 and
4096. The sequence of the indices of Sh,d,a,s gives the multiplexing
order for the different channel. The indices h, d, a and s indicate
height range, Doppler, antenna and sign. For routine drift
observations one might use four antennas, two frequencies and two
height ranges, i.e. 16 channels. Assuming 128 spectral lines in each
channel the data format would be as follows:
63
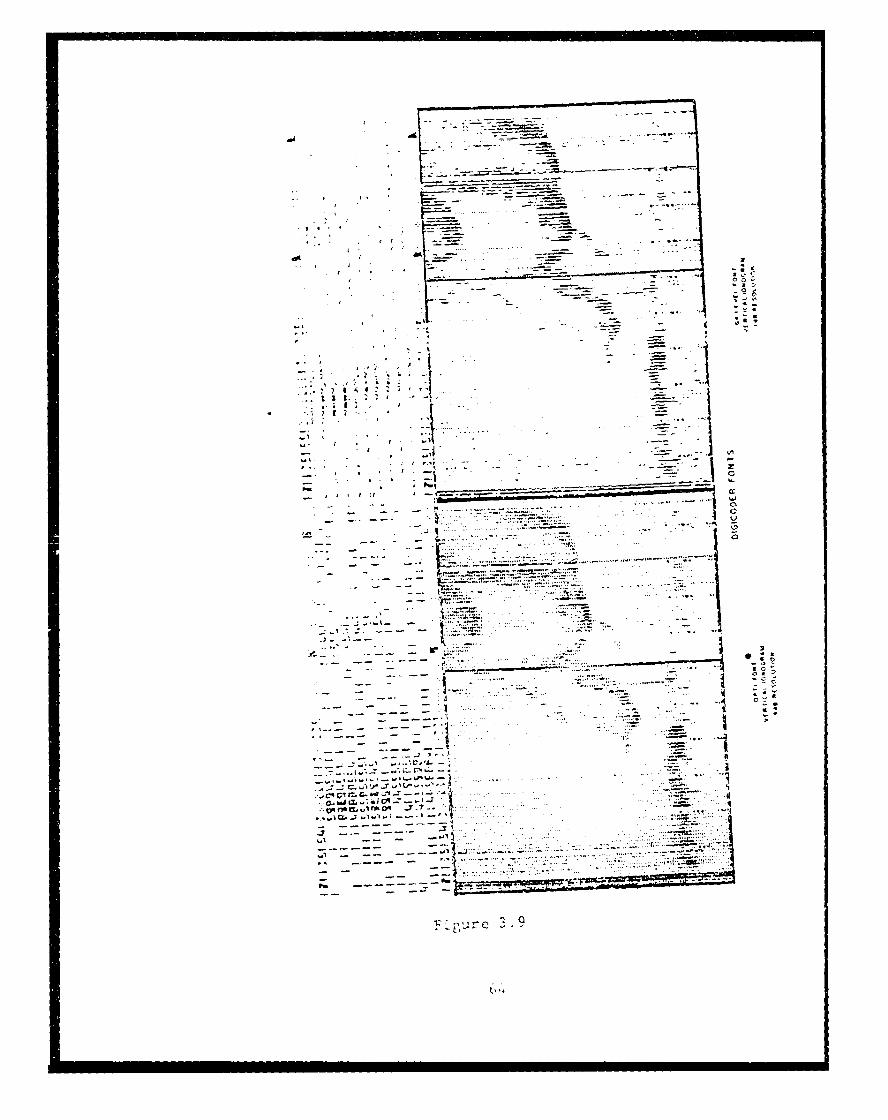
* - . ... -~
* A --
* . , r ~-
* -*- ... - - N- - ~
I Co.-* . -- -. C-
- . -
- .-~ *. :
'I
a-'a I* , I .- \ a,'
-I
-I -- . a,
V - --- . **f*
ti~
t.- - . 2
. ;~-~ - -- - *, -
- -. ~ ---. - I C
A--.-. * '-~
~.I c*
- -'~1
-~ --I ** *1a1 - *
-- a- ~ .
J7~*
- - ~ ...
a-' -- ;.. ------
V. . . .......
---------
- - - .... f*-- -~-"
~KpurC ~. -
ta .4
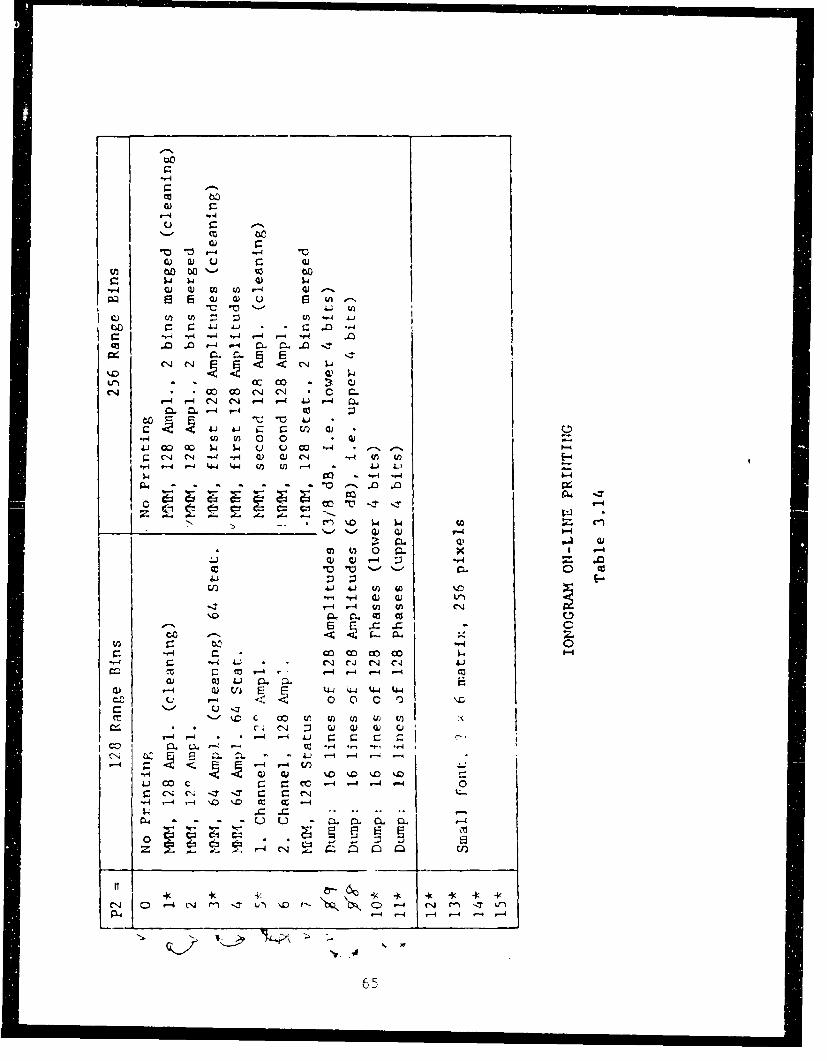
CO-Q)
4- **-
"-4 0 w
OW<C 0
C.J0 co C)C' 500 coC4UI cr
o '4r4 C 'C4 - - 4J r- QM b^& r-4 r4.-4~
Cjr- N - v4 - C~ p.4 M- 4 14 1 4-4 44 0 W - - -
-'-4 0- 0 0 -4. U )
V4 r- 4.
cc -0 - -wr
4.) 4)-)V
U) 'vt'-'r- 0
41 C4.) CJ CN e4 A
CO r4-4 -4 -4 1-4 (oca AS C- a.
a) vi4 E0W44 &tC "-4 P- <1 0- 0 0
-y %D C c U) U) LO Q)' V-' X4z C4 C, - () C)
1 -4 -4 r -I -4S r -
t0 c cc4 -4 C4 C4 -
CN C- ;T".0 r. a ) C U4 U)U)-4 -4 4 CC 0: -40
U CL CL C .
(N4 r-4 -4 '-4 -4'-4
-I ~ ~ .4.465
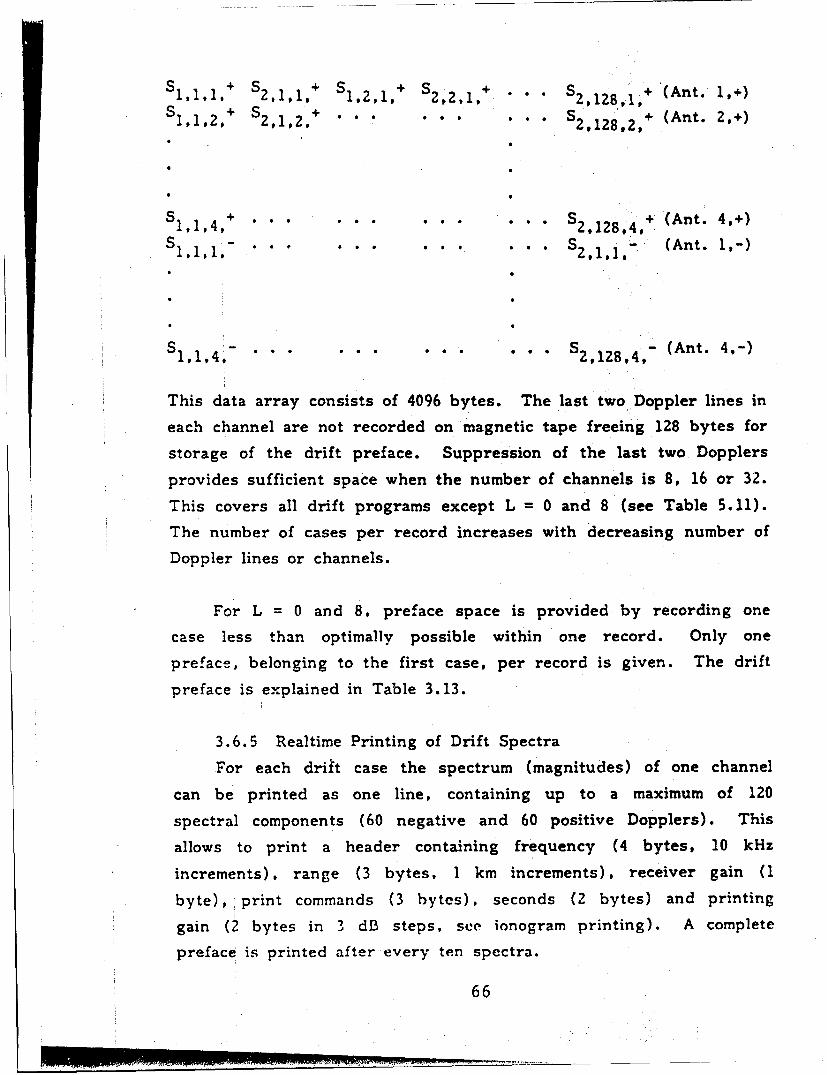
SII,1. + S21, + S 1,2,1, + $2,2, I , + S • 2,128,1, + (Ant.- 1,+), 212+ S S,,2, + . . 2 ,2,+ (Ant. 2,+)
S 1,,4, + . 2,128#4,+ (Ant. 4,+)
s -s ,1. (Ant. 1,-)
S1 - . .. .. .. 2 - ( n .4 -,1,4, , ,4, (Ant. 4.
This data array consists of 4096 bytes. The last two Doppler lines in
each channel are not recorded on magnetic tape freeing 128 bytes for
storage of the drift preface. Suppression of the last two Dopplers
provides sufficient space when the number of channels is 8, 16 or 32.
This covers all drift programs except L = 0 and 8 (see Table 5.11).
The number of cases per record increases with decreasing number of
Doppler lines or channels.
For L = 0 and 8. preface space is provided by recording one
case less than optimally possible within one record. Only one
preface, belonging to the first case, per record is given. The drift
preface is explained in Table 3.13.
3.6.5 Realtime Printing of Drift Spectra
For each drift case the spectrum (magnitudes) of one channel
can be printed as one line, containing up to a maximum of 120
spectral components (60 negative and 60 positive Dopplers). This
allows to print a header containing frequency (4 bytes, 10 kHz
increments). range (3 bytes, I km increments), receiver gain (1
byte), print commands (3 bytes), seconds (2 bytes) and printing
gain (2 bytes in 3 dB steps, see ionogram printing). A complete
preface is printed after every ten spectra.
66
EQUAL SIGN command P3 selects the channel number. Commands
P4 anid P5, explaine6 in Table 3.15, select the Doppler interval and
the amplitude /phase resolutions.
67
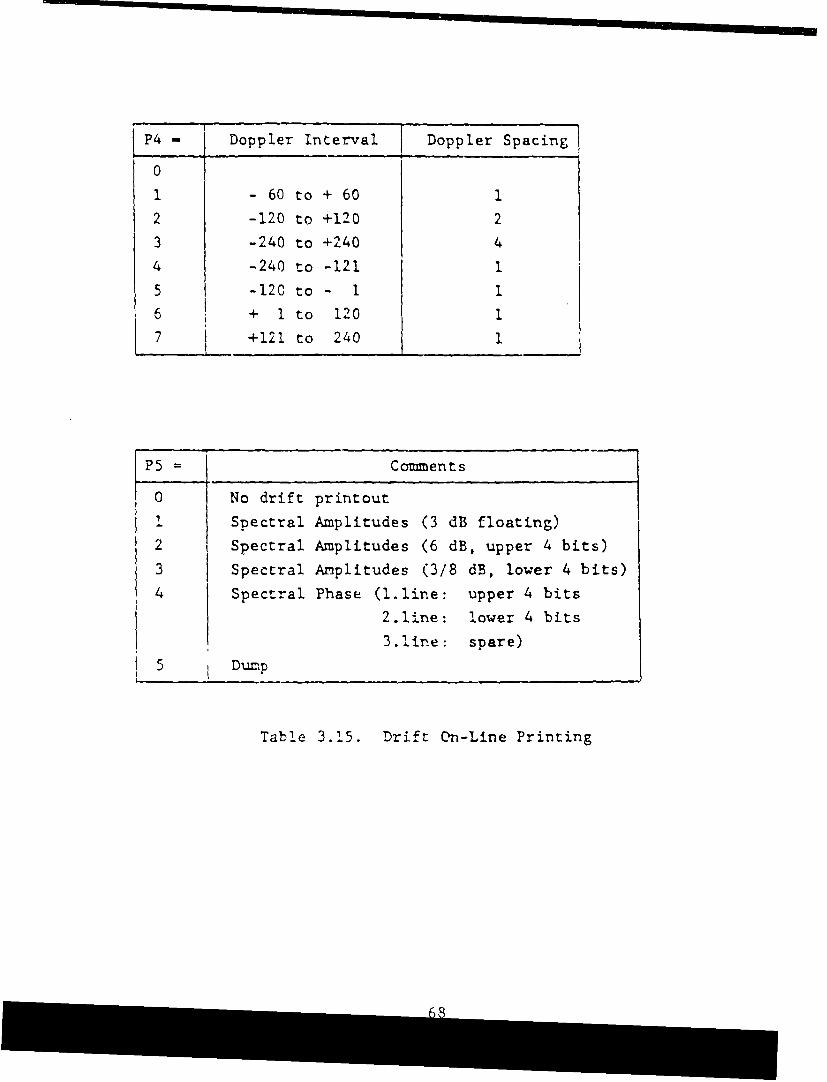
P4 - [ Doppler Interval Doppler Spacing
0
1 - 60 to + 60 1
2 -120 to +120 2
3 -240 to +240 4
4 -240 to -121 1
5 -120 to - 1 1
6 + I to 120 1
7 +121 to 240 1
P5= Comments
o No drift printout
I Spectral Amplitudes (3 dB floating)
2 Spectral Amplitudes (6 dB, upper 4 bits)
3 Spectral Amplitudes (3/8 dB, lower 4 bits)
4 Spectral Phase (l.line: upper 4 bits
2.line: lower 4 bits
3. line: spare)
5 i Duip
Table 3.15. Drift On-Line Printing
4.0 PERIPHERILS
4. 1 Transmitter
Powered by a pulse forming L-C chain and triggered by a pulse
train from the Digisoinde, the 10 kW Final Stage ampFifies the HF
pulses provided by two sequential solid state wide-bauld drivers
following the transceiver output ME of the Digison-e. The 10 kv,'
WVide-Band Ampifier consists of three drawer chassis and the
t.. -stage IOU Watt Solid State Amplifier mounted in the rack.
The three drawer chassis are:
Final Amphfier,
Pulse Power and
Delay Line.
4 1. 1 Rack
As Figure 2. 1 shows the rack also contains three fans and the
mair circuit breaker with two switches which are in parallel at 115V
wiring and on each side of the power line at 230V AC. A strip wired
for ".5V AC is Lvailable at the top of the front for soldering iron and
oscilloscope. There is also space for the main Digisonde 256 chassis
and the P.eceiver Antenna Switch. If no separate receiver antenna is
avai'abie. a tap on the dummy resistor of the Final Amplifier can be
connected directly to the receiver input of the Digisonde 256. Four
pairs of slides for the drawer chassis are also installed. A
solid-state wide-band amplifier interfaces the transceiver and the
Final Arnlifier by BNC connector providing 100 Watt HF pulse power.
Simultaneously, a negative going pulse to zero from a 24V level
should be arriving on another BNC connector. Different polarity and
different voltage levels can easily be accommodated.
Thc output is a type N connector and provides between 10 and 5
k%," at a ;0 0 load. An open output will not damage the amplifier.
69
4.1.2 Final Amplifier
In the 0.5 to 30 MHz version the Final Amplifier consists of a
distributed amplifier with two chains irr push-pul!: of seven tubes
4CPX250K on each side. Because the modern Eimac 4CPX250K ceramic
tubes have very low plate capacity they permit a relatively high plate
impedance up to VHF frequencies. Therefore,, the development of a
high-power, high-voltage output transformer became the mostimportant task for the design of this Final Amplifier. A (450+450):50
(n] impedance match was achieved with three transformers. Since the
ratio of grid to plate capacitance is rather large (4;5), optimum input
match is easy, namely 50: (100+100) In). The high impedance ratio of
the plate and grid delay lines requires treating the delay lines as
shunt m-derived low-pass filters (see Figure 4.1) and to parallel the
stray capacities of the grid inductors by 5 .bF in order to keep the
scale factor of 4.5 for all components.
4.1.3 Pulse Power
Functionally, the Pulse Power chassis, the Delay Line, the
inductor and the high power pulse transformer form the pulse power
supply. In addition, there is a printed circuit card in -the Pulse
Power drawer which monitors the current and the bias voltage and
controls the Silicon Controlled Rectifier (SCR).
The Pulse Power drawer provides up to 6 Amp of current at 230
Volts. For power lines of 230 Volt, the input windings of the three
transformers can be used as auto-transformer to provide 115 Volt for
the Digisonde on one-half of the windings and an opposite 115 Volts
for the fans, the test and the peripheral equipment. A •symmetric
power consumption on the two 115 Volt branches is recommended.
Since a separate large inductor is installed to charge a
capacitor of 200 VF located in the Delay Line drawer, the power line
70
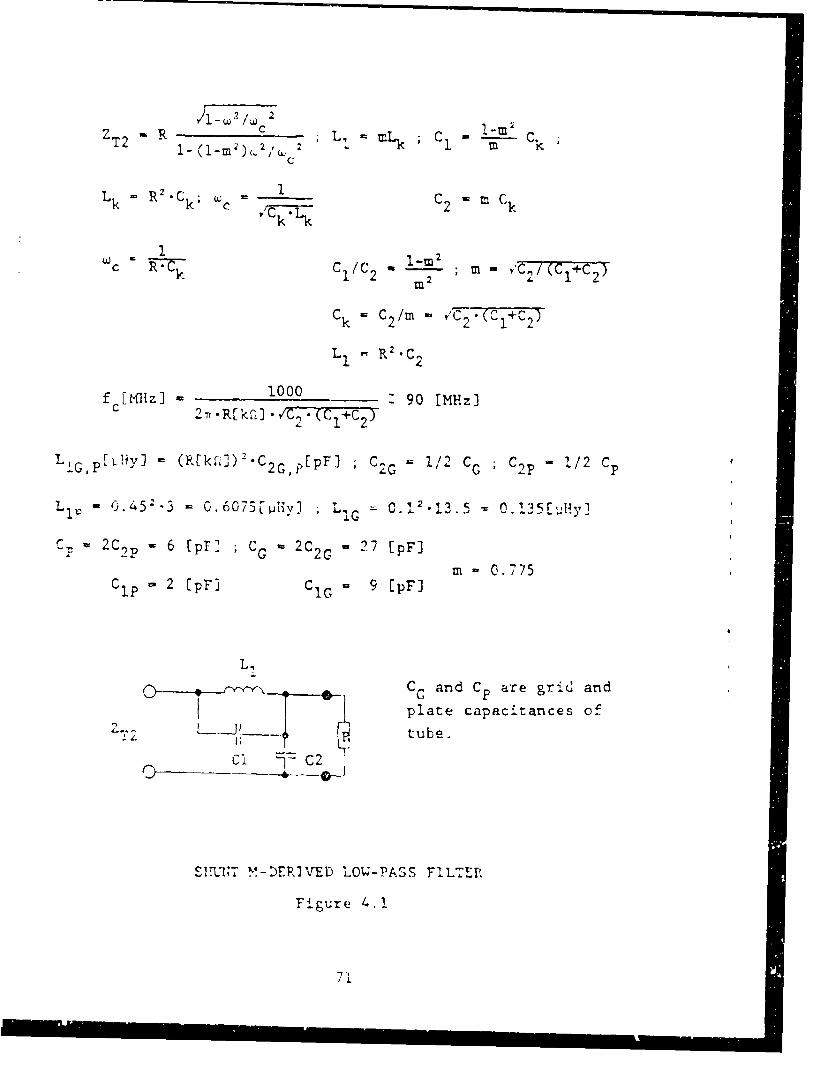
Z 'R C2 ~2~ L1 cL 1M2 C.T2 I- (1-m 2 )2: 21L 1 Zn k
L k R2 C k; wc VcC 2 m C
1 k Zn
Ck 2C 2 1
L R2 .c 2
f C Mflz] - 10090 [MHz]27-R[k~r2.,.C2.(KC +C7,
'L,,iG lv - LG 1/2 CC C, p = 1/2 Cpp[LWJ (Rk~])C2GP[Pr] C
-0.452.3 -0.6075[wIiivjl L.C.21. . 35E,11y]
C-. 2C2 p 6 (pF1 ; C0G 2C 2G 27 [pFJ
mn 0.775C 1p "2 [PFI CiG 9 EPF]
C ;and C Pare grid andplate capacitances of
tube.
SITUNT M- IERh VE1 LOW-PASS FILER
F~u r e.

can provide an almost sinusoidal current and modulation of the quartz
driven pulse sequence by the power line frequency is minimized.
On the Pulse Driver card an oscillator and divider chain
provides a delay after a power failure, a wanted interruption, a short
circuit or a surcharge. For that purpose three sensors are built in
monitoring the high power current on pin 20 and the level of the
negative bias. If the 10-pin connector of the Final Amplifier chassis
is disconnected, i.e., if the heater of the tubes are off, then also
the zener diodes in this chassis are disconnected and the bias,
monitored on pin 8, becomes too large which resets the counter. If
there is no bias (short circuit or blown fuse) the counter is reset
also.
On pin 20 there is a negative voltage, produced by the high
power current on the serial resistor of 1/2 Ohm. In case the SCR
does not open, producing a current of more than 6 Amp, or the
current is too high due to a short circuit in the pulse power load or
at too high repetition rate, the counter is reset also. It will take two
to three min before the high voltage optically coupled switch D4808
will activate again. It is advisable to switch on the manual switch on
the front panel before that time.
4.1.4 Delay Line
To permit a variable pulse length of 66 and 133 Psec, the Delay
Line is composed of two chains linked by a diode and charged by
independent inductors. One-half of the delay line, connected via the
pulse transformers to the SCR is always charged. In addition to the
delay line, the Delay Line chassis includes the pulse transformer and
the SCR. The second charging inductor is switched off if a small
pulse width is chosen. DC power is interrupted during switching.
The inductance of the charging inductors is small enough to
almost charge the delay line to the peak even at 200 Hz repetition
rate, thus derating the maximum power only little at that high
repetition rate. The peak voltage is higher than twice the average
72
voltage measured at the charging capacitors of 200 vF because the
stray inductance of the pulse transformer provides a negative swing
which is necessary to switch off the SCR.
4.1.5 Operation and Maintenance
In spite of its high peak power and large duty cycle, the 10 kW
Final Amplifier is a safe device because of its very low impedance of
1.2 S at the input of the pulse transformer, and 150 . at its output.
Several safety features will assure a reliable operation.
To protect the expensive tubes sufficient air flow must be
provided for their cooling. It is therefore necessary that the 10 kW
Distributed Amplifier drawer is always pushed in fully. If testing in
operation is required the drawer can just bd pulled out for a short
moment even if only the heaters are connected. It is advisable to
remove the horizontal strip underneath the drawer if testing of the
chassis bottom is desired. After the test the horizontal strip must be
put in place again. It is, however, unlikely that a tube will be
damaged because either the heater or the plate connection will
unsolder itself and fall off before permanent damage can occur. It is
therefore recommended to check the cathode currents of all tubes for
equality after any equipment repair or test by turning the knob on
the left side of the 10 kW chassis to its first 14 positions from the
left. The indicated current depends on pulse repetition rate and
excitation. Therefore, a reference table should be established at the
beginning. The 15th position of the switch gives an indication of the
pulse "oltage times root of duty cycle.
Before bringing the 10 kW Final Amplifier into operation, all
internal connections must be checked, especially the large twist-lock
connection between the Pulse Power and Delay Line drawers, but also
the antenna connections, the high voltage pulse connection, the fan
connections and the AC power input. The latter should be twisted a
full turn to the left before connection to secure the twist-lock feature
even if the drawer is pulled out repeatedly.
73

After connecting the power of 220 to 240 Volts and the two BNCconnections for the negative going trigger pulse from a +24 level tozero (0.4) Volts and the HF pulse of 3 to 9 Watts, the main breakeron the right lower corner of the rack can be activated.
It is advisable to also switch on the main switch on the PulsePower chassis because the switching spikes of the high voltage (480V) solid state switch in series with this manual switch can trip thedelay and protection circuitry. As soon as the main power is on, aLED display shows the activation of the delay counter by blinking atabout 1/2 sec rate. After 256 counts (2 to 3 minutes) the solid staterelay is activated if the right bias is present and the current rotexcessive. For easier test of the protection functions the PC card inthe Pulse Power chassis can be put on an extender card if the draweris pulled out. The bias is fused separately with a 0.5 Amp fuselocated at the far right on the front panel of the Pulse Power drawer.Its presence is indicated at the red indicator lamp next to the fuse.
If the 300V DC is activated the red lamp on the third positionfrom the right is lit. The secondary fuse of 6 Amp is at the left ofthe switch which follows the indicator lamp.
If the operator is sure that the heater and the bias are correctand on sufficiently long the time delay can be overcome by pushingthe push button to the left of the blinking LED. This LED will be litpermanently if the high voltage is on. (Push only if the transmitter
pulses are off.)
The HF meter for the antenna current is connected between theconnectors N2 and N3 by two wires of a quadrofilar cable. Theremaining two wires are short-circuited near the meter. Thisquadrofilar cable thus forms a current transformer, creating a meterreading of slightly below one-half of the actual antenna current. Ifthe pulse width is smaller than 100 usec the additional scaling factoris more than 10 at 100 Hz and more than 7 at 200 Hz.
74
To avoid destruction of the HF current meter by lightning it
might be advisable to directly connect the antenna to output N1 if theantenna current need not be monitored. The Distributed Amplifier isoptimized for an input power of 100W. If much less input power wereavailable one or two of the 20 Volt zener diodes could beshort-circuited in the chain of 20 Volt zeners each to decrease thebias by 20 Volts. Then the screen voltage should be decreased byreplacing a 25 il resistor by a 50 nl resistor in the voltage dividerchain to generate the same current in the tubes as before.
To speed up diagnosis in case of a complete failure where theSCR never stays on, it is advisable to replace the high voltage
connection to the 10 kW Distributed Amplifier drawer by a dummy loadof a i resistor of 125 to 150 f2 at 1000 Watt. If the failure persists
then the pulse power supply is at fault. If the failure is gone thenthe 10 kW stage forms a wrong impedance. When the impedance is too
low it leads to moderate overcurrent (monitor pin 20 on PC cardwhich will show less than -2.5V but far from -8 Volts if the push
button is pushed for a short moment). When the impedance is too
high the SCR will not open and produce a surge current, producing
,8V on pin 20.! In this case the push button may be pushed only for
a very short time.
This test will help to find the short or the opening in the 10 kWFinal Amplifier very quickly. If the SCR has failed because of
unusually high peak voltages in the AC supply it might be advisable
to replace it by a C159M which will withstand higher voltages.
All the HF and Pulse Power voltages can be monitored with a100:1; 1.5 kV -oscilloscope probe, except the plate voltage. Thesupply voltage can be tested by measuring the voltages on both endsof the second 600 S1 resistor in the divider chain and adding to thehigher voltage the difference. In testing it should be realized that
the screen currents of the tubes can be negative. Although too highscreen voltages may lead to low frequency oscillations, the tubes are
very reliable. Their large grid capacitance decreases the feedback
75
by the small plate-grid capacity. Therefore, the change in phase at
the grids with increasing tube number is easily observed. But it
should be realized that the phase on all tube plates is the same if the
impedances and the delays are well matched. Only the voltage
increases with the tube number at high frequencies.
It is requested not to run the system too long without an
antenna. To insure reliable operation for a long time the air filters
of the fans must be cleaned periodically dependent on the dust level
of the station.
4.2 Antenna Switch
In a fast moving aircraft or in a satellite the doppler
measurement can be used for arrival angle measurement, at least in
one dimension. But for most stations on the ground a
two-dimensional antenna field is necessary to produce the information
of the azimuth and elevation of the arriving signals.
An elaborate field of 25 receiving antennas had been used in the
first installation of a Digisonde 128PS system on Kwajalein Island in
the West Pacific. It has become, however, advisable to standardize
an antenna array of two perpendicular sets of seven loop antennas
which are sufficient for routine observation as well as for most
scientific investigations. In the following section an antenna switch is
described which powers the two amplifiers in each of the seven
turnstile antennas and permits the selection of any single or the
steering of all seven antennas in 12 azimuth directions and two
elevations, in addition to the vertical position. The location of the
seven antennas, Figure 4.2, has been selected to minimize, for a
large frequency range from 3 to 12 MHz, the reception of unwanted
interferers arriving from low incidence angles, in the case when a
vertical beam is desired, and to minimize the number of delay lines
necessary to bring all antennas in phase for any of 12 azimuth
directions. Two sets of delay lines are chosen independently which
have any fixed ratio to permit either two almost vertical elevations
(for example: 7.50 and 150) or one rather vertical and one low
76
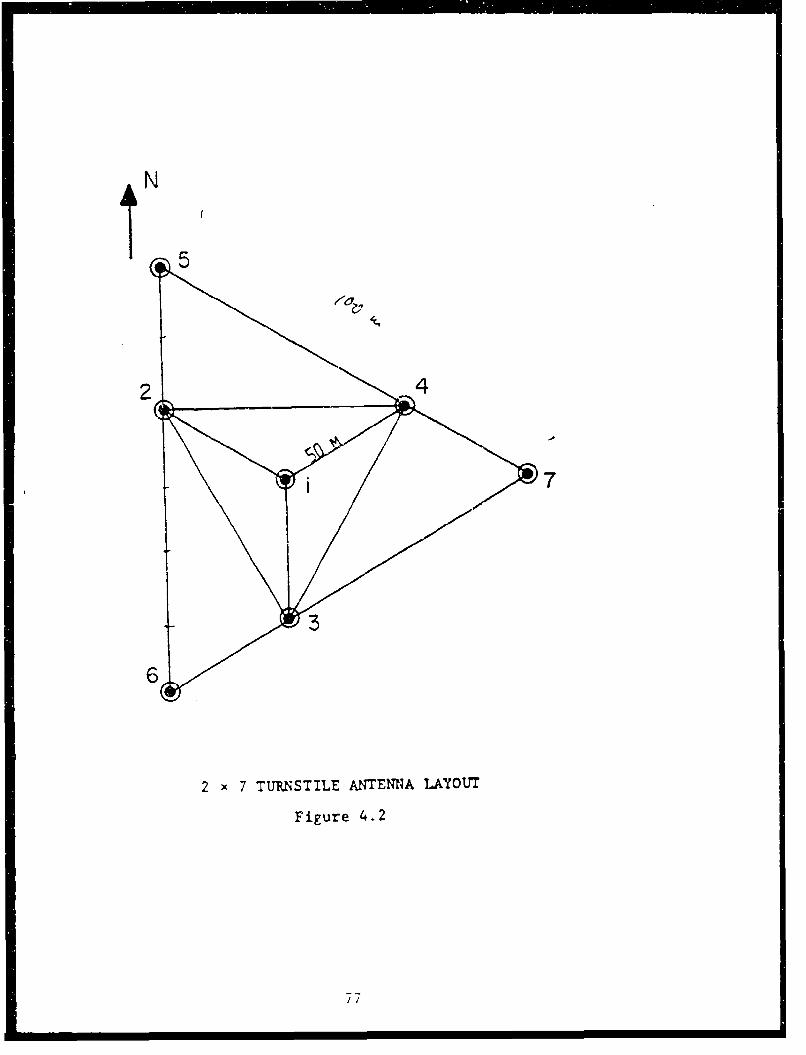
2 x 7 TURNSTILE ANTENNA LAYOUT
Figure 4.2
77
elevation (150 and 750) to produce practically simultaneous vertical
and oblique soundings for backscatter or bistatic experiments.
There are several choices for the combination of the two
perpendicular sets of antennas to permit single use of each of the two
perpendicular subarrays, linear addition or subtraction or the
addition or subtraction with 900 phase shift for receiving both
right-hand and left-hand circular polarization. The single use of the
subarrays is indicated to measure one of the linear polarizations at
the equator. For reception of low incidence angle vertically polarized
signals use of a linearly polarized antenna array is recommended too,
although it might be useful for some studies to alternately measure
right- and left-handed polarization at low incidence angle. By taking
either one of the two sets of antennas or by adding or subtracting
the outputs of the two sets four forward and reverse directions can
be selected with 450 spacing:
NIS NWISE WIE SWINE
for N N + W W W- N
if the antennas are aligned in the NIS and W/E direction. The
necessary delays for the 25 locations of th. antenna beam are
indicated in Table 4.1 as well as the logic for the single selection of
one of the seven antennas. In Table 5.9 the chosen sequence of
antenna beam directions is indicated for eight values of the Z program
parameters. With the L program parameter (Table 5.8) the starting
azimuth of the antenna sequence can be chosen.
4.3 Realtime Ionogram Scaler
Housed in a separate chassis the realtime ionogram scaler (RIS)
extracts the ordinary echo trace from the raw ionogram, determines
the important ionospheric parameters and calculates the vertical
electron density profile. From the 16 parameter ionogram data
produced by the DGS 256 the ordinary and extraordinary polarization
channels with vertical incidence are selected for the trace extraction.
The methods of automatic trace identification for Digisonde ionograms
78
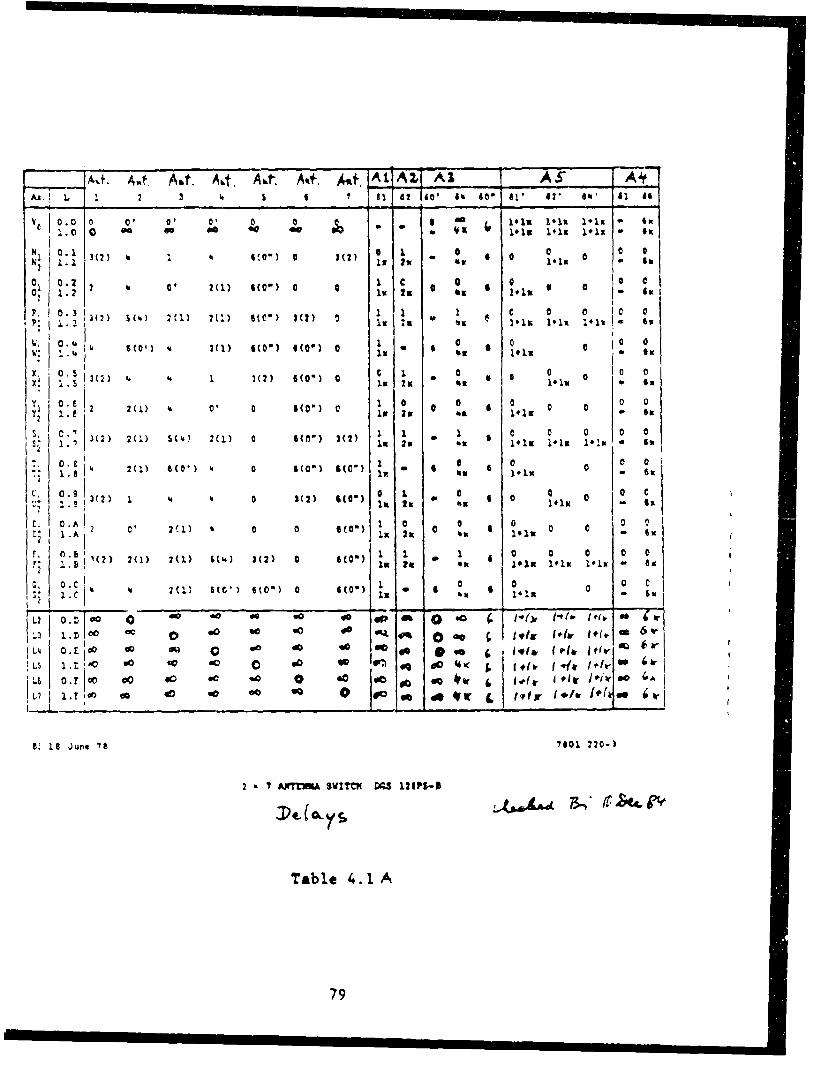
.A,.f. Awt. Aht. A.t. A-+. A4f fAt AX A A S A4t
As4 1 42 140' 6% 40 41, 42, b 4 66
08oo o ' 0 0 0 - S 161% 141K 1#11 6x4
'0 0 ~ ~1#1% 1*1% 1*l3 got3
N, 3(2 1 SO a 3(2 1 , 1 0 0n 0
0~ Q.2 Il Col): 0 0 a 0
F. 0. 3 I( s 06 C 0 0P, 13 . a'4 TsI) 60) 11 e I~1 1 1 I .1 x ',Oil
0. 4I" 6(O0) -A IM 6(1) 4(0) 601) 0 0a I
2 2(1) 46 0 0 S(O") c
3(2 2(1) 5('4) 2(l) 0 G(0') 3(2) li 21 as 1#1 10 0 6 0 i
2(1) 0(' 6(01) 6*~0C 0
I 3(2) 1 ' 0 3(2) G(O-) ~ *4 00 i
t II 0.A! 0, 2'1 o 13 3 91
0 0 0 01-. 4 2U)(0 0") 0
2, 40 23 00 go1 go-
L2 0o 8 2 2(. r(1 $('4 s(2 0 .co" 1, 1 1 0 0
L4 2wE 1.1w 1- 14k I Pe o
1, *C' I *fiU'4 T 110'006(0") 0 0" so * go 4A
LI l n tss 0 00 go 40 tI I'1f j'tb we(
B; 18 Juns 78 7601 220-)
2 7 AWPf1& SWIMC VS IZ6Pt5
Table 4. 1 A
79
has been described by Reinisch et al (1981). Figure 4.3 shows the
error distribution function for the autoscaled foF2 parameter based on
the evaluation of 256 non-spread ionograms from January 1980, Goose
Bay, Labrador. For more than 70% of the ionograms foF2 is, scaled
within ±0.2 MHz of frequent occurrence of spread F. Even if the
frequent cases of spread F ionograms are included (for a total number
of 577) automatic scaling deviates from the manually scaled values by
less than ±0.5 MHz in 80% of all cases.
For calculation of the electron density profile RIS uses the
profile-fitting method developed by Huang and Reinisch (1982) for
application to autoscaled ionogram traces. A Chebysheff polynomial of
order 7 or less for the F-region profile is fitted such as to reproduce
the h'(f) trace. The method was adapted to bottomside Digisonde
ionograms by Huang Xueqin. The E-region is approximated by a
parabola with peak density NME .(foE) 2 , half width Y and height hE.
A valley between E and F region is calculated which best reproduces
the slope of the h'(f) curve for f > foE. Figure 4.4 shows an
automatically scaled ionogram from Goose Bay, Labrador. The little
square dots mark the manual scaling.
The RIS system is based on a 8085 5BC microcomputer with a
hardware mathematics processor unit. Intel's Fortran 80 is used as
source language. The entire ionogram is first stored before
processing begins. The output data are available for magnetic tape
recording and on an RS 232 serial output port.
4.4 Magnetic Tape Drive
After many years experience ULCAR has standardized on digital
tape recorders for which either separate or imbedded formatters are
supplied by the manufacturer. All of the major manufacturers of
digital tape drives [Pertec, Kennedy, IDT (Tandberg), Digidata,
etc.) make models whose latest generation formatters would be
compatible with the microcomputer (OUTCO) in the DGS 256. Several
models with different reel size capabilities are available from these
manufacturers. The only specific requirements for compatibility are
80
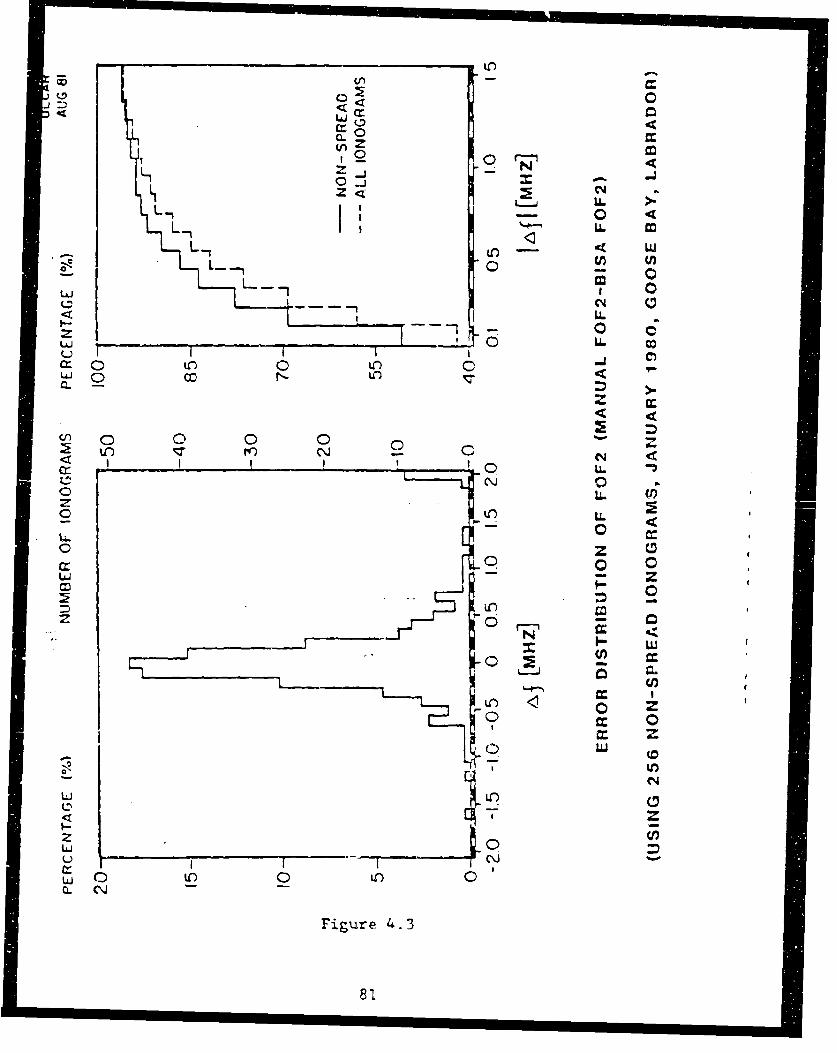
0
Cl -
0,2 rw
0 U3
Z(040LI.
_ _ _ _ _ _ _ _ _ _ _ _ _ LI.
U 0 .. -
< LL
I--.z0
CLC
z 00 0
< o 04o ~ 0
zzLIJ
00
rw 2 <UU
I-n
z U,
Q. ..J C
Fiur 4.
81W

.. .............. ....... . ........ - -- . - . .................... ........... z
*m a
00 Vt * 1
* ,,,610901 leirovI
so *i %,? 0 a* IIe 53 '
t ee 00 an ;-~ as a 0
of ,0 eg * ~ * o - -I *
* 0001 1?1r1r a 0i0Ce '. ^I 4
Iiai,.ouoC c 00 0C
.... I II~O ' c :1.210^0 3- ., -PC23 lc~ MK Sa52~2C,-g C 0 14M0
C Of 00:3 s 001912' ;C - ,
0
0 c:1 2
Co 0 ~ is 1 -
Cl~1 3 M I5
-4 3 C 6 0Ii
J500V 030: -
41. 7 09 03 3011
CL C
011
2'1'c,- 0 vv03 It
0 00 00, 0, 0, 0:'-, a P0 0
0 o 4 0 It 0 to v N 0
I'0 0 0 0 0 0 0 0 0 0 0 0 0C W00
Figure 4.4. AL'TQY-ATI CALL Y SCALED IONOGRAES
9-tracks and a latest generation formatter which accepts control words
strobed in by a pulse (GO pulse). We recommend the 1600 BPI PE
(phase encoded) tape format for reasons of tape economy although the
800 BPI NRZI format is still acceptable. No specific requirement for
tape drive speed exists; 37.5, 45 or 75 ips would all be satisfactory.
The tape formatter is programmed by an output port of OUTCO
on which specific bits represent Forward, Reverse, Write, Read,
EOF, etc. This control word is strobed in by a pulse (GO pulse)
which also initiates the start of the desired operation (read a record,
write a record, write an end-of-file, etc.). Some operations (rewind,
load-on-line) are initiated by a pulse of their own. The actual read
(RO-R7) or write (WO-W7) data is transferred directly to or from RAM
on the tape DMA (direct memory access) card at a rate determined by
the strobe supplied by the formatter. The RAM on the DMA card is
disconnected from the computer bus during the actual transfcr
allowing both the computer and the tape recorder to work
independently. All controls such as ONLINE, WRITE, ENABLE, etc.
are sequenced automatically by OUTCO. If power to the tape drive is
off, end of tape has been reached or some other difficulty has
occurred, OUTCO transfers *a warning message to the display of the
control computer.
4.5 Hardcopy Plotter
Since many years the Digisonde uses a fast electrostatic plotter
as an on-line output device: The Versatec Plotter, Model Matrix 1100.
Connected. to the Digisonde via Connector P the Plotter presents the
ionogram data using the optically weighed Optifont R in regular (4 x 6
dot matrix) or double size (8 x 12 dot matrix) or the 64-level BCD
font (8 x 12 matrix). In either case the high valued numbers (large
amplitudes) appear with higher intensity thus creating an analog
impression of the printout, as demonstrated in Figure 3.9.
The amplitudes of the 128 bins for each frequency are printed in
one line. In general the phase information is suppressed for the
iprintout. Greater simplicity is provided by a thermal dot line
83

THIS
PAGEIS
MISSING
IN
ORIGINAL
DOCUMENT
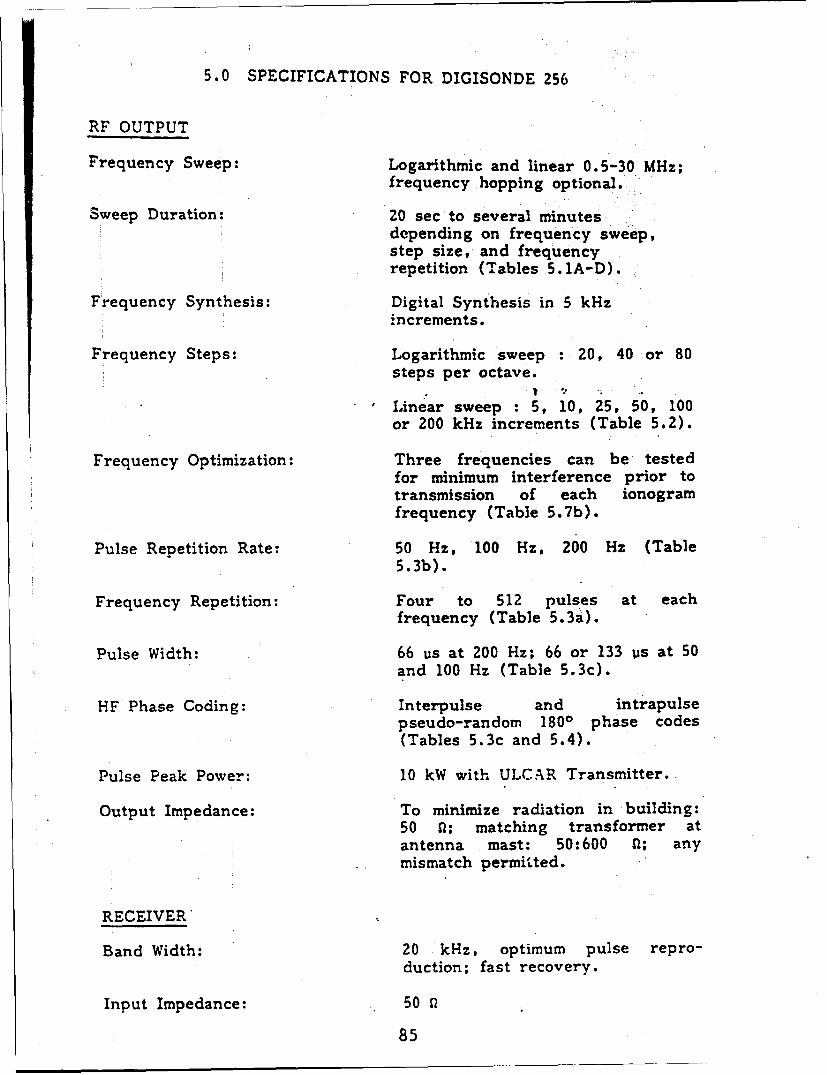
5.0 SPECIFICATIONS FOR DIGISONDE 256
RF OUTPUT
Frequency Sweep: Logarithmic and linear 0.5-30 MHz;frequency hopping optional.
Sweep Duration: 20 sec to several minutesdepending on frequency sweep,step size, and frequencyrepetition (Tables 5.1A-D).
Frequency Synthesis: Digital Synthesis in 5 kHzincrements.
Frequency Steps: Logarithmic sweep : 20, 40 or 80steps per octave.
Linear sweep : 5, 10, 25, 50, 100or 200 kHz increments (Table 5.2).
Frequency Optimization: Three frequencies can be testedfor minimum interference prior totransmission of each ionogramfrequency (Table 5.7b).
Pulse Repetition Rate: 50 Hz, 100 Hz, 200 Hz (Table5.3b).
Frequency Repetition: Four to 512 pulses at eachfrequency (Table 5.3a).
Pulse Width: 66 us at 200 Hz; 66 or 133 us at 50and 100 Hz (Table 5.3c).
HF Phase Coding: Interpulse and intrapulsepseudo-random 1800 phase codes(Tables 5.3c and 5.4).
Pulse Peak Power: 10 kW with ULCAR Transmitter.
Output Impedance: To minimize radiation in building:50 f; matching transformer atantenna mast: 50:600 fl; anymismatch permitted.
RECEIVER
Band Width: 20 kHz, optimum pulse repro-duction; fast recovery.
Input Impedance: 50 Q
85
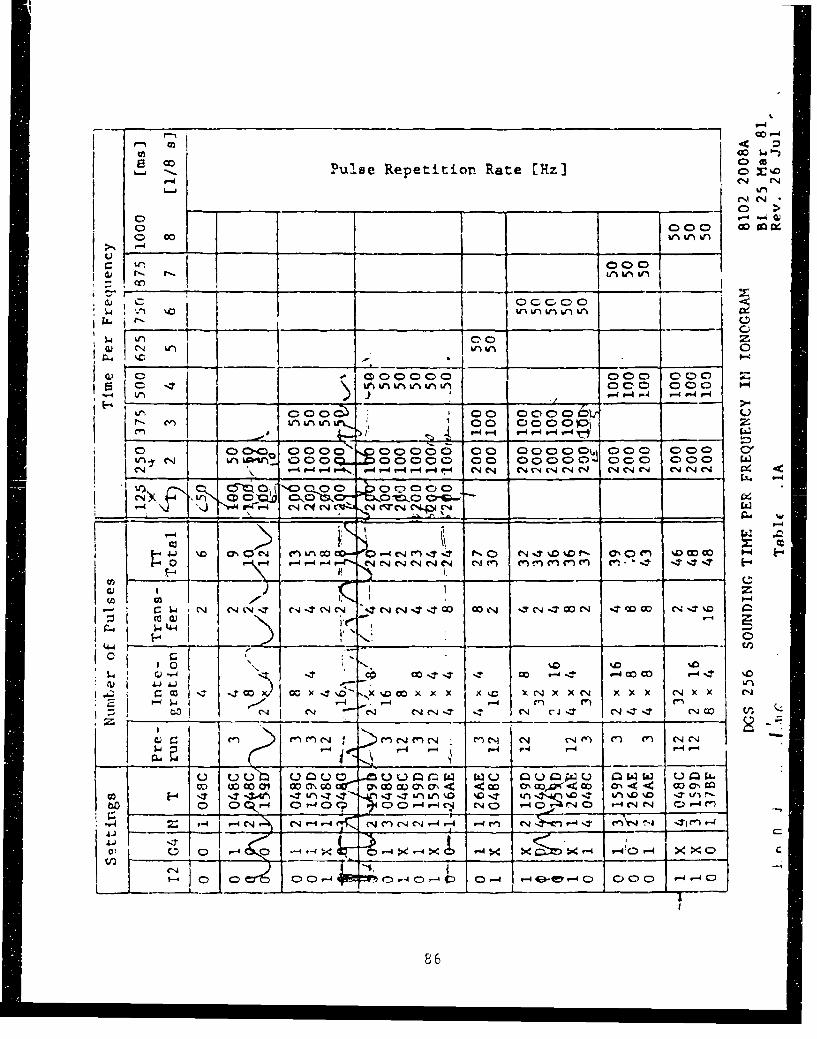
rOD
co~Pus Repetition Rate [HlI5 : .
o0 Go toW
00 -TV~i00
'40
0~-u 000 c mC 00 2:W) r.4 v-4 v-4 4- 0- "..4
00, CV)0~ v CN n )
to ~ ~ ~~~C 00n 40g CDgg gg~~
-4
N 0 CN Cv) LnO O- I,0 N : D% l Dc
0 ~ 4 (NP' NC4C '4( l n ()I
f--
4d 4 (N cc -1, -1-* Iti 00 '-I CO4 00 %t
w -I co cc x< X %0 O xx x x c X C4 X CN x x C1 X
-4 -4 --
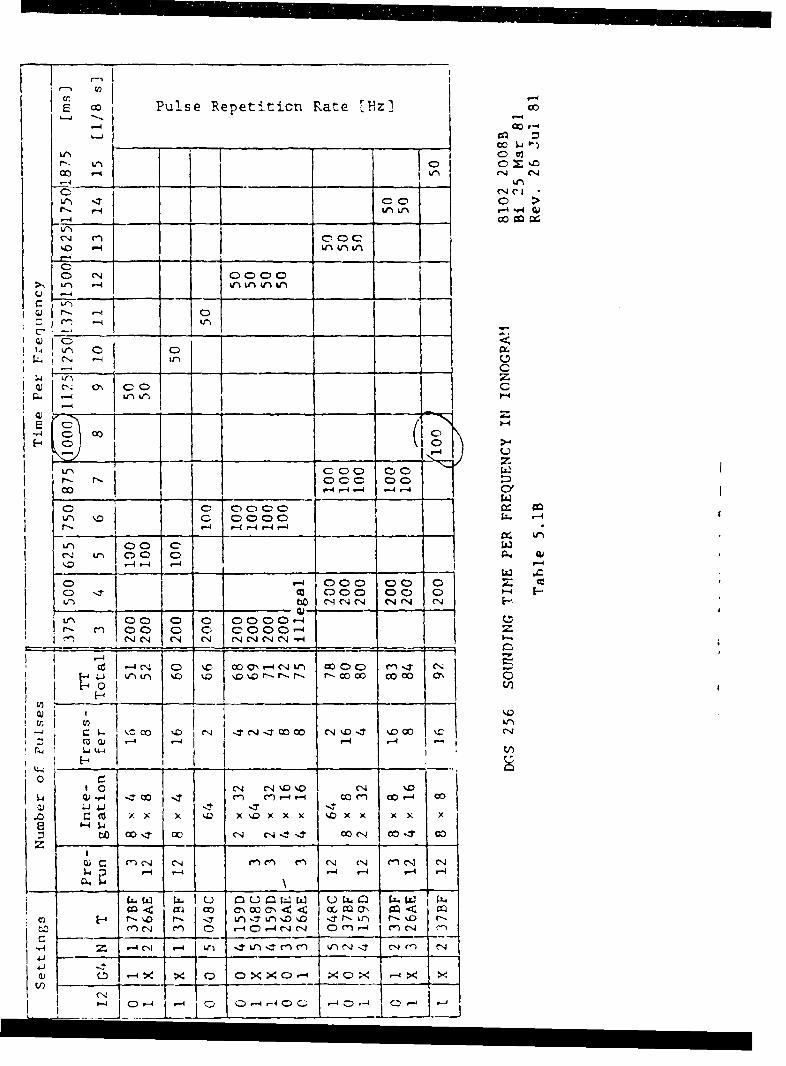
E O Pulse Repetiticn Rate [Hz] -o
00
0 N 00000
01L- C14 0)C
4
C_-1
00 0 - - 0g
Cnu~ 0l)0 C094 G,-4-4 ,-4 -
000O 0 0C) co 000 0 0 0
C ~ ~ ~ ~ N CDN (N000 -
f- 00 0 0C 0 0 0-4
4 00 V 0 0f 0%D0 \ D% -r - -0 0 00
cr~ (n r,D M- COOc 'N N, ' IDD- CC' %CN
1,0110'-4 -4
N C0 N 0 (N\0 N1 %C0
r-4 -4 -4 '-4
_ _ _ _ _ NN (oCs< r N VQ' NK -4( Cj 4 U'IN L Irc(r N C
(UL 4 X C) C>:)-4 (Z: -- >< x
_-4 --Ih _ -__-__ -_I___-4 -

r- lPulse Pulse 0
SRepetition Rate CHz] - Repetition Rate [Hz) )
C0%
C1 Ln 0 CD :
- 00 Ii-0 C)0OO4VI
C)-o~~I C-A c Cc
>1N LtoU 0NUVU1%)WU~l _ _ _ _ _ _ _ _ _ _ _ _ _ __%
I U,0l -4~c 00 ,1
I -4
Q*Wc~ 0( 0
(N.-,Jeq( eN((4( r r-4 (N NC (% (N- >
V 0 0-r - ~ C) CN C) (r-(1.4 0 0 0 CD 0
C14. 4 LL "
CD 0 0 -
j0 -4 40 4I4 CO
C) C )C DC l00C 0 -$ c *.e-C% cO( '. -C c0 0. e. -c,CD. .- p 4 X ,4 X~ C> C>XNX aX)(NXCXXXX r4 0 : C C D >-
v- - -4
I I- r
CU . 4 4 ,4.-4 co 0)-4
-4 . -4
I: r- - 0 oc14 0 -:1 04 %0 1 0 ~q%0 0" a CO-U-
4.) W CI 0I O 0 0-I4I
'-4 00 0 0'0'O - 1'- 0c$4~4(4 -~
8? 0C41 4 C - O-7C

co -
Pul'se z Pulse CEi 00 epetition C %
r- r4 Rate [HI 04"
-4-
_ _ _ r-4 4 0 4 0040r-4-4 r-4 -4 -
N 0 0 000c0 go O0 0 0 0 0 0 j)4U~~L jr -14 -4 -4 P4 (NI P4 N (4 -4
0 L;O~(~' 0 CLr) oI tl-~ d & -) C C- ) 0 000000000
CH CI4 '-i -N -J .-q C'-_ - -'
4fl (, c) i3 0 C%- 0 " CJ. = 0 c C 11 0. c0 C.0 0. ~) m (D O0%
*-I N4 I.- C 4C4(1C- , 4CQ" CN 4 CN CS -.C 4 U4
C'J i- Ef- -4 -44 -e0 e.. '0vI.0 O.- U ( r--4 r-4 0--9-4
'-4 ~ NO ' -4 F'-4( -4 v-o a)4( "4'- -4 - 4
I -z
'.0 'D co co %D co CN "00%Cm "co 0
000000c'- vC-(N 4-4 --7 00 0- D CJ00.T-4
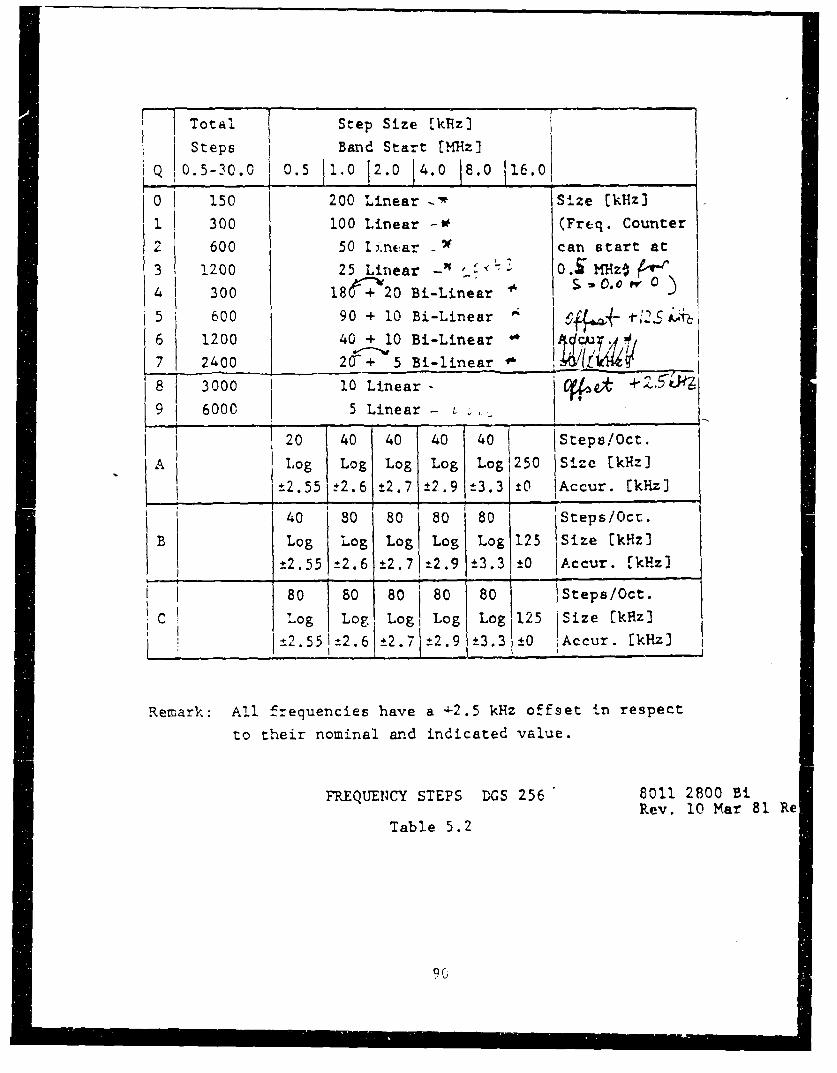
f Total Step Size [kTz]
Steps Band Start [MHz]
0.. 1.0 2.0 4.0 8.0 ]16.0
0 150 200 Linear - Size [kHz]
1 300 100 Linear - (Freq. Counter
S2 600 50 t,.near - can start at
3 1200 25 Linear -0 S E
4 300 18&720 Bi-Linear O
5 600 90 + 10 Bi-Linear $#L 4-"'2.Sesri-6 1200 40 + 10 Bi-Linear " CR.0
7 2400 20-+ 5 Bi-linear __________K8 3000 10 Linear9 6000 5 Linear- t,
I 20 40 40 40 40 Steps/Oct"
A Log Log Log Log Log 250 S!ze [kHz]
t2 55L2.6 t-2.7 2.913.3 ±0 jAccur. [kHz]
'40 80 8 80 80 Steps/Oct.
B Log Log Log Log Log 125 Size [kHz3
±2.55 ±2.6 ±2.7 ±2.9 ±3.3 ±0 Accur. k.zl
80 80 80 80 8 Steps/Oct.
C Log Log Logi Log Log 1125 Size [kHz]
I±2.551±2.6 ±2.7 ±2.9 ±3.3 ±0 1Accur. [kHzJ
Remark: All frequencies have a -2.5 kHz offset in respect
to their nominal and indicated value.
FREQUEmCY STEPS DGS 256 8011 2800 BiRev. 10 Mar 81 Re
Table 5.2
90

Number of Samples
Mode
0 No Operation1 2 x 4t2 8t 2 x 83 16 2 x 164 32 2 x 32 lonogram5 64 2 x 646 128 2 x 1287 256 2 x 2568 512 2 Y 512*
t - only full weight* only Hanning weigh'tK 30, 9
I ,I
R Pulse Rate [Hz] K I Sample Rate [Hz]
0 50 4 50 No Transmit i-D kCV,.,L"
2 100 6 100 No Transmit (C
3 200 7 200 No Transmit C"
Pulse WidthW7 [isec] Sample Weight
0 66
1 133 Full
S2 2 66 (intrapulse)
3 133 (2 samples)
4 66
5 133 Hanning6 2 x 66 (intrapulse)7 133 (2 samples)
DGS 256 NUMBER OF SAMPLES, PULSE RATE AND WIDTH
8102 2004BBi 14 Mar 8i
Table 5.3 Rev. 07 Sep 81
91
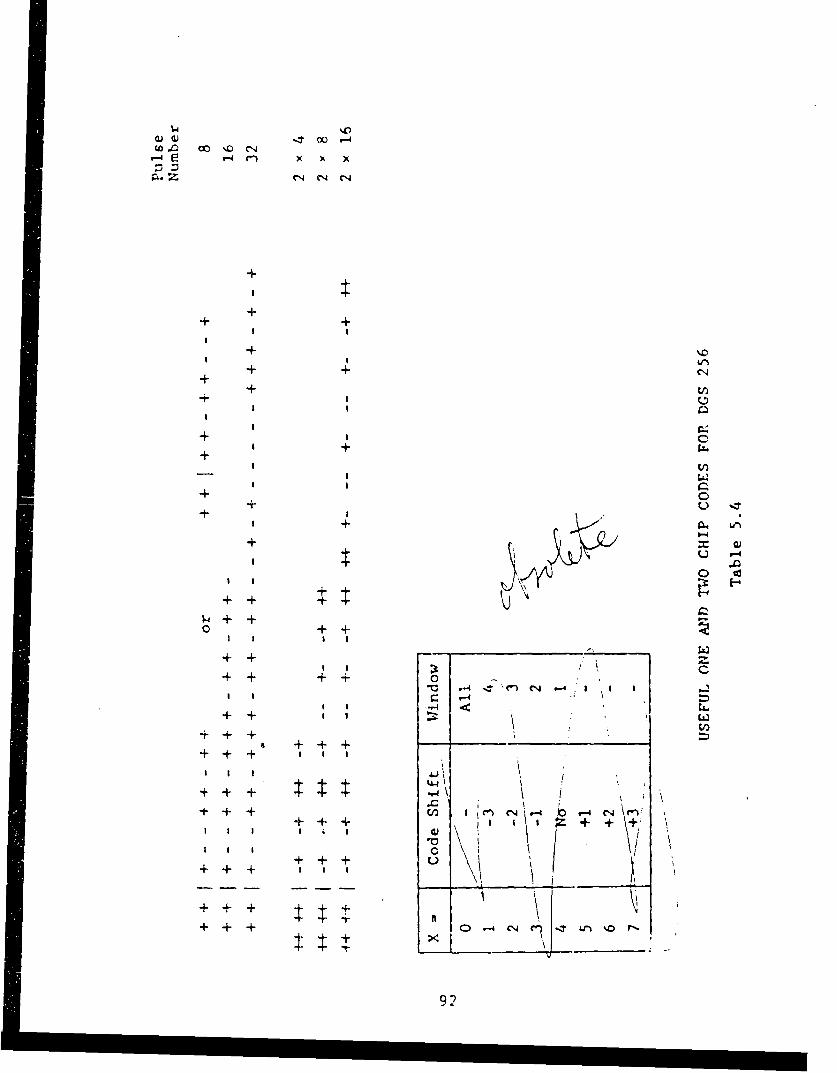
Q a nO ,-4
-4 ?1 x x x
+ C14
++ +
I I
++ +
+ +
+ + +z
S I I+ 0
+ L+
+ +
+ + +
+ +
+ + + EnP- I (N 1,4 4 4 C,4
+ +
+ +4
I I I a I
+ +92c
+++ 1;
+ +4+, -e .? o
+4+ I 92
iI Ii i i i i i i i i i i i
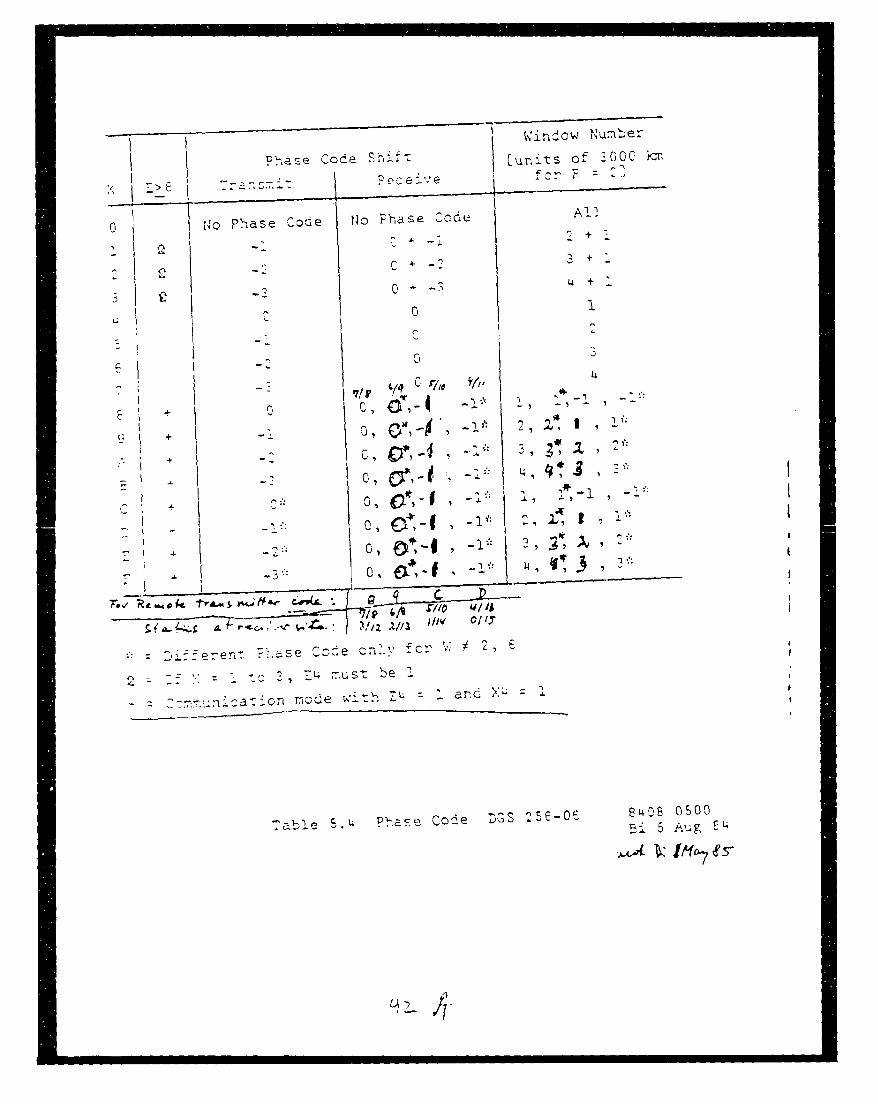
F'as o(e r. it of 0 c icn
0 No Pase 'Code 14o F'ase Code All
3 +
a L;
C-C
I 414 ,
Ic r
- eren-~;S oeOn. C .~2
2 3 ELcus be I
5 Au~g Ew.
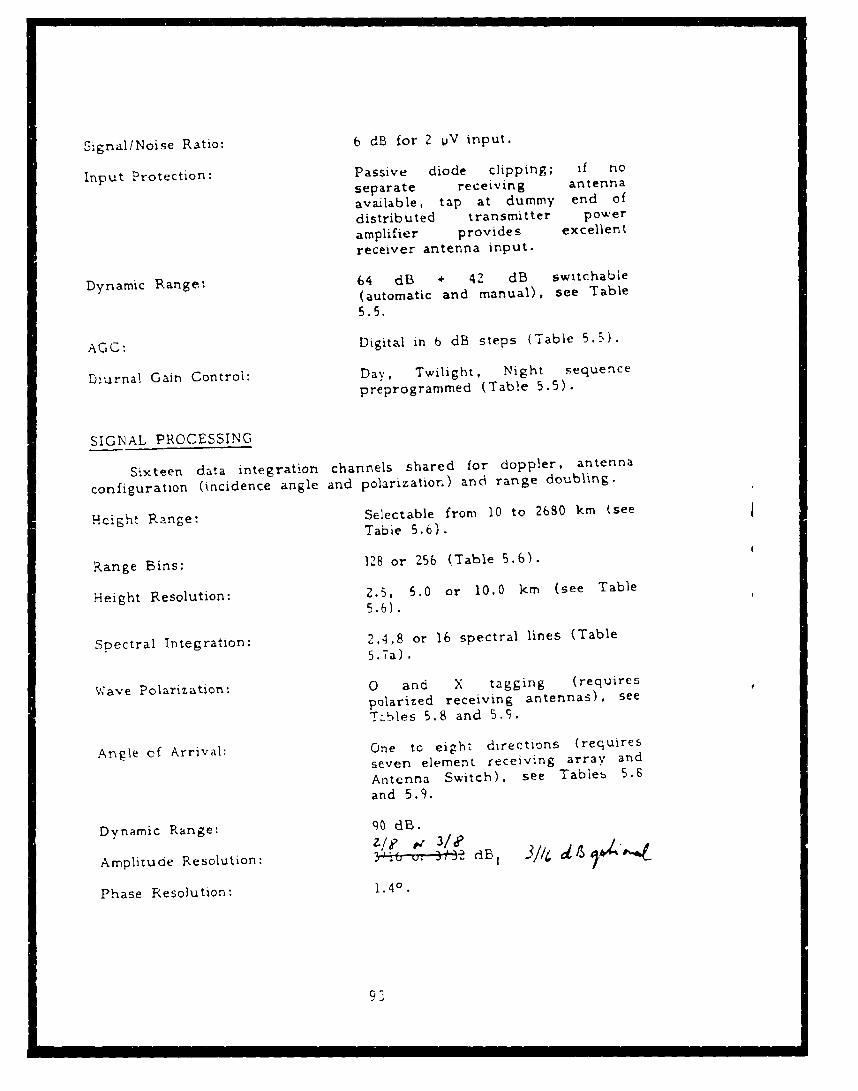
Signal/Noise Ratio: 6 dB for 2 uV input.
Input Protection: Passive diode clipping; if noseparate receiving antenna
available, tap at dummy end of
distributed transmitter power
amplifier provides excellent
receiver antenna input.
Dynamic Range' 64 dB + 4Z dB switchable(automatic and manual), see Table5.5.
AGC: Digital in b dB steps (Table 5.5).
Diurnal Gain Control: Day, Twilight, Night sequence
preprogrammed (Table 5.5).
SIGNAL PROCESSING
Sixteen data integration channels shared for doppler, antenna
configuration (incidence angle and polarization) and range doubling.
Hcight Range: Selectable from 10 to 2680 km (see
Table 5.6).
Range Bins: 128 or 256 (Table 5.6).
Height Resolution: 2.5, 5.0 or 10.0 km (see Table
5.6).
Spectral Integration: 2,4,8 or 16 spectral lines (Table
5.7a).
Wave Polarization: 0 and X tagging (requires
polarized receiving antennas), seeTables 5.8 and 5,0.
Angle of Arrival: One to eight directions (requires
seven element receiving array and
Antenna Switch), see Tabie 5.6
and 5.9.
Dynamic Range: 90 dB.i/? , I
Amplitude Resolution: 3+i uT-#2 dB, 3/is at i ' 4
Phase Resolution: 1.40.
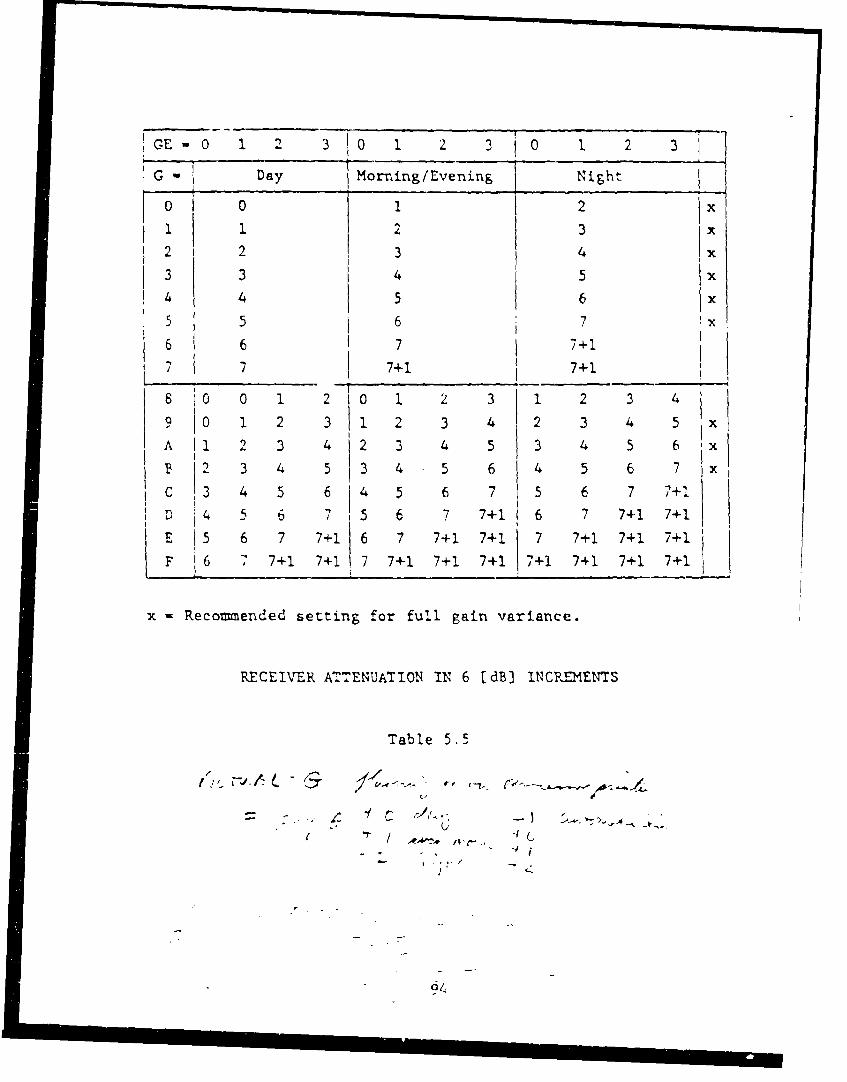
GE-O 1 2 3 0 1 3 0 1 2 3
G- Day Morning/Evening Night
0 0 1 2 x
1 1 2 3 x2 2 3 4 x3 3 4 5 x4 4 5 6 x5 5 6 7 x
6 6 7 7+17 7 7+1 7+1
8 0 0 1 2 0 1 2 3 1 2 3 4
9 0 1 2 3 1 2 3 4 2 3 4 5 x
A i 2 3 4 2 3 4 5 3 4 5 6 x
2 3 4 5 3 4 5 6 4 5 6 7 x
C 3 4 5 6 4 5 6 7 5 6 7 7+1- 4 5 6 7 5 6 7 7+1 6 7 7+1 7+1
E 5 6 7 7+1 6 7 7+1 7+1 7 7+1 7+1 7+1L t '1 7+ _ __ _ _ _F 6 77+1 7+1 7 7+1 7+1 7+1 7+1 7+1 7+1 7+1
x Recommended setting for full gain variance.
RECEIVER ATTENUATION IN 6 [dB) INCREMENTS
Table 5.5
U,
64/
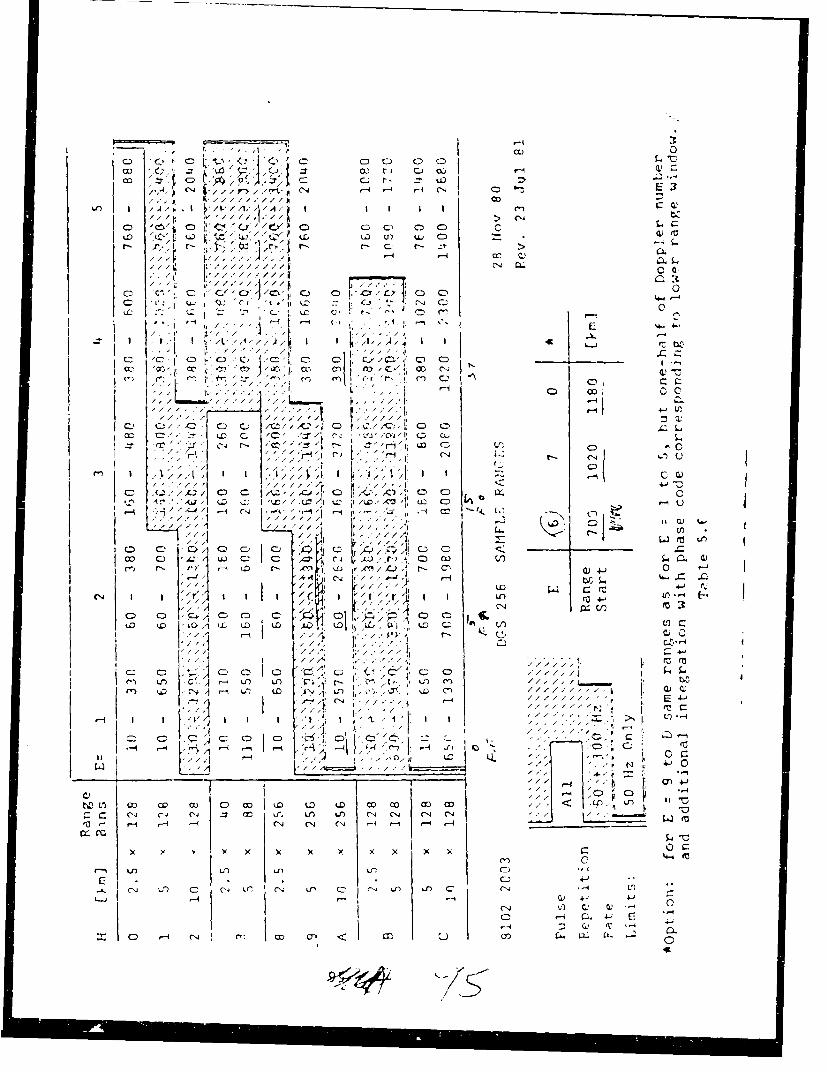
C uE)
E 3
A', I ///J'/ 7/ c
,, CL CLC
0 :C t C
CDC
I= o'' C , / , '/C C) C
71C C
Ct CD CDOCi
02 C c~ C'~/ ~ '~ic 'jI C O.
cc ,/,/ , zo..
r-: W%7~ CD Lr. C&Z) C
''''/ 4D''' L-, CD ___
I. C C
C"I It tUCQ L
tr (N 7 ' I C-).. (--21o C.I A;) (1 C) c L
CD C r.C )(C~ M3 4OA W1 (7-. (l
14. -ci
~~C_ C.- C
47~~C CD c~C C~'
hi Ll co CC) a; C:) co tD f Lo ) 4 J CC) (N M N ':0
a -i 471) -7 inl V) In C) C4 ('4
qo I __J C1.1.* c I -4 -1 w__ 1--4
fl) 14- It "
I C ~-4 (N,-4-4Cico0 oKU
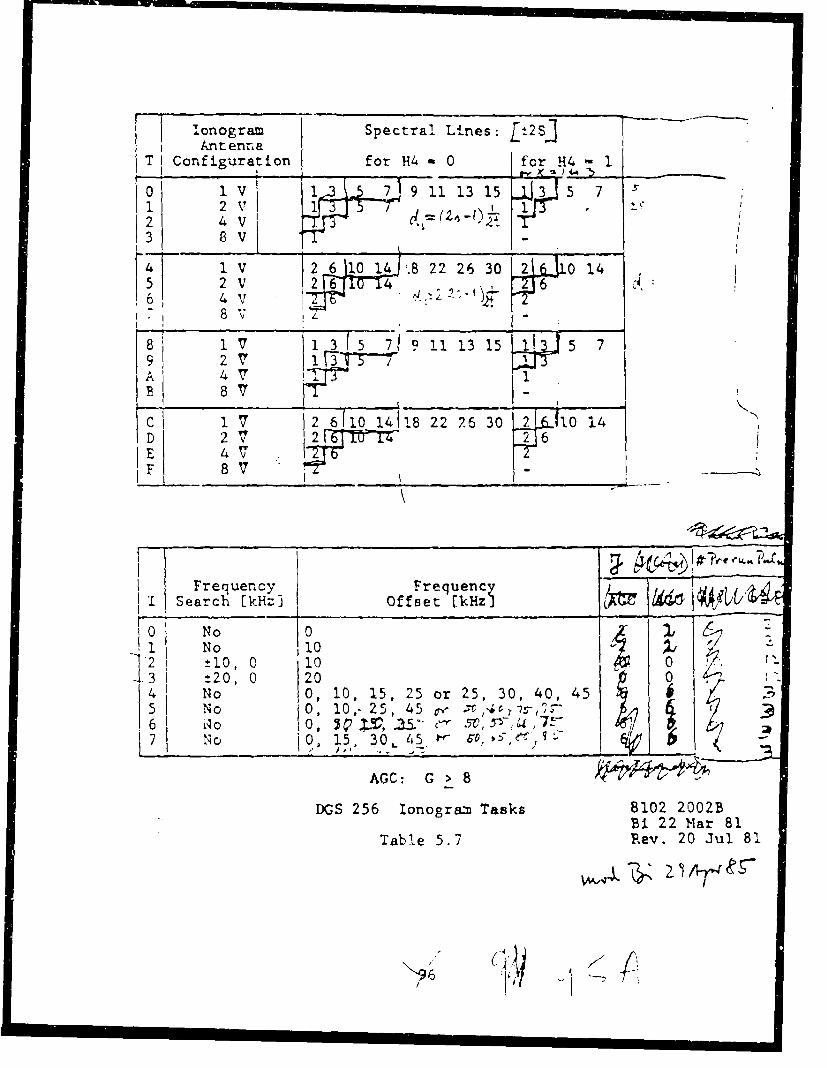
T Conogram Spectral Lines: Lt2S]Antenna
T Configuration for H4- 0 for H4 10 1 v 1 71 9 11 13 15 3 5 7
I 2 V, 12 4 V3 8 V-
27 I1130 2 0Y14
1 2 V 2 10 141.8 22 26 3 0 145 2 V I jITr
A 4 7
1 Frequency FrequencI Search [kHz
Off e rkn ;~ I
0C No 0J No 4101') 10, 0 10
13 t20, 0 20 04 No 0, 10, 15, 25 or 25, 30, 40, 45 ( ,5 No 0, 10, 25, 45 P 4
No 10, 15, 30, 45. , 3 0
AGC: G > 8
DGS 256 Ionogram Tasks 8102 2002BBi 22 Mar 81
Table 5.7 Rev. 20 Jul 81
1
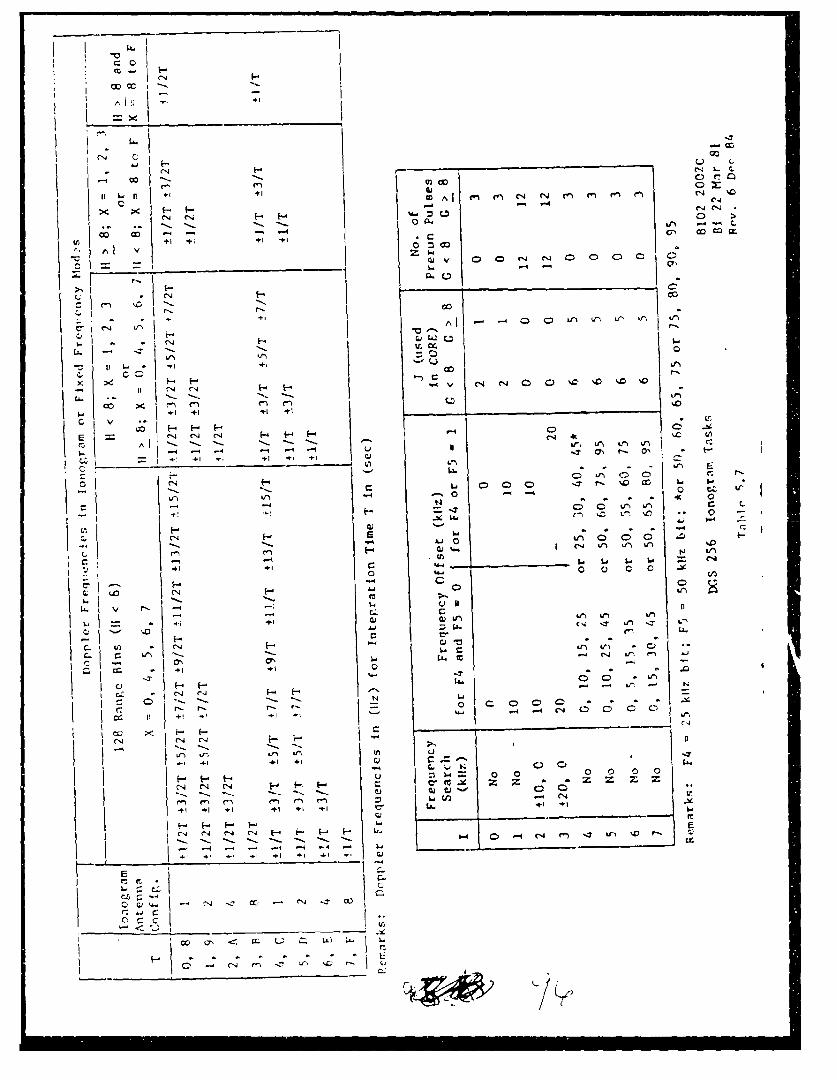
CO C
AC I e 4
CA C A
U-I
+1 +1 +1 0* o I
V 0A C) 0 00
qv0 0
1 I-
C- C j ~VK- C4. 00 %C- %.0 'D %0
*4- -4I+1 +!
_1 1~ ON f-
41 I4
1"
0 0~r.1- -4 ?
-CI
0- 0 Y
CN 0~I(N 4
.4-I CU-4 L
0 0 4) 0 0 n
+1L
ON a, J. -4
~ - -~ ~+1
0H 0 0 *'./-
'-~0 0000 -0
C7' --4 CN Vq.0 0Z =
r. N c- C,4 0. 4 4 cn 1 LK0 r-4 -4 -4
cc,]w W4141L LL
~ -e~ 7 U '0rr
-4~~~~ 40) .i..I
EXTENSION FOR CLOSELY SPACED FREQUENCY MODE
The Closely Spaced Frequency Mode serves to make precise phase
and group height measurement either at fixed frequency or in ionogram
scanning.
In fixed frequency mode four frequencies can be freely chosen.
In ionogram mode at least five frequencies, covering a one Megahertz
range, are necessary (Q = 0).
Selecting I - 4, 5, 6 or 7 (see Table 5.7) four different spac-
ings of the four closely spaced frequencies can be chosen. Originally
it was planned to have the samples from four closely spaced frequencies
with four Doppler lines each independently integrated. As an alternative
256 range bins with two Doppler lines each can be'selected (H > 8). Both
modes require T = 2, 6, A or E, automatically replacing the four antenna
configurations by four closely spaced frequencies.
If 128 height ranges and two Doppler lines are sufficient, two
antenna configurations still can be sampled with four closely spaced fre-
quencies for T - 3, 7, B or F. The starred (*) modes of Table 5.9 will
be applicable. After modification only the ordinarily polarized vertical
antenna configuration is allowed for four Dopplers or 256 height ranges:
T = A or E and Z = 7 or F. For T - 3 or 7 and Z - 7 ordinary and extra-
ordinary polarization can be sampled independently. For T - B or F there
are six possibilities for scanning azimuths 600, 900, or 1800 apart
either with small or large elevation angles.
On card 08 (Antenna Drive) chip 11 pin 12 has to be cut off and
grounded for this extension of the closely spaced frequency modes.
SOUNDIJG MORE THAN ONE FIXED FREQUENCY
A maximum of four frequencies can be set up in a
fixed frequency program. Since there is. only one frequency
Lnput available in a program, the four drift frequencies in
DRIF Buffer are used instead. The four "DRIFT" frequencies
are transmitted sequentially, one frequency per integration
period. Frequencies set equal to zero in the DRIFT Buffer
are ski.-zed. The Digiscnde will cycle through the four fre-
quencies either continuously or for a fixed number of times
depending on the "frequency" programmed into the FIXED fre-
quency program. "Frequencies" under 0.5 MHz will activate
this four frequencies sounding scheme. For example, a fre-
quency of 0.3 5 MHz will set the Digisonde to cycle through
the four frequencies by 35 times. Hence, the maximum number
of cycles is 49 (0.49 MHz). A zero frequency (0.00 MHz) in Ithe FIXED Frequency program indicates continuous sounding
secuentially of the four frequencies in the DRIFT Buffer. !
Freauencies greater than 0.50 MHz in a FIXED frequency program
wcrk conventionally, continuously sounding at the respective
frequency.

toset uo the Dinisoride for intermitten~t transrisc.c-n with -'blicue
5ociiqr: e-ce-imrit, :leojer, two: or mior e iornosorstes. With- or'oer
tr~.~itc~~ vev rd r ericx c arn.r ith he.
once ~ ~ ~ ~ r rv- r ei- wi.th theit
7. 4 t -it
t~nc C Bes AvailableCop

Zenith Angie Drif:1 -L; Small Large Antenna[£] Azimuth Name 0I1. Hame 1 Pol. LS-L8 LS:0 LS:'
0 0 0 0 " "i 0 (,)~ 2. C N N (B)
2 30 2 0 0 N-E (8)3 600 3 0 1N-E (8)
4 90O 4 0 W (A)
5 1200 1 5 0 x N+E (9)
6 1S0 ° 6 0 Y N E (9)
7 1 800 7 0 S N ( )
6 21C0°0 8 N '2 '_E (-)9 2 L0 9 U -E (3)
A 2700 A 0 E E (A)
B 3000 B 0 p N+E (9)
C 33c0 C 0 1 G N+ (9)
D - 0 0 "2 ' 5"
L - O 0 " 3?" " 7 "
____ _ _ _ _ _ _ _ _ __ _ _ 0
Polarization 0 = ordinary circular) exce.t at equator where it
should be N. Chart gives start of antenna sequence f-cr rruit
Parameter Chart can also be used to indicate the cu-tut
function L necessarv for the antenna swit-h orcduce L.Z -
-tnhs and Elevations 1 to C and N to G. If bits L7 and LE
are disregarded, ordinary polarization also for low elevationsN to C.
DEFINITION OF ANTENI;AS AND ANTENNIA CONFIGURATION START
D-S 2EE E8 - .A.INA DRIVE 8107 OClr
Bi $ Jul 82Table S.8 Rev LI1 ,av; 63
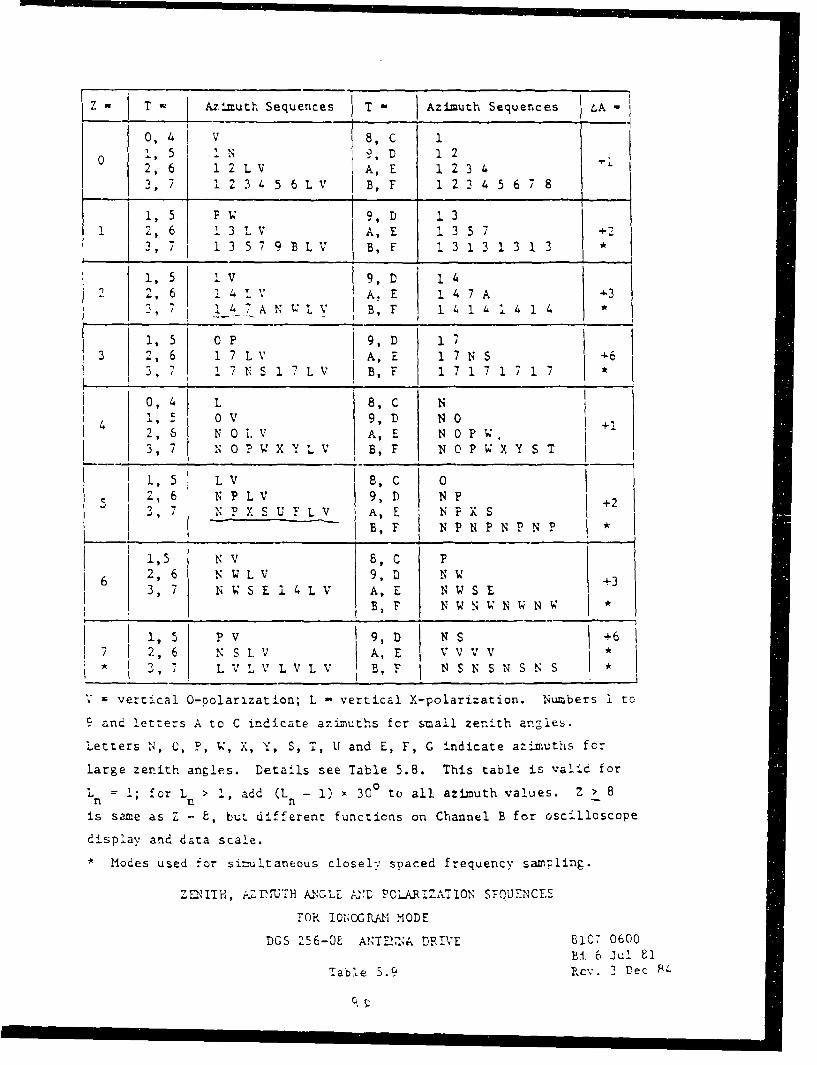
Zu[ T j Azimuth Sequences T Azimuth Sequences A
0,4 V 8, c0 5 N 12
2 6 1 2 LV A, E 123473 ,7 1 2 3 4 5 6 L V B,F 1234567
1,5 P W D 1 32, 6 1 3 L V A, E 1 3 5 7
3, 7 1 3 5 7 9 B L V B, F 1 3 1 3 1 3 13 *l,5 iv 9, D 1 4
2,6 V 4 7 A
7 A N W L V BF 1 1 i 4 i 14 *
1,5 OP 9, D 1 73 2, 6 1 7 L V A, E 1 7 N S 6
3, 7 1 7 N S 17LV B, F 1 7 1 7 1 7 1 7 *
0, 4 L 8, C N4 1, - 0 v 9, D N 0
2, 6 N O 1. V A, E N 0 P W
3, 7 N O P W X Y L V B, F N 0 P S X Y S T
i, 5 L V 8, C 02, 6 N P L V 9, 1) N P +2SNPXSUF L V A,E N P X S
B B N P N P N PNP
1,5 N V 8, C P
6 2, 6 NWLV 9, D NW3, 7 N W S E 1 4 L V A, 3 N W S E
B, F N W N W N W N W
1,5 PV 9, D N S +67 2, 6 N S L V A, V V V V *
3 , 7 L L L V L V B, F N S N S N S N S
V vertical O-polarization; L - vertical X-polarization. Numbers 1 to
9 and letters A to C indicate az.nuths fcr s-all zenith an.g1es.
Letters N, 0, P, W, X, Y, S, 7, U and E, F, C indicate azimuths for
large zenith angles. Details see Table 5.8. This table is val-d for
Ln = 1; for Ln > 1' add (Ln - .) x 300 to all azimuth values. Z > 8
is same as Z - 8, but different functions on Channel B for oscilloscope
display and data scale.
* Modes used for si-multaneous closely' spaced frequency san.;ling.
ZENITH, AZrh'UTH A "N"LZ POCLAIZA.TION SEQUENCES
FOR IONOcP\AI MODE
DGS 2.56-0F A.NT A DRIVE 8107 0600Ei 6 Jul 81
lable 5.9 Pcv. 2 Dec S4
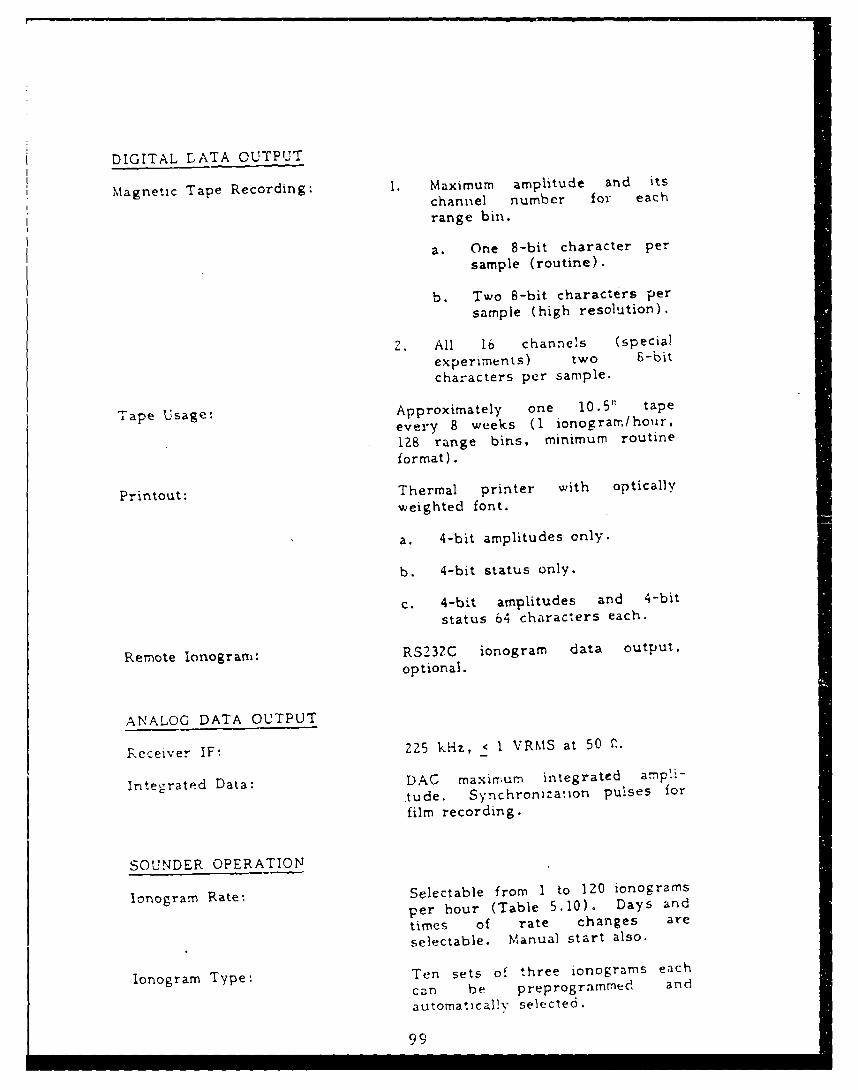
DIGITAL LATA OUTPUT
Magnetic Tape Recording: I. Maximum amplitude and itschannel number for each
range bin.
a. One 8-bit character per
sample (routine).
b. Two 8-bit characters per
sample (high resolution).
2. All 16 channels (special
experiments) two B-bitcharacters per sample.
Tape Usage: Approximately one 10.511 tape
every 8 weeks (1 ionograrr/hour,128 range bins, minimum routine
format).
Printout: Thermal printer with opticallyweighted font.
a. 4-bit amplitudes only.
b. 4-bit status only.
c. 4-bit amplitudes and 4-bit
status 64 characters each.
Remote Ionograni: RS232C ionogram data output.
optional.
ANALOG DATA OUTPUT
Rcceiver IF: 225 kiz, < I VRMS at 50 P.
Integrated Data: DAC maximum integrated arnpU-
tude. Synchronizatlon pulses for
film recording.
SOUNDER OPERATION
Ionogram Rate: Selectable from 1 to 120 ionograms
per hour (Table 5.10). Days and
times of rate changes are
selectable. Manual start also.
lonogram Type: Ten sets of three ionograms each
can be preprogrammed and
automatically selected.
99

43 -4
-n V)in C "4 4)
C4) V
fn
C)C
0 0C>~a C-
~~~e 0<'C 0U-10X~(
00 o4 4
r.. N In 0 V)
4-
0.
t4 r 0 4 f-4 '.0jo 0
_ _4_ 0- '
%0) Ir r-~U0 0 4 14J~ &r~ +- +- 1
P-4CN %0 r- OD a- (D en
4)4 I4 Im I - .-
0100
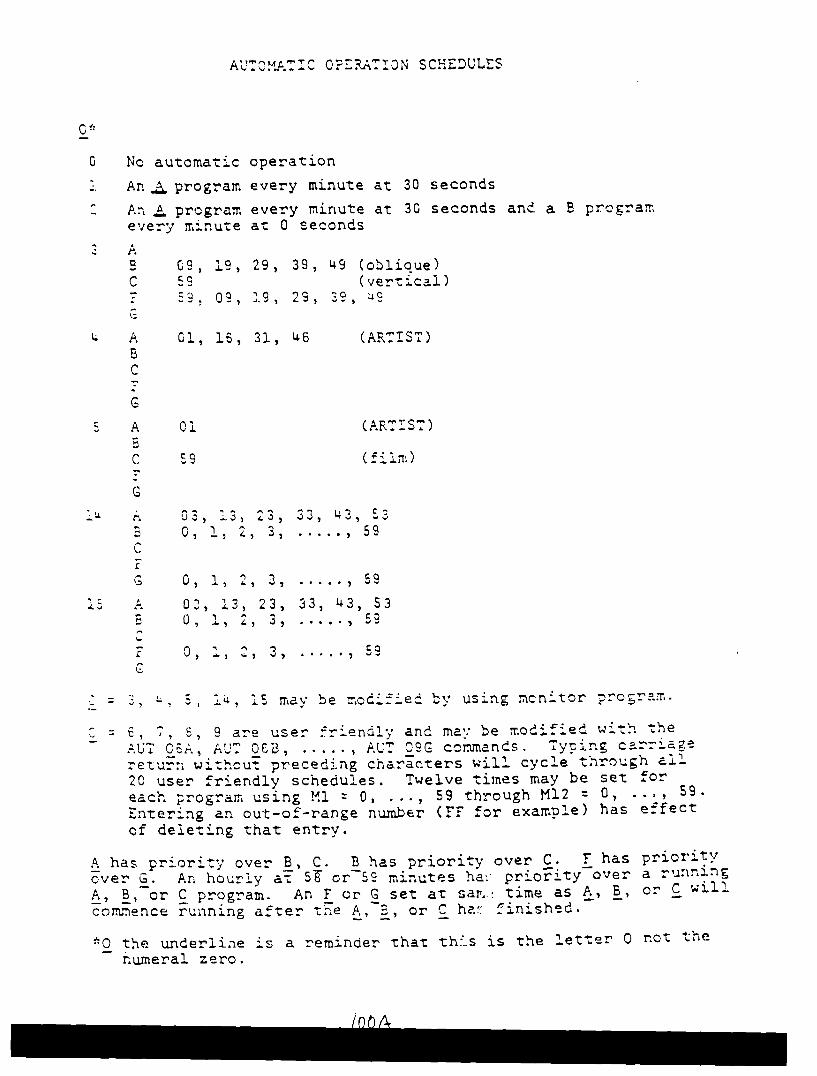
AUQMA~COFFE"RA.T1N SCHiZDULrS
0 *
0 No automatic operation. An . program every minute at 30 seconds
An A program every minute at 30 seconds and a B programevery minute at 0 secondsAB G9, 19, 29, 39, 49 (oblioue)C 59 (vertical)
- . 09, 2-' 9, 9,
A 01, 16, 31, 46 (ARTIST)BC
G
A 01 (ARTIST)
C 59 (film)
G
_ , , 2 3, 3 ..... 4,
CFG 0, 1, 26, 53.
A 03, 13, 23, 33, 43, 53P 0 1 2, 3 . ...... ,5
F 0, ,2, 3..... , 59C
L ' 14 .5 ye ay b e mo d ie by using mcnitor proSram.
6, 7, 8, 9 are user friend!y and may be -modified with theAUT OEA ,U 0 6B..... , AUT .90 cormands Typing ca-riage
return withour, peceding characters will cycle through all
20 user friendly schedules. Twelve times may be set foreach program using Ml z 0, ... , 59 through M12 = 0, -- o9 59.
Entering an out-of-range nutmber (FF for example) has effectof deleting that entry.
has priority over B, C. B has priority over C. F has priorityover G. An hourly a: 5T or-59 minutes ha; priority over a rul.l.
A, B, or C program. An F or G set at sar: time as A, 5, or C Will
comngrence running after the A, B, or C h2.: finished.
*O the underline is a reminder that thi.s is the letter 0 rot thenumeral zero.
I nh4
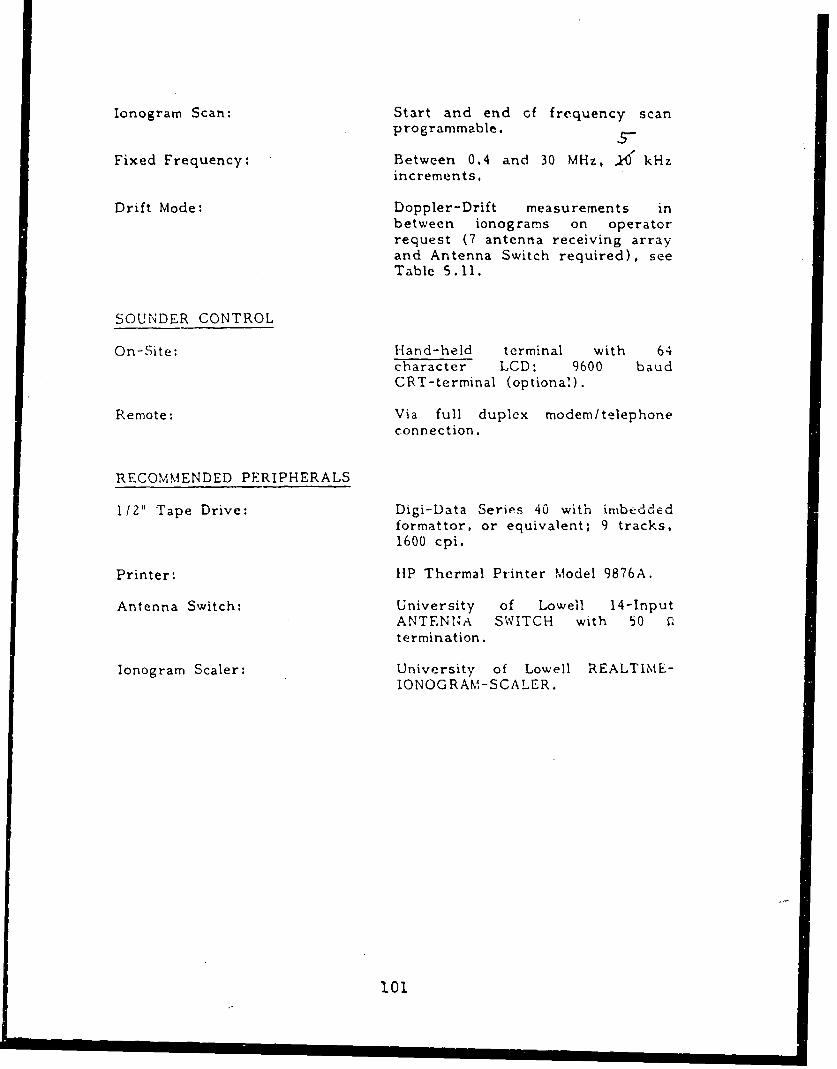
lonogram Scan: Start and end of frequency scanprogrammable.
Fixed Frequency: Between 0.4 and 30 MHz, 1i kHzincrements.
Drift Mode: Doppler-Drift measurements inbetween ionograms on operatorrequest (7 antenna receiving arrayand Antenna Switch required), seeTable 5.11.
SOUNDER CONTROL
On-Site: Hand-held terminal with 64character LCD; 9600 baudCRT-terminal (optional).
Remote: Via full duplex modem/telephoneconnection.
RECOMMENDED PERIPHERALS
1/2" Tape Drive: Digi-Data Series 40 with imbeddedformattor, or equivalent; 9 tracks,1600 cpi.
Printer, HP Thermal Printer Model 9876A.
Antenna Switch: University of Lowell 14-InputANTENNA SWITCH with 50 ftermination.
lonogram Scaler: University of Lowell REALTIME-IONOGRAI-SCALER.
101

Height Max. # Max. #L Antennas Frequencies Ranges Dopplers Samples
0I 1 1 2 256 256
1 1 4 1 2 1 256 512
2 41 1 2 256 256
3 8 4 2 1 128 256
4 4 0 1 2 256 256
5 8 A 2 2 64 128
6 1 1 '8 256 256
7 40 2 1 256 5127
8 1 2 2 256 256
9 4 1 4 1 128 256
-4A 4 1 2 2 128 256
B 8.,,, 4.- 1 64 128
C 4 0 2 2 128 256
- D 8 1 1 2 128 256
E 2 8 128 256
F 0 4 1 128 256
I Height Sectral Lines
N Antennas Frequencies Ranges Samples T3 - 0 1T3 - 1
5 V < X 64 64, 32-
6 X X X 128 _8 64
7 Al , ), 256 256 128
8 Only for L 1 and 7 512 J 256
DGS 256 DRIFT TASKS 8107 0200Bi 2 Jul 81
Table 5.11 Rev. 8 Oct 81
102
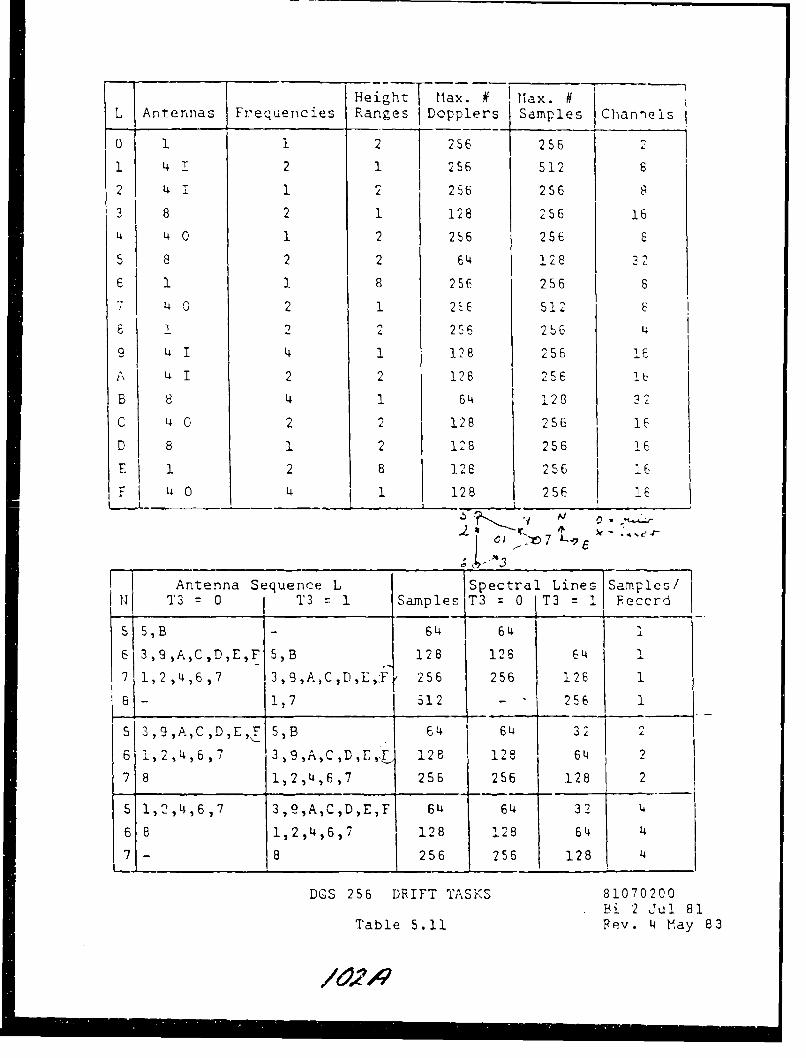
Height I Max. N flax. #L Antennas Frequencies Ranges IDopplers Samples Channels
O 1 1 2 256 256 2
1 4 1 2 1 256 512 8
2 4 1 2 256 256 6
3 8 2 1 128 256 16
4 0 1 2 256 256 8
5 8 2 2 64 128 32
6 1 1 8 256 256 87 4 0 2 1 2 E 512
8 2 2 2,6 256 L4
9 , 4 ! 128 256 1E
4 1 2 2 128 256 lb
B 8 4 1 64 120 32
) ^2128 256 16
D 8 1 2 128 256 16
E 1 2 8 128 256 6
4 0 4 1 128 256 16
Antenna Sequence L ISpectral Lines Samples/T3 = 0 T3 :1 Samples T3 : 0 T3 = I Feccrd
5,B - 64 1 64 1
6 3,9,A,C,D,E,F 5,B 128 126 64 1
7 1,2,4,6,7 3,9,ACDEj 256 256 128 1
8- 1,7 :12 - 256 1
5 3,9,A,C,D,E, j 5,B 64 64 32 2
6 1,z4,6,7 3, 9,t,C,D,Ej 128 120 61
7 8 1,2,'4 6,7 256 256 128 2
5 1,2,4,6 7 3 9,A,C,DE,FI 6" 614 32 L4
1,2,4,6,7 12 2 8 128 64 4
7 - 8 256 256 128 4
DGS 256 DRIFT TASKS 81070200Bi 2 Jul 81
Table 5.11 Rev. 4 May 83
- /0

6.0 REFERENCES
"Automatic Processing of Digital lonograms and Full Wave Solutions forthe Profie Inversion Problem," B.W. Reinisch, H.E. Moses and J.
--Final Report, ULRF-417/CAR. (M%1).
"Ai tom- ic Calculation of Electron Density Profiles from Digitallonogra ns. Part 1. Automatic 0 and X Trace Identification forTopside Ionograms," B.W. Reinisch and Huang 'euqin, to bepublishe6 in Radio Science (1982).
"T'RF Radio Environment in the Topside ionosphere," C. Rush,L'RSi XXth Cc-neral Assembly, Session G.4 (1981).
"High ' d-itude Supplement to the URSI Handbook," W.R. Piggott,World L ita Center A for Solar- Terrestrial Physics, Report UAG-50( 19?:5).-
"The Universal Digital lonosonde," K. Bibi and B.W. Reinisch, RadioScience. 13, pp. 519-530 (1978).
'Font of Digital, or Other, Characters arid Method of Pattern PrintingThe-eof," K. Bibi, U.S. Patent No. 3810095 (1974).
"Direct Digital Graphics,' J. Patenaude, K. Bibl and 12.W. PReinisch.American Laboratory. pp. 95-101, Septembtr 1973.
"Variability of the Eq~uatorial F-Region," K. Bibi, InternationalReference Ionosphere (IRI) Workshop, COSPAR XXIII PlenaryMeetirng, Budapest 1980.
UNIVERSITY OF LOWELLCOLLEGE OF PURE ANiD APPLIED SCIENCE
CENTER FOR ATMOSPHERIC RESEARCHLowell, Massachusetts
TAPE FORV.AT FOR DGS 256
November 1983
TABLE OF CONTENTS
Page
1. Tape Description 1
2. Record Types 1
2.1 Scanning lonograin, MIM'ed Output(Record Types 08H and 09H) 2
2.1.1 Block organization of ionogramdata 3
2.2 Dump of Raw lonogram Data (RecordTypes OCH and ODH) 9
iii
LIST OF TABLES
Table No. Page
. Recorded Data: Record Types 2
2 Record Organization of RecordedMMM'ed Ionograms 4
3a Tape Recorded Preface 5
3b Tape Recorded Preface 6
4 Block Organization cf Recorded
KMM'ed Ionograms (Tape WriteControl P1 = 1) 7
5 Prelude Organization S
6 Status # as Function of Dopplers,Heights, Antenna Option andChannel 4 10
7 Dump of Raw Data: RecordOrganizat in 11
8 Dump of Raw Data (Record TypesOCH and ODH): Encoding of RecordType and Preface into 232 Ampli-tude Characters 12
V
TAPE FORMATS FOR DGS 256
1. Tape Description
All tapes are 9-track 1600 BPI PE format, except
for Belgium with 800 BPI NRZI. Odd parity is used. All
records on tape have 4096 characters or bytes of 8 bits each.
It is possible with some tape recorders that actually 4097
characters will be written due to variations in meaning of
the last word command to the tape formatter. When this hap-
pens, the last character is meaningless.
2. Record Types
The RECORD TYPE is encoded into the 4 LSB of the
first character of each record. Table 1 lists the types of
records and summarizes the contents of each; more details are
found in the sections below. The Tape Write Control parameter
P1 in the ionogran preface directs the Output Computer to
write the data on tape (P1 = 0 indicates 'no output to tape');
the record type indicates to the tape reader the type of data
in each record.
2.1 Scanning Ionogram, MMM'ed Output (Record Types
08H and 09H)
A routine scanning ionogramn consists of 128 or 256
amplitudes and statuses for 128 or 256 range bins at each
sounding frequency. In general several records are required
for each ionogram; the first record of each ionogram is
labelled 09H, and the other records are labelled 08H.
Each record of MH'ed (Modified Maximum Method) ion-
ogram data contains three initial characters plus 57 4-bit
preface characters, followed by a maximum of 30 blocks (30
frequencies) of data with 128 height ranges per block, or a
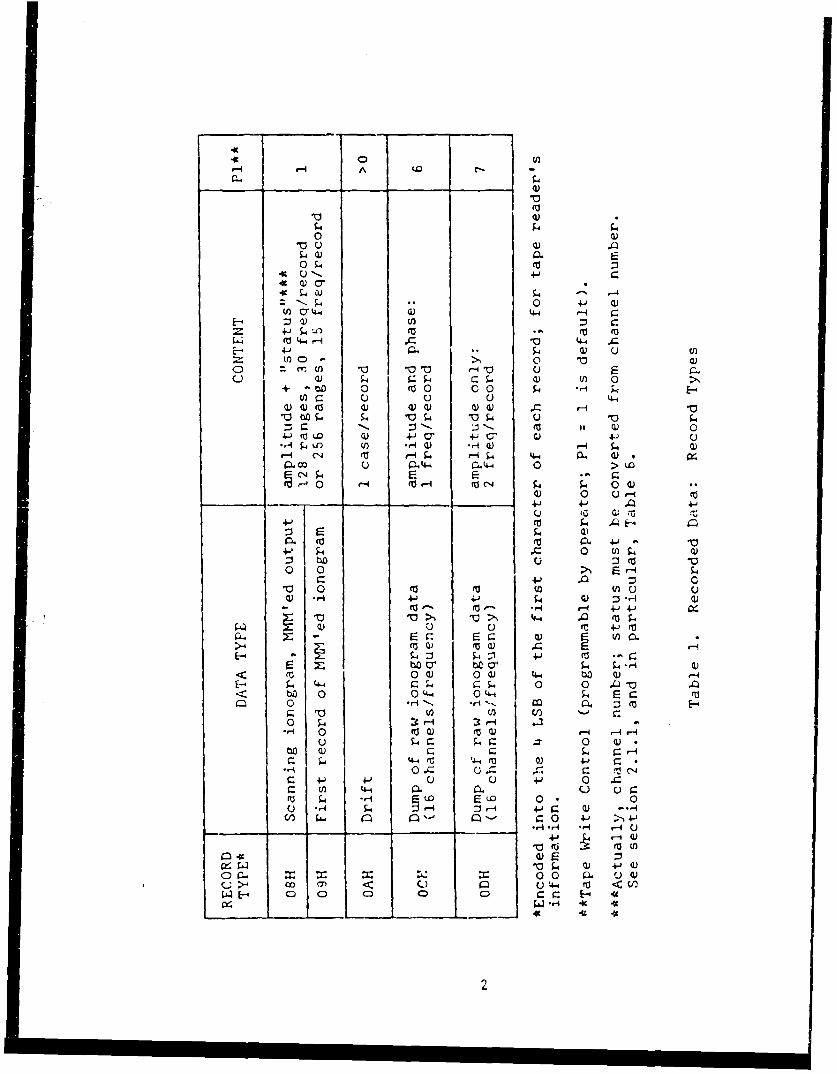
C)u
0 W)
V0 0) .
~0)V)
I4 0) u.4-4
(n Cu a~r
0) *. 0.+ to '-4 0l 0 044 L
r- .Q C) C0)Q ( ) a)0) cu0) -V
=b~ C) 1 Q
0) a . 41C 4-O C, 4.J(JH . U)., ) *HO v-4 Q) 0
i--i C14 r r-4 ~ '- -i 44 a) .CLc ".44 C0. .'-4 0 > (D
C-4 F, i 9
0MC-4N 00)4) 0 ()-IC
:J E 04()
0 U) S.4o o 0i : m
0 4.V)
0) *,4M- 4-' 4-) 4.-4
T) ) >N 4-1
>4 CC 0) . -
0 00) 00) 14-4 w3 Q). 4-4 r- i:C. 0 0 .0 .
to 0 0L'.4 0 4-4 fu0 *H. *- 4 . C
0 (1 a/) C)o~- Q4)-'
to 01 r: 0)r- -,
U0 0c)T!C1
4-4 .4 4 0 0) 4' 00.0 0.0 r=L L
C~ 4- 4'C)C 4-; 0 -4
Ca 0 -1-1 0'j
Cl) L. ( 0~'' 00 4-'4-4-
.4 0- 0
00 M) ()-'0 )E C) C)C) ) -~ E- '-W
I_ _ 1K 4Z9
2
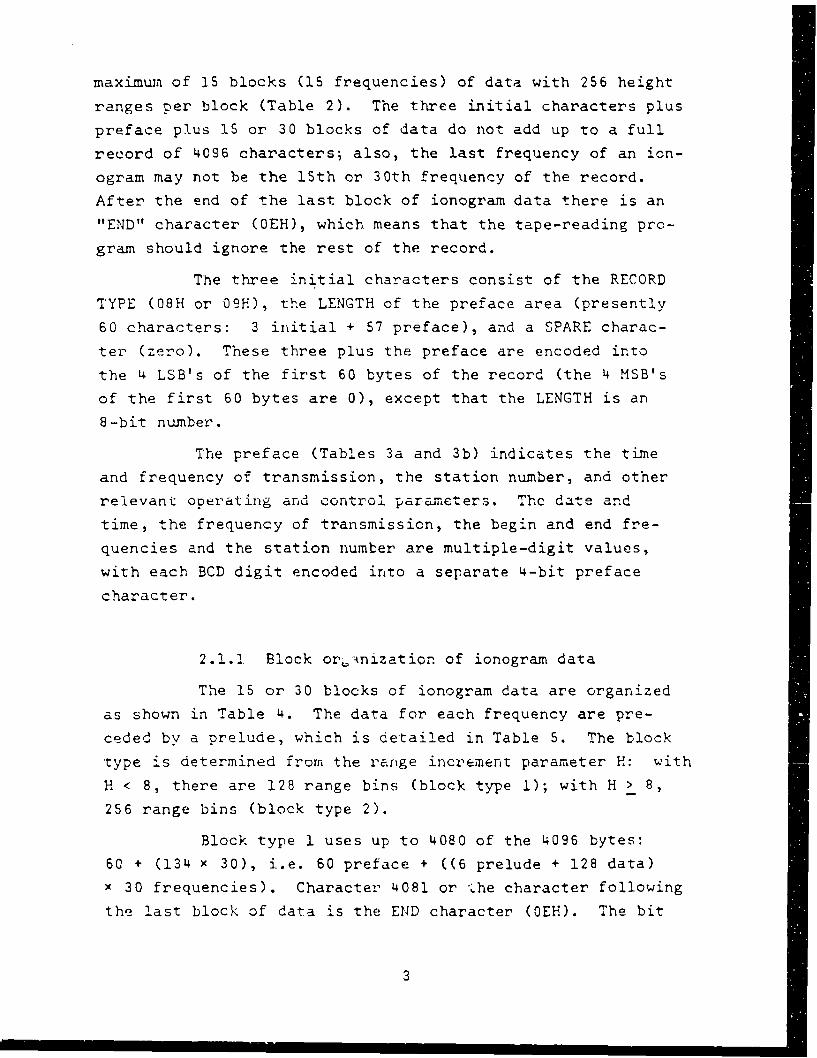
maximum of 15 blocks (15 frequencies) of data with 256 height
ranges per block (Table 2). The three initial characters plus
preface plus 15 or 30 blocks of data do not add up to a full
record of 4096 characters; also, the last frequency of an ion-
ogram may not be the 15th or 30th frequency of the record.
After the end of the last block of ionogram data there is an
"END" character (OEH), which means that the tape-reading pro-
gram should ignore the rest of the record.
The three initial characters consist of the RECORD
TYPE (08H or 09H), the LENGTH of the preface area (presently
60 characters: 3 initial + 57 preface), and a SPARE charac-
ter (zero). These three plus the preface are encoded into
the 4 LSB's of the first 60 bytes of the record (the 4 MSB's
of the first 60 bytes are 0), except that the LENGTH is an
8-bit number.
The preface (Tables 3a and 3b) indicates the time
and frequency of transmission, the station number, and other
relevant operating and control parameters. Thc date and
time, the frequency of transmission, the begin and end fre-
quencies and the station number are multiple-digit values,
with each BCD digit encoded into a separate 4-bit preface
character.
2.1.2 Block orga-nization of ionogram data
The 15 or 30 blocks of ionogram data are organized
as shown in Table 4. The data for each frequency are pre-
ceded by a prelude, which is detailed in Table 5. The block
type is determined from the rarge increment parameter H: with
H < 8, there are 128 range bins (block type 1); with H > 8,
256 range bins (block type 2).
Block type 1 uses up to 4080 of the 4096 bytes:
60 + (134 x 30), i.e. 60 preface + ((6 prelude + 128 data)
x 30 frequencies). Character 4081 or Lhe character following
the last block of data is the END character (OEH). The bit
3
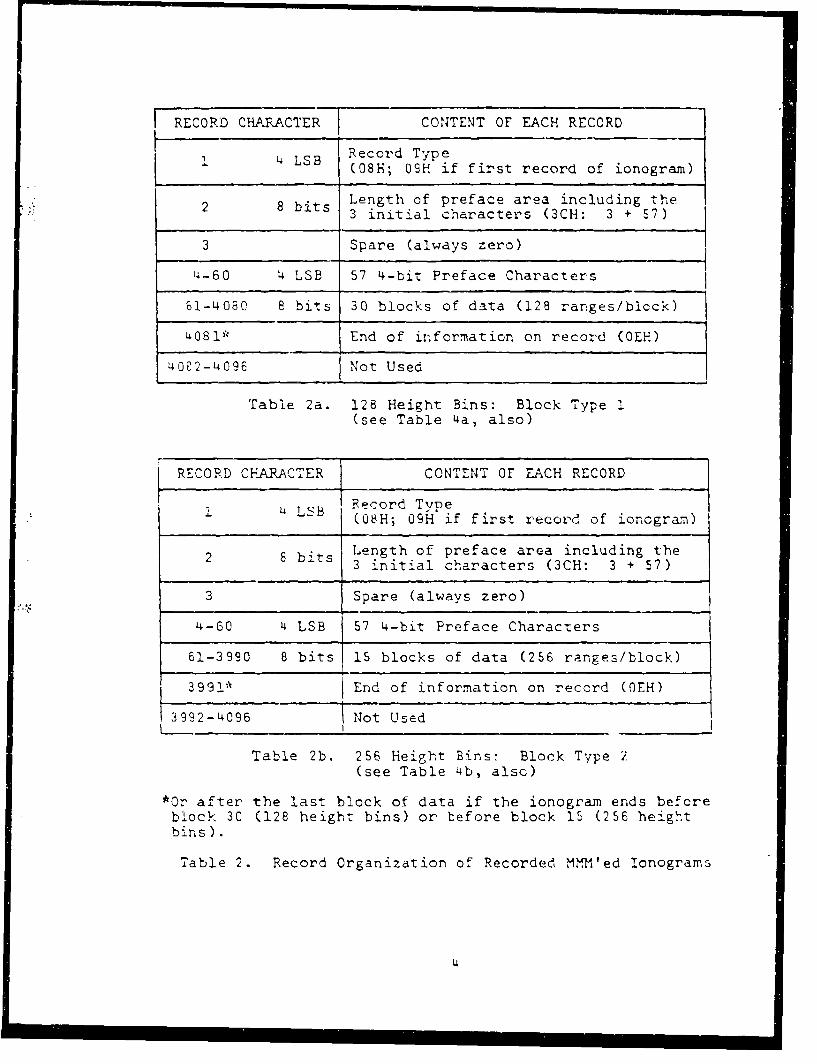
RECORD C.H LAPCTER CONTENT OF EACH RECORD
14 LSB Record Type(08H; 0TH if first record of ionogram)
2 8 bits Length of preface area including the3 initial characters (3CH: 3 + 57)
3 Spare (always zero)
1-60 4 LSB 57 4-bit Preface Characters
61-408 8 bits 30 blocks of data (128 ranges/block)
&081* End of information on record (OEH)
4022-4096 Not Used
Table 2a. 128 Height Bins: Block Type I(see Table 4a, also)
RECORD CFARACER CONTENT OF EACH RECORD
1 LSB Record Type(08H; 09H if first record of ionogram)
8 bits Length of preface area including the
3 initial characters (3CH: 3 + 57)
3 Spare (always zero)
4-60 4 LSB 57 4-bit Preface Characters
61-3990 8 bits 15 blocks of data (256 ranges/block)
3991* End of information on record (OEH)
3992-4096 Not Used
Table 2b. 256 Height Bins: Block Type 2
(see Table 4b, also)
*Or after the last block of data if the ionogram ends before
block 3C (128 height bins) or before block 15 (256 heightbins ).
Table 2. Record Organization of Recorded M1I'ed lonograms
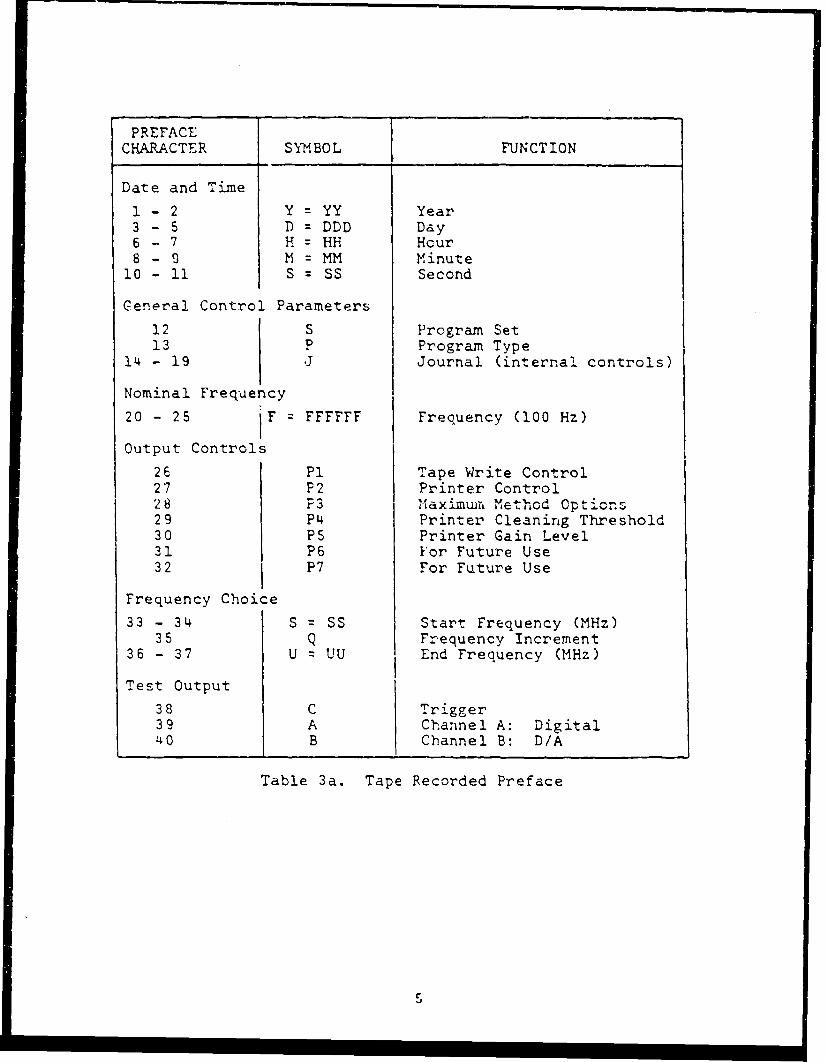
PREFACECHARACTER SYMBOL FUNCTION
Date and Time
1 - 2 Y = YY Year3 - 5 D = DDD Day6 - 7 HzHH Hcur8 - 0 M Minute
10 - 11 S = SS Second
General Control Parameters
12 S Program Set13 P Program Type
14 - 19 Journal (internal controls)
Nominal Frequency
20 - 25 F FFFFFF Frequency (100 Hz)
Output Controls
26 PI Tape Write Control27 P2 Printer Control28 F3 1-aximw, Method Options29 P4 Printer Cleaning Threshold30 PS Printer Gain Level31 P6 For Future Use32 P7 For Future Use
Frequency Choice
33 - 34 S = SS Start Frequency (MHz)35 Q Frequency Increment
36 - 37 U = UU End Frequency (MHz)
Test Output
38 C Trigger39 A Channel A: Digital40 B Channel B: D/A
Table 3a. Tape Recorded Preface
5.-

PREFACECHARACTER SYMBOL FUNCTION
Station Identification
41 - 43 V Station No. from INCPU Personality
Operating Parameters
44 X Phase Code45 L Antenna Azimuth46 Z Antenna Scan47 T Antenna Option and Doppler Spacing
N Number of Samples49 R Repetition Rateso W Pulse Width and Code51 K Time Control52 1* Frequency Correction (from CORE)53 G* Gain Correction (from CORE)r, H Range Increments55 E Range Start56 T Frequency Search57 G Nominal Gain
Drift Parameters
S8 - 60 Hi = HEH Height 1 (kin)61 G1 = G Gain 1 (-6 dB)
62 - 65 F1 = FFFF Frequency 1 (10 kHz)66 - 68 H2 = HHH Height 2
69 G2 = G Gain 270 - 73 F2 = FFFF Frequency 274 - 76 H3 = EHH Height 3
77 G3 = G Gain 378 - 81 F3 = FFFF Frequency 382 - 84 H4 = HHH Height 4
85 G4 z G Gain 486 - 89 F4 = FFFF Frequency 4
Table 3b. Tape Recorded Preface
6i
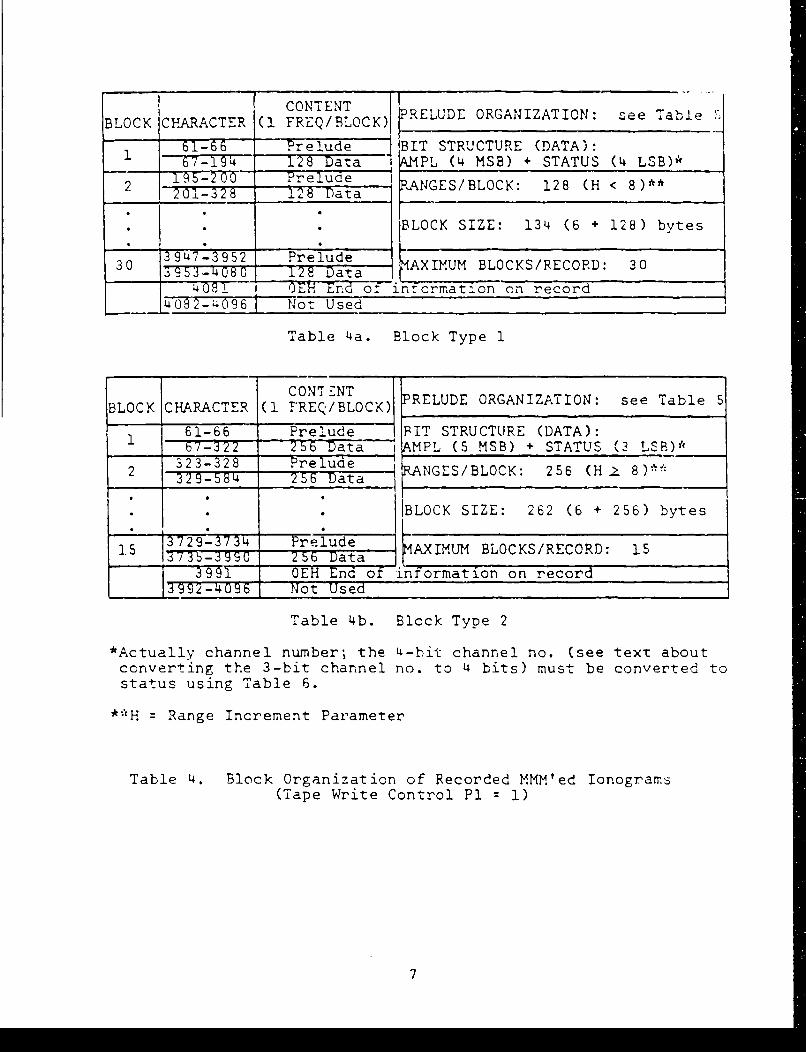
CONTENT PRELUDE ORGANIZATION: see TableBLOCK CHARACTER ( FREQ/BLOCK) _ D
61-66 -- Prelude I BIT STRUCTURE (DATA):7-194 128 Data jv, PL (L MSB) + STATUS (4 LSB)*
195-200 Prelude ANGES/BLOCK: 128 (H < 8)2 201-328 128 Data* I*.BLOCK SIZE: 134 (6 + 128) bytes
30 3947-3952 Prelude30 5308 128 Data AXIUM BLOCKS/RECORD: 30
4081--1 0EH End of inrcrmation on record4 0 2- 096 ,Not Used
Table 4a. Block Type 1
CONT "£NT LBLOCK CHARACTER (1 FREQ/BLOCK) RELUDE ORGANIZATION: see Table $
1 61-66 Prelude TPIT STRUCTURE (DATA):b7-322 256 Data iAMPL (5 MSB) + STATUS (3 LSB)
323-328 Pre lude2 329-5[ 256Data A1 NGES/BLOCK: 256 (H 8),
* . .BLOCK SIZE: 262 (6 + 256) bytes
].S 3729-3734 Prelude MAXIMUM BLOCKS/RECORD: 15_____399 256= Data I_ _ _ _ _ _ _ _ _ _ _ _ _ _ _ _
1 991 OEH End of information on recordT3992-096 Not Used
Table 4b. Block Type 2
*Actually channel number; the [--bit channel no. (see text aboutconverting the 3-bit channel no. to 4 bits) must be converted tostatus using Table 6.
**H = Range Increment Parameter
Table 4. Block Organization of Recorded MMM'ed Ionograms(Tape Write Control P1 1)
7
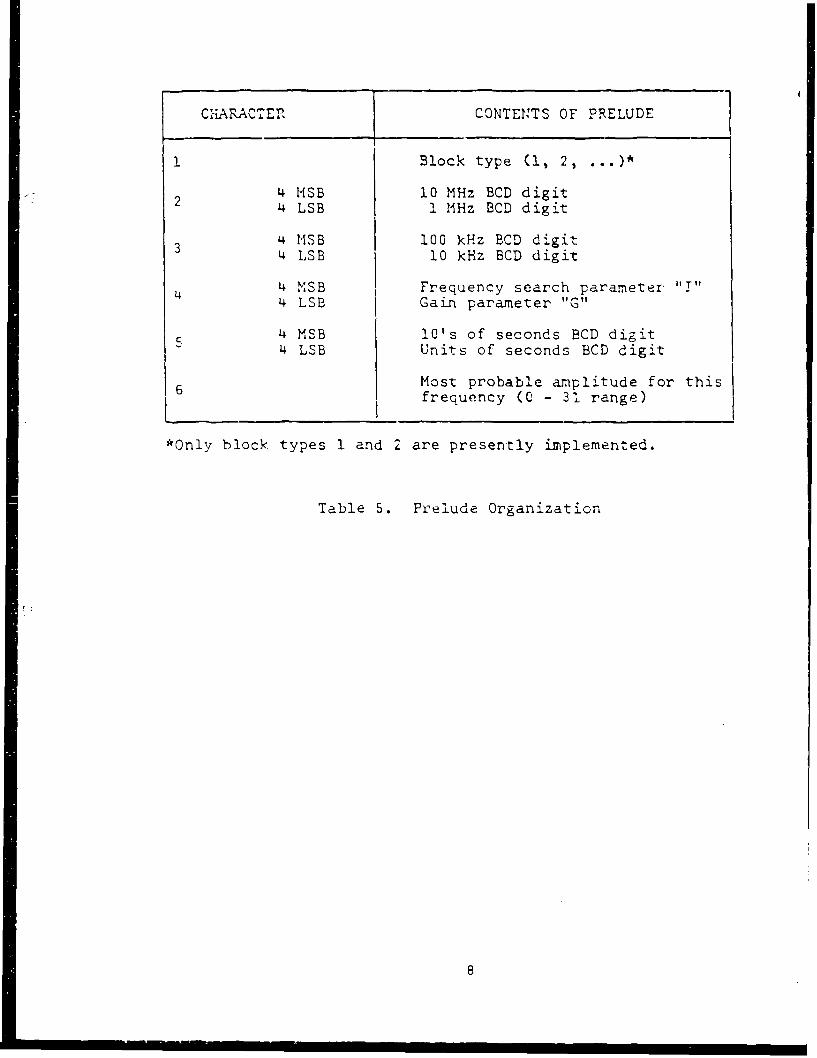
C:iAEACTER flCONTENTS OF PRELUDE
1 Block type (1, 2,
2 4 HSB 10 MHz BCD digit4 LSB 1 MHz BCD digit
4 MSB 100 kHz BCD digit4 LSB 10 kHz BCD digit
4 4 :SB Frequency search parameter "IT"4 LSB Gain parameter "G"
4 MSB 10's of seconds BCD digit4 LSB Units of seconds BCD digit
6 Most probable amplitude for thisfrequency (0 - 31 range)
*Only block types 1 and 2 are presently implemented.
Table S. Prelude Organization
i I I I I I I I i8

structure of each byte of data is AAAASSSS: a 4-bit AMPLITUDE
encoded into ti'e 4 MSB, with a 4-bit STATUS (actually, the
channel number from which the amplitude was selected) encoded
into the 4 LSB. The status is obtained from the channel num-
ber, using Table 6.
Block type 2 uses up to 390O of the 4096 bytes:
60 + (262 x 15), i.e. 60 preface + ((6 prelude + 256 data)
x 15 frequencies). Character 3991 or the character following
the last block of data is the END character. The bit struc-
ture of each byte is AAAAASSS: a 5-bit amplitude encoded into
the 5 MSB, and a 3-bit STATUS in the 3 LSB. SSS, which is
actually the 3 MSB of the channel number, must be converted
back to a 4-bit channel number before being used to determine
the status from Table 6: for the first 128 range bins of each
frequency, chan. # = 2 x SSS; for range bins 129 to 256,
chan. # : 2 x SSS + I.
2.2 Dump of Raw -onograir Data (Record Types OC and ODH)
Each record of type OCH contains the amplitudes and
phases of all 16 channels of data (16 x (128 amplitudes + 128phases); see Table 7a) outputted from CORE for one ionogram
sounding frequency. Each record of type ODH contains the am-
plitudes only of all channels of data for two sounding fre-
quencies (16 x 128 amplitudes + 16 x 128 amplitudes; Table 7b).
All amplitudes and all phases are 8-bit binary numbers; how-
ever, as explained below, the lowest bit(s) of some amplitudes
are undefined because they have been replaced by preface
information.
For both dump types, the preface area consists of a
4-bit record type and 57 4-bit preface characters. These 58characters are encoded serially into the lowest bit of each of
the first 232 (4 x 58) amplitude characters of each record, as
illustrated in Table 8. (Note that in the OCH dump, the first
9
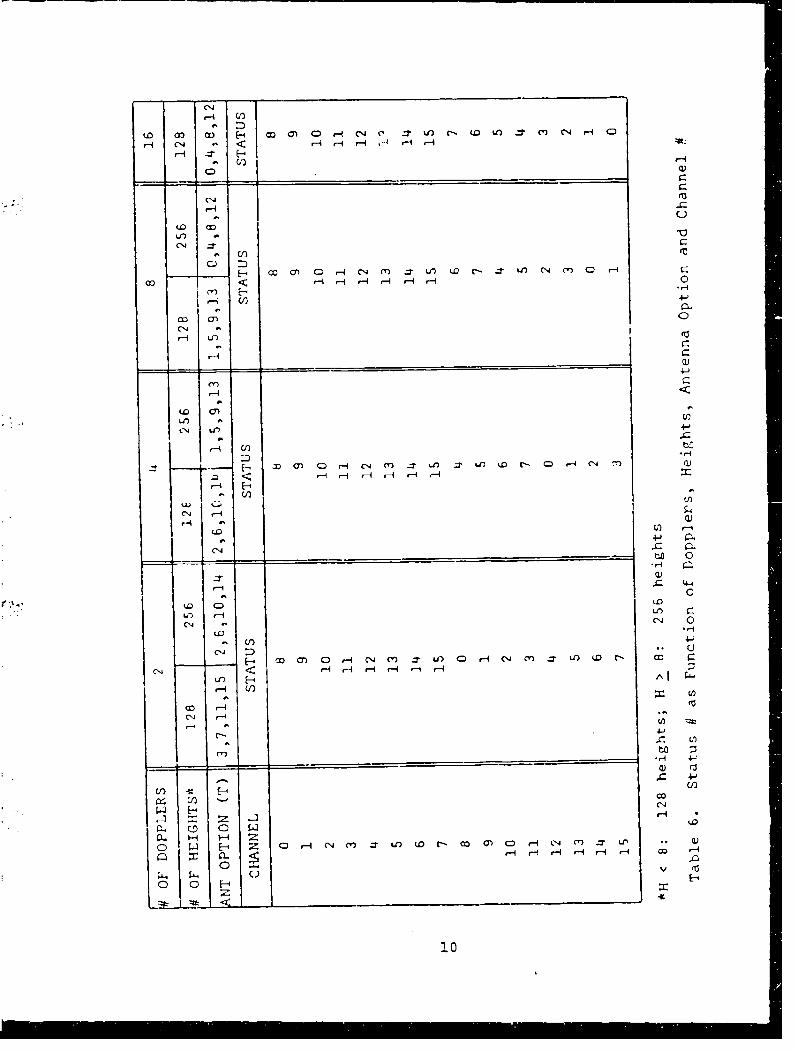
(N (
H -j C14 t
* CQ)
C:))
C1 j, 4
IN M j0 nt* - nNM0rIC
Ho < u J rir-
co alC14-
'-r-
04 U-) 4 J
* E' . ~ C C-4 LN ("o t- -4 I (0 N C'4 .n a
H1 .- H H
'~~1 to
* 4-' C-
LI) H - AI C
C))4- -
C H4
- -- (- - Zd LO ( -4D-) - 4 T U-4 H- -- a)I '-i -4 w
-v 4-
Cl) -~H C10

E C0R D CO0NT-E N TS
CHARACTER CHANNEL A1MPLITUD-E/EF.ASE PREFACE (Table 8)
______ A!____ 4____H___B Rec Tvue (p arallel)2-4A 4A 7 MSB Tec TvDe (serial)5-128~ ~ 7-Al27 7 /, B Te-.13
129-____56 _____ -12 8-bit2-73 60 '-T7T-T ta 32-z)7
_______ -t28 8-bitI
8 4 -77 -8TAl-AT28 8-bit9 6 ______ (l- '126 8 -Lt ---
Table 7a. Record Type OCH: Amplitudes and Phases(1 Frequency/Record)
RECORD CO N4TENT S1CI-AACTE-R FR.FQ CHAN AMPUT"UDE PEC (Tabale 8)I _ _ _ _ _ A_ __4_ _ __F_ _ _ _ __-ar
2-4 e2- 7~W c tvtoe seri ai)
S-128A5-A128 7 MSIB Prefae 1-31-9 -.T Al-AI04~ 7 MSB PTreface 32-57
233-2S -A2 8-bit
19 l2 1 48 r'l 16 Al-A128 8-bit ___________
-7 L,9 -2 -776 1 A-Al;D MS Unused, Pre! 1-3121",-2;2 AI-AlO'4 7 M Preface 3-2--5-7
- 2 A105-A178 8-bit
___________ A T IA -A 27- S-bit
Table 7b. Record Type ODH: Amplitud es Only(2 Frequencies/Record)
Table 7. Dump of Raw Data: Record Organization

cc - >%
-~E-
0'a0< 0
In~~~~C CD C C ) C) ) Q)
< < < < < 4-J0
C? C) C > nW a< C-)
(N) Cl -om cnc r*
-4 < 4J W C) -
e-4~~0
V,)' ~,C~C)~. 1-4-1'4- r- u
a)-4-
Q,- r m C'C) u) (Ar-i_ __ (C 0 1
r -4 4i:4 i . <
C a H c o * C r-4 S 4) E -5
Q a
CNC ' r1C-4 r , C ) C) , 0
s- <*W 0 C-
oz C)).L i - O r z 0 g- ) H'C
__Y__ HC to F
12c :
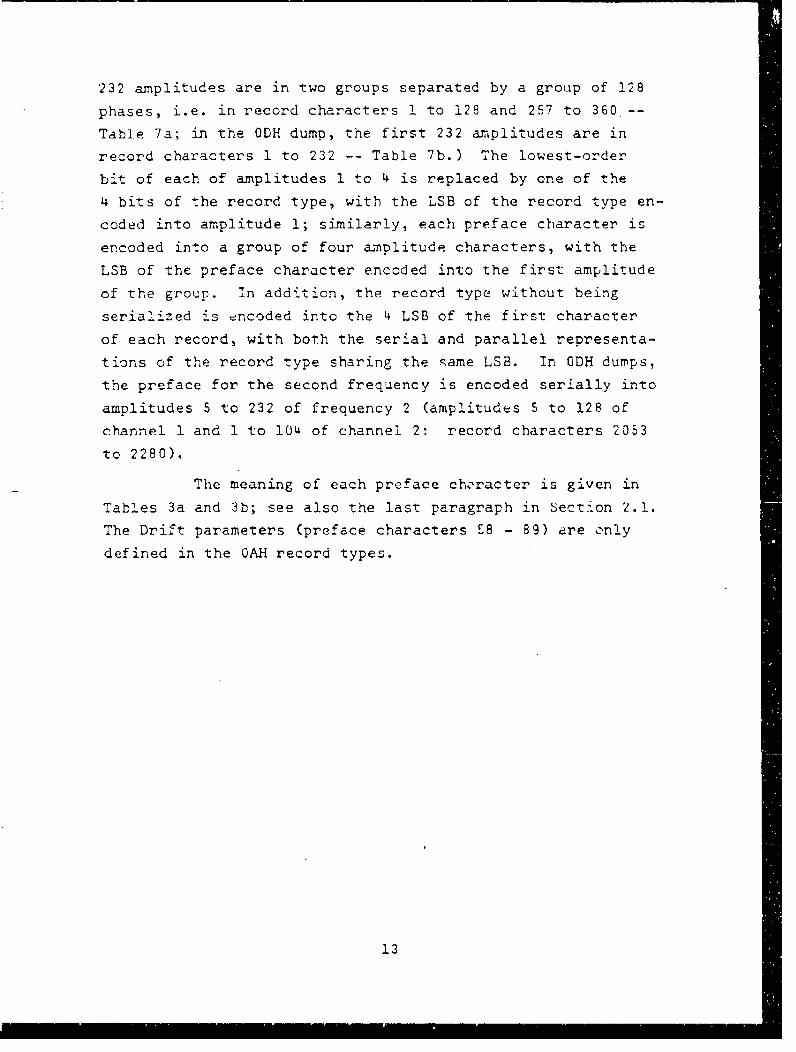
232 amplitudes are in two groups separated by a group of 128
phases, i.e. in record characters 1 to 128 and 257 to 360 --
Table 7a; in the ODH dump, the first 232 amplitudes are in
record characters 1 to 232 -- Table 7b.) The lowest-order
bit of each of amplitudes 1 to 4 is replaced by one of the
4 bits of the record type, with the LSB of the record type en-
coded into amplitude 1; similarly, each preface character is
encoded into a group of four amplitude characters, with the
LSB of the preface character encoded into the first amplitude
of the group. In addition, the record type without being
serialized is encoded into the 4 LSB of the first character
of each record, with both the serial and parallel representa-
tions of the record type sharing the same LSB. In ODH dumps,
the preface for the second frequency is encoded serially into
amplitudes 5 to 232 of frequency 2 (amplitudes 5 to 128 of
channel 1 and 1 to 104 of channel 2: record characters 2053
to 2280).
The meaning of each preface choracter is given in
Tables 3a and 3b; see also the last paragraph in Section 2.1.
The Drift parameters (preface characters £8 - 89) are only
defined in the OAH record types.
13