![[En] Decisional Analytics Solutions - Presentation 2012](https://static.fdocuments.in/doc/165x107/558c7dc6d8b42a7f4c8b4789/en-decisional-analytics-solutions-presentation-2012.jpg)
A decisional space account of saccadic reaction times ... · occur ca. 180ms after the earliest...
27
A decisional space account of saccadic reaction times towards personally familiar faces Meike Ramon*, Nayla Sokhn* & Roberto Caldara Eye and Brain Mapping Laboratory (iBMLab), Department of Psychology, University of Fribourg, Switzerland * Both authors contributed equally to this work Corresponding author: Meike Ramon University of Fribourg Visual and Social Neuroscience Department of Psychology Faucigny 2 1700 Fribourg Switzerland [email protected] +41 26 300 7666 not peer-reviewed) is the author/funder. All rights reserved. No reuse allowed without permission. The copyright holder for this preprint (which was . http://dx.doi.org/10.1101/292656 doi: bioRxiv preprint first posted online Apr. 3, 2018;
Transcript of A decisional space account of saccadic reaction times ... · occur ca. 180ms after the earliest...
A decisional space account of saccadic reaction times towards
personally familiar faces
Meike Ramon*, Nayla Sokhn* & Roberto Caldara
Eye and Brain Mapping Laboratory (iBMLab), Department of Psychology, University of Fribourg,
Switzerland
* Both authors contributed equally to this work
Corresponding author:
Meike Ramon
University of Fribourg
Visual and Social Neuroscience
Department of Psychology
Faucigny 2
1700 Fribourg
Switzerland
+41 26 300 7666
not peer-reviewed) is the author/funder. All rights reserved. No reuse allowed without permission. The copyright holder for this preprint (which was. http://dx.doi.org/10.1101/292656doi: bioRxiv preprint first posted online Apr. 3, 2018;

2
Abstract
Manual and saccadic reaction times (SRTs) have been used to determine the minimum time required
for different types of visual categorizations. Such studies have demonstrated that faces can be
detected within natural scenes within as little as 100ms (Crouzet, Kirchner & Thorpe, 2010), while
increasingly complex decisions require longer processing times (Besson, Barragan-Jason, Thorpe,
Fabre-Thorpe, Puma et al., 2017). Following the notion that facial representations stored in memory
facilitate perceptual processing (Ramon & Gobbini, 2018), a recent study reported 180ms as the
fastest speed at which “familiar face detection” based on expressed choice saccades (Visconti di
Ollegio Castello & Gobbini, 2015). At first glance, these findings seem incompatible with the earliest
neural markers of familiarity reported in electrophysiological studies (Barragan-Jason, Cauchoix &
Barbeau, 2015; Caharel, Ramon & Rossion, 2014; Huang, Wu, Hu, Wang, Ding & Qu et al., 2017),
which should temporally precede any overtly observed behavioral (oculomotor or manual)
categorization. Here, we reason that this apparent discrepancy could be accounted for in terms of
decisional space constraints, which modulate both manual RTs observed for different levels of visual
processing (Besson et al., 2017), as well as saccadic RTs (SRTs) in both healthy observers and
neurological patients (Ramon, in press; Ramon, Sokhn, Lao & Caldara, in press). In the present
study, over 70 observers completed three different SRT experiments in which decisional space was
manipulated through task demands and stimulus probability. Subjects performed a gender
categorization task, or one of two familiar face “recognition” tasks, which differed with respect to the
number of personally familiar identities presented (3 vs. 7). We observe an inverse relationship
between visual categorization proficiency and decisional space. Observers were most accurate for
categorization of gender, which could be achieved in as little as 140ms. Categorization of highly
predictable targets was more error-prone and required an additional ~100ms processing time. Our
findings add to increasing evidence that pre-activation of identity-information can modulate early
visual processing in a top-down manner. They also emphasize the importance of considering
procedural aspects as well as terminology when aiming to characterize cognitive processes.
Keywords
Face processing; visual categorization; minimum saccadic reaction times; personal familiarity; task
demands; stimulus predictability
not peer-reviewed) is the author/funder. All rights reserved. No reuse allowed without permission. The copyright holder for this preprint (which was. http://dx.doi.org/10.1101/292656doi: bioRxiv preprint first posted online Apr. 3, 2018;

3
Introduction
The human visual system can rapidly perform numerous tasks across large variations in stimulus
input, and with extremely high efficiency. For instance, categorization of animals presented in images
of natural scenes presented for as little as 20ms can be reliably achieved in under 300 milliseconds
(ms) (e.g., Thorpe, Fize & Marlot, 1996; Rousselet, Fabre-Thorpe & Thorpe, 2002; Macé, Thorpe,
Fabre-Thorpe, 2005). Among animate objects, human faces appear to have a special status: they
can be rapidly categorized (detected within natural scenes) within as little as 100-110ms (Crouzet,
Kirchner & Thorpe, 2010). Such rapid categorical responses have been used to study the
characteristics of visual processing. Specifically, the time required to perform such accurate visual
categorizations provide a valuable source of information that can be levered to constrain theories of
visual processing (for a review see e.g., Fabre-Thorpe, 2011).
In attempting to maximize the precision estimates of visual processing speed, different
paradigms have been developed (for a direct comparison of paradigms, see Bacon-Macê, Kirchner,
Fabre-Thorpe & Thorpe, 2007). Estimates of visual categorizations have been derived from
verification and naming tasks, which typically involve longer reaction times (RTs) (Tanaka & Taylor,
1991) compared to manual forced choice paradigms, where subjects press (or release) one of two
buttons to distinguish between stimulus categories (e.g., Hasbroucq, Mouret, Seal, & Akamatsu,
1995). To reduce response times, more sensitive Go/no-go paradigms have been developed that
require subjects to respond to a predefined target category by finger-lift from an infra-red sensor
(e.g., Thorpe et al., 1996; VanRullen & Thorpe 2001; Rousselet et al., 2002; Bacon-Macé, Macé,
Fabre-Thorpe & Thorpe, 2005). Finally, other paradigms exploiting the very rapid responses from
oculo-motor, as compared to manual, effectors have been developed to provide a more precise
description of the lower bound of speeded categorizations (Kirchner & Thorpe, 2006; Crouzet,
Joubert, Thorpe & Fabre-Thorpe, 2009; Crouzet et al., 2010). Aside from deriving mean or median
RTs, these paradigms have aimed to determine the (manual or saccadic) minimum reaction time
(minRT). The minRT is defined as the first time-bin for which correct responses significantly
outnumber incorrect ones (Fabre-Thorpe, Richard & Thorpe, 1998; VanRullen & Thorpe, 2001), and
is considered to reflect the minimal processing time required for reliable responses (Rousselet, Macè
& Fabre-Thorpe, 2003).
Visual processing speed of faces is, however, not only determined by the paradigm opted for,
but also depends on the nature of visual categorization performed (Barragan-Jason, Lachat &
Barbeau, 2012), which impacts upon information diagnosticity (Schyns, 1998), as does prior
familiarity (Ramon, Caharel & Rossion, 2011; for a review see Ramon & Gobbini, 2018). For
example, superordinate human vs. animal decisions can be performed manually with high precision
(98%) in as little as 285ms, while famous vs. unfamiliar manual decisions are more error-prone and
slower (75%, 468ms); gender categorization on the other hand can be performed with high fidelity
not peer-reviewed) is the author/funder. All rights reserved. No reuse allowed without permission. The copyright holder for this preprint (which was. http://dx.doi.org/10.1101/292656doi: bioRxiv preprint first posted online Apr. 3, 2018;

4
and intermediate minRTs (94%; ~310ms) (Barragan-Jason et al., 2012). Such findings have led to
the suggestion that visual processing involves initial feed-forward propagation of activity through
occipito-temporal regions (Thorpe et al., 1996), providing coarse magnocellular representations,
which require additional processing and refinement before higher-level categorization can be
achieved (Fabre-Thorpe, Delorme, Marlot & Thorpe, 2001; Macé, Joubert, Nespoulous & Fabre-
Thorpe, 2009; Fabre-Thorpe, 2011). In short, this evidence suggests that face detection (i.e.,
ascertaining the presence or location of a face) occurs before establishing the familiarity of a face.
The idea that face detection precedes familiarity recognition is also supported by a recent
carefully conducted study reported by Besson and colleagues (Besson, Barragan-Jason, Thorpe,
Fabre-Thorpe, Puma et al., 2017). This study involved a Speed and Accuracy Boosting procedure –
a variant of the manual go/no-go paradigm that includes a response deadline and performance
feedback designed to constrain subjects to use their fastest strategy. Using this procedure in
combination with extremely large stimulus sets to avoid image repetitions, the authors reported
manual minRTs that differed as a function of task. Both human (vs. animal) face recognition and
individual face recognition (i.e., searching for a single predefined target identity) were performed in
a highly accurate and extremely fast manner (min RTs: ~240ms and ~260ms). On the other hand,
deciding whether a face belonged to a large pool of famous individuals (“famous face recognition”)
was more error prone and required more time (~380ms), in line with findings from speeded go/no-
go paradigms with personally familiar faces (Ramon et al., 2011). Together these findings support
the idea that 380ms may represent the lower bound for speeded manual familiarity decisions that
occur ca. 180ms after the earliest neural marker of familiarity (e.g., Caharel, Ramon & Rossion,
2014; Barragan-Jason, Cauchoix & Barbeau, 2015; Huang, Wu, Hu, Wang, Ding & Qu et al., 2017).
One recent study seems incompatible with these independent lines of evidence. Measuring
the minimum speed of choice saccades expressed towards personally familiar (PF) faces presented
simultaneously with unfamiliar face (UF) distractors, Visconti di Oleggio Castello and Gobbini (2015)
reported remarkably fast personally familiar face “detection” in 180ms. Naturally, overtly expressed
saccadic behavior would require prior successful neural discrimination. However, the minimum
saccadic reaction times (minSRTs) reported by Visconti di Oleggio Castello and Gobbini (2015)
concur with or precede the earliest familiarity-dependent, differential electrophysiological response
to faces reported to date (~140-200ms; e.g. Caharel et al., 2014; Barragan-Jason et al., 2015).
We reasoned that procedural aspects could account for these apparently discrepant findings.
On the surface, Visconti di Oleggio Castello and Gobbini’s (2015) task seems comparable to the
famous face recognition reported by Besson et al. (2017) and Ramon et al. (2011): all required
categorical, i.e. binomial decisions of familiarity stimuli on a trial-by-trial basis. However, an important
(and in our opinion neglected) aspect concerns the number of stimuli comprising, and thereby
constraining observers decisional space, which can dramatically affect observers categorization
not peer-reviewed) is the author/funder. All rights reserved. No reuse allowed without permission. The copyright holder for this preprint (which was. http://dx.doi.org/10.1101/292656doi: bioRxiv preprint first posted online Apr. 3, 2018;

5
proficiency (Besson et al., 2017; Ramon, Sokhn & Caldara, 2017; Ramon, Sokhn, Lao & Caldara, in
press). A fundamental difference between the aforementioned electrophysiological and behavioral
studies concerns the number of identities based on which observers’ performed their binary
decisions. Visconti di Oleggio Castello and Gobbini’s (2015) group of seven observers performed
choice saccades towards a total of three PF target identities. Despite the several hundreds of
repetitions of each stimulus over the course of their experiment1, their observers accomplished this
task with modest performance accuracy (average: 62%; range: 49-69%), in as little as 180m2. They
concluded that “detectors for diagnostic features associated with overlearned familiar faces” (p.2),
“allow rapid detection that precedes explicit recognition of identity” (p.1). Using a comparable SRT
paradigm, Mathey and colleagues (Mathey, Besson, Barragan-Jason, Garderes, Barbeau & Thorpe
2012) reported even shorter minSRTs of <140ms, along with comparatively higher performance
accuracy (range: 60-75%). Interestingly, their observers performed an “individual face recognition”
task, in which a single famous identity served as the sole target. Based on their findings, the authors
suggested that “information about identity can impact behavior much faster than had been previously
suspected” (p.166).
Thus, both studies involved SRT target search paradigms (Visconti di Oleggio Castello &
Gobbini, 2015; Mathey et al., 2012) and reported extremely rapid (S)RTs executed towards familiar
faces. Comparing the reported results, it is appears that the decrease the number of target items (3
targets vs. 1 target) could account for the observed performance difference (lower vs. higher
accuracy; slower vs. shorter minSRTs), which results from an effective narrowing of observers’
decisional space. Interestingly, both studies draw vastly different conclusions based on their
convergent findings. While Mathey et al. (2012) suggest that “information about identity can impact
behavior much faster than had been previously suspected” (p.166), Visconti di Oleggio Castello and
Gobbini (2015) concluded that “detection […] precedes explicit recognition of identity” (Visconti di
Oleggio Castello & Gobbini, 2015; p.1). In our opinion, the latter conclusion is not warranted, as their
study involved 1-of-3 target search task (cf. Besson et al., 2017; Ramon et al., 2017), which involves
different task demands than a detection task. This stresses the importance of considering procedural
aspects in concert with the appropriateness of the adopted terminology (cf. Ramon, in press).
1 Note that observers responded to different target stimuli (identities personally familiar to one subject served as unfamiliar faces to others), and therefore different visual information. The authors state that “[f]or three subjects one of the target familiar faces had a darker skin color than the other faces. We rejected all the trials containing images of this individual (both as a target and as a distractor) to avoid any bias due to a skin color difference.” (Visconti di Oleggio Castello & Gobbini, 2015; p.5). In our opinion, undesired effects of input-dependent biases cannot be abolished through exclusion of individual responses.
2 To our knowledge, Visconti di Oleggio Castello and Gobbini’s (2015) study is the only one to compute SRTs based on correct responses from all subjects – including those who performed at/near chance level for choice saccades directed towards PF faces (see Table S6, Visconti di Oleggio Castello & Gobbini, 2015). Min(S)RT estimation in the aforementioned studies involved exclusion of data from observers, who were unable to perform the task (e.g. Besson et al., 2017; Ramon et al., 2011; Ramon et al., 2017; Ramon et al., in press).
not peer-reviewed) is the author/funder. All rights reserved. No reuse allowed without permission. The copyright holder for this preprint (which was. http://dx.doi.org/10.1101/292656doi: bioRxiv preprint first posted online Apr. 3, 2018;

6
Expanding on these previous findings, the present study sought to determine the lower
boundary for fast visual categorization of personally familiar faces, and ascertain the effect of
stimulus expectations on processing speed. Observers completed three different experiments
involving binary decisions by performing two alternative forced-choice saccades: a gender
categorization task, as well as two familiarity decision tasks (comparable to those reported
previously; Ramon et al., 2011; Visconti di Oleggigo Castello & Gobbini, 2015; Besson et al., 2017;
Ramon et al., 2017). The latter two tasks differed in terms of the number of personally (un)familiar
identities presented – observers performed a 1-of-n-target search task. This effectively manipulates
observers’ expectation: both familiarity decision tasks differed in that their decisional space was
either comparatively broad or narrow.
We anticipated that performance would be highest and SRTs fastest in the gender
categorization task, which did not require identity individuation, as subjects were instructed to
saccade towards target stimuli belonging to one of two categories (female faces). Although the
familiarity tasks also involved binary decisions (saccades towards PF faces), we anticipated that
performance would depend on the target / distractor category set size used. Specifically, we
expected higher performance and faster SRTs for a narrow decisional space – when target identities
were highly predictable, given a smaller sample of PF faces to detect. In keeping with Besson et al
(2017), but contrary to Visconti di Oleggio Castello and Gobbini (2015), we considered (i) data from
subjects whose performance exceeded chance level exclusively, and (ii) potential effects of stimulus
repetition on RTs that have been reported previously (Lewis & Ellis, 2000; Ramon et al., 2011) during
estimation of processing speed based on SRTs.
To summarize, in this study we varied the probability of targets’ occurrence to determine the
extent to which measured processing speed is influenced by stimulus predictability and repetition.
To anticipate our findings, very rapid minSRTs are observed under conditions of high predictability,
where the search space is confined to a binary, unambiguous category (gender decision task), or a
very small number of target items (familiarity decision with few identities). These findings indicate
that “detection of personal familiarity” per se requires significantly more time than previously
reported, unless “detection” refers to responses towards an extremely restricted number of target
identities (Visconti di Oleggio Castello & Gobbini, 2015), which is terminologically more accurately
described as target identification (Besson et al., 2017).
Methods
Participants
We tested three groups of subjects: the first (n1=8; 4 females, mean age: 31, CI [28, 34]) comprised
group members from the iBMLab; group members were highly familiar with the target identities, who
were their colleagues for several years. The second and third group (n2=36; 31 females, mean age:
not peer-reviewed) is the author/funder. All rights reserved. No reuse allowed without permission. The copyright holder for this preprint (which was. http://dx.doi.org/10.1101/292656doi: bioRxiv preprint first posted online Apr. 3, 2018;

7
21, CI [21, 22]; n3=27; 24 females, mean age: 22, CI [21, 22]) comprised students from the
Department of Psychology who knew the members of Department depicted in the stimulus material
through their teaching and mentoring activities. All participants provided written informed consent;
all procedures were approved by the internal ethics committee of the Department of Psychology at
the University of Fribourg, Switzerland and are in accordance with the Code of Ethics of the World
Medical Association (Declaration of Helsinki).
Stimuli
The full stimulus set comprised natural (uncropped, color) images of 14 facial identities (7 un/familiar)
taken from three different viewpoints (frontal, left, right). For each PF identity, images of a
corresponding unfamiliar identity carefully matched for age, gender, and appearance (hair color and
style, eye color) were taken. Image processing included placement on a uniform grey background
(630 x 630 pixels) and correction for low-level properties (luminance, contrast) using the SHINE
toolbox (Willenbockel, Sadr, Fiset et al., 2010), as well as additional ones kindly provided by V.
Willenbockel to allow for equation of color stimuli.
Procedures
Prior to completing the experiments, subjects completed familiarity ratings to determine their level of
familiarity with each identity (PF and unfamiliar) presented. Each item of the familiarity questionnaire
consisted of an image of each stimulus identity taken under varied, natural conditions. Lab members’
images were taken from professional websites, unfamiliar identities’ images were taken from social
media. Observers had to indicate their self-reported degree of familiarity with each individual on a
scale from 1 (not at all familiar) to 5 (highly familiar). For all experiments stimuli were presented on
a 1920 x 1080 pixel VIEWPixx monitor. Subjects’ oculo-motor behavior was recorded at a sampling
rate of 1000 Hz with an SR Research Desktop-Mount EyeLink 2K eye tracker (with a chin and
forehead rest; average gaze position error ~.5, spatial resolution: ~.01). The eye-tracker had a linear
output over the range of the monitor used. Although viewing was binocular, only the left eye was
tracked; given the fully balanced stimulus presentation across visual fields, inter-individual
differences in ocular dominance were considered irrelevant. The experiment was implemented in
Matlab (R2009b, The MathWorks, Natick, MA), using the Psychophysics toolbox (PTB-3) (Kleiner,
Brainard, & Pelli, 2007; Pelli, 1997) and EyeLink Toolbox extensions (Cornelissen, Peters, & Palmer,
2002; Kleiner et al., 2007). Calibrations of eye fixations were conducted at the beginning of the
experiment using a nine-point fixation procedure as implemented in the EyeLink API (see EyeLink
Manual) and using Matlab software. Afterwards, calibrations were validated with the EyeLink
software and repeated when necessary until reaching an optimal calibration criterion. Drift correction
was performed on each trial via central cross fixation.
not peer-reviewed) is the author/funder. All rights reserved. No reuse allowed without permission. The copyright holder for this preprint (which was. http://dx.doi.org/10.1101/292656doi: bioRxiv preprint first posted online Apr. 3, 2018;
8
In the gender categorization task, subjects were instructed to perform choice saccades
towards female faces. In this task three images (viewpoint changes) for each PF individual (6
identities, 3 females) and their unfamiliar counterparts were presented. A trial began with a central
fixation cross displayed between 800 and 1600ms, followed by a 200ms blank and subsequent
presentation of the target/distractor pair presented for 600ms. After a saccade was registered, the
next trial was presented after a 1000ms blank inter-trial interval. Stimuli subtended 14˚x14° (average
face height was 11°), and stimulus eccentricity was 8.6˚ of visual angle. With all possible
combinations and equal number of presentations per identity and visual field, the total number of
trials was 216; subjects took self-paced breaks after each block of 54 trials.
The two familiarity categorization tasks differed in terms of the number of identities depicted,
but both required observers to perform choice saccades towards personally familiar identities
presented with unfamiliar distractors. The low and high predictability variants involved presentation
of 7 PF (3 females), or 3 PF (all male) identities, respectively, as well as an equal number of well-
matched UF distractors. Presentation parameters were identical to those described for the gender
categorization task (see above). The procedural parameters paralleled those used by Visconti di
Oleggio Castello and Gobbini (2015), with exception of stimulus presentation duration (600ms
instead of 400ms), as initial pilot testing revealed slightly longer presentation durations were
necessary for acceptable performance levels. On each trial, a PF identity was paired with a same-
gender, same-orientation distractor and appeared with equal probability in either visual field. The
total number of trials for the low predictability familiarity categorization task amounted to 150. To
achieve a comparable number of trials in the high predictability variant for comparison with the low
predictability variant, each unique stimulus x visual field combination was presented three times
leading to a total 162 trials over three blocks; these trials / blocks were doubled to further determine
potential effects of repetition in the high predictability categorization task (see Analyses, section iii.).
Subjects took self-paced breaks after each block of 50 or 54 trials (low or high predictability variant),
respectively.
Analyses
Preprocessing
We applied the adaptive velocity based algorithm developped by Nystrom and Holmqvist (2010) to
find the onset of the first saccade (if any) within each trial. We discarded trials in which the onset of
the first saccade was lower than 80 ms (Visconti di Oleggio Castello & Gobbini, 2015), as these were
considered anticipatory saccades.
not peer-reviewed) is the author/funder. All rights reserved. No reuse allowed without permission. The copyright holder for this preprint (which was. http://dx.doi.org/10.1101/292656doi: bioRxiv preprint first posted online Apr. 3, 2018;

9
Statistical analyses
As mentioned above, across all experiments we considered only data from subjects whose
performance exceeded chance level. For the gender categorization task this led to exclusion of one
departmental member (n1=7/8); all student participants performed above chance and were
considered (n2=36/36). For the familiarity categorization tasks, only data from subjects who
performed reliably across both low and high predictability variants were considered (n1=4/8,
n3=14/27). Analyses performed to determine the effect of stimulus repetition were conducted on data
from subjects who performed above chance across all blocks of the high predictability familiarity
categorization task (n1=7/8, n3=20/27). Analyses of accuracy and mean SRTs were performed in R
(version 3.2.4; R Core Team, 2013) using the lme4 package (Bates, Maechler, Bolker & Walker,
2014) and the lmerTest (Kuznetsova, Brockhoff & Christensen, 2015) to obtain p-values of the fixed
predictors of the fitted models. Note that given our research question, we were not interested in
between-group differences, but rather those related to stimulus predictability, i.e. those observed
within groups.
i. Gender categorization
Accuracy, mean and minSRTs are reported descriptively for the gender categorization task for all
participants (n1, n2), as this task served only as a baseline to demonstrate subjects’ ability to perform
the SRT task.
ii. Personal familiarity categorization: low vs. high stimulus predictability
Accuracy. To investigate the effect of stimulus predictability on subjects’ accuracy, we performed
generalized linear mixed models with a binomial family (Jaeger, 2008) for the data obtained in the
experiments characterized by lower (7 identities), or higher stimulus predictability (3 identities),
respectively. This was done separately per group tested given the unequal sample sizes available.
In this model, the main predictor is the variable ‘predictability’ (low and high for larger and smaller
number of identities presented) and the variable participant is a random factor. We performed the
Log-likelihood Ratio Test to compare the null and full model, and assess the significance of the
predictor.
Mean SRTs. To investigate the effect of stimulus predictability on SRTs, we performed a linear mixed
model for the data obtained in the experiments characterized by lower (7 identities), or higher
stimulus predictability (3 identities), respectively, considering only the correct trials.3 In this model,
the main predictor is the variable ‘predictability’ and the variable participant is a random factor. As
3 To account for the different number of trials across experiments, note that we considered all trials (150) from the low, and those of first 3 blocks (162) for the low and high predictability variants of the familiarity categorization tasks.
not peer-reviewed) is the author/funder. All rights reserved. No reuse allowed without permission. The copyright holder for this preprint (which was. http://dx.doi.org/10.1101/292656doi: bioRxiv preprint first posted online Apr. 3, 2018;
10
for accuracy scores, we performed the Log-likelihood Ratio Test to compare the null and full model,
and assess the significance of the predictor.
Minimum SRTs. We estimated minSRTs in two different ways4. First, across subjects’ trials (i.e.,
group minSRTs), we performed a chi-square test using 10ms time bins across trials. We considered
the first bin where the number of correct trials outperforms statistically the number of incorrect trials
(p<.05), followed by at least 3 significant consecutive bins (Besson et al. 2017). Second, we
determined individuals’ minSRTs. To this end, following the procedure reported by Besson et al.
(2017), we (i) considered only RTs of participants who performed above chance level, and (ii) opted
for 40ms time bins using the Fisher’s exact test (p<.05). Using this procedure, some participants’
individual minSRT could not be computed (due to proximal in/correct trial distributions). Finally, we
assessed the effect of stimulus set size for individual subjects of n3 using the Wilcoxon signed-rank
test (p<.05). Note that the comparison of minSRTs as a function of stimulus set size was not
conducted for n1 due to the insufficient statistical power, as only four participants’ data were
considered.
iii. Effect of stimulus repetition under conditions of high stimulus predictability
To determine the effect of stimulus repetition, we used the above described procedure for all
behavioral measures, however, taking into account all correct trials (from all 6 blocks of the high
predictability familiarity categorization experiment; cf. above). We compared RT associated with the
first presentation of a stimulus with each subsequent presentation.
Results
Table 1 summarizes the results obtained for all subjects for gender categorization, and personally
familiar face recognition under low and high predictability conditions, respectively. Individual
subjects’ data are reported in Table S 1 and Table S 2; Figure 1 shows individuals’ minSRTs plotted
against accuracy scores across all experiments.
4 Here, as for mean SRTs, only the first 3 blocks were considered.
not peer-reviewed) is the author/funder. All rights reserved. No reuse allowed without permission. The copyright holder for this preprint (which was. http://dx.doi.org/10.1101/292656doi: bioRxiv preprint first posted online Apr. 3, 2018;

11
Table 1. Accuracy (in %) and minimum saccadic reaction times (in ms) obtained across experiments for all subjects tested, whose performance was above chance level
Gender categorization
Department
members (n1) Students (n2)
Accuracy 81 [71, 90] 84 [81, 86]
minSRT 200ms 140ms
Mean SRT 276 252
Median SRT 262 236
CI [272, 281] [251, 254]
Personal familiarity categorization
Department
members (n1) Students (n3)
Low predictability
Accuracy 74 [64, 81] 68 [64, 72]
minSRT 360 260
Mean SRT 373 334
Median SRT 390 334
CI [370, 388] [331, 340]
High predictability
Accuracy 82 [74, 89] 76 [71, 79]
minSRT 260 240
Mean SRT 345 345
Median SRT 353 339
CI [343, 357] [343, 350]
95% confidence intervals are provided in brackets.
Figure 1. Individual subjects’ minSRTs plotted against performance accuracy. Note that for 3 student subjects minSRTs could not be computed (cf. Table S 2).
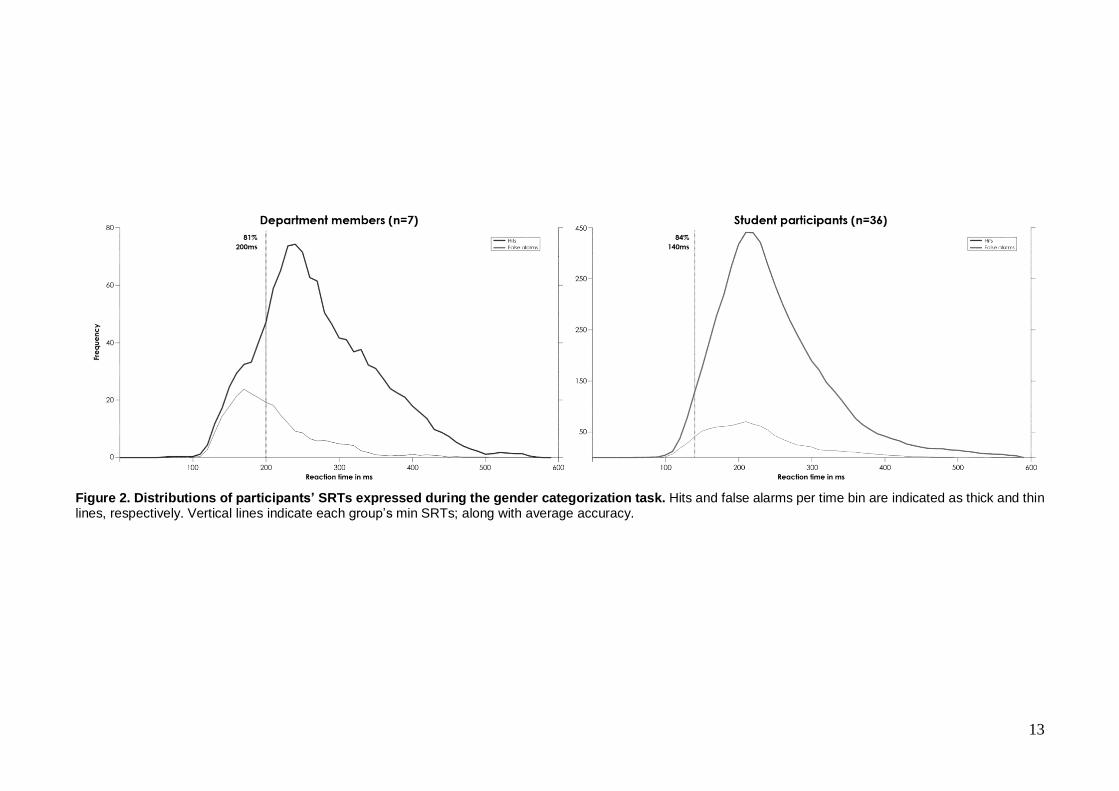
i. Gender categorization
Both departmental members and student participants could reliably perform the gender
categorization task, achieving 81% and 84% on average, and exhibiting minimum SRTs of 200ms
and 140ms, respectively (see Figure 2).
not peer-reviewed) is the author/funder. All rights reserved. No reuse allowed without permission. The copyright holder for this preprint (which was. http://dx.doi.org/10.1101/292656doi: bioRxiv preprint first posted online Apr. 3, 2018;
12
ii. Personal familiarity categorization: lower vs. higher stimulus predictability
Accuracy. The groups’ SRT distributions for the low and high predictability familiarity categorization
tasks are illustrated in Figure 3. For departmental members’ accuracy scores, the fitted model
(considering the total of 1248 trials) revealed a significant main effect of stimulus set size (i.e.,
number of identities depicted; X2(1)=13.73, p=.0002); performance given 7 target identities was
significantly lower than when 3 target identities were presented (74% vs. 82%; z=3.69, p=0.0002).
For students’ accuracy scores, the results from the fitted model (based on a total of 4361 trials) also
showed a significant main effect of stimulus set size X2(1)=33.53, p<.0001); again, performance for
the lower as compared to higher predictability task variant was significantly lower (68% vs. 76%;
z=5.78, p<.0001). For parameter estimates of the fixed effects for the generalized linear mixed model
with the binomial family for each group tested see Table S 3.
Mean SRTs. For departmental members’ SRTs the fitted model (considering the total of 967 trials)
revealed a significant main effect of stimulus set size (X2 (1)=29.70, p<.0001). Mean (373 vs 345;
t=-5.49, p<.0001). For students’ SRTs the results from the fitted model (based on a total of 3142
trials) showed a significant main effect of stimulus set size (X2(1)=14.67, p=.0001). Contrary to the
departmental members, the mean of RTs in Experiment 1 was significantly faster than in Experiment
2 (334 vs 345; t=3.83, p=.0001). For parameter estimates of the fixed effects for the Linear Mixed
Model for each group tested see Table S 3.
not peer-reviewed) is the author/funder. All rights reserved. No reuse allowed without permission. The copyright holder for this preprint (which was. http://dx.doi.org/10.1101/292656doi: bioRxiv preprint first posted online Apr. 3, 2018;
13
Figure 2. Distributions of participants’ SRTs expressed during the gender categorization task. Hits and false alarms per time bin are indicated as thick and thin lines, respectively. Vertical lines indicate each group’s min SRTs; along with average accuracy.
not peer-reviewed) is the author/funder. All rights reserved. No reuse allowed without permission. The copyright holder for this preprint (which was. http://dx.doi.org/10.1101/292656doi: bioRxiv preprint first posted online Apr. 3, 2018;

14
Figure 3. Distributions of participants’ SRTs expressed during the personal familiarity categorization task with low (blue) and high (red) predictability. Hits and false alarms per time bin are indicated as thick and thin lines, respectively.
not peer-reviewed) is the author/funder. All rights reserved. No reuse allowed without permission. The copyright holder for this preprint (which was. http://dx.doi.org/10.1101/292656doi: bioRxiv preprint first posted online Apr. 3, 2018;

15
MinSRTs. The Wilcoxon rank sum test revealed no main effect of stimulus set size on the individual
minSRTS (see Table S 2) for student participants in n3 (p=.11).
iii. Effect of stimulus repetition under conditions of high stimulus predictability
Accuracy. The fitted model (considering the total of 1944 trials) revealed no significant effect of
repetition on subjects accuracy scores for n1 (X2(5)=2.14, p=.83). However a significant main effect
of repetition was shown for n2 (X2(5)=16.22, p<.05; based on 6480 trials in total). Performance in the
first image presentation (73%) was significantly lower than for the fourth image presentation (z=2.61,
p<.05) and the fifth image presentation (z=3.38, p<.001) with a performance of 78% and 79%,
respectively (see Table 2). For parameter estimates of the fixed effects for the generalized linear
mixed model with the binomial family for each group tested see Table S 5.
Mean SRTs. The fitted model revealed a significant effect of repetition on mean RTs for n1
(X2(5)=32.18, p<.0001) and n2 (X2(5)=126, p<.0001) (based on a total 1411 and 4834 trials,
respectively). Both groups were slower in the first image presentation compared to the five other
image presentations (see Table 2). For parameter estimates of the fixed effects for the Linear Mixed
Model for each group tested see Table S 6.
Table 2. Accuracy, mean and min SRTs for choice saccades towards personally familiar faces as a function of stimulus repetition in Experiment 2 (personal familiarity categorization with high predictability).
Department members (n1) Students (n2)
Block Accuracy in %
Mean SRTs
CI minSRTs Accuracy in %
Mean SRTs
CI minSRTs
1st
2nd
3rd
4th
5th
6th
77 78 75 76 74 74
331 307 306 293 310 306
[277; 386] [239; 375] [238; 375] [225; 361] [241; 379] [237; 374]
250 300 340 290 260 290
73 74 76 78 79 74
350 330 326 312 318 319
[325; 374] [298;361] [294;357] [280;343] [286;350] [287;351]
280 260 240 220 220 240
Note that per block each stimulus was shown 3 times.
Discussion
Previous work has demonstrated that the primate brain can visually categorize faces and animals in
a highly proficient and rapid manner (e.g. Thorpe et al., 1996; Rousselet et al., 2003; Crouzet et al.,
2010; Fabre-Thorpe, 2011; Kirchner & Thorpe, 2006). Visual categorization paradigms, which are
considered to involve activation of representations that impact observers’ responses in terms of
maximal “presetting” of the visual system for the task at hand (Thorpe et al., 2001), have been
deployed to constrain theories of visual processing (for a review see e.g., Fabre-Thorpe, 2011),
focusing on the role of stimulus category and information on visual processing.
One body of studies has honed in on visual categorization of a single stimulus category:
faces. Independent lines of research have reported that both level of processing (e.g., Besson et al.,
not peer-reviewed) is the author/funder. All rights reserved. No reuse allowed without permission. The copyright holder for this preprint (which was. http://dx.doi.org/10.1101/292656doi: bioRxiv preprint first posted online Apr. 3, 2018;

16
2017; Barragan-Jason et al., 2012), as well as stimulus familiarity (e.g., Visconti di Oleggio Castello
& Gobbini, 2015; Ramon et al., 2011; Ramon & Gobbini, 2018) can affect overtly observed face
processing proficiency. Besson et al. (2017) reported that manual minRTs increased systematically
as a function of task performed, with higher proficiency exhibited for human face (vs. animal)
categorization (~240ms) and search for a predefined target identity (“individual face recognition”,
~260ms). Famous face recognition on the other hand, i.e. deciding whether a given identity of many
possible ones was famous or not, took substantially longer (~380ms). Collectively, these findings
suggest that detecting the presence of a face precedes determining its familiarity, or identity (Besson
et al., 2017; Barragan-Jason et al., 2012).
Other behavioral findings, however, challenge this view. Visconti di Oleggio Castello and
Gobbini (2015) recently reported that observers could perform SRTs towards personally familiar
faces in as little as 180ms; even faster SRTs to famous face images were reported by Mathey et al.
(2014; <140ms). Based on their findings, Visconti di Oleggio Castello and Gobbini (2015) suggested
that processing of familiarity is rapidly detected at this latency, “prior to explicit recognition of identity”.
This notion is incompatible with the earliest reported neural markers of familiarity recognition
(>170ms; Barragan-Jason et al., 2015; Caharel et al., 2014; Huang et al., 2017).
In the present study we reasoned that these apparently conflicting findings can be reconciled
by careful consideration of the effect that both task demands and expectations exert on visual
categorization, as well as the terminology adopted to communicate findings (Ramon, in press).
Specifically, we proposed that procedural aspects effectively constrain the decisional space within
which observers perform a task, which in turn determines measured behavior (Ramon, in press;
Ramon et al., in press; see also Ramon & Rossion, 2010; Ramon, Busigny, Gosselin & Rossion,
2017; Ruffieux, Ramon, Lao, Colombo, Stacchi et al., 2017). To test this assumption, we measured
observers’ saccadic RTs across three experiments. Each experiment required observers to perform
binary decisions, expressed through choice saccades towards a predefined target category. These
target categories varied across tasks: female faces in the gender decision task, personally familiar
face in the familiarity decision tasks. Importantly, we deployed two familiarity decision tasks, which
differed in terms of the total number of possible target identities (3 vs. 7), thereby manipulating
stimulus predictability, and hence breadth of decisional space. Importantly, all observers were
presented the exact same target identities (i.e., stimuli considered as PF and UF faces), and we
determined potential effects of stimulus repetition on processing speed.
The findings obtained for the gender categorization task reveal that visual processing can be
extremely efficient and fast when operating within a narrow decisional space. Student participants
exhibited high performance accuracy (84%) and very rapid minSRTs when performing choice
saccades towards female faces (~140ms). Department members exhibited slightly lower accuracy
(81%) and somewhat longer minSRTs (200ms), which we attribute to the smaller hit-to-false alarm
not peer-reviewed) is the author/funder. All rights reserved. No reuse allowed without permission. The copyright holder for this preprint (which was. http://dx.doi.org/10.1101/292656doi: bioRxiv preprint first posted online Apr. 3, 2018;
17
ratio given the smaller sample size (6 vs. 36 participants) and hence number of data points available
. In the context of familiarity categorization tasks, we found that participants’ performance was
modulated by the number of PF identities presented. Accuracy increased and RTs decreased with
fewer target identities presented (7 vs. 3 PF identities), and high target predictability was associated
with minSRTs of ~250ms.
Reconciling discrepancies in minSRTs reported for personally familiar face categorization
We believe that procedural differences may at least partially account for the difference in minSRTs
for familiarity decisions observed here and elsewhere (180ms; Visconti di Oleggio Castello &
Gobbini, 2015). First, following others’ adopted procedures (e.g., Besson et al., 2017; Ramon et al.,
2011; Ramon et al., 2017b; Ramon et al., in press) we included only data of subjects who exhibited
reliably high performance, as opposed to also including correct trials from individuals who were at or
near chance level (cf. Visconti di Oleggio Castello & Gobbini, 2015). Although we did not find a
systematic relationship between accuracy and minSRTs among the subjects considered for our
analyses (see Figure 1), we note that lab members’ RTs decreased by 100ms between the low and
high predictability familiarity decision experiments. In comparison, students achieved lower accuracy
in general (68% and 76%) relative to lab members (73% and 82%), and across tasks did not exhibit
the decrease in minSRTs observed for lab members. That is, students performed at maximum speed
during the low predictability experiment, but could increase their performance accuracy due to a
narrowing of the decisional space given less target identities. Regardless of whether groups differed
regarding which behavioral measure improved by predictability, we believe that the comparable
minSRTs exhibited across groups (lab members: 260ms, students: 240ms) reveals the fastest
processing speed for a 1-of-three target identity categorization scenario when estimates are based
on highly reliable performance.
Moreover, in our study PF and UF stimuli were identical to all subjects (cf. e.g., Besson et al.,
2017; Mathey et al., 2012; Ramon et al., 2011; Ramon et al., 2017a, b; Caharel et al., 2015). This is
fundamentally different from Visconti di Oleggio Castello and Gobbini’s (2015) study, in which one
subjects’ PF stimuli served as UF stimuli for another. We suggest that the rapid minSRTs of 180ms
these authors reported are thus more likely to reflect effective top-down “presetting” towards
diagnostic features of specific images, which can lead to a significant decrease in minSRTs
(Delorme, Rousselet, Macé & Fabre-Thorpe, 2004). Therefore, we suggest that not necessarily the
number of distractor items, but rather the overall number of potential targets to verify determines
visual processing speed in familiarity decisions.
The repetition effects reported here and elsewhere using stimulus set sizes ranging from one
famous (Lewis & Ellis, 2000), to 27 PF identities (Ramon et al., 2011) lend further support to the idea
that RTs decrease due to activation of image features; previously observed task-learning effects (cf.
not peer-reviewed) is the author/funder. All rights reserved. No reuse allowed without permission. The copyright holder for this preprint (which was. http://dx.doi.org/10.1101/292656doi: bioRxiv preprint first posted online Apr. 3, 2018;

18
Visconti di Oleggio Castello & Gobbini, 2015) can also further contribute to a systematic decrease
in recorded RTs. Additional support for this claim stems from SRT differences between studies that
have both employed time sensitive go/no-go paradigms. Ramon et al. (2011) reported minSRTs and
mean SRTs of 380ms and 510ms. We attribute the shorter manual response latencies compared to
those reported by Barragon-Jason et al. (2012: 467ms and 581ms; 2015: 460ms and 635ms) to the
difference in stimulus set size and hence target predictability. Collectively, our findings stress the
importance of considering the task’s decisional space and stimulus repetition, as both significantly
affect the speed of familiarity categorizations.
A formal framework of saccadic reaction times to face stimuli
In the present study, we focused on the impact of stimulus probability, or decisional space, and
stimulus repetition as determinants of subjects’ minimum processing speed during visual
categorization. However, an additional factor which can further modulate expressed behavior, which
we did not systematically control here, is visual information. This point can be demonstrated by
considering for example visual categorization of facial expression. Similar to the present study, the
number of categories (i.e. facial expressions) presented will determine the breadth of decisional
space, and thus likely modulate subjects’ performance. Moreover, however, the type of information
based on which categorical decisions are performed will also play an important role. Inclusion of
facial expressions that are more likely confused by subjects (e.g., Jack, Blais C, Scheepers, Schyns
& Caldara, 2009; Jack, Garrod, Yu, Caldara & Schyns, 2012; Rodger, Vizioli, Ouyang & Caldara,
2015) will lead to an increase in task difficulty and hence decrease in accuracy and/or delayed RTs.
Beyond the objectively available visual information, inter-individual anatomical differences that
may affect information processing efficiency would also require consideration. One could speculate
that anatomical differences in early visual cortices (cortical thickness, surface area) reported to affect
perceptual discrimination and mental imagery (Bergmann, Genc, Kohler, Singer & Pearson, 2016;
Song, Schwarzkopf, Kanai & Rees, 2015) may affect processing of the parafoveally presented visual
information subject to categorical responses in SRT paradigms. A comprehensive account of
processing speed based on which a predictive model of saccadic choices for a particular task can
be elaborated will require consideration of stimulus probability, as well as visual information and
anatomically constrained information processing proficiency.
Implications beyond visual categorization measured behaviorally: neuroimaging of face
recognition
We suggest that effects of stimulus predictability may also account for seemingly contradictory
neuroimaging findings reported previously. Electrophysiological studies determining the influence of
familiarity have consistently reported familiarity-dependent modulation of later (>400ms)
components, while effects on earlier (<200ms) components are more variable (for reviews see
not peer-reviewed) is the author/funder. All rights reserved. No reuse allowed without permission. The copyright holder for this preprint (which was. http://dx.doi.org/10.1101/292656doi: bioRxiv preprint first posted online Apr. 3, 2018;
19
Huang, et al., 2017; Ramon & Gobbini, 2018). For example, some studies suggest that the N170 /
M170 – the earliest face-sensitive component electrical signal recorded from the scalp (Bentin &
Deouell, 2000; Eimer, 2000) is sensitive to familiarity and task (Rossion et al., 1999) –. These studies
have, however, reported enhanced (Caharel, Courtay, Bernard, Lalonde & Rebai, 2005; Caharel,
Fiori, Bernard, Lalonde & Rebai, 2006; Kloth, Dobel, Schweinberger, Zwitserlood, Bolte et al., 2006;
Wild-Wall, Dimigen & Sommer, 2008), as well as decreased N170 amplitude (Todd, Lewis, Meusel
& Zelazo, 2008). Of note is that active, identity-related tasks generally lead to modulation of early
components, compared to passive viewing or orthogonal tasks, for which later familiarity effects have
been more consistently reported (Huang et al., 2017; Taylor, Shezad & McCarthy, 2016).
As reviewed by Ramon and Gobbini (2018), whether or not familiarity modulation can be found
for early electrophysiological components may depend on pre-activation of associative knowledge.
Studies reporting early modulation for PF faces have in common that participants usually know in
advance the identities presented (e.g. Caharel et al., 2014). Similarly, studies reporting early
modulation for famous faces often involve stimulus selection based on subjects’ previously assessed
level of familiarity with various famous individuals (Huang et al., 2017). Lastly, studies using
experimentally learned faces have also reported familiarity-dependent modulation of early
components (Taylor et al., 2016). In all of these studies pre-activation of identity information can be
regarded as defining the decisional space from which to-be-presented identities are drawn. Based
on our findings, and reports of expectation-related N170 modulation (e.g. Johnston, Overell,
Kaufman, Robinson & Young, 2016), we hypothesize that the likelihood of observing familiarity-
dependent modulation of early electrophysiological components, and neural responses measured
with functional magnetic neuroimaging (Ramon & Gobbini, 2018), will increase with predictability of
familiar exemplars presented.
Conclusions
Based on the present and previous findings we emphasize the importance of adopting a terminology
that takes into consideration more than merely the stimulus being processed. The process involved,
which depends on the opted-for paradigm, crucially impacts processing speed (cf. Besson et al.,
2017). For instance, the term “face recognition” or “detection” is oftentimes used across a range of
tasks and without sufficient consideration of differences in specific procedures implemented, leading
to at times seemingly contradictory conclusions (Besson et al., 2017; Ramon, in press). Our findings
that target predictability and repetition affect processing speed in binary forced-choice paradigms
emphasize the importance of simultaneously considering task constraints and procedural aspects
when attempting to determine processing speed to constrain theories of visual processing. At the
very least we suggest that previous findings of SRT modulation attributed to personal familiarity
should be revisited: the minSRTs reported by Visconti di Oleggio Castello and Gobbini (2015) do not
reflect facilitated familiar face detection per se, but rather demonstrate how powerful top-down
not peer-reviewed) is the author/funder. All rights reserved. No reuse allowed without permission. The copyright holder for this preprint (which was. http://dx.doi.org/10.1101/292656doi: bioRxiv preprint first posted online Apr. 3, 2018;

20
predictions can expedite rapid visual orienting towards specific, expected images. These findings
also provide a basis to account for seemingly contradicting findings regarding familiarity-related
modulation of responses to faces recorded with neuroimaging techniques, which are likely affected
by the operational decisional space and “presetting” due to subjects’ expectations.
Acknowledgements
We thank our previous Bachelor students Nour Al-Khodairy, Morgane Bulliard, Aurelie Christinaz,
and Lysiane Constantin for their invaluable help during data collection.
References
Bacon-Macé N, Kirchner H, Fabre-Thorpe M, Thorpe SJ (2007). Effects of task requirements on rapid natural scene
processing: from common sensory encoding to distinct decisional mechanisms. J Exp Psychol Hum Percept
Perform, 33(5), 1013-26.
Bacon-Macé N, Macé MJ, Fabre-Thorpe M & Thorpe SJ (2005). The time course of visual processing: backward
masking and natural scene categorisation. Vision Res, 45(11), 1459-69.
Barragan-Jason G, Cauchoix M, Barbeau EJ (2015). The neural speed of familiar face recognition.
Neuropsychologia, 75:390-401.
Barragan-Jason G, Lachat F & Barbeau EJ (2012). How Fast is Famous Face Recognition? Front Psychol, 3:454.
doi: 10.3389/fpsyg.2012.00454.
Bates D, Maechler M, Bolker B & Walker S (2014). lme4: Linear mixed-effects models using Eigen and S4. R
package version 1.0-6. http://CRAN.R-project.org/package=lme4
Bentin S & Deouell LY (2000). Structural encoding and identification in face processing: erp evidence for separate
mechanisms. Cogn Neuropsychol, 17, 35-55.
Bergmann J, Genç E, Kohler A, Singer W & Pearson J (2016). Smaller Primary Visual Cortex Is Associated with
Stronger, but Less Precise Mental Imagery. Cereb Cortex, 26, 3838-50. doi: 10.1093/cercor/bhv186.
Besson G, Barragan-Jason G, Thorpe SJ, Fabre-Thorpe M, Puma S, Ceccaldi M, Barbeau EJ (2017). From face
processing to face recognition: Comparing three different processing levels. Cognition, 158, 33-43. doi:
10.1016/j.cognition.2016.10.004.
Caharel S, Courtay N, Bernard C, Lalonde R & Rebai M (2005). Familiarity and emotional expression influence an
early stage of face processing: an electrophysiological study. Brain Cogn, 59, 96-100.
doi:10.1016/j.bandc.2005.05.005
Caharel S, Fiori N, Bernard C, Lalonde R & Rebai M (2006). The effects of inversion and eye displacements of
familiar and unknown faces on early and late-stage ERPs. Int J Psychophysiol, 62, 141-51.
not peer-reviewed) is the author/funder. All rights reserved. No reuse allowed without permission. The copyright holder for this preprint (which was. http://dx.doi.org/10.1101/292656doi: bioRxiv preprint first posted online Apr. 3, 2018;

21
Caharel S, Ramon M & Rossion B (2014). Face familiarity decisions take 200 msec in the human brain:
electrophysiological evidence from a go/no-go speeded task. J Cogn Neurosci, 26(1), 81-95. doi:
10.1162/jocn_a_00451
Cornelissen FW, Peters EM & Palmer J. (2002). The Eyelink Toolbox: Eye tracking with MATLAB and the
Psychophysics Toolbox. Behavior Research Methods, Instruments, & Computers, 34(4), 613–7,
doi.org/10.3758/BF03195489.
Crouzet SM, Joubert OR, Thorpe SJ & Fabre-Thorpe M (2009). The bear before the forest, but the city before the
cars: revealing early object/ background processing. J Vis, 9, 954.
Crouzet, S. M., Kirchner, H., and Thorpe, S. J. (2010). Fast saccades towards faces: face detection in just 100 ms.
J Vis, 10, 16.1–17.
Delorme A, Rousselet GA, Macé MJ, Fabre-Thorpe M (2004). Interaction of top-down and bottom-up processing in
the fast visual analysis of natural scenes. Brain Res Cogn Brain Res, 19, 103-13.
Eimer M (2000). Event-related brain potentials distinguish processing stages involved in face perception and
recognition. Clin Neurophysiol, 111, 694-705.
Fabre-Thorpe M (2011). The characteristics and limits of rapid visual categorization. Front Psychol, 2:243. doi:
10.3389/fpsyg.2011.00243.
Fabre-Thorpe M, Delorme A, Marlot, C & Thorpe SJ (2001). A limit to the speed of processing in ultra- rapid visual
categorisation of novel natural scenes. J Cogn Neurosci, 13, 171–180.
Fabre-Thorpe M, Richard G & Thorpe SJ (1998). Rapid categorization of natural images by rhesus monkeys.
Neuroreport 9, 303–308.
Hasbroucq T, Mouret I, Seal J & Akamatsu M (1995). Finger Pairings in Two-Choice Reaction Time Taskscolon:
Does the Between-Hands Advantage Reflect Response Preparation? J Mot Behav, 27(3), 251-262.
Huang W, Wu X, Hu L, Wang L, Ding Y & Qu Z (2017). Revisiting the earliest electrophysiological correlate of familiar
face recognition. Int J Psychophysiol, 120:42-53.
Jack RE, Blais C, Scheepers C, Schyns PG & Caldara R (2009). Cultural confusions show that facial expressions
are not universal. Curr Biol, 19:1543-8. doi: 10.1016/j.cub.2009.07.051.
Jack RE, Garrod OG, Yu H, Caldara R & Schyns PG (2012). Facial expressions of emotion are not culturally
universal. Proc Natl Acad Sci U S A, 109:7241-4. doi: 10.1073/pnas.1200155109.
Jaeger TF (2008). Categorical data analysis: Away from ANOVAs (transformation or not) and towards logit mixed
models. Journal of memory and language, 59(4), 434-46.
Johnston P, Overell A, Kaufman J, Robinson J & Young AW (2016). Expectations about person identity modulate
the face-sensitive N170. Cortex, 85, 54-64. doi: 10.1016/j.cortex.2016.10.002.
not peer-reviewed) is the author/funder. All rights reserved. No reuse allowed without permission. The copyright holder for this preprint (which was. http://dx.doi.org/10.1101/292656doi: bioRxiv preprint first posted online Apr. 3, 2018;

22
Kirchner H & Thorpe SJ (2006). Ultra-rapid object detection with saccadic eye movements: visual processing speed
revisited. Vision Res, 46, 1762–1776.
Kleiner M, Brainard D & Pelli D (2007). What’s new in Psychtoolbox-3? Perception, 36 (ECVP Abstract Supplement),
doi.org/10.1068/v070821
Kloth N, Dobel C, Schweinberger SR, Zwitserlood P, Bolte J & Junghofer M (2006). Effects of personal familiarity
on early neuromagnetic correlates of face perception. Eur J Neurosci, 24, 3317-21. doi:10.1111/j.1460-
9568.2006.05211.x
Kuznetsova A, Brockhoff PB & Christensen RHB (2015). Package ‘lmerTest’. R package version, 2(0).
Lewis MB & Ellis HD (2000). The effects of massive repetition on speeded recognition of faces. Q J Exp Psychol A,
53, 1117-42.
Macé M J-M, Thorpe SJ & Fabre-Thorpe M (2005). Rapid categorization of achromatic natural scenes: how robust
at very low contrasts? Eur J Neurosci, 21, 2007–2018.
Mace, M J-M, Joubert OR, Nespoulous J-L & Fabre- Thorpe M (2009). Time-course of visual categorizations: you
spot the animal faster than the bird. PLoS ONE 4, e5927. doi:10.1371/journal.pone.0005927
Mathey MA, Besson G, Barragan-Jason G, Garderes P, Barbeau EJ & Thorpe SJ (2012). Sarkozy: left or right? How
early can we choose? Perception ECVP Abstract Supplement, 41, 166.
Nyström M & Holmqvist K (2010). An adaptive algorithm for fixation, saccade, and glissade detection in eyetracking
data. Behavior Research Methods, 42(1): 188-204. doi:0.3758/BRM.42.1.188.
R Core Team (2013). R: A language and environment for statistical computing. R Foundation for Statistical
Computing, Vienna, Austria. Available: http://www.R-project.org/.
Ramon M & Gobbini MI (2018). Familiarity matters: A review of prioritized processing of personally familiar faces.
Visual Cognition, 26, 179-95.
Ramon M & Rossion B (2010). Impaired processing of relative distances between features and of the eye region in
acquired prosopagnosia—Two sides of the same holistic coin? Cortex, 46(3), 374-389.
Ramon M (in press). The power of how – lessons learned from neuropschology and face processing. Cognitive
Neuropsychology.
Ramon M*, Sokhn N*, Lao J & Caldara R (in press). Decisional space determines saccadic reaction times in healthy
observers and acquired prosopagnosia. Cognitive Neuropsychology
Ramon M, Busigny T, Gosselin G & Rossion B (2017). All new kids on the block? Impaired holistic processing of
personally familiar faces in a kindergarten teacher with acquired prosopagnosia. Visual Cognition, 24, 321-55.
http://dx.doi.org/10.1080/13506285.2016.1273985
not peer-reviewed) is the author/funder. All rights reserved. No reuse allowed without permission. The copyright holder for this preprint (which was. http://dx.doi.org/10.1101/292656doi: bioRxiv preprint first posted online Apr. 3, 2018;

23
Ramon M, Caharel S & Rossion B (2011). The speed of recognition of personally familiar faces. Perception, 40(4),
437-49.
Ramon M, Sokhn N & Caldara R (2017). Top-down effects modulate rapid saccadic reaction times to personally
familiar faces. Talk presented at the European Conference on Visual Perception 2017, Berlin, Germany. Retrieved
from URL: http://journals.sagepub.com/page/pec/collections/ecvp-abstracts/index/ecvp-2017.
Rodger H, Vizioli L, Ouyang X & Caldara R (2015). Mapping the Development of Facial Expression Recognition.
Developmental Science, 18, 926-39.
Rossion B, Campanella S, Gomez CM, Delinte A, Debatisse D, Liard L, Guerit JM (1999). Task modulation of brain
activity related to familiar and unfamiliar face processing: an ERP study. Clin Neurophysiol, 110, 449-62.
Rousselet GA, Fabre-Thorpe M & Thorpe SJ (2002). Parallel processing in high-level categorization of natural
images. Nat Neurosci, 5, 629–630.
Rousselet GA, Macé M J-M & Fabre-Thorpe M (2003). Is it an animal? Is it a human face? Fast processing in upright
and inverted natural scenes. J Vis 3, 440–456.
Ruffieux N*, Ramon M*, Lao J*, Colombo F, Stacchi L, Borruat FX, Accolla E, Annoni JM, Caldara R (2017). Residual
perception of biological motion in cortical blindness. Neuropsychologia, 93, 301-11.
Schyns PG (1998). Diagnostic recognition: task constraints, object information, and their interactions. Cognition,
67(1-2), 147-79.
Song C, Schwarzkopf DS, Kanai R & Rees G (2015). Neural population tuning links visual cortical anatomy to human
visual perception. Neuron, 85, 641-56. doi: 10.1016/j.neuron.2014.12.041.
Tanaka JW & Taylor M (1991). Object categories and expertise: is the basic level in the eye of the beholder? Cogn
Psychol 23, 457–482.
Taylor J, Shehzad Z & McCarthy G (2016). Electrophysiological correlates of face-evoked person knowledge. Biol
Psychol, 118, 136-46. doi: 10.1016/j.biopsycho.2016.05.011.
Thorpe SJ, Fize D & Marlot C (1996). Speed of processing in the human visual system. Nature 381, 520–522.
Todd RM, Lewis MD, Meusel LA & Zelazo PD (2008). The time course of social-emotional processing in early
childhood: ERP responses to facial affect and personal familiarity in a Go-Nogo task. Neuropsychologia, 46, 595-
613. doi:10.1016/j.neuropsychologia.2007.10.011
VanRullen R & Thorpe SJ (2001). Is it a bird? Is it a plane? Ultra- rapid visual categorisation of natural and artifactual
objects. Perception 30, 655–668.
Visconti di Oleggio Castello M & Gobbini MI (2015). Familiar Face Detection in 180 ms. PLoS One, 10(8):e0136548.
doi: 10.1371/journal.pone.0136548.
not peer-reviewed) is the author/funder. All rights reserved. No reuse allowed without permission. The copyright holder for this preprint (which was. http://dx.doi.org/10.1101/292656doi: bioRxiv preprint first posted online Apr. 3, 2018;

24
Wild-Wall N, Dimigen O & Sommer W (2008). Interaction of facial expressions and familiarity: ERP evidence. Biol
Psychol, 77(2), 138-49. doi:10.1016/j.biopsycho.2007.10.001
Willenbockel V, Sadr J, Fiset D, Horne GO, Gosselin F & Tanaka JW (2010). Controlling low-level image properties:
The SHINE toolbox. Behavior Research Methods, 42(3), 671-84. doi:10.3758/BRM.42.3.67
not peer-reviewed) is the author/funder. All rights reserved. No reuse allowed without permission. The copyright holder for this preprint (which was. http://dx.doi.org/10.1101/292656doi: bioRxiv preprint first posted online Apr. 3, 2018;
Supplementary Material
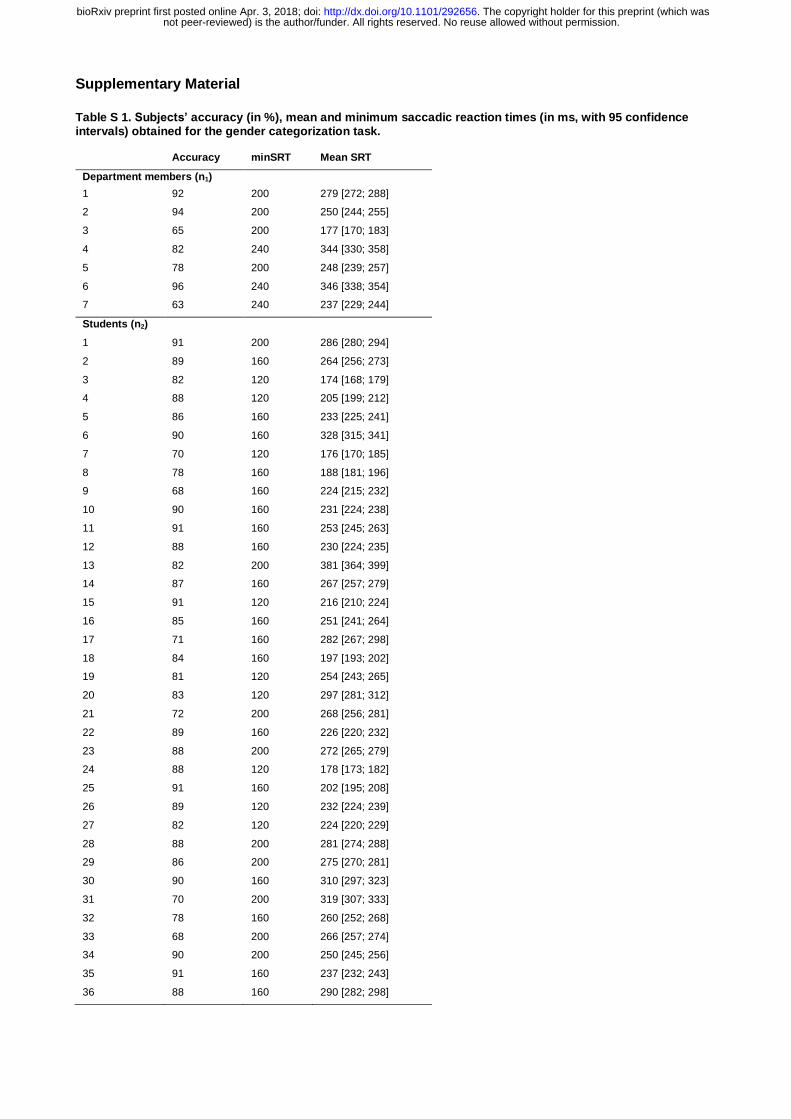
Table S 1. Subjects’ accuracy (in %), mean and minimum saccadic reaction times (in ms, with 95 confidence intervals) obtained for the gender categorization task.
Accuracy minSRT Mean SRT
Department members (n1)
1 92 200 279 [272; 288]
2 94 200 250 [244; 255]
3 65 200 177 [170; 183]
4 82 240 344 [330; 358]
5 78 200 248 [239; 257]
6 96 240 346 [338; 354]
7 63 240 237 [229; 244]
Students (n2)
1 91 200 286 [280; 294]
2 89 160 264 [256; 273]
3 82 120 174 [168; 179]
4 88 120 205 [199; 212]
5 86 160 233 [225; 241]
6 90 160 328 [315; 341]
7 70 120 176 [170; 185]
8 78 160 188 [181; 196]
9 68 160 224 [215; 232]
10 90 160 231 [224; 238]
11 91 160 253 [245; 263]
12 88 160 230 [224; 235]
13 82 200 381 [364; 399]
14 87 160 267 [257; 279]
15 91 120 216 [210; 224]
16 85 160 251 [241; 264]
17 71 160 282 [267; 298]
18 84 160 197 [193; 202]
19 81 120 254 [243; 265]
20 83 120 297 [281; 312]
21 72 200 268 [256; 281]
22 89 160 226 [220; 232]
23 88 200 272 [265; 279]
24 88 120 178 [173; 182]
25 91 160 202 [195; 208]
26 89 120 232 [224; 239]
27 82 120 224 [220; 229]
28 88 200 281 [274; 288]
29 86 200 275 [270; 281]
30 90 160 310 [297; 323]
31 70 200 319 [307; 333]
32 78 160 260 [252; 268]
33 68 200 266 [257; 274]
34 90 200 250 [245; 256]
35 91 160 237 [232; 243]
36 88 160 290 [282; 298]
not peer-reviewed) is the author/funder. All rights reserved. No reuse allowed without permission. The copyright holder for this preprint (which was. http://dx.doi.org/10.1101/292656doi: bioRxiv preprint first posted online Apr. 3, 2018;

26
Table S 2. Subjects’ accuracy (in %), mean and minimum saccadic reaction times (in ms, with 95 confidence intervals) for Experiment 1 and Experiment 2.
Experiment 1 Experiment 2
Accuracy minSRT Mean SRT Accuracy minSRT Mean SRT
Department members (n1)
1 84 280 375 [362; 389] 87 280 364 [354; 373]
2 61 280 286 [272; 302] 72 240 281 [272; 292]
3 72 440 408 [382; 430] 77 240 329 [313; 346]
4 75 360 424 [412; 437] 91 320 405 [397; 415]
Students (n2)
1 66 320 328 [309; 349] 78 280 355 [342; 369]
2 75 280 340 [325; 353] 82 320 370 [358; 380]
3 67 280 363 [348; 380] 62 320 409 [388; 428]
4 65 320 319 [302; 334] 73 280 318 [307; 330]
5 58 -- 253 [232; 276] 77 320 356 [337; 374]
6 78 360 418 [405; 444] 81 280 361 [349; 373]
7 62 -- 315 [303; 328] 57 320 287 [276; 299]
8 57 -- 301 [280; 324] 78 280 382 [367; 398]
9 68 240 304 [291; 319] 80 240 305 [294; 317]
10 67 280 277 [268; 287] 79 240 299 [292; 308]
11 58 320 355 [339; 372] 73 240 358 [341; 375]
12 81 280 353 [342; 365] 82 240 304 [294; 314]
13 69 280 323 [308; 336] 83 320 366 [356; 377]
14 77 360 394 [379; 408] 75 280 352 [342; 362]
Table S 3. Parameter estimates of the fixed effects for the generalized linear mixed model with the binomial family on accuracy
Fixed Effects log(Odds) SE CI Odds Odds CI z-value p-value
Lab Members
Intercept
1.03 .22 [.48; 1.6] 2.80 [1.61 4.95] 4.57 <.0001
high predictability .51 .13 [.24; 0.78] 1.66 [1.27; 2.19] 3.69 .0002
Students
Intercept
.77 .09 [.59; .94] 2.16 [1.80; 2.58 ] 8.74 <.0001
high predictability .40 .07 [.26; .53] 1.49 [1.30; 1.70] 5.78 <.0001
not peer-reviewed) is the author/funder. All rights reserved. No reuse allowed without permission. The copyright holder for this preprint (which was. http://dx.doi.org/10.1101/292656doi: bioRxiv preprint first posted online Apr. 3, 2018;
27
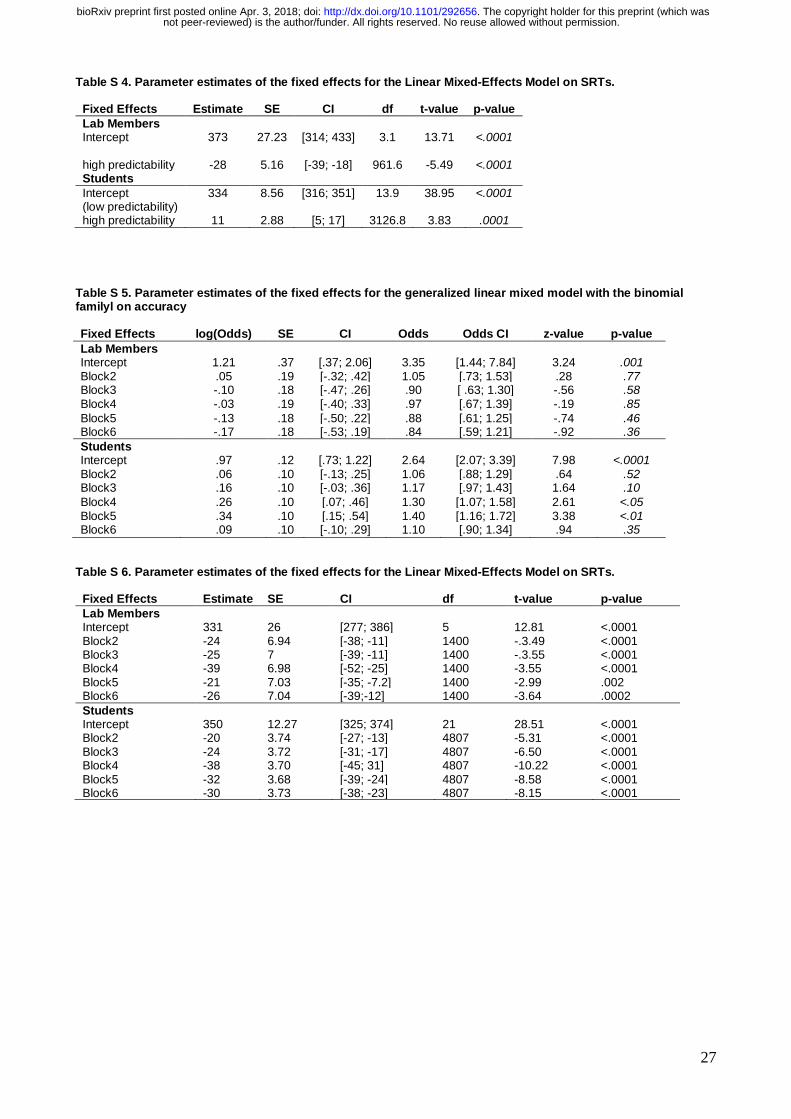
Table S 4. Parameter estimates of the fixed effects for the Linear Mixed-Effects Model on SRTs.
Fixed Effects Estimate SE CI df t-value p-value
Lab Members Intercept
373 27.23 [314; 433] 3.1 13.71 <.0001
high predictability -28 5.16 [-39; -18] 961.6 -5.49 <.0001 Students
Intercept (low predictability)
334 8.56 [316; 351] 13.9 38.95 <.0001
high predictability 11 2.88 [5; 17] 3126.8 3.83 .0001
Table S 5. Parameter estimates of the fixed effects for the generalized linear mixed model with the binomial familyl on accuracy
Fixed Effects log(Odds) SE CI Odds Odds CI z-value p-value
Lab Members Intercept 1.21 .37 [.37; 2.06] 3.35 [1.44; 7.84] 3.24 .001 Block2 .05 .19 [-.32; .42] 1.05 [.73; 1.53] .28 .77 Block3 -.10 .18 [-.47; .26] .90 [ .63; 1.30] -.56 .58 Block4 -.03 .19 [-.40; .33] .97 [.67; 1.39] -.19 .85
Block5 -.13 .18 [-.50; .22] .88 [.61; 1.25] -.74 .46 Block6 -.17 .18 [-.53; .19] .84 [.59; 1.21] -.92 .36
Students Intercept .97 .12 [.73; 1.22] 2.64 [2.07; 3.39] 7.98 <.0001 Block2 .06 .10 [-.13; .25] 1.06 [.88; 1.29] .64 .52 Block3 .16 .10 [-.03; .36] 1.17 [.97; 1.43] 1.64 .10
Block4 .26 .10 [.07; .46] 1.30 [1.07; 1.58] 2.61 <.05 Block5 .34 .10 [.15; .54] 1.40 [1.16; 1.72] 3.38 <.01 Block6 .09 .10 [-.10; .29] 1.10 [.90; 1.34] .94 .35
Table S 6. Parameter estimates of the fixed effects for the Linear Mixed-Effects Model on SRTs.
Fixed Effects Estimate SE CI df t-value p-value
Lab Members Intercept 331 26 [277; 386] 5 12.81 <.0001 Block2 -24 6.94 [-38; -11] 1400 -.3.49 <.0001 Block3 -25 7 [-39; -11] 1400 -.3.55 <.0001 Block4 -39 6.98 [-52; -25] 1400 -3.55 <.0001 Block5 -21 7.03 [-35; -7.2] 1400 -2.99 .002 Block6 -26 7.04 [-39;-12] 1400 -3.64 .0002
Students Intercept 350 12.27 [325; 374] 21 28.51 <.0001 Block2 -20 3.74 [-27; -13] 4807 -5.31 <.0001 Block3 -24 3.72 [-31; -17] 4807 -6.50 <.0001 Block4 -38 3.70 [-45; 31] 4807 -10.22 <.0001 Block5 -32 3.68 [-39; -24] 4807 -8.58 <.0001 Block6 -30 3.73 [-38; -23] 4807 -8.15 <.0001
not peer-reviewed) is the author/funder. All rights reserved. No reuse allowed without permission. The copyright holder for this preprint (which was. http://dx.doi.org/10.1101/292656doi: bioRxiv preprint first posted online Apr. 3, 2018;