Modeling spatial efiects in visual-tactile saccadic ... webpage... · Modeling spatial efiects in...
46
p376 Modeling Visual-Tactile Interaction 1 Perception & Psychophysics (in press) Modeling spatial effects in visual-tactile saccadic reaction time Adele Diederich Hans Colonius International University Bremen Oldenburg University Send correspondence to: Adele Diederich School of Humanities and Social Sciences International University Bremen P.O. Box 750 561 D–28725 Bremen Germany email: [email protected] phone +49 (0) 421 200 3431 Fax +49 (0) 421 200 3303 p376 Running head: Modeling Visual-Tactile Interaction
Transcript of Modeling spatial efiects in visual-tactile saccadic ... webpage... · Modeling spatial efiects in...
p376 Modeling Visual-Tactile Interaction 1
Perception & Psychophysics (in press)
Modeling spatial effects in visual-tactile
saccadic reaction time
Adele Diederich Hans Colonius
International University Bremen Oldenburg University
Send correspondence to: Adele Diederich
School of Humanities and Social Sciences
International University Bremen
P.O. Box 750 561
D–28725 Bremen
Germany
email: [email protected]
phone +49 (0) 421 200 3431
Fax +49 (0) 421 200 3303
p376 Running head: Modeling Visual-Tactile Interaction

p376 Modeling Visual-Tactile Interaction 2
Abstract
Saccadic reaction time (SRT) to visual targets tends to be faster
when non-visual stimuli are presented in close temporal or spatial
proximity even when subjects are instructed to ignore the accessory
input. Here we investigate visual-tactile interaction effects on SRT
under varying spatial configurations. SRT to bimodal stimuli was
reduced by up to 30 ms, compared to responses to unimodal visual
targets. In contrast to previous findings, the amount of multisen-
sory facilitation was not decreasing with the physical distance between
target and non-target but depended on (i) whether target and non–
target were presented in the same hemifield (ipsilateral) or in differ-
ent hemifields (contralateral), (ii) the eccentricity of the stimuli, and
(iii) the frequency of the vibrotactile non–target. The time–window–
of–integration (TWIN) model for SRT (Colonius & Diederich, 2004),
is shown to yield an explicit characterization of the observed multi-
sensory spatial interaction effects through the removal of peripheral
processing effects of stimulus location and tactile frequency.
p376 Modeling Visual-Tactile Interaction 3
Introduction
Saccades are fast voluntary movements of the eyes made to align the foveal
region of the retina with the spatial position of the stimulus eliciting the eye
movement (e.g. Munoz & Schall, 2004). Although saccades are typically
made to visual stimuli, they can also be directed to the locations of sounds
or tactile stimulation on the body’s surface. The saccadic response has be-
come an important paradigm to study effects of multimodal stimulation. In
particular, the modulatory effect of an auditory stimulus on saccade onset
(saccadic reaction time, SRT) and on saccade trajectory has been studied
extensively both in humans and in monkey. A pervasive result is that SRT
toward a visual target is reduced by the presence of a spatially and tem-
porally aligned irrelevant auditory stimulus and that this facilitatory effect
disappears, or even reverses into inhibition, if the spatiotemporal distance
between the stimuli increases (e.g., Frens et al., 1995; Frens & van Opstal,
1998; Hughes et al., 1994, 1998; Lueck et al. 1990; Colonius & Arndt, 2001;
see Diederich & Colonius, 2004b and Van Opstal & Munoz, 2004, for review).
These behavioral observations correlate with multisensory integration ef-
fects measured in neurons of the deep layers of the superior colliculus (SC), a
midbrain area involved in saccade generation, in monkey and cat (Meredith &
Stein, 1986). Information about stimulus location is represented topograph-
ically within this structure by an orderly arrangement of neurons according
to the location of their respective receptive fields (RFs). The spatial reg-
ister among the different sensory maps is formed by multisensory neurons
whose different RFs are in register with one another (Stein and Meredith
1993). Spatially coincident visual-auditory stimuli fall within the overlap-
ping RFs of multisensory SC neurons producing response enhancements that
exceed the individual modality-specific responses (Kadunce et al. 2001). In
p376 Modeling Visual-Tactile Interaction 4
addition, the SC contains a motor map composed of output neurons coding
appropriate eye movements (Sparks 1986; Stanford, 2004). That is, the locus
of activity in the motor map encodes a movement command that reorients
the eyes (and the head) a given distance in a particular direction. Thus, if
the goal is to translate a sensory target into an appropriate motor command,
the alignment of the visual and auditory maps to each other and to the motor
map is critical. The response enhancement observed in multisensory neurons
may serve to facilitate orienting responses to a particular spatial location.
In addition to the visual and auditory maps, the SC also contains a
corresponding somatosensory map of the body’s surface (Stein et al. 1976;
Graziano & Gross 1995). There is increasing evidence (from studies on mon-
key or cat) for the existence of multisensory neurons receptive to both visual
and tactile stimuli not only in subcortical areas like the putamen (Graziano
& Gross, 1995), but also in several brain areas, e.g. in ventral premotor cor-
tex (Graziano & Gross, 1995), ventral intraparietal area (Duhamel, Colby,
& Goldberg, 1998), and superior temporal sulcus (e.g. Bruce, Desimone,
& Gross, 1981). This suggests that not only visual-auditory but also visual-
tactile interactions should occur in saccade generation. Groh & Sparks (1996)
found only a slight tendency for SRT reduction when visual and somatosen-
sory stimuli were presented at the same spatial location (in monkey). In a
recent study of visually guided saccades with tactile distractors, Amlot et
al. (2003) observed (1) that accessory somatosensory stimuli reduced the la-
tency of saccades and (2) that the reduction of SRT was greatest for spatially
coincident stimuli. These authors suggested that the enhancement effect re-
flects a summation at the level of multisensory neurons, although they did
not rule out that a generalized warning signal or alerting effect could be re-
sponsible for part of the facilitation. In a similar vein, Diederich et al. (2003)
p376 Modeling Visual-Tactile Interaction 5
compared SRT to unimodal visual targets and to simultaneously presented
bimodal stimuli (visual targets, tactile-vibratory non-targets) under various
spatial configurations. They found SRTs to bimodal stimuli to be reduced up
to 30 ms compared to unimodal visual responses. Contrary to previous re-
sults for visual-auditory presentations, however, the magnitude of the speed-
up did not increase with reducing the physical distance between visual and
tactile stimulus. Specifically, with a constant level of visual-tactile distance,
SRT facilitation increased with the eccentricity of the stimulus configuration.
Obviously, both the absolute and the relative position of the visual target
and tactile non-target contribute to the enhancement effect.
In order to better understand these observations, here we elaborate a
recently proposed model of multisensory integration (Colonius & Diederich,
2004) to account for effects of spatial configuration, and test it on data from
our lab. Our time–window–of–integration (TWIN) model distinguishes an
early, afferent stage of parallel peripheral processing in the visual and so-
matosensory pathways (first stage) followed by a second stage comprising
neural integration of the input and preparation of an oculomotor response.
In the first stage visual and tactile activity are processed independently in
separate sensory channels1. Multisensory integration can occur in the sec-
ond stage only, manifesting itself through a decrease (or increase) of process-
ing time. Moreover, multisensory integration is contingent upon temporal
proximity of the afferent information delivered from the separate modalities:
termination of the afferent peripheral stages for both modalities must oc-
cur within a temporal window of fixed duration. Rather than assuming the
1Independence can certainly be assumed at the receptor level. The first stage can
be defined by this independence assumption: it lasts up to a level of processing where
independence breaks down.
p376 Modeling Visual-Tactile Interaction 6
existence of a joint spatio-temporal window of integration permitting inte-
gration to occur only for both spatially and temporally neighboring stimuli,
TWIN allows crossmodal interaction to occur even for rather distant stimuli
(of different modalities) as long as they fall within the time window. Such
interaction will typically be an inhibition or only a small facilitation. This
arrangement affords the organism more flexibility in a complex environment.
For example, response depression may occur with nearly simultaneous but
distant stimuli making it easier for the organism to focus on the more impor-
tant event. The concept of a time-window for multisensory integration has
been suggested by several authors based on neurophysiological investigations
in human, monkey, and cat (e.g., Meredith, 2002; Corneil et al., 2002; Stein
& Meredith, 1993).
The TWIN model has been developed for either focused attention (FA) or
redundant target (RET) paradigms. In the latter, the subject is instructed
to react to stimuli of either modality, whereas in the former a non-target
modality stimulus should be ignored and only the target stimulus responded
to. Correspondingly, the TWIN version for FA differs from that for RET with
respect to how the time window of integration is ”opened”. With redundant
targets, the winner of the race between the peripheral processing times in the
first stage triggers the opening of the time window. For integration to take
place, termination of the second peripheral process must fall within the time
window. The RET version of TWIN reflects the symmetry of the role of the
modalities in the RET paradigm. It is not considered here any further since
all experiments reported below were conducted within the FA paradigm.
In the FA paradigm, multisensory integration is assumed to occur only if
(1) peripheral processing of the non-target wins the race and (2) peripheral
processing of the target stimulus terminates within a given temporal window

p376 Modeling Visual-Tactile Interaction 7
of integration opened by the non-target. This reflects the asymmetry in the
role of the modalities: subjects are not supposed to respond to stimuli of the
non-target modality2.
The window of integration acts like a filter determining whether the af-
ferent information delivered from different sensory organs is registered close
enough in time to elicit multisensory integration. Passing the filter is a nec-
essary but not a sufficient condition for multisensory integration to occur,
because the latter also depends on the spatial configuration of the stimuli.
Due to its two-stage assumption, the TWIN model suggests an important
separability hypothesis: it allows the separation of effects on SRT based on
unimodal stimulus properties (like intensity, absolute spatial position) from
those based on crossmodal properties (like physical, or perceived, distance
between target and non-target). Unimodal stimulus properties modulate
the probability of interaction to occur via their influence on the outcome of
the race in the first stage, whereas crossmodal stimulus properties affect the
duration of the second stage processing by their influence on multisensory
integration. A formal presentation of the model follows below.
The global assumptions of TWIN have been tested under various con-
ditions including variations of stimulus intensities and stimulus onset asyn-
chrony (Colonius and Diederich, 2004; Diederich & Colonius, 2004a; Colo-
nius & Arndt, 2001; Arndt & Colonius, 2003). So far, the model has not
addressed the specifics of the effects of spatial configuration on SRT. Ex-
tending the model here several TWIN variants are developed and tested that
differ in how the spatial configuration of the stimuli determines the interac-
2Although non–targets can be ignored, subjects are certainly aware of them and evoke
an inhibitory mechanism to suppress saccades directed to non–targets (see, e.g., Kirchner
& Colonius, 2005).
p376 Modeling Visual-Tactile Interaction 8
tion effects.
Experiment
In a focused-attention paradigm with visual targets and tactile non-targets,
SRT effects of visual-tactile spatial stimulus configuration were studied under
different eccentricity and laterality conditions.
Participants
Three students served as paid voluntary participants. All participants had
normal vision. They were screened for their ability to follow the experimen-
tal instructions (proper fixation, few blinks during trial, saccades towards
visual target). They gave their informed consent prior to their inclusion in
the study. Local ethical approval was obtained for this study, and all experi-
ments were conducted in accordance with the ethical standards described in
the 1964 Declaration of Helsinki.
Apparatus and stimulus presentation
Red light-emitting diodes (LED, 5 mm, 3.7 mcd) served as visual targets pre-
sented against a black background. An additional LED (red, 5 mm, 0.4 mcd)
served as fixation point. Tactile stimuli were vibrations (50 Hz/0.6 V or
5 Hz/2.4 V) applied to the center of the palm, generated by two silenced
oscillation devices. All stimuli were positioned on top of a table (180 cm ×130 cm × 75 cm) 60 cm in front of the participant. The fixation LED was
38.5 cm away from the lower edge of the table. 56 LEDs and 56 holes for
the vibrators were placed at various positions measured from the vertex. For
each experimental condition the two vibrators were moved to the respective
p376 Modeling Visual-Tactile Interaction 9
positions. Vibrators and LEDs were controlled by a PC multi-function card.
Experimental procedure
All experiments were carried out in a completely darkened room so that
participants were unable to see their hands during the experiment. Every
session began with 10 min of dark adaptation during which the measurement
system was adjusted and calibrated. During this phase the participants put
their hands at the position used during the entire experimental block. Thus,
the participants were aware of the hand position and, thus, the position of
the tactile stimulus. Participants were sitting at the longitudinal side (at the
vertex) using a chin rest facing the calibrating screen and wearing a video
camera frame. Each trial began with the appearance of the fixation point.
After a variable fixation time (800-1500 ms), the fixation point disappeared
and, simultaneously, both a visual and a tactile stimulus were presented for
500 ms (no gap). In unimodal trials, only a visual stimulus was presented.
Subjects were instructed to move their eyes to the visual target as quickly as
possible, while the tactile stimulus could be ignored. The interval between
stimulus offset and fixation onset for the next trial was 2 seconds. Each par-
ticipant was first trained for 1000 trials not included in the data analysis.
Data collection
Saccadic eye movements were recorded by an infrared video camera sys-
tem (EyeLink system, Sensomotoric Instruments) with temporal resolution
of 250 Hz and horizontal and vertical spatial resolution of 0.01◦ (accuracy of
0.25 − 0.5◦). Saccades were detected on a trial by trial basis using velocity
(22◦/s) and acceleration criteria (8000◦/s2). Saccadic reaction time (the time
between the onset of the visual stimulus and the onset of the saccadic eye
p376 Modeling Visual-Tactile Interaction 10
movement), start position of the eye, and end position after the saccade (ver-
tical and horizontal positions in degree of visual angle relative to the straight
ahead fixation point) were calculated from the controlled data samples.
Stimulus Arrangement and Design
Three different spatial conditions were run. In Condition I, visual target
distance from the fixation point was kept constant (except for left/right pre-
sentation), while the tactile stimulus position was varied across experimental
blocks. In each trial, a visual target was presented either left or right from
fixation. With the visual stimulus appearing always at 10◦ (left or right) and
the tactile stimulus appearing at 10◦, 50◦, or 70◦ (left or right), 12 different
bimodal configurations (6 ipsi-, 6 contralateral) and two unimodal (visual)
conditions were possible, and a total of 100 trials per configuration were
recorded. Collapsing over left/right hemifields this results in three ipsi- and
three contralateral configurations plus one unimodal (LED-only) condition,
with a total of 200 trials per condition. Since the participant was required
to put their hands at a fixed position, tactile stimulus presentations were
blocked for each position (10◦, 50◦, or 70◦), but the order of the positions
was randomized over subjects. Moreover, trials were randomized with re-
spect to laterality (ipsi/contra), modality (uni-/bimodal), and frequency of
the tactile stimulus (5Hz/50Hz). 150 trials were presented within each block,
a total of twelve blocks were performed by each participant.
Condition II was identical to the first one, except for the following: while
in the first the position of the visual target was held constant and tactile
stimulus position was changed over blocks, here tactile stimulation was ap-
plied at a fixed position (10◦ left or right from fixation). Thus, the position
of the limbs was held constant over the entire condition. The visual stimulus
p376 Modeling Visual-Tactile Interaction 11
was presented at various spatial locations, but in order to keep comparabil-
ity with the first condition, visual stimulus positions were blocked. Thus,
within a block subjects could anticipate the visual target position except for
the left/right presentation. The two vibrators were positioned at 10◦ left and
right from the fixation point, 55 cm from the vertex. Visual stimulus positions
were 10◦, 50◦, and 70◦ left and right from fixation, 50 cm from the vertex.
As before, bimodal stimuli were presented ipsi- and contralateral. This re-
sults in 24 different bimodal configurations (6 ipsi-, 6 contralateral, left or
right, for both frequencies of the vibration) and 6 unimodal (visual) condi-
tions, with 100 trials per configuration. Collapsing over left/right hemifields
this amounts to 6 ipsi- and 6 contralateral configurations plus 3 unimodal
(LED-only) conditions, with a total of 200 trials per condition (per subject).
In Condition III, both visual and tactile stimuli were presented at po-
sitions 10◦, 50◦, and 70◦ left and right from the fixation point, the tactile
stimulus 55 cm and the visual stimulus 50 cm away from the vertex. That is,
the eccentricity of both stimuli varied, however, the distance between target
and non–target was the same for the ipsilateral presentations. As before,
visual stimulus positions were blocked and the bimodal stimuli were pre-
sented ipsi- and contralateral resulting in 24 different bimodal configurations
(6 ipsi-, 6 contralateral, left or right, for both frequencies of the vibration)
and 6 unimodal (visual) conditions, with 100 trials per configuration. Col-
lapsing over left/right hemifields this amounts to 6 ipsi- and 6 contralateral
configurations plus 3 unimodal (LED-only) conditions, with a total of 200 tri-
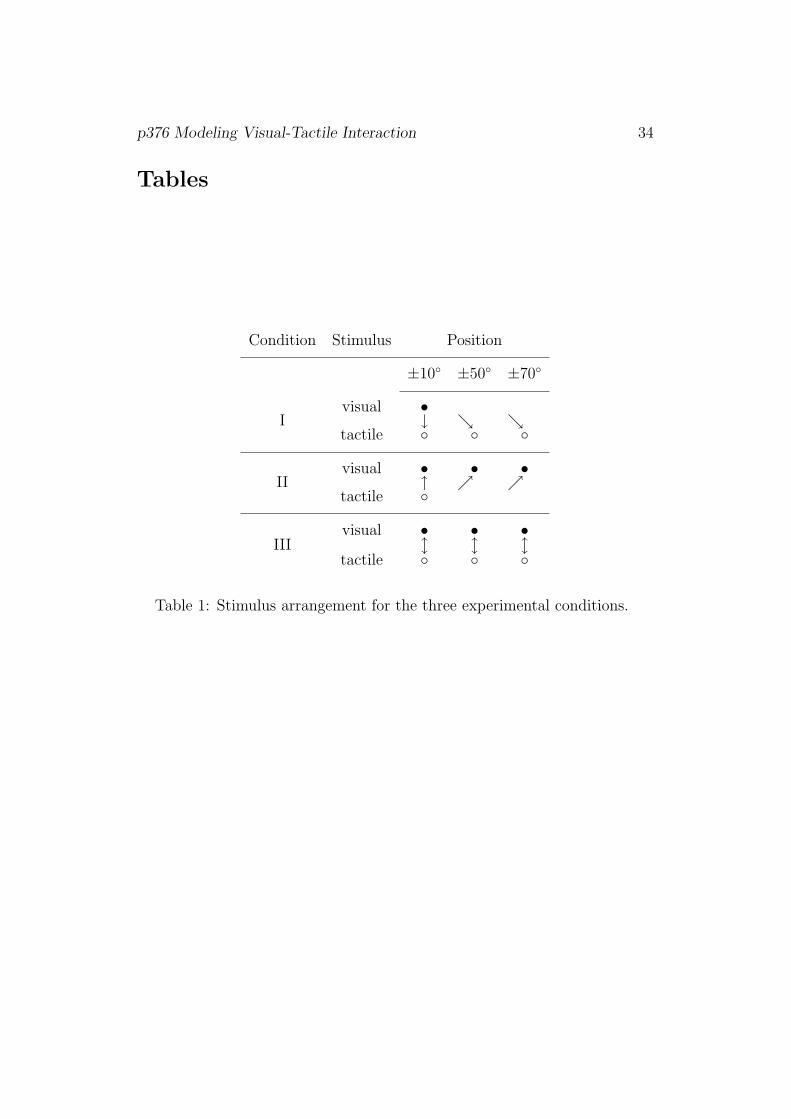
als per condition. Table 1 lists the spatial stimulus arrangement for all three
conditions.
[Table 1]
p376 Modeling Visual-Tactile Interaction 12
Results
Anticipatory saccades with reaction times shorter than 80 ms, responses
longer than 500 ms, saccades less than 5◦ and larger than 20◦ (target at
10◦), and gaze direction errors were excluded from the analysis. Overall, this
amounts to less than 1% of the total number of responses. Data analysis pre-
sented here is across the 3 participants since their results were qualitatively
consistent3. Moreover, mean SRTs were computed regardless of the specific
side (left or right) of stimulus presentation because there were no systematic
hemifield differences. For each of the spatial Conditions I-III, a three-way
ANOVA with factors laterality (with ipsi-, contralateral and unimodal (LED)
as levels), eccentricity (3), and frequency (2) resulted in significant main ef-
fects throughout (p < 0.001), with the exception of eccentricity in Condition I
(p = 0.116). Since the spatial configuration of both stimuli being presented
at 10◦ (left or right) occurs in all of them, SRTs for Conditions I-III were
subsequently combined (both in the figures and in the model fitting). The
same holds for the unimodal SRTs in Conditions II and III.
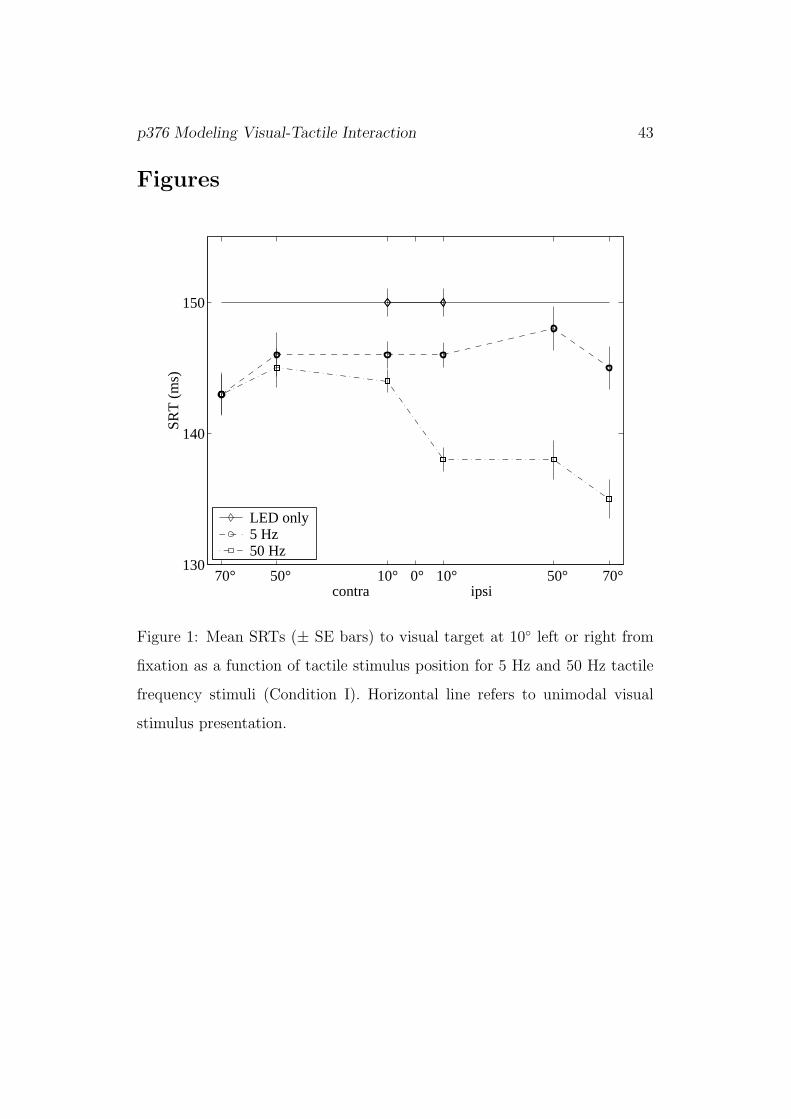
[Figure 1]
Figure 1 shows mean SRTs (with standard errors) in Condition I as a function
of tactile stimulus position. Bimodal SRTs (squares for LED/50Hz, circles
for LED/5Hz condition) are shorter than unimodal responses (diamonds)
under both frequencies and for all eccentricity values of the tactile stimulus;
responses to bimodal stimuli with 5 Hz vibration are longer than to those
with 50 Hz vibration (posthoc Tukey-HSD tests, p < 0.001). There was
3Part of the data in the 50 Hz vibration condition have previously been published in
Diederich et al. (2003). An investigation of saccade accuracy presented there allowed to
exclude the possibility of any speed-accuracy trade-offs in saccade execution.
p376 Modeling Visual-Tactile Interaction 13
a significant interaction of frequency with laterality: ipsilateral SRTs were
faster than contralateral SRTs for 50 Hz vibration, but not for 5 Hz vibration
(p < 0.001).
[Figure 2]
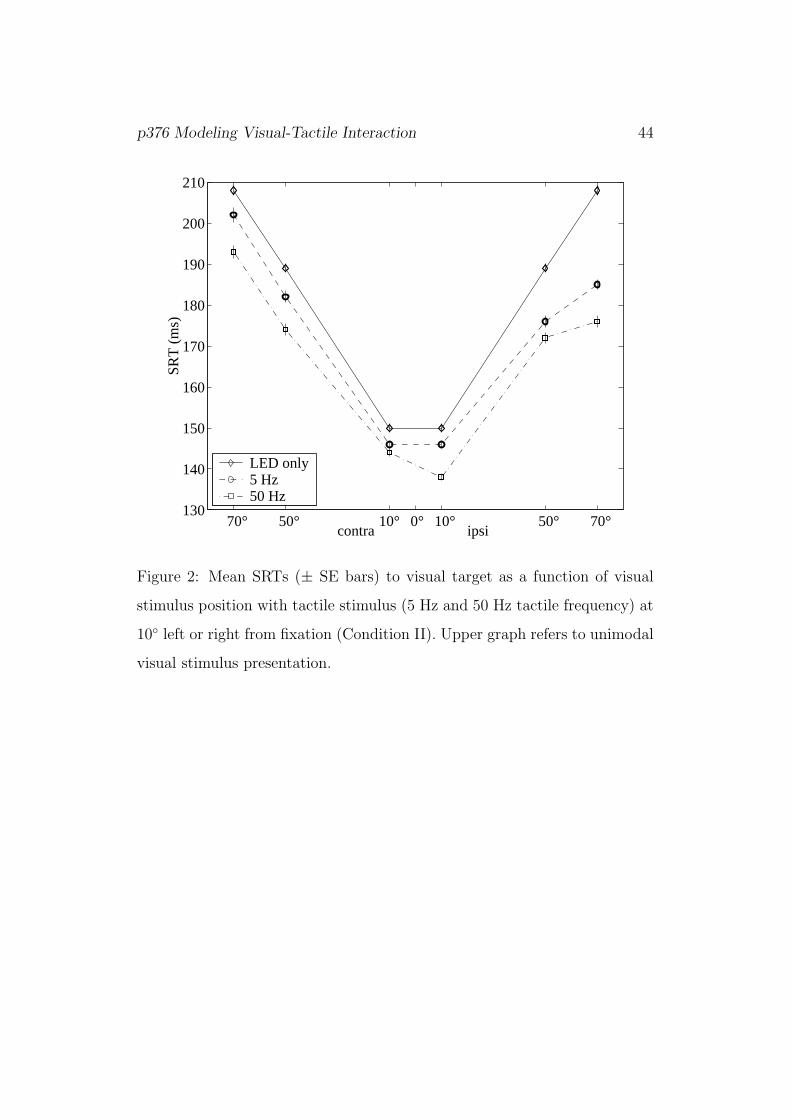
Figure 2 shows mean SRTs in Condition II as a function of visual stimulus
position. Clearly, SRTs increase with eccentricity of the visual stimulus both
ipsi- and contralateral. Again, responses to bimodal stimuli with 5 Hz vibra-
tion are longer than to those with 50 Hz vibration, and both are faster than
unimodal (LED) responses (p < 0.001). Bimodal SRTs are faster for ipsi-
than for contralateral presentation, but here interaction between frequency
and laterality was not significant (p = 0.641).
[Figure 3]
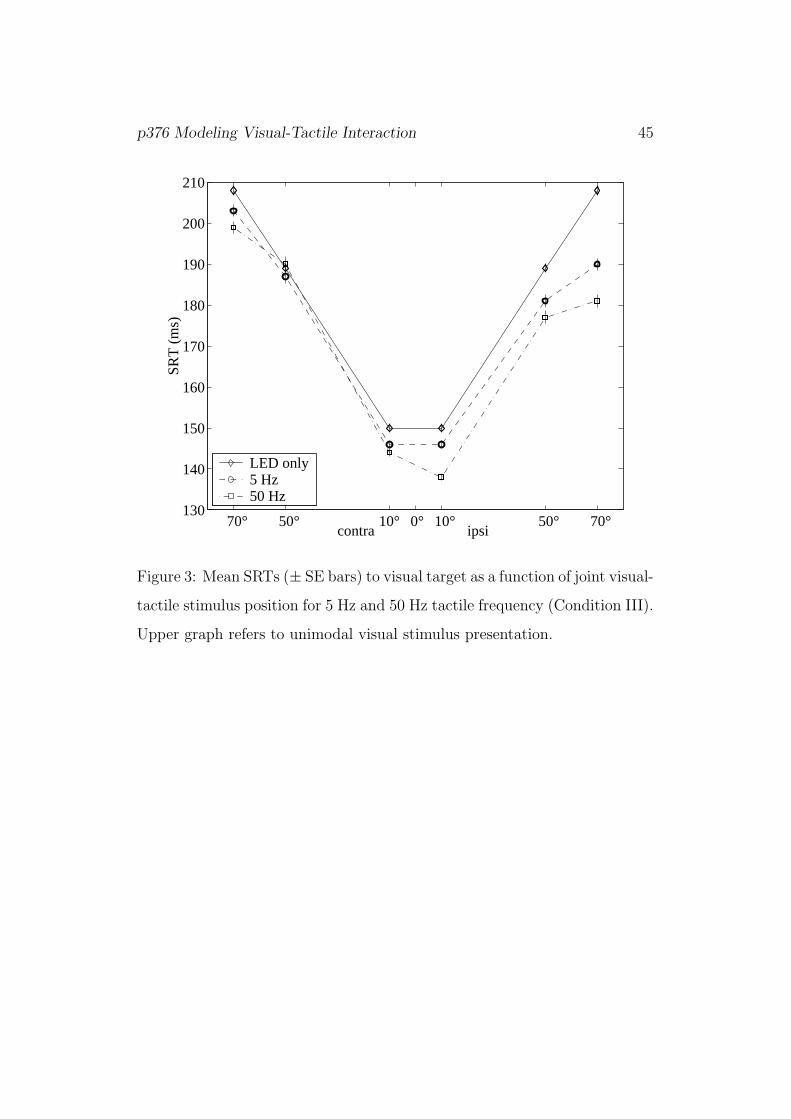
Figure 3 shows mean SRTs in Condition III as a function of joint visual-
tactile stimulus position. Again, SRTs increase with eccentricity, bimodal
responses are faster than unimodal ones, and ipsilateral responses are again
faster than contralateral ones. Bimodal 5 Hz responses also take longer than
50 Hz responses, but only for ipsilateral presentations (significant interaction
of laterality and frequency, p = 0.001).
To summarize, the simultaneous presentation of a tactile non-target stim-
ulus and a visual target co-occurred with a reduction of SRT by up to 30 ms
compared to unimodal responses, the size of this facilitation effect depend-
ing on the spatial configuration. The 5 Hz vibratory non-target condition
(1) exhibited a significant facilitation of bimodal responses compared to uni-
modal responses, but it was smaller than the effect of a 50 Hz non-target;
(2) bimodal 5 Hz responses also increased with eccentricity of the visual tar-
get position and were longer for contra- than for ipsilateral presentations
p376 Modeling Visual-Tactile Interaction 14
(Conditions II and III). Bimodal responses did not increase with tactile non-
target eccentricity (Condition I) neither for 5 Hz nor for 50Hz, while the
ipsi-/contralateral effect found for 50 Hz was not observed in the 5 Hz con-
dition.
Time-window-of-integration model
First, the basic assumptions of the TWIN model in the focused attention
version are presented formally, followed by a series of more specific model
versions characterizing the dependence of the facilitation effect on spatial
stimulus configuration (cf. Colonius & Diederich, 2004).
General case
Saccadic reaction time is assumed to be the sum of two random variables:
SRT = W1 + W2, (1)
where W1 and W2 refer to the first and second stage processing time, respec-
tively. Let V denote visual peripheral processing time, T tactile peripheral
processing time, and Pr(I) the probability of the event I that crossmodal
interaction occurs according to the model, i.e., that T terminates before V
and within the time window of length ω:
I = {T < V < T + ω}.
Assuming that first-stage processing time is terminated by peripheral target
processing time V , mean saccadic reaction time in the bimodal condition,
RTV T , is
E[RTV T ] = E(W1) + E(W2)
p376 Modeling Visual-Tactile Interaction 15
= E(V ) + E(W2)
= E(V ) + Pr(I) · E(W2|I) + [1− Pr(I)] · E(W2|not-I)
= E(V ) + E(W2|not-I)− Pr(I) · [E(W2|not-I)− E(W2|I)],
where E(W2|I) and E(W2|not-I) denote the expected second stage process-
ing time conditioned on interaction occurring (I) or not occurring (not-I),
respectively. In the unimodal condition, no interaction is possible. Thus,
E(RTV ) = E(V ) + E(W2|not-I). (2)
Putting ∆ ≡ E(W2|not-I)− E(W2|I), bimodal mean SRT becomes
E(RTV T ) = E(V ) + E(W2| not-I)− Pr(I) ·∆. (3)
The amount of expected crossmodal interaction, measured as the difference
between expected uni- and bimodal response time, is
E(RTV )− E(RTV T ) = Pr(I) · {E(W2 | not-I )− E(W2 | I ) }= Pr(I) ·∆,
with positive ∆ values corresponding to facilitation, negative ones to inhibi-
tion. The product form of this last equation reflects the separability hypothe-
sis afforded by the TWIN model, as mentioned in the introduction: unimodal
stimulus properties (like intensity) affect crossmodal interaction only by mod-
ulating the probability of interaction, Pr(I), whereas crossmodal properties
(like spatial distance between target and non-target) determine the size (and
sign) of interaction, ∆.
In order to generate quantitative predictions on mean reaction times, pe-
ripheral processes are assumed to be exponentially distributed with a param-
eter depending on eccentricity (for visual stimuli) or frequency (for tactile
p376 Modeling Visual-Tactile Interaction 16
stimuli)4. As only mean SRT predictions will be considered, no distribu-
tional assumption on second-stage processing time is needed, except for the
existence of an expected value (mean) for W2.
Thus, besides ∆, the TWIN model requires six basic parameters for
this experiment: three for visual peripheral speed depending on eccentric-
ity (λ10◦ , λ50◦ , λ70◦), two for tactile peripheral speed depending on frequency
(λ5Hz, λ50Hz), and one for second stage processing without crossmodal inter-
action occurring, E(W2|not-I) ≡ µ. From previous studies, window width
was set to ω = 200 ms a-priori.
Special cases
The general model is unspecific with respect to the dependence of the second-
stage interaction parameter ∆ on the spatial stimulus arrangement. Intro-
ducing explicit assumptions on this dependence yields a series of partially
nested specialized TWIN models with varying numbers of additional param-
eters as follows.
Model 1 : The most parsimonious model is the general case itself where a
single value of ∆ is to account for all spatial configurations. For Condition I
with constant visual target position, it predicts the same mean SRT for
all bimodal stimulus conditions of a given tactile stimulus frequency. For
Conditions II and III, this model attributes differences in observed SRT to
bimodal stimuli to the eccentricity of the visual stimulus and/or the frequency
4This implies
Pr(I) = Pr(T < V < T + ω)
=λT
λT + λV{1− exp[−λV ω]}
where λT and λV refer to the tactile, resp. visual, intensity (peripheral speed) parameters.
p376 Modeling Visual-Tactile Interaction 17
of the tactile stimulus, but not to spatial position. Thus, in addition to the
six basic parameters only one spatial parameter, ∆, is needed.
Model 2 : Here it is assumed that the interaction is most pronounced
when both stimuli are presented at a (nearly) identical position. All other
configurations have the same effect. That is, interaction may occur in the
presence of a non-target as before, but it makes a difference whether or not
the stimuli are in close distance or not. This requires 2 parameters, ∆s for
the interaction when both stimuli are presented at the identical position, and
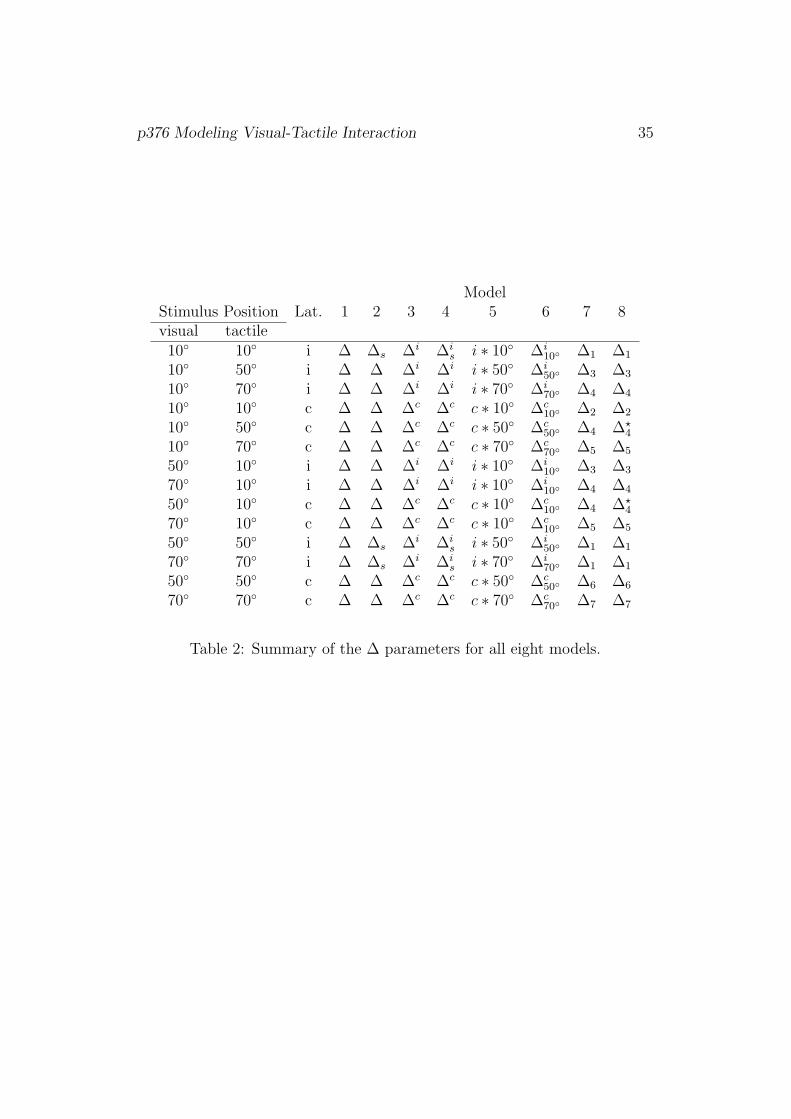
∆ otherwise. Note that for all models considered, the exact specification of
the interaction parameters under all configuration conditions is collected in
Table 2.
Model 3 : Alternatively, it is assumed that interaction depends on whether
or not target and non–target are presented in the same hemifield. This
requires 2 parameters as well, ∆i and ∆c, referring to ipsi- or contralateral
stimulus arrangement, respectively.
Model 4 : This combines the two previous models. It keeps the ipsi- vs.
contralateral distinction but allows for an even stronger interaction if both
stimuli are presented at an identical position. It requires 3 parameters: ∆is,
∆i, and ∆c, for same location, ipsi-, and contralateral stimulus arrangement,
respectively. Note that “same location” refers to ipsilateral condition as well.
Model 5 : It is assumed that both laterality of the bimodal stimulus and
position of the tactile stimulus determine the interaction. Each ∆ value is a
product of one of 2 parameter values indicating laterality (ipsi-/contralateral)
and of one of 3 parameter values indicating eccentricity of the tactile stimulus
(10◦, 50◦, and 70◦). This generates 6 different ∆s from 5 parameters.
Model 6 : Here we retain the assumptions of Model 5 on the role of
laterality and eccentricity but drop the multiplicativity property. This yields
p376 Modeling Visual-Tactile Interaction 18
parameters ∆i 10◦ , ∆c 10◦ , ∆i 50◦ , ∆c 50◦ , ∆i 70◦ , ∆c 70◦ increasing the number of
parameters by one.
Model 7 : Here we drop the perspective of the participant as reference
point for determining laterality and eccentricity. Instead, each physical dis-
tance between visual and tactile stimulus is presented by one parameter. For
Condition I, a visual stimulus at +10◦ is combined with a tactile stimulus at
+10◦, +0◦, +10◦, −10◦, −50◦, −70◦ creating 6 distances and the same holds
for a visual stimulus presented at −10◦. However, for symmetry and because
the distance from +10◦ to +70◦ equals the distance from +10◦ to −50◦, only
5 different parameters are needed. For Condition II this also results in 5 dif-
ferent parameters, whereas Condition III adds another two. For convenience,
they are simply numbered by order of distance magnitude (cf. Table 2).
Model 8 : This generalizes Model 7 in allowing for an effect of laterality
even if physical distance is identical. One more parameter must be added.
[Table 2]
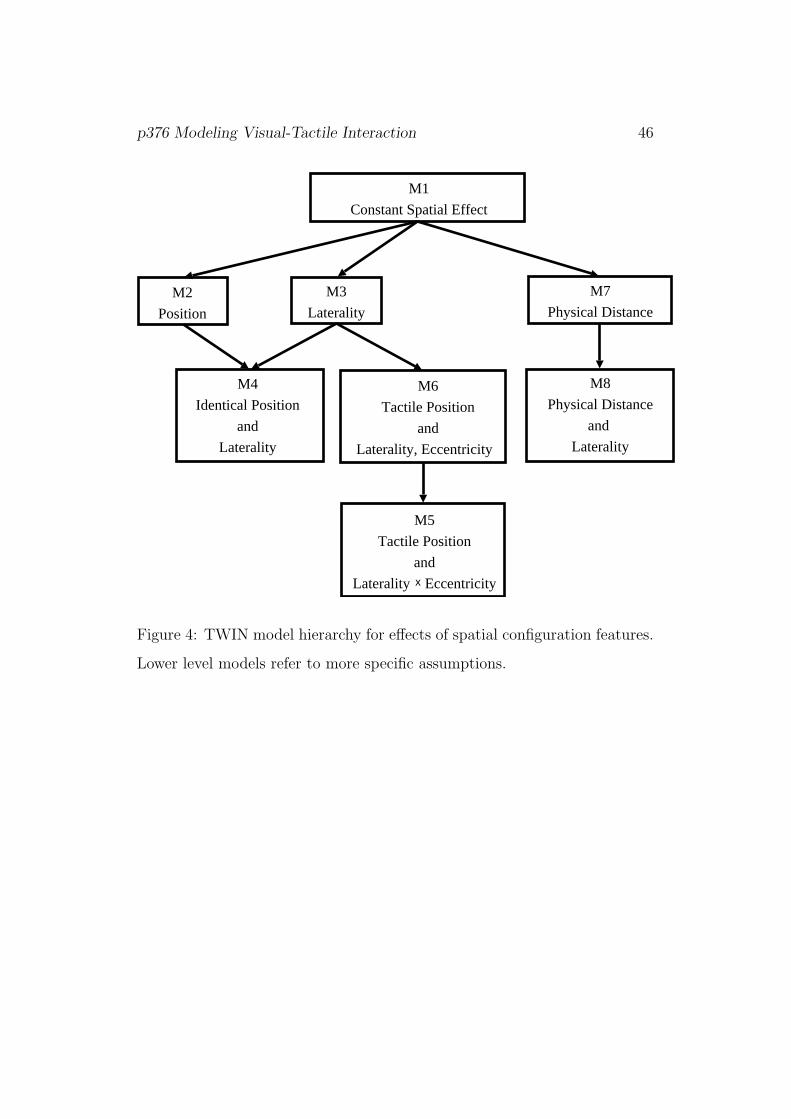
Figure 4 depicts the partially nested family of TWIN model versions for the
effects of spatial configuration.
[Figure 4]
Model fits
Table 2 summarizes the specific parameter sets for all model variants5. These
parameters and the model-specific parameters listed in Table 2 were esti-
mated simultaneously from 31 data points by minimizing the Pearson χ2
statistic6
5As in Colonius & Diederich (2004), window width (ω) was set to 200 ms.6The FMINSEARCH routine of MATLAB was used. Merging the data from the 10◦
conditions reduces the original number of 39 data points to 31.
p376 Modeling Visual-Tactile Interaction 19
χ2 =∑
i
(SRT i − SRT i)2
σ2SRT i
. (4)
SRT i and SRT i are, respectively, the observed and predicted values of the
mean saccadic response times to the ith stimulus condition; and σSRT iis the
associated standard error.
Parameters λ10◦ , λ50◦ , λ70◦ , λ5Hz, λ50Hz, and µ were assumed fixed under
all eight models. Their estimates were λ10◦ = 0.063, λ50◦ = 0.017, λ70◦ =
0.014, λ50Hz = 0.035, λ5Hz = 0.009, and µ = 133.99. They determine the
peripheral and second stage processing time estimates shown in Table 3.
The estimates of visual peripheral processing times are ordered as expected,
i.e., they increase with the eccentricity of the target position at a rate of
about 1 ms/degree of eccentricity, in accordance with an estimate from an
earlier visual-auditory study (Colonius & Arndt, 2001). Estimated peripheral
tactile processing time is substantially shorter for the 50 Hz vibration than
for 5 Hz. This is in line with the fact that the 50 Hz stimulus was reported
by the subjects as being much more salient than the 5 Hz stimulus. In terms
of the model, this means that winning the race against the visual target and,
thereby, the occurrence of interaction, is more likely for the 50 Hz vibration
than for the 5 Hz vibration stimulus.
[Table 3]
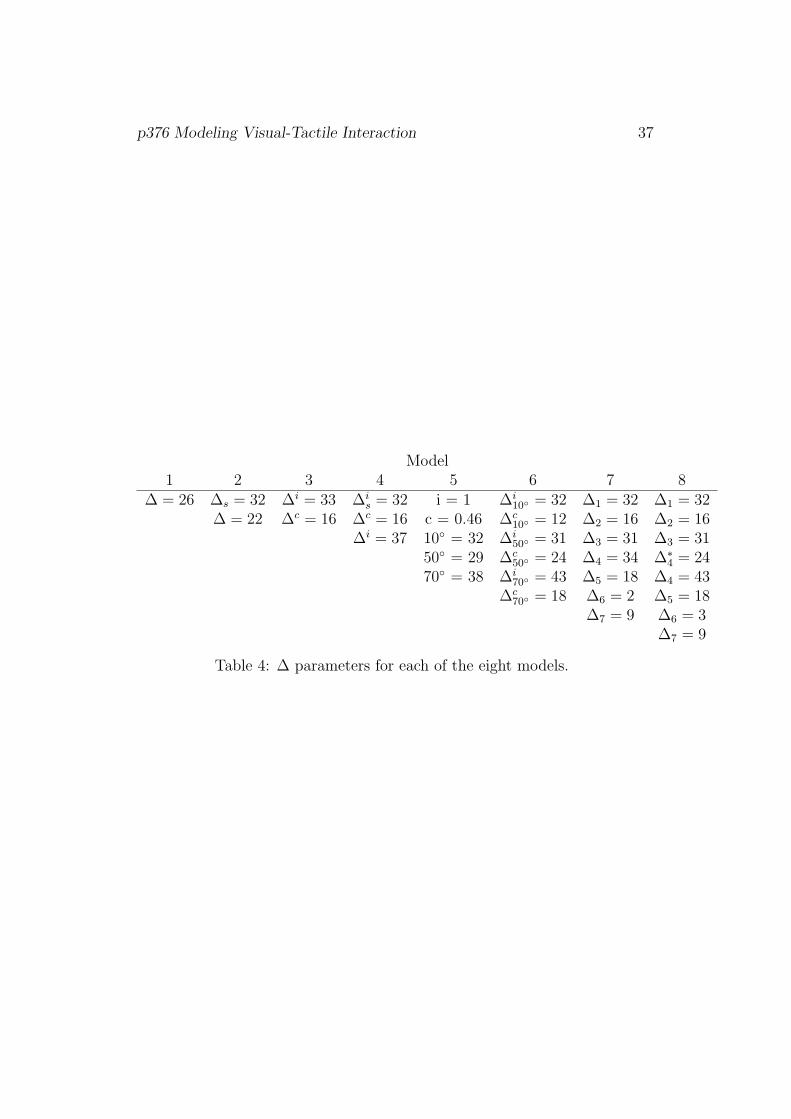
Estimates for the ∆ parameters, specific for each model, are shown in
Table 4. Multiplied by the probability of an interaction they determine
the amount of facilitation/inhibition (in ms). The larger the ∆s the larger
the interaction for a given probability. All ∆ values are larger than zero
indicating a facilitation of SRT for bimodal stimuli. Throughout, the model
p376 Modeling Visual-Tactile Interaction 20
parameters predict larger amounts of facilitation when target and non-target
are presented ipsilateral rather than contralateral.
[Table 4]
Turning to a comparison of the models with respect to their overall fit,
the observed and predicted values for mean saccadic response times for con-
ditions I–III and LED-only, are shown in Tables 5 to 8, respectively.
[Table 5]
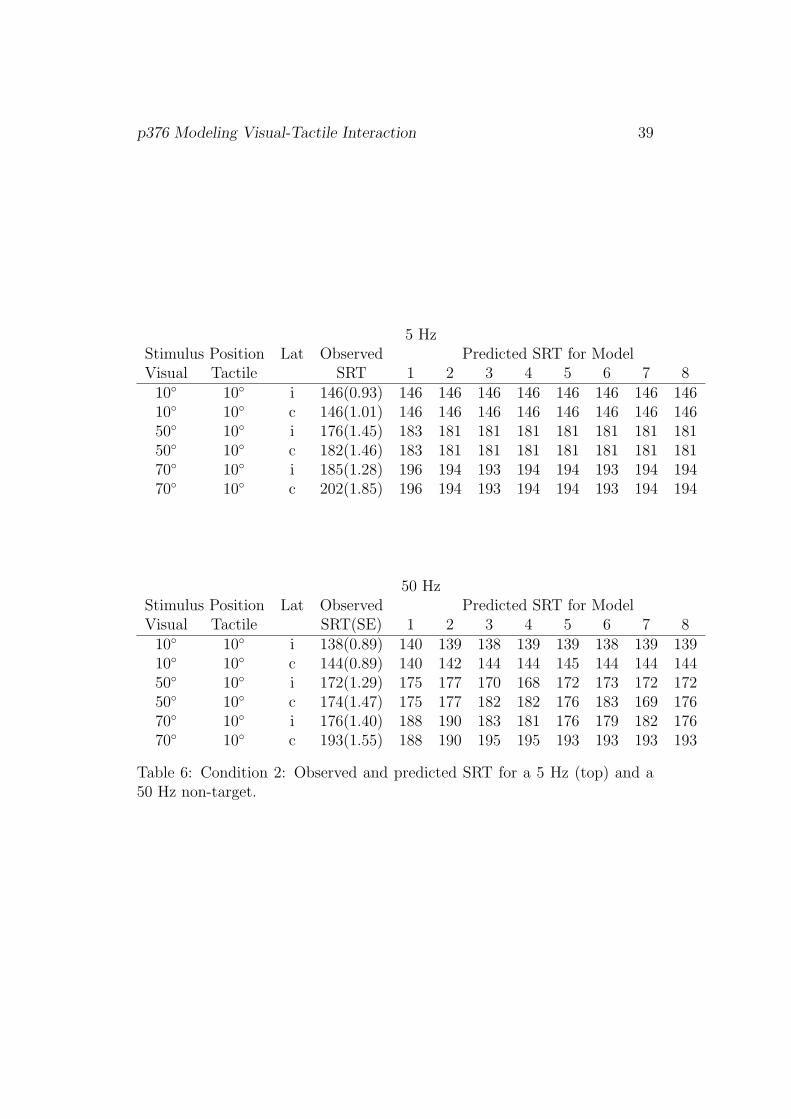
[Table 6]
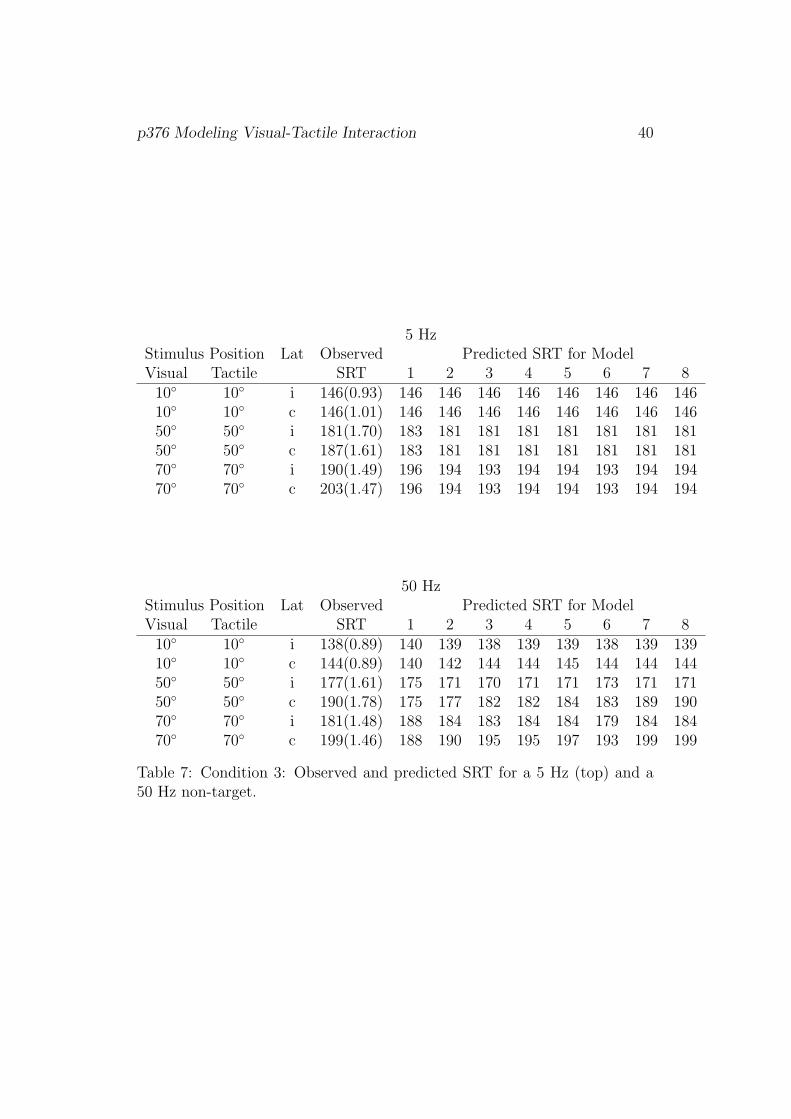
[Table 7]
[Table 8]
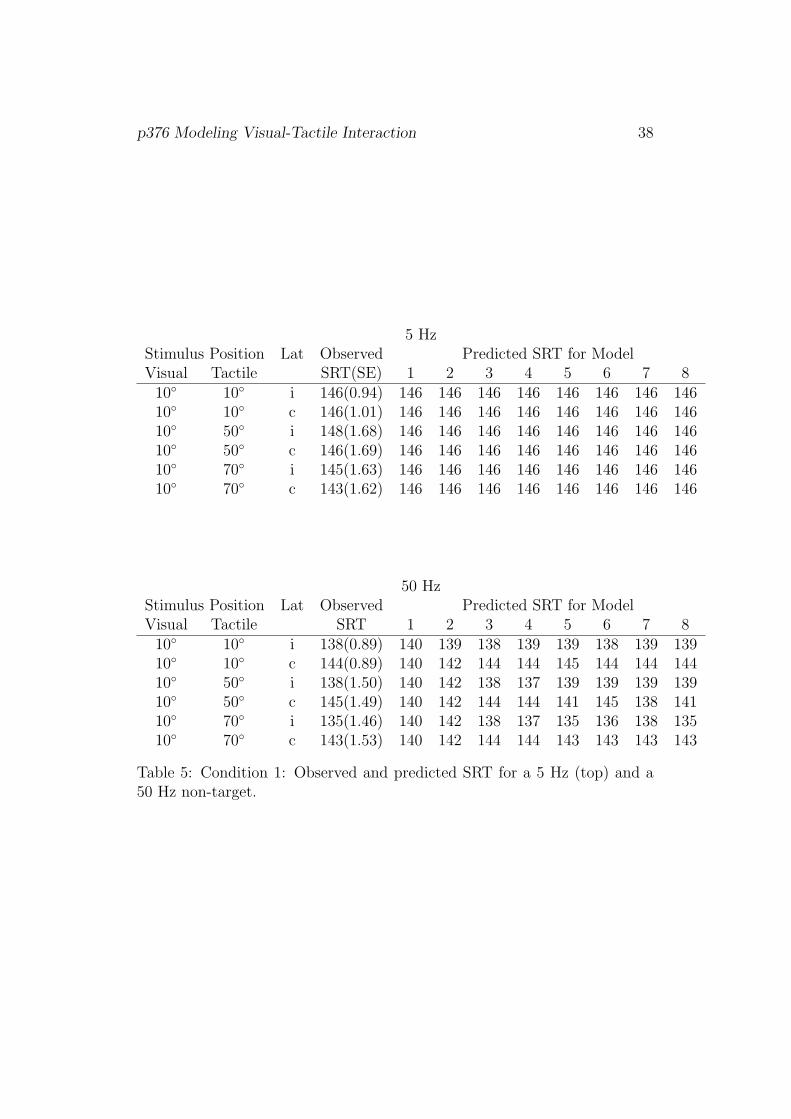
For Condition I, all models predict mean SRT for the 5 Hz tactile accessory
stimulus to be the same for all conditions. Indeed, observed SRTs do not vary
much as a function of stimulus positions. For the 50 Hz accessory stimulus,
Model 6 seems to describe the data best. This model takes into account
the laterality of stimulus presentation (ipsi, contra) and the eccentricity of
stimuli, but not the physical distance between the stimuli like Model 7.
In Condition II, for the 5 Hz tactile accessory stimulus all models predict
SRT to be the same within a given eccentricity of the visual stimulus, regard-
less of the laterality. This results in a rather poor fit when the target was
presented 50◦ or 70◦ left or right from fixation. As before, the models gave a
better account for the 50 Hz than for the 5 Hz tactile non-target condition.
Model 8, with the highest number of parameters, provided the best fit.
In Condition III, the estimated SRTs for the 5 Hz tactile accessory stimu-
lus are identical to the those in Condition II. Note that both conditions differ

p376 Modeling Visual-Tactile Interaction 21
with respect to the position of the tactile non-target but not with respect to
the visual target. Obviously ignoring laterality leads – as before – to a poor
fit of the models. For the 50 Hz stimulus condition Models 7 and 8 provided
the best fits.
For all models it was easier to account for the observed patterns of data
from Condition I than for those from Conditions II and III. In particular, all
models had problems accounting for the observed data in Condition II and
III when the non-target was the 5 Hz rather than the 50 Hz vibration. This
may be due to the relatively long peripheral processing time for the 5 Hz
stimulus (111 ms, see Table 3) leading to low probabilities of interaction
(.34, and .39) for visual stimuli of eccentricity (50◦, and 70◦, resp.): since the
spatial effect is the product of that probability times the ∆ value, the ability
of the different models to make differing predictions is somewhat limited.
Indeed, an inspection of Tables 6 and 7 reveals that model predictions under
5 Hz condition vary very little for any given stimulus configuration and do
not cover the whole range of observed mean SRT values.
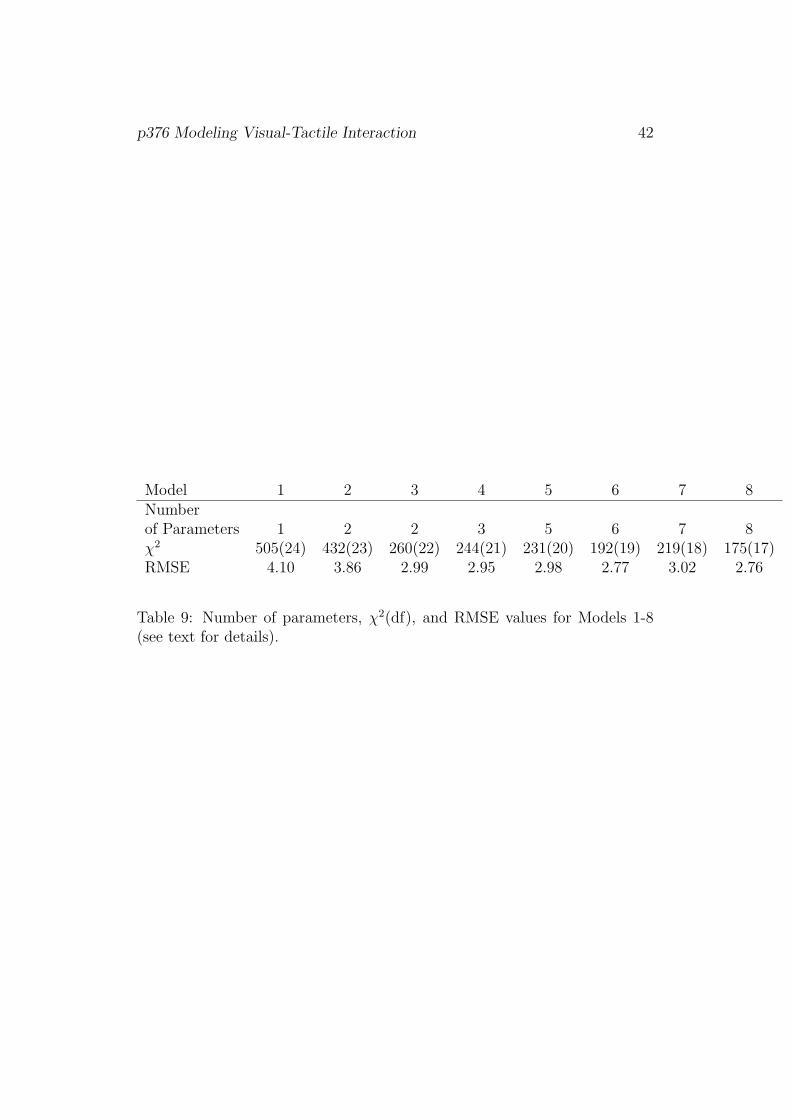
To compare the models while taking into account the different numbers
of parameters, root mean squared error, RMSE, (Browne & Cudek, 1992)
was calculated for each fit. RMSE is the square root of the χ2 value, divided
by the number of data points (N) minus the number of the parameters (k)
of the specific model, i.e., RMSE =√
χ2/(N − k) . The model with the
smallest RMSE is considered as the best fitting. Note that RMSE penalizes
each model by the number of parameters required (RMSE increases as the
number of parameters increases). Table 9 shows the number of model specific
parameters, χ2 values (degrees of freedom in parentheses), and RMSE values
for each model.
[Table 9]
p376 Modeling Visual-Tactile Interaction 22
There is a definite effect of spatial configuration on bimodal SRT, as Model 1
assuming a constant ∆ value fares worst. Attributing a special effect to coin-
cident presentation of visual and tactile stimulus (Model 2) does not improve
the fit substantially. However, distinguishing between same- and different
hemifield presentation (laterality) (Model 3) reduces the RMSE value by
22 %. An additional parameter tracking whether visual and tactile position
are identical or not (Model 4) only leads to a marginal improvement. Further
reduction of RSME is achieved by Model 6 postulating a simultaneous effect
of both the eccentricity of the tactile stimulus and laterality. Assuming that
this effect is multiplicative (Model 5) seems not be warranted. Model 7 claim-
ing physical distance as the only relevant parameter is inferior to Model 6,
but providing an additional parameter for laterality in Model 7 (Model 8)
leads to a fit comparable to that of Model 6.
In terms of relative fit measured by RMSE, Model 6 features the lowest
RMSE value while it has two parameters less than Model 8. The following
picture emerges: the spatial effect is not primarily due to the physical dis-
tance between the stimuli but rather to laterality, i.e., whether or not target
and non-target are presented in the same hemifield. Moreover, there is a
tendency for the effect to increase with eccentricity of the tactile stimulus,
especially with ipsilateral configurations, but laterality and eccentricity seem
not to combine according to a multiplicative rule.
It should be noted that all models must be rejected, from a statistical
hypothesis testing point of view, given the large χ2 values. This is due to
the large sample size (600 observations per condition) leading to very small
standard errors and, consequently, to an excessive power of the χ2 goodness-
of-fit test. On the other hand, all models can account for a high percentage
of the observed variability in the data, ranging from 94 % (Model 1), 97 %
p376 Modeling Visual-Tactile Interaction 23
(Model 6), to 98 % (Model 8).
Finally, given that the model hierarchy was developed posthoc, further
empirical testing of the TWIN model versions for spatial effects is required.
Summary and Discussion
The experiment reported here demonstrated a reliable facilitatory effect of
a vibrotactile accessory stimulus on saccadic response time towards a visual
target. The size of the reduction of bimodal SRT relative to unimodal SRT
was shown to depend on (1) whether both stimuli were presented ipsi- or
contralateral, (2) the eccentricity of the stimuli, and (3) the frequency of
the vibrotactile signal. This extends and complements previous findings in
Diederich et al. (2003) where it was demonstrated in addition that the effect
was not due to a speed-accuracy trade-off in saccade execution. Our results
are in line with the study by Amlot et al. (2003) cited above. In that study,
facilitation was found only when the tactile stimulus preceded the visual
target, but this discrepancy may well be due to the different intensity levels
of the vibrotactile stimuli being used in the two studies.
Part of the reduction of bimodal SRT might be due to the non–target
stimulus providing a ’warning signal’: although the tactile stimulus was not
a reliable predictor of the hemifield the target would occur in (contralateral
presentations were as frequent as ipsilateral ones) the non-target, in partic-
ular the fast 50 Hz stimulus, could have given temporal information about
the forthcoming target-onset7. It is difficult to assess the exact amount of
a possible warning effect, but it is clear that it would not account for the
7At the neural level, this warning effect could be effected by facilitating the release of
fixation–related activity.
p376 Modeling Visual-Tactile Interaction 24
effects of spatial configuration. Another potential explanation often consid-
ered for crossmodal facilitation is probability summation: a reduction of SRT
simply due to statistical facilitation in a race model situation (cf. Colonius&
Diederich, 2006; Colonius, 1990). But, again, it is not obvious how such a
mechanism would be able to account for the spatial effects observed here8.
In order to further probe the nature of the spatial effects several versions
of the TWIN model were fit to the data. The effects of peripheral processing
speed depended on eccentricity of the visual stimulus and frequency of the
vibrotactile stimulus and were clearly reflected in the parameter estimates
(cf. Table 3). The TWIN model framework can be seen as a filter removing
these confounding effects of peripheral processing to yield a true estimate of
the amount of multisensory spatial interaction. The remaining effect of spa-
tial configuration is entirely represented in the model’s ∆ parameters, and
the different TWIN model versions tested only differ in their assumptions on
how ∆ depends on the configuration. Although testing the basic assumptions
of the TWIN model was not the primary goal of this study, the separability
of the peripheral processing parameters from the parameters capturing the
spatial effects and the plausible quantitative ordering of the parameter esti-
mates lend further support to the general framework underlying the TWIN
model.
Compared to the visual-auditory domain, very little seems to be known
8An assessment of statistical facilitation would have required inclusion of unimodal
tactile trials in the experiments, as suggested by one of the reviewers. In our view, intro-
ducing unimodal non-target (tactile) trials in a focused attention paradigm is problematic:
here participants are explicitly instructed to ignore the tactile stimulus and to respond to
the visual target only. This asymmetry in the role of the two modalities is specific to the
focused attention paradigm; it does not apply to the redundant target paradigm where
subjects respond to whichever stimulus they detect first.
p376 Modeling Visual-Tactile Interaction 25
about the coordinate transformations required to determine that, e.g., a tac-
tile stimulus applied to the palm is in spatial register with a visual stimulus
(cf. Andersen & Buneo, 2002). Our modeling results may help to pursue such
an approach. The finding that laterality of the stimulus arrangement plays
the dominant role in determining the amount of interaction and that eccen-
tricity of the tactile stimulus position also matters is consistent with a rep-
resentation of space in eye-centered response fields that are gain-modulated
by limb-position signals (cf. Andersen et al., 1997; Pouget & Snyder, 2000).
Recent brain imaging (fMRI) studies with subjects receiving simple visual
or tactile stimuli in either the right or left hemifield identified multimodal
areas in intraparietal sulcus and in the frontal eye fields (Macaluso & Driver,
2001). In a related focused attention (fMRI) study subjects received either
left or right visual targets near to the hand where vibrotactile non-targets
were also delivered on half of the trials (Macaluso, Frith, & Driver, 2000a).
Neural activity in the occipital visual areas was significantly amplified when
visual and tactile stimuli were presented at the same location compared to
when tactile stimulation was applied to the opposite hand. Moreover, they
showed that this multisensory interaction depended on the spatial alignment
of the crossmodal stimuli in external space, rather than on initial projection
of the visual and tactile stimuli to a common hemisphere (Macaluso, Frith,
& Driver, 2002). Note how this squares with our results in experimental
Condition III: in ipsilateral trials, visual target and tactile non-target were
always presented spatially close to each other but, over different blocks, at
widely different locations: from 10◦ eccentricity to 50◦ and to 70◦. Never-
theless, in the best-fitting models 6 and 8 the corresponding ∆ values were
nearly (model 6) or perfectly (model 8) invariant over these configurations.
These imaging results suggest that the spatial location of the stimuli are
p376 Modeling Visual-Tactile Interaction 26
first represented cortically in modality-specific maps and, at a later stage
of processing, are integrated into a multimodal spatial representation. Note
that this assumption of a feed-forward convergence from unimodal to multi-
modal brain areas is also consistent with the basic TWIN architecture where,
however, no specific assumptions are being made with respect to the under-
lying circuitry (subcortical or cortical). Another important finding of these
imaging studies is the following: Tactile stimulation was found to influence
activity in unimodal visual occipital areas when tactile attention was directed
to one hemifield (Macaluso, Frith, & Driver, 2000b) or with unpredictable
tactile stimulation (Macaluso et al., 2000a). This spatially-specific influence
is suggested to be due to back-projections from multimodal parietal areas
and has also been shown to depend on gaze direction, regardless of whether
the stimulated hand was seen or not (Macaluso et al., 2002). This feedback
system may be part of a mechanism operating to solve the the coordinate
transformations required for crossmodal sensory integration (Andersen, Sny-
der, Bradley, & Xing, 1997)9. There is no evidence at present, however, that
this activity modulation in unimodal cortical areas would also affect the early
peripheral processing stage stage that is represented as the first stage in the
TWIN model.
Finally, a general warning concerning the interpretation of these fMRI
results seems in order, however10. Given that many brain areas contain both
uni- and multisensory cells, an enhanced BOLD signal could be the result of
recruitment of unimodal cells rather than increased response of multisensory
cells. Moreover, in a recent study the above authors found crossmodal con-
gruency effects (in lateral occipital and parietal operculum regions, i.e., in
9For a neural network model with forward and backward connections using known
properties of cortical neurons, see Deneve, Latham, & Pouget (2001)10We are grateful to a reviewer for pointing this out.
p376 Modeling Visual-Tactile Interaction 27
visual and somatosensory cortex) irrespective of which modality was defined
as target, and of whether the stimuli were used to guide eye movements or
were received passively (Macaluso, Frith, & Driver, 2005). This indepen-
dence of the BOLD response of task context and target/non-target modality
make it unlikely that fMRI data speak powerfully to the issues raised by the
specific assumptions of the TWIN model.
p376 Modeling Visual-Tactile Interaction 28
References
Amlot, R., Walker, R., Driver, J., & Spence, C. (2003). Multimodal visual-
somatosensory integration in saccade generation. Neuropsychologia,
41, 1–15.
Andersen, R. A., & Buneo, C. A. (2002). Intentional maps in posterior
parietal cortex. Annual Review of Neuroscience, 25, 189–220.
Andersen, R. A., Snyder, L. H., Bradley, D. C., & Xing, J. (1997). Mul-
timodal representations of space in the posterior parietal cortex and
its use in planning movements. Annual Review of Neuroscience, 20,
303–330.
Arndt, A., & Colonius, H. (2003). Two separate stages in crossmodal sac-
cadic integration: Evidence from varying intensity of an auditory ac-
cessory stimulus. Experimental Brain Research, 150, 417–426.
Bruce, C., Desimone, R., & Gross, C. G. (1981). Visual properties of neu-
rons in a polysensory area in superior temporal sulcus of the macaque.
Journal of Neurophysiology, 46, 369–384.
Browne, M.W., & Cudek, R. C. (1992). Alternative ways of assessing model
fit. Sociological Methods and Research, 21, 230–258.
Colonius, H. (1990). Possibly dependent probability summation of reaction
time. Journal of Mathematical Psychology, 34, 253–275.
Colonius, H., & Arndt, P. (2001). A two-stage model for visual-auditory
interaction in saccadic latencies. Perception & Psychophysics, 63, 126–
147.

p376 Modeling Visual-Tactile Interaction 29
Colonius, H., & Diederich, A. (2006). Race model inequality: How to in-
terpret a geometric measure of the amount of violation. Psychological
Review, 113, 148–154.
Colonius, H., & Diederich, A. (2004). Multisensory interaction in saccadic
reaction time: A time-window-of-integration model. Journal of Cogni-
tive Neuroscience, 16, 1000–1009.
Corneil, B. D., Van Wanrooij, M., Munoz, D. P.,& Van Opstal, A. J.
(2002). Auditory-visual interactions subserving goal-directed saccades
in a complex scene. Journal of Neurophysiology, 88, 438–454.
Deneve, S., Lathan, P., & Pouget, A. (2001). Efficient computation and
cue integration with noisy population codes. Nature Neuroscience, 4,
826–831.
Diederich, A. & Colonius, H. (2004a). Bimodal and trimodal multisensory
enhancement of reaction time: Effects of stimulus onset and intensity.
Perception & Psychophysics, 66, 1388–1404.
Diederich, A., & Colonius, H. (2004b). Modeling the time course of multi-
sensory interaction in manual and saccadic responses. In: G. Calvert,
C. Spence, B. E. Stein (eds.), Handbook of Multisensory Processes (pp.
395–408). MIT Press, Cambridge, MA.
Diederich, A., Colonius, H., Bockhorst, D., & Tabeling, S. (2003). Visual-
tactile spatial interaction in saccade generation. Experimental Brain
Research, 148, 328–337.
Duhamel, J. R., Colby, C. L., & Goldberg, M. E. (1998). Ventral intra-
parietal area of the macaque: congruent visual and somatic response
properties. Journal of Neurophysiology, 79, 126–136.
p376 Modeling Visual-Tactile Interaction 30
Frens, M. A., Van Opstal, A. J., & Van der Willigen, R. F. (1995). Spatial
and temporal factors determine auditory-visual interactions in human
saccadic eye movements. Perception & Psychophysics, 57, 802–816.
Frens, M. A., & Van Opstal (1998). Visual-auditory interactions modulate
saccade-related activity in monkey superior colliculus. Brain Research
Bulletin, 46, 211–224.
Graziano, M. S., & Gross, C. G. (1995). The representation of extraper-
sonal space: A possible role for bimodal, visual-tactile neurons. In
M. S. Gazzaniga (ed.), The cognitive neurosciences (pp. 1021–1034).
Cambridge, MA: MIT Press.
Groh, J. M., & Sparks, D. L. (1996). Saccades to somotosensory targets. I.
Behavioral characteristics. Journal of Neurophysiology, 75, 412–427.
Hughes, H. C., Reuter-Lorenz, P.-A., Nozawa, G., & Fendrich, R. (1994).
Visual-auditory interactions in sensorimotor processing: Saccades ver-
sus manual responses. Journal of Experimental Psychology: Human
Perception & Performance, 20, 131–153.
Hughes, H. C., Nelson, M. D., & Aronchick, D. M. (1998). Spatial char-
acteristic of visual-auditory summation in human saccades. Vision
Research, 38, 3955–3963.
Kadunce, D. C., Vaughan, J. W., Wallace, M. T., & Stein, B. E. (2001).
The influence of visual and auditory receptive field organization on
multisensory integration in the superior colliculus. Experimental Brain
Research, 139, 303–310.
Kirchner, H., & Colonius, H. (2005). Interstimulus contingency facilitates
p376 Modeling Visual-Tactile Interaction 31
saccadic responses in a bimodal go/no-go task. Cognitive Brain Re-
search, 25, 261–272.
Lueck, C. J. , Crawford, T. J., Savage, C. J., & Kennard, C. (1990).
Auditory-visual interaction in the generation of saccades in man. Ex-
perimental Brain Research, 82, 149–157.
Macaluso, E., & Driver, J. (2001). Spatial attention and crossmodal inter-
actions between vision and touch. Neuropsychologia, 39, 1304–1316.
Macaluso, E., Frith, C. D., & Driver, J. (2000a). Modulation of human
visual cortes by crossmodal spatial attention. Science, 289, 1206–1208.
Macaluso, E., Frith, C. D., & Driver, J. (2000b). Selective spatial attention
in vision and touch : unimodal and multimodal mechanisms revealed
by PET. Journal of Neurophysiology, 83, 3062–3075.
Macaluso, E., Frith, C. D., & Driver, J. (2002). Crossmodal spatial influ-
ences of touch on extrastriate visual areas take current gaze direction
into account. Neuron, 34, 647–658.
Macaluso, E., Frith, C. D., & Driver, J. (2005). Multisensory stimulation
with or without saccades: fMRI evidence for crossmodal effects on
sensory-specific cortices that reflect multisensory location-congruence
rather than task-relevance. NeuroImage, 26, 414–425.
Meredith, M. A. (2002). On the neuronal basis for multisensory conver-
gence: a brief overview. Cognitive Brain Research, 14, 31–40.
Meredith, M. A., & Stein, B. E. (1986). Spatial factors determine the activ-
ity of multisensory neurons in cat superior colliculus. Brain Research,
365, 350–354.
p376 Modeling Visual-Tactile Interaction 32
Munoz, D. P., & Schall, J. D. (2004). Concurrent, distributed control of
saccade initiation in the frontal eye field and superior colliculus. In:
W. C. Hall & A. Moschovakis (eds.), The superior colliculus: New
approaches for studying sensorimotor integration (pp. 55–82). Boca
Raton, FL: CRC Press.
Pouget, A., & Snyder, L. H. (2000). Computational approaches to sensori-
motor transformations. Nature Neuroscience, 3, 1193–98.
Sparks, D. L. (1986). Translation of sensory signals into commands for
control of saccadic eye movements: Role of primate superior colliculus.
Physiological Review, 66, 116–177.
Stanford, T. R. (2004). Signal coding in the primate superior colliculus
revealed through the use of artificial signals. In: W. C. Hall & A.
Moschovakis (eds.), The superior colliculus: New approaches for study-
ing sensorimotor integration (pp. 35–53). Boca Raton, FL: CRC Press.
Stein, B. E. & Meredith, M. A. (1993). The merging of the senses. Cam-
bridge,MA: MIT Press.
Stein, B. E., Magalhaes-Castro, & Kruger, L. (1976). Relationship between
visual and tactile representations in cat superior colliculus. Journal of
Neurophysiology, 39, 401–419.
Van Opstal, A. J., and Munoz, D.P. (2004). Auditory-visual interactions
subserving primate gaze orienting. In: G. Calvert, C. Spence, B. E.
Stein (eds.), Handbook of Multisensory Processes (pp. 373–393). Cam-
bridge, MA: MIT Press.

p376 Modeling Visual-Tactile Interaction 33
ACKNOWLEDGMENT
This research was supported by Deutsche Forschungsgemeinschaft (DFG)
grants No. Di 506/8–1 and 506/8–2 to both authors.
p376 Modeling Visual-Tactile Interaction 34
Tables
Condition Stimulus Position
±10◦ ±50◦ ±70◦
visual •I ↓ ↘ ↘
tactile ◦ ◦ ◦visual • • •
II ↑ ↗ ↗tactile ◦visual • • •
III l l ltactile ◦ ◦ ◦
Table 1: Stimulus arrangement for the three experimental conditions.
p376 Modeling Visual-Tactile Interaction 35
ModelStimulus Position Lat. 1 2 3 4 5 6 7 8visual tactile10◦ 10◦ i ∆ ∆s ∆i ∆i
s i ∗ 10◦ ∆i10◦ ∆1 ∆1
10◦ 50◦ i ∆ ∆ ∆i ∆i i ∗ 50◦ ∆i50◦ ∆3 ∆3
10◦ 70◦ i ∆ ∆ ∆i ∆i i ∗ 70◦ ∆i70◦ ∆4 ∆4
10◦ 10◦ c ∆ ∆ ∆c ∆c c ∗ 10◦ ∆c10◦ ∆2 ∆2
10◦ 50◦ c ∆ ∆ ∆c ∆c c ∗ 50◦ ∆c50◦ ∆4 ∆?
4
10◦ 70◦ c ∆ ∆ ∆c ∆c c ∗ 70◦ ∆c70◦ ∆5 ∆5
50◦ 10◦ i ∆ ∆ ∆i ∆i i ∗ 10◦ ∆i10◦ ∆3 ∆3
70◦ 10◦ i ∆ ∆ ∆i ∆i i ∗ 10◦ ∆i10◦ ∆4 ∆4
50◦ 10◦ c ∆ ∆ ∆c ∆c c ∗ 10◦ ∆c10◦ ∆4 ∆?
4
70◦ 10◦ c ∆ ∆ ∆c ∆c c ∗ 10◦ ∆c10◦ ∆5 ∆5
50◦ 50◦ i ∆ ∆s ∆i ∆is i ∗ 50◦ ∆i
50◦ ∆1 ∆1
70◦ 70◦ i ∆ ∆s ∆i ∆is i ∗ 70◦ ∆i
70◦ ∆1 ∆1
50◦ 50◦ c ∆ ∆ ∆c ∆c c ∗ 50◦ ∆c50◦ ∆6 ∆6
70◦ 70◦ c ∆ ∆ ∆c ∆c c ∗ 70◦ ∆c70◦ ∆7 ∆7
Table 2: Summary of the ∆ parameters for all eight models.

p376 Modeling Visual-Tactile Interaction 36
Processing time estimates in ms(10◦) 16
Visual peripheral (50◦) 58(70◦) 71
(50 Hz) 29Tactile peripheral
(5 Hz) 111Second stage 134
Table 3: Processing time estimates for the peripheral processes and the sec-ond stage.
p376 Modeling Visual-Tactile Interaction 37
Model1 2 3 4 5 6 7 8
∆ = 26 ∆s = 32 ∆i = 33 ∆is = 32 i = 1 ∆i
10◦ = 32 ∆1 = 32 ∆1 = 32∆ = 22 ∆c = 16 ∆c = 16 c = 0.46 ∆c
10◦ = 12 ∆2 = 16 ∆2 = 16∆i = 37 10◦ = 32 ∆i
50◦ = 31 ∆3 = 31 ∆3 = 3150◦ = 29 ∆c
50◦ = 24 ∆4 = 34 ∆∗4 = 24
70◦ = 38 ∆i70◦ = 43 ∆5 = 18 ∆4 = 43
∆c70◦ = 18 ∆6 = 2 ∆5 = 18
∆7 = 9 ∆6 = 3∆7 = 9
Table 4: ∆ parameters for each of the eight models.
p376 Modeling Visual-Tactile Interaction 38
5 HzStimulus Position Lat Observed Predicted SRT for ModelVisual Tactile SRT(SE) 1 2 3 4 5 6 7 8
10◦ 10◦ i 146(0.94) 146 146 146 146 146 146 146 14610◦ 10◦ c 146(1.01) 146 146 146 146 146 146 146 14610◦ 50◦ i 148(1.68) 146 146 146 146 146 146 146 14610◦ 50◦ c 146(1.69) 146 146 146 146 146 146 146 14610◦ 70◦ i 145(1.63) 146 146 146 146 146 146 146 14610◦ 70◦ c 143(1.62) 146 146 146 146 146 146 146 146
50 HzStimulus Position Lat Observed Predicted SRT for ModelVisual Tactile SRT 1 2 3 4 5 6 7 8
10◦ 10◦ i 138(0.89) 140 139 138 139 139 138 139 13910◦ 10◦ c 144(0.89) 140 142 144 144 145 144 144 14410◦ 50◦ i 138(1.50) 140 142 138 137 139 139 139 13910◦ 50◦ c 145(1.49) 140 142 144 144 141 145 138 14110◦ 70◦ i 135(1.46) 140 142 138 137 135 136 138 13510◦ 70◦ c 143(1.53) 140 142 144 144 143 143 143 143
Table 5: Condition 1: Observed and predicted SRT for a 5 Hz (top) and a50 Hz non-target.
p376 Modeling Visual-Tactile Interaction 39
5 HzStimulus Position Lat Observed Predicted SRT for ModelVisual Tactile SRT 1 2 3 4 5 6 7 8
10◦ 10◦ i 146(0.93) 146 146 146 146 146 146 146 14610◦ 10◦ c 146(1.01) 146 146 146 146 146 146 146 14650◦ 10◦ i 176(1.45) 183 181 181 181 181 181 181 18150◦ 10◦ c 182(1.46) 183 181 181 181 181 181 181 18170◦ 10◦ i 185(1.28) 196 194 193 194 194 193 194 19470◦ 10◦ c 202(1.85) 196 194 193 194 194 193 194 194
50 HzStimulus Position Lat Observed Predicted SRT for ModelVisual Tactile SRT(SE) 1 2 3 4 5 6 7 8
10◦ 10◦ i 138(0.89) 140 139 138 139 139 138 139 13910◦ 10◦ c 144(0.89) 140 142 144 144 145 144 144 14450◦ 10◦ i 172(1.29) 175 177 170 168 172 173 172 17250◦ 10◦ c 174(1.47) 175 177 182 182 176 183 169 17670◦ 10◦ i 176(1.40) 188 190 183 181 176 179 182 17670◦ 10◦ c 193(1.55) 188 190 195 195 193 193 193 193
Table 6: Condition 2: Observed and predicted SRT for a 5 Hz (top) and a50 Hz non-target.
p376 Modeling Visual-Tactile Interaction 40
5 HzStimulus Position Lat Observed Predicted SRT for ModelVisual Tactile SRT 1 2 3 4 5 6 7 8
10◦ 10◦ i 146(0.93) 146 146 146 146 146 146 146 14610◦ 10◦ c 146(1.01) 146 146 146 146 146 146 146 14650◦ 50◦ i 181(1.70) 183 181 181 181 181 181 181 18150◦ 50◦ c 187(1.61) 183 181 181 181 181 181 181 18170◦ 70◦ i 190(1.49) 196 194 193 194 194 193 194 19470◦ 70◦ c 203(1.47) 196 194 193 194 194 193 194 194
50 HzStimulus Position Lat Observed Predicted SRT for ModelVisual Tactile SRT 1 2 3 4 5 6 7 8
10◦ 10◦ i 138(0.89) 140 139 138 139 139 138 139 13910◦ 10◦ c 144(0.89) 140 142 144 144 145 144 144 14450◦ 50◦ i 177(1.61) 175 171 170 171 171 173 171 17150◦ 50◦ c 190(1.78) 175 177 182 182 184 183 189 19070◦ 70◦ i 181(1.48) 188 184 183 184 184 179 184 18470◦ 70◦ c 199(1.46) 188 190 195 195 197 193 199 199
Table 7: Condition 3: Observed and predicted SRT for a 5 Hz (top) and a50 Hz non-target.

p376 Modeling Visual-Tactile Interaction 41
LED SRTEccentricity Observed Predicted
10◦ 150 15050◦ 189 19270◦ 208 205
Table 8: Observed and predicted SRT for LED-only as a function of eccen-tricity.
p376 Modeling Visual-Tactile Interaction 42
Model 1 2 3 4 5 6 7 8Numberof Parameters 1 2 2 3 5 6 7 8χ2 505(24) 432(23) 260(22) 244(21) 231(20) 192(19) 219(18) 175(17)RMSE 4.10 3.86 2.99 2.95 2.98 2.77 3.02 2.76
Table 9: Number of parameters, χ2(df), and RMSE values for Models 1-8(see text for details).
p376 Modeling Visual-Tactile Interaction 43
Figures
70° 50° 10° 0° 10° 50° 70°130
140
150
SR
T (
ms)
contra ipsi
LED only5 Hz 50 Hz
Figure 1: Mean SRTs (± SE bars) to visual target at 10◦ left or right from
fixation as a function of tactile stimulus position for 5 Hz and 50 Hz tactile
frequency stimuli (Condition I). Horizontal line refers to unimodal visual
stimulus presentation.
p376 Modeling Visual-Tactile Interaction 44
70° 50° 10° 0° 10° 50° 70°130
140
150
160
170
180
190
200
210S
RT
(m
s)
contra ipsi
LED only5 Hz 50 Hz
Figure 2: Mean SRTs (± SE bars) to visual target as a function of visual
stimulus position with tactile stimulus (5 Hz and 50 Hz tactile frequency) at
10◦ left or right from fixation (Condition II). Upper graph refers to unimodal
visual stimulus presentation.
p376 Modeling Visual-Tactile Interaction 45
70° 50° 10° 0° 10° 50° 70°130
140
150
160
170
180
190
200
210S
RT
(m
s)
contra ipsi
LED only5 Hz 50 Hz
Figure 3: Mean SRTs (± SE bars) to visual target as a function of joint visual-
tactile stimulus position for 5 Hz and 50 Hz tactile frequency (Condition III).
Upper graph refers to unimodal visual stimulus presentation.
p376 Modeling Visual-Tactile Interaction 46
M1
Constant Spatial Effect
M2
Position
M3
Laterality
M7
Physical Distance
M4
Identical Position
and
Laterality
M6
Tactile Position
and
Laterality, Eccentricity
M8
Physical Distance
and
Laterality
M5
Tactile Position
and
Laterality Eccentricityx
Figure 4: TWIN model hierarchy for effects of spatial configuration features.
Lower level models refer to more specific assumptions.