INTRODUCTION TO THE USE OF THE UNFCCC - NAI GREENHOUSE GAS INVENTOY SOFTWARE
Upload
archibald-blackCategory
view
220download
1
1 6B.1
UNFCCC - NAI SOFTWARE Sector: Energy
Practical Aspects and Exercises
CGE Greenhouse Gas Inventory Hands – on Training Workshop for
the African Region
Pretoria, South Africa
18 – 22 September 2006
2 6B.2
CONTENT
Specific details of the UNFCCC - NAI Software use to calculate and report GHG emissions in the sector Energy.
Practical exercises (to be solved by the participants after the presentation).
3 6B.3
BACKGROUND
The choice of a good practice method is given by the decision threes in the IPCC GPG according to national circumstances.
UNFCCC -NAI Software contains, basically, the methods of smaller complexity that can use countries for the preparation of inventories.
However, in principle, the software can be used to report the estimated emissions independently of the complexity of used method (Tier 2, 3 etc).

4 6B.4
Sector: Energy
Sector 1: Energy Source Categories and Subcategories Worksheets CO2 From Fuel Combustion (Reference Approach) 1-1s1 to 1-1s5 and 1-1a (3) CO2 From Fuel Combustion -By source categories (sub-sectors)
1-2S1 to 1-2s16 and 1-2a 1-2 Overview (21) (*)
CO2.Transport (by category of transport and type of fuel) 1-2s5 to 1-2s6 Non-CO2 From Fuel Combustion -By source categories (sub-sectors) and gases 1-3s1 to 1-3s3 (11) SO2 From Fuel Combustion – By source categories (sub-sectors) 1-4s1 to 1-4s5 (5) (**) Emissions From Aircraft- Tier 2. By domestic and international aircraft type 1-5s1 to 1-5s3 (3) (9) Methane Emissions From Coal mining and Handling 1-6s1 (1) (***) Methane Emissions from Oil and Gas Activities 1-7s1 (IPCC, 1996) or 1-7s2 (GPG,
2000) (2) (****) Ozone Precursors and SO2 from Oil Refining 1-8s1- 1-8s4 (4) (#) Quantity of sheets
Changes in the worksheets with respect to the IPCC Software * The current software provides two copies of sheets 3-4, 9-10, 15-15 to facilitate calculate separately the emissions from
autogeneration (A) and process heat (B). Several modifications were made in the sheet 1-2 Overview to reduce sources of potential errors and to create automatic link with the sheet 1-3s1 (in the IPCC software it was filled manually).
** The current software provides a copy of sheet 1-4 for each sub-sector so that SO2 emissions can be calculated separately by sub-sectors without inserting new sheets manually.
*** New columns were inserted for taking into account methane that was recovered or flared. **** The current software provides two options (sheet 1-7s1 from IPCC, 1996 or sheet 1-7s2 from GPG, 2000). It also contains more
detailed emissions sub-categories. Please only fill either sheet 1-7s1 or sheet 1-7s2.
5 6B.5
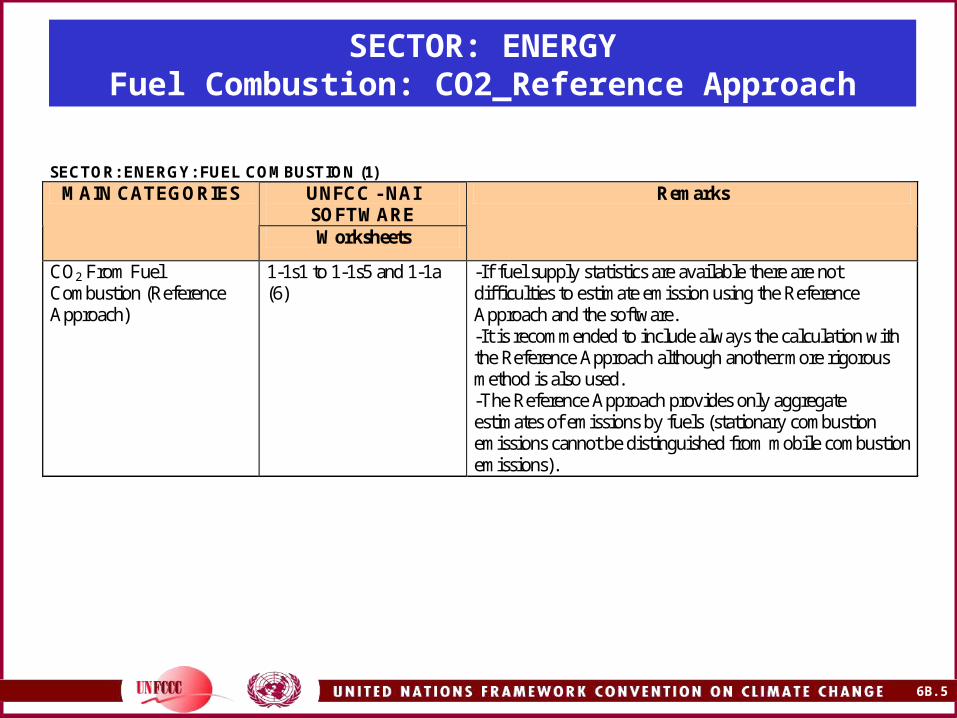
SECTOR: ENERGYFuel Combustion: CO2_Reference Approach
SECTOR: ENERGY: FUEL COMBUSTION (1)
UNFCC - NAI SOFTWARE
MAIN CATEGORIES
Worksheets
Remarks
CO2 From Fuel Combustion (Reference Approach)
1-1s1 to 1-1s5 and 1-1a (6)
-If fuel supply statistics are available there are not difficulties to estimate emission using the Reference Approach and the software. -It is recommended to include always the calculation with the Reference Approach although another more rigorous method is also used. -The Reference Approach provides only aggregate estimates of emissions by fuels (stationary combustion emissions cannot be distinguished from mobile combustion emissions).
6 6B.6
SECTOR: ENERGY
Exercise 1.1: CO2 Reference Approach Tier 1 (I)
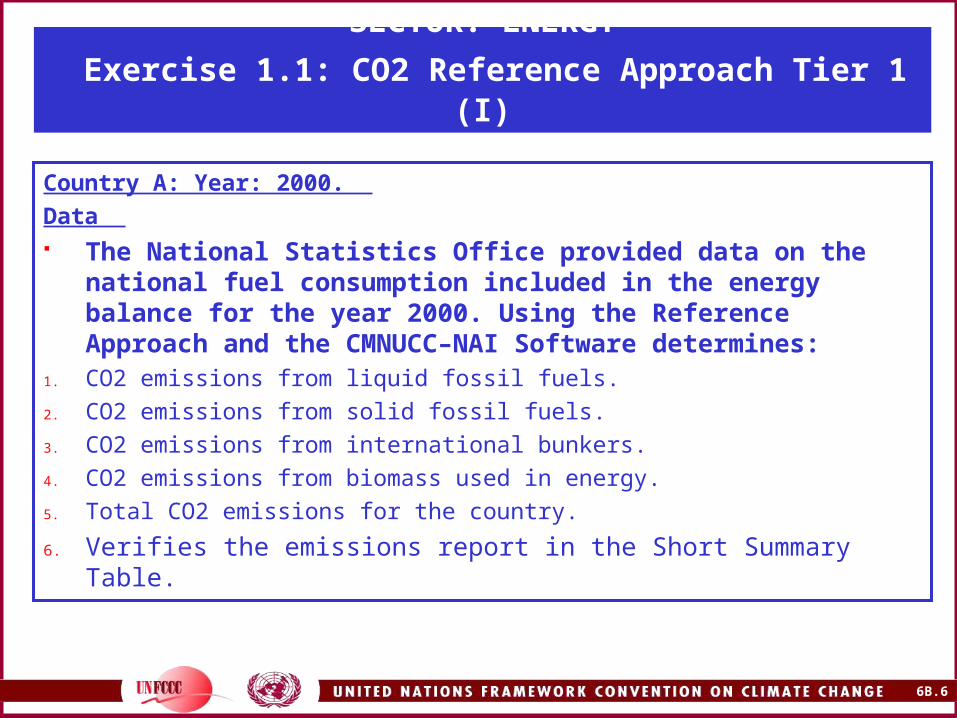
Country A: Year: 2000.
Data The National Statistics Office provided data on the national fuel
consumption included in the energy balance for the year 2000. Using the Reference Approach and the CMNUCC–NAI Software determines:
1. CO2 emissions from liquid fossil fuels.
2. CO2 emissions from solid fossil fuels.
3. CO2 emissions from international bunkers.
4. CO2 emissions from biomass used in energy.
5. Total CO2 emissions for the country.
6. Verifies the emissions report in the Short Summary Table.
7 6B.7
SECTOR: ENERGY Exercise 1.1: CO2 Reference Approach Tier 1 (II)
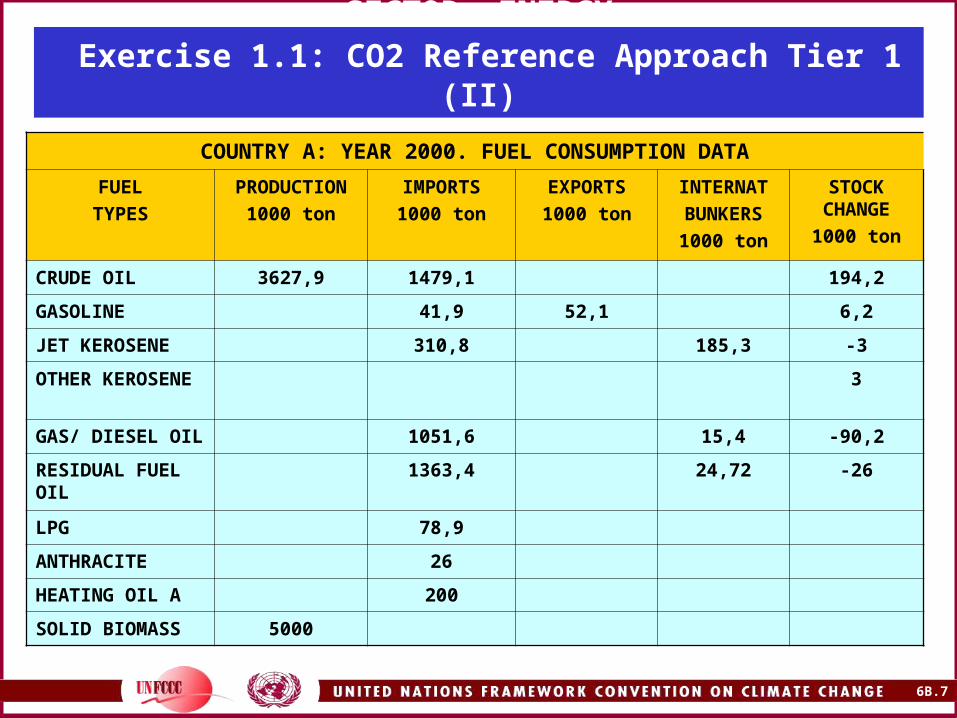
COUNTRY A: YEAR 2000. FUEL CONSUMPTION DATA
FUEL
TYPES
PRODUCTION
1000 ton
IMPORTS
1000 ton
EXPORTS
1000 ton
INTERNAT
BUNKERS
1000 ton
STOCK CHANGE
1000 ton
CRUDE OIL 3627,9 1479,1 194,2
GASOLINE 41,9 52,1 6,2
JET KEROSENE 310,8 185,3 -3
OTHER KEROSENE
3
GAS/ DIESEL OIL 1051,6 15,4 -90,2
RESIDUAL FUEL OIL
1363,4 24,72 -26
LPG 78,9
ANTHRACITE 26
HEATING OIL A 200
SOLID BIOMASS 5000

8 6B.8
SECTOR: ENERGY Exercise 1.1: CO2 Reference Approach Tier 1 (III)
OTHER DATA LINKED TO THE FUELS CONSUMPTION
FUEL TYPES CONVERSION FACTOR
TJ/1000 ton
CARBON EMISSION FACTOR
t C/TJ
CRUDE OIL 43,12 20
GASOLINE 44,95 18,9
JET KEROSENE 44,15 19,5
OTHER KEROSENE 43,87 19,6
GAS/DIESEL OIL 43,16 20,2
RESIDUAL FUEL OIL L 40,57 21,1
LPG 47,65 17,2
ANTHRACITE 33,01 26,8
HEATING OIL A 40,9 18
SOLID BIOMASS 16,23 29,9
9 6B.9
SECTOR: ENERGY Exercise 1.1: CO2 Reference Approach Tier 1 (IV)
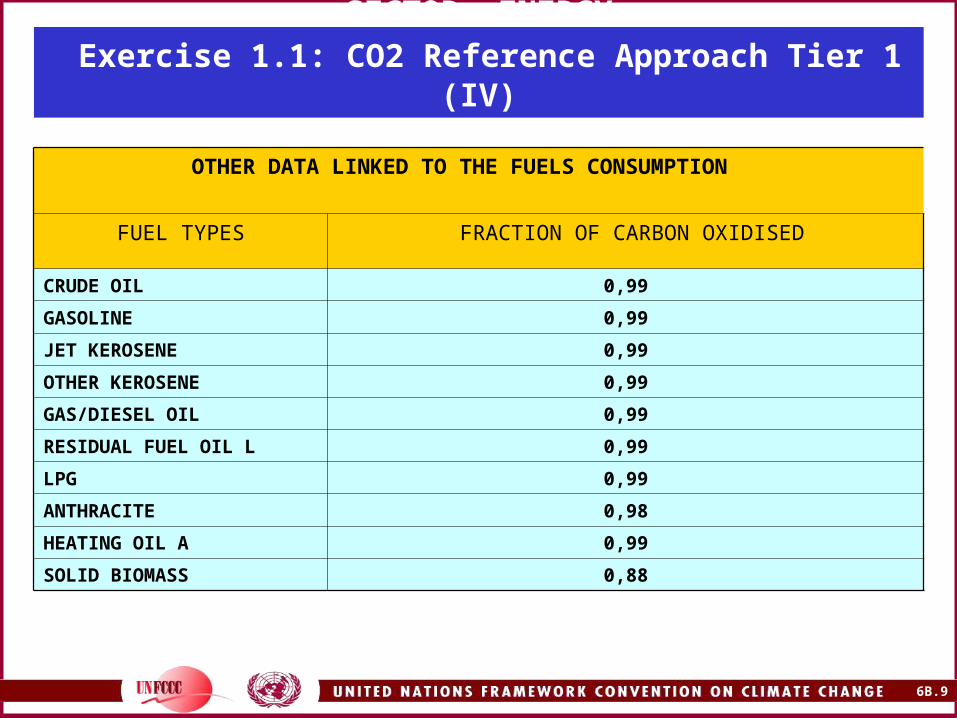
OTHER DATA LINKED TO THE FUELS CONSUMPTION
FUEL TYPES FRACTION OF CARBON OXIDISED
CRUDE OIL 0,99
GASOLINE 0,99
JET KEROSENE 0,99
OTHER KEROSENE 0,99
GAS/DIESEL OIL 0,99
RESIDUAL FUEL OIL L 0,99
LPG 0,99
ANTHRACITE 0,98
HEATING OIL A 0,99
SOLID BIOMASS 0,88
10 6B.10
SECTOR: ENERGYExercise 1.1: CO2 Reference Approach Tier 1 (V)
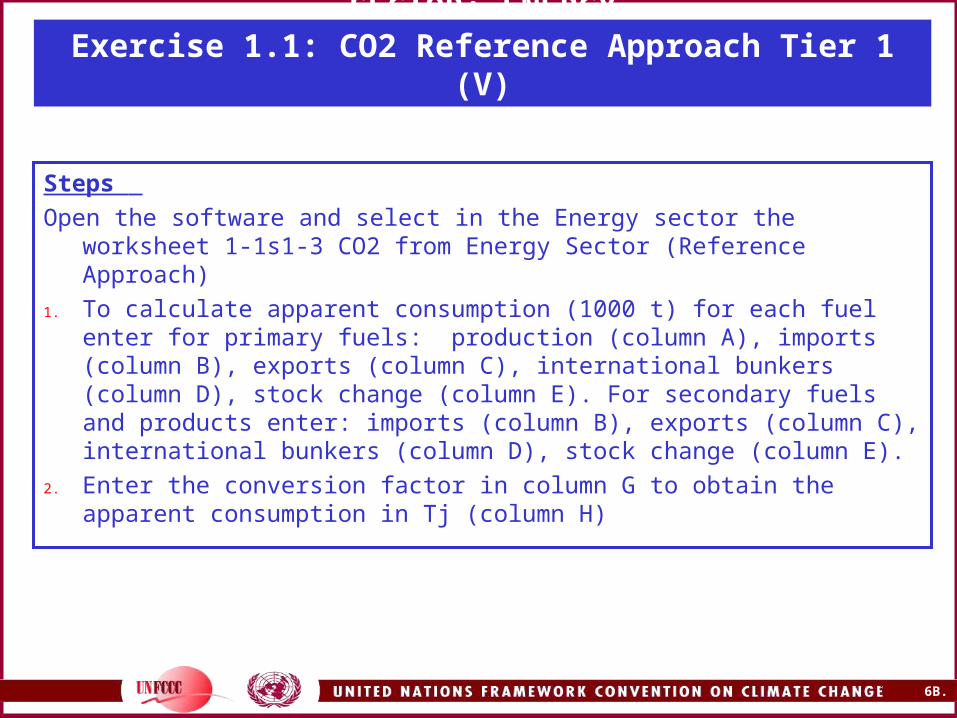
Steps
Open the software and select in the Energy sector the worksheet 1-1s1-3 CO2 from Energy Sector (Reference Approach)
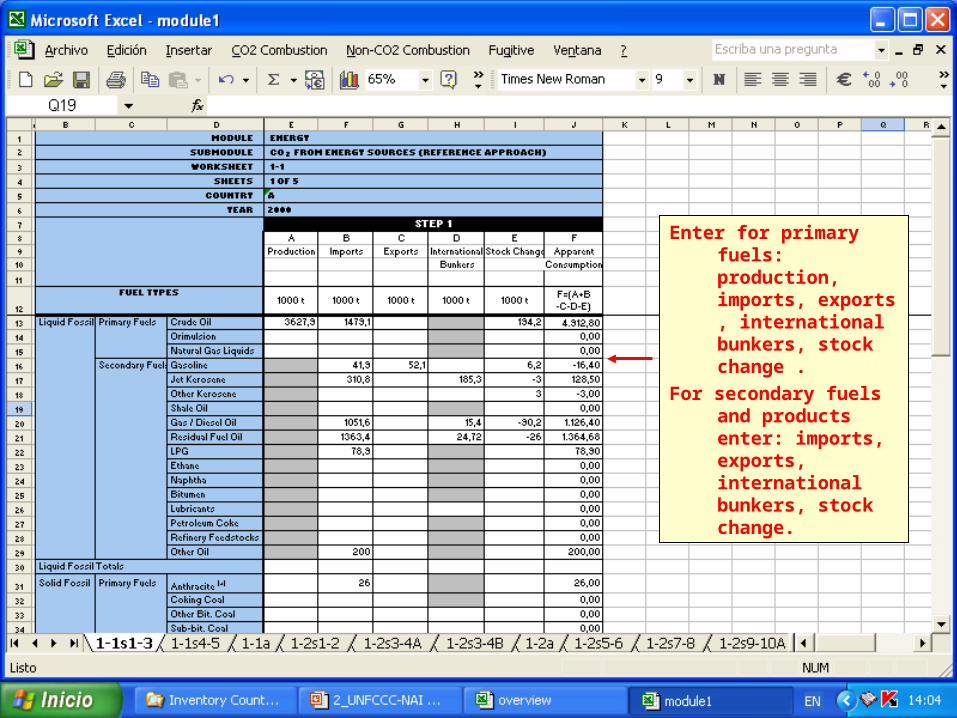
1. To calculate apparent consumption (1000 t) for each fuel enter for primary fuels: production (column A), imports (column B), exports (column C), international bunkers (column D), stock change (column E). For secondary fuels and products enter: imports (column B), exports (column C), international bunkers (column D), stock change (column E).
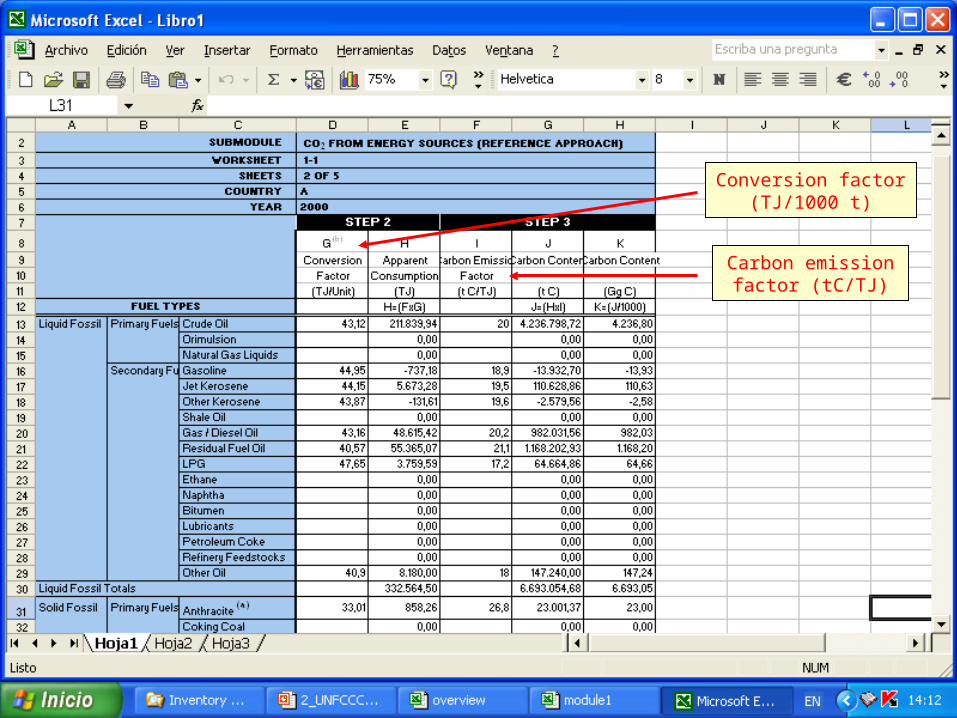
2. Enter the conversion factor in column G to obtain the apparent consumption in Tj (column H)
11 6B.11
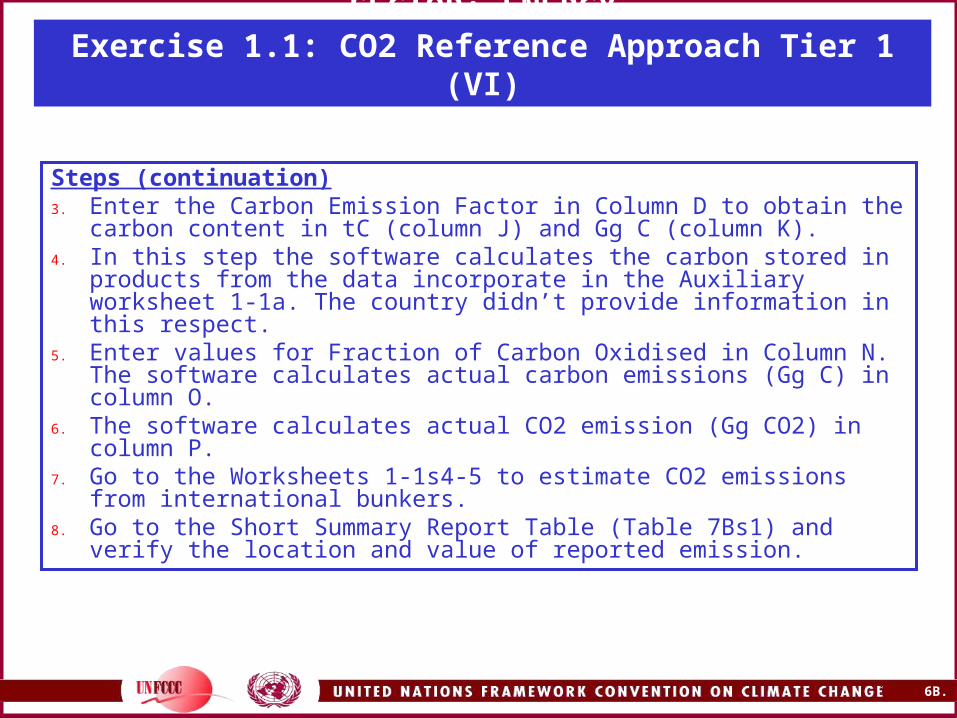
SECTOR: ENERGYExercise 1.1: CO2 Reference Approach Tier 1 (VI)
Steps (continuation)3. Enter the Carbon Emission Factor in Column D to obtain the carbon
content in tC (column J) and Gg C (column K).4. In this step the software calculates the carbon stored in products
from the data incorporate in the Auxiliary worksheet 1-1a. The country didn’t provide information in this respect.
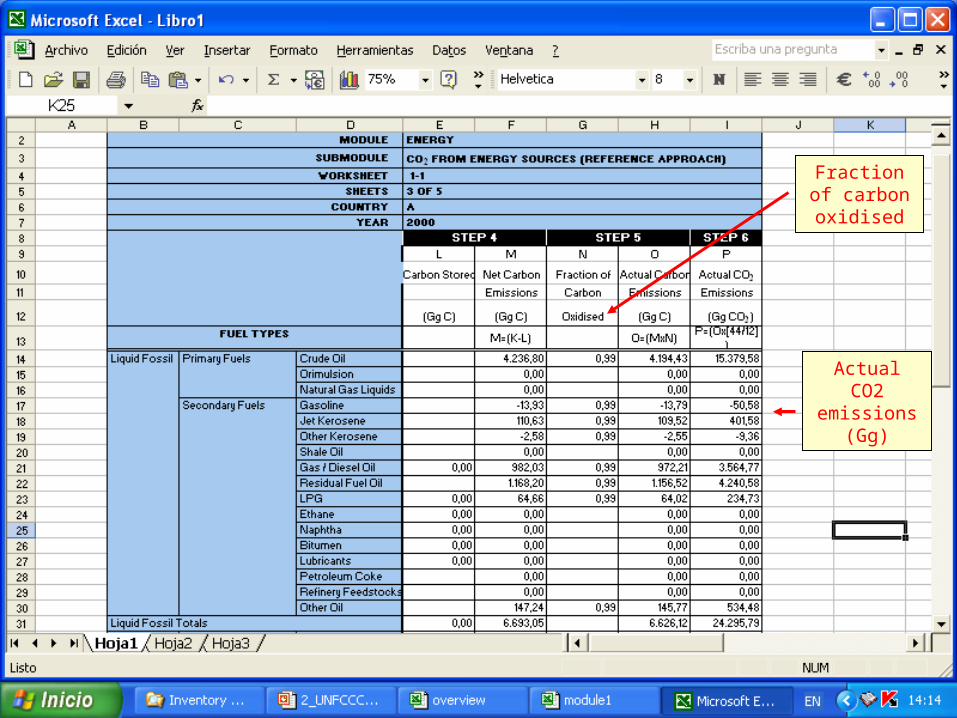
5. Enter values for Fraction of Carbon Oxidised in Column N. The software calculates actual carbon emissions (Gg C) in column O.
6. The software calculates actual CO2 emission (Gg CO2) in column P.7. Go to the Worksheets 1-1s4-5 to estimate CO2 emissions from
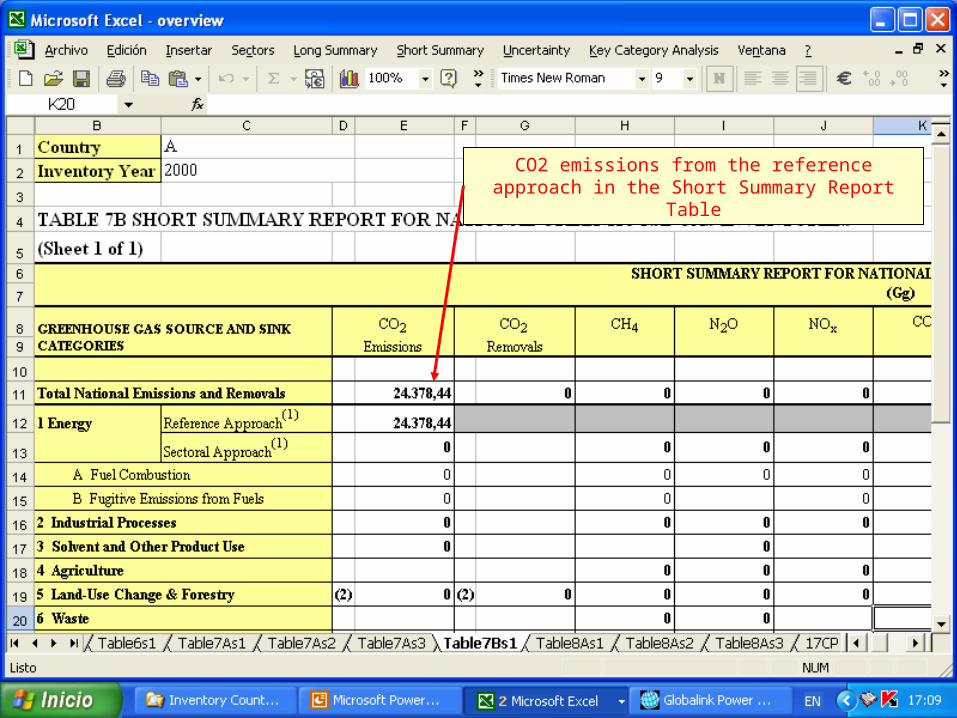
international bunkers.8. Go to the Short Summary Report Table (Table 7Bs1) and verify the
location and value of reported emission.
12 6B.12
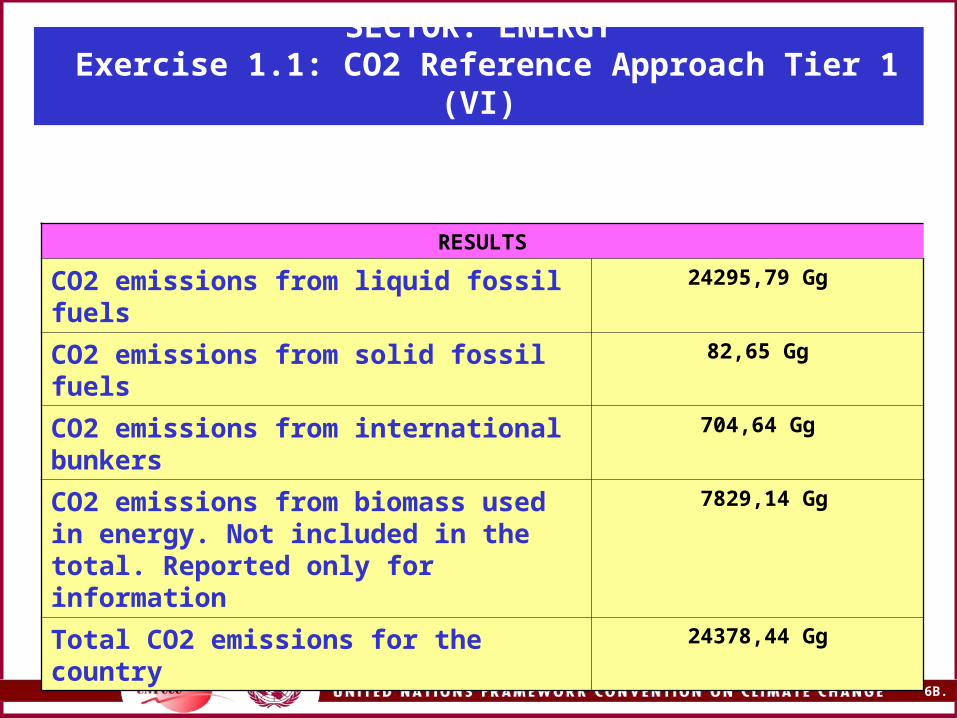
SECTOR: ENERGY Exercise 1.1: CO2 Reference Approach Tier 1 (VI)
RESULTS
CO2 emissions from liquid fossil fuels 24295,79 Gg
CO2 emissions from solid fossil fuels 82,65 Gg
CO2 emissions from international bunkers
704,64 Gg
CO2 emissions from biomass used in energy. Not included in the total. Reported only for information
7829,14 Gg
Total CO2 emissions for the country 24378,44 Gg
13 6B.13
Enter for primary fuels: production, imports, exports , international bunkers, stock change .
For secondary fuels and products enter: imports, exports, international bunkers, stock change.
14 6B.14
Conversion factor (TJ/1000 t)
Carbon emission factor (tC/TJ)
15 6B.15
Fraction of carbon
oxidised
Actual CO2 emissions
(Gg)

16 6B.16
SECTOR: ENERGY Exercise 1.1: CO2 Reference Approach Tier 1 (VI)
RESULTS
CO2 emissions from liquid fossil fuels 24295,79 Gg
CO2 emissions from solid fossil fuels 82,65 Gg
CO2 emissions from international bunkers
704,64 Gg
CO2 emissions from biomass used in energy. Not included in the total. Reported only for information
7829,14 Gg
Total CO2 emissions for the country 24378,44 Gg
17 6B.17
CO2 emissions from the reference approach in the Short Summary Report Table

18 6B.18
SECTOR: ENERGYFuel Combustion: CO2 by Source Categories
SECTOR: ENERGY: FUEL COMBUSTION (2) UNFCC - NAI SOFTWARE
MAIN CATEGORIES
Worksheets
Remarks
CO2 From Fuel Combustion -By source categories (sub-sectors)
1-2S1 to 1-2s16 and 1-2a 1-2 Overview (21)
Tier 1: Sectoral Approach -If estimates for fuel combusted by source category are available there are not difficulties to obtain emissions by sectors using the software. Alert: Attention should be paid when are incorporated in the Worksheets 1-2s1 to 1-2s16 other types of fossil fuels (liquid, solid or gases) not included in the listing of the software. These other fuels are compiled in the Worksheet 1-2 Overview like additional fuels.
1. In current software three columns (AO to AQ) were inserted and they should be filled manually.
2. If you have use columns AG to AK to specify the combustion of other (additional) fuels, then aggregate these other fuels here into solid, liquid and gaseous.
3. These other fuels are linked automatically to the totals in worksheet 1-2 Overview and to appropriate cells in worksheet 1-3s1.
19 6B.19
SECTOR: ENERGYFuel Combustion: CO2 by Source Categories
SECTOR: ENERGY: FUEL COMBUSTION (3)
UNFCCC - NAI SOFTWARE
MAIN CATEGORIES
Worksheets
Remarks
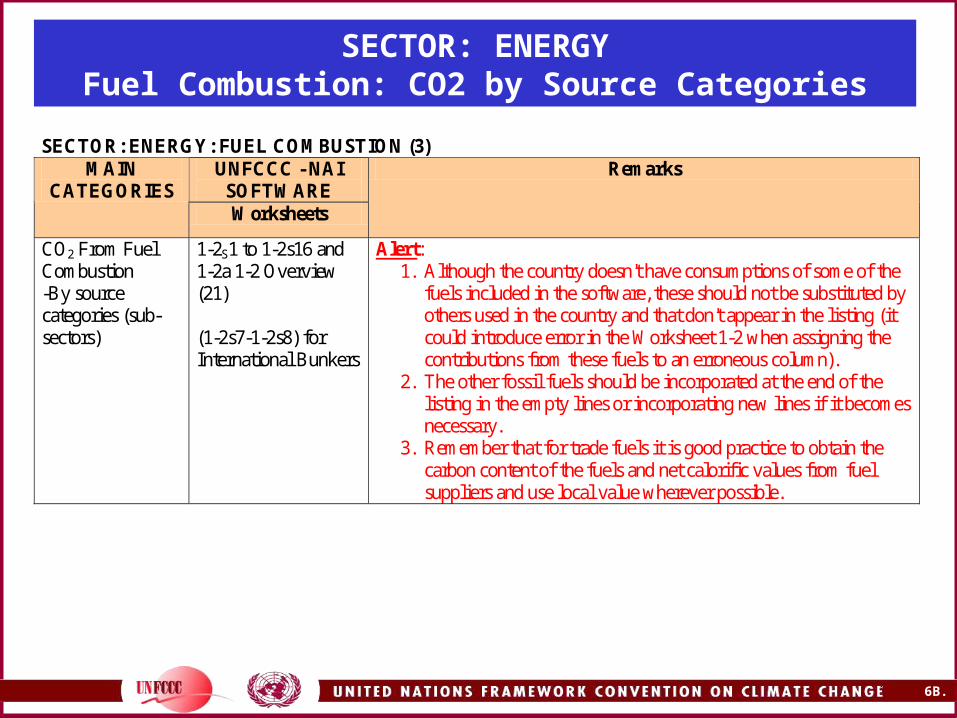
CO2 From Fuel Combustion -By source categories (sub-sectors)
1-2S1 to 1-2s16 and 1-2a 1-2 Overview (21) (1-2s7-1-2s8) for International Bunkers
Alert: 1. Although the country doesn't have consumptions of some of the
fuels included in the software, these should not be substituted by others used in the country and that don't appear in the listing (it could introduce error in the Worksheet 1-2 when assigning the contributions from these fuels to an erroneous column).
2. The other fossil fuels should be incorporated at the end of the listing in the empty lines or incorporating new lines if it becomes necessary.
3. Remember that for trade fuels it is good practice to obtain the carbon content of the fuels and net calorific values from fuel suppliers and use local value wherever possible.
20 6B.20
SECTOR: ENERGYFuel Combustion: CO2 (bottom-up)
SECTOR: ENERGY: FUEL COMBUSTION (3) (cont)
UNFCC - NAI SOFTWARE
MAIN CATEGORIES
Tier 1: Worksheets
Tier 2 Method
Remarks
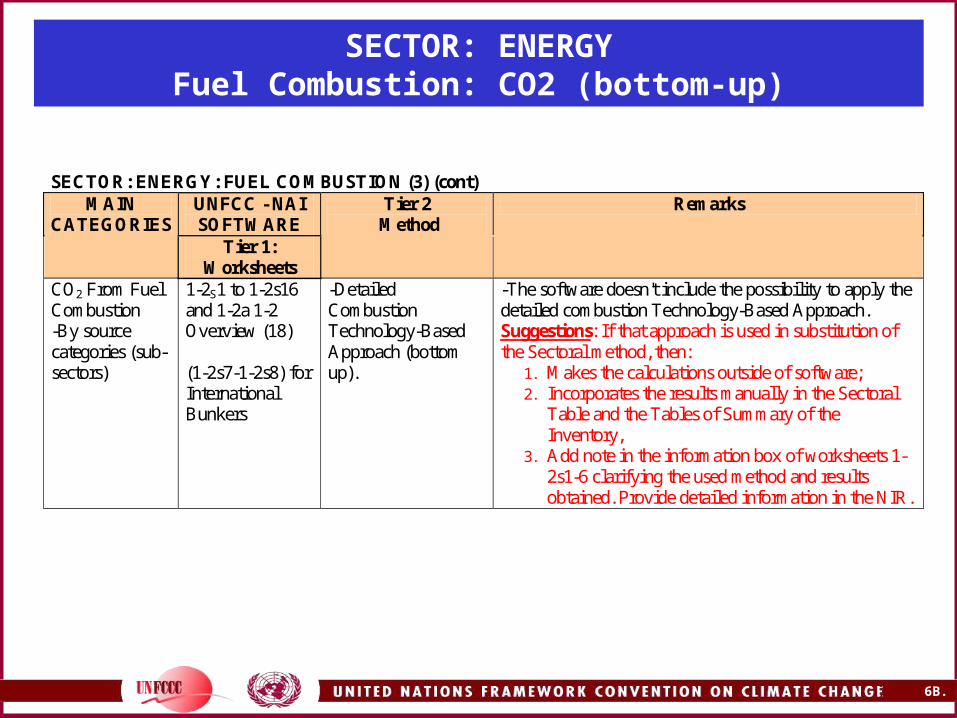
CO2 From Fuel Combustion -By source categories (sub-sectors)
1-2S1 to 1-2s16 and 1-2a 1-2 Overview (18) (1-2s7-1-2s8) for International Bunkers
-Detailed Combustion Technology-Based Approach (bottom up).
-The software doesn't include the possibility to apply the detailed combustion Technology-Based Approach. Suggestions: If that approach is used in substitution of the Sectoral method, then:
1. Makes the calculations outside of software; 2. Incorporates the results manually in the Sectoral
Table and the Tables of Summary of the Inventory,
3. Add note in the information box of worksheets 1-2s1-6 clarifying the used method and results obtained. Provide detailed information in the NIR.
21 6B.21
SECTOR: ENERGYExercise 1. 2: CO2 by Source Categories Tier 1 (I)
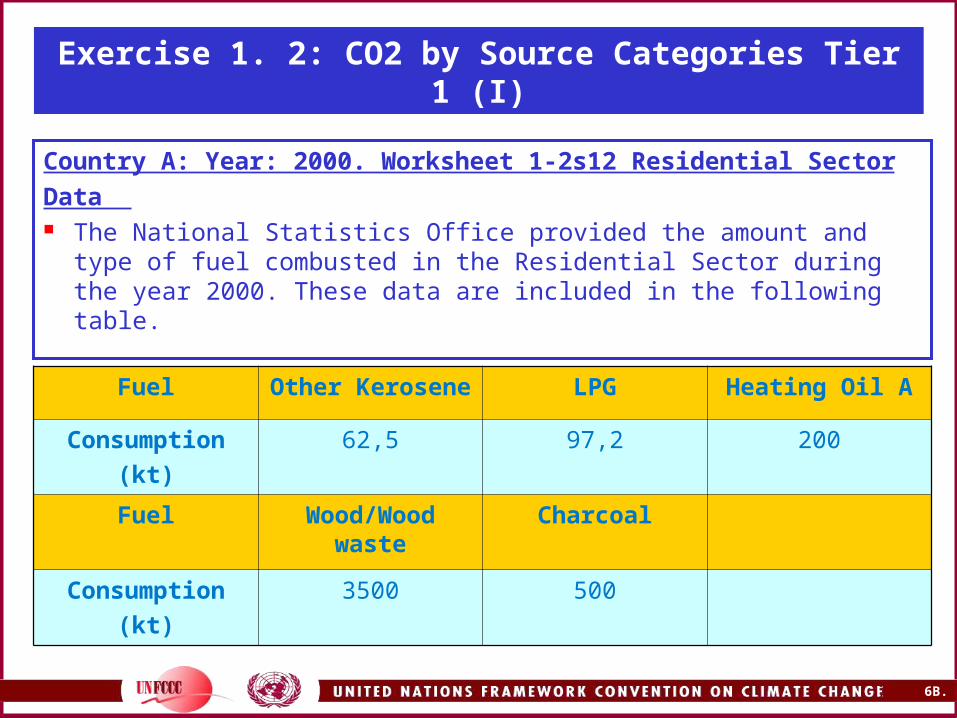
Country A: Year: 2000. Worksheet 1-2s12 Residential Sector
Data The National Statistics Office provided the amount and type of
fuel combusted in the Residential Sector during the year 2000. These data are included in the following table.
Fuel Other Kerosene LPG Heating Oil A
Consumption
(kt)
62,5 97,2 200
Fuel Wood/Wood waste
Charcoal
Consumption
(kt)
3500 500

22 6B.22
SECTOR: ENERGYExercise 1.2: CO2 by Source Categories Tier 1 (II)
Other Data: Use the following values for the calculation:
Fuel Other Kerosene LPG Heating Oil A
Conversion factor (TJ/kt)
43,8 47,6 40,9
Carbon EF
(tC/TJ)
19,6 17,2 18,0
Fraction of Carbon Oxidised
0,99 0,99 0,99
Fuel Wood/Wood waste Charcoal
Conversion factor (TJ/kt)
15,5 30,23
Carbon EF
(tC/TJ)
29,9 29,9
Fraction of Carbon Oxidised
0,88 0,88
23 6B.23
SECTOR: ENERGYExercise 1.2: CO2 by Source Categories Tier 1 (III)
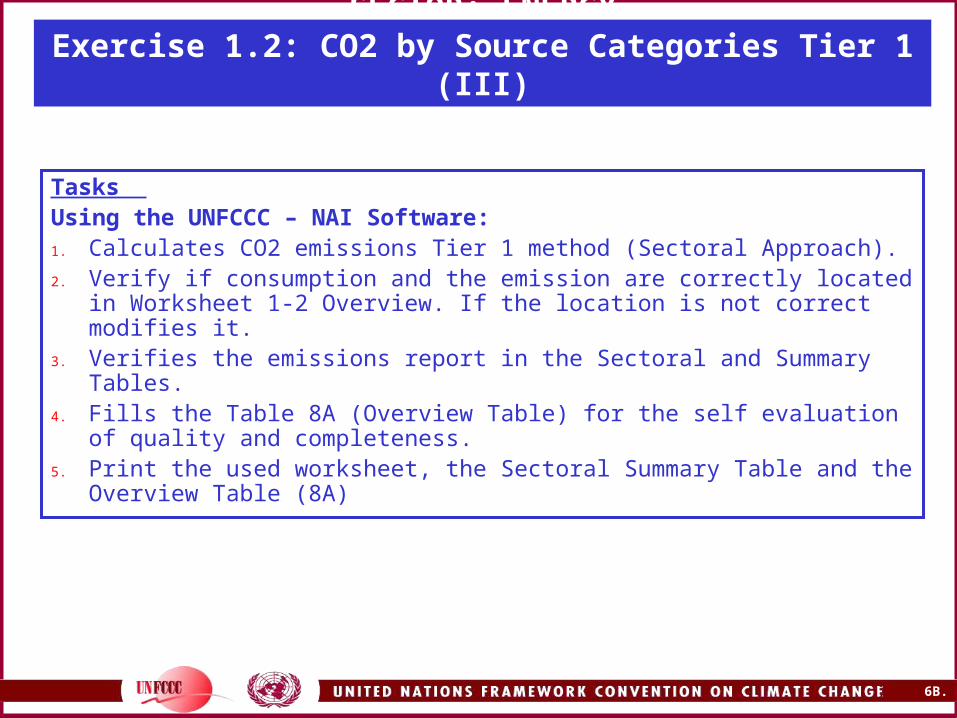
Tasks Using the UNFCCC – NAI Software:1. Calculates CO2 emissions Tier 1 method (Sectoral Approach).2. Verify if consumption and the emission are correctly located in
Worksheet 1-2 Overview. If the location is not correct modifies it.3. Verifies the emissions report in the Sectoral and Summary Tables.4. Fills the Table 8A (Overview Table) for the self evaluation of quality
and completeness. 5. Print the used worksheet, the Sectoral Summary Table and the
Overview Table (8A)

24 6B.24
SECTOR: ENERGYExercise 1.2: CO2 by Source Categories Tier 1 (IV)
Steps
Open the software and select in the Energy sector the worksheet 1-2s11-12 Residential Sector.
1. Enter the amount of each fuel consumed in Column A.
2. Enter the conversion factor to convert to terajoules in Column B.
3. Enter the Carbon Emission Factor in Column D.
4. In this step the software calculates the carbon stored in products from the data incorporate in the Auxiliary worksheet 1-2a. The country didn’t provide information in this respect.
25 6B.25
SECTOR: ENERGYExercise 1.2: CO2 by Source Categories Tier 1 (IV)
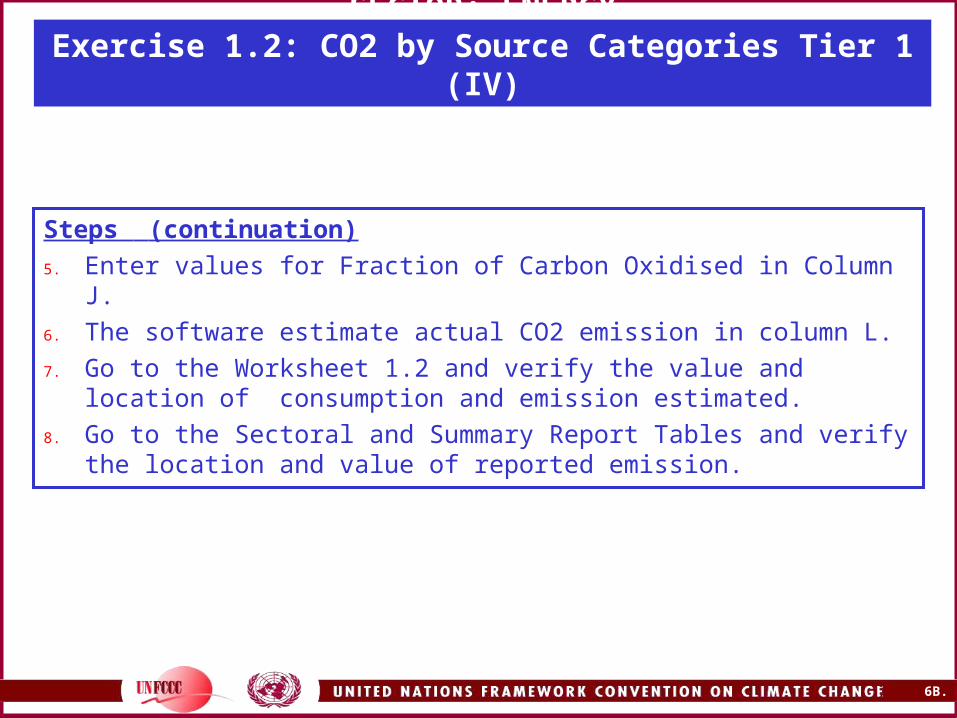
Steps (continuation)
5. Enter values for Fraction of Carbon Oxidised in Column J.
6. The software estimate actual CO2 emission in column L.
7. Go to the Worksheet 1.2 and verify the value and location of consumption and emission estimated.
8. Go to the Sectoral and Summary Report Tables and verify the location and value of reported emission.
26 6B.26
SECTOR: ENERGY Exercise 1.2: CO2 By Source Categories Tier 1 (V)
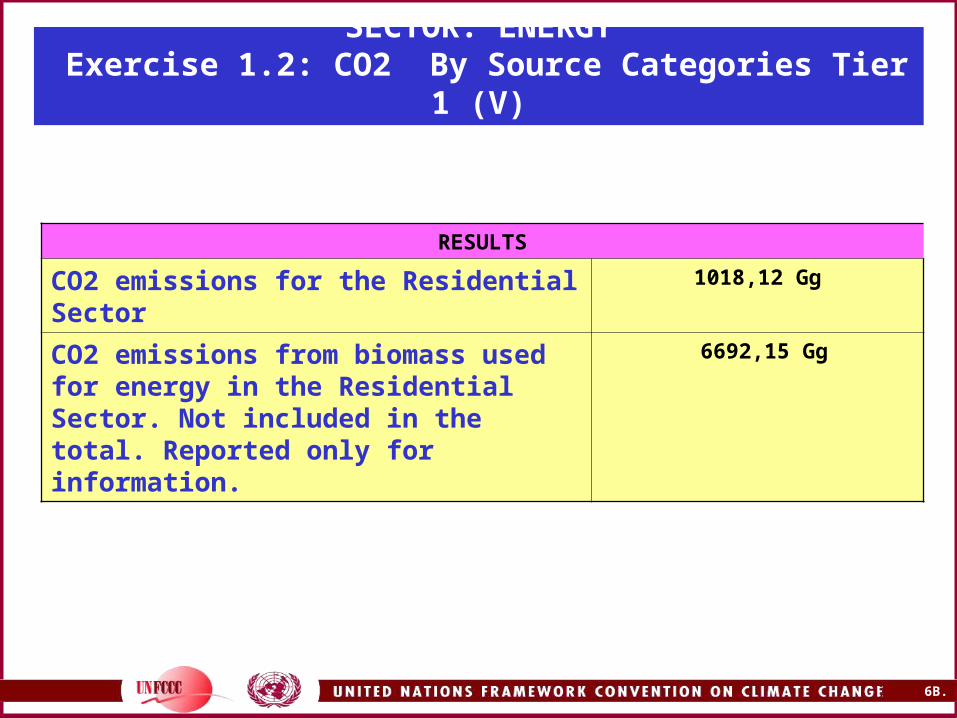
RESULTS
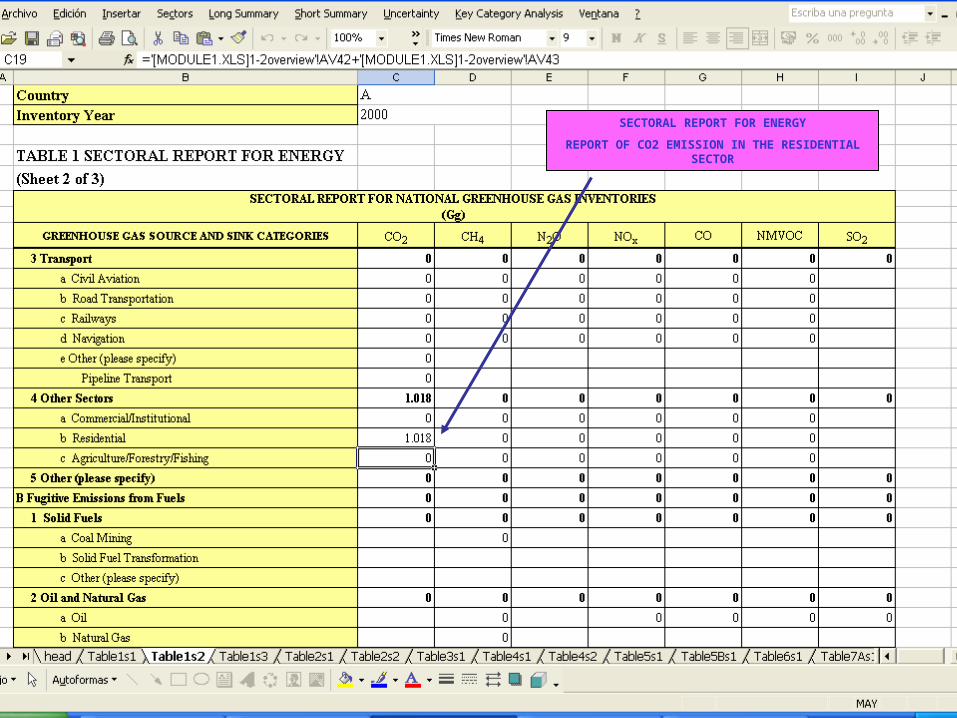
CO2 emissions for the Residential Sector 1018,12 Gg
CO2 emissions from biomass used for energy in the Residential Sector. Not included in the total. Reported only for information.
6692,15 Gg

27 6B.27
ADDITIONAL FUEL
NOT INCLUDED IN THE LIST OF FUELS
CO2 EMISSIONS
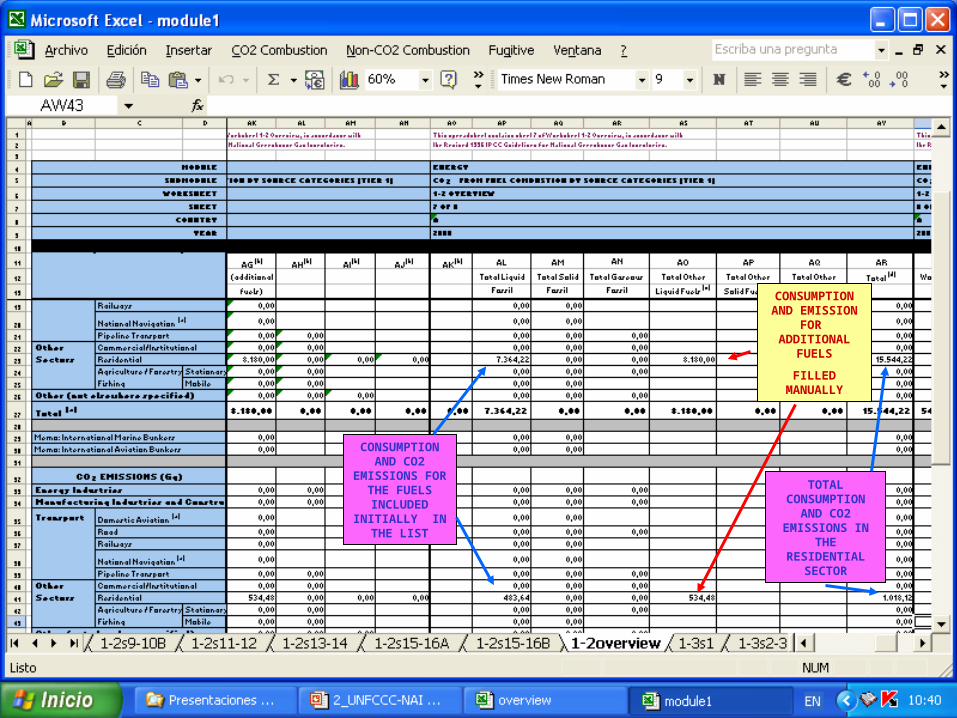
28 6B.28
CONSUMPTION AND EMISSION
FOR ADDITIONAL
FUELS
FILLED MANUALLY
CONSUMPTION AND CO2
EMISSIONS FOR THE FUELS
INCLUDED INITIALLY IN
THE LIST
TOTAL CONSUMPTION
AND CO2 EMISSIONS IN
THE RESIDENTIAL
SECTOR
29 6B.29
SECTORAL REPORT FOR ENERGY
REPORT OF CO2 EMISSION IN THE RESIDENTIAL SECTOR

30 6B.30
SECTORAL REPORT FOR ENERGY
REPORT OF TOTAL CO2 EMISSIONS IN THE ENERGY SECTOR AND FUEL COMBUSTION
ACTIVITIES

31 6B.31
SECTORAL REPORT FOR ENERGY
REPORT OF TOTAL CO2 EMISSIONS FROM BIOMASS IN THE ENERGY SECTOR
32 6B.32
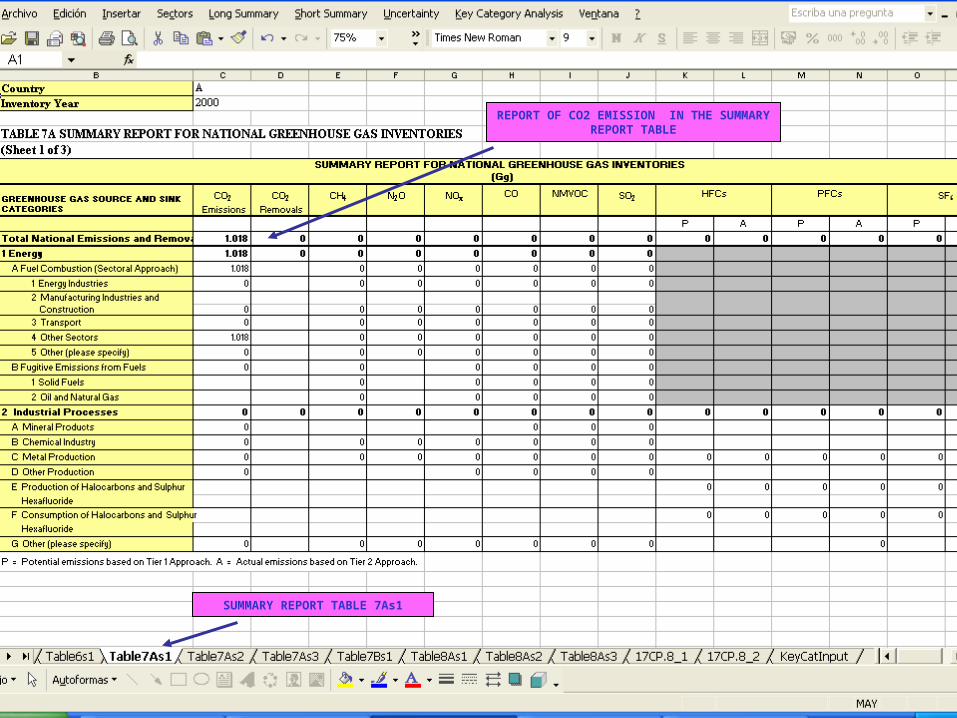
REPORT OF CO2 EMISSION IN THE SUMMARY REPORT TABLE
SUMMARY REPORT TABLE 7As1

33 6B.33
REPORT OF CO2 EMISSION IN THE SHORT SUMMARY REPORT TABLE
SHORT SUMMARY REPORT TABLE
34 6B.34
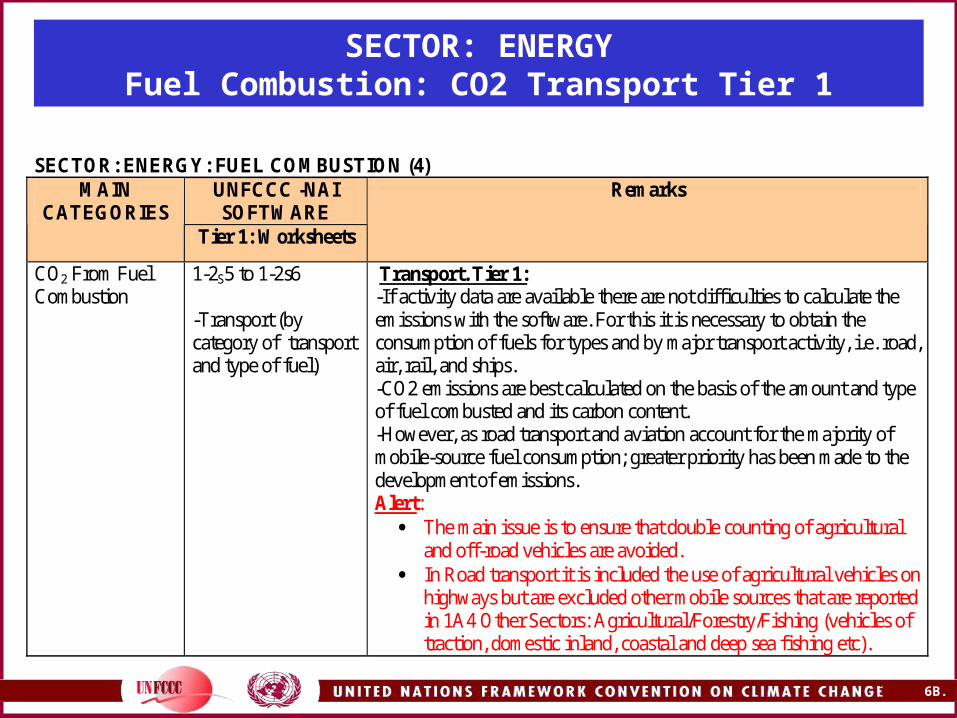
SECTOR: ENERGYFuel Combustion: CO2 Transport Tier 1
SECTOR: ENERGY: FUEL COMBUSTION (4)
UNFCCC -NAI SOFTWARE
MAIN CATEGORIES
Tier 1: Worksheets
Remarks
CO2 From Fuel Combustion
1-2S5 to 1-2s6 -Transport (by category of transport and type of fuel)
Transport. Tier 1: -If activity data are available there are not difficulties to calculate the emissions with the software. For this it is necessary to obtain the consumption of fuels for types and by major transport activity, i.e. road, air, rail, and ships. -CO2 emissions are best calculated on the basis of the amount and type of fuel combusted and its carbon content. -However, as road transport and aviation account for the majority of mobile-source fuel consumption; greater priority has been made to the development of emissions. Alert:
The main issue is to ensure that double counting of agricultural and off-road vehicles are avoided.
In Road transport it is included the use of agricultural vehicles on highways but are excluded other mobile sources that are reported in 1A4 Other Sectors: Agricultural/Forestry/Fishing (vehicles of traction, domestic inland, coastal and deep sea fishing etc).
35 6B.35
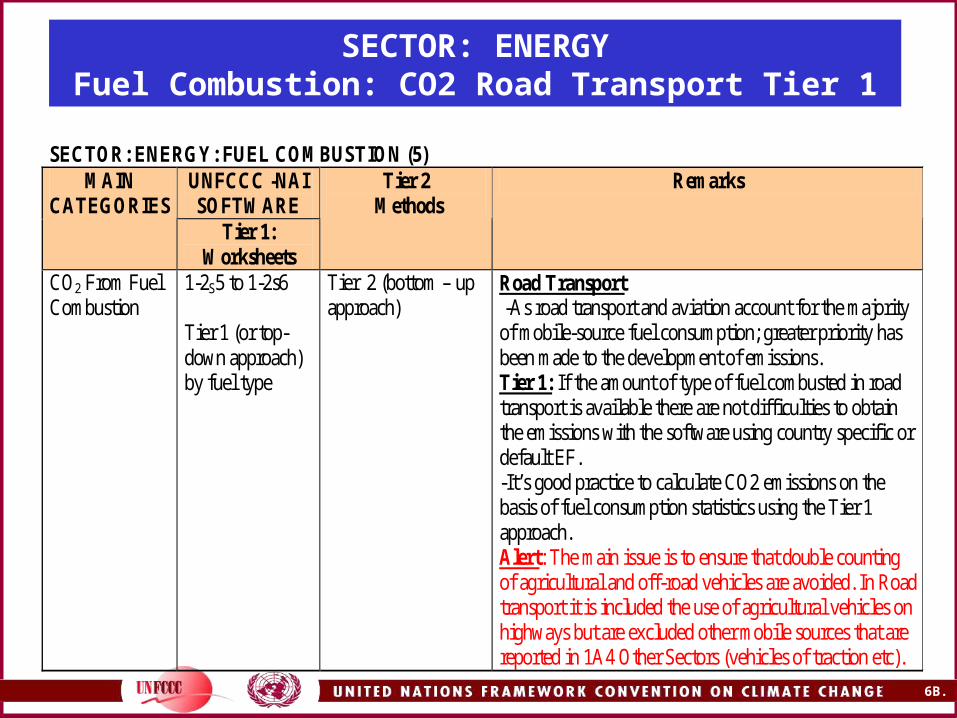
SECTOR: ENERGYFuel Combustion: CO2 Road Transport Tier 1
SECTOR: ENERGY: FUEL COMBUSTION (5)
UNFCCC -NAI SOFTWARE
MAIN CATEGORIES
Tier 1: Worksheets
Tier 2 Methods
Remarks
CO2 From Fuel Combustion
1-2S5 to 1-2s6 Tier 1 (or top-down approach) by fuel type
Tier 2 (bottom – up approach)
Road Transport -As road transport and aviation account for the majority of mobile-source fuel consumption; greater priority has been made to the development of emissions. Tier 1: If the amount of type of fuel combusted in road transport is available there are not difficulties to obtain the emissions with the software using country specific or default EF. -It’s good practice to calculate CO2 emissions on the basis of fuel consumption statistics using the Tier 1 approach. Alert: The main issue is to ensure that double counting of agricultural and off-road vehicles are avoided. In Road transport it is included the use of agricultural vehicles on highways but are excluded other mobile sources that are reported in 1A4 Other Sectors (vehicles of traction etc).
36 6B.36
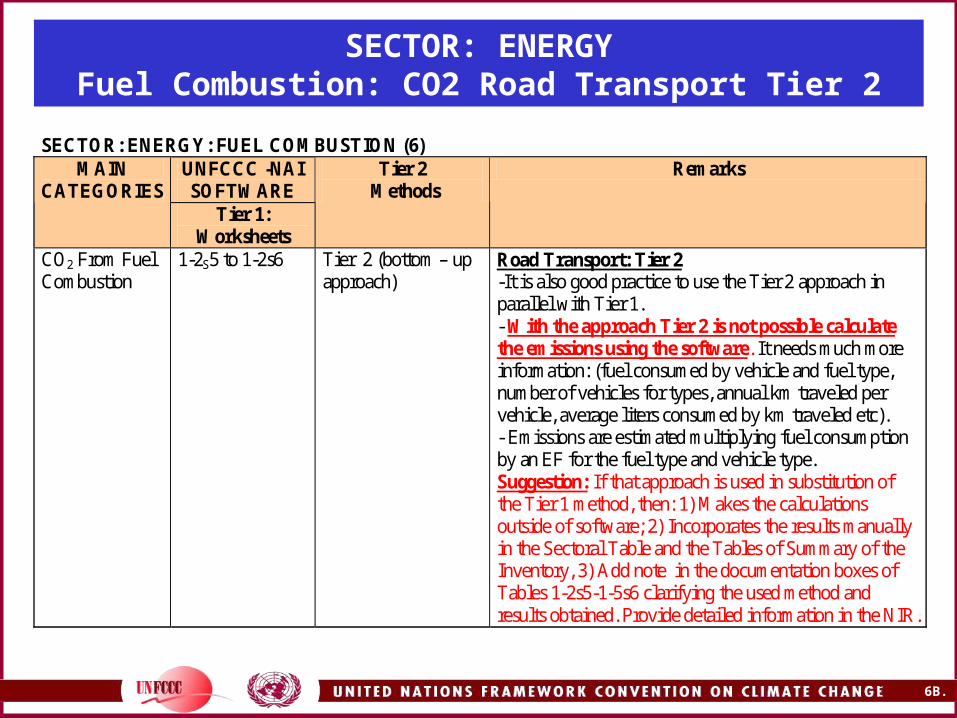
SECTOR: ENERGYFuel Combustion: CO2 Road Transport Tier 2
SECTOR: ENERGY: FUEL COMBUSTION (6)
UNFCCC -NAI SOFTWARE
MAIN CATEGORIES
Tier 1: Worksheets
Tier 2 Methods
Remarks
CO2 From Fuel Combustion
1-2S5 to 1-2s6
Tier 2 (bottom – up approach)
Road Transport: Tier 2 -It is also good practice to use the Tier 2 approach in parallel with Tier 1. - With the approach Tier 2 is not possible calculate the emissions using the software. It needs much more information: (fuel consumed by vehicle and fuel type, number of vehicles for types, annual km traveled per vehicle, average liters consumed by km traveled etc). - Emissions are estimated multiplying fuel consumption by an EF for the fuel type and vehicle type. Suggestion: If that approach is used in substitution of the Tier 1 method, then: 1) Makes the calculations outside of software; 2) Incorporates the results manually in the Sectoral Table and the Tables of Summary of the Inventory, 3) Add note in the documentation boxes of Tables 1-2s5-1-5s6 clarifying the used method and results obtained. Provide detailed information in the NIR.

37 6B.37
SECTOR: ENERGYFuel Combustion: Non-CO2 by Source Categories Tier 1
SECTOR: ENERGY: FUEL COMBUSTION (7)
UNFCCC – NAI
SOFTWARE
MAIN CATEGORIES
Tier 1: Worksheets
Tier 2 Methods Remarks
Non-CO2 From Fuel combustion -By source categories (sub-sectors)
1-3s1 to 1-3s3 (11) CH4 N2O NOx CO NMVOC
-Stationary combustion by sub source categories/ technology type and country specific/regional or IPCC default Tier 2 EF.
Tier 1: If activity data are available there are not difficulties to obtain the emissions with the software.
38 6B.38
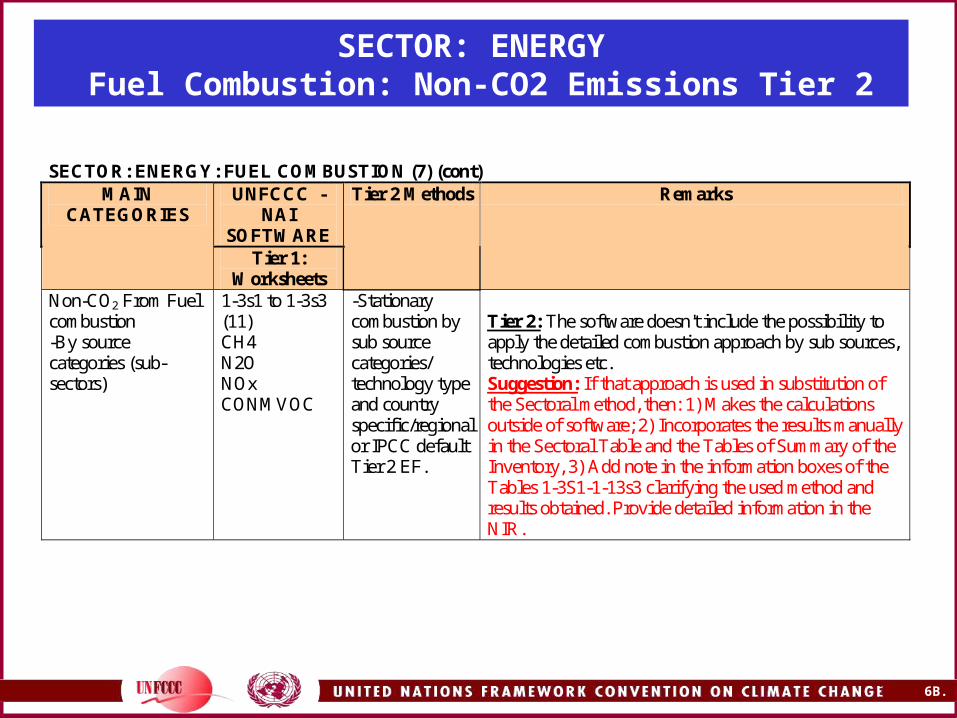
SECTOR: ENERGY Fuel Combustion: Non-CO2 Emissions Tier 2
SECTOR: ENERGY: FUEL COMBUSTION (7) (cont)
UNFCCC -NAI
SOFTWARE
MAIN CATEGORIES
Tier 1: Worksheets
Tier 2 Methods Remarks
Non-CO2 From Fuel combustion -By source categories (sub-sectors)
1-3s1 to 1-3s3 (11) CH4 N2O NOx CONMVOC
-Stationary combustion by sub source categories/ technology type and country specific/regional or IPCC default Tier 2 EF.
Tier 2: The software doesn't include the possibility to apply the detailed combustion approach by sub sources, technologies etc. Suggestion: If that approach is used in substitution of the Sectoral method, then: 1) Makes the calculations outside of software; 2) Incorporates the results manually in the Sectoral Table and the Tables of Summary of the Inventory, 3) Add note in the information boxes of the Tables 1-3S1-1-13s3 clarifying the used method and results obtained. Provide detailed information in the NIR.
39 6B.39
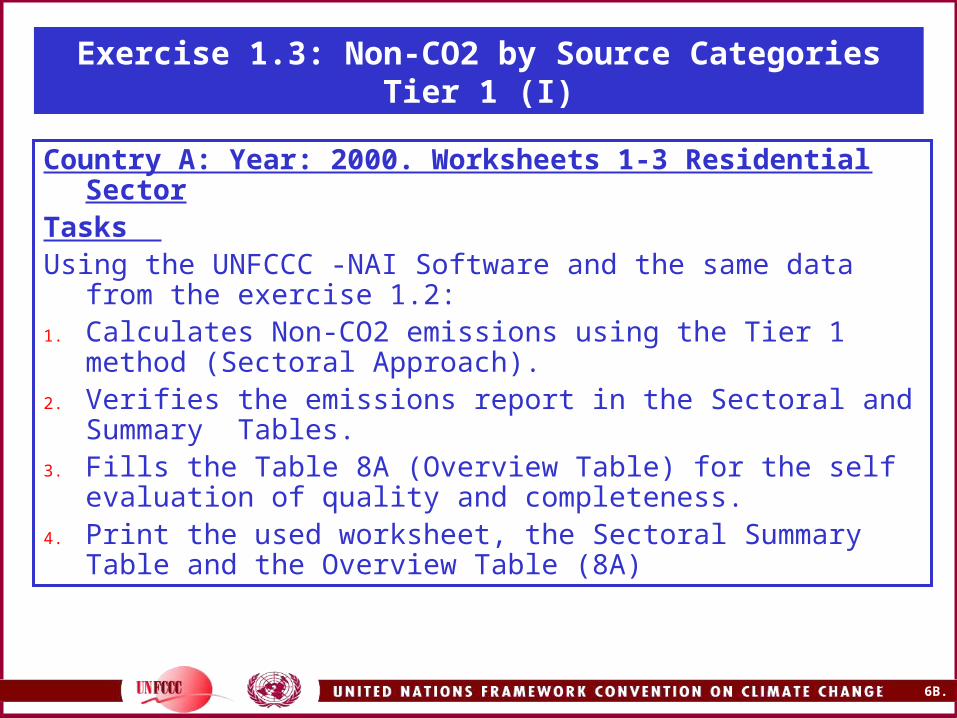
SECTOR: ENERGYExercise 1.3: Non-CO2 by Source Categories Tier 1 (I)
Country A: Year: 2000. Worksheets 1-3 Residential SectorTasks Using the UNFCCC -NAI Software and the same data from the
exercise 1.2:1. Calculates Non-CO2 emissions using the Tier 1 method
(Sectoral Approach).2. Verifies the emissions report in the Sectoral and Summary
Tables.3. Fills the Table 8A (Overview Table) for the self evaluation of
quality and completeness. 4. Print the used worksheet, the Sectoral Summary Table and the
Overview Table (8A)
40 6B.40
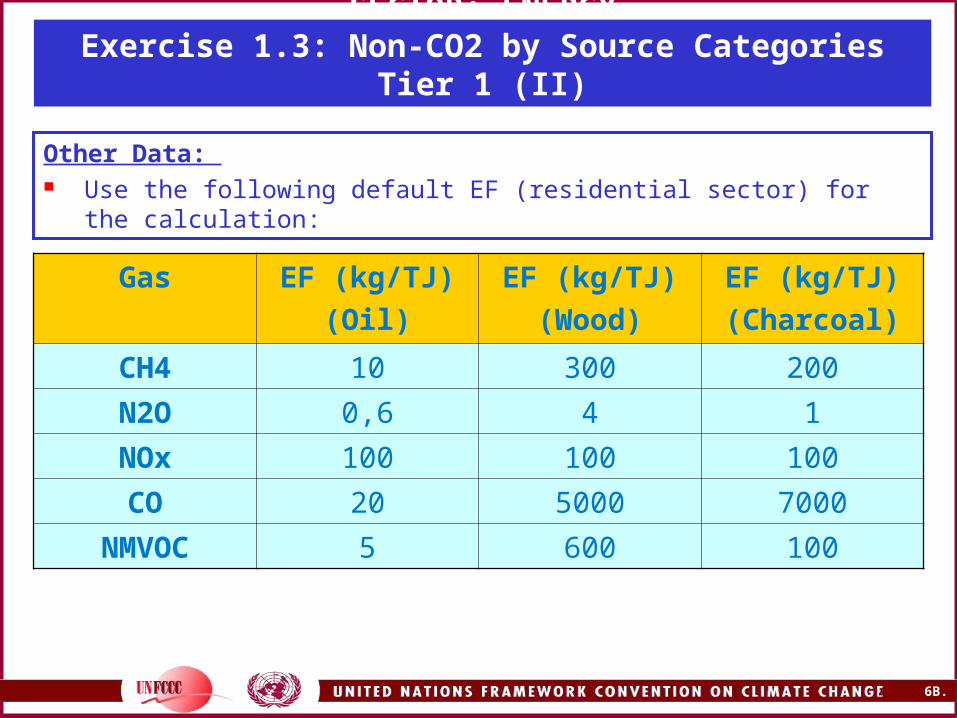
SECTOR: ENERGYExercise 1.3: Non-CO2 by Source Categories Tier 1 (II)
Other Data: Use the following default EF (residential sector) for the calculation:
Gas EF (kg/TJ)
(Oil)
EF (kg/TJ)
(Wood)
EF (kg/TJ)
(Charcoal)
CH4 10 300 200
N2O 0,6 4 1
NOx 100 100 100
CO 20 5000 7000
NMVOC 5 600 100
41 6B.41
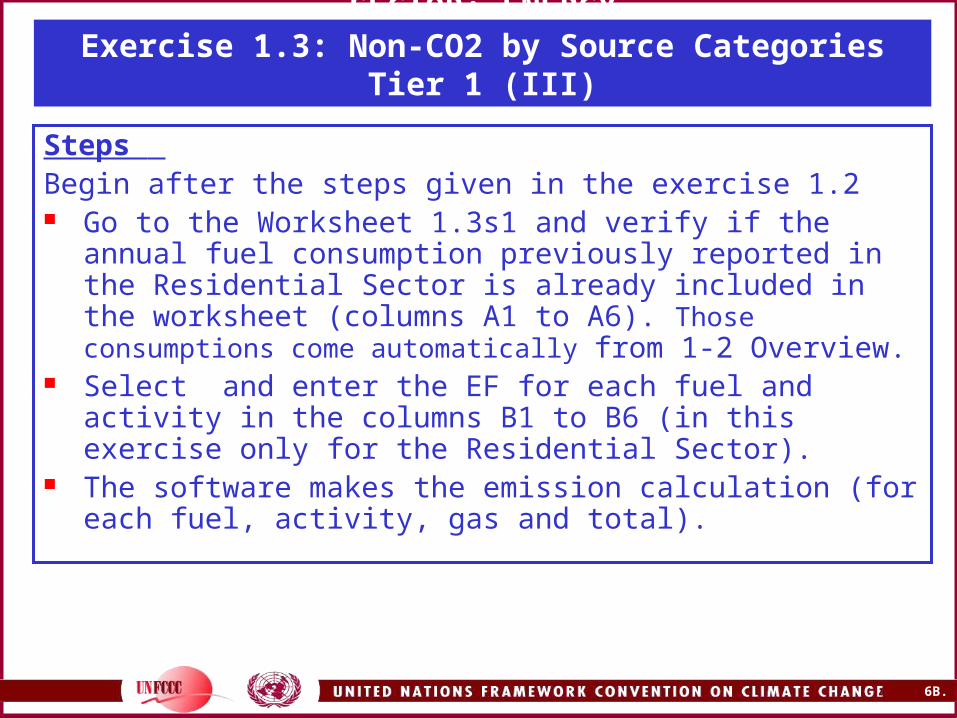
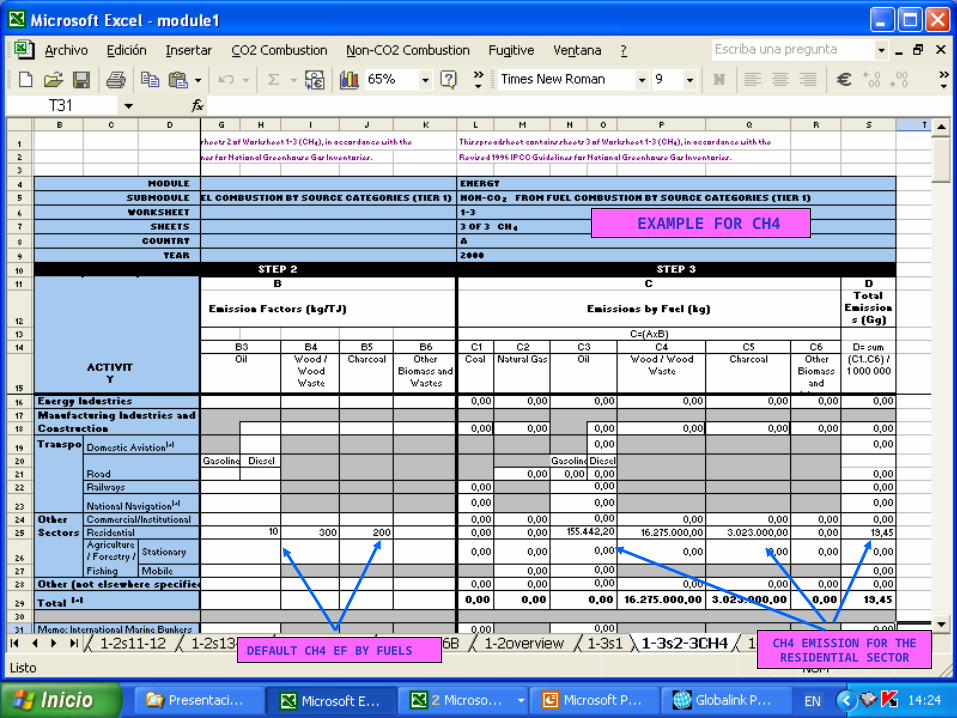
SECTOR: ENERGYExercise 1.3: Non-CO2 by Source Categories Tier 1 (III)
Steps Begin after the steps given in the exercise 1.2 Go to the Worksheet 1.3s1 and verify if the annual fuel
consumption previously reported in the Residential Sector is already included in the worksheet (columns A1 to A6). Those consumptions come automatically from 1-2 Overview.
Select and enter the EF for each fuel and activity in the columns B1 to B6 (in this exercise only for the Residential Sector).
The software makes the emission calculation (for each fuel, activity, gas and total).
42 6B.42
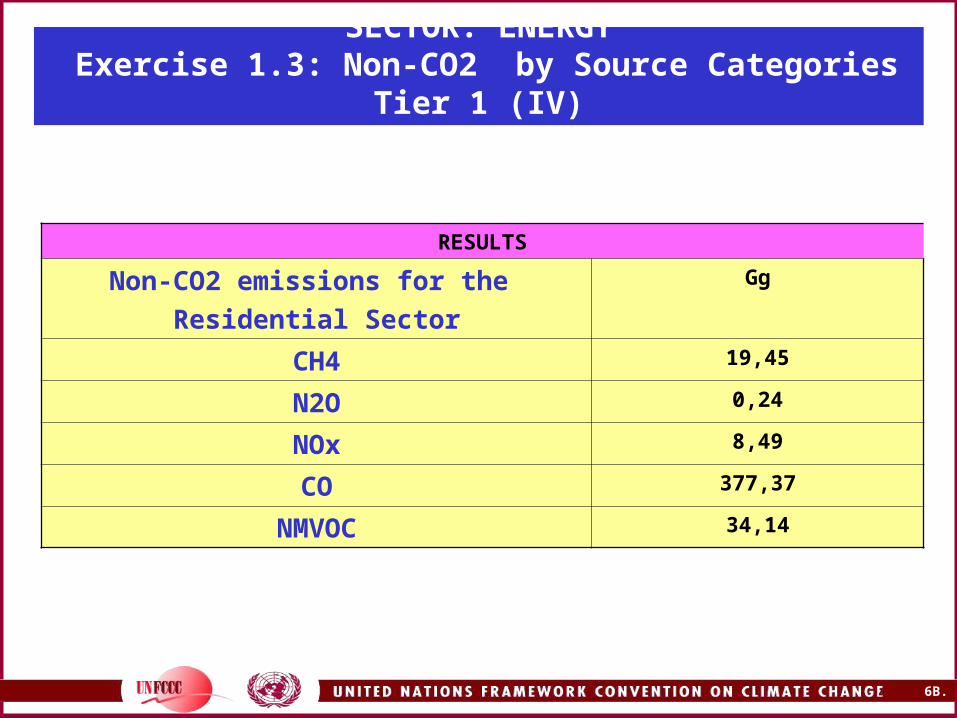
SECTOR: ENERGY Exercise 1.3: Non-CO2 by Source Categories Tier 1 (IV)
RESULTS
Non-CO2 emissions for the
Residential Sector
Gg
CH4 19,45
N2O 0,24
NOx 8,49
CO 377,37
NMVOC 34,14
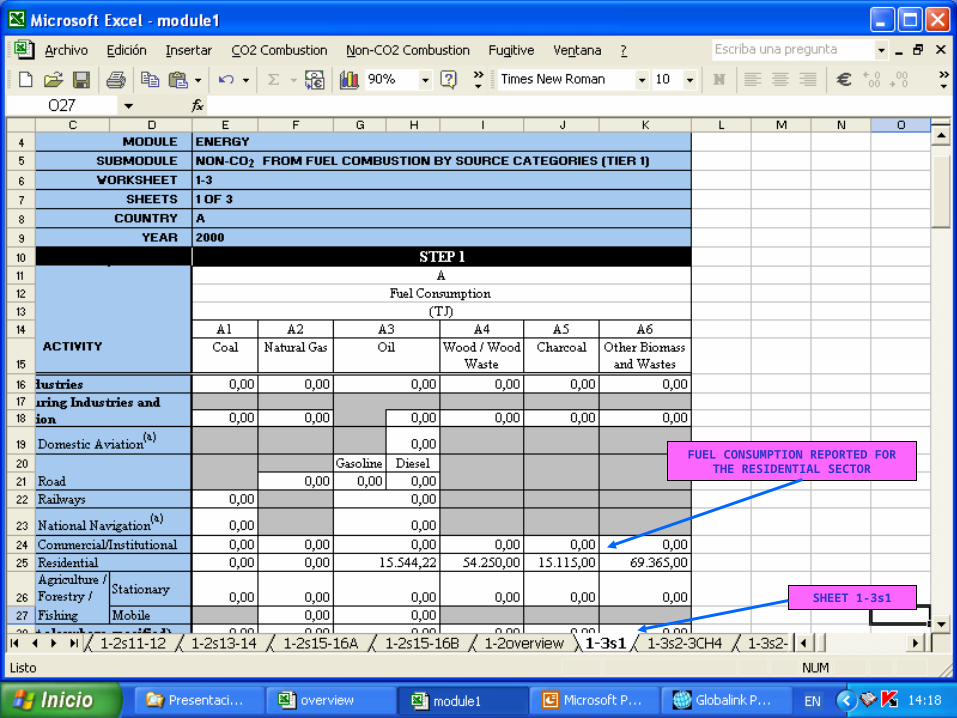
43 6B.43
FUEL CONSUMPTION REPORTED FOR THE RESIDENTIAL SECTOR
SHEET 1-3s1
44 6B.44
DEFAULT CH4 EF BY FUELSCH4 EMISSION FOR THE RESIDENTIAL SECTOR
EXAMPLE FOR CH4
45 6B.45
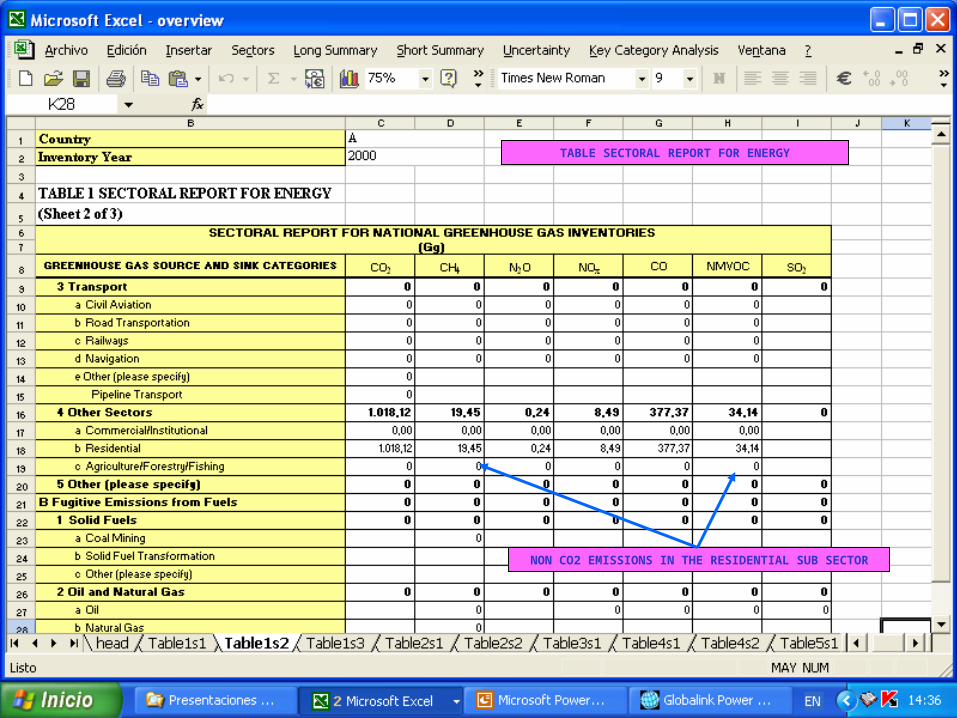
TABLE SECTORAL REPORT FOR ENERGY
NON CO2 EMISSIONS IN THE RESIDENTIAL SUB SECTOR
46 6B.46
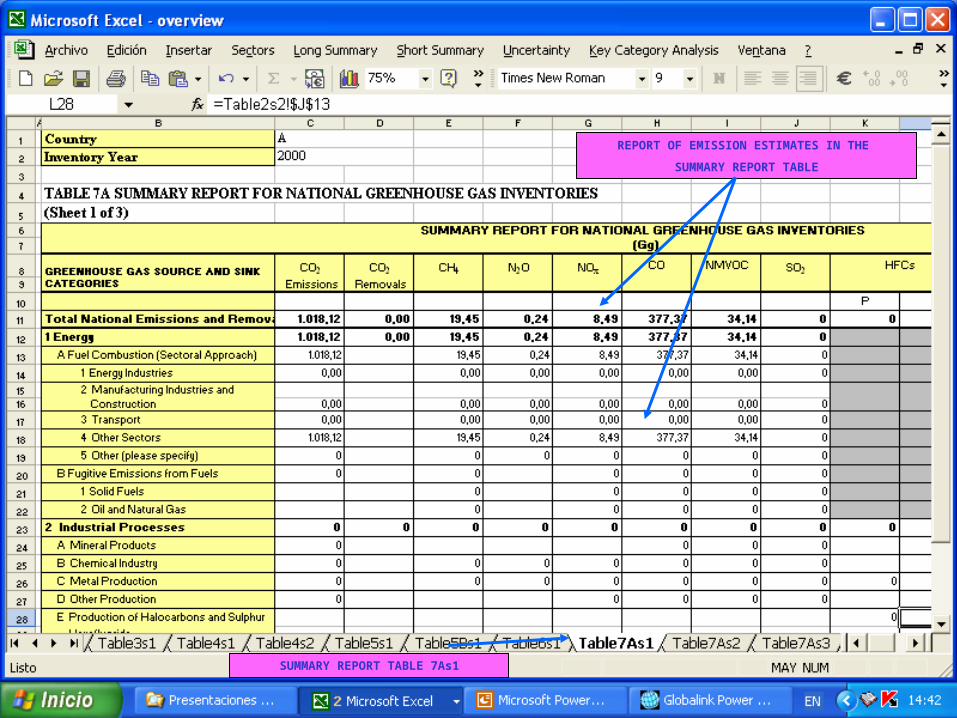
REPORT OF EMISSION ESTIMATES IN THE
SUMMARY REPORT TABLE
SUMMARY REPORT TABLE 7As1
47 6B.47
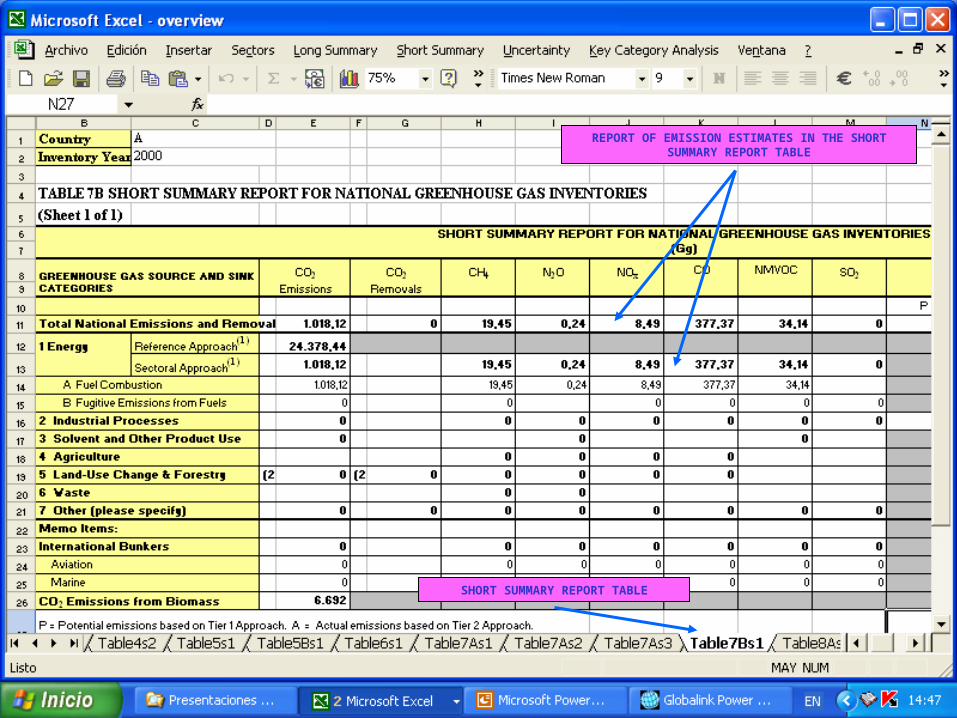
REPORT OF EMISSION ESTIMATES IN THE SHORT SUMMARY REPORT TABLE
SHORT SUMMARY REPORT TABLE
48 6B.48
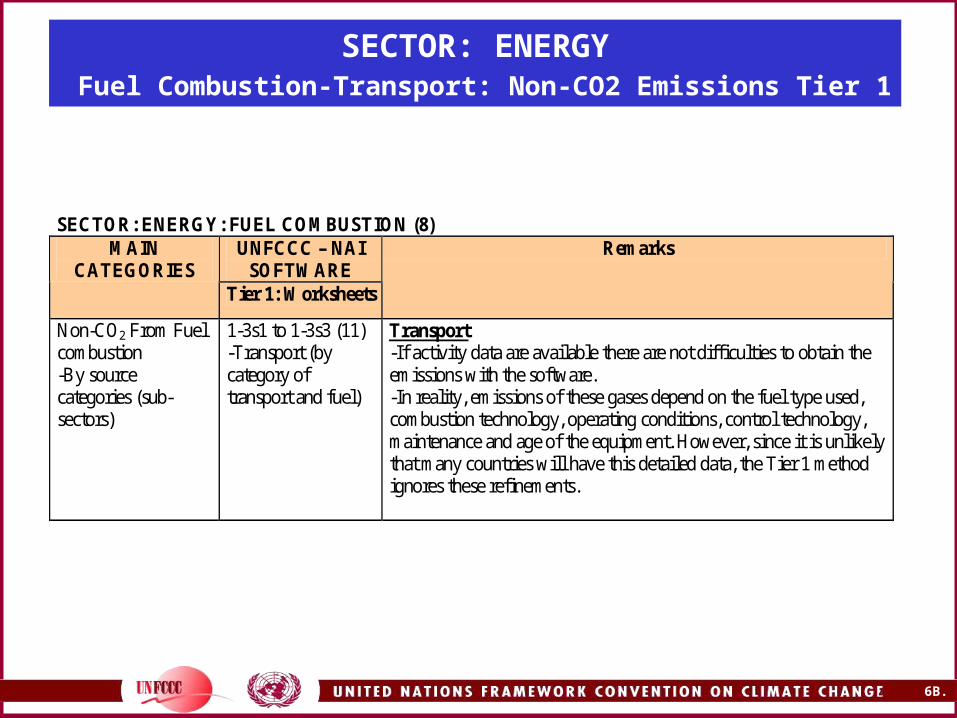
SECTOR: ENERGY Fuel Combustion-Transport: Non-CO2 Emissions Tier 1
SECTOR: ENERGY: FUEL COMBUSTION (8)
UNFCCC – NAI SOFTWARE
MAIN CATEGORIES
Tier 1: Worksheets
Remarks
Non-CO2 From Fuel combustion -By source categories (sub-sectors)
1-3s1 to 1-3s3 (11) -Transport (by category of transport and fuel)
Transport -If activity data are available there are not difficulties to obtain the emissions with the software. -In reality, emissions of these gases depend on the fuel type used, combustion technology, operating conditions, control technology, maintenance and age of the equipment. However, since it is unlikely that many countries will have this detailed data, the Tier 1 method ignores these refinements.
49 6B.49
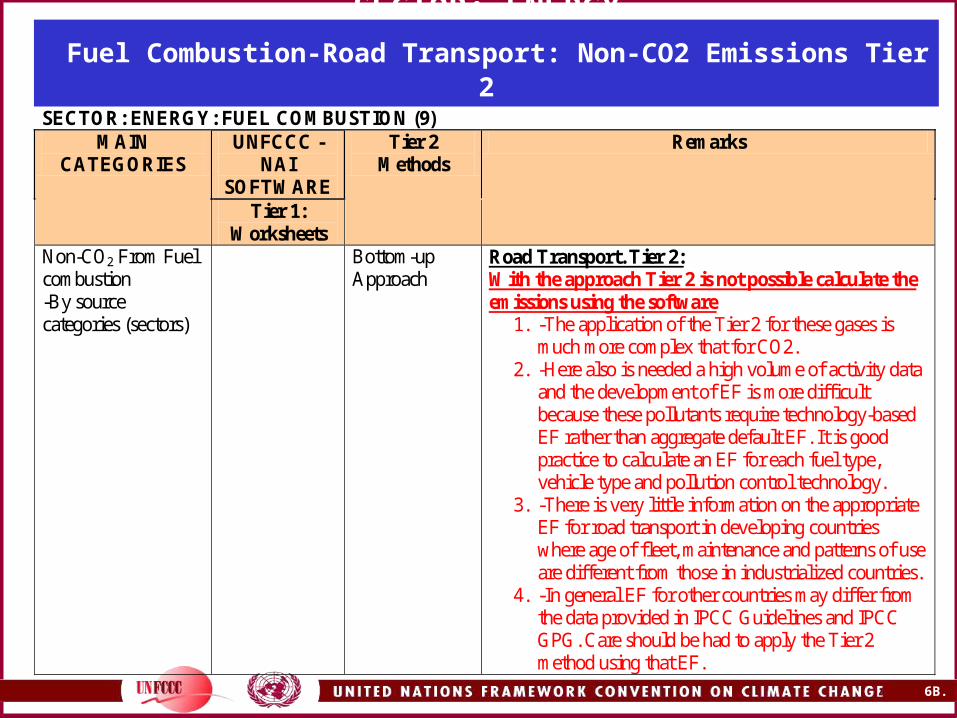
SECTOR: ENERGY Fuel Combustion-Road Transport: Non-CO2 Emissions Tier 2
SECTOR: ENERGY: FUEL COMBUSTION (9) UNFCCC -
NAI SOFTWARE
MAIN CATEGORIES
Tier 1: Worksheets
Tier 2 Methods
Remarks
Non-CO2 From Fuel combustion -By source categories (sectors)
Bottom-up Approach
Road Transport. Tier 2: With the approach Tier 2 is not possible calculate the emissions using the software
1. -The application of the Tier 2 for these gases is much more complex that for CO2.
2. -Here also is needed a high volume of activity data and the development of EF is more difficult because these pollutants require technology-based EF rather than aggregate default EF. It is good practice to calculate an EF for each fuel type, vehicle type and pollution control technology.
3. -There is very little information on the appropriate EF for road transport in developing countries where age of fleet, maintenance and patterns of use are different from those in industrialized countries.
4. -In general EF for other countries may differ from the data provided in IPCC Guidelines and IPCC GPG. Care should be had to apply the Tier 2 method using that EF.
50 6B.50
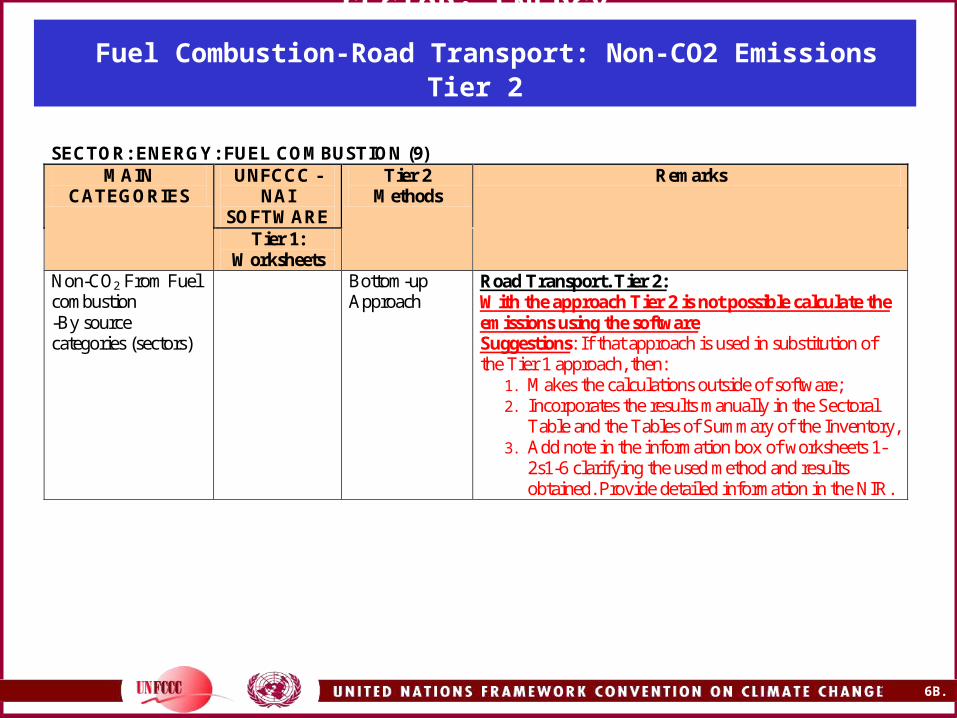
SECTOR: ENERGY Fuel Combustion-Road Transport: Non-CO2 Emissions Tier 2
SECTOR: ENERGY: FUEL COMBUSTION (9)
UNFCCC - NAI
SOFTWARE
MAIN CATEGORIES
Tier 1: Worksheets
Tier 2 Methods
Remarks
Non-CO2 From Fuel combustion -By source categories (sectors)
Bottom-up Approach
Road Transport. Tier 2: With the approach Tier 2 is not possible calculate the emissions using the software Suggestions: If that approach is used in substitution of the Tier 1 approach, then:
1. Makes the calculations outside of software; 2. Incorporates the results manually in the Sectoral
Table and the Tables of Summary of the Inventory, 3. Add note in the information box of worksheets 1-
2s1-6 clarifying the used method and results obtained. Provide detailed information in the NIR.
51 6B.51
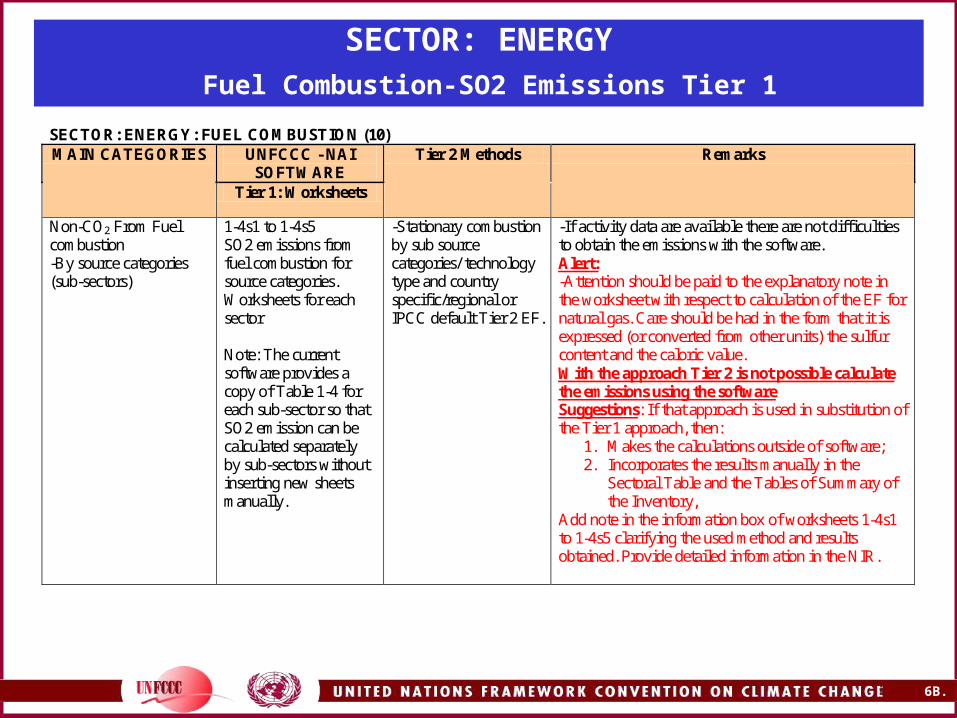
SECTOR: ENERGY Fuel Combustion-SO2 Emissions Tier 1
SECTOR: ENERGY: FUEL COMBUSTION (10) UNFCCC - NAI
SOFTWARE MAIN CATEGORIES
Tier 1: Worksheets
Tier 2 Methods Remarks
Non-CO2 From Fuel combustion -By source categories (sub-sectors)
1-4s1 to 1-4s5 SO2 emissions from fuel combustion for source categories. Worksheets for each sector Note: The current software provides a copy of Table 1-4 for each sub-sector so that SO2 emission can be calculated separately by sub-sectors without inserting new sheets manually.
-Stationary combustion by sub source categories/ technology type and country specific/regional or IPCC default Tier 2 EF.
-If activity data are available there are not difficulties to obtain the emissions with the software. Alert: -Attention should be paid to the explanatory note in the worksheet with respect to calculation of the EF for natural gas. Care should be had in the form that it is expressed (or converted from other units) the sulfur content and the caloric value. With the approach Tier 2 is not possible calculate the emissions using the software Suggestions: If that approach is used in substitution of the Tier 1 approach, then:
1. Makes the calculations outside of software; 2. Incorporates the results manually in the
Sectoral Table and the Tables of Summary of the Inventory,
Add note in the information box of worksheets 1-4s1 to 1-4s5 clarifying the used method and results obtained. Provide detailed information in the NIR.
52 6B.52
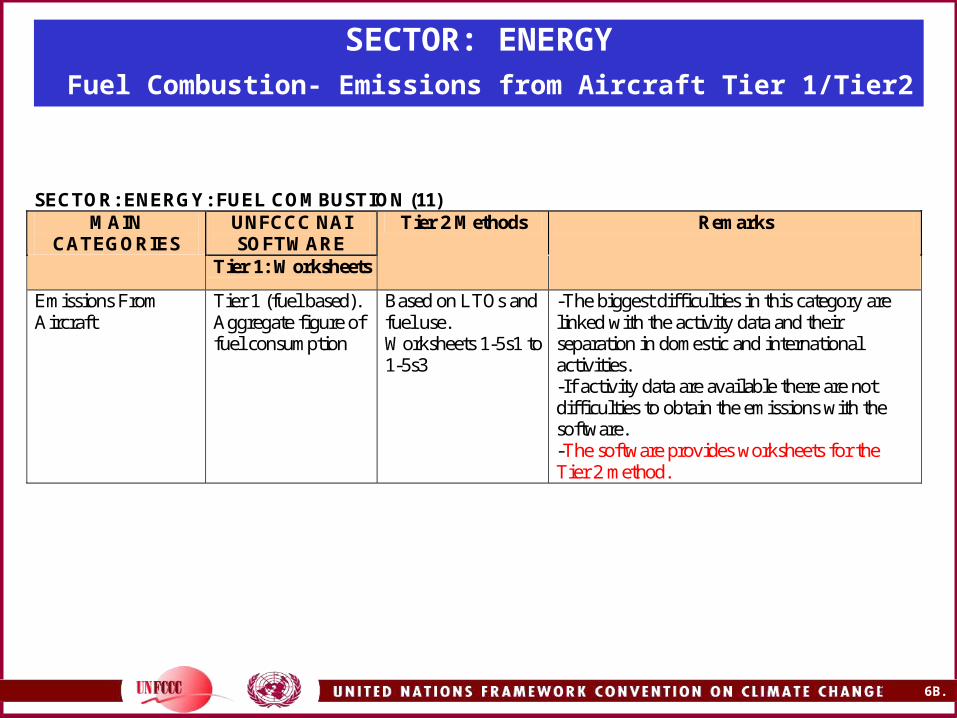
SECTOR: ENERGY Fuel Combustion- Emissions from Aircraft Tier 1/Tier2
SECTOR: ENERGY: FUEL COMBUSTION (11)
UNFCCC NAI SOFTWARE
MAIN CATEGORIES
Tier 1: Worksheets
Tier 2 Methods Remarks
Emissions From Aircraft
Tier 1 (fuel based). Aggregate figure of fuel consumption
Based on LTOs and fuel use. Worksheets 1-5s1 to 1-5s3
-The biggest difficulties in this category are linked with the activity data and their separation in domestic and international activities. -If activity data are available there are not difficulties to obtain the emissions with the software. -The software provides worksheets for the Tier 2 method.
53 6B.53
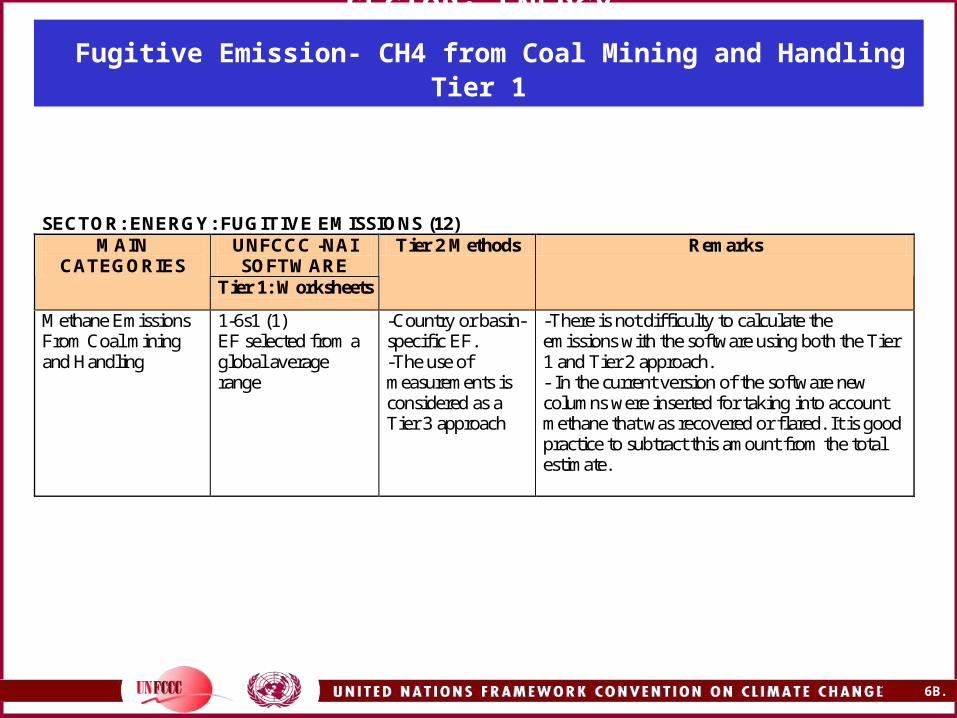
SECTOR: ENERGY Fugitive Emission- CH4 from Coal Mining and Handling Tier 1
SECTOR: ENERGY: FUGITIVE EMISSIONS (12)
UNFCCC -NAI SOFTWARE
MAIN CATEGORIES
Tier 1: Worksheets
Tier 2 Methods Remarks
Methane Emissions From Coal mining and Handling
1-6s1 (1) EF selected from a global average range
-Country or basin- specific EF. -The use of measurements is considered as a Tier 3 approach
-There is not difficulty to calculate the emissions with the software using both the Tier 1 and Tier 2 approach. - In the current version of the software new columns were inserted for taking into account methane that was recovered or flared. It is good practice to subtract this amount from the total estimate.

54 6B.54
SECTOR: ENERGYExercise 1.4: CH4 Emissions from Coal mining and Handling
Tier 1 (I)
Country A: Year: 2000. Worksheet 1-6s1Data The National Statistics Office provided the amount of raw coal produced during
the year. The production is carried out in underground mines located in the same area of the country. The average mining depth is approximately 300m. CH4 emission came from ventilation systems and degasification systems. Mine specific measurement data are not available. Country specific EF are not available
EF underground mines
(m3 CH4/ton)
(default values)
CH4 Recovered and used or
flared
(millions m3)
Raw coal production
(ton)
Mining Post-Mining 30 5 000 000
17,5 2,45
55 6B.55
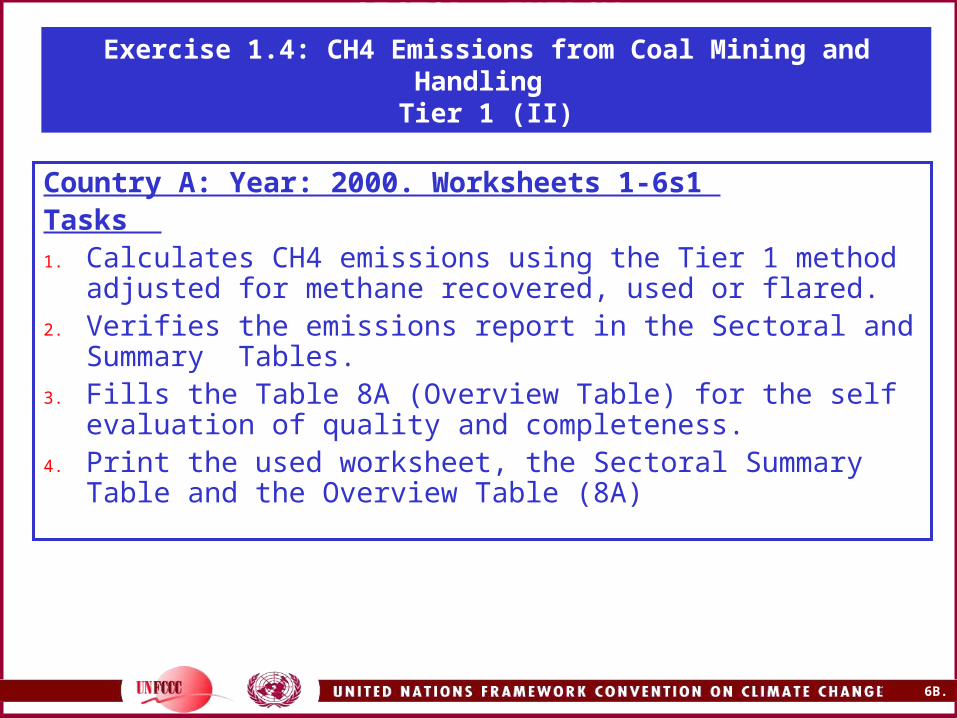
SECTOR: ENERGYExercise 1.4: CH4 Emissions from Coal Mining and Handling
Tier 1 (II)
Country A: Year: 2000. Worksheets 1-6s1 Tasks 1. Calculates CH4 emissions using the Tier 1 method adjusted for
methane recovered, used or flared.2. Verifies the emissions report in the Sectoral and Summary
Tables.3. Fills the Table 8A (Overview Table) for the self evaluation of
quality and completeness. 4. Print the used worksheet, the Sectoral Summary Table and the
Overview Table (8A)
56 6B.56
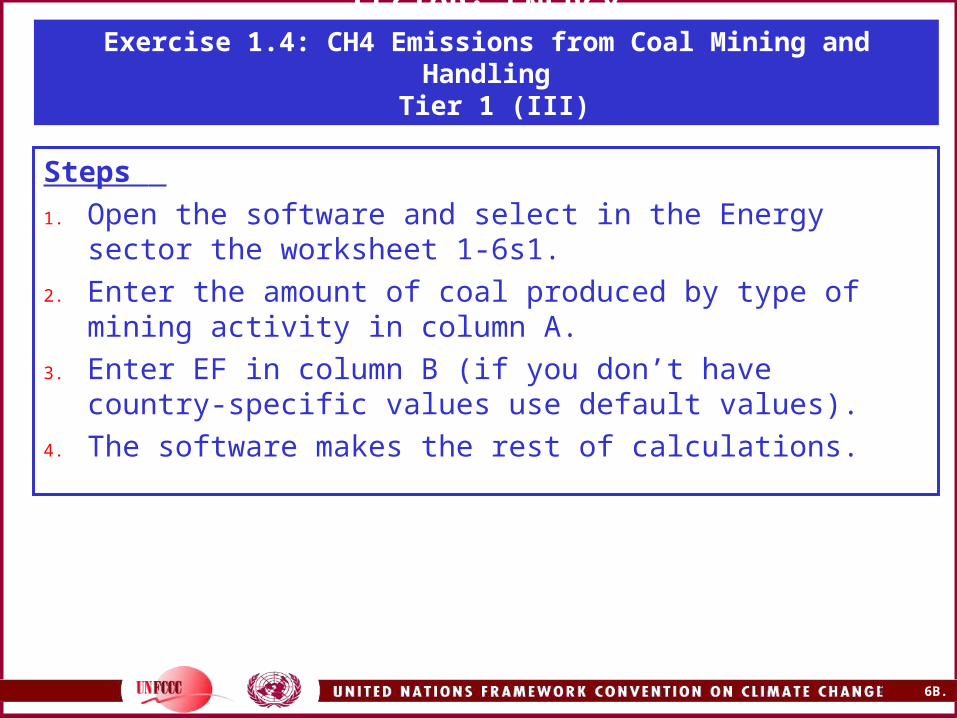
SECTOR: ENERGYExercise 1.4: CH4 Emissions from Coal Mining and Handling
Tier 1 (III)
Steps
1. Open the software and select in the Energy sector the worksheet 1-6s1.
2. Enter the amount of coal produced by type of mining activity in column A.
3. Enter EF in column B (if you don’t have country-specific values use default values).
4. The software makes the rest of calculations.
57 6B.57
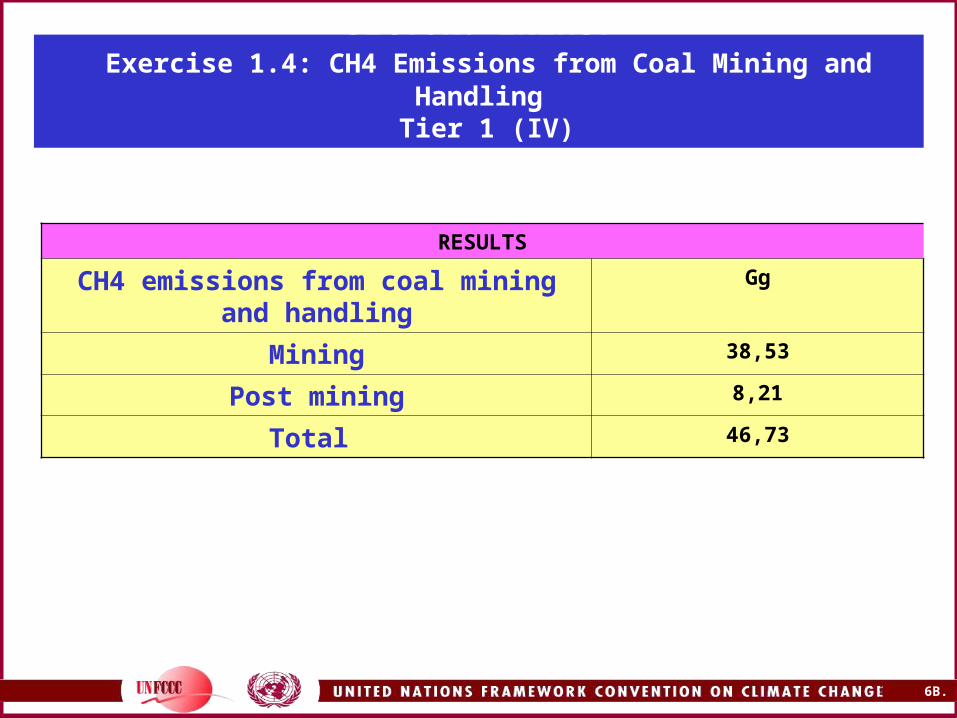
SECTOR: ENERGY Exercise 1.4: CH4 Emissions from Coal Mining and Handling
Tier 1 (IV)
RESULTS
CH4 emissions from coal mining and handling
Gg
Mining 38,53
Post mining 8,21
Total 46,73

58 6B.58
METHANE EMISSIONS
59 6B.59
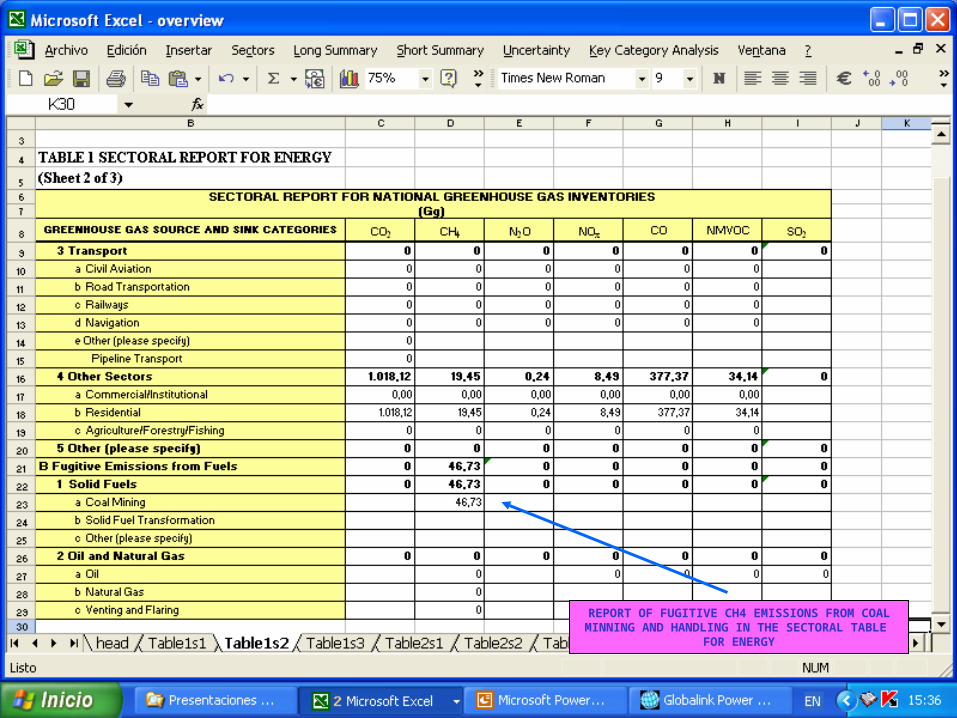
REPORT OF FUGITIVE CH4 EMISSIONS FROM COAL MINNING AND HANDLING IN THE SECTORAL TABLE
FOR ENERGY
60 6B.60
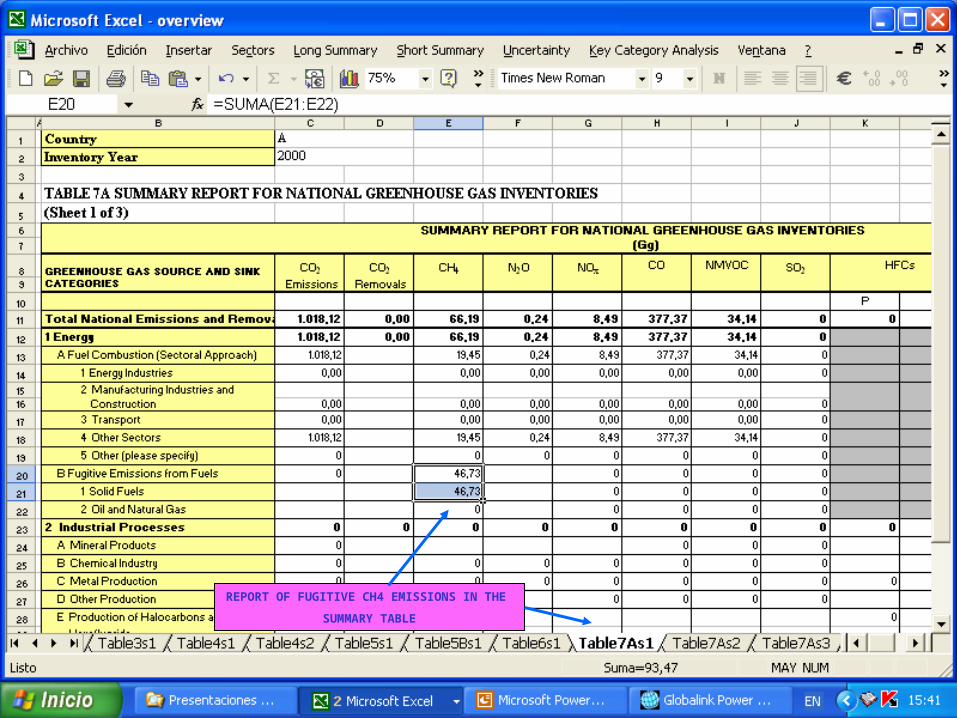
REPORT OF FUGITIVE CH4 EMISSIONS IN THE
SUMMARY TABLE
61 6B.61
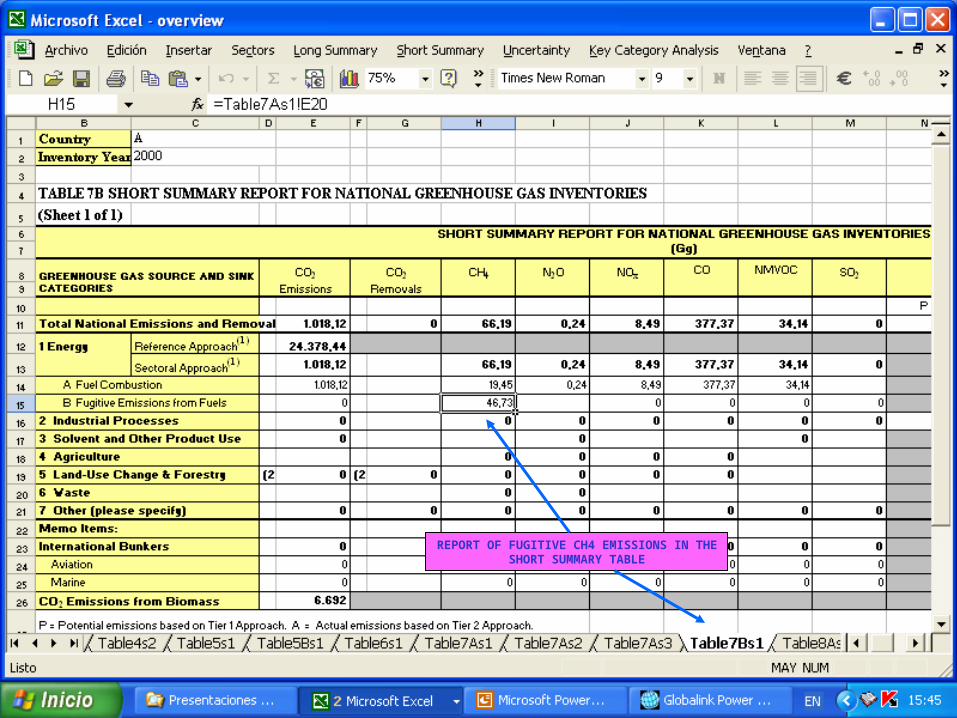
REPORT OF FUGITIVE CH4 EMISSIONS IN THE SHORT SUMMARY TABLE
62 6B.62
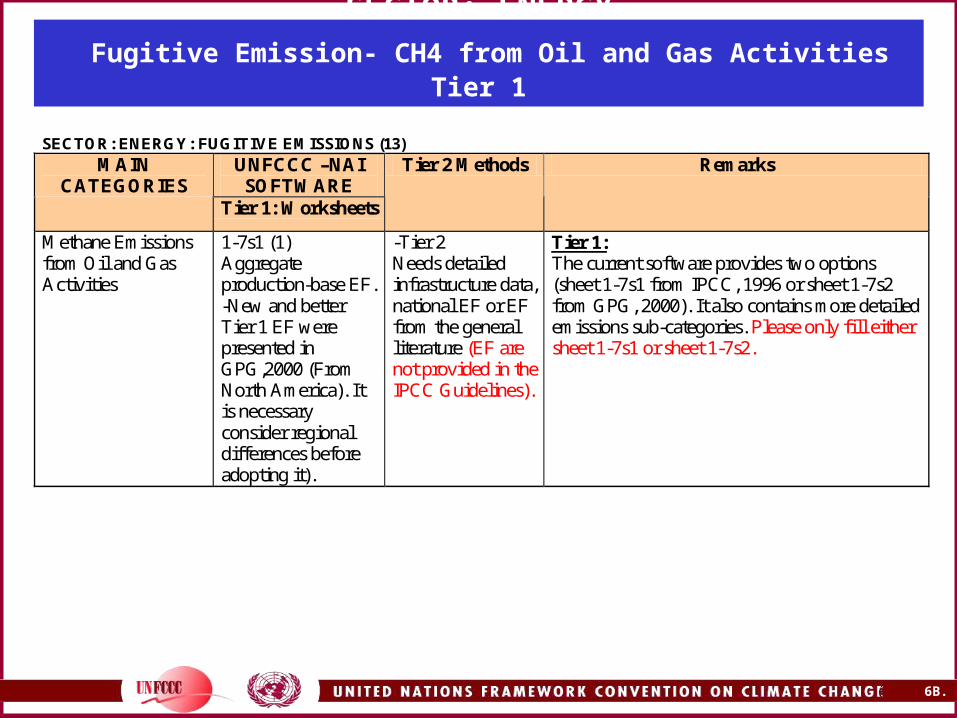
SECTOR: ENERGY Fugitive Emission- CH4 from Oil and Gas Activities Tier 1
SECTOR: ENERGY: FUGITIVE EMISSIONS (13) UNFCCC –NAI
SOFTWARE MAIN
CATEGORIES Tier 1: Worksheets
Tier 2 Methods Remarks
Methane Emissions from Oil and Gas Activities
1-7s1 (1) Aggregate production-base EF. -New and better Tier 1 EF were presented in GPG,2000 (From North America). It is necessary consider regional differences before adopting it).
-Tier 2 Needs detailed infrastructure data, national EF or EF from the general literature (EF are not provided in the IPCC Guidelines).
Tier 1: The current software provides two options (sheet 1-7s1 from IPCC, 1996 or sheet 1-7s2 from GPG, 2000). It also contains more detailed emissions sub-categories. Please only fill either sheet 1-7s1 or sheet 1-7s2.

63 6B.63
SECTOR: ENERGY Fugitive Emission- CO2 and N2O from Oil and Gas Activities
SECTOR: ENERGY: FUGITIVE EMISSIONS (14)
UNFCCC -NAI SOFTWARE
MAIN CATEGORIES
Tier 1: Worksheets
Tier 2 Methods Remarks
CO2 and N2O Emissions from Oil and Gas Activities
-The software doesn't have worksheets for these calculations. -Aggregate production-base EF. -New and better Tier 1 EFs were presented in GPG, 2000 (From North America). It is necessary consider regional differences before adopting it).
-Tier 2 Needs detailed infrastructure data, national EF or EF from the general literature (EF are not provided in the IPCC Guidelines).
- It is not possible to calculate these emissions using the software Suggestion: 1) Makes the calculations outside of software; 2) Incorporates the results manually in the Sectoral and Summary Tables; 3) Add note in the information box of the Worksheet 1-7S1 clarifying the used method and results obtained. Provide detailed information in the NIR. - The software doesn't include the possibility to apply the Tier 2 approach. Suggestion: If that approach is used in substitution of Tier 1 approach, then: 1) Makes the calculations outside of software; 2) Incorporates the results manually in the Sectoral and Summary Tables; 3) Add note in the information box of the Worksheet 1-7S1 clarifying the used method and results obtained. Provide detailed information in the NIR.
64 6B.64
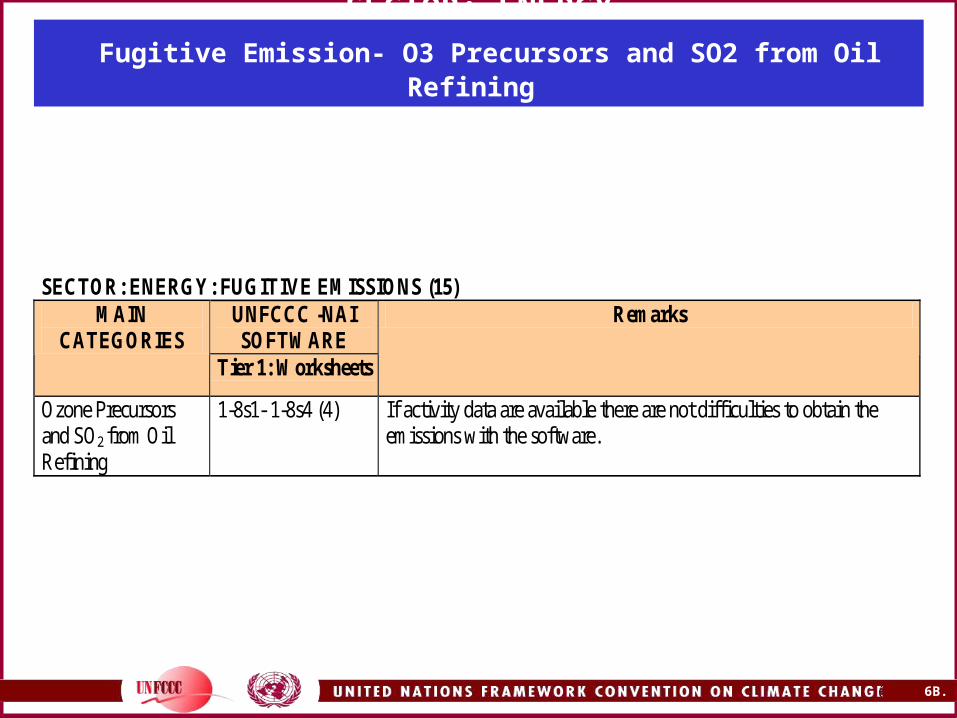
SECTOR: ENERGY Fugitive Emission- O3 Precursors and SO2 from Oil Refining
SECTOR: ENERGY: FUGITIVE EMISSIONS (15)
UNFCCC -NAI SOFTWARE
MAIN CATEGORIES
Tier 1: Worksheets
Remarks
Ozone Precursors and SO2 from Oil Refining
1-8s1- 1-8s4 (4) If activity data are available there are not difficulties to obtain the emissions with the software.
65 6B.65
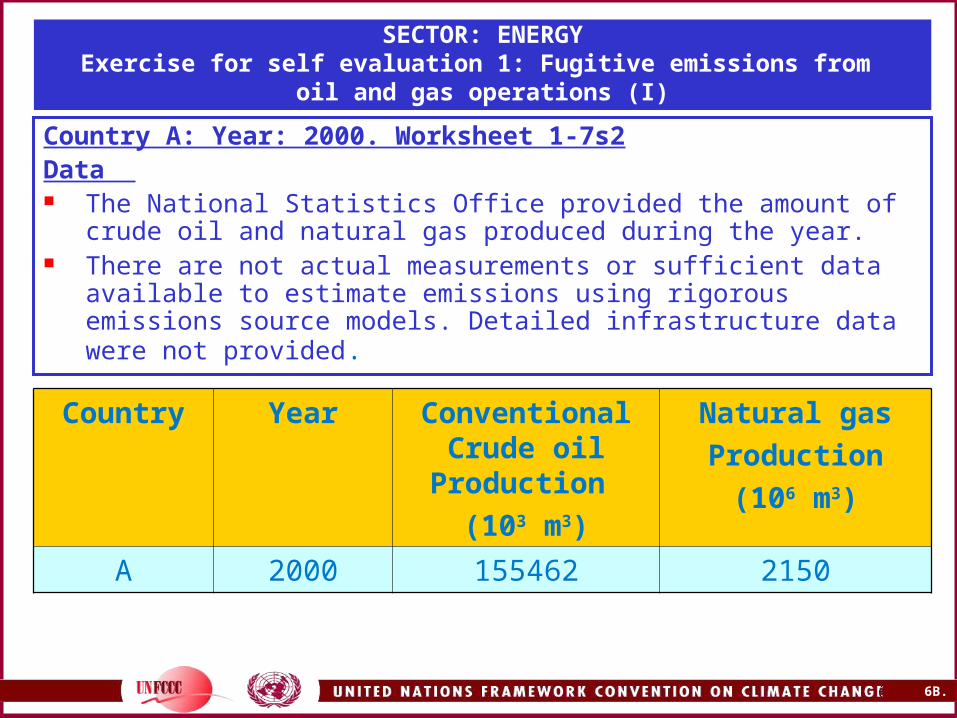
SECTOR: ENERGYExercise for self evaluation 1: Fugitive emissions from
oil and gas operations (I)
Country A: Year: 2000. Worksheet 1-7s2Data The National Statistics Office provided the amount of crude oil and
natural gas produced during the year. There are not actual measurements or sufficient data available to
estimate emissions using rigorous emissions source models. Detailed infrastructure data were not provided.
Country Year Conventional Crude oil
Production
(103 m3)
Natural gas
Production
(106 m3)
A 2000 155462 2150
66 6B.66
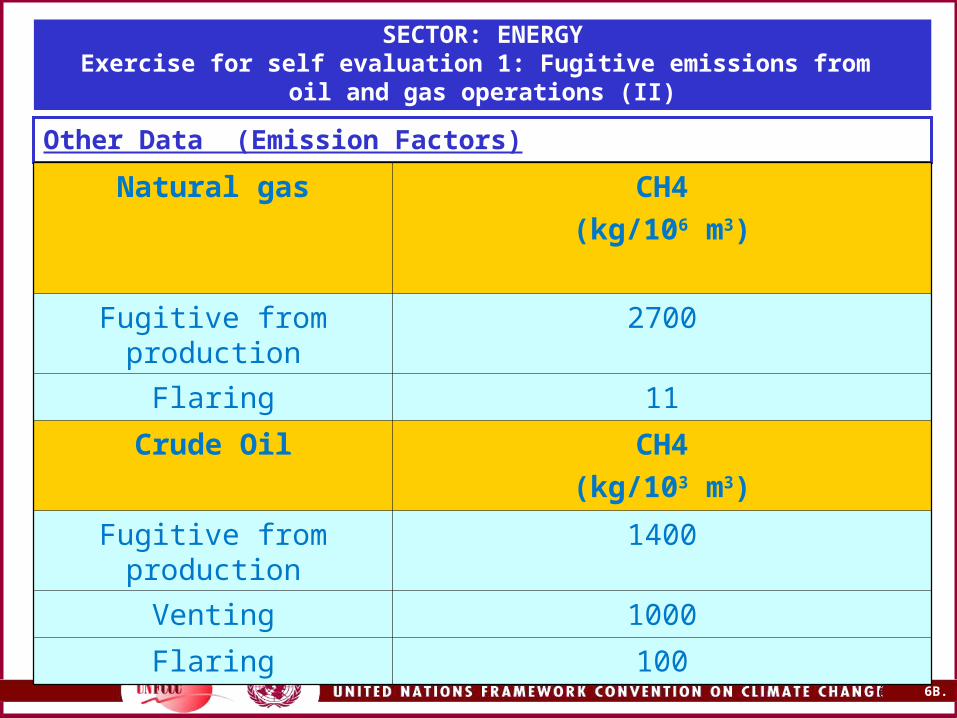
SECTOR: ENERGYExercise for self evaluation 1: Fugitive emissions from
oil and gas operations (II)
Other Data (Emission Factors)
Natural gas CH4
(kg/106 m3)
Fugitive from production 2700
Flaring 11
Crude Oil CH4
(kg/103 m3)
Fugitive from production 1400
Venting 1000
Flaring 100
67 6B.67
SECTOR: ENERGYExercise for self evaluation 1: Fugitive emissions from
oil and gas operations (III)
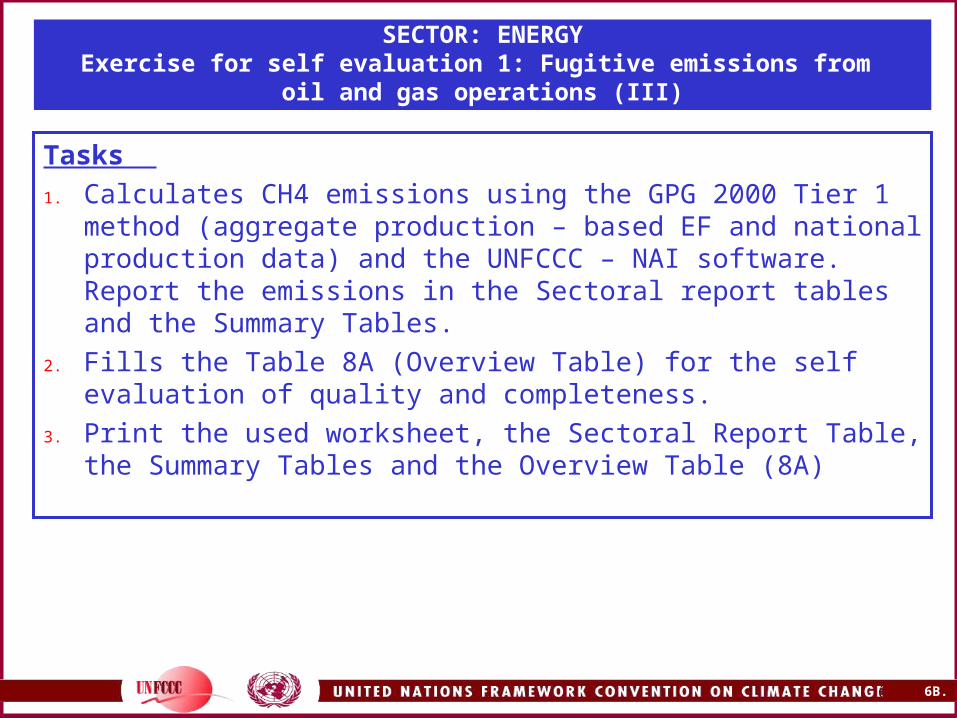
Tasks
1. Calculates CH4 emissions using the GPG 2000 Tier 1 method (aggregate production – based EF and national production data) and the UNFCCC – NAI software. Report the emissions in the Sectoral report tables and the Summary Tables.
2. Fills the Table 8A (Overview Table) for the self evaluation of quality and completeness.
3. Print the used worksheet, the Sectoral Report Table, the Summary Tables and the Overview Table (8A)
68 6B.68
SECTOR: ENERGYExercise for self evaluation 1: Fugitive emissions from
oil and gas operations (IV)
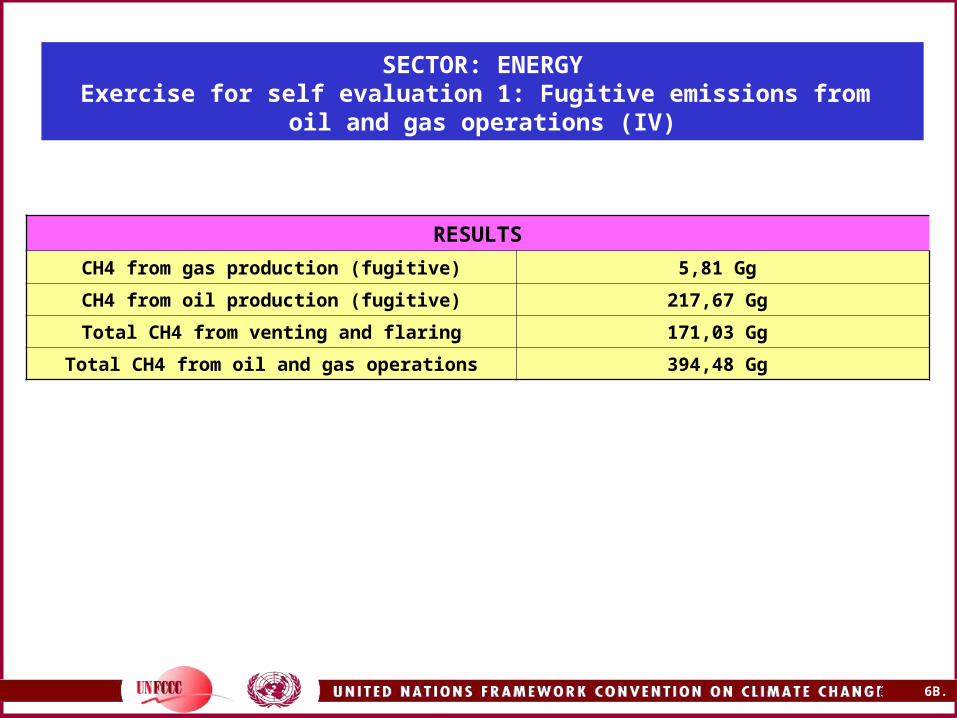
RESULTS
CH4 from gas production (fugitive) 5,81 Gg
CH4 from oil production (fugitive) 217,67 Gg
Total CH4 from venting and flaring 171,03 Gg
Total CH4 from oil and gas operations 394,48 Gg
6B.69
Thank you