6C.1 1 UNFCCC - NAI SOFTWARE Sector: Industrial Processes Practical Aspects and Exercises CGE...
50
1 6C.1 UNFCCC - NAI SOFTWARE Sector: Industrial Processes Practical Aspects and Exercises CGE Greenhouse Gas Inventory Hands – on Training Workshop for the African Region Pretoria, South Africa 18 – 22 September 2006
-
Upload
barbara-merritt -
Category
Documents
-
view
220 -
download
3
Transcript of 6C.1 1 UNFCCC - NAI SOFTWARE Sector: Industrial Processes Practical Aspects and Exercises CGE...

1 6C.1
UNFCCC - NAI SOFTWARE Sector: Industrial Processes
Practical Aspects and Exercises
CGE Greenhouse Gas Inventory Hands – on Training Workshop for
the African Region
Pretoria, South Africa
18 – 22 September 2006
2 6C.2
CONTENT
Specific details of the UNFCCC -NAI Software use to calculate GHG emissions in the sector Industrial Processes.
Practical exercises (to be solved by the participants after the presentation).

3 6C.3
BACKGROUND
The choice of a good practice method is given by the decision threes in the IPCC GPG according to national circumstances.
The UNFCCC –NAI Software contains, basically, the methods of smaller complexity that can use countries for the preparation of inventories.
However, in principle, the software can be used to report the estimated emissions independently of the complexity of used method (Tier 2, 3 etc).
4 6C.4
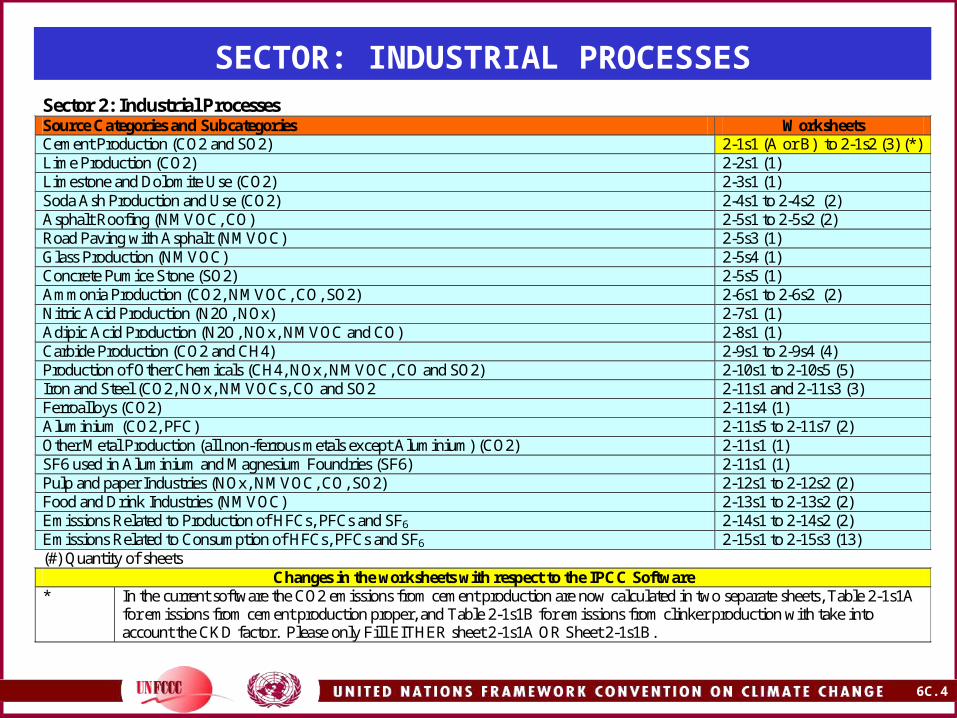
SECTOR: INDUSTRIAL PROCESSES Sector 2: Industrial Processes Source Categories and Subcategories Worksheets Cement Production (CO2 and SO2) 2-1s1 (A or B) to 2-1s2 (3) (*) Lime Production (CO2) 2-2s1 (1) Limestone and Dolomite Use (CO2) 2-3s1 (1) Soda Ash Production and Use (CO2) 2-4s1 to 2-4s2 (2) Asphalt Roofing (NMVOC, CO) 2-5s1 to 2-5s2 (2) Road Paving with Asphalt (NMVOC) 2-5s3 (1) Glass Production (NMVOC) 2-5s4 (1) Concrete Pumice Stone (SO2) 2-5s5 (1) Ammonia Production (CO2, NMVOC, CO, SO2) 2-6s1 to 2-6s2 (2) Nitric Acid Production (N2O, NOx) 2-7s1 (1) Adipic Acid Production (N2O, NOx, NMVOC and CO) 2-8s1 (1) Carbide Production (CO2 and CH4) 2-9s1 to 2-9s4 (4) Production of Other Chemicals (CH4, NOx, NMVOC, CO and SO2) 2-10s1 to 2-10s5 (5) Iron and Steel (CO2, NOx, NMVOCs, CO and SO2 2-11s1 and 2-11s3 (3) Ferroalloys (CO2) 2-11s4 (1) Aluminium (CO2, PFC) 2-11s5 to 2-11s7 (2) Other Metal Production (all non-ferrous metals except Aluminium) (CO2) 2-11s1 (1) SF6 used in Aluminium and Magnesium Foundries (SF6) 2-11s1 (1) Pulp and paper Industries (NOx, NMVOC, CO, SO2) 2-12s1 to 2-12s2 (2) Food and Drink Industries (NMVOC) 2-13s1 to 2-13s2 (2) Emissions Related to Production of HFCs, PFCs and SF6 2-14s1 to 2-14s2 (2) Emissions Related to Consumption of HFCs, PFCs and SF6 2-15s1 to 2-15s3 (13) (#) Quantity of sheets
Changes in the worksheets with respect to the IPCC Software * In the current software the CO2 emissions from cement production are now calculated in two separate sheets, Table 2-1s1A
for emissions from cement production proper, and Table 2-1s1B for emissions from clinker production with take into account the CKD factor. Please only Fill EITHER sheet 2-1s1A OR Sheet 2-1s1B.
5 6C.5
SECTOR: INDUSTRIAL PROCESSESCement Production
SECTOR: INDUSTRIAL PROCESSES (1)
UNFCCC - NAI SOFTWARE
MAIN CATEGORIES
Tier 1: Worksheets
Tier 2 Methods
Remarks
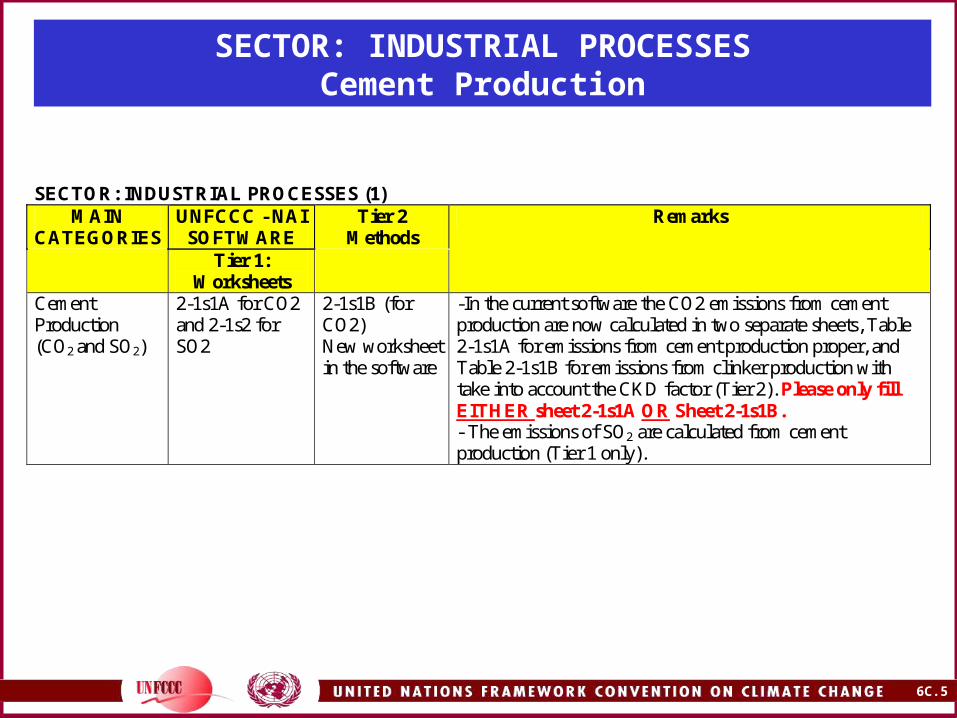
Cement Production (CO2 and SO2)
2-1s1A for CO2 and 2-1s2 for SO2
2-1s1B (for CO2) New worksheet in the software
-In the current software the CO2 emissions from cement production are now calculated in two separate sheets, Table 2-1s1A for emissions from cement production proper, and Table 2-1s1B for emissions from clinker production with take into account the CKD factor (Tier 2). Please only fill EITHER sheet 2-1s1A OR Sheet 2-1s1B. - The emissions of SO2 are calculated from cement production (Tier 1 only).
6 6C.6
SECTOR: INDUSTRIAL PROCESSESExercise 2.1: Cement Production (I)
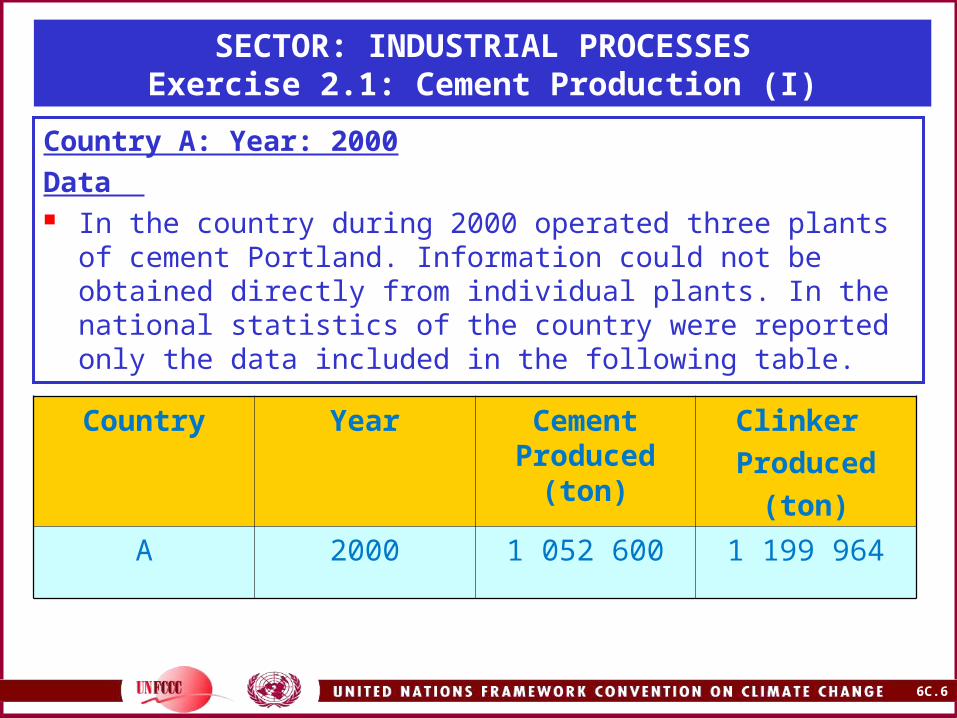
Country A: Year: 2000
Data In the country during 2000 operated three plants of cement
Portland. Information could not be obtained directly from individual plants. In the national statistics of the country were reported only the data included in the following table.
Country Year Cement Produced
(ton)
Clinker
Produced
(ton)
A 2000 1 052 600 1 199 964

7 6C.7
SECTOR: INDUSTRIAL PROCESSESExercise 2.1: Cement Production (II)
Tasks
Using the UNFCCC -NAI Software:
1. Calculates CO2 and SO2 emissions.
2. Verifies the emissions report in the Sectoral and Summary Tables.
3. Fills the Table 8A (Overview Table) for the self evaluation of quality and completeness.
8 6C.8
SECTOR: INDUSTRIAL PROCESSESExercise 2.1: Cement Production (III)
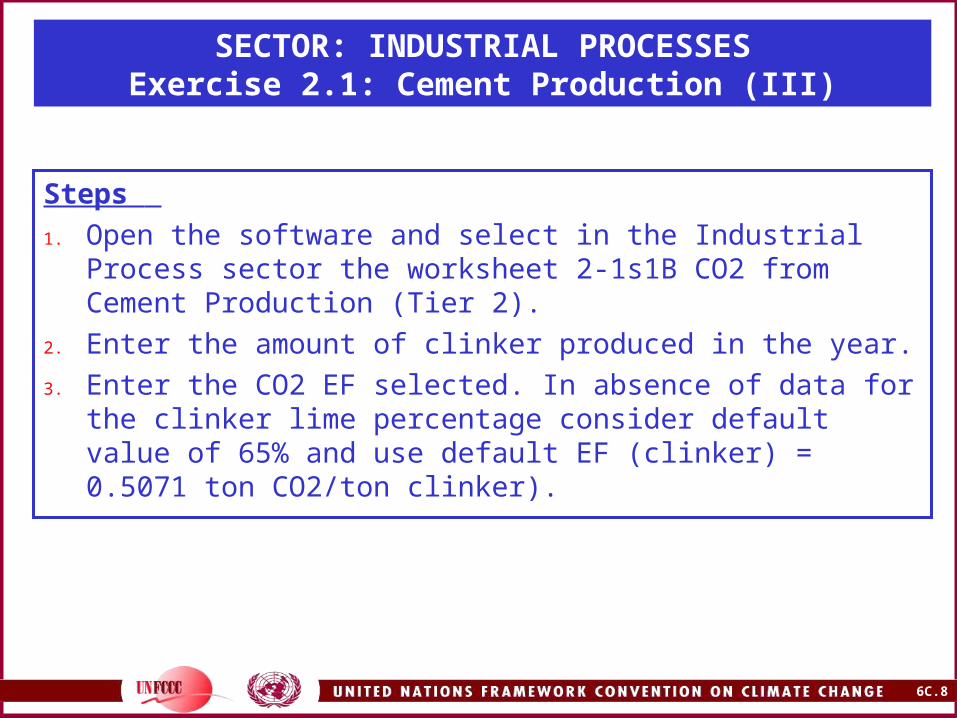
Steps
1. Open the software and select in the Industrial Process sector the worksheet 2-1s1B CO2 from Cement Production (Tier 2).
2. Enter the amount of clinker produced in the year.
3. Enter the CO2 EF selected. In absence of data for the clinker lime percentage consider default value of 65% and use default EF (clinker) = 0.5071 ton CO2/ton clinker).
9 6C.9
SECTOR: INDUSTRIAL PROCESSESExercise 2.1: Cement Production (IV)
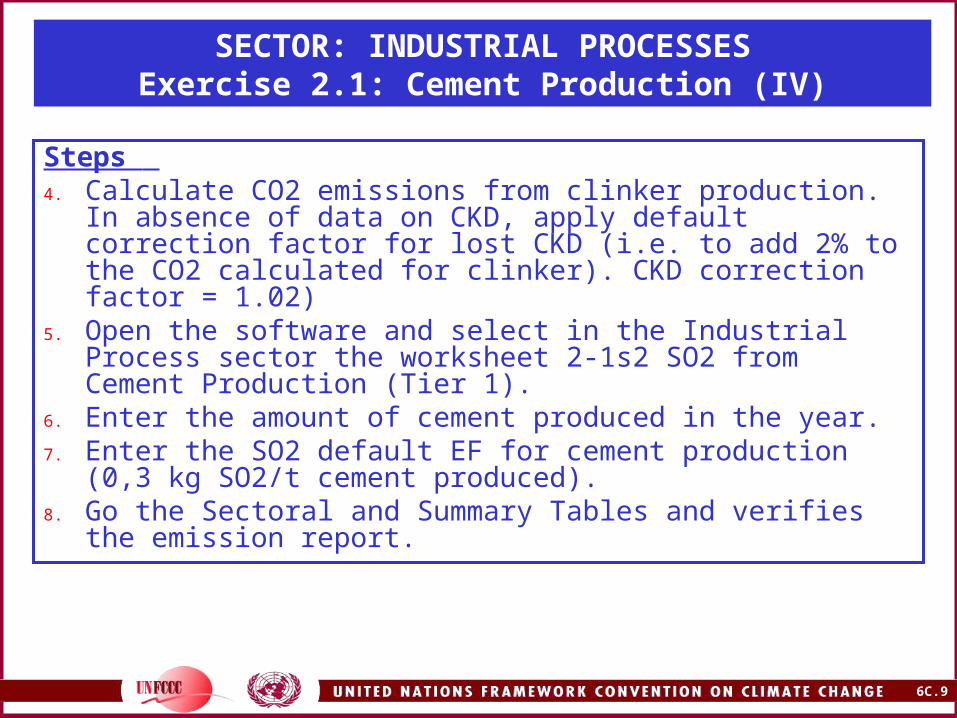
Steps 4. Calculate CO2 emissions from clinker production. In absence of
data on CKD, apply default correction factor for lost CKD (i.e. to add 2% to the CO2 calculated for clinker). CKD correction factor = 1.02)
5. Open the software and select in the Industrial Process sector the worksheet 2-1s2 SO2 from Cement Production (Tier 1).
6. Enter the amount of cement produced in the year.7. Enter the SO2 default EF for cement production (0,3 kg SO2/t
cement produced).8. Go the Sectoral and Summary Tables and verifies the emission
report.
10 6C.10
SECTOR: INDUSTRIAL PROCESSESExercise 2.1: Cement Production (V)
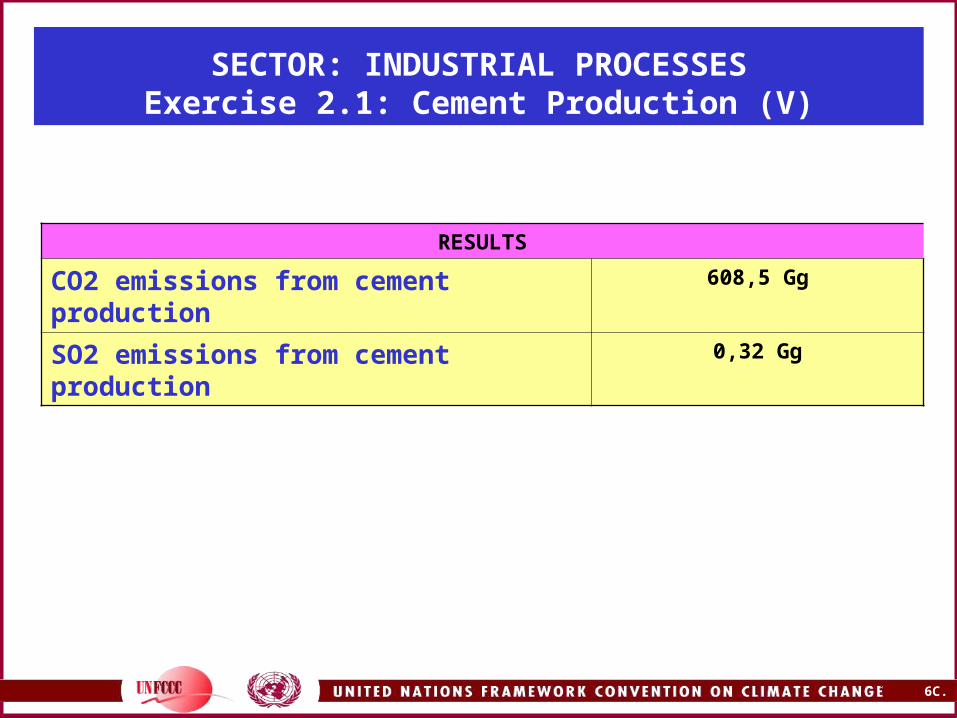
RESULTS
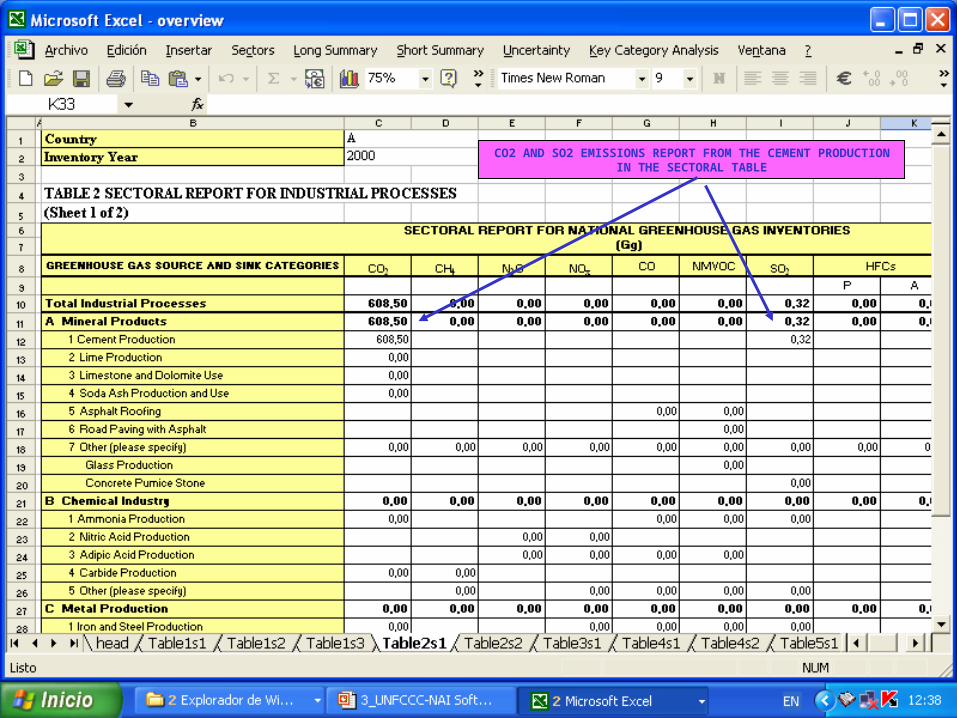
CO2 emissions from cement production 608,5 Gg
SO2 emissions from cement production 0,32 Gg
11 6C.11
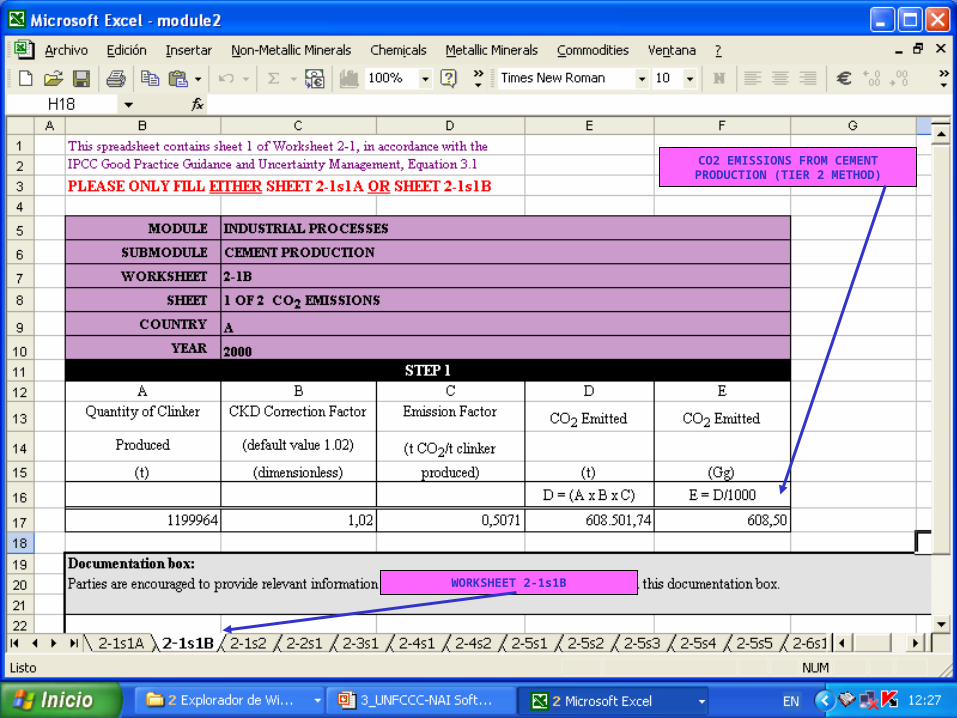
CO2 EMISSIONS FROM CEMENT PRODUCTION (TIER 2 METHOD)
WORKSHEET 2-1s1B

12 6C.12
SO2 EMISSIONS FROM CEMENT PRODUCTION (TIER 1 METHOD)
WORKSHEET 2-1s2
13 6C.13
CO2 AND SO2 EMISSIONS REPORT FROM THE CEMENT PRODUCTION IN THE SECTORAL TABLE

14 6C.14
OBSERVE THAT THE SOFTWARE CALCULATES AUTOMATICALLY THE TOTAL NATIONAL EMISSIONS
CO2 AND SO2 EMISSIONS REPOR FROM CEMENT PRODUCTION IN
THE SUMMARY REPORT TABLE

15 6C.15
CO2 AND SO2 EMISIONS FROM CEMENT PRODUCTION REPORT IN THE SHORT SUMMARY TABLE
16 6C.16
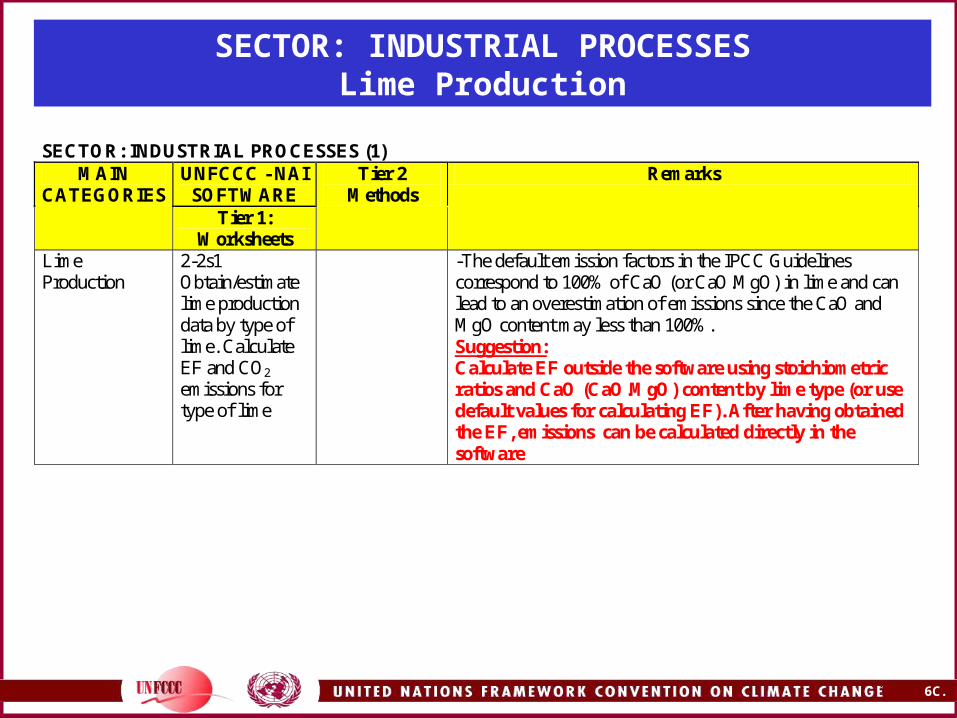
SECTOR: INDUSTRIAL PROCESSESLime Production
SECTOR: INDUSTRIAL PROCESSES (1)
UNFCCC - NAI SOFTWARE
MAIN CATEGORIES
Tier 1: Worksheets
Tier 2 Methods
Remarks
Lime Production
2-2s1 Obtain/estimate lime production data by type of lime. Calculate EF and CO2 emissions for type of lime
-The default emission factors in the IPCC Guidelines correspond to 100% of CaO (or CaO.MgO) in lime and can lead to an overestimation of emissions since the CaO and MgO content may less than 100%. Suggestion: Calculate EF outside the software using stoichiometric ratios and CaO (CaO.MgO) content by lime type (or use default values for calculating EF). After having obtained the EF, emissions can be calculated directly in the software
17 6C.17
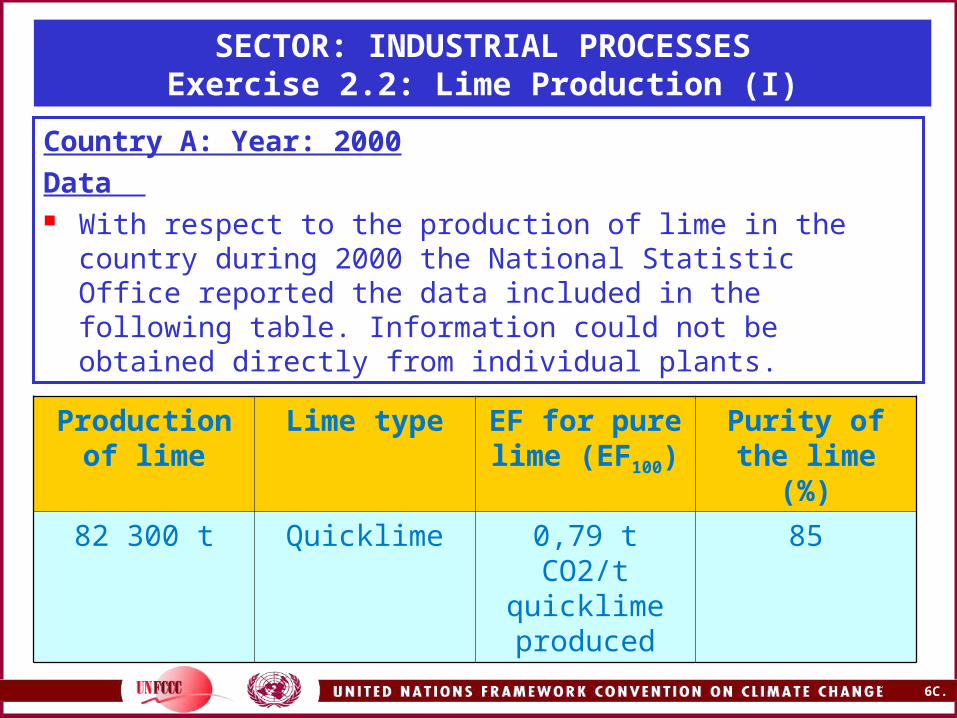
SECTOR: INDUSTRIAL PROCESSESExercise 2.2: Lime Production (I)
Country A: Year: 2000
Data With respect to the production of lime in the country during 2000
the National Statistic Office reported the data included in the following table. Information could not be obtained directly from individual plants.
Production of lime
Lime type EF for pure lime (EF100)
Purity of the lime (%)
82 300 t Quicklime 0,79 t CO2/t quicklime produced
85

18 6C.18
SECTOR: INDUSTRIAL PROCESSESExercise 2.2: Lime Production (II)
Tasks
Using the UNFCCC -NAI Software:
1. Calculates CO2 emissions from lime production.
2. Verifies the emissions report in the Sectoral and Summary Tables.
3. Fills the Table 8A (Overview Table) for the self evaluation of quality and completeness.
19 6C.19
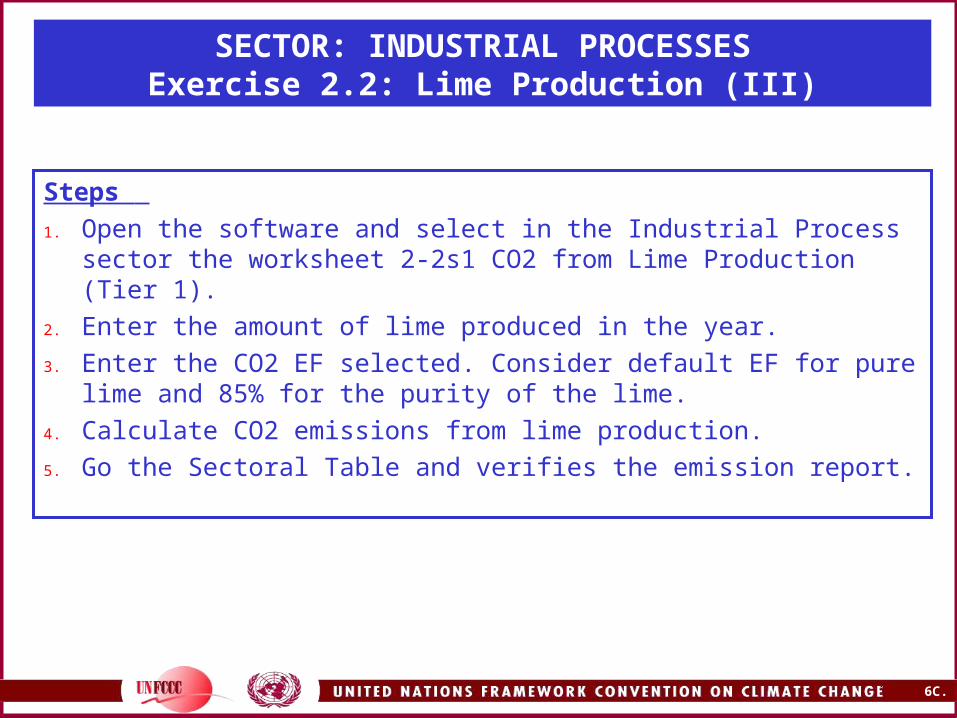
SECTOR: INDUSTRIAL PROCESSESExercise 2.2: Lime Production (III)
Steps
1. Open the software and select in the Industrial Process sector the worksheet 2-2s1 CO2 from Lime Production (Tier 1).
2. Enter the amount of lime produced in the year.
3. Enter the CO2 EF selected. Consider default EF for pure lime and 85% for the purity of the lime.
4. Calculate CO2 emissions from lime production.
5. Go the Sectoral Table and verifies the emission report.
20 6C.20
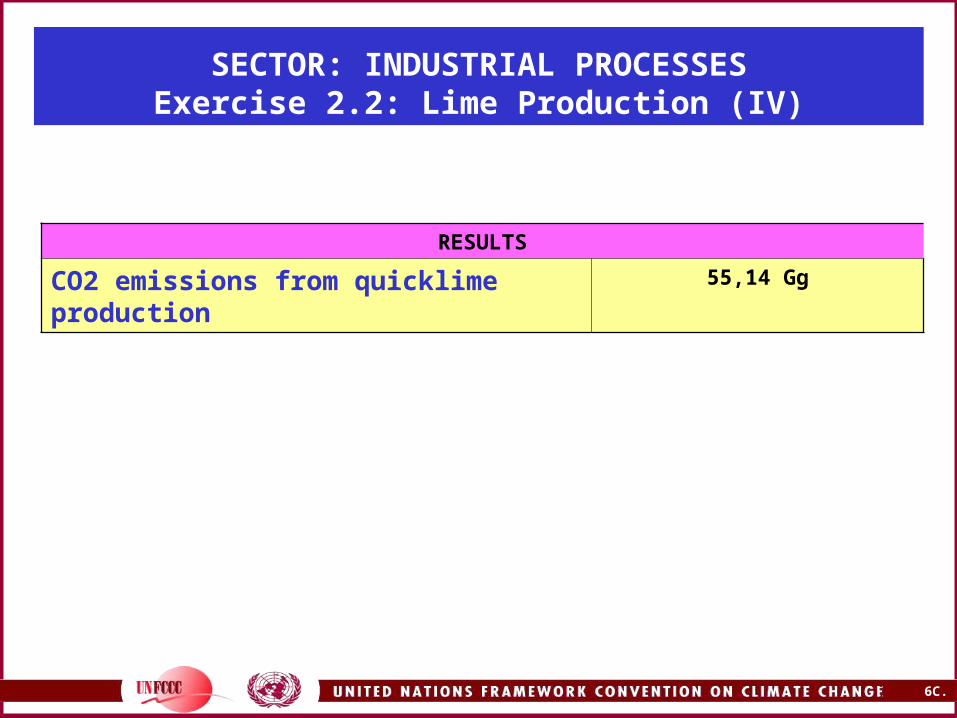
SECTOR: INDUSTRIAL PROCESSESExercise 2.2: Lime Production (IV)
RESULTS
CO2 emissions from quicklime production
55,14 Gg

21 6C.21
CO2 EMISSIONS FROM LIME PRODUCTION

22 6C.22
CO2 EMISSIONS FROM LIME PRODUCTION IN THE SECTORAL
REPORT TABLE

23 6C.23
SECTOR: INDUSTRIAL PROCESSESLimestone and Dolomite; Soda Ash
SECTOR: INDUSTRIAL PROCESSES (2)
UNFCCC - NAI
SOFTWARE
MAIN CATEGORIES
Tier 1: Worksheets
Remarks
Limestone and Dolomite Use
2-3s1 Estimate quantity of limestone or dolomite used. Adjust the default EF using the fractional purity (f) of limestone in CaCO3.
-Good practice guidance has not yet been developed. After having obtained the EF, emissions can be calculated directly in the software. -Consumption is assumed to equal material mined plus material imported minus material exported. Alert: Exclude of calculation limestone or dolomite used for producing cement, lime and magnesium, agricultural activities and processes where CO2 is not generated.
Soda Ash Production and Use
2-4s1(production) 2-4s2 (use)
-Good practice guidance has not yet been developed. If activity data are available there are not difficulties to obtain the emissions with the software. Alert: CO2 emissions associated with the use of coke in soda ash production should be accounted for separately and subtracted from the totals in the combustion section. -For most of the major uses, it is assumed that for each mole of soda ash used, one mole of CO2 is emitted.
24 6C.24
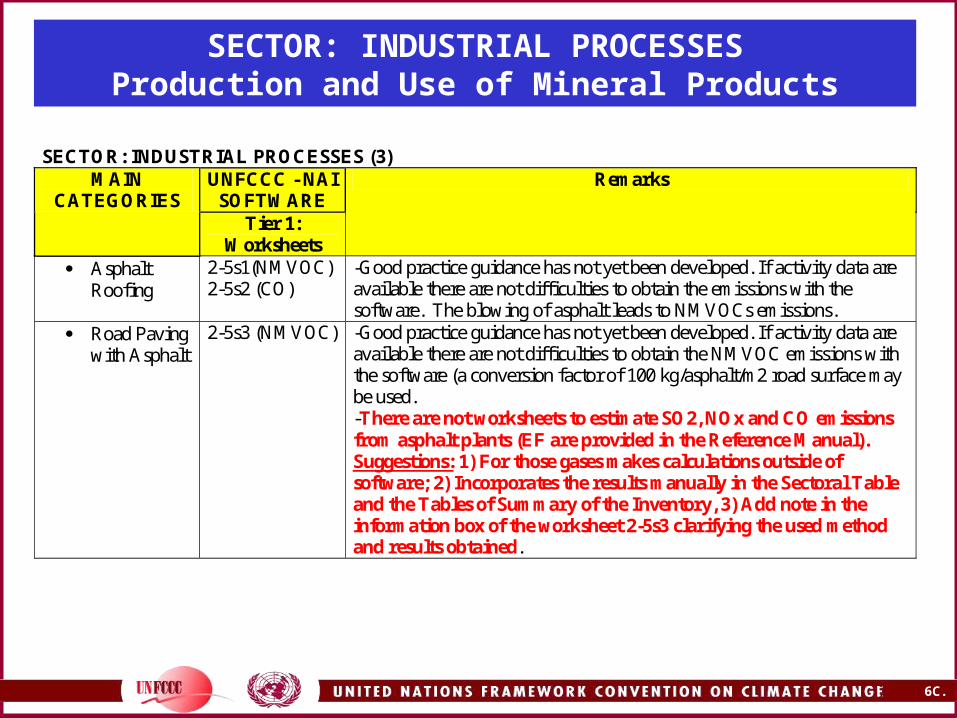
SECTOR: INDUSTRIAL PROCESSESProduction and Use of Mineral Products
SECTOR: INDUSTRIAL PROCESSES (3)
UNFCCC - NAI SOFTWARE
MAIN CATEGORIES
Tier 1: Worksheets
Remarks
Asphalt Roofing
2-5s1(NMVOC) 2-5s2 (CO)
-Good practice guidance has not yet been developed. If activity data are available there are not difficulties to obtain the emissions with the software. The blowing of asphalt leads to NMVOCs emissions.
Road Paving with Asphalt
2-5s3 (NMVOC) -Good practice guidance has not yet been developed. If activity data are available there are not difficulties to obtain the NMVOC emissions with the software (a conversion factor of 100 kg/asphalt/m2 road surface may be used. -There are not worksheets to estimate SO2, NOx and CO emissions from asphalt plants (EF are provided in the Reference Manual). Suggestions: 1) For those gases makes calculations outside of software; 2) Incorporates the results manually in the Sectoral Table and the Tables of Summary of the Inventory, 3) Add note in the information box of the worksheet 2-5s3 clarifying the used method and results obtained.

25 6C.25
SECTOR: INDUSTRIAL PROCESSESOther Mineral Products
SECTOR: INDUSTRIAL PROCESSES (4)
UNFCCC -NAI
SOFTWARE
MAIN CATEGORIES
Tier 1: Worksheets
Remarks
Glass Production
2-5s4 NMVOC
Good practice guidance has not yet been developed. If activity data are available there are not difficulties to obtain the NMVOC emissions with the software
Concrete pumice stone
2-5s5 SO2 Good practice guidance has not yet been developed. If activity data are available there are not difficulties to obtain the SO2 emissions with the software.

26 6C.26
SECTOR: INDUSTRIAL PROCESSESAmmonia Production
SECTOR: INDUSTRIAL PROCESSES (5)
UNFCCC -NAI SOFTWARE
MAIN CATEGORIES
Tier 1: Worksheets
Remarks
Ammonia Production
2-6s1 (Tier 1a CO2) 2-6s2 (Tier 1b CO2) 2-6s2 (Tier 1 NMVOC, CO, SO2)
Good practice guidance has not yet been developed. -The most accurate method (Tier 1a) will be based on the consumption of gas (or oil). It is recommended to determine the carbon content of natural gas for each plant. -As alternative the emissions may be estimated from the ammonia production (Tier 1b; Tier 1). -If activity data are available there are not difficulties to obtain the emissions with the software
27 6C.27
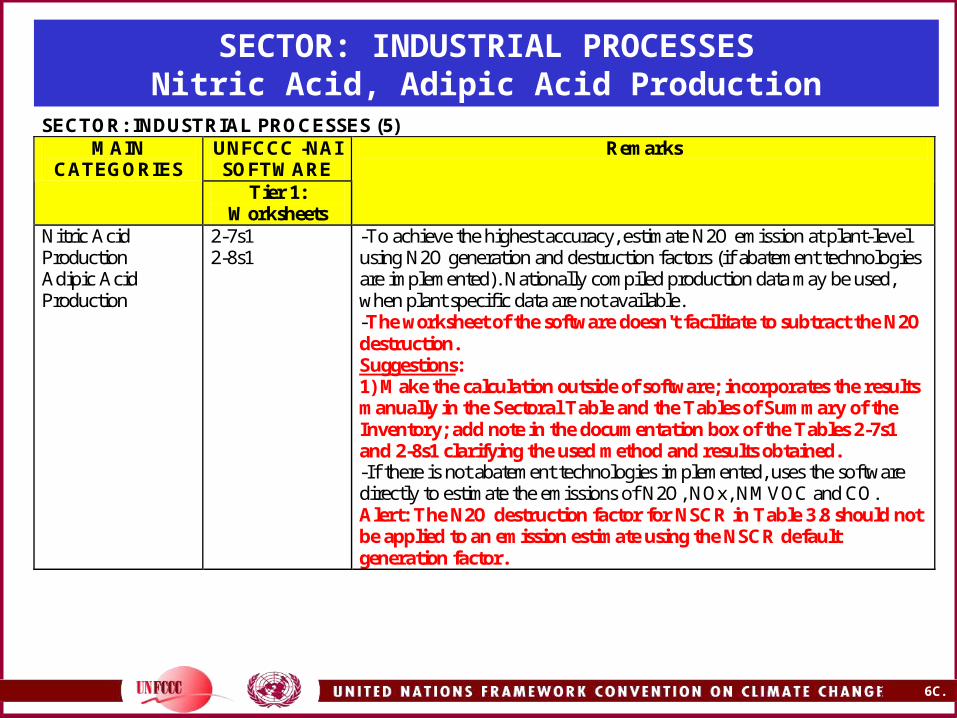
SECTOR: INDUSTRIAL PROCESSESNitric Acid, Adipic Acid Production
SECTOR: INDUSTRIAL PROCESSES (5)
UNFCCC -NAI SOFTWARE
MAIN CATEGORIES
Tier 1: Worksheets
Remarks
Nitric Acid Production Adipic Acid Production
2-7s1 2-8s1
-To achieve the highest accuracy, estimate N2O emission at plant-level using N2O generation and destruction factors (if abatement technologies are implemented). Nationally compiled production data may be used, when plant specific data are not available. -The worksheet of the software doesn't facilitate to subtract the N2O destruction. Suggestions: 1) Make the calculation outside of software; incorporates the results manually in the Sectoral Table and the Tables of Summary of the Inventory; add note in the documentation box of the Tables 2-7s1 and 2-8s1 clarifying the used method and results obtained. -If there is not abatement technologies implemented, uses the software directly to estimate the emissions of N2O, NOx, NMVOC and CO. Alert: The N2O destruction factor for NSCR in Table 3.8 should not be applied to an emission estimate using the NSCR default generation factor.

28 6C.28
SECTOR: INDUSTRIAL PROCESSESCarbide, Other Chemicals
SECTOR: INDUSTRIAL PROCESSES (6)
UNFCCC - NAI SOFTWARE
MAIN CATEGORIES
Tier 1: Worksheets
Remarks
Carbide Production Silicon Carbide 2-9s1, 2-9s2 (CO2 and CH4). Tier 1a based on consumption of petrol coke, carbon content in coke and carbon input sequestered in product. 2-9s3 Tier 1b based on Carbide production (CH4) Calcium Carbide 2-9s4 based on Carbide production
Good practice guidance has not yet been developed. If activity data are available there are not difficulties to obtain the emissions with the software. Calcium Carbide Alert: In the case that lime is not produced in the plant the emissions from the CaO step should be reported in the section “lime production”.
Production of Other Chemicals
2-10s1 to 2-10s5 (CH4, NOx, NMVOC, CO and SO2) A simple methodology is provided
Good practice guidance has not yet been developed. If activity data are available there are not difficulties to obtain the emissions with the software. If it is necessary adds more lines to the worksheet

29 6C.29
SECTOR: INDUSTRIAL PROCESSESIron and Steel
SECTOR: INDUSTRIAL PROCESSES (7) Metal Production (2-11s1 to 2-11s11)
UNFCCC -NAI SOFTWARE
MAIN CATEGORIES
Tier 1: Worksheets
Tier 2 Methods Remarks
-Iron and Steel 2-11s1 (CO2). The Tier 1 calculates emissions from the consumption of the reducing agent and using EF similar to those used to estimate combustion emissions.
2-11s3 (NOx, NMVOCs, CO and SO2
The Tier 2 method includes a correction for the carbon stored in the metals produced. With this method, emissions from iron production and steel production are calculated separately.
CO2 -If activity data are available there are not many difficulties to obtain the CO2 emissions with the software (both using Tier 1 and Tier 2 method). Suggestions: -To estimate the emissions separated from iron and steel and obtain the total of emissions carry out the calculations outside the software and incorporate the results manually to the Sectoral and Summary Tables. For steel produced in electric arc furnaces also add the carbon released from consumed electrodes. -Lime added to electric arc furnaces and its CO2 emissions should be accounted on the lime use section. -When biomass carbon is used the emissions should be reported in the land-use change and forestry sector. Alert: The estimation of CO2 emissions based on production data and production base EF (Worksheet 2-11s2) is not considered to be good practice. Non-CO2 gases If activity data are available there are not difficulties to obtain the emissions with the software.

30 6C.30
SECTOR: INDUSTRIAL PROCESSESExercise 2.3: Iron and Steel Production (I)
Country A: Year: 2000
Data In the country during the year 2000 operated a plant for iron and steel
production. The data submitted directly by the plant included only the Iron/Steel production and that was used Coke like reducing agent (80 000 ton). It was impossible to obtain more details about the chemical composition of the reducing agent and mineral used.
Country Year Iron/Steel production (ton)
A 2000 200 000

31 6C.31
SECTOR: INDUSTRIAL PROCESSESExercise 2.3: Iron and Steel Production (II)
Tasks
Using the UNFCCC -NAI Software:
1. Calculates CO2 emissions.
2. Verifies the emissions report in the Sectoral and Summary Tables.
3. Fills the Table 8A (Overview Table) for the self evaluation of quality and completeness.

32 6C.32
SECTOR: INDUSTRIAL PROCESSESExercise 2.3: Iron and Steel Production (III)
Steps
1. Open the software and select in the Industrial Processes sector the worksheet 2-11-1 for Metal Production (since detailed data for reducing agents are not available, uses the Tier 1 Method. This method slightly overestimates emissions; 1-10%)
2. Enter the mass of reducing agent used (80 000 ton).
3. Since country-specific data at the plant level are not available use the default EF for reducing agents in pig iron production (3.1ton CO2/ton reducing agent).

33 6C.33
SECTOR: INDUSTRIAL PROCESSESExercise 2.3: Iron and Steel Production (IV)
Steps
4. Estimate CO2 emissions.5. Add note in the information box explaining that was impossible to
obtain more details about the chemical composition of the reducing agent and mineral used and for this reason the correction of the column C is not applied
6. Go to the Sectoral and Summary tables and verify the report of the emission estimated.
7. Verify that the quantity of coke used as reducing agent was subtracted from the Fuel Combustion sector.
Note: Tier 2 is more accurate but also more data-intensive. Includes a correction for the carbon-stored in the metals produced
34 6C.34
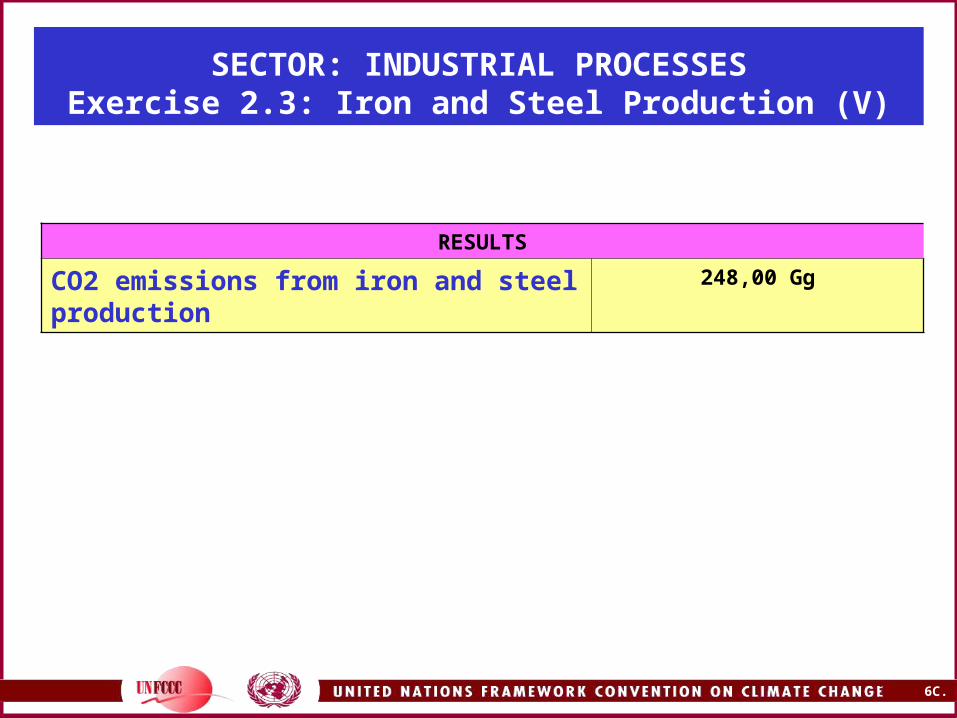
SECTOR: INDUSTRIAL PROCESSESExercise 2.3: Iron and Steel Production (V)
RESULTS
CO2 emissions from iron and steel production
248,00 Gg

35 6C.35
CO2 EMISSIONS FROM IRON AND STEEL PRODUCTION
NOTE IN THE DOCUMENTATION BOX

36 6C.36
CO2 EMISSIONS FROM IRON AND STEEL PRODUCTION IN THE SECTORAL REPORT TABLE

37 6C.37
CO2 EMISSIONS FROM IRON AND STEEL PRODUCTION IN THE SUMMARY REPORT TABLE
38 6C.38
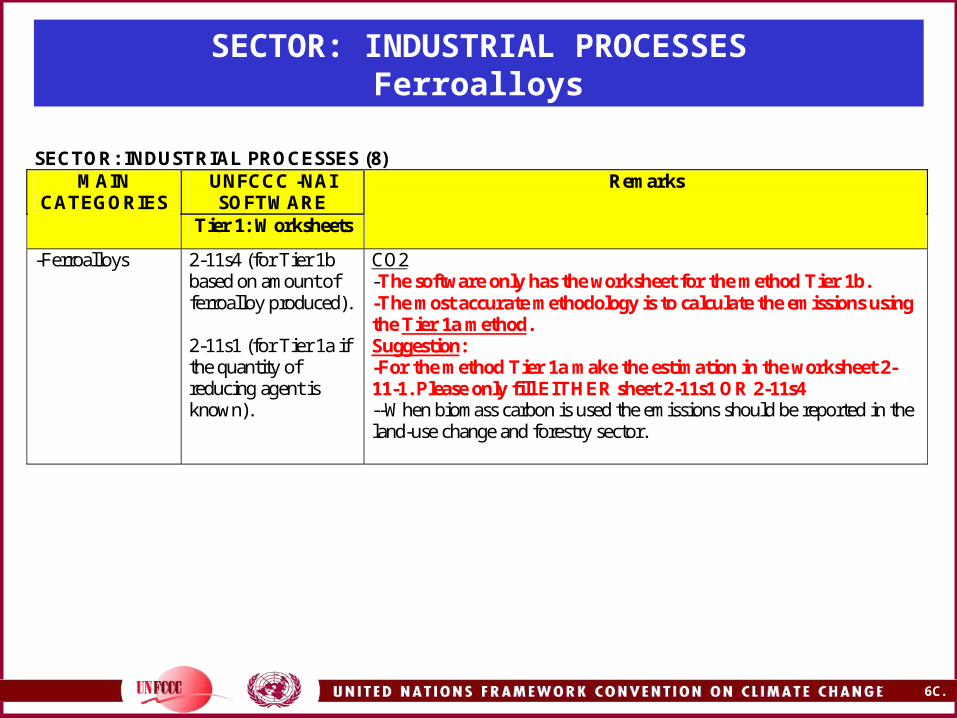
SECTOR: INDUSTRIAL PROCESSESFerroalloys
SECTOR: INDUSTRIAL PROCESSES (8)
UNFCCC -NAI SOFTWARE
MAIN CATEGORIES
Tier 1: Worksheets
Remarks
-Ferroalloys 2-11s4 (for Tier 1b based on amount of ferroalloy produced). 2-11s1 (for Tier 1a if the quantity of reducing agent is known).
CO2 -The software only has the worksheet for the method Tier 1b. -The most accurate methodology is to calculate the emissions using the Tier 1a method. Suggestion: -For the method Tier 1a make the estimation in the worksheet 2-11-1. Please only fill EITHER sheet 2-11s1 OR 2-11s4 --When biomass carbon is used the emissions should be reported in the land-use change and forestry sector.
39 6C.39
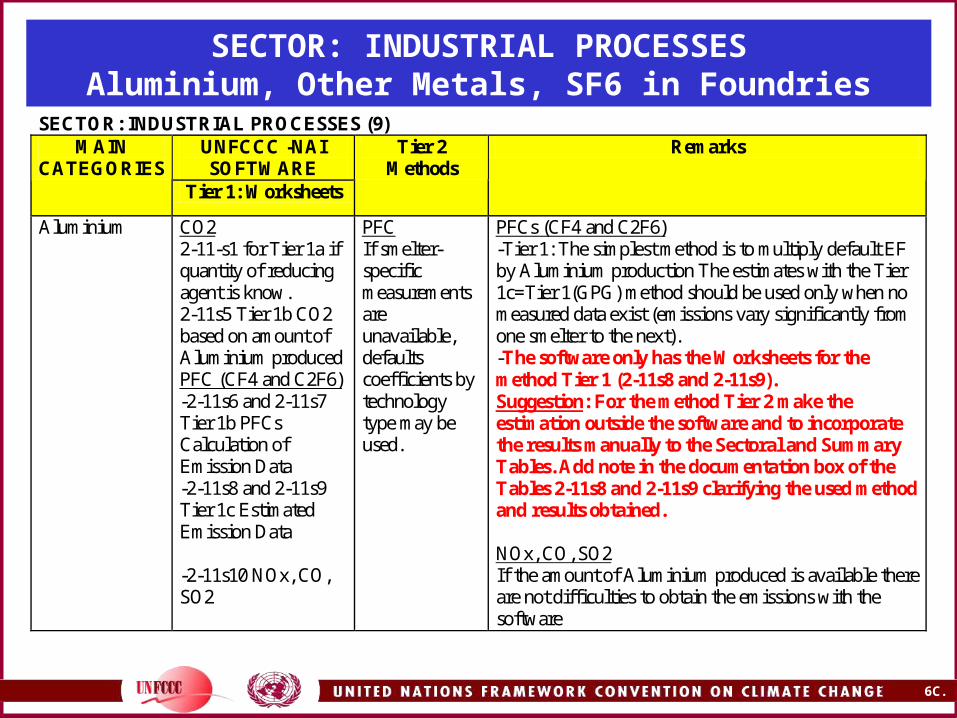
SECTOR: INDUSTRIAL PROCESSESAluminium, Other Metals, SF6 in Foundries
SECTOR: INDUSTRIAL PROCESSES (9) UNFCCC -NAI SOFTWARE
MAIN CATEGORIES
Tier 1: Worksheets
Tier 2 Methods
Remarks
Aluminium CO2 2-11-s1 for Tier 1a if quantity of reducing agent is know. 2-11s5 Tier 1b CO2 based on amount of Aluminium produced PFC (CF4 and C2F6) -2-11s6 and 2-11s7 Tier 1b PFCs Calculation of Emission Data -2-11s8 and 2-11s9 Tier 1c Estimated Emission Data -2-11s10 NOx, CO, SO2
PFC If smelter- specific measurements are unavailable, defaults coefficients by technology type may be used.
PFCs (CF4 and C2F6) -Tier 1: The simplest method is to multiply default EF by Aluminium production The estimates with the Tier 1c=Tier 1(GPG) method should be used only when no measured data exist (emissions vary significantly from one smelter to the next). -The software only has the Worksheets for the method Tier 1 (2-11s8 and 2-11s9). Suggestion: For the method Tier 2 make the estimation outside the software and to incorporate the results manually to the Sectoral and Summary Tables. Add note in the documentation box of the Tables 2-11s8 and 2-11s9 clarifying the used method and results obtained. NOx, CO, SO2 If the amount of Aluminium produced is available there are not difficulties to obtain the emissions with the software
40 6C.40
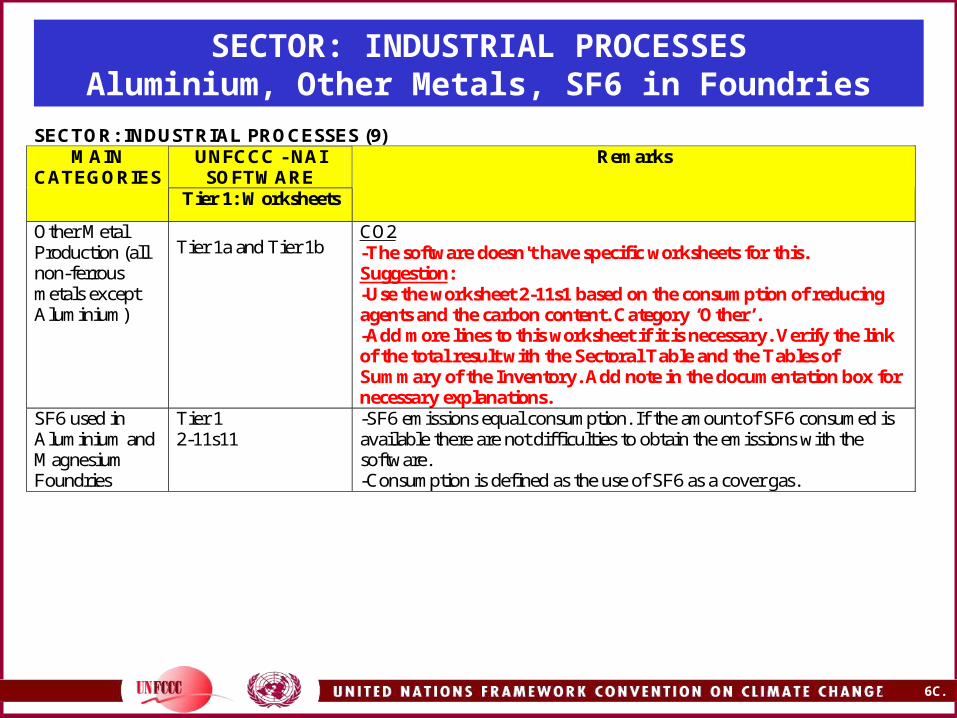
SECTOR: INDUSTRIAL PROCESSESAluminium, Other Metals, SF6 in Foundries
SECTOR: INDUSTRIAL PROCESSES (9) UNFCCC - NAI
SOFTWARE MAIN
CATEGORIES Tier 1: Worksheets
Remarks
Other Metal Production (all non-ferrous metals except Aluminium)
Tier 1a and Tier 1b CO2 -The software doesn't have specific worksheets for this. Suggestion: -Use the worksheet 2-11s1 based on the consumption of reducing agents and the carbon content. Category ‘Other’. -Add more lines to this worksheet if it is necessary. Verify the link of the total result with the Sectoral Table and the Tables of Summary of the Inventory. Add note in the documentation box for necessary explanations.
SF6 used in Aluminium and Magnesium Foundries
Tier 1 2-11s11
-SF6 emissions equal consumption. If the amount of SF6 consumed is available there are not difficulties to obtain the emissions with the software. -Consumption is defined as the use of SF6 as a cover gas.
41 6C.41
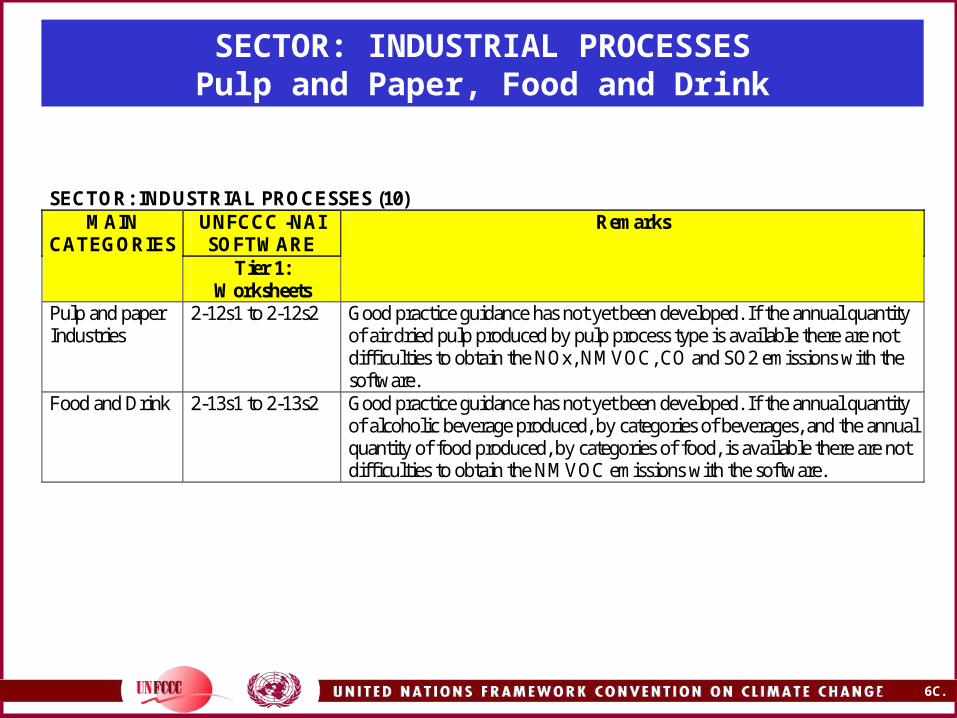
SECTOR: INDUSTRIAL PROCESSESPulp and Paper, Food and Drink
SECTOR: INDUSTRIAL PROCESSES (10)
UNFCCC -NAI SOFTWARE
MAIN CATEGORIES
Tier 1: Worksheets
Remarks
Pulp and paper Industries
2-12s1 to 2-12s2 Good practice guidance has not yet been developed. If the annual quantity of air dried pulp produced by pulp process type is available there are not difficulties to obtain the NOx, NMVOC, CO and SO2 emissions with the software.
Food and Drink 2-13s1 to 2-13s2 Good practice guidance has not yet been developed. If the annual quantity of alcoholic beverage produced, by categories of beverages, and the annual quantity of food produced, by categories of food, is available there are not difficulties to obtain the NMVOC emissions with the software.
42 6C.42
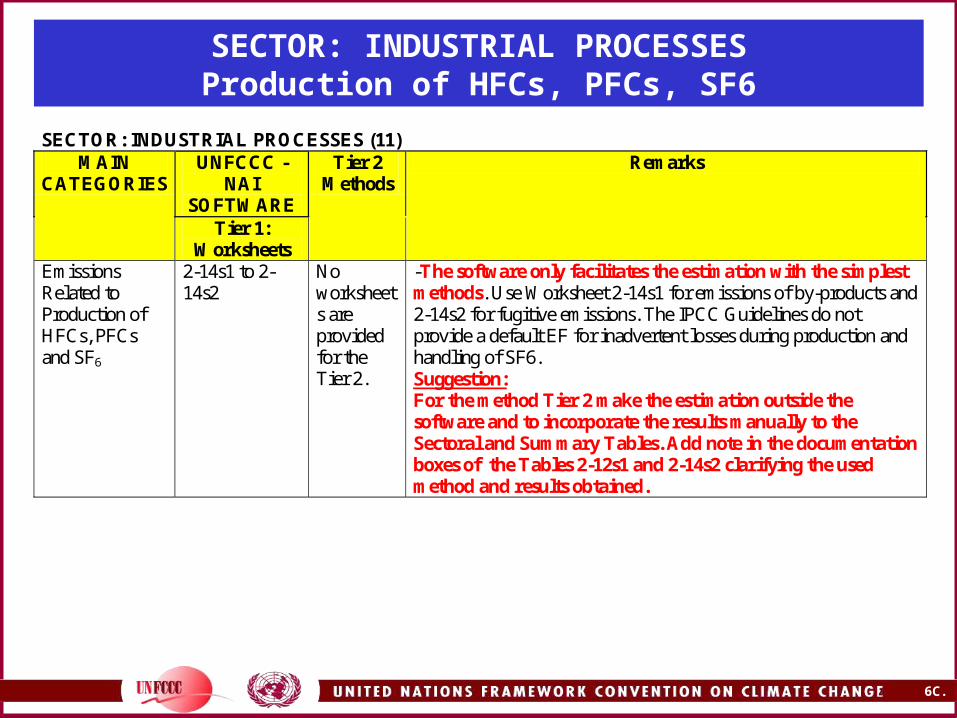
SECTOR: INDUSTRIAL PROCESSESProduction of HFCs, PFCs, SF6
SECTOR: INDUSTRIAL PROCESSES (11)
UNFCCC -NAI
SOFTWARE
MAIN CATEGORIES
Tier 1: Worksheets
Tier 2 Methods
Remarks
Emissions Related to Production of HFCs, PFCs and SF6
2-14s1 to 2-14s2
No worksheets are provided for the Tier 2.
-The software only facilitates the estimation with the simplest methods. Use Worksheet 2-14s1 for emissions of by-products and 2-14s2 for fugitive emissions. The IPCC Guidelines do not provide a default EF for inadvertent losses during production and handling of SF6. Suggestion: For the method Tier 2 make the estimation outside the software and to incorporate the results manually to the Sectoral and Summary Tables. Add note in the documentation boxes of the Tables 2-12s1 and 2-14s2 clarifying the used method and results obtained.
43 6C.43
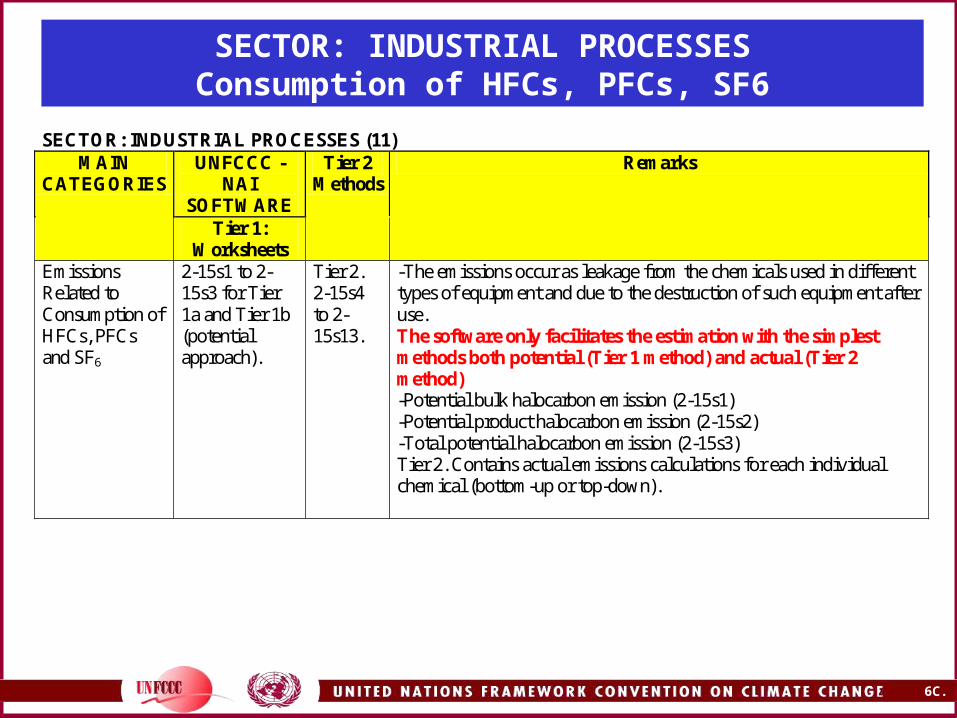
SECTOR: INDUSTRIAL PROCESSESConsumption of HFCs, PFCs, SF6
SECTOR: INDUSTRIAL PROCESSES (11)
UNFCCC - NAI
SOFTWARE
MAIN CATEGORIES
Tier 1: Worksheets
Tier 2 Methods
Remarks
Emissions Related to Consumption of HFCs, PFCs and SF6
2-15s1 to 2-15s3 for Tier 1a and Tier 1b (potential approach).
Tier 2. 2-15s4 to 2-15s13.
-The emissions occur as leakage from the chemicals used in different types of equipment and due to the destruction of such equipment after use. The software only facilitates the estimation with the simplest methods both potential (Tier 1 method) and actual (Tier 2 method) -Potential bulk halocarbon emission (2-15s1) -Potential product halocarbon emission (2-15s2) -Total potential halocarbon emission (2-15s3) Tier 2. Contains actual emissions calculations for each individual chemical (bottom-up or top-down).
44 6C.44
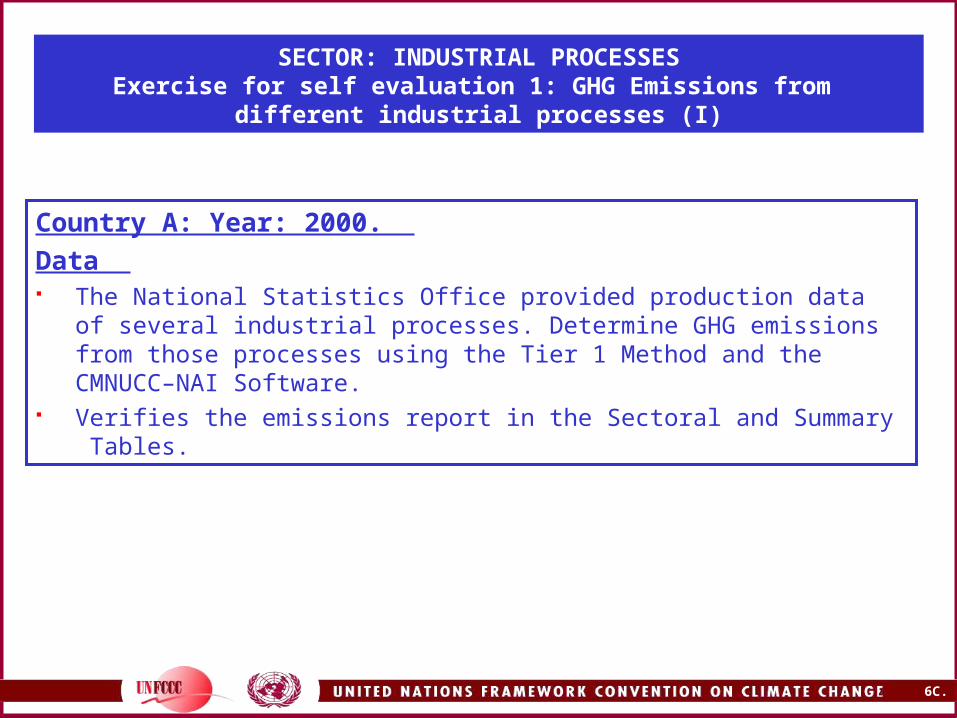
SECTOR: INDUSTRIAL PROCESSESExercise for self evaluation 1: GHG Emissions from
different industrial processes (I)
Country A: Year: 2000.
Data The National Statistics Office provided production data of several
industrial processes. Determine GHG emissions from those processes using the Tier 1 Method and the CMNUCC–NAI Software.
Verifies the emissions report in the Sectoral and Summary Tables.

45 6C.45
SECTOR: INDUSTRIAL PROCESSESExercise for self evaluation 1: GHG Emissions from different
industrial processes (II)
COUNTRY A: YEAR 2000. PRODUCTION DATA OF SEVERAL INDUSTRIAL PROCESSES
PROCESS PRODUCTION EMISION FACTOR
Glass 7173,04 t 4,5 kg COVDM/t glass
Calcium Carbide 8279,3 t 1,8 t CO2/t carbide
Alcoholic Beverages
Wine 155900 hl 0,08 kg COVDM/hl
Beer 2136100 hl 0,035 kg COVDM/hl
Spirits (Rum) (*) 594100 hl 15 kg COVDM/hl
Foods
Bread 464100 t 8 kg COVDM/t
Cookies 21400 t 1 kg COVDM/t
Coffee roasting 20500 0,55 kg COVDM/t
Sugar 4165200 t 10 kg COVDM/t
(*) The emission factor for the rum is based on the alcoholic content of the beberage(40% in this case). Takes into account this fact and incorporate note in the documentation box in the corresponding worksheet.
46 6C.46
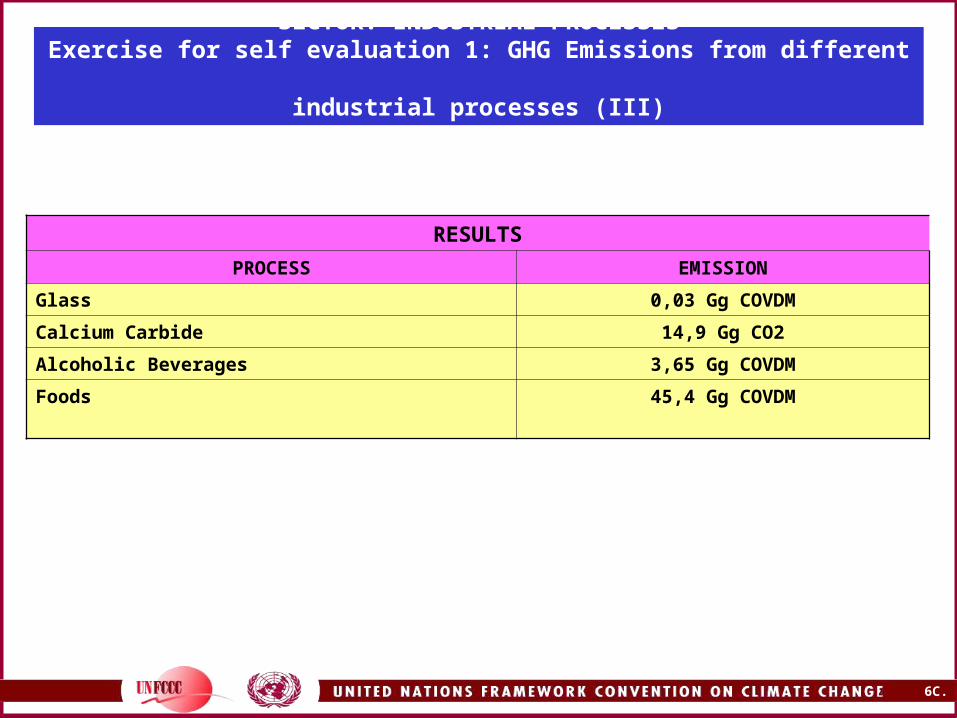
SECTOR: INDUSTRIAL PROCESSESExercise for self evaluation 1: GHG Emissions from different
industrial processes (III)
RESULTS
PROCESS EMISSION
Glass 0,03 Gg COVDM
Calcium Carbide 14,9 Gg CO2
Alcoholic Beverages 3,65 Gg COVDM
Foods 45,4 Gg COVDM
47 6C.47
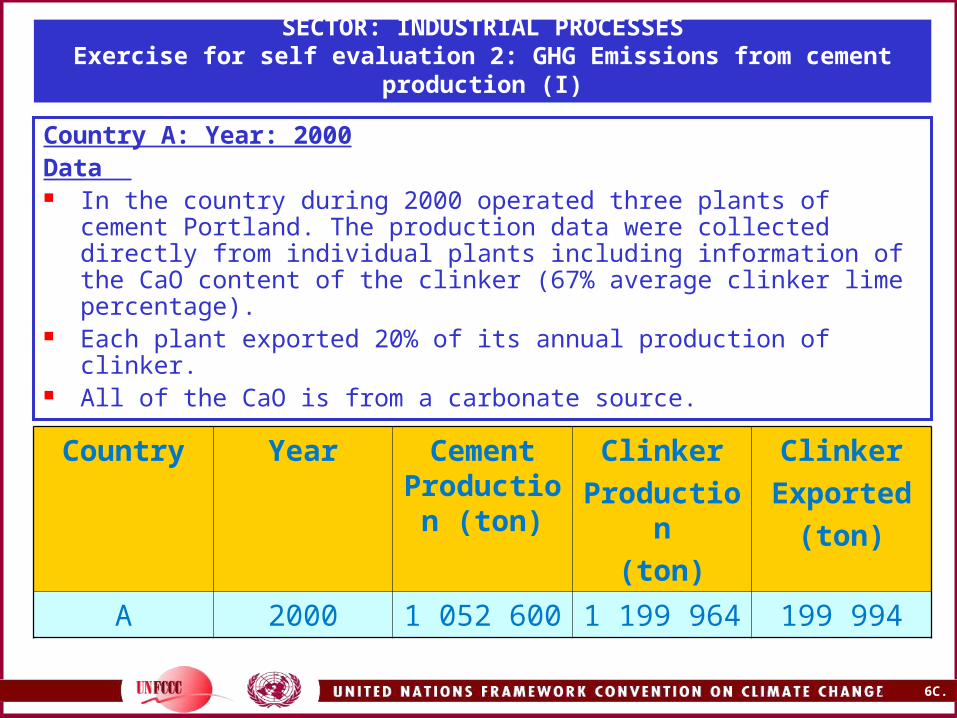
SECTOR: INDUSTRIAL PROCESSESExercise for self evaluation 2: GHG Emissions from cement production (I)
Country A: Year: 2000Data In the country during 2000 operated three plants of cement
Portland. The production data were collected directly from individual plants including information of the CaO content of the clinker (67% average clinker lime percentage).
Each plant exported 20% of its annual production of clinker. All of the CaO is from a carbonate source.
Country Year Cement Production
(ton)
Clinker
Production
(ton)
Clinker
Exported
(ton)
A 2000 1 052 600 1 199 964 199 994
48 6C.48
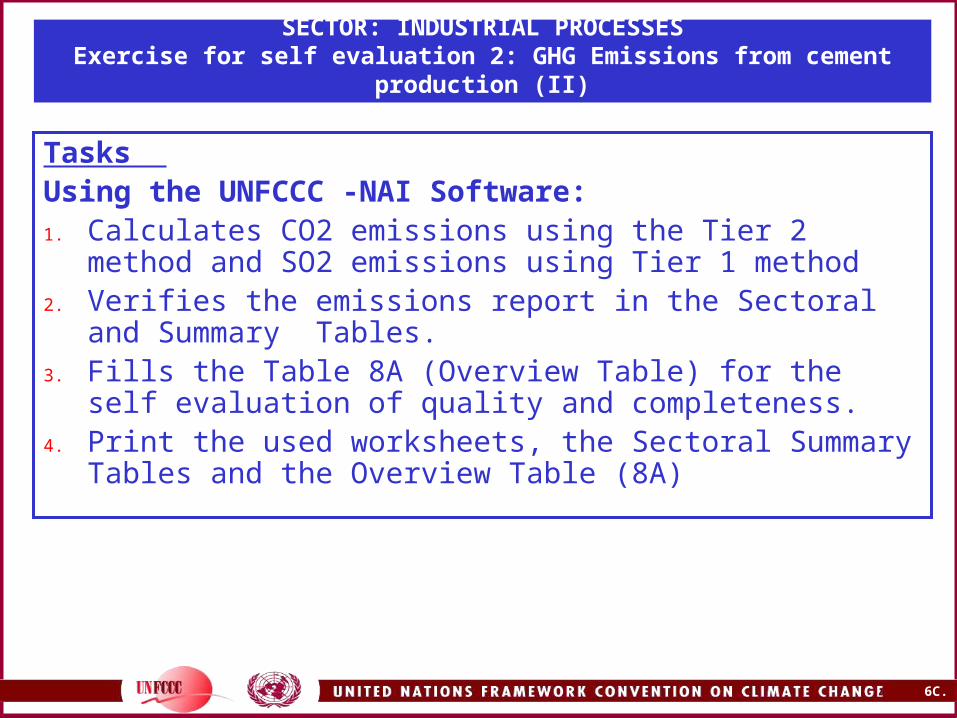
SECTOR: INDUSTRIAL PROCESSESExercise for self evaluation 2: GHG Emissions from cement production (II)
Tasks Using the UNFCCC -NAI Software:1. Calculates CO2 emissions using the Tier 2 method and SO2
emissions using Tier 1 method2. Verifies the emissions report in the Sectoral and Summary
Tables.3. Fills the Table 8A (Overview Table) for the self evaluation of
quality and completeness. 4. Print the used worksheets, the Sectoral Summary Tables and
the Overview Table (8A)
49 6C.49
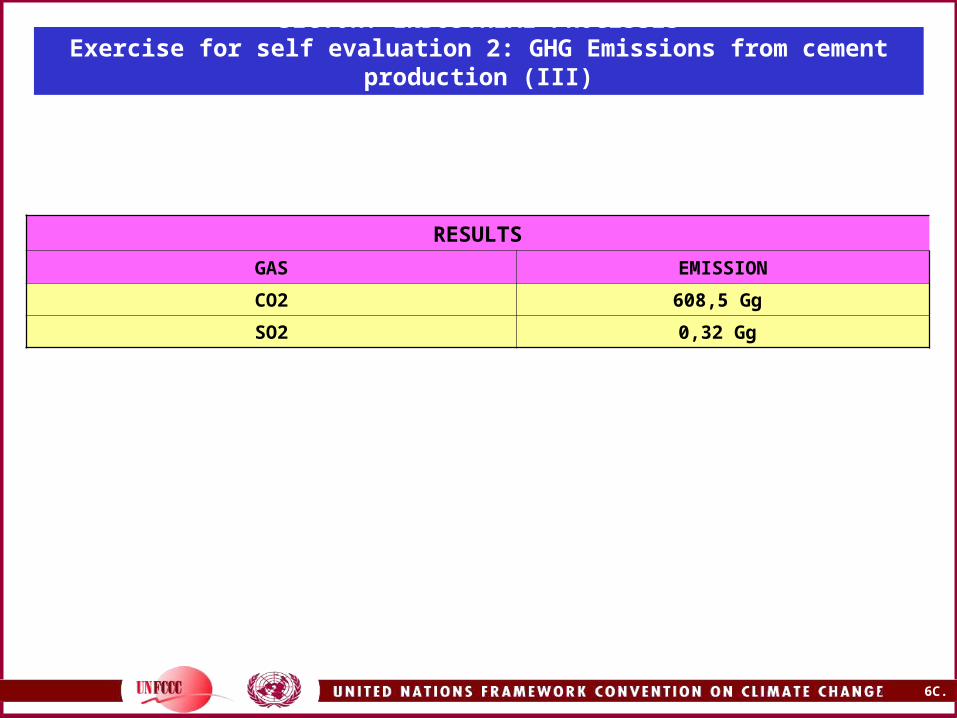
SECTOR: INDUSTRIAL PROCESSESExercise for self evaluation 2: GHG Emissions from cement production (III)
RESULTS
GAS EMISSION
CO2 608,5 Gg
SO2 0,32 Gg
6B.50
Thank you