3 EXISTING TRANSPORTATION DEMAND
108
The Comprehensive Study on the Sustainable Development of Transport System in Vietnam (VITRANSS 2) MAINTEXT 3-1 3 EXISTING TRANSPORTATION DEMAND 3.1 Transportation Surveys and Database 1) Transportation Surveys Conducted in VITRANSS 2 (1) Overview 3.1 For the purpose of transportation demand analysis, two types of information are needed: the first is network information, and the second is demand information. Network information is basically the definition of the transportation network as well as any sche- duled transportation service along the network. On the demand side, what is needed is the origin-destination database. 3.2 Much of the network databases, including those on ongoing and planned projects, were gathered from the corresponding subsector authorities. On the demand side, with the exception of coastal shipping, the existing database is at least three years old. These databases are summarized in the table below. Table 3.1.1 Databases for Demand Forecasting Subsector Network Database (Source) Demand Database (Source) Road Road inventory (VRA) 2005 Road OD database (JICA-TDSI) Railway Rail inventory (VNR) Rail services (VNR) 2006 Railway route database (JICA-TDSI) IWT Channel inventory (VIWA) Port inventory (VIWA) 2005 IWT OD database (JICA-TDSI) Maritime Port inventory (VINAMARINE) 1999 Coastal shipping OD database (JICA) 2006 Port traffic (VPA) Aviation Airport inventory (CAAV) 2008 air routes (CAAV) 2007 Airport traffic (CAAV) Air traffic by route (private airlines) Source: VITRANSS 2 Study Team. 3.3 While the road and IWT OD database seems new, traffic has reportedly grown at such a rapid rate that it is necessary to update the 2005 database. Moreover, the OD da- tabase on coastal shipping was rather outdated and required updating as well. 3.4 To address the gaps in the existing transportation demand databases therefore, transportation surveys were conducted. Included in these surveys was a transportation industry and logistics survey to clarify the profile of transportation service providers and to develop a baseline for policies in the development of transportation service providers. The survey examined the cost structure of providing transportation services in Vietnam. It also quantified logistics costs in the country, the results of which became the basis for analyz- ing logistics services nationwide and the recommendations for improving them. A trans- portation industry survey was conducted in 1999, but it excluded a logistics survey. 3.5 It was also necessary to derive information on passengers and trucks at terminals to be able to supplement statistics and survey results to accurately determine how pas- sengers and goods travel beyond the terminals, such as seaports, airports, railway sta- tions, and airport terminals. The last passenger and freight terminal survey conducted in Vietnam was in 1999 yet. 3.6 The transportation surveys conducted in VITRANSS 2 are overviewed in Table 3.1.2. For details, refer to Technical Report No.1 on traffic surveys and databases.
Transcript of 3 EXISTING TRANSPORTATION DEMAND

The Comprehensive Study on the Sustainable Development of Transport System in Vietnam (VITRANSS 2) MAINTEXT
3-1
3 EXISTING TRANSPORTATION DEMAND
3.1 Transportation Surveys and Database
1) Transportation Surveys Conducted in VITRANSS 2
(1) Overview
3.1 For the purpose of transportation demand analysis, two types of information are needed: the first is network information, and the second is demand information. Network information is basically the definition of the transportation network as well as any sche-duled transportation service along the network. On the demand side, what is needed is the origin-destination database.
3.2 Much of the network databases, including those on ongoing and planned projects, were gathered from the corresponding subsector authorities. On the demand side, with the exception of coastal shipping, the existing database is at least three years old. These databases are summarized in the table below.
Table 3.1.1 Databases for Demand Forecasting
Subsector Network Database (Source) Demand Database (Source) Road Road inventory (VRA) 2005 Road OD database (JICA-TDSI) Railway Rail inventory (VNR)
Rail services (VNR) 2006 Railway route database (JICA-TDSI)
IWT Channel inventory (VIWA) Port inventory (VIWA)
2005 IWT OD database (JICA-TDSI)
Maritime Port inventory (VINAMARINE) 1999 Coastal shipping OD database (JICA) 2006 Port traffic (VPA)
Aviation Airport inventory (CAAV) 2008 air routes (CAAV)
2007 Airport traffic (CAAV) Air traffic by route (private airlines)
Source: VITRANSS 2 Study Team.
3.3 While the road and IWT OD database seems new, traffic has reportedly grown at such a rapid rate that it is necessary to update the 2005 database. Moreover, the OD da-tabase on coastal shipping was rather outdated and required updating as well.
3.4 To address the gaps in the existing transportation demand databases therefore, transportation surveys were conducted. Included in these surveys was a transportation industry and logistics survey to clarify the profile of transportation service providers and to develop a baseline for policies in the development of transportation service providers. The survey examined the cost structure of providing transportation services in Vietnam. It also quantified logistics costs in the country, the results of which became the basis for analyz-ing logistics services nationwide and the recommendations for improving them. A trans-portation industry survey was conducted in 1999, but it excluded a logistics survey.
3.5 It was also necessary to derive information on passengers and trucks at terminals to be able to supplement statistics and survey results to accurately determine how pas-sengers and goods travel beyond the terminals, such as seaports, airports, railway sta-tions, and airport terminals. The last passenger and freight terminal survey conducted in Vietnam was in 1999 yet.
3.6 The transportation surveys conducted in VITRANSS 2 are overviewed in Table 3.1.2. For details, refer to Technical Report No.1 on traffic surveys and databases.
The Comprehensive Study on the Sustainable Development of Transport System in Vietnam (VITRANSS 2) MAINTEXT
3-2
Table 3.1.2 Traffic and Transportation Surveys Conducted in VITRANSS 2
Type Purpose Coverage Methodology Information Implementation 1. Road Traffic
Count • To establish control
totals for OD data-base development
• 24 in the north • 14 in the central • 16 in the south • 54 in total
• 3 weekday x 24/16 hour manual traffic count
• Hourly directional vehi-cular traffic count for 10 vehicle class
• Survey: 9–18 Jan (completed)
• Encoding: 5 Feb (completed)
2. Road OD Interview
• To establish OD rates and load factors for OD database devel-opment
• 24 in the north • 14 in the central • 16 in the south • 54 in total
• Police assisted inter-view for 1 weekday ge-nerating 300–500 sam-ples per station
• OD Data, Passenger load factor, freight load factor by commodity. Covering cars, trucks, busses, and motor-cycles
• Survey: 9–18 Jan (completed)
• Encoding: 5 Feb (completed)
・
3. IWT Traffic Count
• To establish control totals for OD data-base development
• 20 in the north • 21 in the south • 41 in total
• 2 weekday x 24/14 hour manual count
• Hourly directional ves-sel traffic for 9 vessels class and classified by size
• Survey: 9–18 Jan (completed)
• Encoding: 5 Feb (completed)
・ 4. IWT OD
Interview • To establish OD rates
and load factors for OD database devel-opment
• 9 in the north • 7 in the south • 16 in total
• Police assisted inter-view of vessel captain for 1 weekday generat-ing 30–150 samples per station
• OD Data, Passenger load factor, freight load factor by commodity.
• Survey: 9–18 Jan (completed)
• Encoding: 5 Feb (completed)
・ 5. Passenger
Terminal In-terview
• To establish informa-tion to convert linked OD data to unlinked OD data, and to de-rive parameters for modal preferences
• 7 airport terminals • 9 rail stations • 11 bus terminals • 6 cross-border posts • 5 car terminals (i.e.,
gas station) • 38 in total
• Interview of passenger or car driver generating 100~200 samples per station
• OD data, trip characte-ristics, socio-economic profile, stated prefe-rence data ・
• Survey: 9–18 Jan (completed)
• Encoding: 18 Feb (completed)
・
6. Truck Ter-minal Inter-view
• To establish informa-tion to convert linked OD data to unlinked OD data
• 7 seaports • 5 rail stations • 6 cross-border posts • 2 airport terminals • 20 in total
• Interview of truck driver generating 75–200 samples per station
• OD Data, freight load factor by commodity
・
• Survey: 9–18 Jan (completed)
• Encoding: 18 Feb (completed)
・ 7. Port OD
Survey • To derive the OD flow
for coastal shipping • 20 ports • Collection and encod-
ing of cargo manifests • OD data, commodity
types, vessel characte-ristics
• Survey 27 Feb(?) (completed)
• Encoding 5 May (completed)
8. Transporta-tion Industry and Logis-tics Survey
• To develop a profile of transportation ser-vice providers
• Formulate cost struc-ture of transportation service
• Develop a baseline of logistics cost
• Manufacturers (logis-tics), truck company, bus company, IWT company, shipping company
• For each, 35 samples each, with 25 self-answer samples and 10 interviewed samples
• Self-answer question-naire with telephone follow-up;
• Direct interviews
• Company profile • Fleet and service pro-
file • Cost structure • Professional opinions
and comments
• Survey: 1–30 Apr (completed)
• Survey: 12 May (completed)
Source: VITRANSS 2 Study Team.
(2) Road Transportation Surveys (Count and OD Interview)
3.7 In 1999, VITRANSS surveyed 39 traffic stations to develop a comprehensive na-tionwide road traffic database. In 2005, a follow-up study to VITRANSS was carried out, wherein traffic surveys were also conducted, covering 64 road traffic survey stations. Due to the fast growth of traffic and the impact of motorization, it became necessary to re-check the current road traffic demand; in 2008, VITRANSS 2 conducted traffic surveys on 54 stations. The orientations of the three surveys, however, somewhat differ in that the 1999 and 2005 surveys focused on getting the overall picture of the traffic situation in the country, rather than a full and accurate account of traffic at key corridors. Thus the survey

The Comprehensive Study on the Sustainable Development of Transport System in Vietnam (VITRANSS 2) MAINTEXT
3-3
stations were spread more or less evenly all over the country. On the other hand, the 2008 surveys aimed to refine the accounting of traffic at key cordon lines (i.e. around key cities) and the north–south axis of the country taking into account that one of the primary objectives of the study is to develop this corridor. Therefore, the 2008 survey concen-trated on selected stations within a narrow area vis-à-vis the 1999 and 2005 survey. Non-etheless, the results of past surveys were used to fill in the missing parts of the database.
Figure 3.1.1 Coverage of VITRANSS Road Traffic Surveys
Source: VITRANSS 2 Study Team.
3.8 The types of information gathered in all three surveys were more or less identical, and the primary information gathered included: (i) traffic volume; (ii) origin-destination (OD) patterns; (iii) loading characteristics; and (iv) vehicle characteristics. For the 2008 survey, in-formation was also derived from motorcycles, unlike in past surveys. In total, 20,895 ve-hicles were surveyed including 2,134 cars, 4,523 buses, 9,554 trucks, and 4,684 motor-cycles. The overall sampling rate was 3.6%, excluding motorcycles and bicycles.
1999 2005 2008
Stations 39 64 54
The Comprehensive Study on the Sustainable Development of Transport System in Vietnam (VITRANSS 2) MAINTEXT
3-4
Table 3.1.3 Format of Road OD Questionnaire
Section Type of Information Vehicle Characteristics • Vehicle type
• Vehicle size (GVW and NW) Trip Characteristics • Origin and Destination (dis-
trict/city/town) • Type of terminal at origin and des-
tination (i.e., port, airport, ICD, rail station, etc.)
Passenger load • No. of seats • Passenger load
Freight load • Type of loading (i.e., containe-rized, bulk, break bulk)
• Load factor • Commodity type
Source: VITRANSS 2 Study Team.
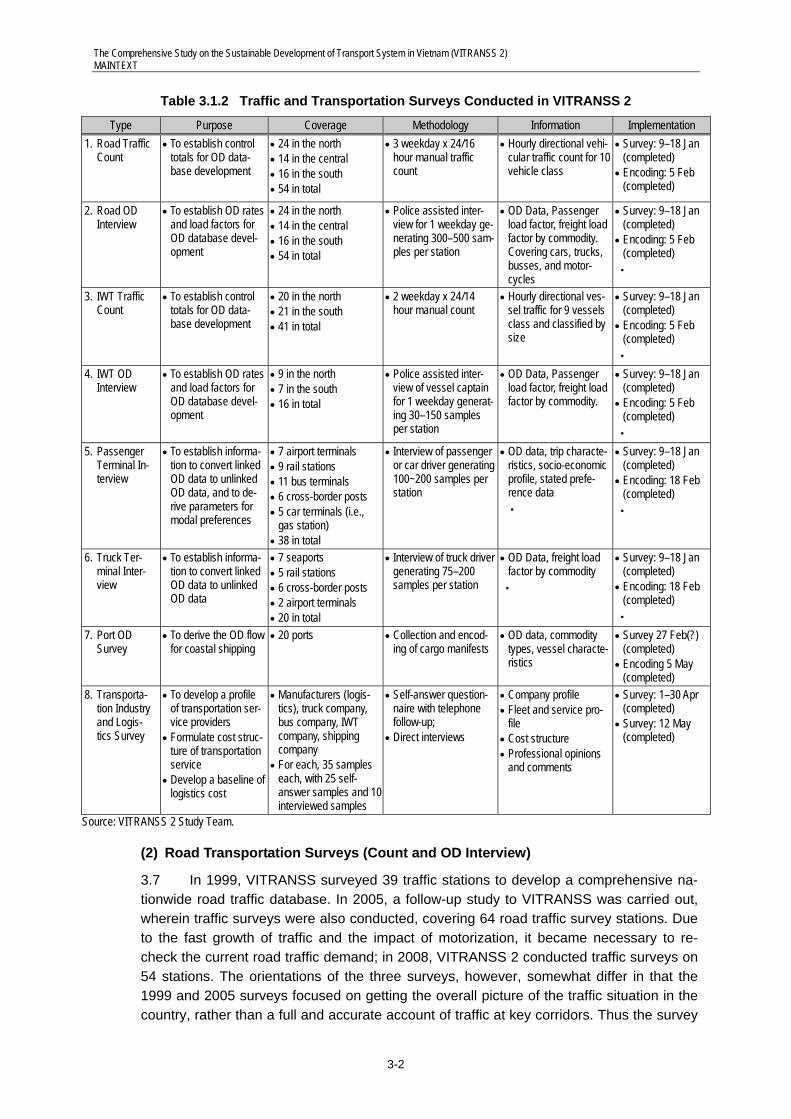
(3) Inland Waterway Transportation Surveys (Count and OD Interview)
3.9 Inland waterway traffic was surveyed during VITRANSS (1999, 40 stations) and the VITRANSS Follow-up Study (2005, 18 of the 1999 stations and one new station). To derive updated information on inland waterway traffic, the 1999 stations were resurveyed and an additional survey point on the cross-border point between Vietnam and Cambodia along Song Tien was included, bringing the number of stations to a total of 41.
3.10 Traffic count (2 days x 14/24 hours each) at each of the station and OD interview was conducted (1 day x 14 hours) at 16 stations including the cross-border station. With the assistance of the IWT police, OD interviews were conducted, wherein vessels were boarded and the captains interviewed. From the survey, vessel traffic volumes, OD pat-terns, load characteristics, and vessel characteristics could be determined. In total 1,268 vessels were surveyed.
Figure 3.1.2 IWT Survey Points
Source: VITRANSS 2 Study Team.

The Comprehensive Study on the Sustainable Development of Transport System in Vietnam (VITRANSS 2) MAINTEXT
3-5
Table 3.1.4 Format of IWT OD Questionnaire
Section Type of Information Vehicle Characteristics • Vessel type
• Vessel size and configuration Trip Characteristics • Origin and destination (district/city/town)
• Port of origin and destination Passenger load • No. of seats
• Passenger load Freight load • Type of loading (i.e., containerized, bulk, break
bulk) • Load factor • Commodity type
Source: VITRANSS 2 Study Team.
(4) Passenger Terminal Surveys
3.11 The passenger terminal surveys cover airports (domestic and international), rail-way stations, bus terminals, cross-border terminals, and car terminals (in this case, gaso-line stations). Stations were geographically spread all over the country, but with priority to major stations and those along the north–south coastal corridor. These are as follows:
(a) Airport Terminals (7): Noi Bai (international), Noi Bai (domestic), TSN (international), TSN (domestic), Danang, and Cam Ranh;
(b) Railway Terminals (9): Yen Vien, Gia Lam, Hanoi, Vinh (Nghe An), Hue, Danang, Nha Trang, Muong Man, and Saigon;
(c) Bus Terminals (11): Gia Lam (Hanoi), Giap Bat (Hanoi), My DInh (Hanoi), Hai Phong, East Terminal (HCMC), West Terminal (HCMC), Vinh (Nge Ah), Hue, Danang, Nha Trang, and Can Tho;
(d) Cross-border Terminals (6): Mong Cai (Quang Ninh–China), Dong Dang/Huu Nghi (Lang Son–China), Lao Cai (Lao Cai–China), Lao Bao (Quang Tri–Lao PDR), Moc Bai (Tay Ninh–Cambodia), Tinh Bien (An Giang–Cambodia); and
(e) Car Terminals (5): Hanoi, Hai Duong, Hai Phong, Danang, HCMC.
3.12 The purpose of the passenger interview, in the case of public transportation users, was to supplement the information derived from the bus OD interviews, airline route statis-tics, and railway route statistics. The information derived from these sources only gave the number of passengers that went from one terminal to another, so it was necessary to supplement them with data on the true origin and destination pattern, which could only be derived through passenger interviews. Furthermore, the interviews also provided key in-puts to understand the market of each of the modes by getting information on the profile of travelers, the most important of which is the income level, trip rate (number of trips tak-en per year), and access to private vehicles. Finally, the interview included a Modal Prefe-rence Survey where modal choices of travelers were probed (e.g., how they would react to a faster-mode alternative). In the case of private car users, a Modal Preference Survey was conducted to examine how potential tollway users would react to several toll levels.
3.13 In total, 6,159 passengers were interviewed, broken down into 1,454 air travelers, 2,982 bus travelers, and 1,723 railway travelers. Moreover, 513 motorists were inter-viewed.

The Comprehensive Study on the Sustainable Development of Transport System in Vietnam (VITRANSS 2) MAINTEXT
3-6
Table 3.1.5 Format of Passenger Interview Questionnaire
Section Type of Information Personal Information • Gender, age, address
• Income and employment status Travel Information • Origin and destination (district, city or town)
• Entry and exit terminal • Access to personal transportation (motorcycle, car)
Modal Preference/ Stated Preference
• Choice between different types of public transportation mode • Choice between private and public transportation • Choice between a tollway and ordinary road (for car terminal survey)
Source: VITRANSS 2 Study Team.
(5) Truck Terminal Surveys
3.14 The truck terminal survey covered seaports (7), railway stations (5), air freight sta-tions (2), and cross-border stations (6). The stations were geographically dispersed all over the country with emphasis on the major terminals of each mode and those along the north–south corridor. The stations are as follows:
(a) Seaports (7): Hai Phong, Cai Lan, Saigon, Vung Tau, Cua Lo, Danang, and Quy Nhon;
(b) Railway Stations (5): Viet Tri (Phu Tho), Yen Vien (Hanoi), Giap Bat (Hanoi), Da-nang, and Song Thanh;
(c) Airports (2): Noi Bai and Tan Son Nhat; and
(d) Cross-border Terminals (6): Mong Cai (Quang Ninh–China), Dong Dang/Huu Nghi (Lang Son–China), Lao Cai (Lao Cai–China), Lao Bao (Quang Tri–Lao PDR), Moc Bai (Tay Ninh–Cambodia), and Tinh Bien (An Giang–Cambodia).
3.15 The purpose of the survey was primarily to supplement the statistics on coastal shipping, railway, and air traffic by providing information on how cargo moved to and from the terminals, similar to the passenger terminal survey. The format of the OD interview is similar to the Road OD interview’s. In total 1,303 trucks were surveyed, of which 132 were from airport terminals, 854 were from seaports, and 317 were from railway terminals.
2) VITRANSS 2 Transportation Database
(1) Background
3.16 Without adequate databases and analytical tools to handle large amounts of dif-ferent data, transportation planning cannot be done scientifically and efficiently. One of the major objectives of VITRANSS 2 thus was to update the database created in 2000 by VITRANSS.
3.17 So that the VITRANSS 2 database can be effectively utilized by various agencies and planning bodies and be properly managed over the years, the following have to be duly considered:
(i) Items and coverage of data should meet the needs of relevant agencies or actual planning, and
(ii) The computerized database should have a simple and clear structure to ensure easy data search and retrieval.

The Comprehensive Study on the Sustainable Development of Transport System in Vietnam (VITRANSS 2) MAINTEXT
3-7
(2) Types of and Categories of Data
(a) Data Types: The VITRANSS 2 database contains the major results of the field sur-veys and interview surveys conducted in the early stage of VITRANSS 2, as well as related data obtained from secondary sources and those provided by related agencies.
(b) Data Categories: Data were categorized based on the extent of the processing done on them. The first category comprises unprocessed or less processed data such as traffic count. These raw data will be useful for researchers or planners who have other aspects to analyze. The second category comprises processed data, such as OD ma-trices and a computerized transportation network for simulation work. The last one is a group of forecast data, which includes future demographic data, future OD matrices and future networks and projects proposed in the VITRANSS2. The data in this cate-gory will need a careful treatment when they are opened to the public because every forecast is made inevitably based on several assumptions or preconditions. Therefore, open use of the forecast data will need further examination in order to avoid misun-derstanding and misuse.
3.18 Data classification is shown in Table 3.1.6.
Table 3.1.6 VITRANSS 2 Database Classified by Extent of Data Processing
Category Primary Data (Original Data)
Secondary Data (Processed Data)
Tertiary Data (Forecast Data)
Socio-economic Data • Population and GDP • Employment/industrial Output
• Future Population and GDP data
Traffic and Transportation Demand Data
• Traffic Count Data (Road/River) • OD Interview • Traffic Volume Data provided from
related agencies.
• Present OD Matrix • Future OD Matrix
Transportation Network Data • Road Inventory Data • Route Data (Road, River, Rail,
Coastal Shipping and Air)
• Present Network Data
• Future Network Data
Other Transportation Related Data • Transportation Terminal Survey Data
Source: VITRANSS 2 Study Team
(3) VITRANSS 2 Database
3.19 The VITRANSS 2 databases consist of socio-economic database, traffic and transportation demand database, transportation network database and other transporta-tion-related database.
(a) Socio-economic Database: The socio-economic database includes socio-economic indicators such as population, urban population, population density, GDP, GDP per capita, employment, and foreign direct investment (FDI). Future socio-economic data forecasted under the precondition or assumption of VITRANSS 2 was also compiled by zone (province).
(b) Traffic and Transportation Demand Database: The traffic and transportation de-mand database is composed of road traffic survey data, river traffic survey data, and OD matrices. Most of the data are the results of field surveys conducted in the first stage of VITRANSS 2. OD matrices are the data processed from the field survey data and data provided by related agencies. To come up with present and future OD ma-trices by mode (and by cargo type for freight), the data were compiled using the

The Comprehensive Study on the Sustainable Development of Transport System in Vietnam (VITRANSS 2) MAINTEXT
3-8
STRADA format.
(c) Transportation Network Database: The transportation network data for assignment to the network is the key to the database. Compiled in the STRADA format, the VI-TRANSS 2 transportation network database includes numerous files and different as-sumptions, as follows:
(i) Present (2008) network
• Road (with and without expressway)
• Railway
• Inland Waterway
• Coastal shipping
• Air
• Various combinations of the above
(ii) Future network (2020 and 2030)
• Road (with and without expressway, and with and without project)
• Railway (with and without High-Speed Railway and with and without project)
• Inland Waterway (with and without project)
• Coastal shipping (with and without project)
• Air (with and without project)
• Various combinations of the above
(d) Other Transportation-related Database: Other transportation-related databases consist of various kinds of interview data such as the results of the passenger/truck driver interview survey, which investigated the movement of passengers and cargoes at passenger/cargo terminals.
The Comprehensive Study on the Sustainable Development of Transport System in Vietnam (VITRANSS 2) MAINTEXT
3-9
Passenger
9% 16%30%
16% 4% 8% 15%
86%66%
34%
87% 82% 66%
4% 4% 3% 6% 5%7%
3% 5% 11%
47%
79%2%
1% 1% 2%
1%
0%10%20%30%40%50%60%70%80%90%
100%
1999 2005 2008 2008 (withMC)*
1999 2005 2008
Pax Pax-Km
Car Bus Rail Air MC
3.2 Overall Transportation Demand
1) Background
3.20 Table 3.2.1 shows an overview of the transportation demand in the country. Based on the figures, freight traffic grew at such a significant rate; growth in passenger traffic is likewise appreciable. The results from the 2008 surveys appear to indicate that such trend is continuing; if it continues, Vietnam’s transportation infrastructure would be overwhelmed quickly.
Table 3.2.1 Overall Interprovincial Traffic Demand in Vietnam
1999 2005 2008 Growth (%/yr)
’99�‘05 ’05�‘08 ’99� ‘08
Passenger No./day (000) 595 846 985 (18751)
6.0 5.2 5.8 Pax-km/day (mill.) 113 1502 161 (2071)
Freight Tons/day (000) 241 1,052 1,332
27.8 8.2 20.9 Ton-km/day (mill.) 72 2232) 237
Source: VITRANSS (1999), VITRANSS Follow-up Study (2005), and VITRANSS 2 Study Team. 1 The traffic demand for motorcycle is included. (For others, motorcycle is not included; in other words, car, bus, rail, and air traffic de-
mand only). 2 A linear relation of trip lengths between 1999 and 2008 was assumed for 2005.
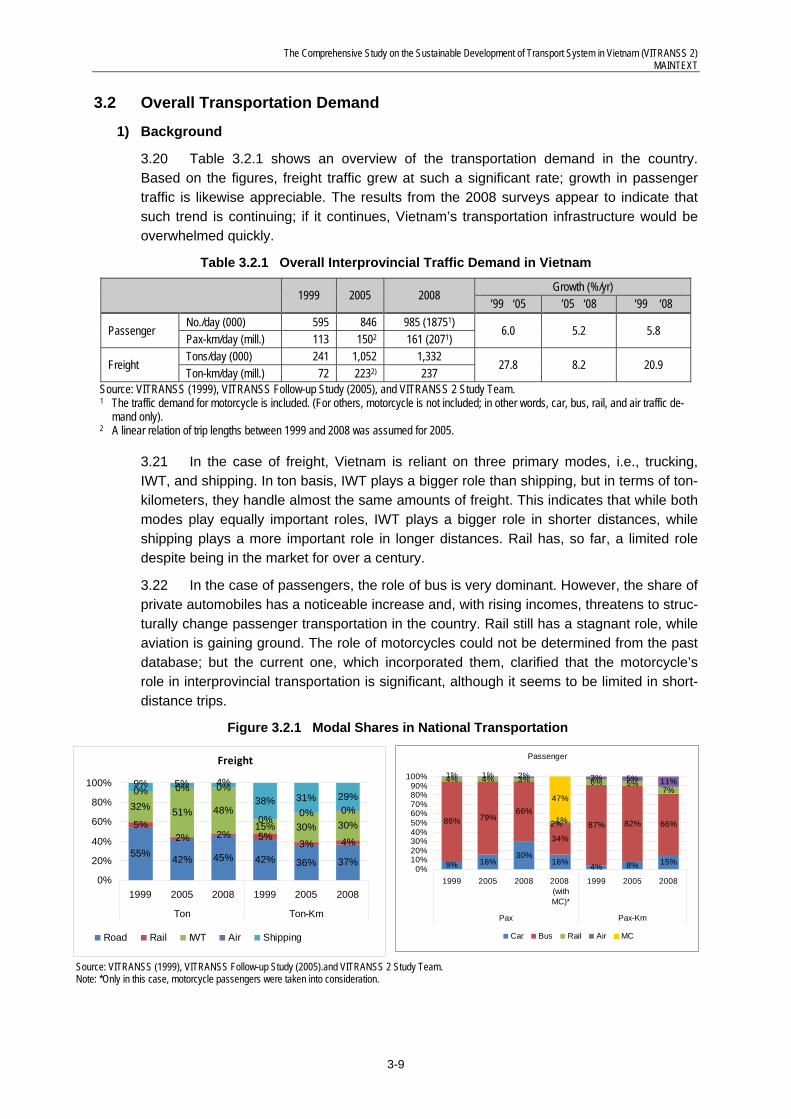
3.21 In the case of freight, Vietnam is reliant on three primary modes, i.e., trucking, IWT, and shipping. In ton basis, IWT plays a bigger role than shipping, but in terms of ton-kilometers, they handle almost the same amounts of freight. This indicates that while both modes play equally important roles, IWT plays a bigger role in shorter distances, while shipping plays a more important role in longer distances. Rail has, so far, a limited role despite being in the market for over a century.
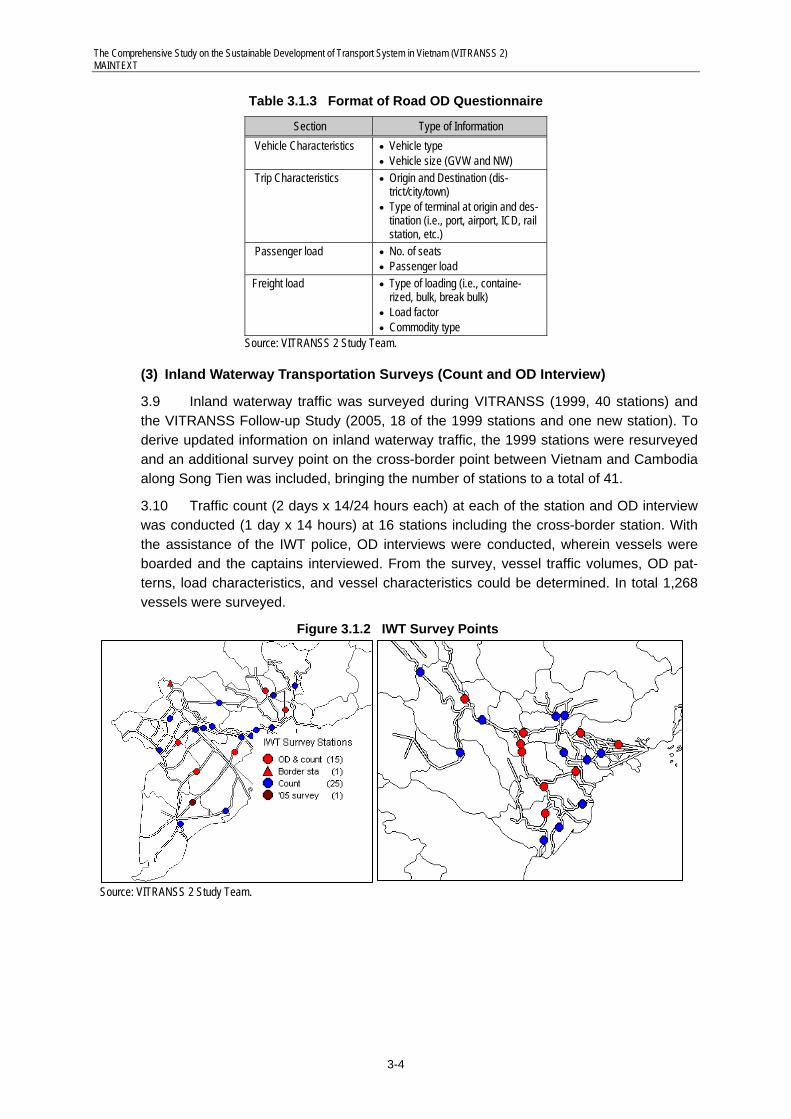
3.22 In the case of passengers, the role of bus is very dominant. However, the share of private automobiles has a noticeable increase and, with rising incomes, threatens to struc-turally change passenger transportation in the country. Rail still has a stagnant role, while aviation is gaining ground. The role of motorcycles could not be determined from the past database; but the current one, which incorporated them, clarified that the motorcycle’s role in interprovincial transportation is significant, although it seems to be limited in short-distance trips.
Figure 3.2.1 Modal Shares in National Transportation
Source: VITRANSS (1999), VITRANSS Follow-up Study (2005).and VITRANSS 2 Study Team. Note: *Only in this case, motorcycle passengers were taken into consideration.
Freight
55% 42% 45% 42% 36% 37%
5%2% 2% 5%
3% 4%
32% 51% 48%15% 30% 30%
0% 0% 0%
0%0% 0%
38% 31% 29%9% 4%5%
0%
20%
40%
60%
80%
100%
1999 2005 2008 1999 2005 2008
Ton Ton-Km
Road Rail IWT Air Shipping

The Comprehensive Study on the Sustainable Development of Transport System in Vietnam (VITRANSS 2) MAINTEXT
3-10
NW
NCC
RRD
SE
MRD
SCC
CH
NE
NW
NCC
RRD
SE
MRD
SCC
CH
NE
2) Passenger Transportation
3.23 Figure 3.2.2 illustrates the volume of interprovincial generation and attraction of passengers in 2008. The Red River Delta, Southeast, and Mekong River Delta are the primary regions for passenger generation and attraction. Especially, external passenger travel from/to the Red River Delta is huge. While the northern and southern areas have major passenger terminals, the central areas, including the North Central and, South Cen-tral Coastal regions, and the Central Highlands, do not have any big passenger terminal. Although the South Central Coastal region has relatively bigger volumes of generated and attracted passengers than the other two regions, it is much smaller than the three-mega terminal regions mentioned above.
Figure 3.2.2 Generated and Attracted Interprovincial Passenger Traffic Volume1, 2008 (Unit: pax/day)
Source: VITRANSS 2 Study Team. 1 Including car, bus, rail, air, and motorcycle.
3.24 Figure 3.2.3 illustrates the distribution pattern of passengers in 2008. The key re-gions of Hanoi and Ho Chi Minh City (HCMC) remained to be strong traffic genera-tors/attractors. While these regions had heavy passenger traffic demand connecting to re-gions around them, the strong connection between the northern regions (Red River Delta, Northeast, and Northwest) and Southeast was also remarkable. For instance, the pas-senger flow from the northern regions to the Southeast region was bigger than that toward the South Central Coastal region despite the latter’s relative proximity to the north. While the scale of the Southeast region would have something to do with it, the level of transpor-tation services also played a significant role. The same can be said of the Mekong River Delta region, which focused its interaction with the Southeast region, resulting in very neg-
Region Trip Generation and Attraction
RRD 1,421,446 NE 230,831 NW 41,309 NCC 144,448 SCC 166,377 CH 20,660 SE 963,893
MRD 761,462

The Comprehensive Study on the Sustainable Development of Transport System in Vietnam (VITRANSS 2) MAINTEXT
3-11
ligible traffic with other regions. Passenger traffic movement to/from the border regions was also active. In the Southeast region, traffic demand to the border with Cambodia was relatively high, while in the north, Red River Delta had a large passenger demand to/from the Northeast at the Chinese border.
Figure 3.2.3 Distribution of Passenger Traffic1, 2008 (Unit: pax/day)
Source: VITRANSS 2 Study Team. 1 Including car, bus, rail, air, and motorcycle.
Table 3.2.2 Distribution of Intraregional Passenger Traffic, 2008 (Pax/day)
RRD NE NW NCC SCC CH SE MRD RRD - 200,536 36,439 27,613 4,560 2,896 21,138 2,816 NE - 3,169 3,516 308 1,182 3,231 305 NW - 735 176 185 369 - NCC - 16,183 1,965 9,950 420 SCC - 5,969 26,005 1,816 CH - 4,485 934 SE - 127,417 MRD -
Source: VITRANSS 2 Study Team. 1 Including car, bus, rail, air and motorcycle.
3.25 Table 3.2.3 shows the trip generation situation for each province for 2008. In Ha-noi and HCMC, passenger trip generations were most significant; each accounted for more than 150,000 generated passengers. Hai Phong was a far third, generating only about 37,000 trips. While bus was the most dominant mode of transportation in almost all provinces, there were some provinces that had different characteristics of modal share. For example, in Lao Cai, which is located along the northwest border with China and is the terminal of the Hanoi–Lao Cai railway line, almost 90% of departing passengers used
NW3,169
36,439
200,
536
NE
RRD
Intra-Northern Region
9,950
127,417
31,864
16,18326,005
NCC
3,121
420
5,044
1,81
6
24,738
SE
MRD
SCC
CH
5,969
1,96
5
4,485
9344,263
RRD,NE&NW

The Comprehensive Study on the Sustainable Development of Transport System in Vietnam (VITRANSS 2) MAINTEXT
3-12
railway. Air transportation was still a minor alternative for interprovincial trips. Trips by air transportation were mostly generated in Hanoi and Ho Chi Minh, which accounted for al-most 70% of air passengers.
Table 3.2.3 Daily Trip Generation by Province, 2008
Province 2008 Generation Composition (%)
Car Bus Rail Air Total Car Bus Rail Air 1. Hanoi 51,016 89,721 8,342 5,029 154,108 33.1 58.2 5.4 3.3 2. Vinh Phuc 4,076 4,241 451 0 8,768 46.5 48.4 5.1 0.0 3. Bac Ninh 15,112 14,780 172 0 30,064 50.3 49.2 0.6 0.0 4. Ha Tay 18,492 43,032 37 0 61,561 30.0 69.9 0.1 0.0 5. Hai Duong 5,035 9,232 1,042 0 15,309 32.9 60.3 6.8 0.0 6. Hai Phong 13,668 22,277 1,041 282 37,268 36.7 59.8 2.8 0.8 7. Hung Yen 9,958 7,557 37 0 17,552 56.7 43.1 0.2 0.0 8. Thai Binh 3,374 4,187 0 0 7,561 44.6 55.4 0.0 0.0 9. Ha Nam 2,879 9,584 98 0 12,561 22.9 76.3 0.8 0.0 10. Nam Dinh 1,027 8,096 455 0 9,578 10.7 84.5 4.8 0.0 11. Ninh Binh 1,414 1,475 122 0 3,011 47.0 49.0 4.1 0.0 12. Ha Giang 216 346 0 0 562 38.4 61.6 0.0 0.0 13. Cao Bang 64 437 0 0 501 12.8 87.2 0.0 0.0 14. Bac Kan 636 422 0 0 1,058 60.1 39.9 0.0 0.0 15. Tuyen Quang 196 1,547 0 0 1,743 11.2 88.8 0.0 0.0 16. Lao Cai 41 260 2,532 0 2,833 1.4 9.2 89.4 0.0 17. Yen Bai 497 1,511 1,262 0 3,270 15.2 46.2 38.6 0.0 18. Thai Nguyen 2,281 4,520 298 0 7,099 32.1 63.7 4.2 0.0 19. Lang Son 1,094 4,910 318 0 6,322 17.3 77.7 5.0 0.0 20. Quang Ninh 3,374 14,087 151 0 17,612 19.2 80.0 0.9 0.0 21. Bac Giang 9,003 14,700 404 0 24,107 37.3 61.0 1.7 0.0 22. Phu Tho 1,333 2,691 1,301 0 5,325 25.0 50.5 24.4 0.0 23. Dien Bien 201 405 0 96 702 28.6 57.7 0.0 13.7 24. Lai Chau 289 26 0 0 315 91.7 8.3 0.0 0.0 25. Son La 679 1,314 0 0 1,993 34.1 65.9 0.0 0.0 26. Hoa Binh 1,621 6,663 0 0 8,284 19.6 80.4 0.0 0.0 27. Thanh Hoa 2,777 4,055 593 0 7,425 37.4 54.6 8.0 0.0 28. Nghe An 2,333 8,741 1,508 139 12,721 18.3 68.7 11.9 1.1 29. Ha Tinh 1,352 5,261 316 0 6,929 19.5 75.9 4.6 0.0 30. Quang Binh 926 1,030 725 0 2,681 34.5 38.4 27.0 0.0 31. Quang Tri 635 1,574 481 0 2,690 23.6 58.5 17.9 0.0 32. Thua Thien - Hue 1,329 5,091 1,327 778 8,525 15.6 59.7 15.6 9.1 33. Danang 2,344 8,906 1,131 1,942 14,323 16.4 62.2 7.9 13.6 34. Quang Nam 1,775 5,867 164 20 7,826 22.7 75.0 2.1 0.3 35. Quang Ngai 438 2,038 369 0 2,845 15.4 71.6 13.0 0.0 36. Binh Dinh 830 2,425 471 115 3,841 21.6 63.1 12.3 3.0 37. Phu Yen 416 1,565 344 21 2,346 17.7 66.7 14.7 0.9 38. Khanh Hoa 1,059 6,125 1,343 761 9,288 11.4 65.9 14.5 8.2 39. Kon Tum 663 2,249 0 0 2,912 22.8 77.2 0.0 0.0 40. Gia Lai 669 2,146 0 125 2,940 22.8 73.0 0.0 4.3 41. Dak Lak 310 2,877 0 219 3,406 9.1 84.5 0.0 6.4 42. Dak Nong 93 630 0 0 723 12.9 87.1 0.0 0.0 43. Lam Dong 6,014 8,759 0 178 14,951 40.2 58.6 0.0 1.2 44. Ninh Thuan 432 1,762 193 0 2,387 18.1 73.8 8.1 0.0 45. Binh Thuan 930 10,564 233 0 11,727 7.9 90.1 2.0 0.0 46. Binh Phuoc 812 3,551 0 0 4,363 18.6 81.4 0.0 0.0

The Comprehensive Study on the Sustainable Development of Transport System in Vietnam (VITRANSS 2) MAINTEXT
3-13
0%10%
20%30%
40%50%
60%70%
80%90%
100%
-100 100-200
200-300
300-400
400-500
500-600
600-700
700-800
800-900
900-1000
1000-1200
1200-1400
1400-1600
1600-1800
1800-2000
Share (%)
MC
Air
Rail
Bus
Car
MC
Air
Rail
Bus
Car
Province 2008 Generation Composition (%)
Car Bus Rail Air Total Car Bus Rail Air 47. Tay Ninh 10,561 24,824 0 0 35,385 29.8 70.2 0.0 0.0 48. Binh Duong 8,561 6,198 0 0 14,759 58.0 42.0 0.0 0.0 49. Dong Nai 22,600 33,211 165 0 55,976 40.4 59.3 0.3 0.0 50. Ba Ria�Vung
Tau 8,875 31,648 0 44 40,567 21.9 78.0 0.0 0.1 51. Ho Chi Minh 43,821 96,252 3,465 6,927 150,465 29.1 64.0 2.3 4.6 52. Long An 5,946 9,093 0 0 15,039 39.5 60.5 0.0 0.0 53. Tien Giang 3,001 8,306 0 0 11,307 26.5 73.5 0.0 0.0 54. Ben Tre 476 3,834 0 0 4,310 11.0 89.0 0.0 0.0 55. Tra Vinh 687 2,638 0 0 3,325 20.7 79.3 0.0 0.0 56. Vinh Long 352 2,826 0 0 3,178 11.1 88.9 0.0 0.0 57. Dong Thap 694 3,998 0 0 4,692 14.8 85.2 0.0 0.0 58. An Giang 1,533 11,793 0 0 13,326 11.5 88.5 0.0 0.0 59. Kien Giang 549 5,729 0 365 6,643 8.3 86.2 0.0 5.5 60. Can Tho 4,590 22,114 0 0 26,704 17.2 82.8 0.0 0.0 61. Hau Giang 3,523 11,235 0 0 14,758 23.9 76.1 0.0 0.0 62. Soc Trang 829 4,299 0 0 5,128 16.2 83.8 0.0 0.0 63. Bac Lieu 704 4,453 0 0 5,157 13.7 86.3 0.0 0.0 64. Ca Mau 480 9,444 0 62 9,986 4.8 94.6 0.0 0.6
Total 291,495 645,132 30,891 17,103 984,621 29.6 65.5 3.1 1.7 Source: VITRANSS 2 Study Team.
3.26 Figure 3.2.4 and Table 3.2.4 show the modal share in 2008 by trip length. Five types of mode (car, bus, rail, air, and motorcycle) were considered here. For the shortest trips (e.g., less than 100km), motorcycle was the dominant transportation mode, while for longer trips, bus was the most popular mode. The share of motorcycle decreased sharply for longer trip lengths. For trips involving around 500km, rail had the highest share (26.1%). As trip lengths became longer, shares decreased slowly. For trips involving around 900km, air transportation accounted for the highest share (47.1%).
Figure 3.2.4 Modal Share by Trip Length, 2008
Trip Length (km) Source: VITRANSS 2 Study Team.

The Comprehensive Study on the Sustainable Development of Transport System in Vietnam (VITRANSS 2) MAINTEXT
3-14
0
100,000
200,000
300,000
400,000
500,000
600,000
700,000
800,000
900,000
-100 100-200
200-300
300-400
400-500
500-600
600-700
700-800
800-900
900-1000
1000-1200
1200-1400
1400-1600
1600-1800
1800-2000
Trip Length (km)
No. of Pax
CarBusRailAirMC
Table 3.2.4 Modal Share of Passenger Traffic by Trip Length, 2008
Trip Length (km) Car (%) Bus (%) Rail (%) Air (%) MC (%)
-100 16.3 27.0 0.7 0.0 56.0 100�200 12.6 58.9 2.0 0.0 26.5 200�300 23.1 56.2 9.3 1.4 9.9 300�400 9.8 82.4 2.0 2.0 3.8 400�500 12.4 43.0 26.1 12.4 6.2 500�600 12.2 72.8 9.1 3.3 2.6 600�700 10.2 46.4 20.3 21.2 2.0 700�800 9.7 46.4 18.7 24.6 0.6 800�900 1.9 33.7 16.6 47.1 0.7 900-�000 12.5 74.4 11.0 0.5 1.6
1000�1200 5.0 75.1 9.3 10.6 0.0 1200�1400 6.0 79.7 8.9 5.4 0.0 1400�1600 1.7 55.8 9.7 32.8 0.0 1600�1800 1.8 94.6 0.0 3.7 0.0 1800�2000 0.0 100.0 0.0 0.0 0.0
Total 15.5 34.4 1.6 0.9 47.5 Source: VITRANSS 2 Study Team.
3.27 Figure 3.2.5 and Table 3.2.5 show the number of passengers in 2008 by trip length. More than 90% of the total volume of passengers made trips involving 200km or less. For the shortest trips (e.g., less than 100km), motorcycle played a significant role; more than 800,000 passengers used it. For trips that cover 1400─1600km, there were about 23,000 passengers. In this range, bus and air transportation were dominant with about 13,000 and 8,000, respectively.
Figure 3.2.5 Number of Passengers by Trip Length, 2008
Source: VITRANSS 2 Study Team.

The Comprehensive Study on the Sustainable Development of Transport System in Vietnam (VITRANSS 2) MAINTEXT
3-15
Table 3.2.5 Number of Passengers by Trip Length, 2008
Trip Length (km) Car Bus Rail Air MC Total
-100 237,465 394,002 9,756 0 816,151 1,457,374 100�200 31,450 146,759 4,901 78 65,903 249,091 200-�300 15,409 37,444 6,196 964 6,600 66,613 300�400 2,864 24,188 598 591 1,101 29,342 400�500 990 3,437 2,086 989 500 8,002 500�600 632 3,756 470 169 133 5,160 600�700 436 1,980 865 904 84 4,269 700�800 545 2,621 1,056 1,390 31 5,643 800�900 134 2,333 1,146 3,253 47 6,913 900�1000 334 1,984 293 13 42 2,666 1000�1200 319 4,818 597 682 0 6,416 1200�1400 471 6,291 705 429 0 7,896 1400�1600 396 12,814 2,222 7,536 0 22,968 1600�1800 50 2,695 0 105 0 2,850 1800�2000 0 10 0 0 0 10
Total 291,495 645,132 30,891 17,103 890,592 1,875,213 Source: VITRANSS 2 Study Team.
3.28 Table 3.2.6 shows the interprovincial passenger movements in 2008. In almost all cases, the origins and destinations were close to each other, at less than 100km. Among all origin–destination pairs, the Hanoi–Ho Chi Minh pair is unique; it had a long distance and the degrees of dependence on air and railway transportation were high, i.e., 6,960 passengers (69%) and 1,525 passengers (15%), respectively. As mentioned above, in short trips, the volume of motorcycle passengers could not be disregarded. In the case of the Hanoi�Ha Tay pair, the number of motorcycle passengers was more than twice that for all other modes.
Table 3.2.6 Interprovincial Passenger Movements1), 2008
Rank From To km Car Bus Rail Air Total (Excl. MC) MC
1 Hanoi Ha Tay 13 22,985 55,537 3 0 78,525 162,058 2 Dong Nai Ho Chi Minh 23 27,227 45,467 37 0 72,731 20,307 3 Tay Ninh Ho Chi Minh 98 20,422 44,900 0 0 65,322 44,918 4 Ba Ria - Vung Tau Ho Chi Minh 112 7,540 37,522 0 78 45,140 11,911 5 Hanoi Hai Phong 98 16,625 21,751 1,736 0 40,112 776 6 Hanoi Bac Ninh 30 15,937 22,966 64 0 38,967 19,424 7 Hanoi Bac Giang 54 8,104 19,921 331 0 28,356 9,854 8 Can Tho Hau Giang 38 6,507 18,128 0 0 24,635 61,050 9 Hanoi Hung Yen 49 14,410 6,787 52 0 21,249 59,563
10 Dong Nai Ba Ria - Vung Tau 89 9,078 10,968 0 0 20,046 1,814 11 Ho Chi Minh Long An 33 8,014 11,685 0 0 19,699 40,212 12 Lam Dong Ho Chi Minh 260 11,160 7,340 0 205 18,705 91 13 Hanoi Vinh Phuc 47 7,263 6,415 295 0 13,973 11,534 14 Ha Tay Ha Nam 69 3,350 9,513 2 0 12,865 8,721 15 Binh Duong Ho Chi Minh 28 7,965 4,359 0 0 12,324 26,858 16 Ha Tay Hoa Binh 28 2,599 8,254 0 0 10,853 17,284 17 Danang Quang Nam 65 2,792 7,657 18 0 10,467 26,562 18 Hanoi Ho Chi Minh 1,508 36 1,606 1,537 6,960 10,139 0 19 Hanoi Hai Duong 68 3,304 4,828 1,525 0 9,657 893 20 An Giang Can Tho 57 1,687 7,932 0 0 9,619 63,773
Source: VITRANSS 2 Study Team. 1 Two-way movement, top 20 OD pairs, passengers/day.

The Comprehensive Study on the Sustainable Development of Transport System in Vietnam (VITRANSS 2) MAINTEXT
3-16
3) Freight Traffic Demand
3.29 Figure 3.2.6 shows the generated and attracted interprovincial freight traffic vo-lumes in 2008. Similar to passenger traffic, the Red River Delta, Southeast, and Mekong River Delta had huge traffic volumes, especially Red River Delta. The Northeast also played a key role in freight, not in passenger, traffic. One of the major reasons for this is the developed network of inland waterways in the region as well as the existence of key ports along the coastal line.
Figure 3.2.6 Generated and Attracted Interprovincial Freight Traffic Volumes, 2008 (Unit: ton/day)
Source: VITRANSS 2 Study Team.
3.30 A similar trend can be observed in freight traffic distribution. The northern and southern regions were the focal points of demand and trade. Meanwhile, the central re-gion was connected more to its southern neighbor and had a smaller logistics flow to the north. The Mekong River Delta region likewise concentrated its goods trade with the Southeast. Again, while the scale of the economy is a contributory factor, the role of transportation was to be emphasized as well.
Region Trip Generation and Attraction
RRD 1,003,208 NE 410,420 NW 20,711 NCC 71,636 SCC 68,878 CH 7,357 SE 641,636
MRD 439,612
NCC
SE
MRD
SCC
NE
RRD
CH
NW

The Comprehensive Study on the Sustainable Development of Transport System in Vietnam (VITRANSS 2) MAINTEXT
3-17
Table 3.2.7 Distribution of Intraregional Freight Traffic, 2008 (Ton/day)
RRD NE NW NCC SCC CH SE MRD RRD 312,060 18,295 24,464 10,717 1,482 26,116 3,706 NE 2,392 10,942 3,564 367 7,676 6,229 NW 6 0 0 18 0 NCC 8,020 43 6,929 1,172 SCC 2,976 18,235 892 CH 1,803 686 SE 213,363 MRD
Source: VITRANSS 2 Study Team.
Figure 3.2.7 Distribution of Freight Traffic, 2008 (Ton/day)
Source: VITRANSS 2 Study Team.
3.31 Table 3.2.8 shows the 2008 modal shares of interprovincial freight transportation by commodity. The heaviest of the 13 commodities was construction materials, followed by manufacturing goods, which was a far second, then rice. Trucks had a big responsibili-ty of carrying these three commodities. In fact, almost half of the total freight volume in terms of ton and ton-km depended on them. Inland waterways also handled large freight volumes, although these were mainly construction materials and the average trip lengths were short. Coastal shipping had an advantage for long-distance trips; cement, coal, and manufacturing goods depended on it. Rail and air had a very limited role in the present setup.
6,929
213,363
35,142
8,02018,235
NCC
12,005
1,17
2
14,281
892
33,810
SE
MRD
SCC
CH
2,976
43
1,803
6861,849
RRD,NE&NW
NW2,392
18,295
311,
060
NE
RRD
Intra-Northern Region

The Comprehensive Study on the Sustainable Development of Transport System in Vietnam (VITRANSS 2) MAINTEXT
3-18
0%
10%
20%
30%
40%
50%
60%
70%
80%
90%
100%
-100 100-
200
200-
300
300-
400
400-
500
500-
600
600-
700
700-
800
800-
900
900-
1000
1000-
1200
1200-
1400
1400-
1600
1600-
1800
1800-
2000
Trip Length (km)
Share (%)
Air
Coastal
IWT
Rail
Road
Table 3.2.8 Modal Shares by Commodity, 2008
Commodity Road Rail Inland Coastal Air Total 1. Rice 78,969 204 36,109 4,261 0 119,543 2. Sugarcane/Sugar 3,682 0 4,847 88 0 8,617 3. Wood 11,499 523 11,683 914 0 24,619 4. Steel 41,965 2,156 1,015 764 0 45,900 5. Construction Materials 129,219 8,213 370,787 1,914 0 510,133 6. Cement 38,965 3,810 64,387 13,021 0 120,183 7. Fertilizer 8,813 2,939 28,678 1,168 0 41,598 8. Coal 12,106 2,377 92,549 10,092 0 117,124 9. Petroleum 33,374 404 5,018 8,234 0 47,030 10. Industrial Crops 5,628 0 2,415 0 0 8,043 11. Manufacturing Goods 171,895 4,895 3,916 13,524 251 194,481 12. Fishery Products 7,186 0 12,203 0 0 19,389 13. Animal Meat & Others 61,578 0 9,373 4,118 0 75,069
Total tonnage (ton/day) 604,879 25,521 642,980 58,098 251 1,331,729 Modal Share (%, ton) 45.4 1.9 48.3 4.4 0.0 100.0
Average Trip Length (km) 143 400 112 1,161 1,404 178 Modal Share (%, ton-km) 36.6 4.3 30.5 28.5 0.1 100.0
Source: VITRANSS 2 Study Team.
3.32 Figure 3.2.8 and Table 3.2.9 show the modal shares of freight in 2008 by trip length. Of the five modes used by freight traffic, truck use dominates regardless of trip length. The major traffic modes for short distances were trucks and IWT. For less than 100km, trucks were used most often, while for 100 to 200km trips, IWT carried more than truck. However, inland waterways were only applicable in distances of less than 200km. Coastal shipping worked for distances of more than 400km, at which range its share is comparable with that of truck.
Figure 3.2.8 Modal Shares of Freight Traffic by Trip Length, 2008
Source: VITRANSS 2 Study Team.
The Comprehensive Study on the Sustainable Development of Transport System in Vietnam (VITRANSS 2) MAINTEXT
3-19
0
100,000
200,000
300,000
400,000
500,000
-100 100-200
200-300
300-400
400-500
500-600
600-700
700-800
800-900
900-1000
1000-1200
1200-1400
1400-1600
1600-1800
1800-2000
Trip Length (km)
Ton/day
Road
Rail
IWT
Coastal
Air
Table 3.2.9 Modal Share of Freight Traffic by Trip Length, 2008
Trip Length (km)
Road (%)
Rail (%)
Inland Wa-terway (%)
Coastal Shipping (%)
Air (%)
-100 61.9 0.4 37.6 0.0 0.0 100�200 17.2 1.6 81.0 0.1 0.0 200�300 68.9 9.8 16.6 4.7 0.0 300�400 63.9 25.3 6.4 4.5 0.0 400�500 32.7 12.9 0.0 54.4 0.0 500�600 58.3 10.5 0.0 31.2 0.0 600�700 50.8 5.8 0.0 43.4 0.0 700�800 32.7 6.0 0.0 61.2 0.2 800�900 60.2 5.4 0.0 34.1 0.2 900�1000 87.2 7.1 0.0 5.7 0.0 1000�1200 40.8 9.5 0.0 49.7 0.0 1200�1400 18.2 3.8 0.0 78.1 0.0 1400�1600 21.9 6.3 0.0 71.2 0.6 1600�1800 60.3 0.7 0.0 39.1 0.0 1800�2000 100.0 0.0 0.0 0.0 0.0
Total 45.4 1.9 48.3 4.4 0.0 Source: VITRANSS 2 Study Team.
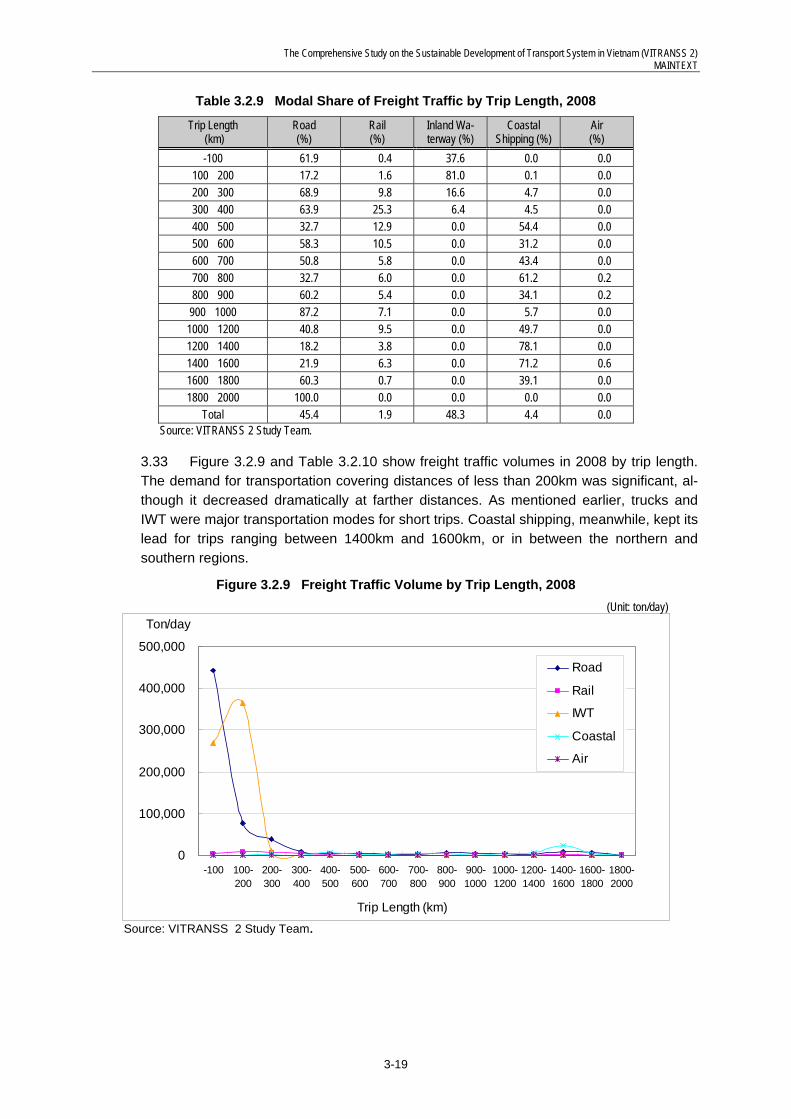
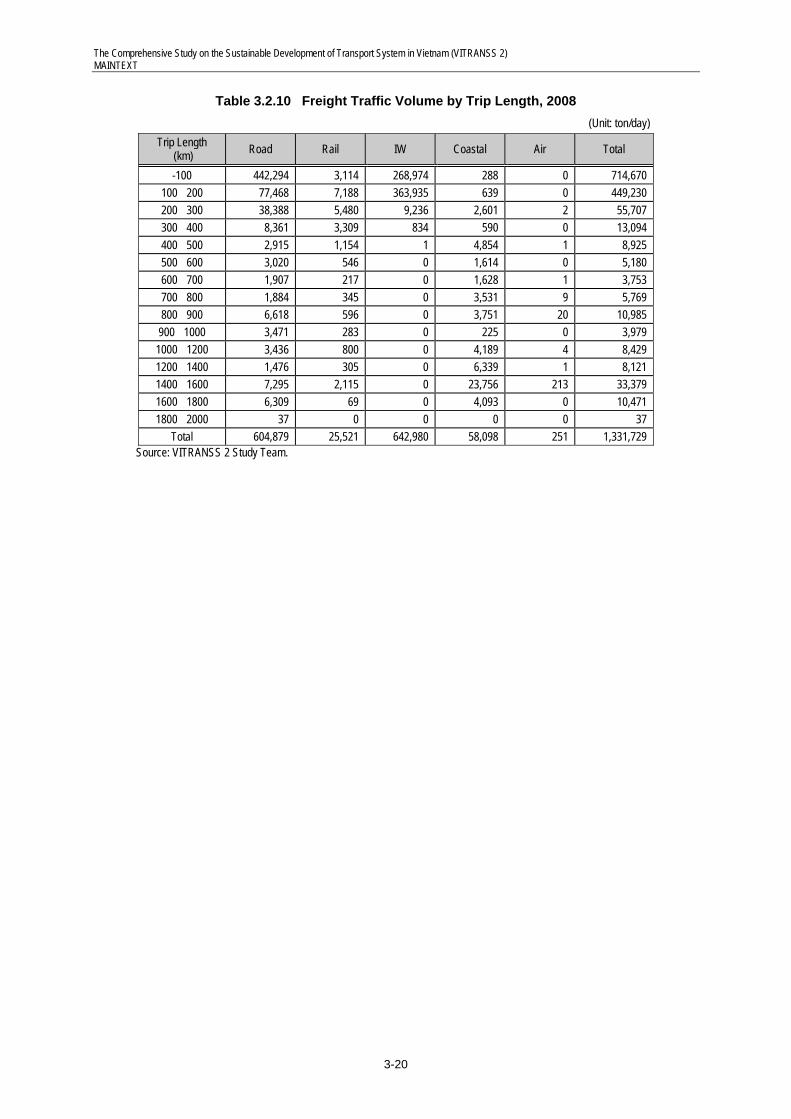
3.33 Figure 3.2.9 and Table 3.2.10 show freight traffic volumes in 2008 by trip length. The demand for transportation covering distances of less than 200km was significant, al-though it decreased dramatically at farther distances. As mentioned earlier, trucks and IWT were major transportation modes for short trips. Coastal shipping, meanwhile, kept its lead for trips ranging between 1400km and 1600km, or in between the northern and southern regions.
Figure 3.2.9 Freight Traffic Volume by Trip Length, 2008 (Unit: ton/day)
Source: VITRANSS 2 Study Team.
The Comprehensive Study on the Sustainable Development of Transport System in Vietnam (VITRANSS 2) MAINTEXT
3-20
Table 3.2.10 Freight Traffic Volume by Trip Length, 2008 (Unit: ton/day)
Trip Length (km) Road Rail IW Coastal Air Total
-100 442,294 3,114 268,974 288 0 714,670 100�200 77,468 7,188 363,935 639 0 449,230 200�300 38,388 5,480 9,236 2,601 2 55,707 300�400 8,361 3,309 834 590 0 13,094 400�500 2,915 1,154 1 4,854 1 8,925 500�600 3,020 546 0 1,614 0 5,180 600�700 1,907 217 0 1,628 1 3,753 700�800 1,884 345 0 3,531 9 5,769 800�900 6,618 596 0 3,751 20 10,985 900�1000 3,471 283 0 225 0 3,979
1000�1200 3,436 800 0 4,189 4 8,429 1200�1400 1,476 305 0 6,339 1 8,121 1400�1600 7,295 2,115 0 23,756 213 33,379 1600�1800 6,309 69 0 4,093 0 10,471 1800�2000 37 0 0 0 0 37
Total 604,879 25,521 642,980 58,098 251 1,331,729 Source: VITRANSS 2 Study Team.

The Comprehensive Study on the Sustainable Development of Transport System in Vietnam (VITRANSS 2) MAINTEXT
3-21
NH3
NH5
NH18
NH2
NH6
NH1
NH1
NH10
3.3 Transportation Demand by Mode
3.34 This section presents the situation of transportation demand by mode. Refer to the Technical Report No.3 for details.
1) Road
(1) Traffic Trends in Northern Vietnam
3.35 In this section, the results of the recent transportation surveys are highlighted, along with the results of the 1999 and 2005 surveys. As depicted in Figure 3.3.1, the highest traffic was along the National Highway (NH) No. 1 corridor, the Hanoi–Hai Phong corridor, and along the periphery of Hanoi up to a 50km radius. In particular, the NH1 and NH5 corridors experienced significant growths in vehicular traffic, and this was mostly brought about by the rapid increase in truck traffic.
Figure 3.3.1 Road Traffic in Northern Vietnam
Source: VITRANSS (1999), VITRANSS Follow-up Study (2005), and VITRANSS 2 Survey (2008).
(2) Traffic Trends in Central Vietnam
3.36 In the case of the central region, traffic was comparatively low (see Figure 3.3.2), even along the NH1 corridor. However, the results of the survey indicate that growth was accelerating. Expectedly, growth in the periphery of Danang was particularly strong, and traffic was highest there as well. The growth in truck traffic in central Vietnam was likewise a key factor, as it was in the north. However, a big share of the growth in traffic was the increase in motorcycle traffic.

The Comprehensive Study on the Sustainable Development of Transport System in Vietnam (VITRANSS 2) MAINTEXT
3-22
NH1
NH15
NH1
NH14
A
B
C
D
Figure 3.3.2 Road Traffic in Central Vietnam
Source: VITRANSS (1999), VITRANSS Follow-up Study (2005), and VITRANSS 2 Survey (2008).
(3) Traffic Trend in Southern Vietnam
3.37 Traffic in the southern region is illustrated in Figure 3.3.3. It features the section between Ho Chi Minh and Dong Nai as the road section with the highest interprovincial traffic volume in the country. Overall road traffic increased sharply and even some sec-tions showed signs of accelerated growth. Truck traffic was the source of traffic growth, al-though motorcycle traffic was likewise a strong contributor.

The Comprehensive Study on the Sustainable Development of Transport System in Vietnam (VITRANSS 2) MAINTEXT
3-23
NH51 NH1
NH20
NH14
NH1
NH1
NH80
NH91
NH13
NH22
0
10
20
30
40
50
60
70
1995 1996 1997 1998 1999 2000 2001 2002 2003 2004 2005 2006
Inland Water Cargo Transportation Capacity (Mil. Ton)
0
50
100
150
200
250
1995 1996 1997 1998 1999 2000 2001 2002 2003 2004 2005 2006
Inland Waterway Passenger Transportation Capacity (Thou.Pax)
Figure 3.3.3 Road Traffic in Southern Vietnam
Source: VITRANSS (1999), VITRANSS Follow-up Study (2005), and VITRANSS 2 Traffic Surveys (2008).
2) Inland Waterway
(1) Overall Traffic Trend
3.38 The published statistics on IWT traffic showed a steady increase in cargo but er-ratic passenger traffic trend from 1995 to 2006 (See Figure 3.3.4) on a nationwide basis. Cargo exceeded 67 million tons in 2006, or an annual rate of increase of 9.4% since 1995. Passenger volumes dipped in 2001 then increased to reach 179 million passengers in 2006. It should be noted, however, that field surveys conducted by VITRANSS 2 esti-mates 234 million tons in 2008. The difference in estimates may be because VIWA statis-tics were derived from port traffic (which may not include all ports), while VITRANSS 2 es-timates were based on channel traffic. Nonetheless the trend is informative.
Figure 3.3.4 Cargo and Passenger Volumes
Source: Prepared from presentation by Dr. Suu, Director General of VIWA at Water summit in Beppu Dec. 2007

The Comprehensive Study on the Sustainable Development of Transport System in Vietnam (VITRANSS 2) MAINTEXT
3-24
3.39 In terms of regional distribution, the southern region accounted for nearly 60% of the country’s freight tonnage carried on waterways, followed by the northern region with 33% share. Only less than 9% were carried in the central region.
(2) Vessel Traffic Trends
3.40 The results of recent surveys on vessel traffic compared with those of the 1999 and 2005 surveys are shown in figures 3.3.5 and 3.3.6. Results show that IWT traffic in-creased overall. In the case of the southern region, some stations experienced a dramatic drop in vessel traffic due to the development of an alternative—a highway.
3.41 In the north, vessel traffic was primarily restricted to self-propelled vessels, while in the south, a more diversified vessel usage was observed. This is actually a manifesta-tion of the differences in the technical standards of the northern and southern channels. With improved channels, operators would have greater flexibility in selecting vessels to suit the requirements of the market.
Figure 3.3.5 Vessel Traffic in Northern Vietnam
Source: VITRANSS (1999), VITRANSS Follow-up Study (2005), and VITRANSS 2 Traffic Surveys (2008).
Figure 3.3.6 Vessel Traffic in Southern Vietnam
Source: VITRANSS (1999), VITRANSS Follow-up Study (2005), and VITRANSS 2 Traffic Surveys (2008).

The Comprehensive Study on the Sustainable Development of Transport System in Vietnam (VITRANSS 2) MAINTEXT
3-25
(3) Vessel Traffic Characteristics
3.42 To further appreciate the movement of IWT vessels in Vietnam, several figures are shown to illustrate the movement of loaded and empty vessels in the network, channel points with the biggest vessel capacities, sizes of vessel along the network, types of commodity being transported, and the OD profile of vessels. Key observations are as fol-lows:
(a) Northern IWT System
(i) Traffic is very directional, i.e., from the west of Hanoi mostly going downstream loaded and returning empty, while traffic from Quang Ninh/Hai Phong goes up-stream loaded and returning empty;
(ii) The primary corridor is Phu Tho–Hanoi–Hai Duong–Hai Phong/Quang Ninh; (iii) Vessel sizes around Quang Ninh are relatively bigger, while further upstream ves-
sel sizes are very limited; (iv) Primary commodities are coal and ore, construction materials, and cement; and (v) Key flows concentrate toward the center of the Red River delta with flows coming
mainly from Hai Phong/Quang Ninh and Phu Tho.
(b) Southern IWT System
(i) Traffic in the south is multidirectional, resulting in relatively higher load factors for IWT vessels;
(ii) The primary corridor is rather concentrated in a smaller area in HCMC and Tien Giang/Ben Tre;
(iii) Vessel sizes in the Mekong delta are comparatively smaller, while vessel traffic along the periphery of HCMC is relatively larger;
(iv) A more diversified carriage of various commodities is observed in the south; and Key flows are focused toward HCMC and Tien Giang/Ben Tre.
3) Railway
(1) Passenger Traffic Trends
3.43 Figure 3.3.7 illustrates the trend in railway passenger traffic on selected segments. Traffic growth in general is increasing, albeit not at the same level as other modes, there-by resulting in stagnant or declining market shares. Traffic is particularly declining in the Hanoi–Hai Phong and Hanoi–Lang Son lines. Incidentally, these are the corridors where road capacity has improved.
3.44 Primary stations with the highest passenger movements are Hanoi, Hoa Hung (HCMC), and Lao Cai. Understandably, Hanoi station has the highest volume, being the hub terminal of the network. The succeeding figures illustrate the key stations along the Ha-noi–Saigon Line, Hanoi–Hai Phong Line, Hanoi–Lao Cai Line, and Hanoi–Lang Son Line.

The Comprehensive Study on the Sustainable Development of Transport System in Vietnam (VITRANSS 2) MAINTEXT
3-26
Viet Tri – Yen Bai1997: 2,3872003: 4,0492006: 5,366
Yen Vien – Bac Giang1997: 8002003: 1,2752006: 738
Hanoi – Hai Phong1997: 3,7772003: 2,6002006: 2,497
Hanoi – Nam Dinh1997: 4,5232003: 5,3302006: 5,486
ThanhHoa ‐ Vinh1997: 3,6672003: 5,6862006: 6,051
Hue ‐ Danang1997: 3,4382003: 5,6682006: 5,529
Dieu Tri ‐Nha Trang1997: 3,0122003: 5,5692006: 5,869
Thap Cham –M. Man1997: 3,3212003: 5,8252006: 6,231
M. Man – Saigon1997: 3,0122003: 5,5692006: 5,869
Unit: in pax/day, 2‐way
1997:3,328 2003:8,836 2006:6,436
0%10%20%30%40%50%60%70%80%
‐500,000
1,000,000 1,500,000 2,000,000 2,500,000 3,000,000 3,500,000 4,000,000
HA
NO
IH
OA
HU
NG
LAO
CA
ILO
NG
BIE
NV
INH
NH
A T
RA
NG
HU
ED
A N
AN
GH
AI P
HO
NG
YE
N B
AI
DO
NG
HO
IG
IA L
AM
HA
I DU
ON
GTH
AN
H H
OA
PH
U T
HO
PH
O L
UN
AM
DIN
HB
AO
HA
DIE
U T
RI
QU
AN
G N
GA
I
Top 20 Stations (pax/yr)
Station Traffic % of total station traffic (cummulative)
Figure 3.3.7 Trends in Railway Passenger Traffic by Segment
Source: VNR.
Figure 3.3.8 Major Passenger Railway Stations, 2006
Source: VNR (2006).
(2) Freight Traffic Trends
3.45 Figure 3.3.9 illustrates the trends in freight traffic on key sections of the network. Similar to the discussion on passenger traffic, overall growth has been limited, and while positive, declines are recorded on the Hanoi–Hai Phong Line.
3.46 The succeeding figures show the key freight stations by volume and the major commodities carried by railway, which has been relegated to the transportation of bulk commodities.

The Comprehensive Study on the Sustainable Development of Transport System in Vietnam (VITRANSS 2) MAINTEXT
3-27
0%
10%
20%
30%
40%
50%
60%
70%
80%
‐
200,000
400,000
600,000
800,000
1,000,000
1,200,000
1,400,000
1,600,000
1,800,000
2,000,000
Top 20 stations (ton/yr)
Station Traffic % of total station traffic (cummulative)
Viet Tri – Yen Bai1997: 2,6082003: 5,7062006: 6,844
Yen Vien – Bac Giang1997: 9582003: 1,6552006: 3,027
Hanoi – Hai Phong1997: 1,5832003: 3,1582006: 3,032
Hanoi – Nam Dinh1997: 2,6022003: 4,6372006: 5,439
ThanhHoa ‐ Vinh1997: 2,6792003: 4,1622006: 5,002
Hue ‐ Danang1997: 1,5582003: 3,0822006: 4,006
Dieu Tri ‐ Nha Trang1997: 1,3662003: 2,0882006: 3,086
Thap Cham –M. Man1997: 1,5382003: 1,8132006: 2,658
M. Man – Saigon1997: 1,2842003: 1,5742006: 2,581
Unit: in ton/day, 2‐way
Figure 3.3.9 Trends in Railway Freight Traffic by Segment
Source: VNR.
Figure 3.3.10 Major Freight Stations by Volume, 2006
Source: VNR (2006).
4) Aviation
(1) Domestic Traffic
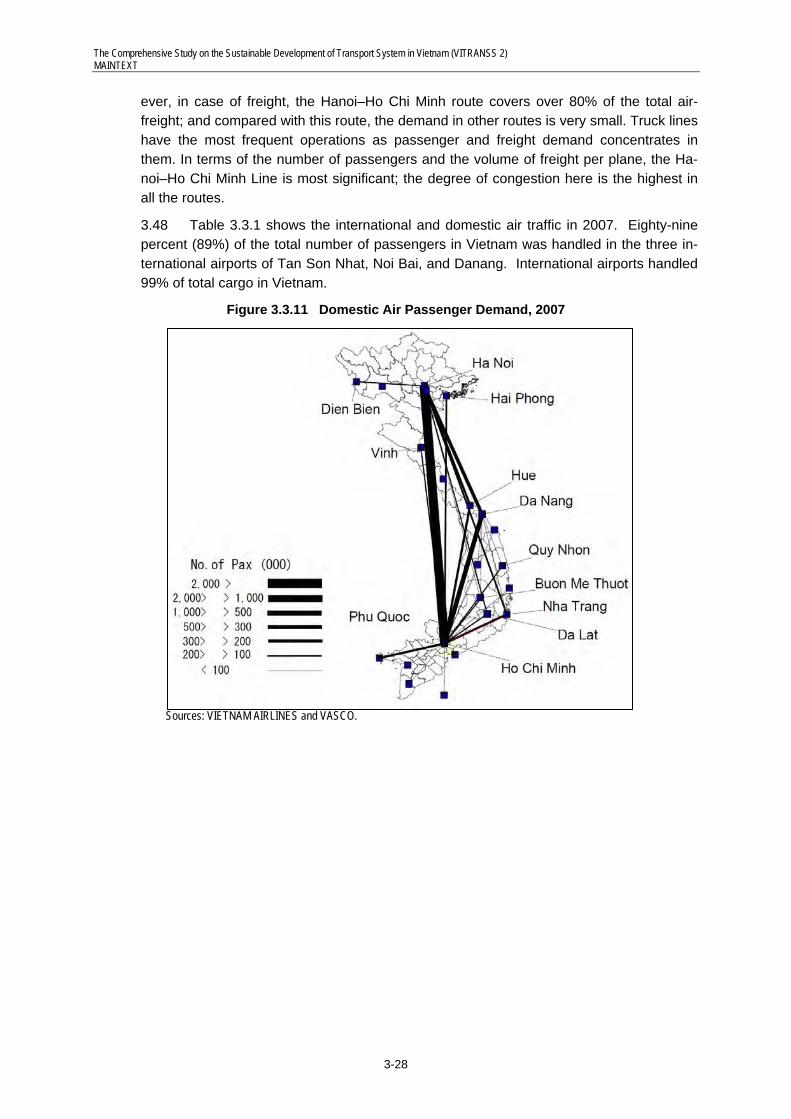
3.47 Regarding passenger demand (see Figure 3.3.11), the Hanoi�Ho Chi Minh line is primary. This route covers over 40% of total air passenger. The Ho Chi Minh–Danang route has the second-highest number of passengers, followed by the Hanoi–Danang route. . In freight traffic, these three routes are most important (see Figure 3.3.12). How-
The Comprehensive Study on the Sustainable Development of Transport System in Vietnam (VITRANSS 2) MAINTEXT
3-28
ever, in case of freight, the Hanoi–Ho Chi Minh route covers over 80% of the total air-freight; and compared with this route, the demand in other routes is very small. Truck lines have the most frequent operations as passenger and freight demand concentrates in them. In terms of the number of passengers and the volume of freight per plane, the Ha-noi–Ho Chi Minh Line is most significant; the degree of congestion here is the highest in all the routes.
3.48 Table 3.3.1 shows the international and domestic air traffic in 2007. Eighty-nine percent (89%) of the total number of passengers in Vietnam was handled in the three in-ternational airports of Tan Son Nhat, Noi Bai, and Danang. International airports handled 99% of total cargo in Vietnam.
Figure 3.3.11 Domestic Air Passenger Demand, 2007
Sources: VIETNAM AIRLINES and VASCO.

The Comprehensive Study on the Sustainable Development of Transport System in Vietnam (VITRANSS 2) MAINTEXT
3-29
Figure 3.3.12 Domestic Air Freight Demand (kg), 2007 (Unit: ton/day)
Sources: VIETNAM AIRLINES and VASCO.
Table 3.3.1 Airport Traffic, 2007
Airport Total Aircraft Movement Total No. of Passengers Total Cargo (kg)
1. Tan Son Nhat 75,585 10,240,813 252,528,089 2. Noi Bai 44,066 6,317,338 124,022,090 3. Da Nanhg 11,300 1,442,501 8,916,800 4. Phu Bai 4,592 518,240 889,170 5. Cam Ranh 5,318 501,491 1,319,260 6. Duon Dong 4,008 236,973 722,585 7. Cat Bi 1,482 185,958 1,916,518 8. Buon Ma Thuot 1,940 144,644 65,035 9. Lien Khuong 1,755 120,161 319,518 10. Vinh 676 93,166 140,751 11. Pleiku 1,452 83,222 78,613 12. Rach Gia 1,498 78,065 93,917 13. Phu Cat 1,432 75,873 2,970 14. Dien Bien Phu 1,182 65,243 82,330 15. Ca Mau 742 42,924 0 16. Co Ong 588 30,818 2,387 17. Dong Tac 302 14,856 0 18. Chu Lai 230 12,914 0
Total 158,148 20,205,200 391,100,033 Source: CAAV.

The Comprehensive Study on the Sustainable Development of Transport System in Vietnam (VITRANSS 2) MAINTEXT
3-30
0
100,000
200,000
300,000
400,000
500,000
600,000
700,000
800,000
900,000
1996 1997 1998 1999 2000 2001 2002 2003 2004 2005
THAILAND
KOREA
JAPAN
SINGAPORE
HONG KONG
MALAYSIA
FRANCE
CHINA
TAIWAN
AUSTRALIA
RUSSIA
PHILIPPINES
GERMANY
(2) International Traffic
3.49 Figure 3.3.13 showsthe number of international passengers to / from Vietnam, which were categorized by origin and destination countries from 1996 to 2005. The fig-ures include air traffic only in major international routes. Thailand’sis Bangkok Airport has been the most popular air traffic destination for international passengers to/from Vietnam since the 1990s.
Figure 3.3.13 International Passengers by Origin and Destination, 1996–2005
Source: ICAO Airline OFOD data.
3.50 Figure 3.3.14 shows international air passengers and growth rates in Noi Bai, Da-nang, and Tan Son Nhat airports from 1999 to 2007. International passengers in Noi Bai and Tan Son Nhat airports increased rapidly. The total number of international passen-gers in Noi Bai was 2.9 million in 2007, and the growth rates in the last eight years were always higher than those of Tan Son Nhat Airport. Although Danang Airport is an interna-tional airport, its traffic level was quite small compared to the other two international air-ports. In total, the three airports received 8.5 million international air passengers in 2007 and the AAGR of air passengers between 2003 and 2007 was 15.5%.
The Comprehensive Study on the Sustainable Development of Transport System in Vietnam (VITRANSS 2) MAINTEXT
3-31
0
1,000,000
2,000,000
3,000,000
4,000,000
5,000,000
6,000,000
-20.0%
-10.0%
0.0%
10.0%
20.0%
30.0%
40.0%
50.0%
60.0%
Noi Bai
Tan Son Nhat
Da Nang
Noi Bai
Tan Son Nhat
Noi Bai 562,578 649,008 799,832 1,043,400 1,118,555 1,702,700 2,085,684 2,505,637 2,899,782
Tan Son Nhat 2,034,876 2,293,763 2,583,662 3,199,388 2,897,076 3,724,589 4,311,994 4,863,567 5,598,625
Da Nang 962 15,976 38,991 40,177 23,411 34,783 30,124 26,264 26,970
Noi Bai 2.4% 15.4% 23.2% 30.5% 7.2% 52.2% 22.5% 20.1% 15.7%
Tan Son Nhat 13.6% 12.7% 12.6% 23.8% -9.4% 28.6% 15.8% 12.8% 15.1%
1999 2000 2001 2002 2003 2004 2005 2006 2007
Figure 3.3.14 International Air Passengers and Growth Rates in Three International Airports, 1999–2007
Source: CAAV.
5) Marine Traffic
(1) Nationwide Cargo Throughput
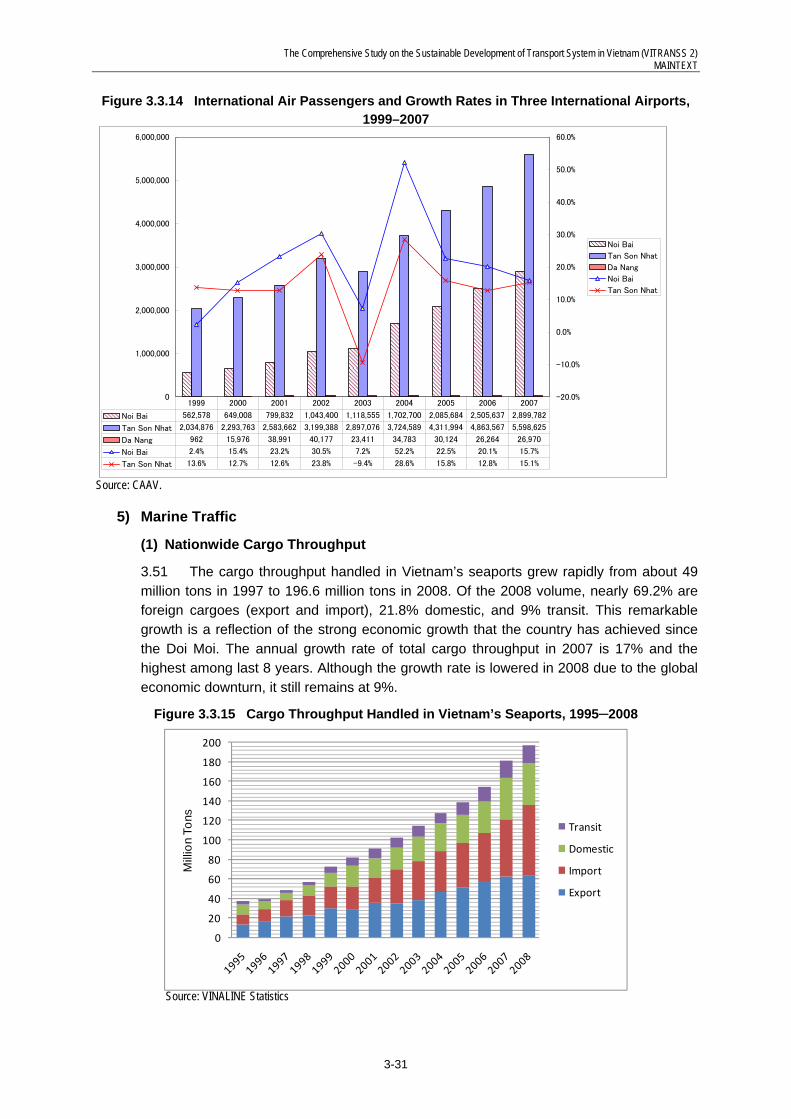
3.51 The cargo throughput handled in Vietnam’s seaports grew rapidly from about 49 million tons in 1997 to 196.6 million tons in 2008. Of the 2008 volume, nearly 69.2% are foreign cargoes (export and import), 21.8% domestic, and 9% transit. This remarkable growth is a reflection of the strong economic growth that the country has achieved since the Doi Moi. The annual growth rate of total cargo throughput in 2007 is 17% and the highest among last 8 years. Although the growth rate is lowered in 2008 due to the global economic downturn, it still remains at 9%.
Figure 3.3.15 Cargo Throughput Handled in Vietnam’s Seaports, 1995─2008
Source: VINALINE Statistics
0
20
40
60
80
100
120
140
160
180
200
Mill
ion
Tons
Transit
Domestic
Import
Export

The Comprehensive Study on the Sustainable Development of Transport System in Vietnam (VITRANSS 2) MAINTEXT
3-32
3.52 Increasing containerization was also observed – from 761 thousand in 1997 to 5,023 thousand TEU by 2008 (see Figure 3.3.16). More than 82% of the containers are foreign trade related. While containerization of domestic cargoes is still small, it neverthe-less recorded impressive growth from nearly zero ten years ago.
Figure 3.3.16 Container Throughput Handled in Vietnam’s Seaports1, 1995─2008
Source: VINAMARINE statistics. Note: The transit container volume is not included due to lack of statistical data.
(2) Cargo Throughput by Seaport Group
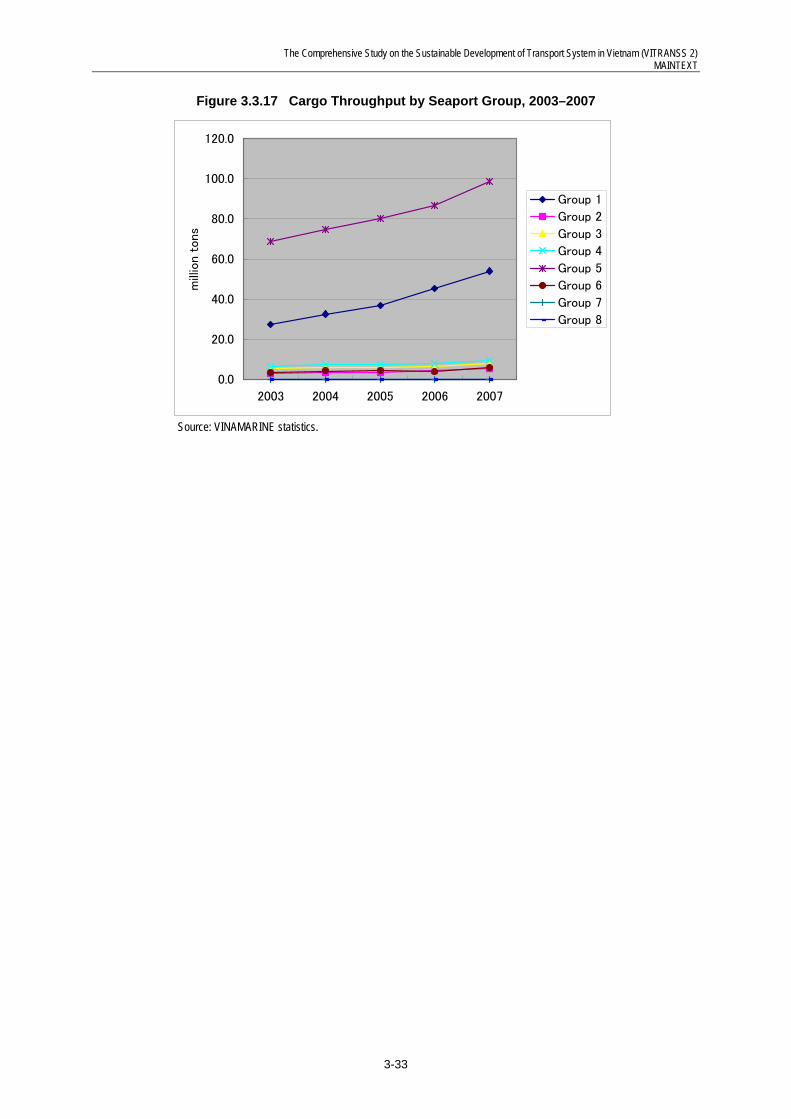
3.53 The maritime ports in Vietnam are classified into eight groups, as follows:
(i) Port Group in the Northern Region; (ii) Port Group in the Northern Central Region; (iii) Port Group in the Central Coastal Region; (iv) Port Group in the Southern Central Region; (v) Port Group in HCMC and Vung Tau-Thi Vai; (vi) Port Group in the Cuu Long River Delta; (vii) Port Group in Phu Quoc Island; and (viii) Port Group in Con Dau Island.
3.54 In terms of cargo throughput by seaport group in 2007, Group 5, which consists of the seaports in Ho Chi Minh and Vung Tau�Thi Vai area, handled 98 million tons (54% of the total cargo volume in the whole country). Group 1, which includes seaports in the north-ern area such as Hai Phong Port and Cai Lan Port, handled 54 million tons (30%). Almost all the seaport groups enjoyed rapid cargo growth in the period 2003–2007. The annual cargo growth rates of Group 5 (seaports in Ho Chi Minh and Vung Tau-Thi Vai area) and Group 1 (seaports in the northern region) were 9% and 19%, respectively. Groups 2, 3, and 4 also increased their cargo throughputs with an annual growth rate of 9–15%.
0
1000
2000
3000
4000
5000
6000
1995
1996
1997
1998
1999
2000
2001
2002
2003
2004
2005
2006
2007
2008
1000
TEU
s
Domestic
Import
Export
The Comprehensive Study on the Sustainable Development of Transport System in Vietnam (VITRANSS 2) MAINTEXT
3-33
0.0
20.0
40.0
60.0
80.0
100.0
120.0
2003 2004 2005 2006 2007
mill
ion t
ons
Group 1
Group 2
Group 3
Group 4
Group 5
Group 6
Group 7
Group 8
Figure 3.3.17 Cargo Throughput by Seaport Group, 2003–2007
Source: VINAMARINE statistics.

The Comprehensive Study on the Sustainable Development of Transport System in Vietnam (VITRANSS 2) MAINTEXT
4-1
4 PERFORMANCE OF THE TRANSPORTATION SUBSECTORS
4.1 Overview
4.1 Since VITRANSS (1999), Vietnam has invested VND 113,000 billion for transpor-tation infrastructure development by the end of 2007, realizing roughly 45% of the planned investments (including VITRANSS proposed and other projects). On average, Vietnam has spent VND 14,200 billion (USD 860 million) annually – or 2.16% of its GDP. Much of the investment has been on roads (80%)
Table 4.1.1 Transportation Investment1) since VITRANSS (1999) up to end-2007 (Unit: VND billion)
Mode Planned Investment Actual Investment VITRANSS Others Total VITRANSS Others Total
Road 121,684 71,783 193,468 72,566 28,207 90,774 Railway 7,440 4,782 12,222 1,428 902 2,329 Waterway 2,009 184 2,192 2,004 184 2,187 Maritime 20,234 8,111 28,346 9,370 803 10,173 Air 10,155 - 10,155 8,264 - 8,264
Total 161,524 84,860 246,383 93,632 20,096 113,729 Note: Compiled by VITRANSS 2 Study Team from available documents.
1) VITRANSS project funds include central and local funds, as well as FDI. Non-VITRANSS projects include MOT projects only.
4.2 During the last decade remarkable achievements were made in transportation in-frastructure development in Vietnam - particularly in roads, where nearly 30,000km were added to the network and paved roads increased 5 times in a short span of seven years.
4.3 The per-capita gross domestic product (GDP) grew from USD 406 in 2000 to USD 765 in 2007. Over the same period, exports expanded more than three times - from USD14.5 billion to USD48.6 billion. Poverty rates also saw a dramatic drop - from 41% in 1995 to 18% in 2005, and to 16% by 2006. The transportation sector was a major enabler of the economic and social transformation of Vietnam.
4.4 As of 2008, a snapshot of the transportation subsectors of Vietnam is presented in Table 4.1.2.
1) Economic and Social Impact
4.5 The amount of investments in transportation projects has hovered at 2.5% of the country’s GDP. A post-evaluation of each of the projects is impractical, but results from a few projects do reflect the broad economic impact as the economic integration and devel-opment of the different regions of the country through a reduction of transportation costs and travel time, as well as improved transportation reliability. In the case of NH5, for ex-ample, its completion in 2000 has accelerated the industrial agglomerations in the north-ern region. Many foreign-invested industrial parks were developed along the highway – their products were transported through the newly-rehabilitated port in Haiphong. Without NH5, more than 90% of the investments in the corridor might not have happened. NH5 al-so brought about a noticeable change in the structure of agricultural production in the ad-joining provinces of Hung Yen and Hai Duong in response to an expanded market.1 In the southern region, and in other parts of the country, a ribbon pattern of developments have emerged along new roads and improved transportation links.
1 Tran Van Tho, et.al., “Impact Assessment of Transport Infrastructure Projects in the Northern Vietnam,” JETRO,
2003.
The Comprehensive Study on the Sustainable Development of Transport System in Vietnam (VITRANSS 2) MAINTEXT
4-2
4.6 Along with FDI-led industrial developments is the rapid shift in the structure of the economy: the secondary and tertiary sectors expanded from 76.7% of GDP in 2000 to 82.1% in 2007.
4.7 Transportation also improved access of rural population to social and economic opportunities. This was documented in a study2 that concluded: “spending one additional point of GDP in infrastructure has led to a proportionate reduction of the poverty rate by roughly 0.5%. The impact is larger in poorer provinces. Poverty alleviation impacts are stronger in the case of transportation investments, and even more so in the case of water and sanitation investments.”
2 Vietnamese Academy of Social Sciences, “Vietnam Poverty Update:2006”, Hanoi (Dec 2006).

The Comprehensive Study on the Sustainable Development of Transport System in Vietnam (VITRANSS 2) MAINTEXT
4-3
Table 4.1.2 Snapshot of Vietnam’s Transportation Sector
Mode Transportation Infrastructure Transportation Demand and Services 1. Road • Network
- 250,000km highway network - 30,000km of primary arterials (nat’l and prov’l)
• Condition of national highways (17,000) - 7% are 4(+) lanes - 43% good, 37% average, 20% bad/very bad - Gravel surface: 6%
• Condition of provincial highways and local roads - Provincial (23,000km): 24% earth or gravel - District (55,000km): :86% earth or gravel - Commune (141,000km): 79% earth or gravel - Urban and Others (14,900km):54% earth or gravel
• Registered vehicles: 18 mill. MC and 973,000 auto-mobiles (2006)
• Vehicle ownership growth: 20.1% p.a. motor-cycles,12.3% p.a. automobiles
• Annual Traffic growth 1999-2008 (Car:Bus:Truck:MC) - NH5 (Hai Phong): 16%:7%:16%:11% - NH1 (Thanh Hoa): 11%:9%:10%:11% - NH1 (Binh Thuan): 16%:10%:9%:10% - NH1 (Dong Nai): 14%:6%:14%:-5% - NH1 (Long An): 11%:5%:9%:8%
• 14,727 accidents, 12,757 fatalities, 11,288 injuries (in 2006)
2. Rail • Railway network: - 2,600km and non-electrified - Single Track (nearly all) and primarily 1,000mm gauge
• Rail condition between Hanoi and HCMC - Manually managed at-grade crossings - 29/25 bridges hinder speeds to ≤ 50-60 km/h (freight/pass) - 41/10 sections where radius restricts speed ≤ 50/60km/h
(freight/pass) - Typical operating speeds at 50-80 km/h
• Rolling Stock - 346 diesel locomotives of which 291 are operable - 75% are greater than 15 years old (most > 20 yrs old) - 842 passenger cars and 4,856 wagons
• 11.6 million passengers (2006) – decreasing by 4% p.a. since 2004
• 11 million tons of freight (2006) – slightly decreasing on ton-km basis
• 473 accidents, 192 fatalities, 391 injuries (average for 2004-2006)
3. Maritime • Seaports - 17 Class 1 Seaports (17,500m, berth length) - 23 Class 2 Seaports and 9 Class 3 Seaports
• Conditions of major seaports (min. depth) - Hoang Dieu (1,717m, 8.4/4.1m depth at berth/channel) - Tien Sa (528m, 11/12.7m depth at berth/channel) - Saigon (2,669m, 8.5/8.5m depth at berth/channel)
• Shipping Fleet (2007) 865 units, 3.4 mill. DWT - Mainly Ocean-going: 360 units, 2.5 mill. DWT - Mainly Coastal: 505 units, 0.9 mill. DWT - State Owned Vessels (2007): 216 units, 1.6 million DWT - Mostly gen. cargo vessels (1 mill. DWT) - 17 container vessels with 181T DWT
• Cargo Throughput (2007) - International: 121.1 MT @ 11% p.a. (04~07) - Domestic: 42.9MT @ 14% p.a. (04~07)
• Container Throughput (2007) - International: 3.7M TEU @ 21% p.a. (04~07) - Domestic: 0.8M TEU @ 32% p.a. (04~07)
• Passenger Traffic – very little • 74 accidents, with 20 fatalities, and 8 injuries (ave. for
2003-2005)
4. Inland Water Transpor-tation
• Network - North IWT Network: 2,700km, with 30-36m min. width and
1.5-3.6m min. depth. Significant seasonal fluctuations to depth, and shoals. Mostly 24-hours operations
- South IWT Network: 3,000 km, with 30-100m min. width and 2.5-4 m min. depth. Mainly 24-hours operation
- Central IWT Network: 800km – relatively of limited role - Ports and Landing Stage – 7,189, incl. 126 river ports,
4,809 freight handling ports, 2,348 river crossing docks. Many others are unaccounted.
• IWT Fleet - Vietnam Register (2006): 86,000 vessels (mostly freight), - 70 tons/vessel ave. Plus 700,000 vessels, of 1-10 tons - Condition is mediocre, and average age of 12 years
• IWT Traffic (2008) - 640,000 ton/day (27% p.a. growth since 1999) - Passenger (local traffic mainly, limited inter-city)
• Type of Commodities - North: Coal, Ore, Construction Materials, Cement - South: Construction materials (mainly), fertilizer,
industrial and manufacturing products, cement, agriculture products, consumption products, etc.
• 308 accidents, with 251 fatalities and 30 injuries (ave. for 2003-2005)
5. Aviation • 21 Airports, 18 with scheduled domestic flights, and 3 interna-tional airports
• Condition of major airports - Noi Bai:4.3 pax/yr capacity, wuth 45x3,800m runway - Danang: 1M pax/yr, with 45x3,048m runway - Tan Son Nhat: 10M pax/yr, with 45x3,800m runway - 3 airlines in operation, with Vietnam Airlines in dominant
position
• International Passenger Traffic: 8.5 mill. (2007) grow-ing at 15.5% p.a. (2003-2007)
• Domestic Passenger Traffic: 11.6 mill. (2007) growing at 15.6% p.a. (2003-2007)
• International Cargo: 224,000 tons (2007) growing at 15.4% (2003-2007)
• Domestic Cargo: 166,000 tons (2007) growing at 14.9% p.a. (2003-2007)

The Comprehensive Study on the Sustainable Development of Transport System in Vietnam (VITRANSS 2) MAINTEXT
4-4
2) New Challenges
4.8 The challenge is no longer a case of restoring infrastructure from the damages of war, or of building more and bigger ports, roads, or airports. The challenge has become a case of achieving sector outcomes that will sustain Vietnam’s FDI-driven growth and devel-opment as well as raise its global competitiveness. For this reason, the performance of the transportation sector has to be seen increasingly in comparison with best international prac-tices.
4.9 The current situation and issues of the sector and its main subsectors – road and road transportation, railway, inland waterway, ports and shipping, aviation - was studied and reported upon. There is no need to repeat them here, other than to summarize the progress made so far and inevitably allude to what the different modes can be.
4.10 In recent years, fundamental reforms have taken place in nearly all subsector in-stitutions. These reforms that will enable Vietnam to better meet future challenges. The separation of policy, regulatory and operator roles in the aviation subsector is particularly noteworthy, but reforms in other subsectors have not been as progressive. A multi-modal orientation is lacking - resulting in imbalances and integration problems between subsec-tors. Funding for maintenance is lacking, particularly in IWT and roads.
4.11 Provinces have not been as involved in meeting transportation challenges as they can be. The size of their budgets for transportation (about 2%-3% of their respective GRDPs) could be leveraged for maximum impact. Private finance in transportation infra-structure is still at its infancy, constrained by institutional barriers.
4.12 There are too many projects under consideration and under by weak priority-setting, results in unrealistic expectations. The issues that the transportation sector has to address – as it moves from the present to the future – can be summarized in Table 4.1.3 below.
Table 4.1.3 Issues for the Transportation Sector of Vietnam
Infrastructure Services 1. Disconnect of urban and regional planning with infrastructure
development 1. Unsustainable subsidy in urban transportation services, particu-
larly in buses (and soon, also in rail transit) 2. Compartmentalized subsector planning that hampers inter-
modal and multi-modal transportation complementation 2. Inefficient pricing and regulation across all modes that result in
imbalances of mode choices and investment 3. Imbalances in resource allocation between sectors, and be-
tween capital and maintenance expenditures 3. Extensive involvement of State in the provision of services, par-
ticularly in ports and shipping 4. Lack of sustainable source of financing for transportation,
particularly for IWT and railways 4. Low level of safety, particularly in road subsector and railway
crossings 5. Productivity enhancement measures on existing assets has
not been given more attention, especially in ports and air-ports
5. Transition from motorcycles to public transit in urban commut-ing
6. Carbon emission and energy demand, with rapid motorization 6. Increasing need by export industries for more sophisticated logistics services
7. Appropriate participation by private sector in the development of ports, airports, expressways, and logistics
7. Connecting remote villages and increasing their accessibility to the transportation network
4.13 It was difficult enough for Vietnam to resolve the above issues and simultaneously modernize its transportation system, in a predictable world of growing economies. Then, the financial crisis struck unexpectedly in 2008. There is currently significant uncertainty in Viet-nam and the rest of the world. For the first time since 1982, global trade will shrink by 9% in 2009, according to WTO. IATA expects the Asia Pacific carriers to be hardest hit by the economic turmoil. International shipping is also affected, as shown by idled gantries in once busy hub ports and vessels moored for lack of business. Worse, the export-led and FDI-driven approach to development to which Vietnam has utilised is currently unstable. Viet-nam is put in a situation where it may have to re-assess its development strategy.

The Comprehensive Study on the Sustainable Development of Transport System in Vietnam (VITRANSS 2) MAINTEXT
4-5
4.2 Road and Road Transportation
1) Government Plans and Decisions
4.14 There are two Prime Minister decisions related to road subsector development, namely No. 412 (April 2007) and No. 1290 (September 2007). Decision No. 1290 has a broader coverage, including primary and secondary roads. The following summarizes the scope of the identified projects:
(i) 2,500km of expressways;
(ii) 110km of main urban roads (Hanoi and HCMC);
(iii) 13 primary road development projects (new, upgrading, expansion, and bridges);
(iv) Secondary road development (350km, new and upgrading); and
(v) Traffic safety enhancement.
4.15 Meanwhile, “The Planning on Development of Vietnam’s Land: Road Communica-tions and Transport Sector till 2010 and Orientations till 2020” was approved by Decision No. 162/2002/QD-TTg in 2002. Since then, several expressway master plans have been formulated by the MOT, VEC, VRA, and VRA (TEDI). The latest expressway master plan was submitted by the MOT in 2007 and includes a network of around 5,500km of ex-pressways. The objectives of the proposed Vietnam expressway network are as follows:
(i) Link political, economic, and cultural centers of the country and the regions with each other;
(ii) Strengthen traffic between focal economic zones; (iii) Connect to main border gates to boost international trade, tourism, etc.; and (iv) Link with other transportation modes via railway, airway, river ports, seaports, and
road gates.
4.16 It is comprised of the North-South Expressway in the west and another in the east, resulting in two parallel north-south expressways. A 6-radial line network in the north (one is coastal), a 4-line network in the central region, and a 6-line network in the south com-pletes the network.
4.17 The MOT Transport Development Strategy up to 2020 recommended a multitude of ordinary road development projects, but focuses on the needs of the north-south axis (NH1 and HCMC road) and those of each region. An expressway network was also pro-posed, comprising of a north-south axis and regional expressway networks in the north and the south. In the case of the secondary road network, the focus was more on the budgeting of more funds for road upgrade or development. At present, there is a multitude of road projects that are ongoing or committed, which is a manifestation of the govern-ment’s focus towards the sector. Notable projects include:
(i) Cau Gie–Ninh Binh Expressway (50km, 2006–2010); (ii) Noi Bai–Lao Cai Expressway (264km, 2008–2012); (iii) HCMC–Long Thanh–Dau Giay Expressway (50km, 2008–2012); (iv) HCMC–Trung Luong Expressway (62km, 2004–2008); (v) Trung Long – Mi Thuan–Can Tho Expressway (82km, for BOT); (vi) Hanoi–Hai Phong Expressway (~100km, 2008–2011); and (vii) Hanoi–Thai Nguyen Expressway (62km, 2005–2010).

The Comprehensive Study on the Sustainable Development of Transport System in Vietnam (VITRANSS 2) MAINTEXT
4-6
2) Key Development Issues
(1) Road Hierarchy
4.18 The road infrastructure so far has been the recipient of the bulk of transportation investment, which explains the subsector’s rapid expansion and appreciable improve-ments. However, many problems still persist. One is that despite rapid investments in roads, traffic growth is fast surpassing the ability of the government to develop roads. Another problem is traffic congestion which is particularly felt in links between industrial areas, cities, and gateways. It is therefore important to incorporate high efficiency in the network through the introduction of a hierarchical structure.
4.19 A road hierarchy creates a functional classification of the highways to allow the specific highway to concentrate on either facilitating high capacity or property access. Controlling access, for example, could increase the capacity of a 4-lane highway by nearly 60%, resulting in higher capacity per unit investment. It also enhances traffic safety and improves operating speeds.
4.20 Unfortunately, one key weakness of the Vietnamese road network is the poor arti-culation of road hierarchy, and this has become increasingly more an issue as Vietnam progresses towards becoming a motorized country with superlative growth rates in motor-cycle ownership, car ownership, and truck movements. These vehicles with differing op-eration characteristics cause friction on the roadway, leading to suboptimal vehicle opera-tion. Worse, it creates risky maneuvers and situations leading to a high rate of accidents on Vietnamese roads.
4.21 Decree No.186/2004/ND-CP categorizes roads into national highways, provincial roads, district roads, commune roads, urban roads and exclusive roads as shown in the table below.
Table 4.2.1 Administrative Classification of Roads
Classification Definition Agency Re-sponsible
Total Length (km)
National Highway
The main axial roads of the nationwide land road network, which are of particular-ly important effect in service of national or regional socio-economic development, defense and security, including: • Roads linking Hanoi capital with the centrally-run cities; and with administrative
centers of the provinces; • Roads linking administrative centers of three or more provinces or centrally-run
cities (hereinafter called provinces); • Roads linking international seaports with international border gates and main
land border gates.
GRA (MOT)
17,228
Provincial Road
Axial roads within one province or two provinces, including roads linking a prov-ince’s administrative center with districts’ administrative centers or with adjacent provinces’ administrative centers; roads linking national highways with districts’ administrative centers.
PDOT (PPC)
23,520
District Road Roads linking districts’ administrative centers with the administrative centers of communes or commune clusters or with adjacent districts’ administrative centers; roads linking provincial roads with administrative centers of communes or centers of commune clusters.
(DPC) 49,823
Commune Road
Roads linking the communes’ administrative centers with hamlets and villages, or roads linking communes together.
(CPC) 151,187
Urban Road Roads lying within the administrative boundaries of inner cities or urban centers. TUWPs (UPC) 8,492 Exclusive Road
Roads used exclusively for transport and communication by one or a number of agencies, enterprises and/or individuals.
(Investor) 6,434
Total 256,684 Source: Vietnam Road Administration, Decree No.186/2004/ND-CP Note: Total length is as of 2008.

The Comprehensive Study on the Sustainable Development of Transport System in Vietnam (VITRANSS 2) MAINTEXT
4-7
4.22 However, the classification mentioned above relates to administration matters, while there is none by function. And while there is a Vietnamese road design standard, it is incomplete. An important factor in the development of road hierarchy is road classifica-tion standards. Road classification by function involves applying standards on key design elements such as design speeds, speed limits, access control, treatment of intersections, and others. It also ensures that facilities are optimally designed as a network through standardization and rationalization of specifications, thereby creating a harmonious and consistent operation of vehicles. The nationwide road network therefore needs to be ex-amined and redefined based on functional classification standards. Along with these de-sign standards, it is also important to incorporate regionally agreed standards such as the Greater Mekong Subregion (GMS) highway classification standards where the design ve-hicle is HS20-44 (40-foot trailer truck).
(2) Secondary Road Network Development
4.23 Eighty-five percent (85%) of the network is composed of local roads or secondary road network which gives access to the poorly developed areas in the country. The quality of this network is unsatisfactory. The PDOT is responsible for the investment and main-tenance of the secondary road network, thus their capability to handle the large invest-ment and the complicated planning and engineering process needed is crucial for the successful alleviation of the poor secondary road network in the country.
4.24 Funding is obviously a key consideration, especially with the scale of investment needed, and therefore it is necessary to rationalize the investment in the secondary road network. In other words, the improvement of the road network needs to follow clear and efficient criteria to ensure that the resources are wisely spent in a staged manner, and the continuous application of this strategy will slowly accumulate and gradually transform the secondary road network in line with growth of traffic requirements.
4.25 The capacity building of local government units therefore is identified as the key thrust to the accelerated development of the secondary network.
(3) Maintenance
4.26 Heavy-vehicle traffic from trucks and buses is significantly increasing and this means pavements will deteriorate much faster, highlighting the need to properly maintain them. First consideration is the lack of budget or more precisely the lack of appropriation, as funding requirements for maintenance is only a fraction of the funds for investment. Funds for maintenance are reliant on state budget (80% of funds), and while going through the appropriation process the required funds tend get downsized to 30–40% of the desired funds to maintain the roads properly. This delays maintenance or requires cheaper treatments that are temporary or short-lived. This creates a vicious cycle in that the next year’s budgetary requirements increase as road deteriorates faster as a result of the lack of timely maintenance and appropriate treatment. It is therefore important to iso-late the maintenance budget from the appropriation process by reforming the fund sourc-ing and funds appropriation. More concretely, appropriated maintenance funds from the state budget should be minimized while dedicated and direct taxes and user fees should become primary sources. Along with this, institutional capacity and accountability should be developed, including technical staff, database, and performance standards.
4.27 The institutionalization of the road maintenance funds has been under discussion for a while, but so far it has not been realized. However, there is a renewed sense of ur-gency to address this with the anticipated high growth in heavy-vehicle traffic.

The Comprehensive Study on the Sustainable Development of Transport System in Vietnam (VITRANSS 2) MAINTEXT
4-8
(4) Quality of Road Construction
4.28 Another factor is the poor construction quality of roads. With the lack of stringent quality control, contractors tend to sacrifice quality in order to lower their bidding prices under a competitive tender. The resulting poor road quality would therefore necessitate higher maintenance costs. Reforms in the tender process and quality control should be made in order to make contractors more accountable for the quality of their work.
(5) Improvement of Long-distance Bus and Truck Transportation Services
4.29 The quality of long-distance passenger and goods services has been substandard, Vehicles and on-board amenities require substantial improvements. In addition, roadside facilities are not adequate. While there are many commercial facilities, such as restau-rants, coffee shops, fueling stations, and hotels, these are scattered along the roads in an unorganized manner, thereby failing to provide comfort and convenience to both passen-gers and drivers. The development of roadside stations (michinoeki)3 as an integral part of road facilities needs to be considered to enhance safety and comfort of road users, and at the same time promote local economic development.
4.30 Roadside stations can contribute to road traffic safety by providing drivers with sufficient spaces for rest/relaxation to alleviate their fatigue. They also provide better and reliable services for road users such as drivers/passengers of long-distance bus trans-ports which are currently being operated on many routes. From the socio-economic view-point, residents living around roadside stations will have opportunities to sell local prod-ucts directly to consumers coming from various cities, districts and villages. Further, road-side stations can provide visitors with useful information about sightseeing of local areas where roadside stations locate, and such information will encourage them to visit neigh-boring tourist spots.
(6) Segregation of Long-distance Heavy-vehicle Traffic and Local Traffic
4.31 As mentioned above, heavy-vehicle traffic on major roads is on the rise. This am-plifies worsening traffic safety and environmental conditions, especially in urban areas.
(7) Impact of Cross-border Transportation
4.32 With the growth of the globalizing economy, cross-border traffic has been growing and is expected to increase further in the future. As Vietnam shares land borders with China, Laos, and Cambodia, the impacts of cross-border traffic have to be carefully stu-died and considered in road transportation development.
3) Scale of Road Infrastructure
4.33 Over the last decade, Vietnam has invested heavily in road network development - thus expanding the total length from 225 thousand kilometers in 1999 to 252 thousand kilometers in 2006. However, motorization grew faster at nearly 20% a year – fuelled by rising incomes. As a consequence, traffic congestion has spread rapidly along main corri-dors, especially in the vicinity of large urban areas like Hanoi and HCMC and the gateway port cities.
4.34 The network grew by 1.6% p.a. from 1999 to 2006, and at the same time the paved ratio significantly improved. In particular, the primary network paved ratio increased
3 The JICA-funded “Master Plan Study on Development of Roadside Stations” is currently undertaken under the
VRA.

The Comprehensive Study on the Sustainable Development of Transport System in Vietnam (VITRANSS 2) MAINTEXT
4-9
from 53% to 74%, largely as a result of the concentration of funding in the road subsector in the last decade. Still, the pavement conditions of roads has a long way to go to be con-sidered good, especially since the overall network is only 32% paved due to the significant share of local roads that have remained unpaved. Even the pavement conditions of na-tional roads are not satisfactory, with only National Highway (NH) No.1 and the roads around the primary cities of Hanoi and HCMC being in good condition.
Table 4.2.2 Roads in Vietnam
Management Category Year
Total Length (km)
Length by Pavement Type (km) Asphalt
Concrete Cement
Concrete DBST Gravel Earth Other
National Road 1999 15,520 5,354 94 5,828 3,178 - - 2006 17,295 7,750 344 6,447 2,854 - -
Provincial Road 1999 18,344 829 157 5,609 7,309 - - 2006 23,138 3,474 701 11,030 4,816 3,073 44
District Road 1999 37,437 - - - - - - 2006 54,962 1,762 2,581 10,992 34,897 77,261 3,601
Commune Road 1999 134,463 - - - - - - 2006 141,442 1,616 18,442 9,226 34,897 77,261 -
Urban Road 1999 5,919 2,297 - 3,622 - - 2006 8,536 2,465 776 2,750 976 1,568 -
Other Road 1999 5,451 - - - - - - 2006 6,414 - 160.4 547 2,593 2,800 -
Total 1999 224,639 - - - - - 2006 251,787 16,967 23,005 40,992 62,018 104,816 3,644
Source: Vietnam Road Administration.
4.35 There are 7,200 bridges along the primary road network with less than 80% con-sidered in good condition.4 Thirty percent (30%) of the bridges need to be upgraded and rehabilitated and 20% are narrow. There are 2,200 and 630 temporary bridges along na-tional roads and provincial roads that that have low permissible loads. There are also 500 points along the primary network that are impassable during the rainy season.
4.36 Compared to other countries (selected samples shown in Table 4.2.3), Vietnam’s road network is relatively dense. Its weak aspect is its low ratio of primary roads whose capacity is limited by the fact that nearly all of them are only two lanes wide. The second-ary road network is also sparse - the provincial road constituting the secondary road net-work is only 30% longer than the primary road network. In most developed countries, the ratio of secondary road network to primary is about 2 to 1. The quality of the secondary road network is also poor with 24% of the network is earth or gravel surfaces. These con-ditions limit accessibility and hamper intra-provincial traffic, and tend to concentrate de-mand on national roads. This can be observed from the unusually high presence of mo-torcycles on national roads.
4 Ibid.

The Comprehensive Study on the Sustainable Development of Transport System in Vietnam (VITRANSS 2) MAINTEXT
4-10
0.053
0.03 0.03
0.11
0.000.01
0.10
0.00
0.14
0.03
0.19
0.05
0.12
0.15
0.11
0.16
0.10
0.32
0.00
0.04
0.18
0.01
0.25
0.15
0.38
0.14
0.24
0.35
0.0 00
0.0 50
0.1 00
0.1 50
0.2 00
0.2 50
0.3 00
0.3 50
0.4 00
0.4 50
Vietnam
Laos
Cambodia
Th ailand
Malaysia
Indon
e sia
Philippi n
esChina
Japan
USA UK
France
Germany Ita
ly
R oad den s ity(km /km 2)
R oad den s ityinde x
N/A
Table 4.2.3 Comparison of Highway Networks
Item Vietnam Philippines Thailand Japan UK Area (000km2) 329 299 514 377 244 Population (million) 83 92 63 127 60 Registered vehicles (000) 973 2,466 8,671 75,680 30,518 Road Network (000km) 256 202 194 1,192 387 National Road (000km) 17 30 57 54 46 Expressway (km) 5,500 (in 2030) 240 313 7,383 3,523 Road Network Density (km/km2) 0.78 0.67 0.38 3.16 1.58 National Road Density (km/km2) 0.05 0.10 0.11 0.14 0.19 Expressway density (km/mil. veh.) n/a 97 36 97 115
Sources: The World Factbook, CIA; World Road Statistics, IRF 2006; MLIT, Japan (2006); Roads in the Philippines, JICA (2003); MOFA, Japan; VRA.
Figure 4.2.1 International Comparison of Road Density (Primary Roads Only)
Source: VITRANSS2 Study Team
4.37 The unbalanced structure of Vietnam’s road network could get worse, if Vietnam proceed with its expressway development plan, which is judged to be disproportionately expansive compared to the needs of Vietnam. The porposed expressway network of 5,500 km in 2030 is equivalent to about 1,100 vehicles/km. For comparison, the current ratio for Japan is 10,300 vehicles/km of expressway, while Thailand and Malaysia is 27,000 vehicles/km and 9,900 vehicles/km, respectively.
Table 4.2.4 Comparison of Highway Hierarchy (Composition of Network)
Vietnam Japan UK Germany France Italy Area (000 km2) 329 377 244 357 547 301 Population (million) 83 127 61 82 64 58 Primary/National Road (%) 7 5 13 23 4 11 Secondary/Provincial Road (%) 9 11 30 38 38 25 Local Road (%) 84 84 58 40 58 64
Sources: The World Factbook, CIA; World Road Statistics, IRF (2006); MLIT, Japan (2006); MOFA,Japan; VRA.
4.38 The density of the local network is relatively good, but the quality of local road network is very poor, with 80% being either earth or gravel roads. It is however not to be taken that all local roads need to be paved, but at least district roads should have a high ratio of paved surface (now at around 86% are earth or gravel roads). Vietnam’s Rural Access Index has improved considerably – from 76% in 2002 to 84% in 2004 – surpass-

The Comprehensive Study on the Sustainable Development of Transport System in Vietnam (VITRANSS 2) MAINTEXT
4-11
ing the global average of 69%. Still, a number of communes remains inaccessible by ve-hicles (i.e. nearly 300 communes or 3%, as of 2006).
4) Usage of Roads
4.39 Vietnamese roads are unsafe, as noted in the road accident statistics comparison with other countries shown in Table 4.2.5. Recent efforts have tempered the accident rate, but fatalities are still abnormally high. Driver error is the main cause (approx. 75% of all cases), where speeding is the most frequent contributory factor. The mixture of 2-wheel and 4-wheel traffic is also a contributor - wherein dangerous maneuvers by either heavy vehicles or motorcycles lead to fatalities.
Table 4.2.5 Comparison of Road Traffic Accidents
Country Number of Accidents
Fatalities Number Per 10,000 Population Per 10,000 Vehicles
Vietnam (2006) 14,727 12,757 1.5 6.5 Vietnam (2000) 23,327 7,924 1.0 11.8 Indonesia 13,000 9,500 0.5 5.2 Malaysia 250,417 6,035 2.6 5.7 Philippines 10,595 969 0.1 2.8 Thailand 67,800 12,040 2.0 6.1 Japan 917,609 9,066 0.7 1.0
Sources: NTSC and GRSP Conference Report (2002).
4.40 While growth in the road network has been appreciable, road traffic is increasing at such a rapid pace as evidenced by growing vehicle ownership, 20.1% p.a. for motor-cycles and 12.3% p.a. for automobiles. The growth in automobiles is especially alarming as they take up much more road space and impact road capacity as a result of on-street parking. It is therefore not surprising that congestion levels have significantly risen not on-ly in urban centers but also in major inter-city links, such as NH1, NH5, NH18, and others (see Figure 4.2.2). Furthermore, there has been significant growth in truck traffic, contri-buting significantly not only to congestion but also to accelerated deterioration of pave-ments. In the meantime, maintenance budget is considered insufficient—estimated to be only 40% of ideal—to cover the full maintenance requirements.

The Comprehensive Study on the Sustainable Development of Transport System in Vietnam (VITRANSS 2) MAINTEXT
4-12
‐
5,000
10,000
15,000
20,000
25,000
30,000
35,000
1999 2005 2008
NH5 @ Ha Phong (pcu/day)
BC
MC
Truck
Bus
Car
‐
5,000
10,000
15,000
20,000
25,000
30,000
1999 2005 2008
NH1 @ Thanh Hoa (pcu/day)
BC
MC
Truck
Bus
Car
‐
2,000
4,000
6,000
8,000
10,000
12,000
1999 2005 2008
NH1 @ TT Hue (pcu/day)
BC
MC
Truck
Bus
Car
‐
5,000
10,000
15,000
20,000
25,000
30,000
35,000
40,000
1999 2005 2008
NH51 @ BR Vung Tau (pcu/day)
BC
MC
Truck
Bus
Car
‐
5,000
10,000
15,000
20,000
25,000
1999 2005 2008
NH1 @ Binh Thuan (pcu/day)
BC
MC
Truck
Bus
Car
‐
10,000
20,000
30,000
40,000
50,000
60,000
70,000
1999 2005 2008
NH1 @ Long An (pcu/day)
BC
MC
Truck
Bus
Car
Figure 4.2.2 Truck Traffic on Selected Road Sections
Sources: 1999 data, VITRANSS; 2005 data (VITRANSS Follow-up study); and 2008 (VITRANSS 2).
4.41 Along with accelerated motorization, traffic safety has become a key issue. While accidents and injuries peaked in 2002 and have declined since then, the number of fatali-ties has continued to increase and is at 12,000 per year at present. The implementation of the motorcycle helmet policy since December 2007 has been laudable and should be able to help improve the situation, as motorcycle users are a high-risk group. The worsening environment is another negative social impact of motorization that needs to be considered.
4.42 There are 1,050 registered companies involved in the road transportation industry. Most of them are small to medium scale companies. The privatization of the trucking in-dustry has progressed so much that the role of state-owned enterprises (SOEs) has been reduced to negligible levels, creating a highly competitive trucking market. While competi-tion is a key factor to enhance responsiveness to the market and to lower costs, there is a danger that over-competition will stifle the modernization of the truck fleet.
4.43 The bus industry is likewise very competitive and the services are quite satisfactory with segmentation of the market, as some companies offer high levels of service at corres-pondingly higher prices, while some offer lower quality of services at much lower prices. It is also notable that the role of the state in the provision of bus services has declined in favor of private sector operators, reflecting an increasingly more vibrant market-oriented industry.
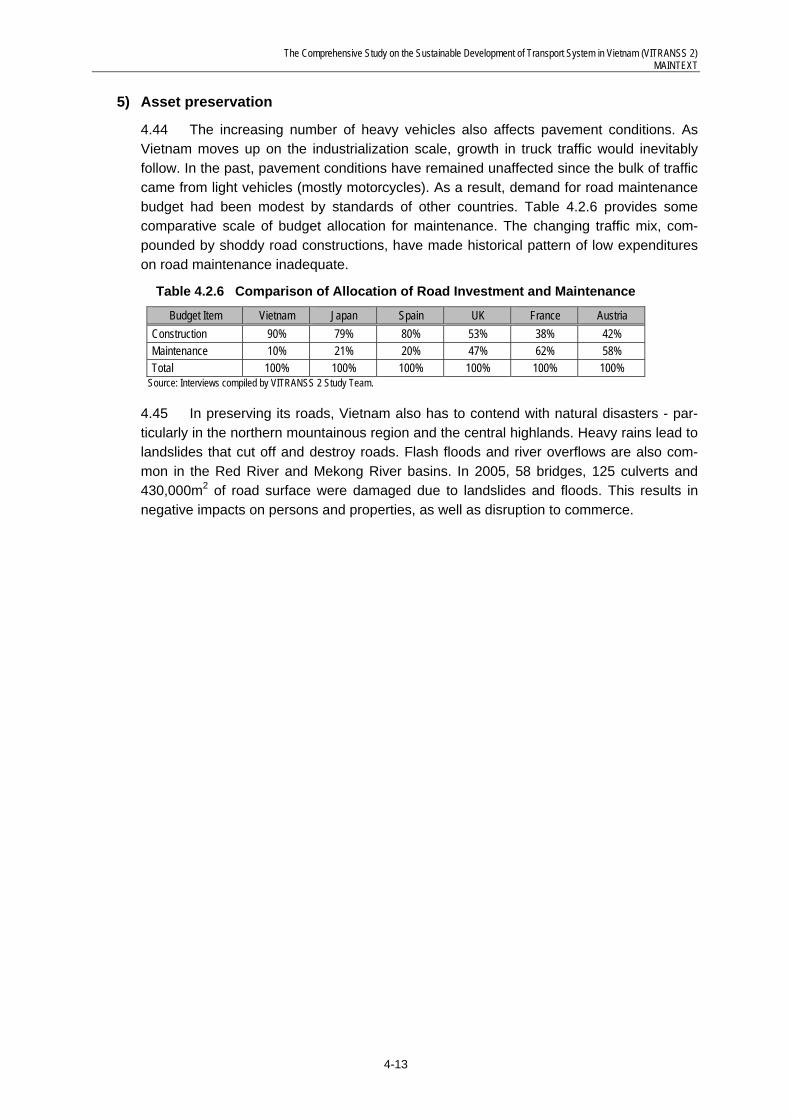
The Comprehensive Study on the Sustainable Development of Transport System in Vietnam (VITRANSS 2) MAINTEXT
4-13
5) Asset preservation
4.44 The increasing number of heavy vehicles also affects pavement conditions. As Vietnam moves up on the industrialization scale, growth in truck traffic would inevitably follow. In the past, pavement conditions have remained unaffected since the bulk of traffic came from light vehicles (mostly motorcycles). As a result, demand for road maintenance budget had been modest by standards of other countries. Table 4.2.6 provides some comparative scale of budget allocation for maintenance. The changing traffic mix, com-pounded by shoddy road constructions, have made historical pattern of low expenditures on road maintenance inadequate.
Table 4.2.6 Comparison of Allocation of Road Investment and Maintenance
Budget Item Vietnam Japan Spain UK France Austria Construction 90% 79% 80% 53% 38% 42% Maintenance 10% 21% 20% 47% 62% 58% Total 100% 100% 100% 100% 100% 100%
Source: Interviews compiled by VITRANSS 2 Study Team.
4.45 In preserving its roads, Vietnam also has to contend with natural disasters - par-ticularly in the northern mountainous region and the central highlands. Heavy rains lead to landslides that cut off and destroy roads. Flash floods and river overflows are also com-mon in the Red River and Mekong River basins. In 2005, 58 bridges, 125 culverts and 430,000m2 of road surface were damaged due to landslides and floods. This results in negative impacts on persons and properties, as well as disruption to commerce.

The Comprehensive Study on the Sustainable Development of Transport System in Vietnam (VITRANSS 2) MAINTEXT
4-14
4.3 Railway
1) Government Plans and Decisions
4.46 The Vietnam Transport Development Strategy 2020 prepared by the MOT pro-posed operational speeds of 80 km/h and 120 km/h or higher for freight and passengers, respectively, particularly for the Hanoi – Saigon Line. The first phase of the plan entails building an express railway between Hanoi and Vinh, and between HCMC and Nha Trang by 2015 and the completion of the north-south backbone by 2020 (with 1,435mm gauge). The plan also entails coordination with regional transportation plans, especially those link-ing with China, through the improvement of related lines.
4.47 In the Development of Vietnam Railways Transport Sector 2020 prepared by the Vietnam Railway Corporation (VNRC), it is proposes to, among others, double-track and electrify the Hanoi–Vinh and HCMC–Nha Trang sections. Moreover, a high-speed, 1,435mm track to reduce travel time between Hanoi and HCMC to only 10 hours. Interna-tional connectivity is likewise emphasized.
4.48 In 412/QD-TTg (April 2007), railway development projects for state budget were laid out which include the following projects:
(i) Hanoi–HCMC Express Rail; (ii) Improvement and upgrading of Yen Vien–Lao Cai Line; (iii) Development of Lao Cai–Hanoi–Hai Phong Line; (iv) Upgrading of Dong Dang–Hanoi Line; and (v) Development of aluminum transportation.
4.49 In addition, in 1290/QD-TTg (September 2007), the investment plan for private sector participation includes the following:
(i) Lao Cai–Hanoi–Hai Phong Line; (ii) Da Lat–Thap Cham Tourist Line; (iii) Bao La–Phan Thiet Line; (iv) Hoa Hung–Vung Tau Line; (v) Sai Gon–Loc Ninh Line; (vi) Hanoi–Ha Dong Line; (vii) Hanoi–San Bay Noi Bai Line; (viii) Hanoi–Lang Hoa Lac Line; (ix) Dak Nong (aluminium mine site)–Phan Thiet Line; (x) Saigon–My Tho Line; and (xi) Hai Van Tunnel.
4.50 Key planning directions in the above document are the following:
(i) Promote high-speed service along the north-south line; (ii) Exploit suburban passenger train service, where needed; (iii) Replan freight stations and consider exploiting container transportation; and (iv) Develop tourism-related services.
2) Key Development Issues
4.51 Despite being around for more than a century, railways are being used at only 60–70% of the capacity. Poor and outdated railway infrastructure is a major cause of its low utilization. Sections with sharp curves, high gradient, and ageing bridges and culverts still

The Comprehensive Study on the Sustainable Development of Transport System in Vietnam (VITRANSS 2) MAINTEXT
4-15
remain. Railway facilities, such as rail track, earthworks, signals and communication sys-tems, are in poor condition and outdated. Similarly, locomotives and wagons have low transportation capacities, are old-fashioned, have inconsistent specifications, and most of them are over 20 years old.
(1) Market Positioning
4.52 Railways have been identified to provide social services with fares at 80% of bus fares in the case of passengers. In the case of freight, it has so far concentrated on the movement of industrial and bulk cargo. This traditional role, while important, needs to be reexamined as to the future of the railway system in the country. For the Hanoi–Saigon Line, in the case of passenger service, it is practical to rethink the role of rail and it may be best to relegate social transportation services to the bus industry, where the market condi-tions will ensure that low-fare services suited to low-income markets will continually be provided. Meanwhile, rail services have the opportunity to service the middle to higher-income market through higher speeds and more comfortable accommodation. It is not ef-ficient if the system will have to service both markets, as it will lead to the suboptimal op-eration of the higher level of the service market (see Table 4.3.1).
Table 4.3.1 Market and Role of Railway by Line
Line Present Market/Role Future Market/Role
Current Status Alternative Hanoi – Saigon • Low cost passenger
• Low cost freight • Low cost passenger • Low cost freight
• Mid- to high-cost passenger • Low-cost freight • Mid- to long-distance container
Hanoi – Hai Phong
• Low cost passenger • Low cost freight
• Low cost passenger • Low cost freight
• Inter-city commuter train (Hanoi – Hai Duong – Hai Phong)
• Low cost freight • Port access
Hanoi – Lao Cai • Low cost passenger • Tourism service • Low cost freight
• Low cost passenger • Tourism service • Low cost freight
• Inter-city commuter train (Hanoi – Viet Tri Bai)
• Tourism service • Low cost freight • Regional connection
Hanoi – Lang Son • Low cost passenger • Low cost freight
• Low cost passenger • Low cost freight
• Inter-city commuter train (Hanoi – Bac Giang)
• Low cost freight • Regional connection
Hanoi – Ha Long • Low cost freight • Low cost freight • Low cost freight • Tourism service
Hanoi Ring Rail • Low cost freight • Bypass
• Low cost freight • Bypass
• Low cost freight • Bypass (complete)
Source: VITRANSS 2 Study Team.
4.53 For other lines, the potential for the lines to be used as commuter rail lines can be explored, especially in the northern region. Key cities in the periphery of Hanoi and around Hai Phong create a huge potential demand for passenger movement and to rele-gate this demand to road transportation—whether public or private—would create conges-tion along the primary radial roads and virtually create barriers for the cities to integrate seamlessly. Exploitation of the existing radial lines in the northern region for inter-city commuter services with higher frequency could be an efficient way to utilize the existing lines. Development of railway terminals/stations also needs attention in parallel to these

The Comprehensive Study on the Sustainable Development of Transport System in Vietnam (VITRANSS 2) MAINTEXT
4-16
activities (see Figure 4.3.1). Likewise, around HCMC, commuter service may be devel-oped coupled with improvement of tracks, terminals and stations.
4.54 Concentration of freight service in the bulk goods market results in low rates and ultimately low revenues. While railway operation has its inherent comparative disadvan-tages, i.e. the need to provide access-trucking services makes it uncompetitive for short to mid-distance transportation, it does have enough economy of scale to be competitive in long-haul transportation such as between Hanoi and HCMC (and even with Danang). Demand at the moment between the two cities is limited in volume, but the industrializa-tion of the northern focal economic zone (NFEZ) and the southern focal economic zone (SFEZ) will provide the future volume of higher-valued goods to be transported from the north to the south of the country. Currently, rail provides four days (unguaranteed) tran-sit by rail while trucking provides three days (guaranteed). Thus it is clear that trucking is the preferred mode to transport higher-valued goods between Hanoi and HCMC (see Figure 4.3.2).
4.55 For the market repositioning of passenger and freight operations, performance benchmarks need to be set and met by the appropriate technology and investment.
Figure 4.3.1 Cities in Railway Catchments in the Hanoi Metropolitan Region
Source: The Comprehensive Urban Development Programme in Hanoi Capital City (HAIDEP) (2007).
Rail Cities in HMR
Population (000) Growth (99-05) 1999 2005
Viet Tri 131.5 138.6 1.3% Vinh Yen 70.6 79.1 2.7% Bac Ninh 75.6 82.9 2.3% Bac Giang 94.0 101.7 2.0% Hai Duong 128.7 133.9 1.0% Hanoi 2,685.0 3,149.8 2.7%

The Comprehensive Study on the Sustainable Development of Transport System in Vietnam (VITRANSS 2) MAINTEXT
4-17
Figure 4.3.2 Railway Traffic by Commodity
Source: Vietnam Railway.
(2) Coordination with Regional Railway Plans
4.56 Vietnam railways have to meet the domestic demand while coordinating with the Singapore – Kunming Railway Link (SKRL) which aims to connect the Greater Mekong Subregion (GMS) countries by rail. The Vietnam network is especially critical for the SKRL because it is the bridge to the Chinese railway network. Issues in the consistency of stan-dards are still very fuzzy; for instance, the Chinese network connections are using stan-dard gauge, or in the case of the link going to Kunming, it is in the process of converting to standard gauge. On the other hand, the Cambodian, Thai, and Malaysian networks util-ize the narrow gauge. While there are plans in Thailand and Malaysia to move towards the standard gauge system, the timing is not clear. Meanwhile, the Cambodian network remains to be of narrow gauge.
4.57 From the point of view of Vietnam, it may have to sacrifice regional connectivity over its own interest. Thus, the basic strategy would be to design a national network on the basis of domestic requirement, while border links will have to follow the regional stan-dards. In this way, the focus of the coordination with regional railway plans from the point of view of Vietnam is to ensure the smooth transition at the border points such as the adoption of a dual gauge system as well as the provision of efficient transfer points and consolidation centers. Nevertheless, the future direction of the SKRL system would have to be further examined so that the Vietnam railway can best respond to its commitments in the region while incorporating the domestic requirements.

The Comprehensive Study on the Sustainable Development of Transport System in Vietnam (VITRANSS 2) MAINTEXT
4-18
Figure 4.3.3 Alignment of the Singapore–Kunming Railway Line
Source: ASEAN Secretariat.
(3) Practical Railway Development Strategy
4.58 The nature of railway services would dictate the level of improvement in the infra-structure. The current railways and facilities are not capable of providing higher levels of service, even if the railway operating company desires to provide such services. The coordination of the types of service to be offered by railway operators and the railway in-vestment is crucial. However, any railway investment is a particularly expensive undertak-ing, so that balancing the need for higher levels of service has to consider a practical phasing of the development and the prudent utilization of existing assets.
(4) Strengthening of Services and Related Business
4.59 Institutionally, the Vietnam railway system has been vertically segregated, with railway operations handed over to a public corporation. While it is a positive step towards instilling market responsiveness to the sector, there is a need to further stregthen market incentives through the following measures:
(i) Less government interference in, and greater independence of, management and staffing;
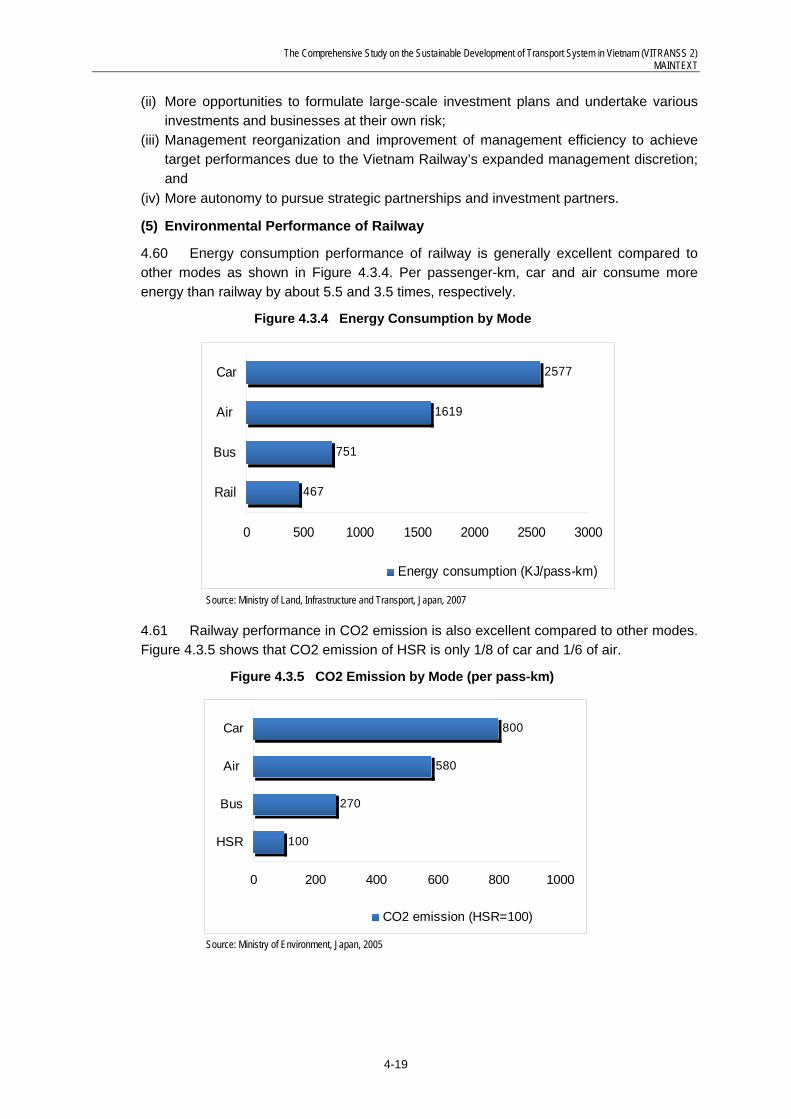
The Comprehensive Study on the Sustainable Development of Transport System in Vietnam (VITRANSS 2) MAINTEXT
4-19
(ii) More opportunities to formulate large-scale investment plans and undertake various investments and businesses at their own risk;
(iii) Management reorganization and improvement of management efficiency to achieve target performances due to the Vietnam Railway’s expanded management discretion; and
(iv) More autonomy to pursue strategic partnerships and investment partners.
(5) Environmental Performance of Railway
4.60 Energy consumption performance of railway is generally excellent compared to other modes as shown in Figure 4.3.4. Per passenger-km, car and air consume more energy than railway by about 5.5 and 3.5 times, respectively.
Figure 4.3.4 Energy Consumption by Mode
467
751
1619
2577
0 500 1000 1500 2000 2500 3000
Rail
Bus
Air
Car
Energy consumption (KJ/pass-km)
Source: Ministry of Land, Infrastructure and Transport, Japan, 2007
4.61 Railway performance in CO2 emission is also excellent compared to other modes. Figure 4.3.5 shows that CO2 emission of HSR is only 1/8 of car and 1/6 of air.
Figure 4.3.5 CO2 Emission by Mode (per pass-km)
100
270
580
800
0 200 400 600 800 1000
HSR
Bus
Air
Car
CO2 emission (HSR=100)
Source: Ministry of Environment, Japan, 2005
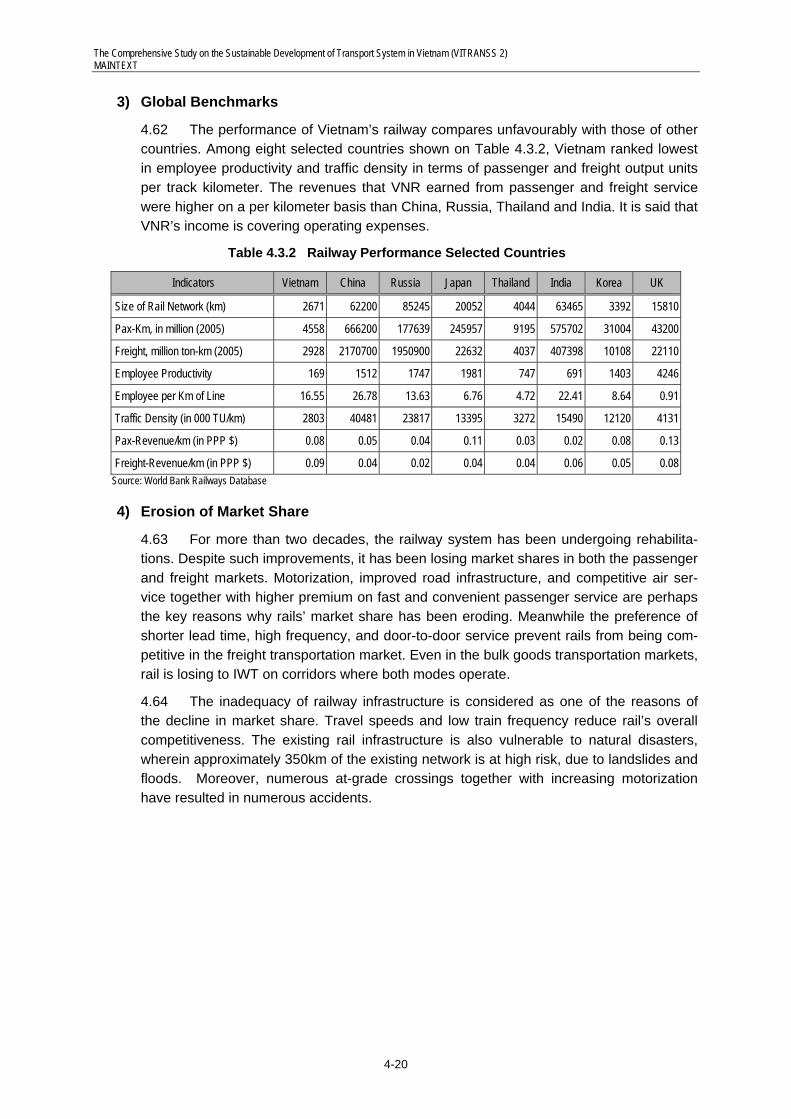
The Comprehensive Study on the Sustainable Development of Transport System in Vietnam (VITRANSS 2) MAINTEXT
4-20
3) Global Benchmarks
4.62 The performance of Vietnam’s railway compares unfavourably with those of other countries. Among eight selected countries shown on Table 4.3.2, Vietnam ranked lowest in employee productivity and traffic density in terms of passenger and freight output units per track kilometer. The revenues that VNR earned from passenger and freight service were higher on a per kilometer basis than China, Russia, Thailand and India. It is said that VNR’s income is covering operating expenses.
Table 4.3.2 Railway Performance Selected Countries
Indicators Vietnam China Russia Japan Thailand India Korea UK
Size of Rail Network (km) 2671 62200 85245 20052 4044 63465 3392 15810
Pax-Km, in million (2005) 4558 666200 177639 245957 9195 575702 31004 43200
Freight, million ton-km (2005) 2928 2170700 1950900 22632 4037 407398 10108 22110
Employee Productivity 169 1512 1747 1981 747 691 1403 4246
Employee per Km of Line 16.55 26.78 13.63 6.76 4.72 22.41 8.64 0.91
Traffic Density (in 000 TU/km) 2803 40481 23817 13395 3272 15490 12120 4131
Pax-Revenue/km (in PPP $) 0.08 0.05 0.04 0.11 0.03 0.02 0.08 0.13
Freight-Revenue/km (in PPP $) 0.09 0.04 0.02 0.04 0.04 0.06 0.05 0.08 Source: World Bank Railways Database
4) Erosion of Market Share
4.63 For more than two decades, the railway system has been undergoing rehabilita-tions. Despite such improvements, it has been losing market shares in both the passenger and freight markets. Motorization, improved road infrastructure, and competitive air ser-vice together with higher premium on fast and convenient passenger service are perhaps the key reasons why rails’ market share has been eroding. Meanwhile the preference of shorter lead time, high frequency, and door-to-door service prevent rails from being com-petitive in the freight transportation market. Even in the bulk goods transportation markets, rail is losing to IWT on corridors where both modes operate.
4.64 The inadequacy of railway infrastructure is considered as one of the reasons of the decline in market share. Travel speeds and low train frequency reduce rail’s overall competitiveness. The existing rail infrastructure is also vulnerable to natural disasters, wherein approximately 350km of the existing network is at high risk, due to landslides and floods. Moreover, numerous at-grade crossings together with increasing motorization have resulted in numerous accidents.

The Comprehensive Study on the Sustainable Development of Transport System in Vietnam (VITRANSS 2) MAINTEXT
4-21
Figure 4.3.6 Market Share of Railways
Sources: VRA and VITRANSS transportation database. Note: Total demand is estimated and interpolated based on VITRANSS surveys in 1999, 2005, and 2008.
5) Performance in Plan Execution
4.65 VNR has plans to increase its operating speed, modernize its signalling system, upgrade its rolling stock, shift to standard gauge, or a combination thereof. VNR also has plans for a high-speed rail system. However, little has been achieved because of funding constraint. Historically, rail managed to secure only about 2% share of the total invest-ments going into transportation. But even when money was made available (e.g. from an ODA source), project implementation has been hindered due to various reasons. Re-structuring in accordance with the European business model where infrastructure is sepa-rated from rail service provisions was adopted more than two years ago, but implementa-tion is yet to materialize.

The Comprehensive Study on the Sustainable Development of Transport System in Vietnam (VITRANSS 2) MAINTEXT
4-22
4.4 Inland Waterway
1) Government Plans and Decisions
4.66 The Development Plan for Vietnam Inland Waterway Sector to 2020 was ap-proved in 2000, and is now being revised by the Vietnam Inland Waterway Administration (VIWA), in cooperation with the MOT’s Transport Development and Strategy Institute (TDSI). Main points of the revised plan are included in the Vietnam Development Strategy up to 2020 (2007). The master plan sets a scenario wherein pull-propel cargo vessels of 1200–1600tons or bigger, self-propelled cargo vessels of 200–500tons, and sea-river car-go vessels of 1000–2000tons will be introduced in the Red River Delta Region. Meanwhile, in the Mekong delta region, pull-propel cargo vessels of 600–1200T or bigger, self-propelled cargo vessels of 200–500tons, sea-river vessels of 1000–2000tons, and con-ventional passenger vessels of 50–120 seats, as well as coastal and island passenger vessels of 100–120 seats are proposed.
4.67 On the basis of the above, the following were identified as priority projects:
(a) North IWT Channel System Improvement (i) Quang Ninh–Hanoi–Vie Tri (ii) Quang Ninh–Ninh Binh (crossing Dao River) (iii) Lach Giang–Hanoi (iv) Viet Tri–Tuyen Quang (v) Red River Crossing (Hanoi) (vi) Viet Tri–Yen Bai–Lao Cai
(b) South IWT Channel System Improvement (i) Saigon – Ha Tien (ii) Saigon – Ca Mau (iii) Tien River (iv) K. Phuoc Xuyen – 4Bis – K.2
(c) IWT Port Improvements (9 each in the north and the south).
2) Key Development Issues
(1) Focus on Core Competitiveness of IWT
4.68 The core advantage of inland waterway transportation is in the transportation of high-volume, low-cost products in bulk, particularly coal, ore, and aggregates. However, the IWT system in Vietnam does not have enough length and coverage to be able to compete against road transportation, especially when the highway network is further de-veloped. Therefore, the IWT system should enhance its service by further improving cost effectiveness. There are several ways to proceed with this. First is to use bigger vessels, although the natural conditions of the river system in Vietnam do not allow this. Another way is to promote the use of tow barges. Currently, particularly in the north, the use of self-propelled barges is the norm due to the latter’s suitability to the channel. In the case of the south, more diversified vessels are observed, which is reflective of the much more favorable channel conditions in the south. Thus operators have more flexibility in the se-lection of vessels to use. The factors that hinder the use of tow-barges barges need to be further examined and rectified, in particular the bend curvatures, clearances, and depths of channels. Consistency in standards is critical, thus a systematic and operation-oriented approach to channel improvement is recommended.

The Comprehensive Study on the Sustainable Development of Transport System in Vietnam (VITRANSS 2) MAINTEXT
4-23
4.69 Passenger service is a losing cause for inland waterway transportation, especially for inter-city transportation and when the road network is further improved. Thus it is best to concentrate resources on further promoting bulk transportation.
Figure 4.4.1 Vessel Traffic at Key Points of Inland Waterway Routes in Northern Vietnam
Source: VITRANSS 2 Survey, 2008.
Figure 4.4.2 Vessel Traffic at Key Points of Inland Waterway Routes in Southern Vietnam
Source: VITRANSS 2 Survey, 2008.

The Comprehensive Study on the Sustainable Development of Transport System in Vietnam (VITRANSS 2) MAINTEXT
4-24
(2) Promotion of Sustainable Channel Maintenance
4.70 To sustain the quality of service, it is important to have the sufficient funds to maintain channels and navigational aids. Currently, funds for channel maintenance are derived from state fund. While it may still be needed, it is not only equitable but in the in-terest of all players to introduce a channel fee to generate supplementary funds for chan-nel maintenance. Along with this, the institutional capacity to be able to handle this fund to maintain the channel needs to be established. Performance benchmarks, accountability, and technical capability need to be put in place. The issue of collecting user fees for channel maintenance has been piloted three years ago but has failed. For example, there are 5 million registered tonnage of IWT vessels, excluding passenger vessels with an av-erage of 70tons per vessels. By paying VND 20,000 per registered ton (average of VND 1.4 million/vessel), VIWA could increase its annual budget by 50%.
(3) Strengthening of Vessel Registration
4.71 It is presently difficult to know the number of IWT vessels operating in Vietnam due to weak registration and enforcement system. This makes it difficult to enforce stan-dards in safety and navigation. The vessel registry system could also be used to generate funds for channel maintenance, as annual fees being part of the registration process. The registration system could also be used as an incentive/disincentive mechanism to pro-mote fleet renewal and modernization.
(4) Strengthening of Interface between Inland Waterway and Other Modes
4.72 Inland waterway transportation primarily handles specialized bulk goods, particu-larly coal, ore, and aggregates. However, it also carries a significant volume of goods for distribution such as cement, fertilizer, and others. These goods are first brought in bulk by inland waterway vessels to a port for distribution. It is strategic for the subsector to contin-ue to be compe- titive in this service, not just for its viability, but also to discourage the use of highway alternatives, which would cause congestion. The inherent disadvantage of in-land waterway transportation is the need for double handling; but this can be countered if the subsector can offer better interface with other modes, particularly with trucking. It na-turally starts with the improvement of cargo handling at ports. Another critical aspect is the improvement of warehouses and warehouse services. Goods are delivered from the fac-tory to the ports, which become the point to carry inventory. Being closer to the market, these warehouses can enhance delivery response and it will allow IWT to carry the goods cheaply in large lots, while still being able to deliver to customers in small lots and high frequency. It is therefore strategic for IWT ports to examine the potential of warehousing function as part of their business model, along with the improvement of cargo handling.
(5) Cross-border Transportation Opportunities via Inland Waterway
4.73 The Phnom Penh–HCMC service via the Mekong River is the most promising cross-border link for IWT and is currently being served by three companies utilizing 50 to 150 teu vessels with one-way journey taking two to three days at a freight rate of USD250 per teu. This is very competitive over the coastal route. One operator is said to haul 800 to 900 teu/month. Based on the outlook of future demand, the issue here is only a matter of timing of investment in the further enhancement of the channels.
4.74 A more difficult issue is the utilization of the Hong River as potential cross-border link to China. There is big potential upside of this market. Unfortunately, the Hong River has a lot of drops that at its natural state could not cater to IWT vessels. The development

The Comprehensive Study on the Sustainable Development of Transport System in Vietnam (VITRANSS 2) MAINTEXT
4-25
of locks to allow vessels to navigate across drops have been proposed, but it is critical to examine the market potential more closely to ensure that investments are not wasted.
(6) Market Share
4.75 The published statistics on IWT traffic showed steady increase in cargo but erratic passengers volumes from 1995 to 2006 (See Figure 4.4.3) on a nationwide basis. Despite increasing competition from road transportation, the IWT managed to post an annual rate of increase of 9.4% since 1995 for freight. Passenger volumes trend is unstable and it is diffi-cult to see a trend, other than to point that the long-term trend is a stagnation of demand, al-though since 2001 demand has increased to reach 179 million passengers in 2006.
Figure 4.4.3 Cargo and Passenger Volumes
Source: Prepared from presentation by Dr. Suu, Director General of VIWA at Water summit in Beppu Dec. 2007
4.76 IWT is successful in holding maintaining its market shares – at about 22% for freight and 17% for passengers. When trip-lengths are taken into account, however, the overall share of the passenger transportation market is small, at about 6%, and declining. In freight, IWT carried much more than official statistics would imply because of non-reporting from non-registered ports and river landings, as well as from private ports whose bulk cargo dominate river traffic. VITRANSS 2 has estimated the share of IWT at 28% on a ton-km basis, and 46% on tonnage basis, in 2008.
4.77 Using the low figure, it was calculated that the overall productivity of IWT is 2,866tons per thousand kilometers of national waterway, which is more than twice the throughput of 1,022 tons for national roads and the 1,290tons for railways. Combining passengers and freight turnover, the performance index for IWT is 3.3 transportation units per km – lower than the 3.7 for roads but higher than rail’s 2.9.
4.78 In terms of regional distribution, the southern region accounted for nearly 60% of the country’s freight tonnage carried on waterways, followed by the northern region with 33% share. Only less than 9% were carried in the central region. In relation to the network size of the 3 regions, this means that IWT throughput in the south is the most productive with 24.5 thousand tons/km. In comparison, the throughputs in the northern region and central region were 14.7 thousand and 13.8 thousand per km, respectively. It is also in the southern region where IWT is used in cross-border trade with Cambodia. The main com-modities carried across this border are oil, cement and steel products from Vietnam and wood and garment from Cambodia.
Inland Waterway Passenger Transport Capacity (Thousand person)
0
50
100
150
200
250
1995 1996 1997 1998 1999 2000 2001 2002 2003 2004 2005 2006
Inland Waterway Cargo Transport Capacity (Mil.ton)
0
10
20
30
40
50
60
70
1995 1996 1997 1998 1999 2000 2001 2002 2003 2004 2005 2006

The Comprehensive Study on the Sustainable Development of Transport System in Vietnam (VITRANSS 2) MAINTEXT
4-26
3) Reinvigoration of IWT
4.79 Despite the higher performance index of 3.3 for IWT vs 2.9 for railway, IWT re-ceived a smaller share of the total transportation investments in the last 7 years. Histori-cally IWT receives an investment allocation of only 0.3 trillion VND per year (2000─2007) or roughly 10% of the planned amount. However, the low funding allocation of IWT may be changing with ODA taking cognizance of its economic and social importance. A clear manifestation of the change in the trend of funding allocation for IWT is the World Bank fi-nancing for a project packages in the North and in the South worth more than USD320 million of investments in waterways. In the indicative 10-year investment program of VI-TRANSS 2 for 2010-2020, the recommendation is for tripling the historical share of IWT in transportation funding.
4.80 Many industries in the north and south have located along waterways, because IWT is central to their viability (e.g. Chinh Fonz Cement in Quang Ninh and Pha Lai Power Plant). The coal-fired power plants of the country are dependent on the waterways. In the Mekong Delta, IWT serves a range of industries; many poor villages depend on it for access and livelihood, and it supports cross-border trade to the GMS countries.
4.81 IWT also serves as an alternative mode of transportation to provide cheap alterna-tive and to absorb a significant share of the transportation demand. If there is no waterway, about 190 thousand tons of freight a day would have to be transported on road or rail. In the absence of rail capacity, this freight would end up being carried by trucks on the roads. The additional transportation cost to industries would exceed $300 million a year.
4) IWT in Other Countries
4.82 Although waterways of countries are impossible to compare because of their wide differences, a comparison among selected countries is valuable as an indicator of how each country has maximized the use of its waterways. In Table 4.4.1, Netherlands is the top-most IWT country because it has the highest density of waterways in Europe (3 times the river density of Vietnam), a very high market share in freight (40%), and high impor-tance of waterways in the intermodal transportation chain.
Table 4.4.1 Comparative IWT Indicators, Selected Countries
IWT Items Bangladesh China India Vietnam Thailand Netherland Freight market share of IWT 35% 27% 0.1% 17.0% 4.5% 40% Land Area (000 sq.km) 133.9 9,600 3,287.6 325.4 513.1 33.9 WW Length (kms) 6,000 119,000 5,700 6,574* 1,800 6,211 IWT Density (km/km2) 0.044 0.012 0.002 0.02 0.004 0.18 Approx. Budget/km/yr $3,500 $3,600 $6,000 $1,500 n.a. n.a Notes: *IWT length refers only to channels under national management
Source: Collated by Study Team from various sources
4.83 China also relies heavily on IWT where up to 27% of goods are transported on this mode and over long distances of 2,231km against Vietnam’s 153km. China allocates more than 2 times the funding per kilometer of waterway than Vietnam.

The Comprehensive Study on the Sustainable Development of Transport System in Vietnam (VITRANSS 2) MAINTEXT
4-27
4.5 Ports and Shipping
1) Government Plans and Decisions
4.84 The Government of Vietnam approved the Master Plan for the Development of Vietnam’s Seaport System till the Year 2010 through the Prime Minister’s Decision No. 202/1999/QD-TTg dated October 12, 1999. (Detailed plans were prepared in 2003–2005 for each seaport group.) While the 1999 decision does not indicate any details on de-mand analysis, it does include an attachment that states the target cargo handling capaci-ties and vessel sizes to be accommodated by 2010 for each of the 49 seaports in the na-tion5. Based on the attachment, the total target cargo handling capacity by 2010 is 216–255 million tons as a result of a summation of the target capacities for each port. (In the main body of the decision document, the nationwide target capacity is stated as 200 mil-lion tons). The bulk of the port capacity expansion will focus on the Northern Port Group, the Central Port Group, and the HCMC and Vung Tau-Thi Vai Port Group.
4.85 In line with this master plan, there have been several projects that are ongoing or in the pipeline. A series of container terminals at Cai Mep-Thi Vai Port is one of the most significant projects that are already approved and will be developed in the coming years. Deep-sea terminals are to be developed with Japanese official development assistance (ODA) loans, followed by a number of deep-sea terminals planned to be invested by SOEs and JVs co-founded by global terminal operators and SOEs/domestic companies. In fact, construction work for some terminals has already commenced.
4.86 Other projects and plans include the following:
(1) Hiep Phuoc Port
4.87 In Ho Chi Minh, there is another planned project at Hiep Phuoc Port along the Nha Be River, which will receive investments from a global terminal operator (DP World) and a company under the Ho Chi Minh People’s Committee (Tan Thuan Industrial Promo-tion Company). It is planned to be operational by 2009.
(2) Dinh Vu and Lach Huyen Ports
4.88 In Hai Phong, port development projects are planned in Din Vu and Lach Huyen. Among them, the Lach Huyen project includes a deep-sea container terminal at Cat Hai Island for 50,000dwt vessels and the construction of a new bridge. A Prime Minister’s de-cision was issued in April 2007 specifying that raising the funds for the first phase of the project is to be implemented by VINALINES. At Cai Lan Port, three additional deep-sea berths are planned.
(3) Danang Port
4.89 At Danang Port, one of the most important ports in the central region, a new ter-minal project is planned and waiting for MOT’s approval. This project includes five new berths for 15,000dwt vessels at Tho Quang where a former navy base was located. This new terminal will handle general cargo in place of the Song Han terminal which is located along the Song Han River and has narrow yards. The Song Han terminal is planned to be converted into a tourism area to make use of its location adjoining the center of the city. The Tho Quang terminal will be invested in by the Danang People’s Committee and oper-
5 New Prime Minister decision 16/2008/QD-TTg has classified Vietnam seaport into 3 classes with 49 ports and
166 berths.

The Comprehensive Study on the Sustainable Development of Transport System in Vietnam (VITRANSS 2) MAINTEXT
4-28
ated by the Danang Port Company which is one of the affiliates of VINALINES and cur-rently operates the Song Han Terminal.
(4) Dung Quat Port
4.90 The Dung Quat industrial zone in Quang Ngai Province promotes heavy and chemical industries including an oil refinery. The Dung Quat Port project is to imple-mented to complement the industrial zone. A single-buoy mooring for 150,000 dwt crude oil carrier vessels, piers with six berths for 5,000–12,000dwt oil product carrier vessels, and breakwater are under construction with investment from Petrovietnam. The port is planned to become operational by end-2008. A general cargo terminal for 30,000dwt ves-sels invested in by Gemadept is also under construction and will become operational in June 2008. Adjoining this terminal is another general cargo terminal which is waiting for approval including general cargo berth No.3, accommodating 50,000 dwt ships which will be constructed. It is to be invested in by VINALINES and is planned to start construction work at the end of 2008. In addition, two berths dedicated for a steel products factory for 30,000dwt vessels are planned to be developed by foreign investors, while a shipyard in-vested in by the Vietnam Shipbuilding Industry Corporation (VINASHIN) is under con-struction will be able to build 105,000dwt crude oil carriers. An access channel and turning basins are to be dredged up to -12m for the first phase by Vietnam Maritime Bureau (VI-NAMARINE) and will be deepened up to 14m in the future.
(5) Van Phong Port
4.91 In Khanh Hoa Province, a new container terminal for international transshipment is planned at Van Phong Port. A Prime Minister’s decision was issued in April 2007 speci-fying that raising the funds for the first phase of the project is to be implemented by VINA-LINES.
2) Key Development Issues
(1) Development of Competitive Gateway Ports in the North and South
4.92 In the southern and northern regions where 98% of the nationwide container vo-lume is handled, ports in Ho Chi Minh and the Haiphong Port with massive throughput on-ly have shallow water depths of 8.5m and experience delays in their respective extensions plans to accommodate larger-sized vessels. At Cai Mep-Thi Vai Port, construction work for 14-meter-deep terminals has already commenced, but channel dredging has not started. At Hai Phong Port in the north, the development of a deep-sea port has been de-cided through a Prime Minister’s decision, but the plan has materialized yet. Vietnam’s trade volume to/from North America and Europe has rapidly grown, almost equaling that of Thailand, so that Vietnam has become attractive enough for shipping lines to deploy their fleet of large vessels in the trunk trade lanes of Asia – North America and Asia – Eu-rope. Deep-sea ports should thus be developed immediately to accommodate large-sized vessels as one of the measures to enhance the country’s international competitiveness as base for manufacturing in Southeast Asia.
4.93 At Van Phong Port in the southern central region, an international transshipment port is being planned to accommodate large container vessels. At Cai Mep-Thi Vai Port, deep-sea container terminals with 18 berths are either planned or under construction. This means that an additional capacity of around 5.4–9 million teu will be developed in the com-ing years. Cai Mep-Thi Vai Port is obviously preferred by ocean-going shipping lines with possible cargo from/to their hinterland and enough handling capacities. To realize Van

The Comprehensive Study on the Sustainable Development of Transport System in Vietnam (VITRANSS 2) MAINTEXT
4-29
Phong Port’s goal to be a transshipment port would thus be a long way off unless imported/ exported cargo volume grows by developing the port’s hinterland (see Table 4.5.1).
Table 4.5.1 Profile of Major Ports in ASEAN Countries
Country Port Name Berth Length (m) Draft (m) Brunei Muara 250 12.5
Cambodia Old Sihanoukville 580 8.5 New Sihanoukville 350 10.0
Indonesia Tj. Priok 2,485 8.0–14 Tj. Perak (TPS only) 1,450 10.5–12.0
Malaysia
Port Klang 4,379 11.0–15.0 Penang 931 9.0–12.0 Tj. Pelapas 2,160 15.0 Bintulu 400 14.0
Myanmar MPA 183 9.0–10.0 Thilawa 1,000 10.0 AWPT 614 9.5
Philippines South Harbor 1,164 9.5–12.0 MICT 1,300 12.5–14.5 Cebu 760 10.0
Singapore Singapore Port 6,200 9.5–15.0
Thailand Bangkok 1,528 8.5 Laem Chabang 3,959 10.0–16.0
Vietnam
Saigon 704 8.5 New Saigon 2,037 11.0 VICT 486 9.7 Hai Phong 485 7.5
Source: ASEAN Logistics Study (2007).
(2) Development/Strengthening of Key Regional Ports to Support Regional Development
4.94 Ports in areas other than the three focal economic zones are still weak. In order to promote and support development in these areas, i.e. along the coast and their respective hinterlands, regional ports must be strengthened in an integrated manner together with the provision of transportation access and the promotion of socio-economic activities in the hinterland.
(3) Promotion of Competitive Environment for Port Service Provision
4.95 The quality of port services in most Vietnamese ports is still low, resulting in dam-ages to cargo, as well as increased costs and time, among others. A competitive envi-ronment must therefore be introduced including port administration reform, particularly in the introduction of port competition. Presently, there is already port competition in the south among several independent operators. The same cannot be said in the case of the central and the northern regions, where VINALINES is the dominant operator. The intro-duction of independent operators in these regions could bring about improved market re-sponse by the port operators and incentives to further enhance operations. For example, in the case of Surabaya Port, the introduction of two container terminal operators in Tan-jung Perak led to the segmentation of container services, wherein one terminal handles shipping lines who desire a fast turnaround but at more expensive rates, while the other concentrates on low-cost services but lower service levels, which is all to the benefit of port users.
4.96 There are two levels in the introduction of port competition in Vietnam, first is to

The Comprehensive Study on the Sustainable Development of Transport System in Vietnam (VITRANSS 2) MAINTEXT
4-30
Jurisdiction of Maritime Administration
Jurisdiction of Port Authorities practiced in many countries
Area managed by Port
give VINAMARINE, being the investor of the port infrastructure, the flexibility to competi-tively tender port or terminal operations. The second level is to allow VINAMARINE to shortlist potential bidders, so that they could pro-actively promote multiple operators in the same port or in the same general hinterland.
(4) Integrated Planning, Development, and Management of Ports and Hinterland
4.97 In Vietnam’s seaports, water areas are administrated by local maritime administra-tions (MAs), individual port facilities are managed by investors, and usage of land adjoining port facilities are administrated by people’s committees. This arrangement lacks the organi-zation or mechanism with which to implement integrated management/coordination. As a result, the resolution of problems, such as shortages of land for distribution facilities, mixture of port and local traffic, and lack of railway access. Is quite slow.
4.98 As investments in individual port facilities are approved separately and since there is no coordination for integrated planning in view of future development as a whole, pre-ceding investors tend to pay massive costs to develop facilities for common use, such as breakwaters and access channels, which will benefit succeeding investors. Moreover, there is also a tendency for access roads, to which high priority should be given in terms of port development, to not be prioritized in schedules prepared by the entity in charge of roads, because the entity is separated from port and maritime affairs. The solution of these issues will be the establishment of administrative systems which carry out coordina-tion among stakeholders and the management of infrastructure including planning, con-struction, maintenance, upgrading, etc. as well as the mechanisms for providing financial resources for the administrative systems (see Figure 4.5.1).
Figure 4.5.1 Concept of Port Area Management
Source: Overseas Coastal Area Development Institute, Japan.
(5) Strengthening of Multimodal Interface and Logistics Function
4.99 Modern logistics have changed the way goods are moved in that greater impor-tance is placed on profit, not just in the reduction of transportation costs. Moreover, the role of transportation has extended to marketing and not merely delivering goods. The port being the point in the transportation with the biggest concentration of cargo move-ment has a strong role to play in multimodal transportation. Currently, the role of the ports in Vietnam is primarily as a gateway for goods coming in and out of the country. This tra-ditional role can be extended to provide logistics and value-added services within the premises of the port, and for it to be the strategic point where other modes can be seam-lessly integrated. Firstly, the port can be made to serve as a consolidation or distribution center incorporating all modes, including truck, rail, and domestic shipping, through the

The Comprehensive Study on the Sustainable Development of Transport System in Vietnam (VITRANSS 2) MAINTEXT
4-31
improvement and the incorporation of modal access and terminals within the port. Se-condly, further value-added services can be provided if it can also serve as inventory con-trol point by incorporating advanced warehouse functions within the port. A notable exam-ple of this concept is the Port Klang Free Zone—although at a very large scale—where port operations are integrated with logistics, and even reexport activities, which are all si-tuated within the port premises.
(6) Strengthening of Coastal Shipping
4.100 The role of coastal shipping at the present is understated, focusing only on bulk and break bulk movement. While shipping is inherently slower than other modes, it does carry a significant advantage in cost. Thus, it could cater to lower valued goods or goods that need not require a speedy delivery. Considering that goods in Vietnam are still in the low to me-dium value category, there is a big untapped market potential in coastal shipping.
4.101 Containerized coastal shipping has not been sufficiently exploited. For instance, in Indonesia, the Jakarta – Surabaya route (approx. 700km) caters to strong coastal ship-ping demand for containerized cargo, despite the presence of highways and railway trans- portation. The introduction of private operators, with strong support and incentives from the government, was key to the success of coastal shipping in Indonesia. The same could be applied in Vietnam, particularly as the economic poles of the country continue to indu-strialize, spurring transportation demand between north and south.
(7) Liberalization of the Shipping Sector
4.102 Shipping services are still dominated by the state, although some level of privati-zation has taken root. This is manifested in the lack of ship bottoms and the slow progress of innovation in coastal shipping, such as container roll-on/roll-off operation. Even con-tainer lift-on/lift-off operation is very limited. Much of the coastal shipping activities are bulk or break bulk operations.
4.103 The introduction of more lax regulations in the formation and operation of coastal shipping companies could help stimulate the needed private investment and infuse stronger competition in the industry. Key areas that need to be examined include vessel importation, foreign participation, and port facilities.
3) Overall Assessment
4.104 In the Global Competitiveness Report 2008-2009 of the World Economic Forum, Vietnam was ranked 70th among 134 countries on the basis of 12 pillars of competitiveness. One of these pillars is infrastructure, in which the country scored poorly at 93. What pulled down the overall rank is the poor quality of port infrastructure (112th position, which is at the bottom 20%).
4.105 It was not for lack of trying to improve port infrastructure that Vietnam scored poorly. The rapid growth of the economy overwhelmed port capacity. What made it extremely difficult for Vietnam was the fact that some of its main ports are located upstream of rivers, with li-mited depths, resulting in poor seaside accessibility, limiting the size of vessels that could dock at the terminals, and making the ships dependent on tidal conditions.

The Comprehensive Study on the Sustainable Development of Transport System in Vietnam (VITRANSS 2) MAINTEXT
4-32
4) Introduction of New Capacities
4.106 To address the problem, plans for a deep seaport have been formulated more than 10 years ago. Given the long gestation period for new ports, the opening of ports in Cai Mep, Thi Vai, and Ba Ria Serece plus major upgrades in Hiep Phuoc Port in HCMC provided much needed capacities. The Cai Lan Port was built to provide relief to the congested ports of Haiphong, handle bigger ships, and become the main container port in the northern re-gion. The actual container traffic for Cai Lan, however, fell short of expectations.
5) Port Productivity
4.107 A faster and cheaper approach to addressing the congestion at ports would have been to improve efficiency in cargo handling and cut down berth times for vessels. Raising port productivity has been difficult. With few exceptions, the ports in Vietnam performed be-low international performance benchmarks. The major reason for the low productivity is the lack or inadequate cargo handling equipment, as well as limited yard space for operations. The issue of poor productivity applies to conventional and containerized cargo.
Table 4.5.2 Performance of Selected Terminals in Vietnam
Hai Phong Quang Ninh New Port Sai Gon VICT
Handling productivity (Boxes/crane/hour) 20 18 17–19 15–18 25- 28
Source: information collected from selected ports
4.108 A graphic presentation of the sector’s performance is shown on figures 4.5.2 and 4.5.3. Although a bit out-of-date (2004), the absence of major changes in Vietnam’s port sector would not materially affect the performance comparison.
Figure 4.5.2 TEU per Berth-Meter at Selected ASEAN Ports, 2004
Source: VITRANSS 2 Study Team.
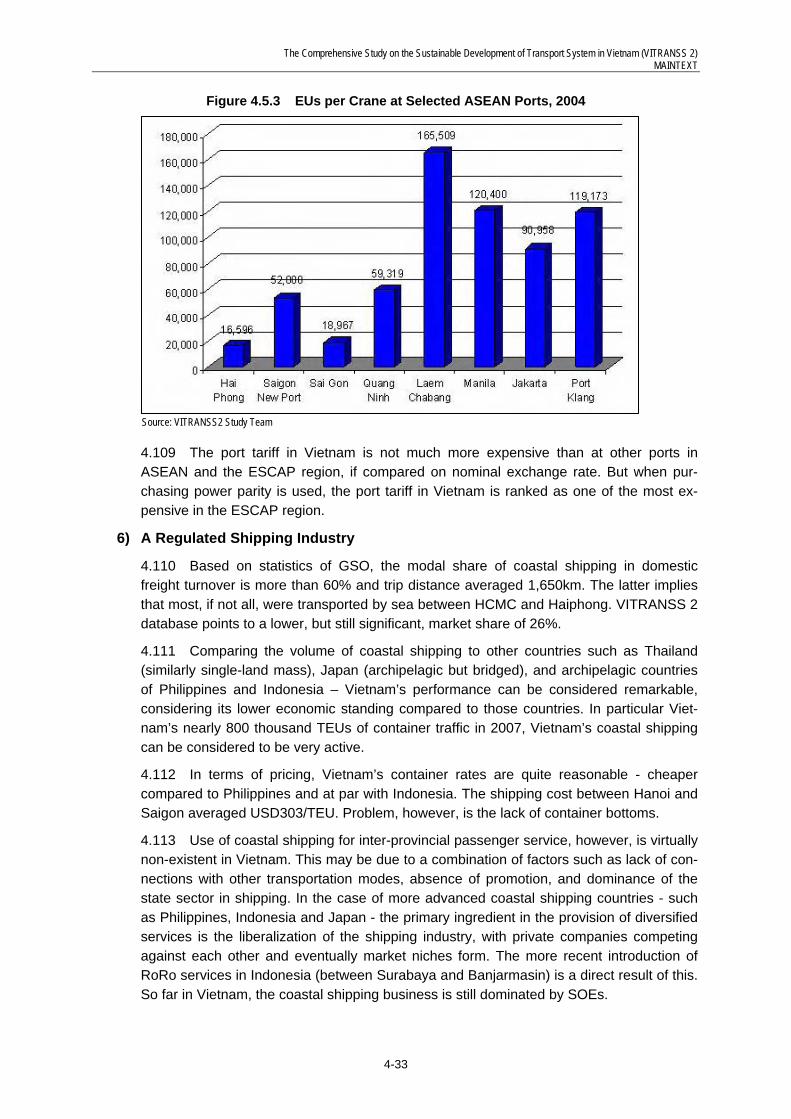
The Comprehensive Study on the Sustainable Development of Transport System in Vietnam (VITRANSS 2) MAINTEXT
4-33
Figure 4.5.3 EUs per Crane at Selected ASEAN Ports, 2004
Source: VITRANSS2 Study Team
4.109 The port tariff in Vietnam is not much more expensive than at other ports in ASEAN and the ESCAP region, if compared on nominal exchange rate. But when pur-chasing power parity is used, the port tariff in Vietnam is ranked as one of the most ex-pensive in the ESCAP region.
6) A Regulated Shipping Industry
4.110 Based on statistics of GSO, the modal share of coastal shipping in domestic freight turnover is more than 60% and trip distance averaged 1,650km. The latter implies that most, if not all, were transported by sea between HCMC and Haiphong. VITRANSS 2 database points to a lower, but still significant, market share of 26%.
4.111 Comparing the volume of coastal shipping to other countries such as Thailand (similarly single-land mass), Japan (archipelagic but bridged), and archipelagic countries of Philippines and Indonesia – Vietnam’s performance can be considered remarkable, considering its lower economic standing compared to those countries. In particular Viet-nam’s nearly 800 thousand TEUs of container traffic in 2007, Vietnam’s coastal shipping can be considered to be very active.
4.112 In terms of pricing, Vietnam’s container rates are quite reasonable - cheaper compared to Philippines and at par with Indonesia. The shipping cost between Hanoi and Saigon averaged USD303/TEU. Problem, however, is the lack of container bottoms.
4.113 Use of coastal shipping for inter-provincial passenger service, however, is virtually non-existent in Vietnam. This may be due to a combination of factors such as lack of con-nections with other transportation modes, absence of promotion, and dominance of the state sector in shipping. In the case of more advanced coastal shipping countries - such as Philippines, Indonesia and Japan - the primary ingredient in the provision of diversified services is the liberalization of the shipping industry, with private companies competing against each other and eventually market niches form. The more recent introduction of RoRo services in Indonesia (between Surabaya and Banjarmasin) is a direct result of this. So far in Vietnam, the coastal shipping business is still dominated by SOEs.

The Comprehensive Study on the Sustainable Development of Transport System in Vietnam (VITRANSS 2) MAINTEXT
4-34
4.6 Air Transportation
1) Government Plans and Decisions
4.114 Aviation projects are stipulated in several official documents of the Vietnam Gov-ernment, although, the latest is Prime Minister decision No 21/QD-TTg dated on January 1, 2009 that decision is promulgated on the approval of Airport Master Plan development up to the year 2020, as follows:
(a) There are 10 international airports
(i) Noi Bai Airport (for international and whole country fly/ terminal expansion, moderni-zation)
(ii) Cat Bi (for international and inter- city fly/upgrading and modernization) (iii) Phu Bai (for international and inter- city fly/upgrading and modernization) (iv) Danang (as international and domestic center air port/upgrading and terminal expantion) (v) ChuLai (as international cargo center, and inter-city airport) (vi) Cam Ranh (as international and inter-city passenger airport) (vii) Tan son Nhat (as international and whole country fly at Southern Area) (viii) Long Thanh (new build, is the Country biggest Air port and play role as Regional Airport Hub) (ix) CanTho (as international and inter-city fly/renovation and upgrading) (x) Phu Quoc (as international and cities airport of North and Central Area to Phu Quoc)
(b) There are 16 domestic airport (in which: DienbienPhu, DongHoi, NaSan, Vinh, Gia-Lam, PhuCat, TuyHoa, Pleiku, LienKhuong, BuonmaThuot, ConSon, CaMau, Rach-Gia, VungTau, LaoCai, QuangNinh)
In addition, there are some other provincial airports which are Lao Cai, Lai Chau, Phan Thiet, Thanh Hoa, Angiang, Quang Ninh…obtaining of MOT agreement to formulation of project investment report (F/S).
4.115 Committed projects include the following:
(a) Noi Bai International Airport: Construction of a new passenger terminal building at Noi Bai Airport. The terminal named T2 capacity will be 8 to 10 million passengers per annum and is to be completed by 2010.
(b) New Long Thanh International Airport: As Tan Son Nhat is difficult to expand, a new airport is planned to replace it. Tendering for the consultants to develop the mas-ter plan has just completed. The airport is to have a capacity of 25 million passengers per annum.
(c) Phu Quoc International Airport: The airport is planned to accommodate 2 million passengers and 15,000 tons per year.
2) Key Development Issues
4.116 Airport Network Rationalization: Airports thrive when demand is consolidated, jus-tifying the frequency of services and the use of larger airplanes. On the other hand, Viet-nam is an extensive country with some areas requiring special airport access. In order to avoid wasteful investment and to improve the utilization of airports, it is recommended that the location of airports be rationalized based on practical considerations. The roles of air-ports need to be clarified, and design standards be practically set. Providing effective land access between the airports and mother cities/destinations is also important.

The Comprehensive Study on the Sustainable Development of Transport System in Vietnam (VITRANSS 2) MAINTEXT
4-35
Figure 4.6.1 Present Location of Airports in Vietnam
Source: Vitranss2 Study Team

The Comprehensive Study on the Sustainable Development of Transport System in Vietnam (VITRANSS 2) MAINTEXT
4-36
(1) Expansion of International Gateway Airports
4.117 Considering the high traffic growth experienced in Vietnam in the last five years, it is presumable that the traffic volume in Noi Bai and Tan Son Nhat airports will soon reach current capacities. Although passenger terminal facilities in major international airports have been developed, traffic growth has been more significant than ever imagined, fast outstripping capacity expansion. If adequate capacity is not provided in an airport, delays may occur and service levels may deteriorate. Hence, it is important to develop airport fa-cilities to meet air traffic demand.
4.118 There are several factors in Vietnam which have caused increased aircraft movements such as competitive environment and introduction of low-cost carriers. Air-lines tend to increase frequency to meet passenger demand if there are competitive con-ditions, and one of the business model of low-cost carriers are frequent service.
4.119 As runway capacity in Noi Bai and Tan Son Nhat airports were estimated as hour-ly 50–55 movements and 165,000–181,500 annual movements, runway capacity will be a major capacity constraint in international airports.
(2) Provision of Competitive Environment
4.120 At present, there are four Vietnamese airlines, namely Vietnam Airlines, Jetstar Pacific, Vasco and Indochina Airlines having shedued fights. Viet Jet has been provided licence but it has not been in operation. Competitive conditions now exist in some domes-tic routes such as Hanoi–Ho Chi Minh City and Ho Chi Minh City–Danang. Still, the com-petitive level within Vietnam is still low, although it is a welcome development that there has been significant improvement on this front. This policy needs to be maintained, while keeping strict safety standards.
(3) Promotion among Low-cost Carriers (LCCs)
4.121 The market share of LCCs has been increasing worldwide. There are more than 100 LCCs in the world, representing 20% of the total global market in terms of seats of-fered. In 2007, the market share of LCCs in North America was 26%, in Europe 30%, and in Latin America 20%. Meanwhile, the market share in Asia was 12% in 2007 although it has grown from 5% with less than 10 airlines in 20046. LCCs in the Asia and Pacific re-gion already operate in Vietnam. They are AirAsia, Viva Macau, Jetstar Asia, Jetstar, Tiger Airways, PB Air, and Silk Air. As compared to other regions, there is a big potential for LCCs to expand their share in Asia.
4.122 The LCCs’ operating concept is quite different from that of traditional air carriers. While there are several types of LCC, the basic concepts are as follows:
(i) Single-class seat type; (ii) Single type of aircraft, such as A320s and B737s, to reduce training and maintenance cost; (iii) Fast turnaround time to keep aircraft in the air as long as possible; (iv) Point-to-point route and not hub-and-spoke concept; and (v) Preference for secondary airports and not congested major airports, etc.
4.123 With different operations, LCCs’ requirements for airport facilities also differ from those of traditional air carriers. LCCs tend to avoid airport services that increase operating
6 Airbus Global Market Forecast 2007─2008.

The Comprehensive Study on the Sustainable Development of Transport System in Vietnam (VITRANSS 2) MAINTEXT
4-37
Source: Prepared by VITRANSS2 Study Team based on GSO Vietnam data
costs, such as passenger loading bridges. They prefer to use remote gates and try to mi-nimize the cost and turnaround time in the airports. If the number of LCCs operating in Vietnam will increase, they will require such conditions mentioned above will be made by them, and it may be necessary to consider this scenario when modifying airport opera-tions and facilities.
4.124 Although there are as yet no serious airport congestion and delay problems in Vietnam, the experiences of countries with high air traffic volume show that such prob-lems will happen in Vietnam in the near future. AS LCCs tend to avoid congested airports, secondary airports may be required to be developed in Hanoi and Ho Chi Minh City.
3) Air Transportation Market
4.125 In terms of market expansion, the aviation sector of Vietnam outperformed the Asia Pacific region, which was already considered by IATA as the region with highest growth in the world.
4.126 In the Asia-Pacific region, air passenger traffic grew at an annual average rate of 6.2% (against world’s average of 5.1%) from 1994–2004. On the other hand, Vietnam’s annual average from 1995 to 2005 was an impressive 11.3% pa; and from 2005 to 2007, at an even higher average of 18.9% pa. Although data for comparable periods are not available, the performance of Vietnam in air cargo traffic was similarly higher than that of the region – at about 14.4% vs 5.5%.
4.127 International passengers totaled 8.5 million in 2007; with AAGR of 16.5% from 1999 to 2007. Domestic passengers also grew from 3.4 million in 1999 to 11.6 million in 2007, for AAGR of 16.9%. The historical experience of other countries is a growth rate in the air transportation market equal to 1.8 times the annual GDP growth. Vietnam, howev-er, recorded a multiple of 2.3 times its annual increase in GDP – from 1999 to 2007. (See Figure 4.6.2).
4.128 Taking cue from expanding foreign trade, international air cargo traffic grew at an annual average of 18.0% per year from 1999 to 2007 to reach 224.2 thousand tons in 2007. Domestic air cargo traffic grew at a slightly higher rate of 21.7% over the same period.
Figure 4.6.2 Rate of Growths of GDP and Air Transportation Traffic
‐5%
0%
5%
10%
15%
20%
25%
30%
35%
40%
2000 2001 2002 2003 2004 2005 2006 2007
Ann
ual Rate of In
crease
GDP Passenger Air Cargo

The Comprehensive Study on the Sustainable Development of Transport System in Vietnam (VITRANSS 2) MAINTEXT
4-38
4) Infrastructure Quality
4.129 The air transportation infrastructure is seen as one of Vietnam’s disadvantages - although not as bad as the port inadequacies, based on the most recent Global Competi-tiveness Report. It also ranked lower than other countries in the region, as shown in Fig-ure 4.6.3. The airline capacity index is the available seat-kilometers offered by scheduled carriers, normalized with Japan as base =100. It reflects total air carriers’ capacities.
Figure 4.6.3 Competitiveness of Air Transportation, Selected Countries
Source: WEF, Global Competitiveness Report 2008-2009
5) Air Services
4.130 A major change in the domestic aviation market is the increasing competition in domestic air services, which was before dominated by Vietnam Airline. Liberalization has started, with the entry of other carriers. Jetstar is positioning itself as a low-cost carrier. New players (Viet Jet and Air Speed Up) have announced plans to come in, but apparent-ly on-hold as the air travel market declined in 2009.
4.131 Pricing of airfares has been shifting toward market pricing, but only for routes with competing carriers (which are still very few). The prevailing policy is “ceiling price” control, rather than a floor price or a flexible band.
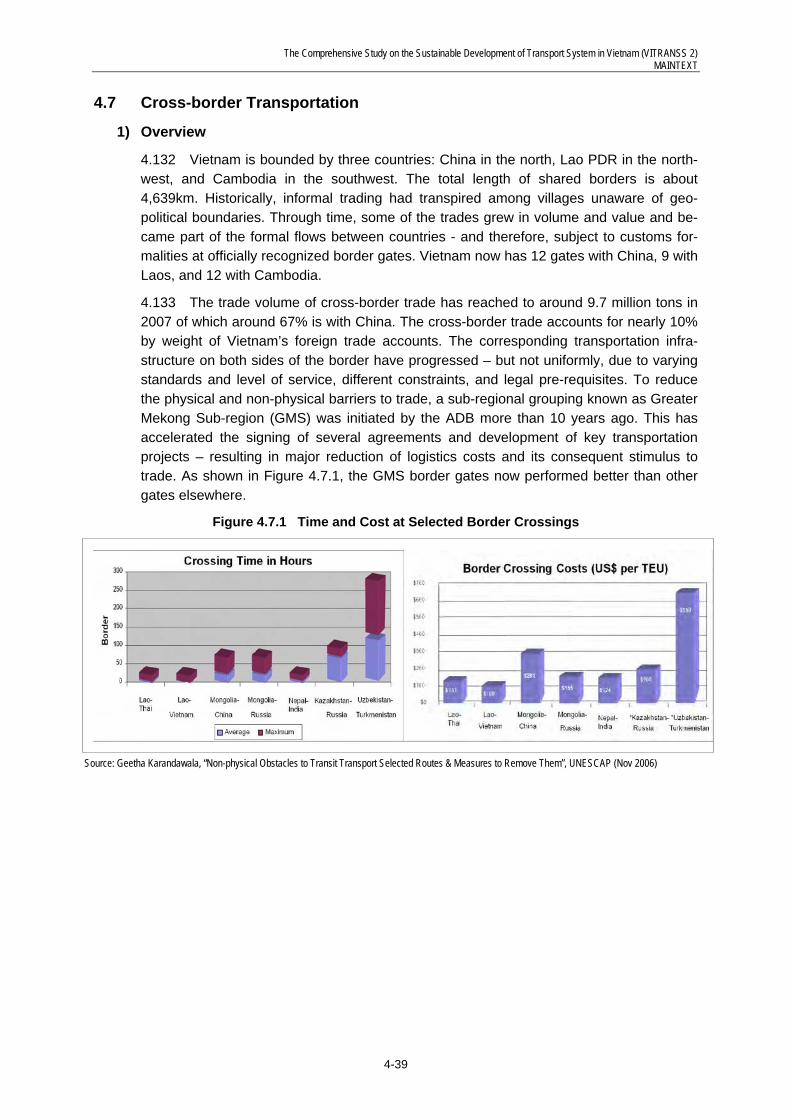
The Comprehensive Study on the Sustainable Development of Transport System in Vietnam (VITRANSS 2) MAINTEXT
4-39
4.7 Cross-border Transportation
1) Overview
4.132 Vietnam is bounded by three countries: China in the north, Lao PDR in the north-west, and Cambodia in the southwest. The total length of shared borders is about 4,639km. Historically, informal trading had transpired among villages unaware of geo-political boundaries. Through time, some of the trades grew in volume and value and be-came part of the formal flows between countries - and therefore, subject to customs for-malities at officially recognized border gates. Vietnam now has 12 gates with China, 9 with Laos, and 12 with Cambodia.
4.133 The trade volume of cross-border trade has reached to around 9.7 million tons in 2007 of which around 67% is with China. The cross-border trade accounts for nearly 10% by weight of Vietnam’s foreign trade accounts. The corresponding transportation infra-structure on both sides of the border have progressed – but not uniformly, due to varying standards and level of service, different constraints, and legal pre-requisites. To reduce the physical and non-physical barriers to trade, a sub-regional grouping known as Greater Mekong Sub-region (GMS) was initiated by the ADB more than 10 years ago. This has accelerated the signing of several agreements and development of key transportation projects – resulting in major reduction of logistics costs and its consequent stimulus to trade. As shown in Figure 4.7.1, the GMS border gates now performed better than other gates elsewhere.
Figure 4.7.1 Time and Cost at Selected Border Crossings
Source: Geetha Karandawala, “Non-physical Obstacles to Transit Transport Selected Routes & Measures to Remove Them”, UNESCAP (Nov 2006)

The Comprehensive Study on the Sustainable Development of Transport System in Vietnam (VITRANSS 2) MAINTEXT
4-40
2) The Evolving Trade Patterns
4.134 Figure 4.7.2 illustrates the trade and transportation links among the GMS coun-tries, as well as China.
Figure 4.7.2 Conceptual Trade-Transportation Links
Source: VITRANSS2 Study Team
4.135 The main drivers to trade between countries are their foreign trade orientation, level of economic development, and population – with distance as a barrier or negative factor. These are summarized in Table 4.7.1 – which shows Thailand with the biggest for-eign and Intra-Asean trade. Guangxi and Yunnan, which are provinces of China, are near-ly the same economic size as Vietnam.
Table 4.7.1 Basic Data on Border Countries
Country Population GDP Foreign Trade (2006, $m) Intra-Asean
(2007) (2007, $m) Total Export Import (2006, $m) Vietnam 85,205 71,292 77,270 37,033 40,237 18,668 Lao PDR 5,608 4,128 989 402 587 791 Cambodia 14,475 8,662 6,437 3,514 2,923 1,227 Thailand 65,694 245,702 248,687 121,579 127,108 50,484 Yunnan (China) 44,150 68,941 3,740 2,240 1,500 Guangxi (China) 48,890 70,102 7,000 4,320 2,680 Guangdong (China) 83,040 379,562 527,160 301,900 225,260
Source: VITRANSS 2 Study Team based on ASEAN Secretariat Trade Statistics.

The Comprehensive Study on the Sustainable Development of Transport System in Vietnam (VITRANSS 2) MAINTEXT
4-41
Share of Trade Value
Guangdong
YunnanProvince
GuangxiZhuangzu
Viet Nam
Lao PDR
Cambodia
Thailand
Myanmar
Vi et Nam
Lao PDR
Cam bodia
T hail and
Yunnan
Province
Guangxi
Zhuangzu
4.136 The inclusion of trade data for southern China provinces leads to the trade pat-tern shown on Figure 4.7.3. The major players are Thailand, Vietnam, Guangdong, and Guangxi.
Figure 4.7.3 Shares of Trade Value
Source: VITRANSS2 Study Team
4.137 Figure 4.7.4 illustrates the emerging triangular trades among Vietnam, China, and Thailand with Lao PDR, Cambodia. Laos and Cambodia serve as the land-bridge for tran-sit cargo between Vietnam and Thailand – and benefit accordingly. Already, Thailand’s trade is rising rapidly with Cambodia and Lao PDR.
Figure 4.7.4 Trade Pattern among GMS Countries
Source: The Research on the cross-border transportation infrastructure: Phase II, JICA, 2007
3) Current Situation of Transportation Infrastructure
4.138 The GMS countries have reached a consensus on the transportation corridors that each one has to develop, in accordance with their own capability. Of relevance to Vietnam are:
(i) N-S Corridor from Kunming to Hai Phong; (ii) East-West 1 between Hanoi and Bangkok via Laos; and (iii) East-West 2 between HCMC and Bangkok via Cambodia.

The Comprehensive Study on the Sustainable Development of Transport System in Vietnam (VITRANSS 2) MAINTEXT
4-42
Figure 4.7.5 Location of Cross-Border Gates
Source: The Research on the Cross-border Transportation Infrastructure: Phase II, JICA, 2007
4.139 The infrastructure development includes the development or improvement of road, waterways, seaport, airport and cross-border trade infrastructure (CBTI); and power as well as communication. CBTI projects were intended to cut time and cost at border gates where customs formalities had to be undertaken.
4.140 Before the GMS came about, the idea of building the Asian Highway/ASEAN Highway was already being pushed by UN Social Economic Commission for Asia and the Pacific (ESCAP). By 2002, the project has expanded to cover 32 Asian countries with a total road length of 141,000km and eventually linking with the European Highway. The GMS-portion of the Highway is 14,511km, some sections of which had already been com-pleted or under implementation. The ASEAN transportation network interlinks 10 countries with 23 routes and a total distance of 38,400km. The railway component is farther from realization. Although all the GMS countries, except Laos, have railway systems, most of them are narrow gauges (1m), single track, with missing links. Yunnan’s railway is more advance, but cannot proceed as yet to Vietnam.
4.141 Most foreign trades – especially those for trans-continental markets - are trans-ported by sea, hence dependent on ports. Strictly speaking, ports are excluded from CBTI but their locations and hinterlands affect the traffic on the land-bridges. For example, the emergence of Laem Chabang in Thailand has induced transit cargo from Cambodia and Laos to move across the border. The port at Cai Mep Thi Vai area might also affect the cross-border traffic if the corresponding land transportation connections across the bor-ders are also developed.
4) Location of Cross-border Points
4.142 There are many cross-border points among the GMS coun-tries (see Figure 4.7.5). Forty (40) of them are Class I points that serve people and goods from any country, including third countries, which have diplomatic relations with the transit country. There are 36 Class II border points that allow people and goods only between two neighboring countries. Most of these points have simple facili-ties.

The Comprehensive Study on the Sustainable Development of Transport System in Vietnam (VITRANSS 2) MAINTEXT
4-43
4.143 Relatively large cross-border traffic volumes are observed between:
(i) Vietnam and China (in Lao Cai/Hekou, Lang Son/Pingxiang, and Mong Cai/Dongxing);
(ii) Lao PDR and Thailand (in Nong Khai/Vientiane, Nakhon Phanom/ Thakek and Muk-dahan/ Savannakhet);
(iii) Cambodia and Thailand (in Aranyaprathet/Poipet); (iv) Cambodia and Lao PDR (in Muang Khong/Phumi Sralau, across the Mekong River); (v) Cambodia and Vietnam (in Bavet/Moc Bai) and between Myanmar and Thailand (in
Mae Sai/Tachilek).
4.144 In general, there are few cross-border points with more than 1,000 PCU per day, still within the capacity of the roads but processing delays often led to congestions.
4.145 Vietnam has 16 Class-1 points at present. The priority is centered on 4 gates, viz.:
(i) Lao Cai Cross-border Gate linking with China’s Yunnan Province; (ii) Lang Son Cross-border Gate linking with Guangxi Province; (iii) Lao Bao Cross-border Gate linking with Lao PDR and Thailand via Lao PDR; (iv) Moc Bai Cross-border Gate linking with Cambodia.
5) Current Situation of Cross-border Trade Agreement (CBTA)
4.146 The CBTI cannot proceed without the legal framework. Non-physical impediments to regional movement are: difficult border formalities, restrictive visa requirements and ve-hicle entry, varying vehicle and driver standards and lack of effective transit regimes. To eliminate these non-physical barriers on the selected routes, the GMS Cross-Border Transport Agreement (CBTA) was negotiated and has now been ratified by all 6 GMS countries. Twenty annexes and protocols have been added on implementing facilitation of cross border movement of goods and persons, a single stop/single window inspection system, harmonization and integration of systems, exchange of traffic rights and transit traffic provisions. The GMS Customs Transit and Temporary Admission System (CTS) are in the finalization stage, with the Public-Private-Partnership on Implementing CTS already agreed among member countries. The Road Transport Permit had been printed and circu-lated to countries for their implementation. With a permit, one country’s truck could enter into another country on the designated route defined by Protocol 1 of the CBTA. In June 2009, permit for 1,200 units of trucks (400 units each to Thailand, Lao PDR and Vietnam) had been issued, thus achieving a smooth transport of goods across the borders.
6) Remaining Issues
(1) Issues Related to CBTA
4.147 The enhancement of trade facilitation to increase the trade among member coun-tries requires additional collaboration work among member countries. Several issues that need to be tackled by Vietnam are as follows:
(i) Agreement on Single Stop / Single Window Inspection (SSI) with China (ii) Agreement on GMS multiple visa for truck drivers (iii) Agreement on quarantine and immigration (iv) Agreement for transit to the third country (v) Harmonization and standardized documentation for customs, quarantines and immigtation

The Comprehensive Study on the Sustainable Development of Transport System in Vietnam (VITRANSS 2) MAINTEXT
4-44
(vi) Permit on offshore factory in the industrial estate closely located at border point (vii) Recognition of Incoterms in view of freight insurance (viii) Issuance of GMS driving license
(2) Issues Related to CBTI
4.148 The following infrastructure requires action from Vietnam:
(i) Upgrading and improvement of roads connecting major ports and cross-border points; (ii) Repair and maintenance of road to and from cross-border points and trunk road; (iii) Development of modern cross-border gate composed of customs, inspection yard, in-
spection equipment, truck head switching yard, accommodation of staffs, etc.; and (iv) Expansion of IT and computerization of customs procedure and integration of such
systems into a wider logistics network.

The Comprehensive Study on the Sustainable Development of Transport System in Vietnam (VITRANSS 2) MAINTEXT
4-45
4.8 Logistics
1) Sector Performance
(1) Truck Operation
4.149 Truck transportation is invariably part of any logistics chain. Even as multimodal transportation operators (MTOs) try to provide efficient logistics system, final delivery de-pends on truck delivery. Considering this situation, developing not only road infrastructure but also upgrading truck transporters and their service levels is essential for developing Vietnam’s logistics quality. Problems in low operation speeds and poor pavement condi-tions contribute to the inefficiency of truck operation, which ultimately affects the competi-tiveness of logistics services.
4.150 In the case of long-distance truck operation notably between Hanoi and HCMC, current truck services can offer delivery within three days, and this is an appreciable im-provement compared to 10 years ago when it used to take twice that long. However, a transit time of three days for a 1,500km distance is considered uncompetitive, since de-veloped countries could offer 2-day transit service for the same distance. In addition to the transit time, the increasing number of tollgates and the official/unofficial penalties levied by police increases transportation costs. While official fees are understandable, unofficial fees are totally unacceptable. While tollgates are not a problem per se, toll fees are typi-cally levied on the use of expressways, thus payments are recouped with high-quality fa-cilities. But levies on ordinary roads cannot be appreciated.
4.151 The trucking industry is primarily composed of small-scale firms. Thus, they do not have the capability to offer standardized services nationwide and their coverage is limited. Nonetheless, there is a sufficient number of trucks available. Still, truck operations remain primitive and a simple A-to-B transportation depending on charter-base.
(2) Warehouse Management
4.152 Within ASEAN, the fostering of qualified logistics providers, which are classified into LSPs (logistics solution provider), MTOs, and 3PL (3rd party logistics), is a target is-sue to improve logistics. Even in such new and distinguished business field, the most es-sential part of service is actual operations: delivery and inventory control. The logistic ser-vice level depends on such actual operations.
4.153 With the spreading influence of the supply chain management (SCM) concept, it has become common in advanced countries that only required items with accurate quanti-ty should be delivered in a speedy and timely manner. That reflects the trend of keeping excess inventory low and for holding the minimum inventory as much as possible. In order to respond to this requirement, sophisticated and speedy warehouse operation is a critical service for logistics providers. Up to now, Vietnam’s warehouses only provide simple sto-rage and the operation level remains primitive. There are no local providers that can pro-vide short-transit dispatching operation involving processing, value-adding operations, and piece-picking operations as seen in advanced countries. The expected service ranges from accurate inventory control, piece control, speedy shipment, to cross-dock functions.
(3) Rail Freight
4.154 The use of rail transportation for high-value cargo is currently limited because the service level seems inferior. Railway operators announce that the transit time for freight

The Comprehensive Study on the Sustainable Development of Transport System in Vietnam (VITRANSS 2) MAINTEXT
4-46
transportation is below 40 hours between HCM and Hanoi. However, most users believe that more time is actually required and frequent delays are unavoidable.
4.155 In addition, traceability and schedule control are difficult because the connection of rail transportation and the loading/unloading section is ineffective. Users cannot have information on cargo status and cargo dispatch/arrival schedules, resulting in difficulties in calculating total transit time and time of cargo arrival. This inconvenience leads users to hesitate to utilize rail transportation for their logistics needs. Besides, the capacity of freight trains is limited.
(4) IWT in Logistics
4.156 Currently, there are no examples utilizing IWT among foreign customers who em-phasize speedy and timely delivery especially for high-value goods. The commodity for IWT is mainly low-valued bulk cargo, namely cement, coal, and construction materials. If IWT would try to attract highly valuable cargo, it is necessary to settle the problems it has in common with railway transportation, i.e. traceability, reliability, and visibility problems (speedy delivery is not originally required for IWT).
(5) Ports
4.157 Port operations have improved with the development of port infrastructure. In Ho Chi Minh, initiating Cat Lai Port operations has benefited port users. In 2007, approx-imately 2 million teu was handled in both terminals, accounting for 60% of total container volume handled in the south. In addition, Cat Lai Port has also effectively avoided the traf-fic regulation prohibiting inter-city truck during the day, enabling it to provide speedy and timely delivery to customers. That is why Cat Lai Port attracts shipping lines and custom-ers. In the north, the Cai Lan container terminal started operations in 2005. In 2006, how-ever, the gantry crane collapsed. Two new gantries have been imported from Germany and will be used starting May 2008. The envisioned cargo shift from Hai Phong, which has not been realized up to, now may yet be achieved.
4.158 The production volume of foreign companies is expected to remarkably increase in the coming years. Therefore, it is obvious that port-handling capacity will be short for the predicted volume. At present, the transit time for cargo handling at Hai Phong con-tainer terminal is reliable and predictable and users are not seriously affected by the con-ditions of port operation including the off-dock facility. However, it is uncertain whether this service level can been sustained in the future when cargo volumes expand.
4.159 Establishing new ports and the expansion of existing ones seems to be the cor-rect decision for both southern and northern Vietnam. Additionally, improving port access is a critical issue for logistics providers. The assessment of port operations will deeply de-pend on whether customers can deliver/receive cargo smoothly and in a timely manner.
(6) Air Freight
4.160 Air transportation will be critical transportation mode in the coming years with the expected increase in the production and consumption for high-end commodities. Taking a look at Vietnam’s situation, the local air forwarding industry is so outdated, and most for-warders are not familiar with House-Master B/L relations. Their activities thus are not dif-ferent from those carried out by simple brokerage firms. The role of forwarders has not necessarily been recognized up to now because air cargo volume is not enough. However, the situation will change, thus fostering air cargo forwarders is an urgent issue. From the

The Comprehensive Study on the Sustainable Development of Transport System in Vietnam (VITRANSS 2) MAINTEXT
4-47
logistics provider side, the disadvantages are the highly regulated cargo-handling termin-als, their low service levels, high risk of damage, and delayed cargo release. It is also dif-ficult for forwarders to have their own consolidation facility for unit load device (ULD) due to difficulties in acquiring the necessary permits. Further, liberalization is necessary.
2) Overall Logistics Performance in Vietnam
4.161 The logistics cost in Vietnam is high, compared to its Asian neighbors (see Figure 4.8.1). It is estimated to be at 20%-25% of GDP.
Figure 4.8.1 Comparative Logistics Costs, Selected Countries
Source: World Bank
4.162 A quantitative indicator of the overall logistic performance of a country has been developed by World Bank. It rated countries logistics performance based on seven (7) di-mensions, viz.:
(i) Efficiency and effectiveness of the clearance process by Customs and other border control agencies;
(ii) Quality of Transportation and IT infrastructure for logistics; (iii) Ease and affordability of arranging shipments; (iv) Competence in the local logistics industry (e.g., transportation operators, customs
brokers); (v) Ability to track and trace shipments; (vi) Domestic logistics costs (e.g., local transportation, terminal handling, warehousing);
and Timeliness of shipments in reaching destination.
4.163 Vietnam’s Logistic Performance Index (LPI) stood at 2.89, good enough for a 53rd position against other countries in 2007. Singapore was rated highest with LPI = 4.19. The comparative scores of selected countries are shown on Table 4.8.1.
4.164 The general understanding of logistics is still at the primitive stage, which so far only involves transportation and storage activities. Proffered solutions often focus on in-frastructure – which is only 1 of 4 components wherein the other 3 are service providers, laws and regulations, and shippers and products. There is still a long way to go to reach a level where its scope becomes the supply chain system to improve trade competitiveness of key products and industries.

The Comprehensive Study on the Sustainable Development of Transport System in Vietnam (VITRANSS 2) MAINTEXT
4-48
Time
Sales
Former
Current
Time
Sales
Former
Current
Table 4.8.1 2007 LPI Score of Selected Countries
Criteria Vietnam Thailand China Singapore Indonesia Korea
Score Rank Score Rank Score Rank Score Rank Score Rank Score Rank Customs 2.89 37 3.03 32 2.99 35 3.90 3 2.73 44 3.22 27 Infrastructure 2.50 60 3.16 31 3.20 30 4.27 2 2.83 45 3.44 25 International Shipments 3.00 47 3.24 32 3.31 28 4.04 2 3.05 44 3.44 24 Logistics Competence 2.80 56 3.31 29 3.40 27 4.21 2 2.90 50 3.63 22 Tracking and Tracing 2.90 53 3.25 36 3.37 31 4.25 1 3.30 33 3.56 25 Domestic Logistics Cost 3.30 17 3.21 28 2.97 72 2.70 113 2.84 92 2.73 110 Timeliness 3.22 65 3.91 28 3.68 36 4.53 1 3.28 58 3.86 30
Overall – LPI 2.89 53 3.31 31 3.32 30 4.19 1 3.01 43 3.52 25 Source: World Bank.
3) Key Development Issues
(1) Meeting the Needs of Modern Business Models
4.165 The basic purpose of logistics is divided into two: one is the reduction of total lead (transit) time and inventory as much as possible. The market-oriented economy in recent years has led firms to accommodate large varieties of items in their production model in order to attract customers. However, customer demand is likely to change easily so huge inventories are avoided so that dead stock remains low. Excess inventory becomes dead stocks when demand trends change. The production side has to put their goods into the market promptly, expecting a changeable market demand. A typical case is observed in personal computers: PCs sell best within six months from the time of product marketing. Logistics play an important role to deliver the commodity speedily into the market to take advantage of the best-selling period. Although the production side makes a lot of effort to anticipate or catch up with customer requirements, predicting market trends is full of un-certainty. Thus, delivery into the market is of utmost importance (see Figure 4.8.2).
Figure 4.8.2 Changes in Product Life in the Market
Source: VITRANSS 2 Study Team.
4.166 In order to respond to such market changes, it is unavoidable for the transporta-tion and warehouse sectors to be flexible in their services. Such circumstances force the logistics side to provide complicated and difficult operations. A production line has to make varied lines of products with limited quantities in order to avoid excess inventory. The increasing number of produced items makes it difficult for warehouse operations to control inventory. In addition, shipping orders from customer tend to be complicated, indi-cating delivery items should be dealt in short transit times. Not only warehouse operations

The Comprehensive Study on the Sustainable Development of Transport System in Vietnam (VITRANSS 2) MAINTEXT
4-49
but also the transportation sector has to change its service structure. One of the most im-portant changes for transportation operations is to respond to the demand for providing small lots and frequent deliveries. In addition, speedy delivery is also highly demanded because the low inventory volume and changeable market are likely to take place and the opportunity loss for good sale items is easily experienced if service is unsatisfactory. Un-der the ‘Kanban’ production trend, i.e. the production line is likely to shut down easily even by a small error or delay in the logistics side. The pressure on transportation operations is surely huge and serious.
4.167 In this context, the integration of improved warehouse and transportation services is essential for logistics service. Several factors are required for each sector (see Table 4.8.2).
Table 4.8.2 Required Elements for Logistics Service
Area Required Element Transportation
• JIT service (Just In time) delivery consisting of: - Timely, speedy delivery - Time dedicated delivery - Cargo traceability Visibility) - Small lot delivery - Consolidation service (with JIT concept) - Emergency delivery
Warehouse • Inventory of variety number of items with accuracy • Accurate shipment preventing miss-shipment • Speedy shipment from order acceptance • Cross-dock operation • Value-added service (labeling, processing, repairing, etc.) • Vendor management initiative (VMI) operation • Frequent shipment • Emergency shipment
Source: VITRANSS 2 Study Team.
4.168 Considering the Vietnamese logistics industry, it seems difficult for local providers to provide satisfactory logistics services. From now on, local transporters have to take ac-tion to provide such service. If not, their service levels will not meet the logistics demand in the near future. In particular, warehouse operations remain an in-house undertaking in Vietnam, and not generally outsourced to others. No local operator has experience in in-ventory control as provided in developed counties yet. (In other words, Vietnamese ware-house provides only storage space, not inventory control under the context of speedy handling).
4.169 In order to foster logistics services, upgrading basic services of transportation and warehouse operators is the first step. Without this, it would be difficult to realize more ad-vanced services.
4.170 In order to achieve this goal, high-quality facilities and equipment are necessary. It is unfortunate that the hardware utilized by local operators is generally of inferior quality because most of them are ageing and outdated. It is well recognized among concerned parties that investment is critical in order to replace current equipment. However, majority of the local providers do not have enough financial resources and this situation has been the same for a long period now.
4.171 In addition, IT support is a critical issue in order to provide logistics service. Up to now, IT innovation for the logistics field in Vietnam lags far behind than global standards.

The Comprehensive Study on the Sustainable Development of Transport System in Vietnam (VITRANSS 2) MAINTEXT
4-50
In other words, no one can provide logistics service without using IT. This is a critical is-sue to address. However, the fulfillment of IT is also a big financial burden for local logis-tics operators.
(2) Market for High-quality Logistics Services
4.172 Lowering logistics costs is favorable for every concerned party and is the main purpose of logistics providers. However, logistics costs deeply depend on service levels. The relation of cost and quality is a trade-off, and it is practically impossible to enjoy low costs and high-quality services at the same time. Whether or not high costs are accepta-ble depends on a customer’s product value and business model. High-value and time-sensitive goods tend to incur high logistics costs because a timely market-in is critical to take advantage of their limited high-sales period.7
4.173 At this moment, the focus is more on costs in Vietnam. With investments in indus-trial and consumer goods production, the requirements for logistics will change and a premium will be attached to those who can provide highly responsive services and offer value to their customers. Therefore, the importance of warehouse management through the integration of inventory control operations will become more apparent. Logistics ser-vice providers will therefore face a daunting challenge to offer a variety of services with varying degrees of trade-off between cost and quality to meet the requirements of their clients. In this context, the technical and managerial capabilities of the logistics service providers will be a key.
(3) Strategy for the Improvement of Logistics (Hardware)
4.174 The tools to allow for the efficient delivery of logistics services are presently not up to standard in that it is virtually impossible to expect any enhancements in performance. So the first step is to improve the hardware component, and the basic requirements from the point of view of logistics are as shown in Table 4.8.3.
(4) Strategy for the Improvement of Logistics (Software)
4.175 With the improvement of basic transportation infrastructure, the next stage in the strategy of developing logistics is the strengthening of the logistics industry. The industry should be able to optimally use the improved hardware to the benefit of their clients. New management techniques, particularly in integrating the warehouse into the overall logistics chain would have to be promoted. It is also the time to explore advances in information technology (IT) to further enhance the overall performance of logistics services. To this end, the logistics association must be strengthened to give it the resources and support to move towards self-sufficiency in promoting the industry. Areas in human resource devel-opment, professionalization of the industry, piloting of IT applications, and promotion of consolidation centers, are some of the key initiatives to promote the industry.
7 Looking at the convenience store industry in Japan, their advantage is their ability to supply fresh and safe
products that require frequent and timely delivery, resulting in logistics cost accounting for 20% of prices. In spite of this, customers willingly pay for their expensive commodity. As a result, this industry is one of the fastest growing sectors in Japan. In this context, lowering logistics cost is not necessarily the correct answer to every business model.

The Comprehensive Study on the Sustainable Development of Transport System in Vietnam (VITRANSS 2) MAINTEXT
4-51
Table 4.8.3 Logistics Requirements of the Transportation Sector
Subsector Requirement
Road
• Road improvement securing safety and speedy transportation (exclusive expressway is not necessary as long as safety & speedy drive is available)
• Improved and maintained road surfaces • Bypasses around high population areas • Secured night time drive • Eliminating unnecessary traffic control and the reduction on un-
official payment
Rail
• Scheduled operation • Guaranteed total lead time on door-to –door basis • Cargo trace • Combination with truck delivery( transshipment function) • Fostering rail freight forwarders • Access and integration into port services
IWT • Guaranteed total lead time on door-to –door basis • Cargo trace • Combination with truck delivery( transshipment function)
Ports
• Improved port accessibility • Higher port capacity • Facilitation procedure for cargo receipt between forwarder and
terminal operator(To avoid manual operation and unofficial pay-ment)
Air
• Improvement on cargo terminal and liberalization for private warehouse
• Improvement on cargo handling (to avoid damage) • Resolving entry obstacle for forwarders • New airport in HCM area(it is difficult to find out the effective so-
lution avoiding traffic restriction in city area) Source: VITRANSS 2 Study Team.
(5) Strategy for the Improvement of Logistics (Industry Partnership)
4.176 As the industry becomes astute in maximizing the usage of modern infrastructure, further areas to consider are the promotion of intra-industry partnerships. Further efficien-cies can be derived when players cooperate for mutual benefit. Joint carriage, truck pool system, common marketing, and others are but a few innovations that the private sector could come to. At this stage, the promotion of standardization of key elements of opera-tions is important, such as in documentation, technology standards, unit loads, etc. Again, the industry association, with the help of the government, could again play the central role in this regard.

The Comprehensive Study on the Sustainable Development of Transport System in Vietnam (VITRANSS 2) MAINTEXT
4-52
246 484 9731,209
6,211
18,616
0
5,000
10,000
15,000
20,000
1990
1991
1992
1993
1994
1995
1996
1997
1998
1999
2000
2001
2002
2003
2004
2005
2006
No. of
Vehic
les
('000)
Automobile
Motorcycle
4.9 Traffic Safety
1) Rapid Motorization
4.177 In the 1990’s, the number of registered motorized vehicles has rapidly increased with high annual growth rates of 17.8% for motor cycle (M/C) and 7.0% for automobile. The number of M/Cs and automobiles has increased from 1.2 million and 246 thousand in 1990 to 6.2 million and 484 thousand in 2000, respectively. This increasing tendency was accele-rated after 2000 due to import of cheaper priced vehicles from China. The number of M/Cs and automobiles has further increased and reached about 19 million and 1 million, respec-tively, with higher annual growth rates of 20.1% and 12.3%, respectively. (Figure 4.9.1)
Figure 4.9.1 Number of Registered Vehicles (2006)
Source: National Traffic Safety Committee (NTSC).
2) Traffic Conditions on Major National Highways
(1) Road Traffic Volume
4.178 The daily traffic volume varies by national highway and by section. Generally, ar-terial corridors such as national highways of No.1, No.5, No.13, and No.51 have larger au-tomobile traffic volume ranging from 8,000 to 15,000 vehicles in 2004, particularly on the urbanized sections near the large cities of Hanoi, HCM/C and Hai Phong.
4.179 On the other hand, the large M/C traffic volume of more than 10,000 in 2004 is observed not only on the urbanized sections of arterial corridors but also on the sections in the Mekong River Delta. In terms of vehicular traffic volume, average increase ratios of traffic volume from 1999 to 2004 are 1.6 times in automobile and 1.9 times in M/C, re-spectively. Traffic volume at most of the section has been increased. There are a few sec-tions that traffic volume was decreased.
(2) Mixed Road Traffic
4.180 In Vietnam, a mixed traffic of automobiles and M/C is significant. Apparently, this traffic situation tends to be a cause of traffic accidents, because of traffic conflicts be-tween vehicles with different running speeds and body size. As shown in Table 4.9.4, traf-fic volume of M/Cs accounted for more than 65% of the total traffic or 19 times of automo-bile in terms of vehicular traffic volume.

The Comprehensive Study on the Sustainable Development of Transport System in Vietnam (VITRANSS 2) MAINTEXT
4-53
0
5,000
10,000
15,000
20,000
25,000
30,000
35,000
1990
1991
1992
1993
1994
1995
1996
1997
1998
1999
2000
2001
2002
2003
2004
2005
2006
Year
No.
Accidents Fatality Injury
4.181 In general, proportion of automobiles in the traffic on national highways is relative-ly higher compared to the traffic on the other lower classed roads such as provincial/city and district roads, since national highways are mainly used for long-distance trips. In the urbanized areas such as in Hanoi and HCM/C, traffic volume of M/Cs accounted for more or less 90% in terms of vehicular traffic volume. By type of automobiles, proportions of cars, buses and trucks in 2004 accounted for 7.5%, 8.6% and 18.1%, respectively.
4.182 According to the traffic volume on major national highways from 1999 to 2004, the volume of M/Cs and cars showed rapid increases with growth rates of 13.7% and 12.5% per annum, respectively. Although, traffic volumes of buses and trucks were increased, their proportions were slightly decreased due to rapid increase of cars and M/Cs.
3) Traffic Accidents in Vietnam
(1) Trend of Road Traffic Accidents
4.183 Figure 4.9.2 shows the annual number of road traffic accidents, fatalities and inju-ries from 1992 to 2006. In 2006, there were 14,727 road traffic accidents, which resulted to 12,757 fatalities and 11,288 injuries. The road traffic accidents increased rapidly from 1990 to 2002, the peak year of traffic accidents, with an annual increase rate of 13.5%. During this 12-year period, the number of fatalities has particularly increased 5.8 times. The number of accidents, fatalities and injuries has reached 27,993, 13,186 and 30,999, respectively. However, the number of traffic accidents and injuries dramatically fell after 2003, although the number of fatalities remained high and relatively constant around 12,000 per year.
Figure 4.9.2 Road Traffic Accidents in Vietnam (1990-2006)
Source: National Traffic Safety Committee (NTSC).
4.184 There may be systematic bias in the reporting of data on road traffic accidents since Vietnam’s 0.87 fatalities per accident (2006) is extremely high as compared with its neighboring countries, with only 0.17 in Thailand and 0.02 in Malaysia (2000). Fairly con-stant fatalities from 2002 to 2006, in contrast to rapidly declining accidents and injuries in the same period, also point to statistical inconsistency. Significant under-reporting of acci-dents and injuries are suspected, relative to the number of fatalities, which should be more reliable.

The Comprehensive Study on the Sustainable Development of Transport System in Vietnam (VITRANSS 2) MAINTEXT
4-54
0.0
1.0
2.0
3.0
4.0
5.0
1990
1991
1992
1993
1994
1995
1996
1997
1998
1999
2000
2001
2002
2003
2004
2005
2006
Year
No.
/10,
000
pop.
Accident Fatality Injury
(2) Traffic Accident per Population
4.185 Figure 4.9.3 shows the fluctuation of indices of traffic accidents per 10,000 per-sons. The fluctuation trend is almost the same as those of numbers as described pre-viously, because increase of population is constant at about 2% growth rate. Rates of ac-cidents and injuries were increasing until 2002, but decreased later by less than 2 per 10,000 persons. However, fatality rate was still high at about 1.5 per 10,000 persons.
Figure 4.9.3 Road Traffic Accidents per 10,000 Population (1990-2006)
Source: VITRANSS 2 Study Team.
(3) Traffic Accident per Motorized Vehicles
4.186 The number of road traffic accidents has been increasing as the number of moto-rized vehicles including M/Cs increased. This is due to the rapid motorization that Vietnam has been experiencing since the 1990s. As statistics would show, from 1900 to 2006, the number of motorized vehicles has sharply increased 13.5 times (4.0 times in cars and 15.4 times in M/C). On the other hand, as shown in Figure 4.9.4, the rates of accidents and injuries are sharply decreasing through the years. However, fatality rate still remains at a critical level of 6.5 per 10,000 motorized vehicles.
Figure 4.9.4 Road Traffic Accidents per 10,000 Motorized Vehicle (1990-2006)
0.0
10.0
20.0
30.0
40.0
50.0
1990
1991
1992
1993
1994
1995
1996
1997
1998
1999
2000
2001
2002
2003
2004
2005
2006
Year
No.
/10,
000
veh.
Accident Fatality Injury
Source: VITRANSS 2 Study Team.

The Comprehensive Study on the Sustainable Development of Transport System in Vietnam (VITRANSS 2) MAINTEXT
4-55
(4) Geographical Distribution of Traffic Accidents
4.187 Traffic accidents are occurring nationwide. However, as shown in the Table 4.9.1, more than 40% of accidents with nearly 6,000 fatalities are occurring in South Vietnam in 2006. HCM/C accounted for 9% of the total accidents with more than 1,000 fatalities. In terms of rate per population, the regions of Southeast, Central Highlands, South Central Coast and Northeast indicated higher rate in each indicator of accident, fatality and injury.
4.188 Figure 4.9.5 shows the number of accident fatalities and fatality rate by province. As shown in this figure, provinces with more than 450 fatalities are located in HCM/C and Dong Nai in the south and Hanoi in the north. On the other hand, provinces with high fa-tality rate (more than 2 fatalities per 10,000 persons) are distributed in the regions of Cen-tral Vietnam and the Southeast.
Table 4.9.1 Road Traffic Accidents by Region (2006)
Region No. of Accidents
No. of Fatalities
No. of Injuries
Accident Rate (per 10,000 pop.)
Fatality Rate (per 10,000 pop.)
Injury Rate (per 10,000 pop.)
I. Red River Delta 2,716 2,156 1,832 1.5 1.2 1.0 II. North East 1,760 1,253 1,681 1.9 1.3 1.8 III. North West 383 290 393 1.5 1.1 1.5 IV. North Central Coast 1,277 1,288 810 1.2 1.2 0.8 V. South Central Coast 1,415 1,270 1,184 2.0 1.8 1.7 VI. Central Highlands 1,124 938 787 2.3 1.9 1.6 VII. South East 3,667 3,004 2,966 2.7 2.2 2.1 VIII. Mekong River Delta 2,230 1,937 2,146 1.3 1.1 1.2
Vietnam 14,572 12,136 11,799 1.7 1.4 1.4 Source: Road and Rail Transport Division, MOPS.
Figure 4.9.5 Number of Accident Fatalities and Fatality Rate by Province (2006)
No. of Fatalities Fatality Rate
Source: Road and Rail Transport Division, MOPS.
Fatality Rate per 10,000 Persons2006
2 to 31.5 to 21 to 1.50 to 1
No. of Fatalities2006
450 to 1,100300 to 450150 to 300
0 to 150

The Comprehensive Study on the Sustainable Development of Transport System in Vietnam (VITRANSS 2) MAINTEXT
4-56
(5) Age Distribution
4.189 As shown in the Figure 4.9.6, age of accident offender forms a normal distribution. Age group from 20 to 29 years old accounted for 38% of the total offenders, followed by those in the 30’s age group, which shares 19% of the total. Young people aged below 20 years and those in the older age group of 60 years old and above still share 14% and 2%, respectively.
Figure 4.9.6 Traffic Accidents by Age Group (2001)
0
5
10
15
20
25
0-15 16-19 20-24 25-29 30-39 40-49 50-59 60 andover
Age Group
%
Source: People’s Police Academy (Sampled Data Analysis).
(6) Accident Type
4.190 Figure 4.9.7 shows the composition of traffic accidents by accident type from 2002 to 2006. Accident type is defined by MOPS in its Decision 768/2006/QD-BCA (C11) is-sued in 20 June 2006, and classification is basically dependent on the seriousness of ac-cident such as number of fatalities, injuries and property losses, etc. As shown in this fig-ure, in 2006, the serious accidents accounted for about 70% of the total accidents and the very serious and extremely serious accidents accounted for less than 8% of the total. Proportion of the serious accidents has been increasing as proportion of the less serious accidents has been decreasing since 2002.
Figure 4.9.7 Traffic Accidents by Accident Type (2002-2006)
46.1 41.5 34.926.0 23.0
45.3 51.6 58.566.2 69.1
7.4 5.7 5.4 5.4 6.21.2 1.3 1.2 2.4 1.7
0%
20%
40%
60%
80%
100%
2002 2003 2004 2005 2006
Extremely SeriousVery SeriousSeriousLess Serious
Source: Road and Rail Transport Division, MOPS.

The Comprehensive Study on the Sustainable Development of Transport System in Vietnam (VITRANSS 2) MAINTEXT
4-57
(7) Vehicle Type
4.191 Figure 4.9.10 shows the composition of traffic accidents by vehicle type of offend-er from 2002 to 2006. By vehicle type, 67% of road traffic accidents were caused by M/C, 20% by automobile and 13% by other road users including bicycle and pedestrian.
Figure 4.9.8 Traffic Accidents by Vehicle Type (2002-2006)
22.0 23.3 20.8 17.5 20.4
69.6 66.5 66.265.4 66.7
1.3 0.1 0.60.3
0.3
1.0 1.6 1.72.1
1.8
6.1 8.5 10.6 14.0 10.8
0%
20%
40%
60%
80%
100%
2002 2003 2004 2005 2006
OthersPedestrianBicycleMotorcycleAutomobile
Source: Road and Rail Transport Division, MOPS.
4) Government Strategies and Initiatives
4.192 The number of accidents, fatalities and injuries has reached 27,993, 13,186 and 30,999, respectively in 2002 as the peak year in the past 12 years. However, the number of traffic accidents and injuries dramatically fell after 2003, although the number of fatali-ties remained high and relatively constant around 12,000 per year.
4.193 This fall of traffic accident incidents is attributed chiefly by the government initia-tives to enhance traffic safety. However, to make sure of further reduction of traffic acci-dent and number of victims both the government initiatives and peoples awarness on the traffic safety is needed.
4.194 Based on the result of analysis on the cause of traffic accidents and identification of issues a comprehensive master plan on the traffic safety has been prepared under the technical collaboration of JICA. The recommendations and developed policies spelled out in “The Study on National Road Traffic Safety Master Plan” (October 2008) is expected to be legislated soon by the government of Vietnam so as to effectuate the objectives of the comprehensive traffic safety master plan.
4.195 This master plan is composed of following components:
(i) Improvement of road network; (ii) Improvement of design standards for road and road safety facilities; (iii) Establishment of traffic safety audit; (iv) Development of traffic safety corridor; (v) Improvement of driver licensing system; (vi) Improvement of vehicle inspection system; (vii) Enhancement of traffic safety education; (viii) Establishment of medial emergency system; and (ix) Improvement of traffic accident victim support system.

The Comprehensive Study on the Sustainable Development of Transport System in Vietnam (VITRANSS 2) MAINTEXT
5-1
5 TRANSPORTATION DEMAND FORECAST
5.1 Methodology
5.1 Figure 5.1.1 presents the outline of the demand forecast methodology adopted in VITRANSS 2. For more details, refer to Technical Report No.3.
5.2 The demand forecast is divided into two parts, namely, passenger and freight. The starting point of both is the creation of current origin-destination (OD) tables based on the transportation and traffic surveys conducted by VITRANSS 2 and other relevant data collected from various government agencies. While passenger OD tables are prepared by mode (i.e., road, railway, inland waterway, shipping, and air), freight OD tables are further broken down by cargo type (13 types such as rice, wood, steel, etc.).
5.3 Using these OD tables and socio-economic indicators of the study area, forecast models were constructed. Both for passenger and freight, the conventional four-step modeling was adopted, i.e., generation/attraction, distribution, modal split and assignment. For freight, however, production and/or consumption should be determined by traffic zone for all 13 cargoes prior to stepping into the four-step modeling process, because this is the root cause of freight traffic.
5.4 Once models were built, future conditions in terms of socio-economic indicators and proposed projects were inputted to the models. The models output the simulation re-sults for the target years, and if they were not satisfactory, the input conditions were changed. The reiteration of this process is the core of transportation planning.
Table 5.1.1 Outline of Demand Forecast Methodology
Source: VITRANSS 2 Study Team.
VITRANSS2 Transport Surveys (Traffic volume and OD for road, port, rail, etc.)
2008 OD Tables by mode 2008 Transport Network 2008 OD Tables by Mode and by Cargo Type (13 Types)
Model Building•Generation/Attraction
•Distribution•Modal Split•Traffic Assignment
Model Building•Production/Consumption•Generation/Attraction•Distribution•Modal Split•Traffic Assignment
Future (2020,2030)Projects
Future (2020,2030)Transport Network Characteristics
Future (2020,2030) PassengerOD tables and traffic volumes
Future (2020,2030) FreightOD tables and traffic volumes
Passenger Freight
2008Socio‐economic Indicators•Population•GRDP•Employment, etc.
Future (2020,2030)Socio‐economic Indicators•Population•GRDP•Employment, etc.

The Comprehensive Study on the Sustainable Development of Transport System in Vietnam (VITRANSS 2) MAINTEXT
5-2
5.2 Socio-economic Framework
5.5 The socio-economic framework was estimated for the years 2010, 2020, and 2030. Population, urban population, and GDP were forecasted for the entire Vietnam and its 64 provinces. For details by province, refer to Technical Report No. 6 on regional plan-ning and socio-economic development framework.
1) Population
5.6 In VITRANSS 2, population growth rates were taken basically from the NCPFP forecast for the entire Vietnam and each region taking into account the regional develop-ment directions. After adjusting the calculated values against actual statistics for 2005, na-tional and regional populations were estimated as shown below.
Table 5.2.1 Summary of Population Forecasts
Region Population (000) Growth Rate (%/yr)
2005 2010 2020 2030 2005─2010 2010─2020 2020─2030 Vietnam Total 83,120 88,971 101,439 113,954 1.4 1.3 1.2
1. Red River Delta 18,040 19,054 21,788 24,670 1.1 1.4 1.3 2. Northeast 9,358 9,763 10,552 11,382 0.8 0.8 0.8 3. Northwest 2,566 2,876 3,338 3,757 2.3 1.5 1.2 4. North Central Coast 10,620 11,162 12,378 13,673 1.0 1.0 1.0 5. South Central Coast 7,050 7,513 8,464 9,443 1.3 1.2 1.1 6. Central Highlands 4,759 5,395 6,261 6,747 2.5 1.5 0.8 7. Southeast 13,460 15,007 18,711 22,585 2.2 2.2 1.9 8. Mekong River Delta 17,267 18,202 19,948 21,697 1.1 0.9 0.8
Note: Estimated by VITRANSS 2 Study Team based on NCPFP projections and modified based on actual 2005 data.
2) Urban Population
5.7 Urban population was estimated based on past trends and NCPFP projections. Urban population will increase continuously over the forecast period and its ratio to the total popula-tion will be over 40% by 2030. Major urban centers in Vietnam, such as Hanoi and HCMC, will attract a number of migrants from the rural areas. National and regional urban population was projected in the same manner as the total population, as shown in Table 5.2.2.
Table 5.2.2 Summary of Urban Population Forecast
Region Population (000) Growth Rate (%/yr)
2005 2010 2020 2030 2005─2010 2010─2020 2020─2030 Vietnam Total 22,416 27,407 39,033 52,454 4.1 3.6 3.0
1. Red River Delta 4,484 5,805 8,700 11,837 5.3 4.1 3.1 2. Northeast 1,768 1,952 2,379 2,900 2.0 2.0 2.0 3. Northwest 357 400 474 561 2.3 1.7 1.7 4. North Central Coast 1,455 1,712 2,369 3,183 3.3 3.3 3.0 5. South Central Coast 2,121 2,580 3,819 5,233 4.0 4.0 3.2 6. Central Highlands 1,337 1,831 2,711 3,643 6.5 4.0 3.0 7. Southeast 7,328 8,788 12,158 16,340 3.7 3.3 3.0 8. Mekong River Delta 3,566 4,339 6,423 8,758 4.0 4.0 3.2 Note: Estimated by VITRANSS 2 Study Team based on NCPFP projection, modified based on 2005 actual data.

The Comprehensive Study on the Sustainable Development of Transport System in Vietnam (VITRANSS 2) MAINTEXT
5-3
5.8 Table 5.2.3 summarizes the rate of urban population by region. The Southeast Region that includes HCMC shows the highest urbanization ratio.
Table 5.2.3 Forecast of Urban Population Rate by Region
Region Urban Population Rate (%) 2005 2010 2020 2030
Vietnam Total 27.0 30.8 38.5 46.0 1. Red River Delta 24.9 30.5 39.9 48.0 2. Northeast 18.9 20.0 22.5 25.5 3. Northwest 13.9 13.9 14.2 14.9 4. North Central Coast 13.7 15.3 19.1 23.3 5. South Central Coast 30.1 34.3 45.1 55.4 6. Central Highlands 28.1 33.9 43.3 54.0 7. Southeast 54.4 58.6 65.0 72.3 8. Mekong River Delta 20.7 23.8 32.2 40.4
Note: Estimated by VITRANSS 2 Study Team based on NCPFP projection, modified based on 2005 ac-tual data.
3) GDP and GDP per Capita
5.9 Vietnam’s economy grew at an annul rate of more than 7% from 2001 to 2007. The main engine of this high growth has been the heavy investment by the government, private sector, and foreign countries. Actually, the average investment ratio to the GDP reached 45% from 1991 to 2005. Therefore, development alternative scenarios were pre-pared in three patterns in terms of investment ratio to the GDP. These are high-, medium- and low-growth scenarios. During the period from 2005 to 2030, the average annual growth rate is expected to reach 7.2% in the high-growth scenario, 6.4% in the medium-growth scenario, and 5.6% in the low-growth scenario. For the purpose of forecasting traf-fic demand, the medium-growth scenario was selected as the most realistic. The table be-low shows the regional distribution of GRDP forecasted by VITRANSS 2 for this scenario.
Table 5.2.4 Regional Distribution of GDP under a Medium-growth Scenario
Region GRDP Distribution (VDN bil. at 1994 constant prices) 2005 2010 2020 2030
Vietnam Total 393,028 574,253 1,082,983 1,858,609 1. Red River Delta 83,695 126,336 248,267 435,591 2. Northeast 25,059 34,455 60,978 108,881 3. Northwest 4,831 5,891 12,563 28,300 4. North Central Coast 26,869 37,327 65,939 119,634 5. South Central Coast 24,689 35,603 70,793 130,789 6. Central Highlands 14,740 20,099 38,775 65,662 7. Southeast 142,966 223,810 422,836 690,210 8. Mekong River Delta 70,179 90,733 162,832 279,541 Source: VITRANSS 2 Study Team.
5.10 Per capita GRDP by region is presented in Table 5.2.5.
Table 5.2.5 Per-capita GDP/GRDP by Region under a Medium-growth Scenario
Region VITRANSS 2 Forecast (VND mil. at 1994 constant prices) 2005 2010 2020 2030
Vietnam Total 4.7 100 6.5 100 10.7 100 16.3 100 1. Red River Delta 4.6 98 6.6 102 11.4 106 17.7 108 2. Northeast 2.7 57 3.5 54 5.8 54 9.6 59 3. Northwest 1.9 40 2.0 31 3.8 35 7.5 46 4. North Central Coast 2.5 53 3.3 51 5.3 49 8.7 53 5. South Central Coast 3.5 74 4.7 72 8.4 78 13.9 85 6. Central Highlands 3.1 66 3.7 57 6.2 58 9.7 60 7. Southeast 10.6 226 14.9 229 22.6 211 30.6 187 8. Mekong River Delta 4.1 87 5.0 77 8.2 76 12.9 79
Source: VITRANSS 2 Study Team.

The Comprehensive Study on the Sustainable Development of Transport System in Vietnam (VITRANSS 2) MAINTEXT
5-4
2005
y = 14.882x - 272.6
R2 = 0.8826
0
10,000
20,000
30,000
40,000
50,000
60,000
70,000
80,000
0 1,000 2,000 3,000 4,000 5,000 6,000
Urban Population
GR
DP
(Seconda
ry+Tert
iary
secto
rs)
2010
0
20,000
40,000
60,000
80,000
100,000
120,000
140,000
0 1000 2000 3000 4000 5000 6000 7000
Urban Population
GR
DP
(Seconda
ry+Tert
iary
secto
rs)
2020
0
50,000
100,000
150,000
200,000
250,000
0 2000 4000 6000 8000 10000
Urban Population
GR
DP
(Seconda
ry+Tert
iary
secto
rs)
2030
0
50,000
100,000
150,000
200,000
250,000
300,000
350,000
400,000
0 2000 4000 6000 8000 10000 12000
Urban Population
GR
DP
(Seconda
ry+Tert
iary
secto
rs)
2005
y = 14.882x - 272.6
R2 = 0.8826
0
2,000
4,000
6,000
8,000
10,000
12,000
14,000
0 200 400 600 800 1,000
Urban Population
GR
DP
(Seconda
ry+Tert
iary
secto
rs)
2010
0
5,000
10,000
15,000
20,000
0 200 400 600 800 1000 1200
Urban Population
GR
DP
(Seconda
ry+Tert
iary
secto
rs)
2020
0
5,000
10,000
15,000
20,000
25,000
30,000
35,000
40,000
0 200 400 600 800 1000 1200 1400 1600 1800
Urban Population
GR
DP
(Seconda
ry+Tert
iary
secto
rs)
2030
0
10,000
20,000
30,000
40,000
50,000
60,000
70,000
0 500 1000 1500 2000
Urban Population
GR
DP
(Seconda
ry+Tert
iary
secto
rs)
5.11 The GRDP of the secondary/tertiary sector has a strong correlation with urban population as illustrated in Figure 5.2.1. In order to determine the GDP structure by sector, this correlation was used for each province (with a correction by the ratio of actual figure to theoretical figure).
Figure 5.2.1 Interrelationship between Urban Population and GRDP of Secondary / Tertiary Sectors
Source: VITRANSS 2 Study Team.

The Comprehensive Study on the Sustainable Development of Transport System in Vietnam (VITRANSS 2) MAINTEXT
5-5
5.3 Passenger Transportation Demand
1) Methodology
5.12 As stated earlier, models for demand forecast followed the conventional four-step method, namely (i) trip generation/attraction, (ii) trip distribution, (iii) modal split, and (iv) traffic assignment. The trip generation/attraction model is often used in combination with the trip production model to control the total number of trips generated in a study area. In this study, however, the output of the trip generation/attraction model was used as is.
Figure 5.3.1 Demand Forecasting Flow Generation/Attraction
Model
Distribution Model
Modal Split Models
Assignment Model
Source: VITRANSS 2 Study Team.
2) Trip Generation/Attraction
5.13 Similar to the VITRANSS 1 case, the urban population and GRDP were adopted as explanatory variables in the following regression equations:
Gi = 1.675 * UPOPi * (GRDPi/Upop) 0.9643 Aj = 1.674 * UPOPj * (GRDPi/Upop) 0.9644
Where, Gi: Generation of Zone i Aj: Attraction of Zone j UPOPi: Urban Population of Zone i (unit: 000) GRDPi: GRDP of Zone i (VND billion)
Table 5.3.1 Trip Generation/Attraction Model
Variable Generation Model Attraction Model
Coefficient t Value Coefficient t Value Constant 1.675 0.90 1.675 0.90 (GRDP/Urban population) 0.9643 5.02 0.9644 5.01 Multiple correlation coefficient 0.8476 0.8475 Number of samples 64 64
Source: VITRANSS 2 Study Team.
5.14 The ratio of actual value to theoretical value was used as adjustment factor simi-larly to the VITRANSS 1 case.
Population 0.7273 Urban Population 0.8405 GRDP (Total) 0.8447 GRDP (Secondary) 0.7406 GRDP (Tertiary) 0.8638 GRDP/Pop’n 0.4534 GRDP/Upop 0.1363
Correlation with Passenger Movement

The Comprehensive Study on the Sustainable Development of Transport System in Vietnam (VITRANSS 2) MAINTEXT
5-6
Passenger Demand
0
500
1,000
1,500
2,000
2,500
3,000
3,500
4,000
1990 2000 2010 2020 2030 2040
Pax
(000
/day
)
VITRANSS-1VITRANSS-2V-2 (Low case)V-2 (high case)
Figure 5.3.2 Passenger Demand Comparison between VITRANSS 1 and VITRANSS 2
Sources: VITRANSS 1 (1999) and VITRANSS 2 Study Team.
3) Trip Distribution
5.15 Several gravity models were tested. By direction, it was assumed symmetric. The following equation with a dummy parameter was adopted.
C X Gia X Aj
b X (dum)d
GCijcTij =
Where, C: Constant Tij: No. of trips between Zone i and j Gi: Average of Trip Generation and Attraction of Zone i Aj: Average of Trip Generation and Attraction of Zone j GCij: Generalized Cost between Zone i and j GCij = (time)*VoT + (cost) dum: a dummy constant a, b, c, and d: parameters
Note: Value of Time (VoT) was determined at VND437/min and VND1237/min for 2008 and 2030, respectively, as a weighted average of car and bus passengers.
Study 1999 2008 2010 2020 2030
VITRANSS 1 600 - 1,097 2,007 - VITRANSS 2 (Med) 600 985 1,105 1,850 2,978 VITRANSS 2 (Low) 600 985 1,105 1,711 2,521
VITRANSS 2 (High) 600 985 1,105 2,001 3,520

The Comprehensive Study on the Sustainable Development of Transport System in Vietnam (VITRANSS 2) MAINTEXT
5-7
0
100,000
200,000
300,000
400,000
500,000
600,000
700,000
100 200 300 400 500 600 700 800 900 1000 1200 1400 1600 1800
Trip Length
Figure 5.3.3 Trip Distribution Model
Source: VITRANSS 2 Study Team.
5.16 After applying the trip distribution model mentioned above, the Fratar conver-gence calculation was conducted to adjust the OD values to the trip generation/attraction estimated earlier.
Figure 5.3.4 Comparison of Distribution Model Value (With Dummy Variable) and No. of Actual Trips
Distribution Model (With Dummy Variable)
0
20,000
40,000
60,000
80,000
100,000
0 20,000 40,000 60,000 80,000 100,000
Actual Trips
Est
imate
d T
rips
Source: VITRANSS 2 Study Team.
Variable Coefficient t-Value Constant 2.5566 2.96 Generation 0.5006 24.44 Attraction 0.4632 22.22 Distance Impedance 0.8431 35.05 Dummy 1.7349 54.60 Multiple Correlation Coefficient 0.9377 Number of Samples 772

The Comprehensive Study on the Sustainable Development of Transport System in Vietnam (VITRANSS 2) MAINTEXT
5-8
5.17 The estimated results are shown in Figures 5.3.5 through 5.3.7.
Source: VITRANSS 2 Study Team. Source: VITRANSS 2 Study Team.
Figure 5.3.7 Distribution of Car, Bus, Rail, and Air Passengers by 2030
Source: VITRANSS 2 Study Team.
340 - 350150 - 100
55,426
342,131
105,412
45,048114,364
11,678
1,46
9
23,078
2,24
9
103,345
SE
MRD
SCC
37,890
7,08
6
39,083
4,62819,023
RRD,NE&NW
100 - 5050 - 3030 - 2020 - 10
Pax (000)/day
10 - 0
CH
NCC
20 -159,880
74,629
20,679
9,83921,320
NCC
3,121
420
5,044
340
24,738
SE
MRD
SCC
CH
5,653
1,96
5
4,106
9344,263
RRD,NE&NW
25 -20
15 -1010 - 6
6 - 0
Pax (000)/day75 -70
Figure 5.3.5 Distribution of Car, Bus, Rail, Air, and MC Passengers in 2008
20 -15
35 -2525 -20
15 -10
9,950
127,417
31,864
16,18326,005
NCC
3,121
420
5,044
1,81
6
24,738
SE
MRD
SCC
CH
5,969
1,96
5
4,485
9344,263
RRD,NE&NW
10 - 55 - 0
Pax (000)/day130 -120
Figure 5.3.6 Distribution of Car, Bus, Rail, and Air Passengers in 2008
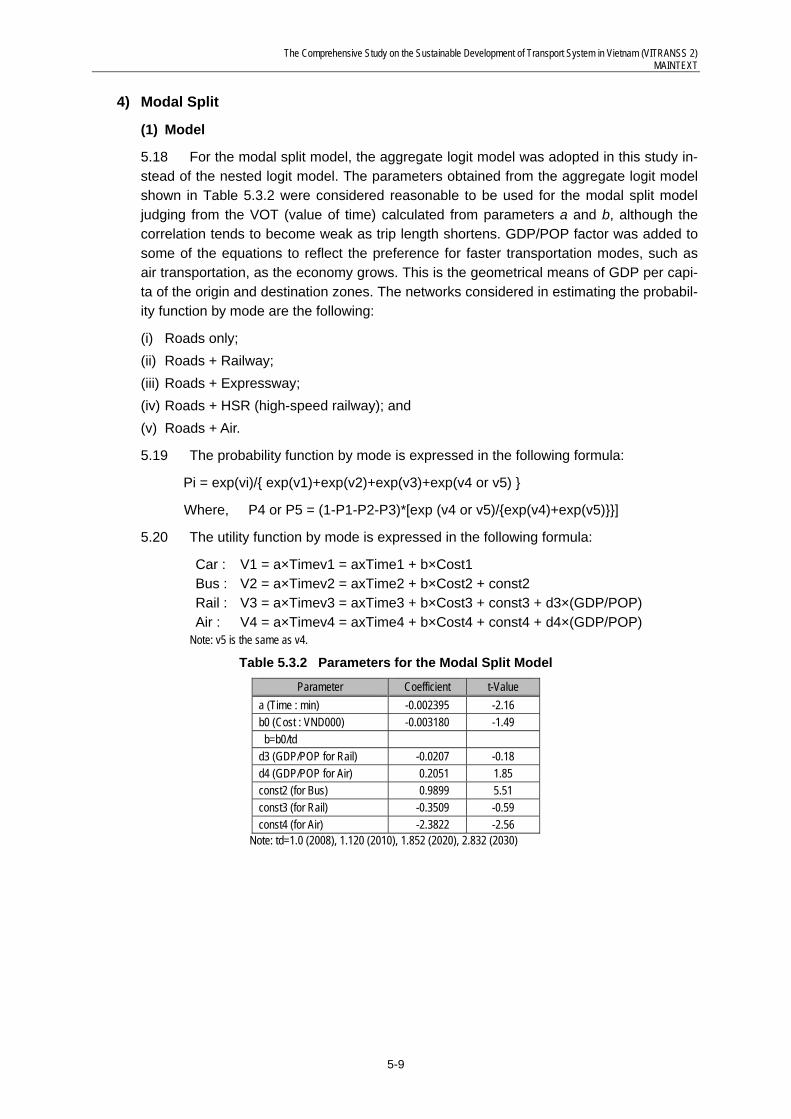
The Comprehensive Study on the Sustainable Development of Transport System in Vietnam (VITRANSS 2) MAINTEXT
5-9
4) Modal Split
(1) Model
5.18 For the modal split model, the aggregate logit model was adopted in this study in-stead of the nested logit model. The parameters obtained from the aggregate logit model shown in Table 5.3.2 were considered reasonable to be used for the modal split model judging from the VOT (value of time) calculated from parameters a and b, although the correlation tends to become weak as trip length shortens. GDP/POP factor was added to some of the equations to reflect the preference for faster transportation modes, such as air transportation, as the economy grows. This is the geometrical means of GDP per capi-ta of the origin and destination zones. The networks considered in estimating the probabil-ity function by mode are the following:
(i) Roads only; (ii) Roads + Railway; (iii) Roads + Expressway; (iv) Roads + HSR (high-speed railway); and (v) Roads + Air.
5.19 The probability function by mode is expressed in the following formula:
Pi = exp(vi)/{ exp(v1)+exp(v2)+exp(v3)+exp(v4 or v5) }
Where, P4 or P5 = (1-P1-P2-P3)*[exp (v4 or v5)/{exp(v4)+exp(v5)}}]
5.20 The utility function by mode is expressed in the following formula:
Car : V1 = a×Timev1 = axTime1 + b×Cost1 Bus : V2 = a×Timev2 = axTime2 + b×Cost2 + const2 Rail : V3 = a×Timev3 = axTime3 + b×Cost3 + const3 + d3×(GDP/POP) Air : V4 = a×Timev4 = axTime4 + b×Cost4 + const4 + d4×(GDP/POP)
Note: v5 is the same as v4.
Table 5.3.2 Parameters for the Modal Split Model
Parameter Coefficient t-Value a (Time : min) -0.002395 -2.16 b0 (Cost : VND000) -0.003180 -1.49 b=b0/td d3 (GDP/POP for Rail) -0.0207 -0.18 d4 (GDP/POP for Air) 0.2051 1.85 const2 (for Bus) 0.9899 5.51 const3 (for Rail) -0.3509 -0.59 const4 (for Air) -2.3822 -2.56
Note: td=1.0 (2008), 1.120 (2010), 1.852 (2020), 2.832 (2030)

The Comprehensive Study on the Sustainable Development of Transport System in Vietnam (VITRANSS 2) MAINTEXT
5-10
(2) Assumptions on Operating Conditions
5.21 In projecting modal shares, operating conditions were assumed by mode, and access penalty was specified for air, HSR, and conventional rail (CR) (see Table 5.3.3).
Table 5.3.3 Assumed Operating Conditions by Mode
Scenario Road Railway
Air Existing Road Expressway CR HSR
Car Bus Car Bus
2008 Speed (km/h) 40 32 - - 60 - 800 Fare (VND/km) 533 296 - - 329 - 1,532 Access Penalty (min) - - - - 30 - 180
2030 Do-Nothing
Speed (km/h) 40 32 - - 60 - 800 Fare (VND/km) 533 296 - - 329 - 1,532 Access Penalty (min) - - - - 30 - 180
2030 Scenario 1
(Improved CR+Expwy)
Speed (km/h) 40 32 100 80 100 - 800 Fare (VND/km) 533 296 576 315 329 - 1,532 Access Penalty (min) - - - - 30 - 180
2030 Scenario 2
(Improved CR +Expwy+HSR)
Speed (km/h) 40 32 100 80 100 300 800 Fare (VND/km) 533 296 576 315 329 1,532 1,532
Access Penalty (min) - - - - 30 60 180
Source: VITRANSS 2 Study Team.
(3) Modal Shares for Different Scenarios by 2030
5.22 Table 5.3.4 shows the estimated modal shares for different scenarios by 2030. By that year, if the transportation network does not improve, air will gain a large share in in-ter-city passenger transportation, while the share of bus will significantly decrease. If ex-isting VR lines (CR) are improved from speeds of 60km/h to 100km/h and all the ex-pressways planned by MOT are developed (Scenario 1), the share of bus and CR will not decrease much and the gain of air will remain moderate. The HSR, when implemented (Scenario 2), will have a share of about 5% and 12% in terms of number of passengers and passenger-km, respectively. The share of HSR will come mainly from air and bus. CR will not be affected by the HSR due to its role of access mode to the HSR.
Table 5.3.4 Demand Analysis Results by Mode Car Bus CR HSR Air Total
2008
No. of pax/day (000) 292 645 31 - 17 985 Modal share (pax, %) 29.6 65.5 3.1 - 1.7 100.0 Modal share (pax-km, %) 15.7 68.6 7.5 - 8.2 100.0 Average Trip Length (km) 92 181 419 - 823 174
2030 Do Nothing
No. of pax/day (000) 708 1792 54 - 423 2978 Modal share (pax, %) 23.8 60.2 1.8 - 14.2 100.0 Modal share (pax-km, %) 15.3 40.5 2.1 - 42.1 100.0 Average Trip Length (km) 148 155 269 - 682 230
2030 Scenario 1
(Improved CR + Expwy)
No. of pax/day (000) 739 1,932 115 - 191 2,978 Modal share (pax, %) 24.8 64.9 3.9 - 6.4 100.0 Modal share (pax-km, %) 19.4 51.6 4.4 - 24.6 100.0 Average Trip Length (km) 189 194 278 - 932 243
2030 Scenario 2
(Improved CR +Expwy+HSR)
No. of pax/day (000) 719 1,880 109 146 123 2,978 Modal share (pax, %) 24.2 63.1 3.7 4.9 4.1 100.0 Modal share (pax-km, %) 18.4 48.4 4.3 11.6 17.3 100.0 Average Trip Length (km) 186 187 284 575 1,024 244
Source: VITRANSS 2 Study Team. Note: In the “Do nothing” case, the 2008 transportation network was applied. Scenario 1 assumed an improved CR (up to
100kph) and all planned expressways completed excluding the Ho Chi Minh route. Scenario 2 assumed HSR at 300kph (fare is equal to air’s) plus the Scenario 1 network. Pax-km figures are calculated by representative mode including its access/egress.

The Comprehensive Study on the Sustainable Development of Transport System in Vietnam (VITRANSS 2) MAINTEXT
5-11
5.23 Table 5.3.5 shows the number of passengers and the estimated modal shares for representative OD pairs (along the North-South Corridor). The share of HSR is higher in the medium-distance section, such as Hanoi–Danang and HCMC–Danang, than in the long-distance section of Hanoi–HCMC. However, passenger movements in Hanoi–HCMC section can become stronger as in Japan, as shown in Figure 5.3.8.
Table 5.3.5 Results of Demand Analysis on the North-South Corridor Car Bus CR HSR Air Total
2008
No. of pax/day
Hanoi - DaNang 27 143 425 - 1,351 1,946 Hanoi - HCMC 36 1,606 1,537 - 6,960 10,139 HCMC - DaNang 17 765 552 - 2,381 3,715
Share (%)
Hanoi - DaNang 1 7 22 - 69 100 Hanoi - HCMC 0 16 15 - 69 100 HCMC - DaNang 0 21 15 - 64 100
2030 Do-nothing Scenario
No. of pax/day
Hanoi - DaNang 24 48 6 - 3,278 3,356 Hanoi - HCMC 12 24 2 - 17,036 17,074 HCMC - DaNang 54 134 18 - 7,602 7,808
Share (%)
Hanoi - DaNang 1 1 0 - 98 100 Hanoi - HCMC 0 0 0 - 100 100 HCMC - DaNang 1 2 0 - 97 100
2030 Scenario 1
(Improved CR + Expwy)
No. of pax/day
Hanoi - DaNang 88 220 36 - 3,012 3,356 Hanoi - HCMC 138 354 52 - 16,530 17,074 HCMC - DaNang 162 432 56 - 7,154 7,804
Share (%)
Hanoi - DaNang 3 7 1 - 90 100 Hanoi - HCMC 1 2 0 - 97 100 HCMC - DaNang 2 6 1 - 92 100
2030 Scenario 2
(Improved CR + Expwy +
HSR)
No. of pax/day
Hanoi - DaNang 88 220 36 1,478 1,536 3,356 Hanoi - HCMC 138 354 52 5,174 11,354 17,072
HCMC - DaNang 162 432 56 3,004 4,150 7,804
Share (%)
Hanoi - DaNang 3 7 1 44 46 100 Hanoi - HCMC 1 2 0 30 67 100 HCMC - DaNang 2 6 1 38 53 100
Source: VITRANSS 2 Study Team.
Figure 5.3.8 Comparison of Traffic Flows between Cities in Japan and Vietnam
Trip Demand from Tokyo (2005) and HN-DN-HCM (2008 & 2030)
0
10,000
20,000
30,000
40,000
50,000
60,000
0 200 400 600 800 1000 1200 1400 1600 1800
Distance (km)
No.
of p
ax/d
ay
HN-HCM
Naha
Sapporo
Fukuoka
OsakaNagoya
HCM-DN
HN-DN
Kobe
Sendai
Shizuoka
Yamanashi
Hiroshima
2030
2008203020082030
2008
Source: VITRANSS 2 Study Team.

The Comprehensive Study on the Sustainable Development of Transport System in Vietnam (VITRANSS 2) MAINTEXT
5-12
Figure 5.3.9 Intermodal Relationships among Regions 2008 Current Situation 2030 Do-nothing Scenario 2030 Scenario1 (Improved CR + Expressway)
2030 Scenario 2 (Improved CR + Expressway + HSR [300 km/h, Equal to Airfare])
Vinh HCMC Mekong River DeltaDanangHanoi
263 266
353332
362
100
200
300
400
North South
HSR
Pax/day (000)
Car Bus CR Air
(Representative mode of travel)
Vinh HCMC Mekong River DeltaDanangHanoi
221,663
North South
Car Bus CR Air
(Representative mode of travel)
100
200
300
400
Pax/day (000)
263 266
353332
362
Vinh HCMC Mekong River DeltaDanangHanoi
58 5972
6579
100
50
North South
Car Bus CR Air
(Representative mode of travel)
Pax/day (000)
Vinh HCMC Mekong River DeltaDanangHanoi
221,663
North South
Car Bus CR Air
(Representative mode of travel)
100
200
300
400
Pax/day (000)
263 266
353332
362

The Comprehensive Study on the Sustainable Development of Transport System in Vietnam (VITRANSS 2) MAINTEXT
5-13
2008 Current Scenario
2030 Do-nothing Sce-nario
0
100
200
300
400
500
600
200 400 600 800 1000 1200 1400 1600 1800 2000km
Pax(000)
CarBusCRAir
0200400600800
1,0001,2001,4001,6001,800
0-200 200-400
400-600
600-800
800-1000
1000-1200
1200-1400
1400-1600
1600-1800
1800-2000
km
Pax(000)
CarBusCRAir
0
200
400
600
8001,000
1,200
1,400
1,600
1,800
0-200 200-400
400-600
600-800
800-1000
1000-1200
1200-1400
1400-1600
1600-1800
1800-2000
km
Pax(000)
CarBusCRAir
2030 Scenario 1 (Im-proved CR + Ex-pressway)
2030 Scenario 2 (Im-proved CR + Expressway + HSR)
0
200
400
600
800
1,000
1,200
1,400
1,600
1,800
0-200 200-400
400-600
600-800
800-1000
1000-1200
1200-1400
1400-1600
1600-1800
1800-2000
km
Pax(000)
Car
Bus
CR
HSR
Air
Car
Bus
CR
HSR
Air
Figure 5.3.10 Distribution of Trip Lengths
Source: VITRANSS 2 Study Team.

The Comprehensive Study on the Sustainable Development of Transport System in Vietnam (VITRANSS 2) MAINTEXT
5-14
Figure 5.3.11 Traffic Distribution, 2008
Source: VITRANSS 2 Study Team.

The Comprehensive Study on the Sustainable Development of Transport System in Vietnam (VITRANSS 2) MAINTEXT
5-15
Figure 5.3.12 Traffic Distribution under a Do-nothing Scenario, 2030
Source: VITRANSS 2 Study Team.

The Comprehensive Study on the Sustainable Development of Transport System in Vietnam (VITRANSS 2) MAINTEXT
5-16
Figure 5.3.13 Traffic Distribution under Scenario 2 (Improved CR + Expwy + HSR), 2030
Source: VITRANSS 2 Study Team

The Comprehensive Study on the Sustainable Development of Transport System in Vietnam (VITRANSS 2) MAINTEXT
5-17
Figure 5.3.14 Traffic Distribution under Scenario 1 (Improved CR + Expwy) , 2030
Source: VITRANSS 2 Study Team

The Comprehensive Study on the Sustainable Development of Transport System in Vietnam (VITRANSS 2) MAINTEXT
5-18
CRCRCRCRCRCRCRCRCRHSRHSRHSRHSRHSRHSRHSRHSRHSR
Road AccessRoad AccessRoad AccessRoad AccessRoad AccessRoad AccessRoad AccessRoad AccessRoad Access
passenger/daypassenger/daypassenger/daypassenger/daypassenger/daypassenger/daypassenger/daypassenger/daypassenger/day
20,00020,00020,00020,00020,00020,00020,00020,00020,00010,00010,00010,00010,00010,00010,00010,00010,00010,000
CR & HSR CR & HSR CR & HSR CR & HSR CR & HSR CR & HSR CR & HSR CR & HSR CR & HSR CR & HSR CR & HSR CR & HSR CR & HSR CR & HSR CR & HSR CR & HSR CR & HSR CR & HSR CR & HSR CR & HSR CR & HSR CR & HSR CR & HSR CR & HSR CR & HSR Passenger Traffic Demand Passenger Traffic Demand Passenger Traffic Demand Passenger Traffic Demand Passenger Traffic Demand Passenger Traffic Demand Passenger Traffic Demand Passenger Traffic Demand Passenger Traffic Demand Passenger Traffic Demand Passenger Traffic Demand Passenger Traffic Demand Passenger Traffic Demand Passenger Traffic Demand Passenger Traffic Demand Passenger Traffic Demand Passenger Traffic Demand Passenger Traffic Demand Passenger Traffic Demand Passenger Traffic Demand Passenger Traffic Demand Passenger Traffic Demand Passenger Traffic Demand Passenger Traffic Demand Passenger Traffic Demand in 2030in 2030in 2030in 2030in 2030in 2030in 2030in 2030in 2030in 2030in 2030in 2030in 2030in 2030in 2030in 2030in 2030in 2030in 2030in 2030in 2030in 2030in 2030in 2030in 2030
50,00050,00050,00050,00050,00050,00050,00050,00050,000100,000100,000100,000100,000100,000100,000100,000100,000100,000
1707km Dian1707km Dian1707km Dian1707km Dian1707km Dian1707km Dian1707km Dian1707km Dian1707km Dian
0km Hanoi 0km Hanoi 0km Hanoi 0km Hanoi 0km Hanoi 0km Hanoi 0km Hanoi 0km Hanoi 0km Hanoi
688km Hue 688km Hue 688km Hue 688km Hue 688km Hue 688km Hue 688km Hue 688km Hue 688km Hue 791km Da Nang 791km Da Nang 791km Da Nang 791km Da Nang 791km Da Nang 791km Da Nang 791km Da Nang 791km Da Nang 791km Da Nang
522km Dong Hoi 522km Dong Hoi 522km Dong Hoi 522km Dong Hoi 522km Dong Hoi 522km Dong Hoi 522km Dong Hoi 522km Dong Hoi 522km Dong Hoi
175km Thanh Hoa 175km Thanh Hoa 175km Thanh Hoa 175km Thanh Hoa 175km Thanh Hoa 175km Thanh Hoa 175km Thanh Hoa 175km Thanh Hoa 175km Thanh Hoa
319km Vinh 319km Vinh 319km Vinh 319km Vinh 319km Vinh 319km Vinh 319km Vinh 319km Vinh 319km Vinh
261km Gau Giat 261km Gau Giat 261km Gau Giat 261km Gau Giat 261km Gau Giat 261km Gau Giat 261km Gau Giat 261km Gau Giat 261km Gau Giat
1316km Nha Trang1316km Nha Trang1316km Nha Trang1316km Nha Trang1316km Nha Trang1316km Nha Trang1316km Nha Trang1316km Nha Trang1316km Nha Trang
1726km Ho Chi Minh1726km Ho Chi Minh1726km Ho Chi Minh1726km Ho Chi Minh1726km Ho Chi Minh1726km Ho Chi Minh1726km Ho Chi Minh1726km Ho Chi Minh1726km Ho Chi Minh
1698km Bien Hoa1698km Bien Hoa1698km Bien Hoa1698km Bien Hoa1698km Bien Hoa1698km Bien Hoa1698km Bien Hoa1698km Bien Hoa1698km Bien Hoa
1106km Qui Nhon1106km Qui Nhon1106km Qui Nhon1106km Qui Nhon1106km Qui Nhon1106km Qui Nhon1106km Qui Nhon1106km Qui Nhon1106km Qui Nhon1096km Dieu Tri1096km Dieu Tri1096km Dieu Tri1096km Dieu Tri1096km Dieu Tri1096km Dieu Tri1096km Dieu Tri1096km Dieu Tri1096km Dieu Tri
Distance from Hanoi (Existing Rail)
(4) HSR Demand
5.24 The figure below shows the assigned rail traffic volume when HSR speed is 300km/h and HSR fare is equal to airfare.
Figure 5.3.15 Assigned Rail Traffic Volume by 2030 (HSR speed: 300 km/h, HSR Fare: Equal to Airfare)
.
Distance from Hanoi (HSR) Source: VITRANSS 2 Study Team.
Tuy Hoa(1080km)
Thap Cham(1268km)
Da Nang(702km)
Ho Chi Minh(1540km)
Ha Noi(0km)
Pax/day(000)
Vinh(283km)
Dong Hoi(465km)
81
555060
40
20
80