ACTIVE TRANSPORTATION APPENDIX -...
46
ADOPTED APRIL 2012 Southern California Association of Governments ACTIVE TRANSPORTATION APPENDIX
Transcript of ACTIVE TRANSPORTATION APPENDIX -...
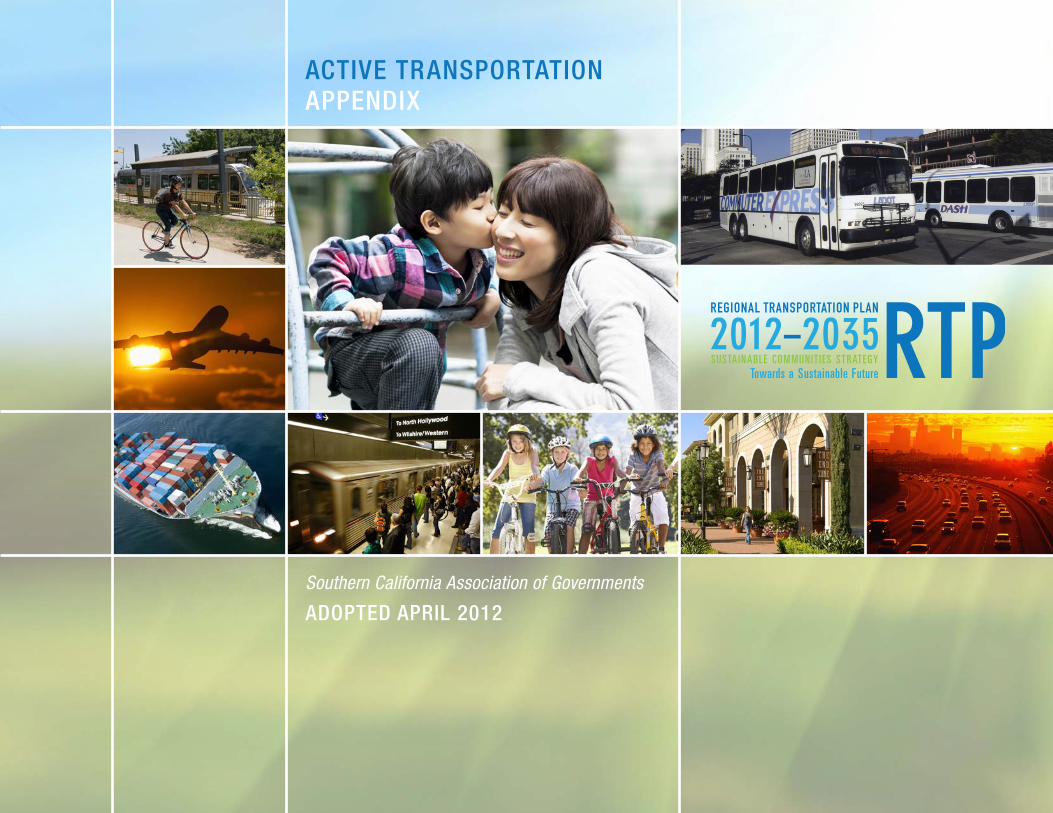
ADOPTED APRIL 2012
Southern California Association of Governments
ACTIVE TRANSPORTATIONAPPENDIX

ACTIVE TRANSPORTATION
Existing Conditions 1Physical Setting 1
Political Environment 1
Existing Plans 2
Bicycling and Walking Overview 4Types of Bicyclists 5
Riding Styles 7
Types of Bicycle Facilities 7Class I Bikeways 7
Class II Bikeways 9
Class III Bikeways 9
Cycletracks 9
Bicycle Boulevards 9
Bicycle Boulevards 9
Bicycle Safety 9
Pedestrian Oriented Design and Access Requirements 11Americans with Disabilities Act (ADA) 11
Schools 11
Transit 12
Street Design and Access to Destinations 12
Pedestrian Safety 12
Deficiencies and Needs Analysis 14Pedestrian Facility Deficiencies 14
Bicycle Access to Transit 22
Pedestrian Access to Transit 22
Access to Bicycle Routes 25
California Coastal Trail 35
Policy Recommendations 39Agencies, Groups and Individuals in Bicycle and Walking Planning 39
Performance Measures 39
Proposed Policies 39
Air Quality Improvements 42Potential VMT Reduction 42

The Southern California Association of Governments (SCAG) is the nation’s largest metropolitan planning organization (MPO) representing six counties (Imperial, Los Angeles, Orange, Riverside, San Bernardino, and Ventura) and 191 cities. The 2012–2035 Regional Transportation Plan (RTP) and Sustainable Communities
Strategy (SCS) seeks to develop a comprehensive and interconnected network of bicycle and pedestrian facilities throughout the region to increase transportation options, so that bicycling and walking become more practical and desirable choices for travel. Increasing bicycling and walking within the region will assist in reducing road congestion, enhancing public health, and improving air quality. The RTP supports Active Transportation through the development of bicycle and pedestrian policies.
Active Transportation refers to transportation such as walking or using a bicycle, tri-cycle, velomobile, wheelchair, scooter, skates, skateboard, push scooter, trailer, hand cart, shopping car, or similar electrical devices. For the purposes of this report, Active Transportation will generally refer to bicycling and walking, the two most common meth-ods. Walking and bicycling are essential parts of the SCAG transportation system, are low cost, do not emit greenhouse gases, can help reduce roadway congestion, and increase health and the quality of life of residents. As the region works towards reducing conges-tion and air pollution, walking and bicycling will become more essential to meet the future needs of Californians
The strategies established by the Active Transportation Chapter will adhere to the follow-ing goals and objectives:
� Goal 1: Increase dedicated funding for bicycle and pedestrian infrastructure. � Objective 1.1: Develop a Constrained Plan that analyzes existing funding and
provides quantitative support for future funding requirements. � Objective 1.2: Estimate the benefits of current investments to analyze future
funding needs.
� Goal 2: Increase accommodation and planning for bicyclists and pedestrians. � Objective 2.1: Include a Strategic Plan that includes additional investments
needed to develop a comprehensive and interconnected network of bicycle and pedestrian facilities throughout the region.
� Objective 2.2: Estimate project costs associated with this vision. � Objective 2.3: Estimate the benefits of these investments. � Objective 2.4: Support local jurisdictions with the development of their
local plans.
� Goal 3: Increase transportation options, particularly for trips less than three miles. � Objective 3.1: Increase linkages between bicycling and walking with transit. � Objective 3.2: Examine bicycling and walking as an integral part of a conges-
tion/transportation management tool (e.g. Safe Routes to School).
� Goal 4: Significantly decrease bicycle and pedestrian fatalities and injuries. � Objective 4.1: Address actual and perceived safety/security concerns that
prohibit biking and walking from being considered as viable mode choices.
The following sections will illustrate the existing conditions, identify potential oppor-tunities and provide recommendations that may assist in achieving a more bicycle and pedestrian friendly region. The policies and recommendations established by this Active Transportation chapter can also assist local jurisdictions and agencies in the development of more comprehensive policies that improve public health, safety, and welfare.
Existing Conditions
Physical SettingThe climate in the SCAG region varies by location. The western Los Angeles Basin, Ventura County and western Orange County experience marine climates, cool ocean breezes and moderate average temperature variations. The inland areas within the region are comprised of more arid climates with more significant temperature variations throughout the day. Rainfall in the SCAG region typically averages only 30 days per year, which provides ideal conditions for walking and bicycling. The majority of the western portion of the region is highly developed with suburban areas, with some areas of dense urbanization. The inland areas of the region are becoming developed with significant suburbanization and pockets of urban development, but are primarily undeveloped or designated as national and state parkland.
Political EnvironmentRecent shifts in the political environment have increased support for Active Transportation (please see FIGURE 1 Legislative Timeline). The Intermodal Surface Transportation Efficiency Act of 1991 (ISTEA) challenged officials to make “bicycles a more viable part of the transportation network.” The Transportation Equity Act for the 21st Century (TEA-21) provided additional Federal funds for surface transportation, such as pedestrian
Active Transportation 1

walkways, until 2003. The Act also extended the Disadvantaged Business Enterprises program and created new incentives for bicycle and pedestrian safety and educational programs. TEA-21 continued to research new transportation systems and “ensure[d] the consideration of bicyclists and pedestrians in the planning process and facility design.” Safe, Accountable Flexible, Efficient Transportation Equity Act: A Legacy for Users (SAFETEA-LU) increased funding for non-motorized transportation. SAFETEA-LU also established the Safe Routes to School (SRTS) program to “enable and encourage primary and secondary school children to walk and bicycle to school” and to support infrastruc-ture-related and behavioral projects that are “geared toward providing a safe, appealing environment for walking and bicycling that will improve the quality of our children’s lives and support national health objectives by reducing traffic, fuel consumption, and air pol-lution in the vicinity of schools.”
FIGURE 1 Legislative Timeline
1990
1991Intermodal Surface Transportation Efficiency Act (ISTEA)
1998Transportation Equity Act for the 21st Century (TEA-21)
2005Safe, Accountable, Flexible, Efficient TransportationEquity Act: A Legacy for Users (SAFETEA-LU)
2006Assembly Bill 32: Global Warming Solutions Act(AB 32)
2007Assembly Bill 1358: The CompleteStreets Act (AB 1358)
2008Senate Bill 375: Regional Targets(SB 375)
2000 2010
At the State level, Assembly Bill 32 (AB 32) and Senate Bill 375 (SB 375) were established to reduce greenhouse gas emissions. AB 32, enacted in 2006, directed the California Air Resource Board (CARB) to develop early actions to reduce greenhouse gases and to prepare a scoping plan to identify specific strategies to meet the 2020 limit. SB 375, enacted in 2008, focuses on reducing greenhouse gas (GHG) emissions generated by cars and light trucks and requires SCAG to develop a Sustainable Community Strategies (SCS) for the region. The new law also provides incentives for local jurisdictions and develop-ers to implement new land use development strategies that would help reduce GHGs. Some of these strategies include non-motorized transportation strategies. The Complete Streets Act of 2008 (AB 1358) required cities and counties to incorporate the concept of Complete Streets in their general plan updates to ensure that transportation plans meet the needs of all users. SCAG has also adopted similar strategies in the 2012 RTP and has the opportunity to provide information and resources to support local cities and counties as they implement Complete Streets strategies within their jurisdictions.
Existing PlansAll six of the counties within the SCAG region have developed their own bicycle and pedestrian plans. All local bicycle/pedestrian plans finalized by September 30, 2011 are considered part of the SCAG Active Transportation Plan.
IMPERIAL COUNTY
In 2003, Imperial County developed a Bicycle Master Plan, which was adopted by its Board of Supervisors in 2007. The guiding vision of the plan is to “encourage and promote bicycling as a safe and convenient form of transportation and recreation achieved through engineering, education, enforcement, and encouragement.” Imperial County is currently working on updating their Bicycle Master Plan, which is anticipated to be completed by the end of 2011. The proposed plan is anticipated to implement 374.4 miles of bikeways at an estimated cost of $6.4 million.
LOS ANGELES COUNTY
The Los Angeles County Metropolitan Transportation Authority (Metro) developed a Bicycle Transportation Strategic Plan (BTSP) in 2006 to be used by “the cities, the County of Los Angeles and transit agencies in planning bicycle facilities around transit and
2 Active Transportation

setting priorities that contribute to regional improvements. The goal is to integrate bicycle use in transportation projects.” In addition, Metro also created a Bicycle Transportation Account Compliance Document (BTA Document) to provide an “inventory and mapping of existing and proposed facilities, and an estimate of past and future expenditures for bicycle facilities.”
The Los Angeles County Department of Public Works released a draft of their revised Bicycle Master Plan in February 2011, which was developed with the over arching goal of increasing “bicycling throughout the County of Los Angeles through the development and implementation of bicycle-friendly policies, programs, and infrastructure.” The plan recommends the development of an interconnected network of bicycle corridors, with approximately 695 miles of bikeway facilities at a proposed cost of $284.8 million.
In addition Metro has developed a Long Range Transportation Plan that includes all of the regional bike trail projects that were identified in the BTSP as well as the Arroyo Seco Bike Trail, Compton Creek Bike Trail, Dominquez Channel Bike Trail, and the San Jose Creek Bike Trail Phase 2B.
ORANGE COUNTY
The 2009 Orange County Transportation Authority (OCTA) Commuter Bikeways Strategic Plan was developed “to encourage the enhancement of Orange County’s regional bike-ways network, in order to make bicycle commuting a more viable and attractive travel option.” The plan identifies approximately 116 miles of priority bikeway projects, estimat-ing $71.5 million; and is expected to be updated for 2014.
The strategic plan of the Orange County Long Range Transportation Plan also includes advanced active transportation treatments at key intersections within the Central County Major Investment Study (MIS) study area. On January 23, 2012, the OCTA Board of Directors directed staff to work with local agencies to develop the Orange County Bikeway program for strategic corridor planning, developing detailed development imple-mentation plans, and construction of high priority projects. The goal of the program is to take advantage of grant funding opportunities by developing shelf’ready projects along regaionl bikeway corridors.
RIVERSIDE COUNTY
The Western Riverside Council of Governments (WRCOG) and the Coachella Valley Association of Governments (CVAG) have developed Non-Motorized Transportation Plans in 2010 for their respective jurisdictions covering most of Riverside County. WRCOG’s 2010 Non-Motorized Transportation Plan proposes the development of over 440 miles of bikeways in order to provide a “regional backbone network of bicycle and pedestrian facilities to provide enhanced transportation mobility options.” The 2010 CVAG Non-Motorized Transportation plan recognizes the “value of providing opportunities for local residents and visitors to bicycle for work and recreation, as well as to use off-road trails for hiking, equestrians and jogging.”
One innovative project is Parkway 1e11, a proposed 54-mile grade separated bicycle / pedestrian / neighborhood electric vehicle path in the Coachella Valley connecting Desert Hot Springs to Palms Springs to Coachella and the cities in-between. The Parkway, in the preliminary planning stages, will provide an alternative transportation corridor to State Route 111. In addition, by the inclusion of neighborhood electric vehicles, it provides additional mobility as well as access to activities for active senior citizens. Once com-pleted the parkway will become part of the regional bikeway Network alignment through the Coachella Valley.
SAN BERNARDINO COUNTY
The 2011 San Bernardino County Non-Motorized Transportation Plan’s goals include: 1) improving pedestrian access to transit; 2) removing existing barriers to pedestrian travel; 3) developing regional trails and pathways, which provide improved pedestrian access to destinations; and 4) improving the pedestrian environment on major regional arterials and at regional activity centers.
VENTURA COUNTY
The 2007 Ventura County Bicycle Master Plan “provides a broad vision, strategies and actions for the improvement of bicycling” by maximizing funding sources for implemen-tation; improving safety and encouraging cycling; expanding the network and sup-port facilities; and enhancing the quality of life in Ventura County. The combined cost of the identified projects in the Ventura County Bicycle Master Plan is approximately $93.1 million
Active Transportation 3

4 Active Transportation
TABLE 1 County Active Transportation Plans
County Plan Adopted
Imperial Imperial County Bicycle Master Plan 2007
Los Angeles Metro Bicycle Master Plan 2006
Department of Public Works 2011 Bicycle Master Plan 2011
Orange Commuter Bikeways Strategic Plan 2009
Riverside CVAG Draft Non-Motorized Transportation Plan 2010
WRCOG Non-Motorized Plan 2010
San Bernardino 2011 Non-Motorized Transportation Plan 2011
Ventura County Bicycle Master Plan 2007
LOCAL JURISDICTIONS
In addition to county plans, many local jurisdictions have developed their own active transportation plans or include active transportation components in the Circulation Element of their General Plan. Many street enhancement projects or capital improve-ment projects include active transportation elements as well. For example, many street improvement projects may include the striping of bikeways or new developments may include sidewalk enhancements. By examining the annual budgets of the 20 most populous cities in the SCAG region and their expenditures associated with active trans-portation projects such as new sidewalks or bikeways we were able to estimate that on average cities spend $5.45 per capita on active transportation each year. Based on an average 1 percent annualized population growth and 3 percent adjustment for infla-tion, it is estimated that local jurisdictions would spend a total of $4.1 billion dollars between 2011 and 2035 on active transportation, which is not accounted for in the 2012–2035 RTP/SCS.
Bicycling and Walking OverviewThe majority of commuters within the SCAG region commute via car, truck or van. According to the American Community Survey in 2008, more than 85 percent of all com-muters traveled to work by car, truck or van; and less than 4 percent traveled to work via an active transportation mode (0.7 percent bicycled and 2.5 percent walked). The 2012 RTP/SCS allocates approximately $6.7 billion for active transportation. This is an increase of more than 270 percent over the commitments made in the 2008 RTP. Aproximately $700 million was added to the allocation provided in the Draft 2012-2035 RTP/SCS, partly in response to the overwhelming support received for higher level of funding dur-ing the comment period. This amount primarily reflects regional commitments and does not include many of the locally funded projects associated with active transportation, nor does it include projects where bicycle/pedestrian facility construction is part of a larger project. So, when the local expenditures are considered, the region is expected to spend significantly more than $10 billion in active transportation over the period of the plan.
FIGURE 2 Commuter Mode Share in the SCAG Region (2008)
Car, truck, or van86%
Public transportation5%
Bicycle1%
Walk3%
Other1%
Worked at Home4%
Source: American Community Survey, 2008
In 2009 the National Household Travel Survey California Travel Survey Add-On (NHTS-CA) data estimated that approximately 20.94 percent of all trips in 2009 were conducted by walking (19.24 percent) or bicycling (1.7 percent), this is an approximately 75 percent

increase from the 11.9 percent active transportation mode share in 2000. The 2009 NHTS data also showed that there was a decrease in driving from 83.9 percent to 75.0 percent; this was a 10.6 percent decrease from 2000.
FIGURE 3 Mode of Travel for Total Trips (2000)
Drive84%
Transit3%
Bike1%
Walk11%
Other1%
Source: National Household Travel Survey, 2000
FIGURE 4 Mode of Travel for Total Trips (2009)
Drive75%
Transit3%
Bike2%
Walk19%
Other1%
Source: National Household Travel Survey California Travel Survey Add-On, 2009
However, between 2005 and 2009, the percentage of commuters that traveled by car, truck or van has decreased while the percentage of bicycling and walking to work has
increased. This increase in active transportation usage may have been attributed to changes in the economic climate or increases in gas prices. This steady increase in active transportation mode share may indicate a greater demand for active transportation infra-structure and planning.
TABLE 2 Commuter Mode Share in the SCAG Region
Car,
Truc
k,
or V
an
Publ
ic
Tran
spor
tati
on
Taxi
cab,
M
otor
cycl
e,
or o
ther
Wor
ked
at
Hom
e
Bicy
cle
Wal
ked
Tota
l
2005 87.40% 4.50% 1.30% 4.10% 0.50% 2.10% 100.00%
2006 86.70% 4.90% 1.20% 4.20% 0.60% 2.40% 100.00%
2007 86.40% 4.80% 1.20% 4.50% 0.60% 2.40% 100.00%
2008 85.90% 5.10% 1.30% 4.50% 0.70% 2.50% 100.00%
2009 85.90% 5.00% 1.10% 4.80% 0.70% 2.50% 100.00%
Source: U.S. Census, 2005-2009
Types of BicyclistsBicyclists have varying levels of riding experience and confidence, which influence their decision to bicycle. SCAG recognizes that there are a number of factors that motivate people to bicycle, and has identified the following three types of bicyclists:
TRANSPORTATION/COMMUTER
Individuals that use their bicycle as a form of transportation on a reasonably regular basis, particularly for traveling to work, are classified as bicycle commuters. These cyclists utilize cycling primarily for utilitarian travel, not recreation. Some riders in this group may choose to travel by bicycle in place of a car while others use bicycling because of a lack of other feasible options. Some individuals use bicycling as a method of trans-portation due to economic necessity or because they are restricted by law from operating a motor vehicle. These include the low income individuals, immigrants, and the young
Active Transportation 5

adults. These individuals are often referred to as “invisible cyclists” and are often under counted in surveys. They may also lack proper equipment for nighttime riding, lack basic riding safety knowledge, and are more inclined to ride on sidewalks when there are no dedicated bikeways.
These riders typically fall into one of three categories: 1) adult employees, 2) students, and 3) shoppers. Transportation or commuter riders tend to travel during peak traffic hours and have increased exposure to vehicles. Routes leading to major businesses, shopping, education and other commercial areas of high importance to transporta-tion cyclists. Transportation cyclist needs are consistent throughout the SCAG region and include: personal safety and security, safe and secure parking, infrastructure that accommodates riding in changes in weather and darkness, and fair treatment from law enforcement.
EXERCISE/RECREATION
Recreational cyclists include both competent, experienced individuals and beginner riders, including adults and children. Some weekend riders, mountain bikers, and other recreational cyclists may drive to other locations in order to ride their bicycles, and ride as a form of recreation rather than transportation.
Primary needs of recreational cyclists are similar to that of transportation cyclists except that their travel routes are less focused on access to business, shopping, and other commercial areas. They tend to travel in lower traffic and more scenic areas or seek out off-road paths and trails. Some experienced recreational cyclists may be interested in bicycling as transportation, but are concerned about safety, distances, sweat and body odor in the work environment.
SOCIAL GROUP
Social bicycle riders represent a growing group of riders, especially in Los Angeles County with its growing bicycle culture. The City of Los Angeles has been growing and supporting bicycling through a number of activities and advocacy efforts including informal and for-mal rides such as the Bicycle Kitchen and similar co-ops, Critical Mass, Midnight Ridazz, and C.I.C.L.E. (Cyclists Inciting Change through Live Exchange).1
1 Although referencing various advocacy groups in this document, SCAG makes no endorsement of any external group’s policies, goals or positions.
The State of California shows its commitment to active transportation
in the following documents:
� Highway Design Manual
� Deputy Directive on Accommodating Non-motorized
Transportation (DD64)
� Director’s Policy on Context Sensitive Solutions (DP22)
� Main Streets: Flexibility in Design and Operations Assembly
Concurrent Resolution 211
� California Supplement to the MUTCD
� California Blueprint for Bicycling and Walking
� California Bicycle Transportation Act
� California Vehicle Code
� California Streets and Highway Code
� California Access Compliance Reference Manual
6 Active Transportation

Riding StylesJust as there are different types of cyclists, there are different riding styles. While no one entirely fits into one category or another, it is an attempt to broadly explain riding styles to understand the needs of the various members of the bicycling community. The following “Four Types of Cyclists” categorization was first developed in 2005 by the City of Portland, Oregon as it began to consider what it would take to dramatically increase bicycle use in Portland. The definitions that follow have been expanded somewhat to more closely match the demographics in southern California.
FULLY CONFIDENT CYCLIST
Often called “Vehicular Cyclists,” these cyclists ride their bicycles in the same man-ner that one would drive a motor vehicle. These individuals are confident in riding with motorized traffic in almost all conditions, and may forgo using dedicated bicycle facilities. These individuals are accustomed to riding in a variety of environments and can navigate in less space. Many of these individuals advocate for vehicular cycling because they are capable of operating their bicycles on the road in a visible, predictable manner, and follow the rules of the road, which may enable automobile drivers to be able to better predict how these bicyclists will act, and respond accordingly.
ENTHUSED AND CONFIDENT CYCLIST
These cyclists are as comfortable as the fully confident cyclists in sharing the roadway, but prefer using designated bicycle facilities. It is believed that enthused and confident cyclists comprise the majority of the tremendous growth in commuter cycling in Portland after investments were made in bicycling infrastructure.
INTERESTED BUT CONCERNED CYCLIST
Interested but concerned cyclists make up the majority of cyclists. They are curious about regular bicycling as a form of transportation, but may be inexperienced. Due to financial or immigration issues, they may also be unable to afford to own or operate a motor vehi-cle. Also, due to the graduated licensing program, older teenagers also fall into this group.
According to the “Four Types” categorization, those in the “Interested but Concerned” category like riding a bicycle, but they are afraid to ride. They would ride if they felt safer
on the roadways, if cars were slower and less frequent, and if there were more quiet streets with few cars and paths without any cars at all.
Inexperienced cyclists tend to have minimal riding skill and little experience, and are not comfortable riding with traffic or within the roadway. These cyclists may lack confidence or knowledge of safe cycling practices and regulations. These riders tend to use sidewalks, school grounds, parks, bicycle lanes, and Class I bicycle paths as their preferred riding environments.
NO WAY, NO HOW
This group is not interested in bicycling for transportation. Some may not own a bicycle or ride at all. Others may ride for recreation only on off-road bikeways. This could be attrib-uted to the distance between home and work, making bicycling too difficult or impossible. Shorter utilitarian trips are an option, but may also be considered difficult or impossible.
It is important to note that these are not clear cut definitions, and there is some overlap between categories, particularly as one’s level of interest and confidence increases since this may shift the demand for bicycle facilities. The Portland report lists that less than one percent of bicyclists were fully confident, seven percent were enthused and confi-dent, 60 percent were interested but concerned, and 33 percent were classified as no way, no how.
Types of Bicycle FacilitiesA bicycle facility may include a variety of facilities, from bicycle lanes to bicycle parking facilities, and other related facilities. Varying types and groups of riders prefer different types of riding environments. The Caltrans Highway Design Manual currently classifies bicycle lanes, bicycle paths, and routes in the following method:
Class I BikewaysClass I Bikeways are also known as bicycle paths, shared-use paths or bicycle trails. A Class I Bikeway provides a completely separated right-of-way designated for the exclu-sive use of bicycles and/or pedestrians with cross flows by motorists minimized.
Active Transportation 7

8
EXHIBIT1 Existing Bikeways in the SCAG Region

Class II BikewaysOften referred to as a bicycle lane, a Class II Bikeway provides a striped lane for one-way bicycle travel on a street or highway.
Class III BikewaysClass III Bikeways are also known as bicycle routes and provide for shared use with pedestrians and/or motor vehicle traffic.
CycletracksCycletracks are bicycle lanes on a street or highway physically separated from travel lanes occupied by vehicles.
Bicycle BoulevardsBicycle Boulevards refer to low speed, mostly residential streets where bicycling and walking are considered the primary modes. Sometimes used for traffic calming, the installation of bicycle boulevards often includes discouragement of non-local vehicle traffic while allowing free flow of bicyclists. As an example, traffic diverters allow free flow for bicyclists and allow vehicle access to property for homeowners, but do not allow motorists to continue driving in the same direction. By reducing speeds and access, safety for bicyclists and pedestrians is increased.
The City of Long Beach has installed a bicycle boulevard on Vista Street in the Belmont Heights neighborhood. Methods used include traffic circles, a bicycle only signal, road narrowing and barriers forcing motorists to turn left or right while allowing bicyclists access.
TABLE 3 Existing Bikeways (in Miles)
Impe
rial
Los
Ang
eles
Oran
ge
Rive
rsid
e
San
Bern
ardi
no
Vent
ura
Tota
l Exi
stin
g
% o
f Tot
al
Class 1 2.9 264.0 204.9 925.1 77.4 56.5 1,530.8 35.5%
Class 2 4.4 484.6 638.5 235.7 275.8 203.1 1,842.1 42.7%
Class 3 38.1 518.2 102.4 103.6 116.7 62.9 941.9 21.8%
Total Existing 45.4 1,266.9 945.8 1,264.3 469.9 322.5 4,314.8 100.0%
Bicycle BoulevardsBicycle Boulevards are low speed streets optimized for bicycle travel over vehicle travel.
Like their auto-driving counterparts, most bicyclists will most often use the fastest or most convenient route to reach their destinations. Bicyclists are legally allowed to use any public roadway in California unless specifically prohibited by State law (e.g. Freeways). Therefore, while some roadways are not designated or classified as bikeways, motorists should expect and anticipate bicyclists to share the road.
Bicycle SafetyBased on data from the Statewide Integrated Traffic Records System (SWITRS), the majority of counties in the SCAG region have experienced an increase in the number of traffic-related bicyclist fatalities for every 100,000 persons between 2003 and 2006, followed by a decrease in the number of fatalities between 2006 and 2008. Most of the counties experienced a decrease in traffic-related bicycle injuries for every 100,000 per-sons between 2003 and 2007; followed by an increase between 2007 and 2008.
Active Transportation 9

FIGURE 5 Number of Traffic Related Bicyclist Fatalities for Every 100,000 Persons
0.0
0.2
0.4
0.6
0.8
1.0
1.2
1.4
1.6
2003 2004 2005 2006 2007 2008
Fata
litie
s pe
r 100
,000
per
sons
Year
Imperial County Los Angeles County Orange County Riverside County
San Bernardino County Ventura County SCAG Region
Source: State-Wide Integrated Traffic Records System (SWITRS), 2003-2008
FIGURE 6 Number of Traffic Related Bicyclist Injuries for Every 100,000 Persons
0
5
10
15
20
25
30
35
40
45
2003 2004 2005 2006 2007 2008
Inju
ries
per 1
00,0
00 P
erso
ns
Year
Imperial County Los Angeles County Orange County Riverside County
San Bernardino County Ventura County SCAG Region
Source: State-Wide Integrated Traffic Records System (SWITRS), 2003-2008
In 2008, 3.98 percent of all traffic-related fatalities in our region involved bicyclists, and 4.31 percent of all traffic-related injuries involved bicyclists. Orange County had the highest percentage of traffic-related bicyclist fatalities (6.17 percent), and Ventura County had the highest percentage of traffic-related bicyclist injuries (5.83 percent) in the SCAG region in 2008.
10 Active Transportation

FIGURE 7 Percentage of Traffic-Related Fatalities Involving Bicyclists
0% 2% 4% 6% 8% 10% 12% 14% 16% 18%
California
SCAG Region
Del Norte County (1st)
Orange County (11th)
Los Angeles County (17th)
Riverside County (20th)
Ventura County (23rd)
Imperial County (26th)
San Bernardino County (27th)
San Joaquin County (31st)
Source: State-Wide Integrated Traffic Records System (SWITRS), 2008
FIGURE 8 Percentage of Traffic-Related Injuries Involving Bicyclists
0% 2% 4% 6% 8% 10% 12% 14%
California
SCAG Region
Santa Cruz County (1st)
Ventura County (10th)
Orange County (12th)
Los Angeles County (21st)
Imperial County (37th)
Riverside County (40th)
San Bernardino County (46th)
Mariposa County (56th)
Source: State-Wide Integrated Traffic Records System (SWITRS), 2008
The SCAG region has seen a greater percentage of traffic-related fatalities involving bicyclists than the statewide average, but had a lower percentage of traffic-related injuries involving bicyclists. Los Angeles and Orange Counties were the only counties with a higher percentage than the statewide percentage of traffic-related bicycle fatalities. Orange and Ventura Counties were the only counties with a higher percentage than the statewide percentage of traffic-related bicycle injuries.
Pedestrian Oriented Design and Access Requirements
Americans with Disabilities Act (ADA)The ADA was signed into law in 1990 and requires that all public facilities be accessible to people with disabilities. The impact of the ADA has been far-reaching. For example, multi-level facilities including transit stations must include elevators, sidewalks must have sloped surfaces at intersections and other crossings to allow wheelchair accessibil-ity, buses must have lifts, and signage must include Braille for the blind.
SCAG estimates that $90 million is necessary annually to maintain the existing pedestrian infrastructure in usable condition and to maintain consistency with ADA requirements, assuming a sidewalk life expectancy of 35 years. A portion of the $6.7 billion dollars allo-cated toward Active Transportation in the 2012 RTP will be applied toward infrastructure improvements that will maintain and improve sidewalks to ADA standards.
SchoolsPedestrian access between schools and nearby neighborhoods is a high safety priority. Clear crosswalks, signals adequately timed to allow children to cross streets, crossing guards, and school speed limit zones provide a safer environment for children on foot. Additionally, pathways and neighborhood parks can provide easier and safer access to schools by allowing children, both on foot and bicycle.
The Safe Routes to School (SRTS) program aims to increase the number of students walking or bicycling to school. Both the federal government and the State of California provide funding for SRTS programs.
Active Transportation 11

TransitEfficient and well-used public transit (busses, subway, light rail, commuter trains) contrib-ute to improved mobility and air quality, and extends accessibility for active transporta-tion. However, the effectiveness of transit is decreased if individuals are unable to easily access it in a safe manner. It is estimated that transit users will walk half a mile (Ohland, 2004) and bicycle two miles (Mineta Transportation Institute, 2002) to a transit stop. One of the barriers for commuters to take transit is the convenience to access transit or the distance between their starting point and final destination (first-mile/last-mile gap). Transit stations benefit from Park-and-Ride lots by expanding the pool of potential riders by bringing them to a central point. Yet, studies have shown that the effective distance for many Park-and-Ride users is 5 miles or less to these facilities. Placing adequate transit, pedestrian, and bicycle facilities within this radius may address the first-mile/last-mile gap and encourage ridership and active transportation.
The SCAG region has already taken steps to address the first mile/last mile connectiv-ity. Metro Rail has removed some seats on the Red/Purple lines allocating that space for bicycles. Metrolink has 12 dedicated bicycle cars on their commuter trains. The cars can hold up to 18 bicycles on the lower level.
Street Design and Access to DestinationsBuildings are often set further back from the street with a large parking lot between the entrance and the sidewalk, making them more accessible to visitors that arrive by car. This form of building design can act as a deterrent to bicyclists and pedestrians. Pedestrian and bicyclist access to retail and major activity centers is an integral part of a walkable community. Research on walkability has identified that the availability and dis-tance of potential destinations, such as grocery stores, restaurants, cafes, public spaces, and retail stores are significant variables associated with walkability. Smaller blocks with more extensive sidewalk coverage along major streets with higher densities are posi-tively associated with walkability. Similarly, the Complete Streets Act of 2008 (AB 1358) required cities and counties to accommodate and plan for all users.
Pedestrian SafetyBased on SWITRS data, in 2003, San Bernardino County had the highest number of traffic-related pedestrian fatalities for every 10,000 persons, and Imperial County had the lowest. Imperial County had the highest number of traffic-related pedestrian fatalities from 2004 to 2007, while Ventura County had the lowest. In 2008, Los Angeles County had the highest number of traffic-related pedestrian fatalities for every 10,000 persons, while Ventura County had the lowest. Los Angeles County has consistently had the highest number of traffic-related pedestrian injuries for every 10,000 persons. Riverside County had the lowest number of traffic-related pedestrian injuries for every 10,000 persons in 2003. San Bernardino County has had the lowest number of traffic-related bicyclist injuries for every 10,000 persons between 2004 and 2008.
FIGURE 9 Number of Pedestrian Fatalities for Every 100,000 Persons
0.0
0.5
1.0
1.5
2.0
2.5
3.0
3.5
4.0
2003 2004 2005 2006 2007 2008
Fata
litie
s pe
r 100
,000
per
sons
Year
Imperial County Los Angeles County Orange County Riverside County
San Bernardino County Ventura County SCAG Region
Source: State-Wide Integrated Traffic Records System (SWITRS), 2003-2008
12 Active Transportation

Active Transportation 13
FIGURE 10 Number of Pedestrian Injuries for Every 100,000 Persons
0
5
10
15
20
25
30
35
40
45
2003 2004 2005 2006 2007 2008
Inju
ries
per 1
00,0
00 P
erso
ns
Year
Imperial County Los Angeles County Orange County Riverside County
San Bernardino County Ventura County SCAG Region
Source: State-Wide Integrated Traffic Records System (SWITRS), 2003–2008
While bicycle deaths and injuries are fairly low when compared to other modes of trans-portation, pedestrian deaths and injuries represent a much more significant percentage of all traffic-related incidents, particularly in urban areas. In 2008, 20.94 percent of all traffic-related fatalities in the SCAG region involved a pedestrian, and 5.74 percent of traffic-related injuries involved pedestrians. Los Angeles County had the highest percent-age of traffic-related pedestrian fatalities (29.65 percent) and the highest percentage of pedestrian injuries (7.05 percent) within the SCAG region in 2008.
FIGURE 11 Percentage of Traffic-Related Fatalities Involving Pedestrians
0% 5% 10% 15% 20% 25% 30% 35% 40% 45%
California
SCAG Region
San Francisco County (1st)
Los Angeles County (4th)
Orange County (12th)
San Bernardino County (20th)
Riverside County (28th)
Ventura County (29th)
Imperial County (36th)
Kings County (41st)
Source: State-Wide Integrated Traffic Records System (SWITRS), 2008
FIGURE 12 Percentage of Traffic-Related Injuries Involving Pedestrians
0% 2% 4% 6% 8% 10% 12% 14% 16% 18% 20%
California
SCAG Region
San Francisco County (1st)
Los Angeles County (4th)
Ventura County (15th)
Orange County (18th)
San Bernardino County (30th)
Imperial County (34th)
Riverside County (36th)
Siskiyou County (56th)
Source: State-Wide Integrated Traffic Records System (SWITRS), 2008

Most counties in the SCAG region have a smaller percentage of traffic-related pedestrian fatalities involving a pedestrian when compared to the statewide average; Los Angeles and Orange County were the only two counties to have a higher percentage of pedestrian-involved fatalities. Most counties also had a smaller percentage of traffic-related injuries involving a pedestrian versus the statewide average; Los Angeles County was the only county that had a higher percentage of pedestrian involved injuries.
FIGURE 13 Fatalities and Injuries by Mode (in 2008)
0%
20%
40%
60%
80%
100%
Fatalities Injuries Fatalities Injuries Fatalities Injuries Fatalities Injuries Fatalities Injuries Fatalities Injuries Fatalities Injuries
Imperial Los Angeles Orange Riverside San Bernardino Ventura SCAG
Driver Passenger Pedestrian Bicyclist
Source: State-Wide Integrated Traffic Records System (SWITRS), 2008
Deficiencies and Needs AnalysisThe existing active transportation infrastructure may provide access for many of the residents within the region but fails to accommodate the needs of the youth, elderly, and disabled. Added consideration must be given to these populations as any of them do not currently feel secure or able to utilize the existing active transportation facilities. The population within the SCAG region is expected to expand with an additional 4 million residents within the next 25 years. This growth in population will put added strain on the existing transportation infrastructure and contribute to more congestion if no improve-ments are made. In addition to the population increase, the average age of our population will increase, changing the characteristics and demand on travel. The aging population will place a greater demand on transit and active transportation modes.
Pedestrian Facility DeficienciesThe 1994 AASHTO Green Book describes pedestrian facilities as “sidewalks, crosswalks, traffic control features, special walkways found on some portions of freeway rights-of-way, curb cuts (depressions), and ramps for the older walkers and persons with mobility impairments. They are also parts of bus stops or other loading areas, grade separations, and the stairs or escalators related to these facilities.”
The coordination of local plans and county/regional policies is necessary to develop a regional interconnected network of bicycle facilities. Individuals base their travel deci-sions based on convenience, accessibility and safety. The need for a regional approach towards bicycle and pedestrian planning is attributed to the fact that travelers are not restricted to a single jurisdiction and often cross multiple jurisdictions during their trip. Existing facilities and infrastructure, and the planning for the infrastructure are often disjointed and do not provide easy accessibility for users.
Similarly, the dominance of motorized transportation has led to a disproportionate alloca-tion of funding and adequate planning for pedestrian accessibility. Examples include areas that are not in compliance with the Americans with Disabilities Act (ADA); areas that have long blocks between intersections and high speed limits, which all can make active trans-portation more difficult. The California Highway Patrol (CHP) has identified in their 2008 SWITRS that 50 percent of all pedestrian fatalities in California occurred within the SCAG region. The high percentage of pedestrian fatalities demonstrates a need for change
14 Active Transportation

15
EXHIBIT 2 Access to Public Transit in Imperial County

16
EXHIBIT 3 Access to Public Transit in Los Angeles County

17
EXHIBIT 4 Access to Public Transit in Orange County

18
EXHIBIT 5 Access to Public Transit in Riverside County

19
EXHIBIT 6 Access to Public Transit in San Bernardino County

20
EXHIBIT 7 Access to Public Transit in Ventura County

21
EXHIBIT 8 Cities Without Stops Within the SCAG Region

within the SCAG region. Existing facilities should be retrofitted to reduce or prevent bicycle and pedestrian accidents and new facilities should be designed to reduce known conditions that contribute to bicycle and pedestrian related accidents. Furthermore, streets should be designed to promote the use of alternative modes of transportation through the provision of bicycle parking, street landscaping and other amenities that would create a more inviting environment for all users.
Bicycle Access to TransitAccessibility is one the primary performance measures used to evaluate active transpor-tation. Accessibility measures how well the current infrastructure provides individuals with the opportunity to access facilities. The following provides a general analysis of the deficiencies and gaps with our region’s current active transportation infrastructure.
Envisioning Neighborhoods with Transit-Oriented Development Potential (Mineta Transportation Institute, 2002) found that “bicycling distance, [is] usually approximated as less than 2 miles.” By using a 2-mile buffer around the transit station, we found that the majority of residents in the SCAG region have access to transit by bicycle (97.0 percent), with Los Angeles County having the highest percentage of bicyclist access to transit (99.1 percent) and Imperial County having the lowest (87.5 percent).
TABLE 4 Percentage of Bicyclists with Access to Transit
County Population Served Total Population Percentage Served
Imperial 155,254 177,448 87.50%
Los Angeles 10,243,811 10,341,602 99.10%
Orange 3,088,474 3,124,761 98.80%
Riverside 1,933,589 2,088,521 92.60%
San Bernardino 1,826,414 2,052,928 89.00%
Ventura 806,437 831,029 97.00%
SCAG Region 18,053,980 18,616,290 97.00%
Pedestrian Access to TransitThe New Transit Town: Best Practices in Transit-Oriented Development (Ohland, 2004) states that residents are willing to walk “between a quarter- and a half-mile” to access transit. By using a 0.5-mile buffer, we found that the majority of residents in the SCAG region have access to transit by walking (85.7 percent), with Los Angeles County hav-ing the highest percentage of pedestrian access to transit (93.5 percent) and Riverside County having the lowest (64.2 percent).
TABLE 5 Percentage of Pedestrians with Access to Transit
County Population Served Total Population Percentage Served
Imperial 116,245 177,448 65.50%
Los Angeles 9,668,821 10,341,602 93.50%
Orange 2,781,863 3,124,761 89.00%
Riverside 1,341,002 2,088,521 64.20%
San Bernardino 1,417,039 2,052,928 69.00%
Ventura 628,540 831,029 75.60%
SCAG Region 15,953,510 18,616,290 85.70%
All 7 incorporated cities in Imperial County contain transit stops.
Of the 88 incorporated cities in Los Angeles County, 83 cities contain transit stops. The five cities that do not are Avalon, Bradbury, Hidden Hills, La Habra Heights, and Rolling Hills.
All 34 incorporated cities in Orange County contain transit stops
All 25 incorporated cities in Riverside County contain transit stops.
Of the 24 incorporated cities within San Bernardino County, 20 cities contain transit stops. The cities that do not are Barstow, Needles, Twenty-Nine Palms, and Yucca Valley.
All 10 of the incorporated cities in Ventura County contain transit stops.
Of the 181 member cities within the SCAG region in 2008, 172 contained transit stops. The remaining nine cities that do not contain transit stops are Avalon, Bradbury, Hidden
22 Active Transportation

23
EXHIBIT 9 Bikeway Access in the SCAG Region

24
EXHIBIT 10 Existing and Proposed Bikeway Access in Imperial County

Hills, La Habra Heights, Rolling Hills, Barstow, Needles, Twenty-Nine Palms, and Yucca Valley.
While the majority of the population has access to the existing transit network, additional improvements are needed. Access to a transit stop does not ensure that individuals will utilize transit, since the transit stop that is near them may not provide them with access to their desired destination. Therefore, additional analysis is needed to ensure that indi-viduals are being served with adequate access to transit by both walking and bicycling. Furthermore, additional analysis regarding access to the transit stops is required. This would include gaps in sidewalks, ADA compliance, and the transit network.
While access is a key topic of concern, bicycle and pedestrian facilities also need to be considered. Adequate bicycle facilities such as bicycle parking, lockers, or showers should also be evaluated in order to address the needs of bicyclists. Consideration for pedestrian access should also include adequate lighting, complete sidewalks, and ADA requirements in order to ensure the ease of access and improve pedestrian mode share.
Access to Bicycle RoutesAccording to a study conducted by the Oregon Transportation Research and Education Consortium (OTREC) in 2008, bicyclists would travel 0.27 miles to utilize a bikeway. By using a 0.27-mile buffer, we found that less than half of the SCAG region has access to bikeways (42.6 percent), with Ventura County having the highest percentage of resi-dents with access to bikeways (64.0 percent) and Los Angeles County having the lowest (38.0 percent).
TABLE 6 Percentage of Population with Access to Existing Bikeways
CountyPopulation Served
Total Population
Percentage Served
Commuter Bicyclist Mode Share
Imperial 80,170 177,448 45.2% 0.0%
Los Angeles 3,929,538 10,341,602 38.0% 0.8%
Orange 1,987,805 3,124,761 63.6% 0.9%
Riverside 832,429 2,088,521 39.9% 0.5%
San Bernardino 624,552 2,052,928 30.4% 0.4%
Ventura 531,515 831,029 64.0% 0.5%
SCAG Region 7,933,592 18,616,290 42.6% 0.7%
Source: American Community Survey, 2008
While a significant portion of the region has access to bikeways, only a small percent-age utilizes the bikeways for their daily work commutes (less than 1 percent). The lack of bicycling commute trips may be attributed to the type of bikeways, confidence of the rider, adequate facilities at their destination (bicycle parking, showers, etc.) and acces-sibility to their desired destinations.
Once the locally proposed bikeways (projects identified by the local jurisdictions) are implemented, accessibility to bikeways will increase from 42.6 percent to 62.4 percent. Orange County would then have the highest percentage of bicyclists with access to bike-ways (89.4 percent) and Riverside County would have the lowest (52.7 percent).
TABLE 7 Locally Proposed Bicycle Facilities (in Miles)
Impe
rial
Los
Ang
eles
Oran
ge
Rive
rsid
e
San
Be
rnar
dino
Vent
ura
Tota
l Pr
opos
ed
% o
f Tot
al
Class 1 63.4 197.8 172.0 172.8 285.6 142.5 1,034.1 20.8%
Class 2 294.8 509.9 499.2 693.4 798.6 248.6 3,044.5 61.1%
Class 3 16.3 318.7 61.4 136.5 248.6 119.9 901.4 18.1%
Total 374.4 1,026.4 732.6 1,002.7 1,332.7 511.1 4,979.9 100.00%
Active Transportation 25

26
EXHIBIT 11 Existing and Proposed Bikeway Access in Los Angeles County

27
EXHIBIT 12 Existing and Proposed Bikeway Access in Orange County

28
EXHIBIT 13 Existing and Proposed Bikeway Access in Riverside County

29
EXHIBIT 14 Existing and Proposed Bikeway Access in San Bernardino County

30
EXHIBIT 15 Existing and Proposed Bikeway Access in Ventura County

TABLE 8 Percentage of Population with Access to Existing and Proposed Bikeways
County Population Served Total Population Percentage Served
Imperial 136,207 177,448 76.8%
Los Angeles 5,503,786 10,341,602 53.2%
Orange 2,794,871 3,124,761 89.4%
Riverside 1,101,478 2,088,521 52.7%
San Bernardino 1,456,946 2,052,928 71.0%
Ventura 691,812 831,029 83.2%
SCAG Region 11,615,295 18,616,290 62.4%
In 2008, 153 out of SCAG’s 191 member cities contain bikeways. Of the 7 incorporated cities in Imperial County, 4 cities contained bikeways. Once the proposed bikeways have been developed, all 7 incorporated cities in Imperial County will contain bikeways.
Of the 88 incorporated cities in Los Angeles County, 79 cities contain bikeways. Once the proposed bikeways have been developed, only four will not contain bikeways.
All 34 incorporated cities in Orange County contain bikeways.
Of the 25 incorporated cities in Riverside County, 21 cities contain bikeways. The 4 cities that do not are Banning, Beaumont, Blythe, and Calimesa. Once the proposed bikeways have been developed, only four will not contain bikeways.
Half of the 24 incorporated cities within San Bernardino County contain bikeways.
All 10 of the incorporated cities in Ventura County contain bikeways.
In an effort to increase mobility for bicyclists in the SCAG region, a 2,012.2 mile SCAG Regional Bikeway Network (Network) has been developed. This network has identified specific regional corridors that may be used to increase bicyclist mobility and connectiv-ity within the SCAG region. The Network includes 432.2 miles of existing bikeways. In addition, local jurisdictions have currently proposed an additional 752.5 miles of bike-ways within their local plans that would contribute to the Network. As part of the 2012 Strategic Plan, SCAG has identified 827.5 miles of bikeways that may be developed to close gaps in the Network. Completion of the Network would provide approximately 570,000 additional individuals with access to bikeways.
TABLE 9 SCAG Regional Bikeway Network Route Lengths by County and Class Type
County Class Existing Network
Proposed Network
SCAG Corridors Total
Imperial Class 1 2.9 63.4 - 66.3
Class 2 4.4 294.8 202.3 501.4
Class 3 38.1 16.3 51.8 106.2
Total 45.4 374.4 254.1 673.9
Los Angeles Class 1 264.0 197.8 3.9 465.7
Class 2 484.6 509.9 79.0 1,073.5
Class 3 518.2 318.7 127.0 964.0
Total 1,266.9 1,026.4 209.9 2,503.2
Orange Class 1 204.9 172.0 - 377.0
Class 2 638.5 499.2 0.6 1,138.3
Class 3 102.4 61.4 - 163.8
Total 945.8 732.6 0.6 1,679.0
Riverside Class 1 925.1 172.8 5.3 1,103.1
Class 2 235.7 693.4 31.9 960.9
Class 3 103.6 136.5 198.6 438.7
Total 1,264.3 1,002.7 235.8 2,502.8
San Bernardino Class 1 77.4 285.6 - 363.0
Class 2 275.8 798.6 16.6 1,091.0
Class 3 116.7 248.6 90.2 455.4
Total 469.9 1,332.7 106.8 1,909.4
Ventura Class 1 56.5 142.5 4.5 203.6
Class 2 203.1 248.6 0.4 452.1
Class 3 62.9 119.9 15.3 198.1
Total 322.5 511.1 20.2 853.8
Regional Total 4,314.8 4,979.9 827.3 10,122.1
Active Transportation 31

32
EXHIBIT 16 Existing, Proposed and SCAG Regional Bikeways

33
EXHIBIT 17 Existing SCAG Regional Bikeway Network

34
EXHIBIT 18 Proposed SCAG Regional Bikeway Network

Completion of the locally proposed projects would increase the bikeway network from 4,314.8 miles to 9,294.7 miles (4,979.9 mile increase). Completion of the Network would increase the total network system to 10,122.1 miles (an additional 827.4 mile increase).
TABLE 10 Population Served by the SCAG Regional Bikeway Network
Regional NetworkBikeway
MilesPopulation
ServedTotal
PopulationPercentage
Served
Existing Bikeways 4,315 7,933,592 18,616,290 42.6%
Existing Bikeways + Locally Proposed Bikeways
8,439 11,615,295 18,616,290 62.4%
Existing Bikeways + SCAG Proposed Bikeways
4,286 8,225,263 18,616,290 44.2%
Existing Bikeways + Locally Proposed Bikeways + SCAG Regional Bikeway Network
10,122 11,865,083 18,616,290 63.7%
The completed system will include the existing bikeway facilities, facilities proposed by local jurisdictions (constrained plan), and the SCAG Regional Bikeway Network Projects (strategic plan).
The existing bikeways that belong to the SCAG Regional Bikeway Network are highlighted. The existing system currently includes 432.2 miles of existing bikeways.
The proposed bikeways that belong to the SCAG Regional Bikeway Network have been highlighted, of these proposed projects 752.5 miles have been proposed by local jurisdic-tions and 827.4 miles have been identified by SCAG as regional bikeway corridors. These corridors provide a network, linking cities and facilities throughout the SCAG region; which may provide an increase in the number of bicycle commuters as well as bicycle tourists and recreational riders.
The SCAG Regional Bikeway Network was developed using local existing and planned facilities to the greatest extent possible to develop an interconnected bikeway network that allows bicyclists to travel between multiple jurisdictions. The new corridor facilities are graphically shown to close the gaps between the existing and locally planned facilities and do not necessarily represent specific alignments or facilities. Further, analysis and
collaboration with local jurisdictions is necessary to determine specific route structures. The $6.7 billion dollars allocated toward Active Transportation projects will significantly improve the existing bikeway network through the maintenance, improvement and expan-sion of the existing infrastructure.
California Coastal TrailIn addition to bikeways, local trails have been able to increase accessibility and provide opportunities for active transportation. Trails along the coast of California have been utilized as long as people have inhabited the region. In an effort to develop a “continuous public right-of-way along the California coastline; a trail designed to foster appreciate and stewardship of the scenic and natural resources of the coast through hiking and other complementary modes of non-motorized transportation” the California Coastal Trail (CCT) was established by Coastal Act of 1976.
The Coastal Initiative Collection (Proposition 20) of 1972 “created six regional commis-sions and one statewide commission to oversee the use and development of California’s 1,000 mile coastline, and was designed to address the state legislature’s failure to produce an acceptable compromise measure regarding coastal ecology, protection, and preservation.” Four years later Costal Act established the California Coastal Trail. In 1999 the CCT was designated as California’s Millennium Legacy Trail to encourage federal agencies to assist in its development. In 2001, Assembly Concurrent Resolution 20 declared the CCT an official State trail and Senate Bill 908 directed the Coastal Commission and State Parks Department to develop a plan to complete the CCT by 2008.
In 2003, the Coastal Conservancy developed the Completing the California Coastal Trail plan to provide a strategic blueprint to complete the CCT. The plan attempted to create a consistent, quality and connective trails throughout the length of the state by adhering to the following principles:
� Proximity – the CCT “should be within sight, sound or at least the scent of the sea.”
� Connectivity – the CCT “should effectively link starting points to destinations.”
� Integrity – the CCT “should be continuous and separated from motor traffic.”
� Respect – the CCT should be “located and designed with a healthy regard for the protection of natural habitats, cultural and archaeological features, private property rights, neighborhoods, and agricultural operations along the way.”
Active Transportation 35

� Feasibility – the CCT alignment should identify “timely, tangible results with the resources that are available, both interim and long-term.”
Government Code Section 65080.1 requires each MPO that includes a “portion of the California Coastal Trail, or property designated from the trail shall coordinate with the State Coastal Conservancy, the California Coastal Commission and Caltrans regarding the development of the trail. The trail must be identified in the RTP.”
In 1976 the American Revolution Bicentennial Commission of California and the California Department of Transportation developed the “Pacific Coast Bicentennial Bike Route.” The route began on Highway 101 at the California/Oregon State line, and ended near Interstate 5 at the Mexican border. This existing route is considered challenging and generally recommended for experienced bicyclists only. A pilot project to provide signage along the route in Caltrans District 1 included the installation of 19 bicycle guide signs in Mendocino County, providing cyclists with food, camping and directional information along the bikeway. This existing bikeway coincides with the CCT in some areas depend-ing on the geographical characteristics of that area. While the CCT includes the use of all of forms of active transportation, the primary goal of the CCT is to provide hiking or pedestrian trails.
Los Angeles, Orange and Ventura County each contain a number of bikeways located along the coast, which may be contribute to the completion of the CCT. Ventura County currently contains approximately 322.5 miles of existing bikeways, roughly 23.1 miles are located along the coast. Los Angeles County currently contains approximately 1,266.9 miles of existing bikeways, roughly 63.9 miles are located along the coast. Orange County currently contains approximately 945.8 miles of existing bikeways, roughly 30.2 miles are located along the coast. Completion of the CCT in these areas will require coordination between local and state agencies. New development projects that require approval from the California Coastal Commission may include Conditions of Approvals that provide for enhancements or additions to the CCT.
Completion of the 1,200 mile trail would provide citizens with the SCAG region and the state to have increased access to the California coast through active transportation modes. Additional public benefits from completing the CCT would include:
� Economic Benefits – According to the American Hiking Society’s factsheet, The Economic Benefits of Hiking, “Revenues generated from trail-related recreation and sports activities provide substantial income and employment opportunities.”
� Environmental Protection and Enhancement – having an established, marked trail may help minimize human impacts on the environment by directing them away from environmentally sensitive areas or resources and encouraging the use of active transportation to reduce GHGs.
� Quality of Life Benefits – the trails may increase recreational activities by providing safe trails for hiking, and riding and may also increase accessibility to other recre-ational facilities such as the beach or camp grounds.
� Public Health Benefits – improved accessibility to trails may encourage individuals to participate in a more active lifestyle by utilizing active transportation for recreational or transportation purposes.
In addition to the policy initiatives, the following projects have been identified to complete significant portions of the CCT within Ventura, Los Angeles and Orange County.
VENTURA COUNTY1. Assist Caltrans in evaluating and improving non-motorized access opportunities
along the Highway 101 corridor between the County line and Mussel Shoals.
2. Design a recreational access trail along the Santa Clara River to encourage non-motorized access to the coast from inland cities.
3. Restore the pedestrian and bicycle pathway damaged by erosion at Surfers’ Point (County Fairgrounds). Encourage the U.S. Navy to provide a shoreline public access connection on the Naval Construction Battalion Center, Port Hueneme, consistent with military security requirements.
4. Provide pedestrian and bicycle paths in conjunction with planning for restoration of the Ormond Beach wetlands, to connect with the trail in Port Hueneme.
5. Work with the City of Oxnard to design and construct recreational support facilities at the terminus of Arnold Road to improve beach access opportunities and avoid impacts to sensitive habitat areas.
36 Active Transportation

LOS ANGELES COUNTY1. Assist Caltrans in evaluating and improving non-motorized access along State
Highway 1 corridor from Leo Carrillo State Beach to the beginning of the South Bay Bicycle Path near Temescal Canyon. Encourage Caltrans and local agencies to extend bicycle and pedestrian improvements through Malibu.
2. Facilitate continuous lateral access along the Malibu shoreline from Leo Carrillo State Beach to the city limit.
3. Link the inland portions of the Santa Monica Mountains national Recreation Area with the coast by assisting the National Park Service, State Parks, the Santa Monica Mountains Conservancy, and the City of Malibu to acquire necessary rights-of-way and develop improvements to complete the Coastal Slope Trail.
4. Extend the pedestrian/bicycle path from Washington Street to the north jetty of Marina del Rey, and support the seasonal ferry service for pedestrians and cyclists across the channel to Playa del Rey.
5. Assist the Cities of Los Angeles and Long Beach in providing a continuous pedes-trian and bicycle access across the replacements for the Vincent Thomas Bridge and Gerald Desmond Bridge linking San Pedro to Long Beach.
ORANGE COUNTY1. Implement the planned State Highway 1 improvements between Seal Beach and
Anderson Street in Huntington Beach to create a separated non-motorized trail.
2. Encourage local agency efforts to work with private landowners and acquire public access rights necessary to provide a trail connection to the coast from Aliso Creek Regional Park.
3. Encourage local agency land acquisitions, trail design, and development to provide a public access connection to the coast from Laguna Coast Wilderness Park.
4. Complete improvements of “missing links” to provide safe pedestrian and bicycle access adjacent to State Highway 1 between the cities of Laguna Beach and Dana Point.
5. Support the effort by the City of San Clemente to provide a safe pedestrian and bicycle trail along the railroad right-of-way west of State Highway 1.
It is estimated that the CCT in the SCAG region would be comprised of 183 miles. Approximately 87 miles are considered adequate and an additional 96 miles are still needed in terms of highway corridor improvements, acquisition and construction on private lands, and construction on public lands. Completion of the CCT in the SCAG region is estimated to cost approximately $41,860.
TABLE 11 Improvements Needed to Complete the Coastal Trail: Estimated Linear Miles by County
CountyHighway Corridor
Improvements
Acquisition/Construction
on Private Lands
Construction on Public
Lands
Current Improvements
AdequateTotal
Ventura 21 - 6 25 52
Los Angeles 22 5 25 34 86
Orange 11 3 3 28 45
SCAG Total 54 8 34 87 183
CCT Total 245 269 245 548 1,307
TABLE 12 Estimated Capital Outlay Costs to Complete the Coastal Trail
CountyHighway Corridor
Improvements
Acquisition of New
Right-of-Way
Trail ConstructionTotalHard
SurfaceRural Signing
Ventura $3,200 - $2,400 - $20 $5,620
Los Angeles
$3,400 $2,300 $20,600 $100 $100 $26,300
Orange $1,600 $1,800 $6,700 - $40 $9,940
Total $8,200 $4,100 $29,700 $100 $160 $41,860
CCT Total $37,200 $121.40 $123,300 $38,450 $1,200 $321,550
Completion of these projects would help increase bicycle and pedestrian accessibility to the coast and assist in the development of a regional bikeway network.
Active Transportation 37

38
EXHIBIT 19 California Coastal Trail

Active Transportation 39
Policy RecommendationsWhile SCAG is not an implementing agency SCAG may work with local jurisdictions to assist them with developing policies and projects that may improve active transportation.
Agencies, Groups and Individuals in Bicycle and Walking PlanningFederal and state regulations require SCAG to plan and accommodate for bicycle and walking transportation. As the region’s MPO, SCAG develops regional planning strategies and encourages local jurisdictions to think about transportation at the regional level, since individual travel decisions are not bound by political boundaries and often transverse multiple jurisdictions. A regional approach towards transportation planning will provide increased connectivity and accessibility. The 2012 RTP has been developed in coopera-tion and collaboration with federal, state and local stakeholders. Each stakeholder plays a different role in the development and final adoption of the RTP.
FEDERAL GOVERNMENT
Federal statutes have mandated Metropolitan Planning Organizations (MPOs) to include pedestrian and bicycle facility strategies as part of their overall systematic approach in addressing current and future transportation demands.
STATE OF CALIFORNIA
The State of California and Caltrans has long supported active transportation planning, design policies and practices.
COUNTIES
Each county within the SCAG region has developed and maintained a bicycle and walking master plan to guide their active transportation development.
CITIES
Many of the cities within the SCAG region have developed and maintained a bicycle and/or walking plan as part of their circulation element or as a separate document. These
plans are used to guide their transportation development and assist them with the imple-mentation of their active transportation policies.
Performance MeasuresIn addition to the established goals and objectives the following performance measures have been identified in an effort to maximize the benefits of active transportation modes:
1. Change in Active Transportation mode share: Increase bicycling and walking in the SCAG region by creating and maintaining an active transportation system that includes well maintained bicycle and pedestrian facilities, easy access to transit facilities, and increased safety and security.
2. Change in the amount of Active Transportation facilities: Increase accommodation and planning for bicyclists and pedestrians (including persons with disabilities) for all transportation planning projects.
3. Change in the number of accidents involving Active Transportation users: Decrease bicyclist and pedestrian fatalities and injuries by increasing transportation safety.
4. Change in land use patterns and Active Transportation: Support local jurisdictions comply with the Complete Streets Act and the development of local active trans-portation plans. SCAG will also work with local jurisdictions in developing a regional active transportation plan.
Proposed PoliciesThe goals, objectives and policies in this report were derived from information gathered over the course of the planning process, including public input, review of bicycle and pedestrian master plans from local jurisdictions throughout the region.
GOAL 1: DECREASE BICYCLIST AND PEDESTRIAN FATALITIES AND INJURIES
� Objective 1.1: SCAG will work with local jurisdictions to support a safe transporta-tion environment in the SCAG Region.
� Policy 1.1.1: SCAG will work with local jurisdictions to provide comprehensive education for all road users.

40 Active Transportation
� Policy 1.1.2: SCAG will work with local jurisdictions to direct enforcement agencies to focus on bicycling and walking safety to reduce multi-modal conflicts.
� Policy 1.1.3: SCAG will partner with local advocacy groups and bicycle related businesses to provide bicycle-safety curricula to the general public.
The 2006 Strategic Highway Safety Plan (SHSP) established goals to make walking and street crossing safer; and improve bicycle safety. The SHSP intended on achieving these goals by 2010, reducing the number of pedestrian fatalities attributed to vehicle collisions and the number of bicycle roadway fatalities by 25 percent from their 2000 level. These goals were established by the Legislature in the 2002 California Blueprint for Bicycling and Walking, and assumed that the Legislature’s mobility goal of a 50 percent increase in bicycling and pedestrian trips by 2010 would also be achieved.
Improved data collection regarding pedestrian and bicycle trip characteristics, facil-ity conditions and injuries and fatalities would provide local jurisdictions with a clearer understanding of the active transportation conditions within their jurisdictions. Analysis generated from this data would also provide decision makers with a better understanding of the deficiencies and needs within the existing active transportation system.
FIGURE 14 California Coastal Trail Timeline
1970 1980 2000
1972COASTAL INITIATIVE COLLECTION (PROPOSITION 20)Created six regional and one state commission to develop California’s 1,000 mile coastline.
1976CALIFORNIA COASTAL ACTDefined the “coastal zone” as the area of the state that extends 3 miles seaward and 1,000 yards inland.
1999COASTAL ACCESS PROGRAM:CALIFORNIA’S MILLENNIUM LEGACY TRAILThe California Coastal Trail was recognized and designated as California’s Millennium Legacy Trail.
2001ASSEMBLY CONCURRENT RESOLUTION 20 The California Coastal Trail was declared an official State Trail.
SENATE BILL 908The State Coastal Conservancy developed the “Completing the California Coastal Trail” report.
2003COMPLETINGTHE CALIFORNIA COAST TRAILThe “Completing the California Coast Trail” plan was completed.
1990 2010

Active Transportation 41
GOAL 2: DEVELOP AN ACTIVE TRANSPORTATION FRIENDLY ENVIRONMENT THROUGHOUT THE SCAG REGION
� Objective 2.1: Produce a comprehensive regional active transportation plan � Policy 2.1.1: SCAG will work with local jurisdictions to adopt and implement
the proposed SCAG Regional Bikeway Network � Policy 2.1.2: SCAG will work with local jurisdictions to connect all cities in the
SCAG region via bicycle facilities � Policy 2.1.3: SCAG will work with local jurisdictions to complete the California
Coastal Trail
The need for active transportation needs to be fully considered for all transportation plan-ning projects. Increased accommodation for bicyclists and pedestrians requires increased funding, multi-modal planning, programming, and design. As planners increase accom-modation for active transportation users, an increase in bicyclist and pedestrian safety should also occur.
Research by Dr. Jennifer Dill, Portland State University Associate Processor, and anec-dotal evidence from New York City (NYC) indicate that increases in dedicated bicycle facilities (bicycle lanes and bicycle paths) in those cities have resulted in greater bicycle usage. In addition, in NYC, while bicycling use has doubled along with the number of bicycle facilities, bicycle fatalities have not grown, and injuries have actually declined in total. Collaborative efforts that are capable of integrating the needs of all commuters are essential to developing a safe and accessible transportation system for all users.
Adoption of the SCAG Regional Bikeway Network would increase bicycle facilities by 827.5 miles beyond existing local plans, and may further promote ridership in the SCAG region. In addition, SCAG may partner with local jurisdictions on grant opportunities such as the Caltrans Bicycle Transportation Account (BTA) or Safe Routes to School (SRTS) projects. SCAG may also provide local jurisdictions with assistance in the development of their local active transportation plans and by providing them with Pedestrian Safety Action Plan (PSAP) workshops. The SCAG Compass Blueprint program may further assist local jurisdictions with the development of innovative transportation and land-use plan-ning projects.
Adoption of a Complete Streets Policy that would ensure that all streets are safe, com-fortable, and convenient for travel for everyone, regardless of age or ability—motorists, pedestrians, bicyclists, and public transportation riders.
GOAL 3: INCREASE ACTIVE TRANSPORTATION USAGE IN THE SCAG REGION
� Objective 3.1: Adoption of a Safe Routes to School Policy � Policy 3.1.1: Enable and encourage children, including those with disabilities
to walk and bicycle to school � Policy 3.1.2: Make bicycling and walking to school a safer and more appeal-
ing transportation method, thereby encouraging a healthy and active lifestyle from an early age
� Policy 3.1.3: Facilitate the planning, development, and implementation of proj-ect and activities that will improve safety and reduce traffic, fuel consump-tion, and air pollution in the vicinity (approximately 2 miles) of primary and middle schools (Grade K-8)
� Objective 3.2: Adoption of a Complete Streets Policy � Policy 3.2.1: Encourage local jurisdictions to prioritize and implement proj-
ects/policies to comply with ADA requirements � Policy 3.2.2: Encourage local jurisdictions to develop and implement
Complete Streets Policies.
Increasing bicycling and walking requires well maintained bicycle and pedestrian facili-ties, easy access to transit facilities, and increased safety and security. While pedes-trian sidewalks are fairly well established in most areas, it is estimated that there are only 4,315 miles of dedicated bicycle facilities in the region, with an additional 7,154 miles planned.
Reliable data for planning is also needed to increase active transportation and invest-ments. Active transportation data needs include, but are not limited to, comprehensive user statistics, user demographics, bicycle travel patterns/corridors, accident map-ping, bikeway system characteristics, and sub-regional improvement projects and funding needs.

42 Active Transportation
GOAL 4: ENCOURAGE THE DEVELOPMENT OF LOCAL ACTIVE TRANSPORTATION PLANS
� Objective 4.1: SCAG will assist local jurisdictions with the development and mainte-nance of their local active transportation plans
� Policy 4.1.1: SCAG will work with local jurisdictions in the development of bicycle/pedestrian plans for all cities in the region
� Objective 4.2: Develop Pedestrian Safety Action Plans � Policy 4.2.1: SCAG will work with local jurisdictions in the development of
PSAPs by conducting workshops
� Objective 4.3: Encourage the use of Intelligent Traffic Strategies � Policy 4.3.1: Encourage the use of Intelligent Traffic Signals that are able to
detect slower pedestrians in signalized crosswalks and extend the signal time appropriately
SCAG will work with all member counties and cities to develop bicycle and walking plans and policies. Active transportation plans have been created or updated within the previ-ous four years are eligible for BTA funds.
Air Quality ImprovementsIn addition to increased mobility for all users throughout the SCAG region, implementation of the 2012–2035 RTP/SCS will further improve the environment and congestion of the region through the reduction of vehicle miles traveled (VMT).
Potential VMT ReductionAs described previously, active transportation has grown dramatically in recent years. This trend is expected to continue into the foreseeable future aided by several factors. First, dramatic increase in the bicycle network, as demonstrated earlier, will result in improved access to bicycle network for the Region’s residents by more than 50 percent. Second, more compact mixed use urban forms in the future will be much more condu-cive to biking and walking. Third, better coordination with other modes, primarily transit, will become an incentive for some to switch to biking or walking. Most importantly, a significant change in the culture that values a healthy lifestyle, bikeability and walkability
will become a greater impetus in promoting active transportation as a viable means of accessing opportunities. Given this context and survey data that supports dramatic increase in bicycling and walking mode shares in recent years, it is reasonable to assume this trend will continue into the future. For example, according to the NHTS data, bicycle mode share increased for all trips from 0.8 percent in 2000 to over 1.7 percent in 2009. This is an increase of almost 9 percent on an annualized basis. The share of walk trips for all trip purposes increased by approximately 6 percent on an annualized basis during the same period.
So, if we assumed annualized increase of 9 percent in mode share of bicycle trips for all trips, the potential bicycle mode share could be as high as 4.4 percent in 2020 and as high as 16 percent in 2035. However, it is somewhat unrealistic to assume that 9 percent growth rate could be sustained over such a long period of time. On the other hand, given the significant investments proposed for active transportation and the current trends, it is reasonable to assume that at least 2/3 of all trips shorter than 3 miles or half of all trips that are 5 miles or less could be converted to active transportation by 2035.
As indicated earlier, based on NHTS-CA Survey for all trips, bicycling and walking mode share for all trips are approximately 1.7 percent and 19.24 percent respectively for 2009. This represents a little over 50 percent of all trips less than 3 miles. Assuming 2/3 of all trips under 3 miles or half of all trips under 5 miles as the upper limit of Active Transportation mode share in 2035, relative increase (from the base year of 2008) in bicycling and walking mode shares can be estimated as 1.7 percent and 3.1 percent in 2020, and 3.9 percent and 6.3 percent in 2035. Relative reduction in VMT resulting from these mode shifts are estimated at approximately 7.8 million miles and 20.4 million miles for 2020 and 2035 respectively.


REGIONAL OFFICESImperial County1405 North Imperial AvenueSuite 1 El Centro, CA 92243 Phone: (760) 353-7800 Fax: (760) 353-1877
Orange CountyOCTA Building 600 South Main StreetSuite 906 Orange, CA 92863 Phone: (714) 542-3687 Fax: (714) 560-5089
Riverside County3403 10th StreetSuite 805 Riverside, CA 92501 Phone: (951) 784-1513 Fax: (951) 784-3925
San Bernardino CountySanta Fe Depot 1170 West 3rd StreetSuite 140 San Bernardino, CA 92410 Phone: (909) 806-3556 Fax: (909) 806-3572
Ventura County950 County Square DriveSuite 101 Ventura, CA 93003 Phone: (805) 642-2800 Fax: (805) 642-2260
818 West 7th Street, 12th Floor Los Angeles, CA 90017 Phone: (213) 236-1800 Fax: (213) 236-1825www.scag.ca.gov
please recycle 2347 2012.04.09