2018 VCE Further Mathematics 2 examination report...2008 Sydney value higher, 29.2 > 24.5, and...
18
© VCAA 2018 VCE Further Mathematics 2 examination report General comments Students were required to complete: a compulsory Core section of Data Analysis (worth 24 marks) a compulsory Core section of Recursion and financial modelling (worth 12 marks) two selected modules (worth 12 marks each). The selection of modules by students in 2018 is shown in the table below. Students are expected to be familiar with the formula sheet provided with the examination. Many students gave answers that did not relate to the question asked. Students are strongly encouraged to read the question again after they have completed their answer to ensure that they are answering appropriately. For example, in Question 1f. of the Core section when asked to describe the shape of the distribution, some students gave additional information concerning the centre and spread. Attention needed to be given to the type of statistical description required. Many questions on the examination were worth one mark, and with these questions the mark was awarded for a correct answer. Generally there was no need to put the answer into a sentence. For example, in Question 2e. of the Core the required answer was 85%, but students were not required to describe the meaning of this percentage. Some questions required the further application of a previous answer. If the previous answer was incorrect, the student may have been eligible for consequential error consideration. For this to apply, working out needed to show a correct substitution of the previous reasonable, but incorrect, answer into a relevant calculation. The resulting answer then needed to match that substitution and also be a reasonable answer. For example, in Question 3b. of the Geometry and Measurement module, a student who used Pythagoras’s theorem appropriately using their incorrect answer from Question 3a. was able to be awarded the consequential mark. For questions worth more than one mark, students are strongly advised to show working. An incorrect answer on its own will not be awarded any marks in a two-mark question; however, often Module % 2018 Matrices 88 Networks and decision mathematics 50 Geometry and measurement 29 Graphs and relations 33
Transcript of 2018 VCE Further Mathematics 2 examination report...2008 Sydney value higher, 29.2 > 24.5, and...

© VCAA
2018 VCE Further Mathematics 2 examination report
General comments
Students were required to complete:
a compulsory Core section of Data Analysis (worth 24 marks)
a compulsory Core section of Recursion and financial modelling (worth 12 marks)
two selected modules (worth 12 marks each).
The selection of modules by students in 2018 is shown in the table below.
Students are expected to be familiar with the formula sheet provided with the examination.
Many students gave answers that did not relate to the question asked. Students are strongly
encouraged to read the question again after they have completed their answer to ensure that they
are answering appropriately. For example, in Question 1f. of the Core section when asked to
describe the shape of the distribution, some students gave additional information concerning the
centre and spread. Attention needed to be given to the type of statistical description required.
Many questions on the examination were worth one mark, and with these questions the mark was
awarded for a correct answer. Generally there was no need to put the answer into a sentence. For
example, in Question 2e. of the Core the required answer was 85%, but students were not required
to describe the meaning of this percentage.
Some questions required the further application of a previous answer. If the previous answer was
incorrect, the student may have been eligible for consequential error consideration. For this to
apply, working out needed to show a correct substitution of the previous reasonable, but incorrect,
answer into a relevant calculation. The resulting answer then needed to match that substitution and
also be a reasonable answer. For example, in Question 3b. of the Geometry and Measurement
module, a student who used Pythagoras’s theorem appropriately using their incorrect answer from
Question 3a. was able to be awarded the consequential mark.
For questions worth more than one mark, students are strongly advised to show working. An
incorrect answer on its own will not be awarded any marks in a two-mark question; however, often
Module %
2018
Matrices 88
Networks and decision mathematics 50
Geometry and measurement 29
Graphs and relations 33
2018 VCE Further Mathematics 2 examination report
© VCAA Page 2
a method mark can be awarded for an intelligible attempt. For example, in Question 2d. of the Core
section, an answer of +1.8 without any working was not awarded any marks.
When a descriptive answer is required, brevity is encouraged in the response.
Some questions on the examination asked students to ‘show that’ a particular answer could be
obtained. Students must work towards the given result with all relevant steps shown in their
response. The answer the student is asked to show may be relevant in a subsequent part of the
question.
Rounding of answers to a specified level of accuracy is an important skill that students must be
able to demonstrate. When completing the equation of a least squares line, some students did not
understand the difference between decimal places rounding and significant figures rounding.
In the Recursion and financial modelling module students sometimes continued working from a
correct answer to an incorrect answer because they rounded to the nearest 5 cents or 10 cents.
For example, in Question 5b. of the Core section, the required answer was $5484.23 and some
students incorrectly rounded further to $5484.20 or $5484.25.
In questions where no instruction to round was given, an exact answer was required as rounding
did not apply. For example, in Question 2c. of the Core section the required answer was 63.8%
and since rounding did not apply an answer of 64% could not be accepted.
Specific information
This report provides sample answers or an indication of what answers may have included. Unless otherwise stated, these are not intended to be exemplary or complete responses.
The statistics in this report may be subject to rounding resulting in a total more or less than 100 per cent.
Core Data analysis
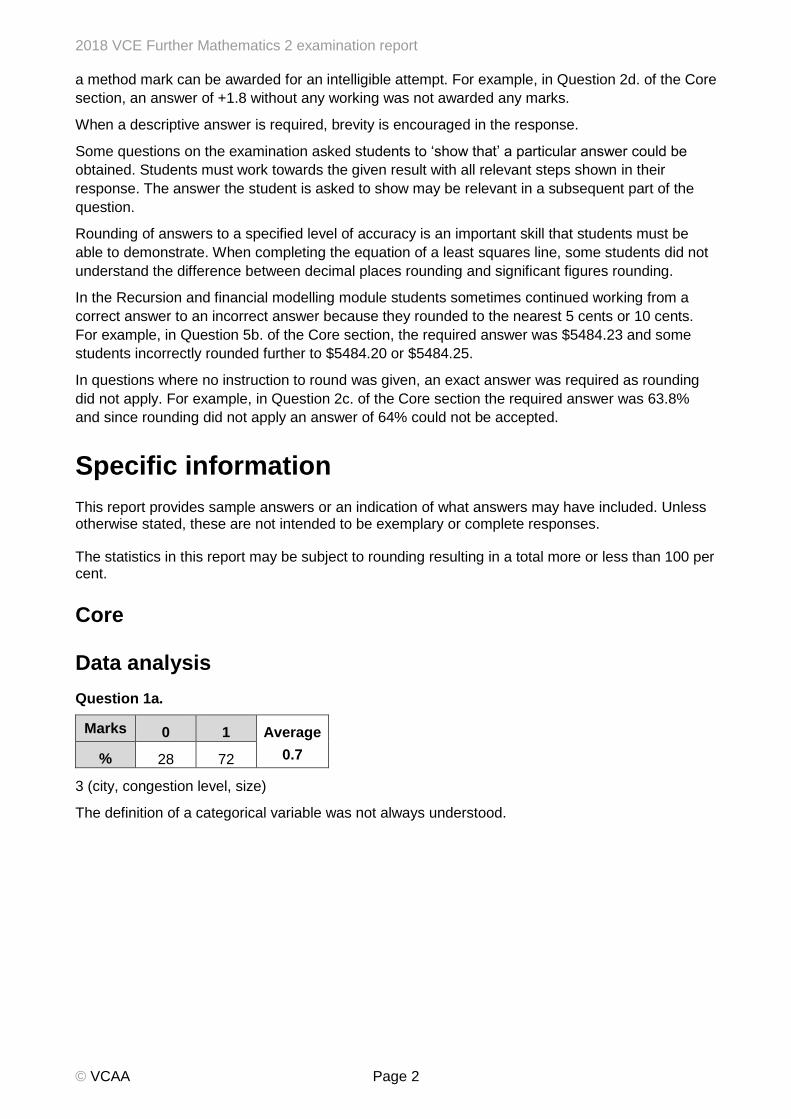
Question 1a.
Marks 0 1 Average
% 28 72 0.7
3 (city, congestion level, size)
The definition of a categorical variable was not always understood.

2018 VCE Further Mathematics 2 examination report
© VCAA Page 3
Question 1b.
Marks 0 1 Average
% 29 71 0.7
2 (congestion level, size)
Most students were able to answer this question correctly, but 1 and 3 were also common
answers.
Question 1c.
Marks 0 1 Average
% 20 80 0.8
Newcastle-Sunderland and Liverpool
It was evident that some students did not read the question carefully as they gave the full list of all
cities with a medium level of congestion instead of giving only the large cities with a medium level
of congestion as required by the question.
Question 1d.
Marks 0 1 2 Average
% 1 5 94 1.9
City size
Congestion level Small Large
high 4 2
medium 4 2
low 8 3
Total 16 7
Question 1e.
Marks 0 1 Average
% 19 81 0.8
25%
This question was answered well, although some students gave 17% by taking the percentage of
all 23 cities.

2018 VCE Further Mathematics 2 examination report
© VCAA Page 4
Question 1f.
Marks 0 1 Average
% 13 87 0.9
Positively skewed
This question was answered well; however, some students went on to comment on the centre and
spread, which was not required and made it difficult to determine if the student understood which
had been asked for. The mark could not be awarded in this case.
Question 1g.
Marks 0 1 Average
% 19 81 0.8
52.5
This question was answered well; however, some students added the relationship between the
data value and the upper fence, which was not part of this question.
Question 2a.
Marks 0 1 2 Average
% 30 29 41 1.1
Median percentage congestion level for morning peak period 52%
Median percentage congestion level for evening peak period 56%
This question was not answered well. Some students gave the correct median percentage for the
morning peak period but not for the evening peak period as they found the median ‘x’ value and
then wrote the ‘y’ value of that data point as their median ‘y’ value.
Question 2b.
Marks 0 1 Average
% 10 90 0.9
Evening congestion level
Question 2c.
Marks 0 1 Average
% 22 78 0.8
63.8%
Rounding did not apply, so an answer of 64% was not accepted.
Question 2d.
Marks 0 1 2 Average
% 36 21 42 1.1
–1.8

2018 VCE Further Mathematics 2 examination report
© VCAA Page 5
Some students did not answer this question well. Many students did not find the actual value of 50
from the graph and used 47 instead. Some found 51.814 but did not know how to proceed further.
Question 2e.
Marks 0 1 Average
% 41 59 0.6
85%
92% was a very common incorrect answer.
Question 3a.
Marks 0 1 Average
% 12 88 0.9
Question 3bi.
Marks 0 1 Average
% 49 51 0.5
2018 VCE Further Mathematics 2 examination report
© VCAA Page 6
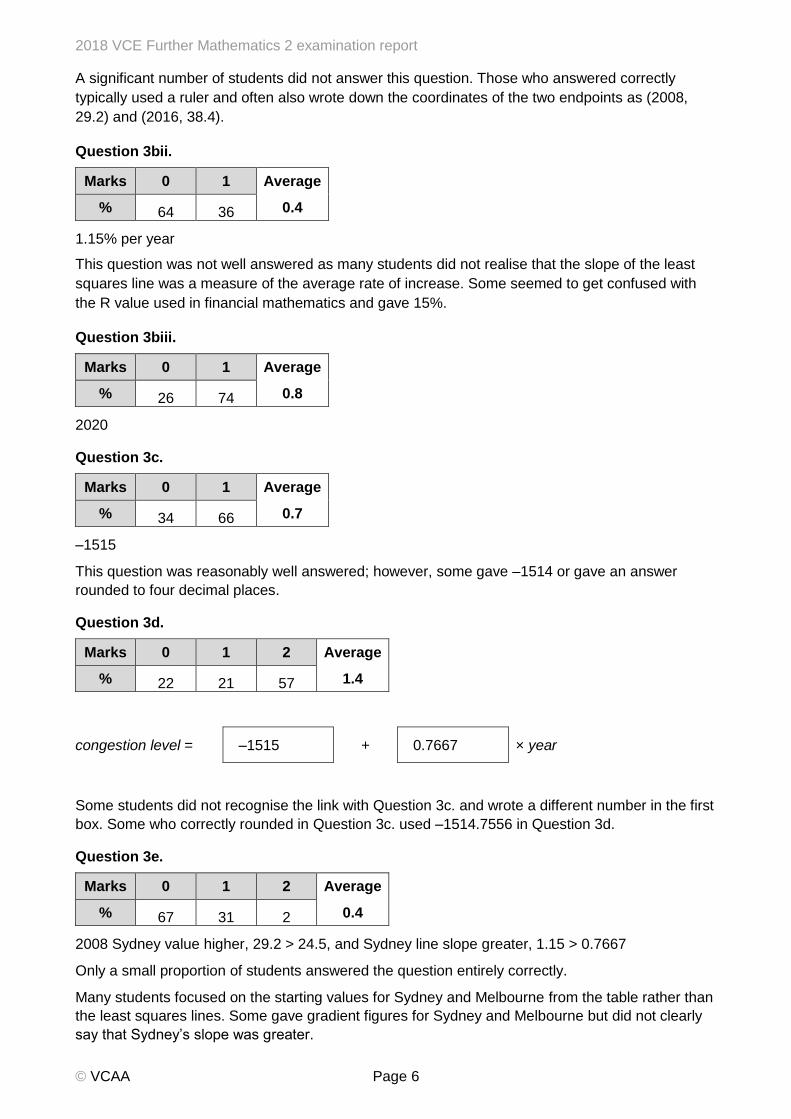
A significant number of students did not answer this question. Those who answered correctly
typically used a ruler and often also wrote down the coordinates of the two endpoints as (2008,
29.2) and (2016, 38.4).
Question 3bii.
Marks 0 1 Average
% 64 36 0.4
1.15% per year
This question was not well answered as many students did not realise that the slope of the least
squares line was a measure of the average rate of increase. Some seemed to get confused with
the R value used in financial mathematics and gave 15%.
Question 3biii.
Marks 0 1 Average
% 26 74 0.8
2020
Question 3c.
Marks 0 1 Average
% 34 66 0.7
–1515
This question was reasonably well answered; however, some gave –1514 or gave an answer
rounded to four decimal places.
Question 3d.
Marks 0 1 2 Average
% 22 21 57 1.4
congestion level = –1515 + 0.7667 × year
Some students did not recognise the link with Question 3c. and wrote a different number in the first
box. Some who correctly rounded in Question 3c. used –1514.7556 in Question 3d.
Question 3e.
Marks 0 1 2 Average
% 67 31 2 0.4
2008 Sydney value higher, 29.2 > 24.5, and Sydney line slope greater, 1.15 > 0.7667
Only a small proportion of students answered the question entirely correctly.
Many students focused on the starting values for Sydney and Melbourne from the table rather than
the least squares lines. Some gave gradient figures for Sydney and Melbourne but did not clearly
say that Sydney’s slope was greater.

2018 VCE Further Mathematics 2 examination report
© VCAA Page 7
Again some students seemed to get confused with the R value used in financial mathematics and
described Melbourne’s gradient of 0.7667 as a decrease of about 23%.
Recursion and financial modelling
Question 4a.
Marks 0 1 Average
% 4 96 1
$12 000
Question 4bi.
Marks 0 1 Average
% 11 89 0.9
V1 = 1.0062 × 12 000
This question was answered well, although some students used methods other than simple
recursion, which were not acceptable.
Question 4bii.
Marks 0 1 Average
% 18 82 0.8
4 months
Question 4ci.
Marks 0 1 Average
% 22 78 0.8
balance = 12 000 × 1.0062 n
A common error was for students to write the two numbers in the incorrect boxes.
Question 4cii.
Marks 0 1 Average
% 35 65 0.7
36
Question 5a.
Marks 0 1 Average
% 45 55 0.6
15%
This question was not well answered. Some students gave the R value of 0.85.

2018 VCE Further Mathematics 2 examination report
© VCAA Page 8
Question 5b.
Marks 0 1 2 Average
% 53 13 34 0.8
$5484.23
Some students obtained one mark for correctly finding the value after three years.
Many depreciated by 8.6% for the entire eight years.
Question 6a.
Marks 0 1 Average
% 59 41 0.4
4.68%
A common error was 0.18%, which did not account for the fortnightly payments. Perpetuities was
an area that requires improvement for many students.
Question 6bi.
Marks 0 1 Average
% 52 48 0.5
$2800
Question 6bii.
Marks 0 1 2 Average
% 80 9 11 0.3
$20 488.89
Balance start Year 2: 480 242.25
Balance end Year 2: 467 131.14
Balance reduction 13 111.11
Payments in Year 2 = 12 × 2800 = 33 600
Interest = 33 600.00 – 13 111.11 = 20 488.89
An answer of $20 488.88, based on an unrounded value from Question 6bi., was also awarded full
marks.
Many students did not attempt this question. Many found the future value after two years of
$467 131 but could not proceed further.
A few students tried unsuccessfully to use the annuities formula.

2018 VCE Further Mathematics 2 examination report
© VCAA Page 9
Section B – Modules Module 1 – Matrices
Question 1a.
Marks 0 1 Average
% 1 99 1
$2.87
Question 1b.
Marks 0 1 Average
% 6 94 1
3 1
Question 1c.
Marks 0 1 Average
% 34 66 0.7
1 0 2
Some students gave the correct numbers but in a column matrix.
Question 2a.
Marks 0 1 Average
% 38 62 0.6
2184
1782
1666
Some students gave only one or two of the correct elements.
Question 2b.
Marks 0 1 Average
% 60 40 0.4
1.04 0 0
0 0.99 0
0 0 0.98
Most students recognised that a 3 × 3 matrix was required. Numbers such as 0.04, –0.01 and
–0.02 were often included in students’ answers.

2018 VCE Further Mathematics 2 examination report
© VCAA Page 10
Question 3a.
Marks 0 1 Average
% 52 48 0.5
70 km
Many students gave 390 as their answer, indicating that they had not read the question fully.
Some gave 10% or 0.1 rather than finding the length.
Question 3b.
Marks 0 1 Average
% 23 77 0.8
0.2 × 700 + 0.1 × 400 + 0 × 200 + 0.2 × 1400 = 460
Some students listed the numbers in the G column rather than the row.
Question 3c.
Marks 0 1 Average
% 18 82 0.8
390 and 360
Question 3d.
Marks 0 1 Average
% 83 17 0.2
48.5%
This question was not answered well, with most students giving 97%, which did not take account of
the 0.5 change.
Question 3e.
Marks 0 1 Average
% 61 39 0.4
56.7%
Some students left the answer as 1532.1 and did not convert to the required percentage.
Question 4a.
Marks 0 1 Average
% 61 39 0.4
30
Many students did not recognise that the 2700 km of highway remained constant throughout.

2018 VCE Further Mathematics 2 examination report
© VCAA Page 11
Question 4b.
Marks 0 1 Average
% 77 23 0.3
457 km
Students who found k correctly in part a. were often able to answer this question correctly. Some
wrote the correct matrix for 2022 only and did not extract the number 457 as their answer.
Module 2 – Networks and decision mathematics
Question 1ai.
Marks 0 1 Average
% 10 90 0.9
9
Question 1aii.
Marks 0 1 Average
% 23 77 0.8
13
Some gave an answer of 14 by not allowing for the 1 against the flow.
Question 1b.
Marks 0 1 Average
% 68 32 0.3
7
This question was not answered well. The answer of 9 from part a. was often repeated.
Question 2a.
Marks 0 1 Average
% 4 96 1
F
Question 2b.
Marks 0 1 Average
% 46 54 0.6
2
Some students gave a definition of an Eulerian trail rather than stating how many extra edges were
required.

2018 VCE Further Mathematics 2 examination report
© VCAA Page 12
Question 2c.
Marks 0 1 Average
% 38 62 0.6
This is one example of numerous possible paths that begin at F, have 9 edges and include all
other vertices.
A reasonable number of students answered this question correctly; however, some paths returned
to F, creating a circuit.
Question 3a.
Marks 0 1 Average
% 36 64 0.7
10
The most common incorrect answer given by students was 8, which indicated that they did not
recognise that the longest path to I was required.
Question 3b.
Marks 0 1 Average
% 24 76 0.8
B-E-G-H-J
Question 3c.
Marks 0 1 Average
% 55 45 0.5
A and C
This question was not answered well, with many combinations of incorrect answers given by
students.
Question 3d.
Marks 0 1 Average
% 75 25 0.3
end of activity E to the start of activity J
F

2018 VCE Further Mathematics 2 examination report
© VCAA Page 13
This question was not answered well. Some students could identify E as the starting point of the
required edge but could not identify J as the end point.
Question 4a.
Marks 0 1 Average
% 69 31 0.3
2
An Eulerian circuit was required; therefore, two extra edges were needed to make all vertices of
even degree. Common incorrect answers were 3 and 4.
Question 4b.
Marks 0 1 Average
% 86 14 0.2
108 km
The extra two edges (PQ and ST) needed to be added to the sum of all distances (86) on the
graph.
This question was not well answered, with many different incorrect responses given, including 109
and 113.
A number of students incorrectly calculated the minimum distance to visit all the towns
(Hamiltonian) rather than check all the roads (Eulerian).
Module 3 – Geometry and measurement
Question 1a.
Marks 0 1 Average
% 14 86 0.9
6.8 cm
Question 1b.
Marks 0 1 Average
% 25 75 0.8
508.4 cm2
Question 1ci.
Marks 0 1 Average
% 13 87 0.9
V 343.4
3
Some students used a power of 2 rather than 3. The correct calculation needed to involve p and
not an approximate value such as 3.14.

2018 VCE Further Mathematics 2 examination report
© VCAA Page 14
Question 1cii.
Marks 0 1 Average
% 18 83 0.8
V 23.4 20.4
Question 1ciii.
Marks 0 1 Average
% 26 74 0.8
247 cm3
Some students allowed for only one tennis ball and gave 576 as their answer.
Question 2a.
Marks 0 1 Average
% 71 29 0.3
13 hours 30 minutes
This question was not answered well. Common incorrect answers included 9 hours 30 minutes
where time difference was not considered, and 5 hours 30 minutes where the time difference was
subtracted. 13.3 hours was not an equivalent form of 13:30 hours and could not be accepted.
Question 2bi.
Marks 0 1 Average
% 48 52 0.5
6400 cos 11r
Equivalent forms were accepted.
Question 2bii.
Marks 0 1 Average
% 67 33 0.4
1754 km
Many students used 6400 rather than 6282 in the calculation, giving 1787 as the final answer.
Question 3a.
Marks 0 1 Average
% 27 73 0.8
18.8 m
Question 3b.
Marks 0 1 Average
% 40 60 0.6
19 m

2018 VCE Further Mathematics 2 examination report
© VCAA Page 15
A consequential mark was available to those who used their incorrect result for part a.
Question 3ci.
Marks 0 1 Average
% 75 25 0.3
52.5° and 127.5°
This involved the ambiguous case of the sine rule, solving
Qsin sin 23.5
20.7 10.4
This question was not answered well, with some students finding only the 52.5° solution.
Question 3cii.
Marks 0 1 Average
% 82 18 0.2
13 m
Students needed to choose the 127.5° angle and then solve for x.
x 10.4
sin 29 sin 23.5
Some students used the 52.5 angle to find 25 metres, which was outside the court.
Module 4 – Graphs and relations
Question 1a.
Marks 0 1 Average
% 8 92 0.9
Day 2
Question 1b.
Marks 0 1 Average
% 22 78 0.8
Days 16 and 17
This question was well answered; however, some students did not give consecutive days.

2018 VCE Further Mathematics 2 examination report
© VCAA Page 16
Question 2a.
Marks 0 1 Average
% 47 53 0.6
567
20
It was not sufficient to substitute in values or to give the equation and write ‘solve’.
Question 2b.
Marks 0 1 Average
% 12 88 0.9
5.67 g
Question 2c.
Marks 0 1 Average
% 33 67 0.7
8 ounces
Question 3a.
Marks 0 1 Average
% 40 60 0.6
Incorrect lines often began at the origin.

2018 VCE Further Mathematics 2 examination report
© VCAA Page 17
Question 3b.
Marks 0 1 Average
% 59 41 0.4
$11 200
Many students tried to read off the graph and gave an incorrect answer of $11 000.
Question 3c.
Marks 0 1 2 Average
% 13 15 73 1.6
Generally the two line segments were drawn in the right positions with mistakes tending to be with
the open and closed circles at the endpoints.

2018 VCE Further Mathematics 2 examination report
© VCAA Page 18
Question 4a.
Marks 0 1 Average
% 70 30 0.3
This question was not answered well, with some students shading a region rather than marking
five points.
Some students incorrectly thought the required points must always be the intersection points of
boundary lines.
Question 4b.
Marks 0 1 Average
% 71 29 0.3
$2560
Maximum cost at (7, 15)
C = 130 7 + 110 15 = 2560
This question was not answered well. Most students were able to generate a cost function and
substitute into it but did not have the correct integer values.
Question 4c.
Marks 0 1 Average
% 78 22 0.2
$2740
Minimum cost at (6, 14)
C = 130 6 + 140 14 = 2740
This question was not answered well. Students who scored well were able to slide a line with a
gradient of -13
14 to the first of the five integer points.