2018 General Rate Case A.16-09- - Southern California Edison€¦ · Workpaper – Southern...
142
2018 General Rate Case A.16-09-_______ Workpapers HR - Total Compensation Study SCE-06 Volume 03 September 2016
Transcript of 2018 General Rate Case A.16-09- - Southern California Edison€¦ · Workpaper – Southern...
2018 General Rate Case
A.16-09-_______
Workpapers
HR - Total Compensation Study SCE-06 Volume 03
September 2016
Workpaper – Southern California Edison / 2018 GRC
Exhibit No. SCE-06 / Vol. 03Witness: A. Peterson
Aon Hewitt Consulting | Talent, Rewards, and Performance
Risk. Reinsurance. Human Resources.
2018 General Rate Case— Total Compensation Study Report—Final Southern California Edison
July 2016
1
Workpaper – Southern California Edison / 2018 GRC
Exhibit No. SCE-06 / Vol. 03Witness: A. Peterson
2018 General Rate Case 1
Introduction In 2016, Southern California Edison (“SCE”) will be filing an application for its 2018 General Rate Case (“GRC”) with the California Public Utilities Commission (“CPUC”). As part of this application, SCE will include a Total Compensation Study (“the 2018 Study”) that will provide a competitive analysis of SCE’s total compensation including pay and benefits. Total Compensation Studies that were included in prior GRC submissions, including the most recent submission for the 2015 GRC, were conducted jointly with SCE and the Office of Ratepayer Advocates (“ORA”) of the CPUC. ORA declined to participate in the 2018 Study.
SCE selected Aon Hewitt to conduct the competitive analysis of total compensation. Working together as the GRC Study Team (“the Team”), representatives from SCE and Aon Hewitt reviewed the methodology used in the 2015 Study and confirmed that the same methodology would be applied in the 2018 Study. The methodology is described in detail in this report and discussions about the methodology are referenced in the meeting notes and working papers. The team felt it was important that the methodology remain as consistent as possible to the approach used in the 2015 Study in order to reflect input provided by the ORA related to preferences in methodology and to allow comparison of results between the two Studies. Aon Hewitt applied the methodology to obtain competitive total compensation data and then compared that data to SCE’s total compensation levels.
The Team members included the following:
� Mark Bennett—SCE
� George DeMaria—SCE
� Colleen Hernandez—SCE
� Rahab Mahfud—SCE
� Michelle Ricard—SCE
� Al Kopec—Aon Hewitt, Project Consultant
� Kathy Miller—Aon Hewitt, Project Consultant
� Blake Murphy—Aon Hewitt, Project Consultant
� Chelsea G. Penaloza—Aon Hewitt, Project Consultant
� Alison A. Peterson—Aon Hewitt, Study Project Manager
This report contains the 2018 Study results and a description of the 2018 Study methodology.
2
Workpaper – Southern California Edison / 2018 GRC
Exhibit No. SCE-06 / Vol. 03Witness: A. Peterson
2018 General Rate Case 2
Contents Study Results 3
Study Methodology 9
Appendix A: Benchmark Jobs 25
Appendix B: Comparator List 36
Appendix C: Detailed Results by Category 40
Appendix D: Competitive Analysis Summary 50
Appendix E: Generic Job Methodology 54
Appendix F: LTI Study Positions 60
Appendix G: Benefit Calculation Samples (SCE and Comparator Company) 63
Appendix H: Meeting Notes 71
Appendix I: Measurement of Error 72
Appendix J: Glossary of Terms 74
3
Workpaper – Southern California Edison / 2018 GRC
Exhibit No. SCE-06 / Vol. 03Witness: A. Peterson
2018 General Rate Case 3
Study Results
4
Workpaper – Southern California Edison / 2018 GRC
Exhibit No. SCE-06 / Vol. 03Witness: A. Peterson
2018 General Rate Case 4
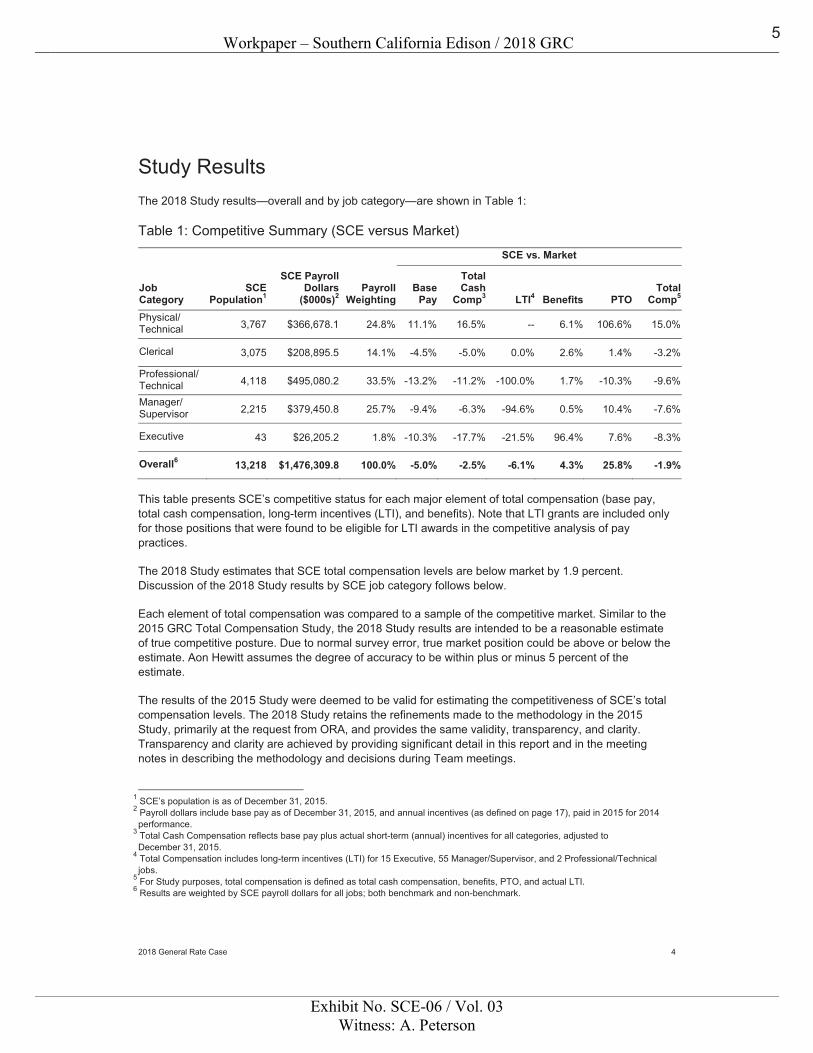
Study Results The 2018 Study results—overall and by job category—are shown in Table 1:
Table 1: Competitive Summary (SCE versus Market)
SCE vs. Market
Job Category
SCE Population1
SCE Payroll Dollars
($000s)2Payroll
WeightingBase
Pay
Total Cash
Comp3 LTI4 Benefits PTOTotal
Comp5
Physical/ Technical 3,767 $366,678.1 24.8% 11.1% 16.5% -- 6.1% 106.6% 15.0%
Clerical 3,075 $208,895.5 14.1% -4.5% -5.0% 0.0% 2.6% 1.4% -3.2%
Professional/ Technical 4,118 $495,080.2 33.5% -13.2% -11.2% -100.0% 1.7% -10.3% -9.6%
Manager/ Supervisor 2,215 $379,450.8 25.7% -9.4% -6.3% -94.6% 0.5% 10.4% -7.6%
Executive 43 $26,205.2 1.8% -10.3% -17.7% -21.5% 96.4% 7.6% -8.3%
Overall6 13,218 $1,476,309.8 100.0% -5.0% -2.5% -6.1% 4.3% 25.8% -1.9%
This table presents SCE’s competitive status for each major element of total compensation (base pay, total cash compensation, long-term incentives (LTI), and benefits). Note that LTI grants are included only for those positions that were found to be eligible for LTI awards in the competitive analysis of pay practices.
The 2018 Study estimates that SCE total compensation levels are below market by 1.9 percent. Discussion of the 2018 Study results by SCE job category follows below.
Each element of total compensation was compared to a sample of the competitive market. Similar to the 2015 GRC Total Compensation Study, the 2018 Study results are intended to be a reasonable estimate of true competitive posture. Due to normal survey error, true market position could be above or below the estimate. Aon Hewitt assumes the degree of accuracy to be within plus or minus 5 percent of the estimate.
The results of the 2015 Study were deemed to be valid for estimating the competitiveness of SCE’s total compensation levels. The 2018 Study retains the refinements made to the methodology in the 2015 Study, primarily at the request from ORA, and provides the same validity, transparency, and clarity. Transparency and clarity are achieved by providing significant detail in this report and in the meeting notes in describing the methodology and decisions during Team meetings.
1 SCE’s population is as of December 31, 2015. 2 Payroll dollars include base pay as of December 31, 2015, and annual incentives (as defined on page 17), paid in 2015 for 2014 performance.
3 Total Cash Compensation reflects base pay plus actual short-term (annual) incentives for all categories, adjusted to December 31, 2015.
4 Total Compensation includes long-term incentives (LTI) for 15 Executive, 55 Manager/Supervisor, and 2 Professional/Technical jobs.
5 For Study purposes, total compensation is defined as total cash compensation, benefits, PTO, and actual LTI. 6 Results are weighted by SCE payroll dollars for all jobs; both benchmark and non-benchmark.
5
Workpaper – Southern California Edison / 2018 GRC
Exhibit No. SCE-06 / Vol. 03Witness: A. Peterson
2018 General Rate Case 5
Discussion of Competitive Posture Overall, SCE total compensation is below the competitive norm by 1.9 percent. This amount was derived by computing an overall average based on the results of each category, weighted by its payroll dollars. SCE was 5.0 percent below the competitive norm in the 2015 Study. There were several contributing factors to the shift in position to comparators between the two Studies with the most notable being:
� Decline in position to comparators on base pay from 3.3 percent below in the 2015 Study to 5.0 percent below in the 2018 Study. SCE’s average base pay increased 8.3 percent between Studies while the comparators increased by 10.5 percent. The Study team believes the slower rate of increase in base pay at SCE is tied to the approximately 20 percent reduction in SCE’s employee population during this time frame with, on average, more highly compensated employees leaving the Company resulting in lower overall average base pay for the retained population.
� Increase in position to comparators on total cash compensation from 3.7 percent below in the 2015 Study to 2.5 percent below in the 2018 Study. This increase is primarily attributable to an increase in the average bonus payout from 104 percent of target for bonuses paid in 2012 (and reported in the 2015 Study) to 143 percent of target for bonuses paid in 2015 (reported in the 2018 Study).
� Increase in the position to comparators on Long-Term Incentives (LTI) for non-executive positions from 15.0 percent below in the 2015 Study to 6.1 percent below in the 2018 Study. The primary driver of this change is that fewer jobs were eligible for LTI in the 2018 Study.
� Increase in position to comparators for benefits from 1.2 percent below in the 2015 Study to 4.3 percent above in the 2018 Study. The increase is related to a reduction in retirement benefits at utility comparators causing SCE’s retirement values to increase relative to those comparators. The increase in retirement benefits is partially offset by SCE’s lower position to general industry comparators on medical costs.
� Increase in the position to comparators for Paid Time Off (PTO) from 2.6 percent above in the 2015 Study to 25.8 percent above in the 2018 Study. The increase is related to an increase in the number of days carried over at year-end for SCE versus the comparator group in the PTO calculation. Because the value of PTO is small relative to total cash and benefits, small changes in the value of the PTO carry over can result in significant changes in the position to comparators.
6
Workpaper – Southern California Edison / 2018 GRC
Exhibit No. SCE-06 / Vol. 03Witness: A. Peterson
2018 General Rate Case 6
Competitive posture varies by category as follows:
Physical/Technical SCE’s Physical/Technical jobs are above comparators by 15.0 percent. The results were influenced by position to comparators for several of SCE’s highly populated job classifications including: Lineman, Troubleman, Foreman Electrical Crew, and Operator, System. These benchmarks are 25.6 percent, 29.0 percent, 27.3 percent, and 21.3 percent above comparator pay levels, respectively. Position to comparators for this category was 9.2 percent above in the 2015 Study.
Clerical In the Clerical category, SCE’s pay levels are below comparator levels by 3.2 percent. This result is due to a mix of position to comparators for several high incumbent jobs with some being above, approximately at, and below comparator pay levels. The ���� most highly populated jobs in this category are Customer Specialist 2, Analyst-Program/Project 2, Planner 1, and Construction/Maintenance Acc�������. These benchmarks are 16.1 percent above, 16.0 percent below, 15.3 percent below, and 40.3 percent above�����, respectively. Results are similar to the 2015 Study in which the Clerical category was 1.1 percent below the comparator pay levels.
Professional/Technical Overall, SCE’s total compensation for the Professional/Technical category was 9.6 percent below comparator group levels. Total compensation was below comparator levels for roughly 87 percent of benchmark incumbents including the following highly populated jobs: Manager-Project/Product 1, Technical Specialist/Scientist 3, Analyst-Business 3, Analyst-Program/Project 3, and Engineer 3. These benchmarks are 11.9 percent, 12.9 percent, 4.6 percent, 14.2 percent and 10.7 percent below comparator pay levels respectively. Similarly, this group’s total compensation was 12.3 percent below the comparator level in the 2015 Study.
Manager/Supervisor SCE’s total compensation for this category is 7.6 percent below comparator levels. In the 2015 Study, the Manager/Supervisor category was further below comparator levels at 15.9 percent. The Manager/Supervisor category has a higher percentage of low incumbent count jobs as compared to the Physical/Technical, Clerical, or Professional/Technical category, but the most highly populated position contributing to the below market result is the Manager Project/Product 2 at 13.1 percent below comparator levels. The largest contributor to the shift in position to comparators for this category is the higher bonus payouts, resulting in an increase in the 2018 Study as compared to the 2015 Study.
Executive Total compensation for this category is 8.3 percent below comparators. In the 2015 Study, this category was 9.5 percent above comparator total compensation levels. The shift in position to comparators is difficult to isolate because there were a number of changes in the benchmark results for executives from the 2015 Study. Six of the fifteen jobs included in the Study had a significant change in scope and accountabilities. As a result, the benchmark matches for these jobs changed from the 2015 Study. Two jobs are new to SCE and were added to the Study. Two jobs were included in the 2015 Study; however insufficient market data was available at that time. Sufficient data was available for these two jobs for the 2018 Study. Two jobs remained the same and were included in both the 2015 and 2018 Study with no changes in incumbents. One job remained the same but had a change in incumbents between Studies.
7
Workpaper – Southern California Edison / 2018 GRC
Exhibit No. SCE-06 / Vol. 03Witness: A. Peterson
2018 General Rate Case 7
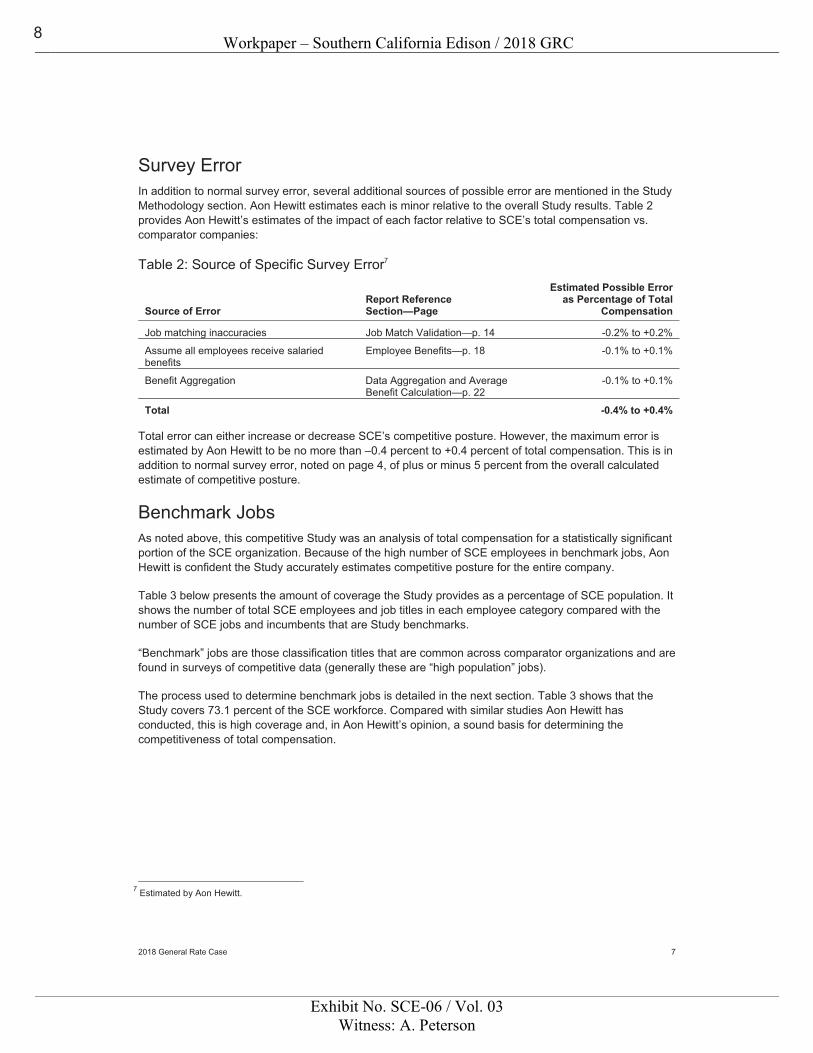
Survey Error In addition to normal survey error, several additional sources of possible error are mentioned in the Study Methodology section. Aon Hewitt estimates each is minor relative to the overall Study results. Table 2 provides Aon Hewitt’s estimates of the impact of each factor relative to SCE’s total compensation vs. comparator companies:
Table 2: Source of Specific Survey Error7
Source of Error Report Reference Section—Page
Estimated Possible Error as Percentage of Total
Compensation
Job matching inaccuracies Job Match Validation—p. 14 -0.2% to +0.2%
Assume all employees receive salaried benefits
Employee Benefits—p. 18 -0.1% to +0.1%
Benefit Aggregation Data Aggregation and Average Benefit Calculation—p. 22
-0.1% to +0.1%
Total -0.4% to +0.4% Total error can either increase or decrease SCE’s competitive posture. However, the maximum error is estimated by Aon Hewitt to be no more than –0.4 percent to +0.4 percent of total compensation. This is in addition to normal survey error, noted on page 4, of plus or minus 5 percent from the overall calculated estimate of competitive posture.
Benchmark Jobs As noted above, this competitive Study was an analysis of total compensation for a statistically significant portion of the SCE organization. Because of the high number of SCE employees in benchmark jobs, Aon Hewitt is confident the Study accurately estimates competitive posture for the entire company.
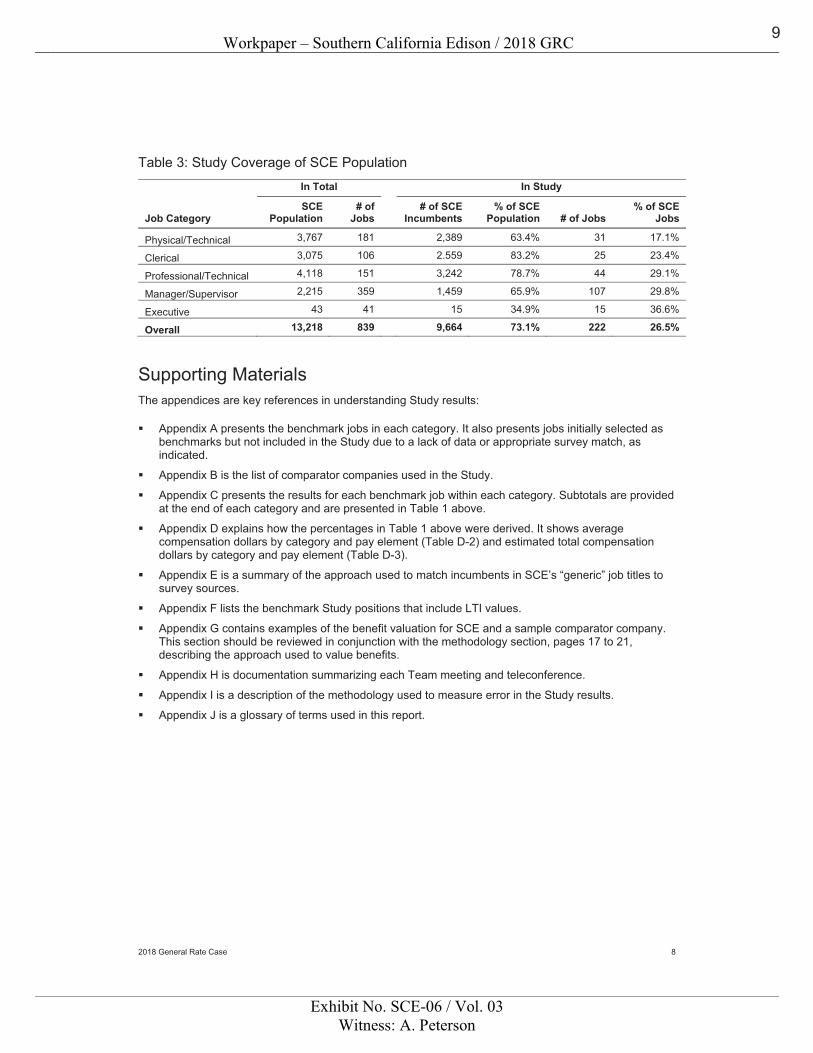
Table 3 below presents the amount of coverage the Study provides as a percentage of SCE population. It shows the number of total SCE employees and job titles in each employee category compared with the number of SCE jobs and incumbents that are Study benchmarks.
“Benchmark” jobs are those classification titles that are common across comparator organizations and are found in surveys of competitive data (generally these are “high population” jobs).
The process used to determine benchmark jobs is detailed in the next section. Table 3 shows that the Study covers 73.1 percent of the SCE workforce. Compared with similar studies Aon Hewitt has conducted, this is high coverage and, in Aon Hewitt’s opinion, a sound basis for determining the competitiveness of total compensation.
7 Estimated by Aon Hewitt.
8
Workpaper – Southern California Edison / 2018 GRC
Exhibit No. SCE-06 / Vol. 03Witness: A. Peterson
2018 General Rate Case 8
Table 3: Study Coverage of SCE Population
In Total In Study
Job Category SCE
Population # of
Jobs # of SCE
Incumbents % of SCE
Population # of Jobs % of SCE
Jobs
Physical/Technical 3,767 181 2,389 63.4% 31 17.1%
Clerical 3,075 106 2.559 83.2% 25 23.4%
Professional/Technical 4,118 151 3,242 78.7% 44 29.1%
Manager/Supervisor 2,215 359 1,459 65.9% 107 29.8%
Executive 43 41 15 34.9% 15 36.6%
Overall 13,218 839 9,664 73.1% 222 26.5%
Supporting Materials The appendices are key references in understanding Study results:
� Appendix A presents the benchmark jobs in each category. It also presents jobs initially selected as benchmarks but not included in the Study due to a lack of data or appropriate survey match, as indicated.
� Appendix B is the list of comparator companies used in the Study.
� Appendix C presents the results for each benchmark job within each category. Subtotals are provided at the end of each category and are presented in Table 1 above.
� Appendix D explains how the percentages in Table 1 above were derived. It shows average compensation dollars by category and pay element (Table D-2) and estimated total compensation dollars by category and pay element (Table D-3).
� Appendix E is a summary of the approach used to match incumbents in SCE’s “generic” job titles to survey sources.
� Appendix F lists the benchmark Study positions that include LTI values.
� Appendix G contains examples of the benefit valuation for SCE and a sample comparator company. This section should be reviewed in conjunction with the methodology section, pages 17 to 21, describing the approach used to value benefits.
� Appendix H is documentation summarizing each Team meeting and teleconference.
� Appendix I is a description of the methodology used to measure error in the Study results.
� Appendix J is a glossary of terms used in this report.
9
Workpaper – Southern California Edison / 2018 GRC
Exhibit No. SCE-06 / Vol. 03Witness: A. Peterson
2018 General Rate Case 9
Study Methodology
10
Workpaper – Southern California Edison / 2018 GRC
Exhibit No. SCE-06 / Vol. 03Witness: A. Peterson
2018 General Rate Case 10
Study Methodology
Overview The principles behind the 2018 Study methodology were held constant to the 2015 Study. They include:
� To collect and analyze data on a company-specific basis so that the levels of total compensation (for SCE and for each comparator company) were captured accurately; and
� To express both cash and benefit elements of compensation on an equivalent basis for SCE and comparator companies as of a common point in time.
Aon Hewitt obtained and valued pay and benefits information from comparator companies and SCE. Aon Hewitt then calculated SCE’s competitive posture versus the comparator companies.
Job Categories For the purpose of this Study, SCE and Aon Hewitt placed SCE jobs into one of five categories agreed upon by the Team (these five categories were used in the 2015 Study). The 2018 Study results include subtotals for each of these five categories:
One change to note from the 2015 Study is that nuclear jobs were excluded from the 2018 Study because total compensation for those jobs will be recovered as part of the decommissioning proceeding of the San Onofre Nuclear Generating Station (SONGS) rather than the GRC. � Physical/Technical. Usually, these are field jobs requiring physical activities that are repetitive in
nature. They are found more frequently in utility companies and are typically covered by a collective bargaining agreement (at SCE and at other comparator utilities). Physical jobs often have a formal apprenticeship program and typically do not require college study. Technical jobs are individual contributor jobs that may require some college study, but a college degree is not required. These jobs are subject to the Fair Labor Standards Act8 (“FLSA”) and are categorized as nonexempt.
� Clerical. These jobs are nonexempt under the FLSA, typically include work in an office environment, and require activities that are generally routine and clerical in nature. The exception is the Meter Reader, which works in the field. These jobs may require some college study, but a college degree is not required. These jobs may be organized, but most are not—neither at SCE nor at most other comparator companies.
� Professional/Technical. These jobs are individual contributor jobs that are typically exempt from the FLSA. Usually, these jobs require a college degree, and the nature of the work involves analytical thought and independent judgment.
� Manager/Supervisor. These jobs are exempt from the FLSA; these jobs are primarily responsible for the direction and final product of the work of others.
� Executive. This category contains the limited group of company top executives who are responsible for overall direction of the company.
8 The Fair Labor Standards Act (FLSA) of 1938 established overtime, record keeping, and a floor for minimum wage. It also determined the type of positions that are exempt from the overtime provisions. Federal law requires that “nonexempt” positions receive overtime pay for hours in excess of 40 worked in a week. Some states (e.g., California) require overtime pay for nonexempt positions for hours in excess of 8 worked in one day.
11
Workpaper – Southern California Edison / 2018 GRC
Exhibit No. SCE-06 / Vol. 03Witness: A. Peterson
2018 General Rate Case 11
Benchmark Job Selection and Job Matching In this Study, Aon Hewitt attempted to assess competitive posture for enough jobs so that the Team could be confident there was adequate coverage of each category.
The benchmark job selection process included a review by the Team of all benchmark jobs covered in the 2015 Study with consideration of the number of incumbents by job and coverage by job category. The Team agreed to use the 2015 benchmark jobs as a starting point in identifying benchmarks for the 2018 Study and add likely benchmarks with a high-incumbent count to increase the Study coverage.
Aon Hewitt then met in a series of three meetings with SCE staff familiar with SCE jobs to identify survey matches. During the matching process, Aon Hewitt and SCE performed the following activities:
� Aon Hewitt identified initial job matches based on a review of the 2015 Study benchmark jobs, SCE job descriptions, and compensation survey databases.
� Aon Hewitt confirmed matches with SCE staff, which in some cases included conducting additional discussions with individuals knowledgeable about a specific job and its actual job duties. Based on the discussions, Aon Hewitt adjusted some job matches.
� Aon Hewitt made these matches to surveys where it deemed job duties to be 80 percent comparable to the survey job (Aon Hewitt follows this 80 percent guideline as an industry standard).
Similar to the 2015 Study, the Team decided to include SCE’s broadly defined “generic” jobs.
SCE generic job titles are meant to be broad and cover similar activities in different functional areas/departments which are the same level of work. The following SCE generic job titles and levels were examined:
� Manager 1 and 2
� Supervisor 1, 2, 3, and 4
� Technical Specialist 1, 2, 3, and 4
� Information Technology Specialist 2, 3, 4, and 5
� Manager, Project/Product 1 and 2
� Manager, Program/Contract 1, 2, and 3
The Team discussed the nature of these jobs, which, while broadly defined, could be compared to a variety of survey benchmarks also performing a similar level of work at comparator organizations. The survey benchmarks would likely be found in several departments at Study comparator companies.
The Team agreed to include these jobs in the 2018 Study, using the approach described in Appendix E.
When Aon Hewitt completed the benchmarking process, the coverage of SCE incumbents ranged from 34.9 percent (Executive) to 83.2 percent (Clerical). Overall, there was 73.1 percent coverage of SCE employees by benchmark jobs. This provides a statistically significant level of employee coverage, sufficient for Aon Hewitt to be confident of the validity of Study results.
Appendix A shows the specific benchmark titles, by category, included in the 2018 Study with the number of SCE incumbents.
12
Workpaper – Southern California Edison / 2018 GRC
Exhibit No. SCE-06 / Vol. 03Witness: A. Peterson
2018 General Rate Case 12
Labor Market and Comparator Companies For base salary, TCC and LTI, the Team selected comparator companies or comparator groups found in existing survey databases. Generally, the comparators included other comparably sized U.S. based utilities for roles specific to the industry, general industry organizations for roles that are not utility-specific, or a blend of utility and general industry. For executives, the Team agreed to use the same comparator group used in the 2015 Study with the exception of Nestle USA, Sara Lee Corporation, Science Applications International Corporation, and Constellation Energy Group.
� Nestle USA was excluded because revenue increased from the last Study and exceeded the methodology guidelines of including companies with revenue of 0.5x to 2.0x SCE’s revenue or approximately $5 billion to $20 billion.
� Sara Lee Corporation and Science Applications International Corporation were excluded because revenue fell from the 2015 Study and has dropped below the revenue guidelines noted above.
� Constellation Energy Group was acquired by Exelon Company.
� Public Service Enterprise Group and Northrop Grumman Corporation were added to the executive comparators group list because their revenue fell within the revenue guidelines and because they are also included in the non-executive comparator group.
CPUC participated in the 2015 Study, providing benefits information for all employees and compensation information for executive level employees. The Team solicited their participation for inclusion in the 2018 Study. In response to the Team’s request, CPUC indicated they were unable to supply their benefits and executive data due to other work priorities and, as a result, are not part of the 2018 Study.
For each job category, it was determined to use the following labor markets:
� Physical/Technical, Clerical, Professional/Technical, and Manager/Supervisor – For utility-specific jobs (e.g., Lineman, Meter Reader, roles found in Operations, and roles found
in Transmission and Distribution): national energy utilities including those found in the western United States and California.
– For non-utility-specific jobs (e.g., roles found in Finance, Human Resources, and Information Technology): a national group of general industry companies or a blend of utility and general industry if the jobs are found broadly in both.
– The 2018 Study applies the same approach requested by ORA and used in the 2015 Study to utilize national general industry data and apply a geographic differential to adjust for higher cost of labor in Southern California. A geographic differential of 12% (effective December 31, 2015) was obtained from the Economic Research Institute (ERI) and is the same as the geographic differential reported by them and used in the 2015 Study. The 2015 Study also utilized geographic differential data from the Bureau of Labor Statistics (BLS); however, BLS has not published new geographic data since 2012, and therefore their data was not available for the 2018 Study.
� Executive – For utility-specific jobs (e.g. VP Energy Supply & Management, VP Power Production): national
energy utilities with revenues between $5 billion and $20 billion plus LADWP and SMUD.
– For non-utility-specific jobs (e.g., SVP Chief Financial Officer, VP Tax): national general industry employers with revenues between $5 billion to $20 billion.
– Selecting specific companies for use for executive jobs in the Study allowed Aon Hewitt to obtain total compensation amounts for each comparator by matching average cash compensation with average benefits for each Study job.
Because the survey databases used in the Study to cover base salary, bonus, TCC, and LTI do not also include benefits, the Team agreed to use the comparator group used in the 2015 Study to value benefits.
13
Workpaper – Southern California Edison / 2018 GRC
Exhibit No. SCE-06 / Vol. 03Witness: A. Peterson
2018 General Rate Case 13
This comparator group is made up of utilities and general industry companies, with a particular focus on including employers from Southern California. Aon Hewitt calculated benefits values for each Study company based on information contained in its database of benefit specifications. Aon Hewitt required both cash compensation and benefits data from comparators in order to determine a total compensation value. Therefore, participation in the Aon Hewitt Benefits database was required for Study inclusion. LADWP and SMUD agreed to participate in the database and so were included in determining benefits values.
The comparator companies are shown in Appendix B. The company revenue shown reflects 2015 information, which is the effective date of compensation data used for comparator companies and SCE.
Survey and Data Sources and Job Match Validation Benefits data for all Study companies were drawn from the Aon Hewitt Benefits database. Aon Hewitt obtained cash compensation data from the best available survey sources. These sources, shown by survey provider and the survey used were as follows:
� Aon Hewitt: Radford Total Compensation Survey (RADFORD).
� Aon Hewitt Executive Total Compensation Measurement™ (TCM™) Database.
� The Edward A. Powell Data Information Solutions Study (EAPDIS).
� Mercer: Salary Information Retrieval System (MHRC-SIRS).
� Towers Watson: Energy Services Survey: Executive, Middle Management & Professional Database
� Towers Watson: General Industry Survey: Executive, Middle Management & Professional Database
Because LADWP and SMUD did not participate in any of these survey databases, Aon Hewitt requested and received executive (LADWP and SMUD) and non-executive (LADWP) compensation data from company representatives directly.
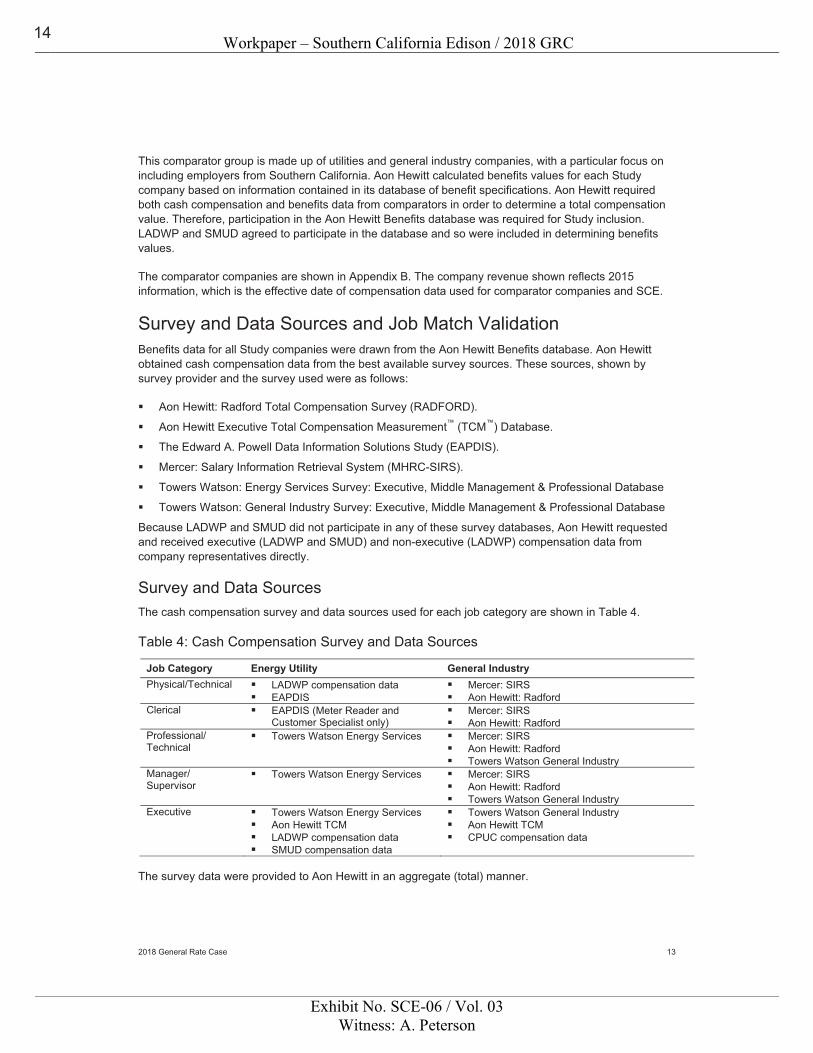
Survey and Data Sources The cash compensation survey and data sources used for each job category are shown in Table 4.
Table 4: Cash Compensation Survey and Data Sources
Job Category Energy Utility General Industry Physical/Technical � LADWP compensation data
� EAPDIS � Mercer: SIRS � Aon Hewitt: Radford
Clerical � EAPDIS (Meter Reader and Customer Specialist only)
� Mercer: SIRS � Aon Hewitt: Radford
Professional/ Technical
� Towers Watson Energy Services � Mercer: SIRS � Aon Hewitt: Radford � Towers Watson General Industry
Manager/ Supervisor
� Towers Watson Energy Services � Mercer: SIRS � Aon Hewitt: Radford � Towers Watson General Industry
Executive � Towers Watson Energy Services � Aon Hewitt TCM � LADWP compensation data � SMUD compensation data
� Towers Watson General Industry � Aon Hewitt TCM � CPUC compensation data
The survey data were provided to Aon Hewitt in an aggregate (total) manner.
14
Workpaper – Southern California Edison / 2018 GRC
Exhibit No. SCE-06 / Vol. 03Witness: A. Peterson
2018 General Rate Case 14
Once Aon Hewitt collected and analyzed compensation data, it noted the number of matches for each job:
� If the job had insufficient company matches within the selected comparator subgroup (e.g., utilities had less than five matching companies), the combined group (e.g., utilities plus general industry) was used if appropriate. This approach was applied to Clerical, Professional/Technical, Manager/Supervisor, and Executive positions.
� If both the comparator group and the combined group had fewer than five companies matching a job, then Aon Hewitt excluded the job from the Study.9
Job Match Validation In prior Studies, Aon Hewitt reviewed a list of benchmark jobs including incumbent counts with the Team. ORA selected approximately 30 jobs from this list for review in the job match validation process. Once ORA selected the list of jobs for validation, Aon Hewitt compiled the SCE job descriptions and survey source job descriptions for use in validating matches.
Because the ORA declined to participate in the 2018 Study, this process step could not be performed. However, the Team ensured that all benchmark jobs reviewed in the job validation process in the 2015 Study were included in the 2018 benchmarking review, with the exception of three nuclear jobs (9697: Officer Nuclear Security, SUP2: Nuclear, SUP4: Nuclear) which were excluded, as noted earlier, because total compensation for those jobs will be recovered as part of the decommissioning proceeding of the San Onofre Nuclear Generating Station (SONGS) rather than the GRC.
9 This threshold complies with the antitrust survey guidelines established by the U. S. Department of Justice and Federal Trade Commission regarding surveys of salaries, wages, and benefits (Statement 6A from the September 1994 “Statements of Antitrust Enforcement Policies”).
15
Workpaper – Southern California Edison / 2018 GRC
Exhibit No. SCE-06 / Vol. 03Witness: A. Peterson
2018 General Rate Case 15
Elements of Total Compensation
Elements of Compensation—Included The following elements of compensation were included in this Study:
Cash Compensation � Base pay
� Short-term (annual) incentives
� Total cash compensation (base pay plus short-term incentives)
Noncash Compensation
� Employee benefits10
– Defined benefit pension plans
– Defined contribution plans
• Deferred profit sharing
• Savings/thrift plans with company matches
• Savings/thrift plans without company matches
• Stock purchase plans
• Employee stock ownership plans
• 401(k) plans
– Death benefits
• Preretirement group life
• Postretirement group life
• Group survivor’s income
– Long-term disability
– Health care benefits
• Preretirement medical
• Postretirement medical
• Dental and vision coverage
– Paid Time Off
� Supplemental executive benefits (Executive category only)
– Medical/dental
– Nonqualified retirement plans
• Defined benefit restoration plans
• Supplemental executive retirement plans
• Defined contribution restoration plans
– Long-term disability 10 Note that not all benefits listed are provided by SCE or by each comparator company.
16
Workpaper – Southern California Edison / 2018 GRC
Exhibit No. SCE-06 / Vol. 03Witness: A. Peterson
2018 General Rate Case 16
– Nonqualified deferred compensation plans
– Executive death benefits
� Long-term incentives
– Stock options and stock appreciation rights
– Deferred stock units
– Performance shares/units
– Restricted stock
– Phantom stock
Elements of Compensation—Excluded As in past Studies, pay elements other than base salary, annual incentives, long-term incentives, and benefits were excluded.
Shift differentials, spot awards, and overtime pay were excluded because this data is not available in surveys on a position-by-position basis, and wide variances exist in their utilization among comparators and SCE. None of these elements of compensation were included in total compensation amounts reported to survey databases used in this Study.
Also, Short-Term Disability was excluded from the Study. This benefit is usually paid by the employer as a salary continuation during the disability period and, therefore, is assumed to be part of an employee’s pay.
17
Workpaper – Southern California Edison / 2018 GRC
Exhibit No. SCE-06 / Vol. 03Witness: A. Peterson
2018 General Rate Case 17
Valuation of Total Compensation Elements
Base Pay Average base pay data were obtained from SCE and comparators for incumbents in each benchmark job. Hourly pay data were annualized as needed by multiplying by 2,080 hours.
Consistent with the 2015 Study in which ORA requested that SCE use the CPUC-approved labor escalation factor for purposes of adjusting the market data, this factor (2.68% for the 2018 GRC) was utilized in the 2018 Study. Both Aon Hewitt and SCE disagree with use of the labor escalation factor as it is not a relevant measure of the rate of change of pay in the general industry and utility industry. However, the Team agreed to utilize the CPUC labor escalation factor in order to maintain consistency in the methodology used in the 2015 Study.
To illustrate the application of the adjustment factor, general industry survey data that needed to be adjusted by 3 months was increased by 3/12 of the annual rate of 2.68%, or 0.67 percent.
SCE base salary information was effective December 31, 2015, so it was not adjusted.
Short-Term (Annual) Incentives (Bonus) Average annual cash incentive payments were collected, by position, from each survey source for comparators and for SCE. Similar to base pay, survey amounts were adjusted by the aging factor to December 31, 2015. SCE amounts, which were paid in March 2015, were also adjusted to the same date.
SCE and survey company incentives were actual amounts paid (not planned or “target” amounts) in 2015 (for 2014 performance) and may include cash profit sharing, gainsharing awards, or other lump-sum payments from ongoing incentive plans requested by each survey. As noted earlier, spot award payments were excluded.
For SCE, these amounts included the employee Short Term Incentive Plan and Executive Incentive Compensation Plan awards. This Study did not examine the operation of these programs; rather, it examined the magnitude of awards provided by SCE to its employees as reported to Aon Hewitt.
Total Cash Compensation Base pay and short-term incentives, as reported by the comparators and SCE, were totaled for incumbents in each Study position to obtain total cash compensation.
Employee Benefits Benefit values have been computed by Aon Hewitt’s application of its Benefit Index® methodology. All values are net of employee contributions. Aon Hewitt uses this proprietary methodology to value each type of employee benefit. (Note that the specific formulae used cannot be shared with third parties, due to potential loss of Aon Hewitt’s competitive advantage.)
In the 2015 Study, at the request of the ORA and with agreement from SCE, the Team developed benefit values using SCE’s demographic models and assumptions because this approach would best reflect SCE’s benefits values. This methodology change was retained and applied in the 2018 Study. SCE’s actual demographic profile is based on employee and retiree data, including age, gender, years of service, rate of opt-out from health care coverage, etc., as well as economic and other assumptions used
18
Workpaper – Southern California Edison / 2018 GRC
Exhibit No. SCE-06 / Vol. 03Witness: A. Peterson
2018 General Rate Case 18
in valuing SCE’s Retirement Plan and Post-retirement Benefits Other than Pensions (PBOPs) such as projected salary increases, average retirement age, and rates of disability. Aon Hewitt applied SCE’s demographic profile and assumptions to both SCE’s and the comparator companies’ benefit designs to isolate as best as possible the impact on benefit values resulting from differences in plan design.
For each job that was included in the Study (for all companies, including SCE), the average total cash compensation level of the incumbents in that position was used as the basis for benefit valuation.
Aon Hewitt obtained a detailed description of each comparator company’s benefit program in effect, which it used to value benefits.
Benefits may differ by employee group. For Study purposes, Aon Hewitt used the primary salaried employee benefit plans. There were no material differences in benefits between employee groups for SCE but there were differences in benefits between employee groups for approximately 20 percent of the Study companies. In most of these cases, this difference was limited to the health care contribution for represented employees, who are primarily found in the Physical/Technical category. For simplicity and cost-effectiveness, the Team asked Aon Hewitt to use salaried benefits for all Study jobs. This introduces a small amount of error in the Study. Aon Hewitt estimates this decision overstates the competitors’ total compensation value by less than 0.1 percent of total compensation for most Study positions.
The assumptions used to value benefits using the SCE demographic profiles and assumptions are reflected in annual SCE Retirement Plan and postretirement benefit actuarial valuations, and represent the signing actuaries’ best estimates of the future plan experience, taking into consideration past experience and reasonable future expectations. These actuarial valuations are used to determine pension and postretirement benefit expense under Accounting Standards Codification (ASC) Topic 715. Demographic actuarial assumptions, including rates of retirement and employment termination, postretirement health benefit claims and trend assumptions, are reviewed periodically based on actual plan experience and insurance premiums, as well as plan design features and national trends. All actuarial assumptions are reviewed each year for general consistency with emerging plan experience.
In general, the value of each benefit provided by SCE or a comparator company was determined in one of two ways:
� Not every benefit is received by every employee in every year. Thus, for each individual in the standard population, the probability of an event, such as disability, is multiplied by the lump-sum value of all amounts to be paid arising from that event. This approach is used for all benefits for which value may be received in the current year; or
� Certain benefits are commitments to provide a payment after active employment has ended. These are valued by establishing the benefit as a percentage of pay for the current year. This approach is used to calculate a discounted present value for a future promise.
These values are determined as (1) a percentage of cash compensation (for pay-related benefits such as pensions) or (2) flat-dollar amounts (for programs such as medical coverage). Where compensation data are necessary to determine the value for a particular benefit at a given company, the appropriate actual cash compensation level is used.
Benefit values were calculated using each company’s plan features in place for calendar-year 2015.
Specific comments on valuation methodology for benefit elements are provided below, and examples are provided in Appendix G:
19
Workpaper – Southern California Edison / 2018 GRC
Exhibit No. SCE-06 / Vol. 03Witness: A. Peterson
2018 General Rate Case 19
� Defined Benefit Pension: Values for each position in the Study were determined by performing a standard pension valuation of qualified and, if applicable, nonqualified plans on the population. (Qualified plans are those that comply with Internal Revenue Code requirements of funding, vesting, and broad employee participation. Employers make tax-deductible contributions to trusts to provide for the future benefits to their employees. Nonqualified plans are generally provided for select management and highly compensated employees and are not subject to the same funding, vesting, and participation requirements as qualified plans. Employers generally pay such benefits as they come due.) The most important factors considered include the benefit formula, definition of covered pay, early retirement subsidies, subsidized payment forms, and the existence of benefit restoration plans.
Ultimately, pension values represent a consistent annual employer contribution that would be required to provide the promised benefit at retirement.
� Capital Accumulation and Defined Contribution: Profit sharing, 401(k), matched savings, broad-based stock purchase, and employee stock ownership plans were included in this area. Employer contributions were adjusted only for eligibility and the possibility of forfeiture.
� Group Life: The value of this benefit for each incumbent was determined as the amount of the benefit times the probability of that person dying in the next year, minus any employee contributions. The benefits included were noncontributory and contributory qualified plans, supplemental programs, accidental death and dismemberment coverage, and continuation of benefits on disability.
� Survivor Income Annuity Benefits: These programs were valued the same way as group life benefits, except that the benefit amount is converted to the lump-sum value of the annuity stream of payments that would be paid. Benefits paid from a pension upon death of an active employee were included, as were annuities not paid from the pension plan.
� Postretirement Death Benefits: Values for postretirement death benefits were determined through a pension valuation approach, except that the benefit being funded was not an annuity payable while the retiree is alive, but a lump sum payable at death. Annuities paid from a pension to the beneficiary upon the retiree’s death were included in the pension value rather than the postretirement death value.
� Long-Term Disability: This benefit captures the value to the employee of coverage for disability that is longer than six months. The value of the benefit to each incumbent equals the probability of disability times the annuity value of the benefits received, minus employee contributions (if any). Both qualified and nonqualified plans were included. In addition, pension benefits paid to disabled employees prior to normal retirement were included in this category of benefits.
� Health Care: The value of the preretirement medical, dental, hearing, and vision plans was based on expected claims determined using a rate-making manual, taking into account the utilization associated with each employee group, adjusted for the net effect of persons waiving coverage.
Health care claims values are based on SCE’s actual costs. Plan values for each study company are aggregated using the plan enrollment distribution for that company. The study aggregates all various plans of the same delivery model type and allows Aon Hewitt to quantify each delivery model’s purchasing efficiency. Definitions of the various delivery models are illustrated below in order of purchasing efficiency to the employer.
– Health Maintenance Organization (HMO): A “prepaid” medical group plan consisting of a defined panel of physicians and facilities. Patients must follow the HMO’s protocols in order to obtain coverage (the primary care physician must approve all care and provides referrals to specialists when necessary). Generally, no benefits are paid for care obtained outside the designated provider panel.
– Exclusive Provider Option (EPO): A medical group plan that mirrors the HMO concept, but is self-funded by an employer. Claims are paid as they are incurred; medical care is not “prepaid.”
20
Workpaper – Southern California Edison / 2018 GRC
Exhibit No. SCE-06 / Vol. 03Witness: A. Peterson
2018 General Rate Case 20
– Point-of-Service (POS): A medical group plan with two levels of benefits: in-network and out-of-network. Typically, in-network benefits mirror HMO benefits (patients must follow HMO-like protocols). Out-of-network benefits are available, but are less comprehensive and typically are subject to higher deductibles and lower coverage levels.
– Preferred Provider Option (PPO): A medical group plan with two levels of benefits similar to a POS plan. The key difference is that the in-network benefits are not subject to HMO-like protocols. Patients can access specialists directly, referrals are not required, and medical utilization reviews are less stringent than in HMOs.
– Indemnity: A medical group plan without any provider networks or stringent utilization controls.
A purchasing efficiency adjustment was applied to each comparator company based on the medical plan enrollment distribution for that company. Employee contributions, if any, were subtracted from total values to determine the employer paid value.
� Retiree Medical: Postretirement medical benefit values were calculated in a manner similar to pensions and postretirement death benefits. In 2003, SCE announced retiree health care changes that would affect all of its employees. Equivalent changes were negotiated with the Unions representing employees in 2004 and 2005. Some employees were “grandfathered” under the prior plan; the remaining employees will receive a different level of retiree medical benefits. The grandfathered percentage of SCE employees is small and not considered in this Study. Aon Hewitt determined that employees in benchmark jobs have approximately the same age and service as employees in non-benchmark jobs. Therefore, retiree medical values for SCE benchmarks are representative of the entire workforce.
� Flexible Credits: Each company’s program is structured differently. Most often, however, flexible credits are granted by benefit type. For example, a company may give $3,000 toward the purchase of medical coverage, $500 toward the cost of dental coverage, enough flexible credits to purchase a 50 percent LTD plan, and enough credits to purchase two-times-pay life insurance. Credits were allocated back to the benefit types for which they were intended and were treated as offsets to employee contributions. Thus, using the flexible credits in the example above, if the overall medical price tag was $4,000, the $3,000 of flexible credits effectively reduced the employee contribution to $1,000. If the credits for a given benefit area exceeded the price tag for that benefit, the extra credits that result were allocated to other areas where such credits were not sufficient to pay the entire cost. If the flexible credits in total were more than sufficient to purchase all eligible benefits, the excess credits were allocated to health care spending accounts, defined contribution accounts, or cash, depending on the terms of the program.
� Paid Time Off ORA requested that PTO be valued and reported separately from other benefits for the 2015 Study. In prior Studies, the value of PTO was assumed to be covered in base pay since the value to the employee is reflected in the base pay they earn while on PTO. ORA argued that unused PTO has additional value since the employee can receive payment for unused days upon termination or retirement. This same approach is used in the 2018 Study.
The Team agreed to develop a value for PTO in two parts (based on SCE’s utilization as applied to each company’s schedule of PTO days).
– Part 1: Days used during the year: The lesser of the number of PTO days provided by each company and the number of PTO days used by SCE employees were valued using Aon Hewitt’s current PTO methodology and included implicitly in salary.
21
Workpaper – Southern California Edison / 2018 GRC
Exhibit No. SCE-06 / Vol. 03Witness: A. Peterson
2018 General Rate Case 21
This is a consistent treatment for all PTO days up to the utilization assumption. Any PTO days provided above the utilization assumption would be included in Part 2.
– Part 2: Days in excess of used days during the year: Because days provided in excess of those used during the year are eligible for cash out when the employee leaves the company, these days were valued similar to a pension benefit as a lump sum at projected termination/retirement. PTO value is based on final salary and the number of unpaid days. This is consistent treatment for all PTO days above the utilization assumption. The value is added to the total benefit value.
22
Workpaper – Southern California Edison / 2018 GRC
Exhibit No. SCE-06 / Vol. 03Witness: A. Peterson
2018 General Rate Case 22
Data Aggregation and Average Benefit Calculation As noted earlier in this report, data from survey providers was provided in aggregated form. This means that Aon Hewitt did not have access to the base salaries and short-term incentives paid by each company. Instead, Aon Hewitt had only the total number of incumbents, average base salary, bonus, and total cash compensation (in aggregate) for each survey job.
Based on this information, Aon Hewitt used the following process to calculate benefit values for each survey benchmark:
� For each job, Aon Hewitt used incumbent-weighted average (aggregated) base salary and bonus data.
� Benefits for each comparator company and SCE were valued for each job category.
� These values were averaged for utility, general industry, and the combined groups.
� These averages were applied to appropriate total cash levels in each job category.
� Aon Hewitt summed the average base salary, bonus, long-term incentives (where eligible), benefit and PTO values to determine an average total compensation figure for the job.
In past studies, Aon Hewitt conducted test analyses using data provided in both aggregated and non-aggregated form to determine the significance of the differences between averaging benefits across each Study group and calculating benefits values separately for each company.
In the past analyses, Aon Hewitt found the difference between the approaches was minor, and that the variance was sometimes positive and sometimes negative. Thus, over the group of survey benchmarks, variances offset each other, and the overall differences were negligible.
Aon Hewitt believes that while error is possible, it would not affect Study results by more than +/- 0.1 percent of total compensation.
Long-Term Incentives LTI compensation programs include such plans as:
� Stock options;
� Deferred stock units/performance units;
� Stock appreciation rights;
� Restricted stock; and
� Phantom stock.
In determining which benchmark jobs were eligible for LTI awards and, therefore, should include LTI values in the 2018 Study, the Team examined eligibility data that reported the percentage of comparator companies that granted LTI for each benchmark job. Similar to the 2015 Study, the Team agreed to include LTI values for jobs that were eligible for LTI at 50% or more of the comparator companies. A total of 72 benchmark jobs met this criteria including: 2 Professional/Technical positions, 55 Manager/Supervisor positions, and 15 Executive positions.
The Black-Scholes methodology was used to value LTI for the market and for SCE. The general principle behind the valuation method is to arrive at a figure that corresponds as closely as possible to the intrinsic (economic) value of the long-term incentive award on the date of grant.
23
Workpaper – Southern California Edison / 2018 GRC
Exhibit No. SCE-06 / Vol. 03Witness: A. Peterson
2018 General Rate Case 23
� Stock Options: To recognize the potential value inherent in stock option grants, Aon Hewitt used the Black-Scholes option pricing approach, adjusted for a variety of elements unique to employee stock options. This model does not assume a particular growth in stock price, but rather values the right to buy stock at a fixed price for a certain period of time. The model takes into account several factors in assigning a value to the option. These factors include the following:
– Option price;
– Fair market value on the date of grant;
– Length of exercise period;
– Vesting restrictions on the exercise of options;
– Stock price volatility;
– Projected dividend stream;
– Reasonable discount factor; and
– Recipient turnover.
The character of a stock is largely defined by its dividend yield and price volatility. The pricing model recognizes these characteristics in the valuation of stock options. Simply expressed, an option on a stable security (high dividend yield, relatively little fluctuation in price) is worth less, as a percent of stock price, than an option on an active, growth-oriented stock, which may not pay dividends. An option holder benefits from a stock in which the majority of the investment returns lies in appreciation; the holder of most stock options derives no benefit from dividends on the stock until after exercise of the option occurs.
The design of a stock option plan can have a material impact on an option’s value. An option with a ten-year term, for instance, is worth more than a five-year option, primarily because the recipient has a longer time period over which to benefit from relative stock price volatility.
Other plan design features incorporated into the valuation include dividend equivalents (payment of dividends as if the recipient held the stock), extension of the exercise period beyond termination of employment, and the frequency of grants.
Among Study comparators, Aon Hewitt has found that utility companies are more likely to pay dividends and their stock price tends to be less volatile than general industry companies. Therefore, the per stock option value (assuming the same exercise price and other design features) we ascribe for a utility company would typically be lower (historically 20-25% of stock price at grant) than we ascribe to a stock option of a general industry company (historically 30-40% of stock price at grant).
� Deferred Stock Units/Performance Units: The data obtained from each company in the Study includes: actual grant size (in number of shares or units) for each position, target (expected) and maximum award opportunities, performance requirements necessary to earn target and maximum awards, and the related performance measurement period for each grant. The starting point for deferred stock/performance unit valuations generally equals the market price of the company’s stock on the date of award, reduced for the probability of goal attainment. In cases where a performance share plan does not provide for the payment or accrual of dividends, the value is reduced further. The calculated unit or share value then is multiplied by grant size to determine the final grant value. Both deferred stock units, performance shares and units are valued to reflect:
– Volatility of performance;
24
Workpaper – Southern California Edison / 2018 GRC
Exhibit No. SCE-06 / Vol. 03Witness: A. Peterson
2018 General Rate Case 24
– Maximum award levels;
– Length of performance period; and
– Recipient turnover.
If a deferred stock unit/performance share has the same design characteristics, Aon Hewitt’s calculated value will be similar across industries.
� Stock Appreciation Rights: Similar to stock options, stock appreciation rights (SARs) allow the recipient to obtain the gain from stock price appreciation, but require no recipient payment. Generally, SARs are valued in the same manner as stock options.
� Restricted Stock: The total value of each restricted stock grant is obtained by multiplying the number of shares granted by the value of the stock on the date of grant. This value is then reduced by an amount equal to the assumed turnover for the period of restriction. In cases where the plan does not provide for the payment or accrual of dividends on restricted shares, or where the recipient has to make cash payment for such shares, the value is reduced further. If a restricted share has the same design characteristics, Aon Hewitt’s calculated value will be similar across industries.
� Phantom Stock: Phantom stock programs are valued in one of two ways. If the recipient obtains the full value of the phantom share or unit, then the valuation methodology is similar to that used for restricted stock. Alternatively, if the phantom stock award is based solely on the appreciation in the stock price, then the methodology is similar to that used for stock appreciation rights.
Project Workpapers Project workpapers are submitted along with SCE’s GRC filing. The project workpapers provide additional clarity regarding the Study process. The workpapers, combined with this Study report, provide a clear picture of how the Study was conducted, the decisions made by the Team, and the calculated results. The workpapers include:
� A list of all SCE jobs (by job category) used to select Study benchmark jobs.
� A list of survey job matches for each Study benchmark, which includes SCE department identifiers used to match manager and supervisor jobs to surveys (as described in Appendix E).
25
Workpaper – Southern California Edison / 2018 GRC
Exhibit No. SCE-06 / Vol. 03Witness: A. Peterson
2018 General Rate Case 25
Appendix A: Benchmark Jobs
26
Workpaper – Southern California Edison / 2018 GRC
Exhibit No. SCE-06 / Vol. 03Witness: A. Peterson
2018 General Rate Case 26
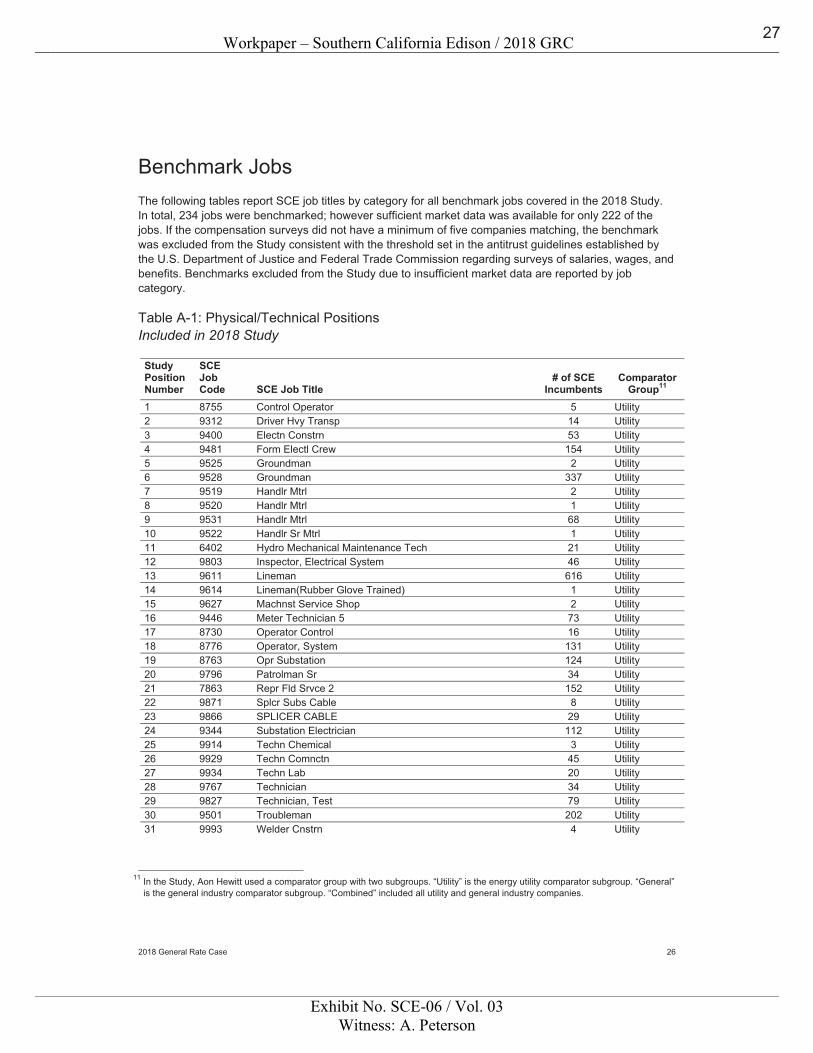
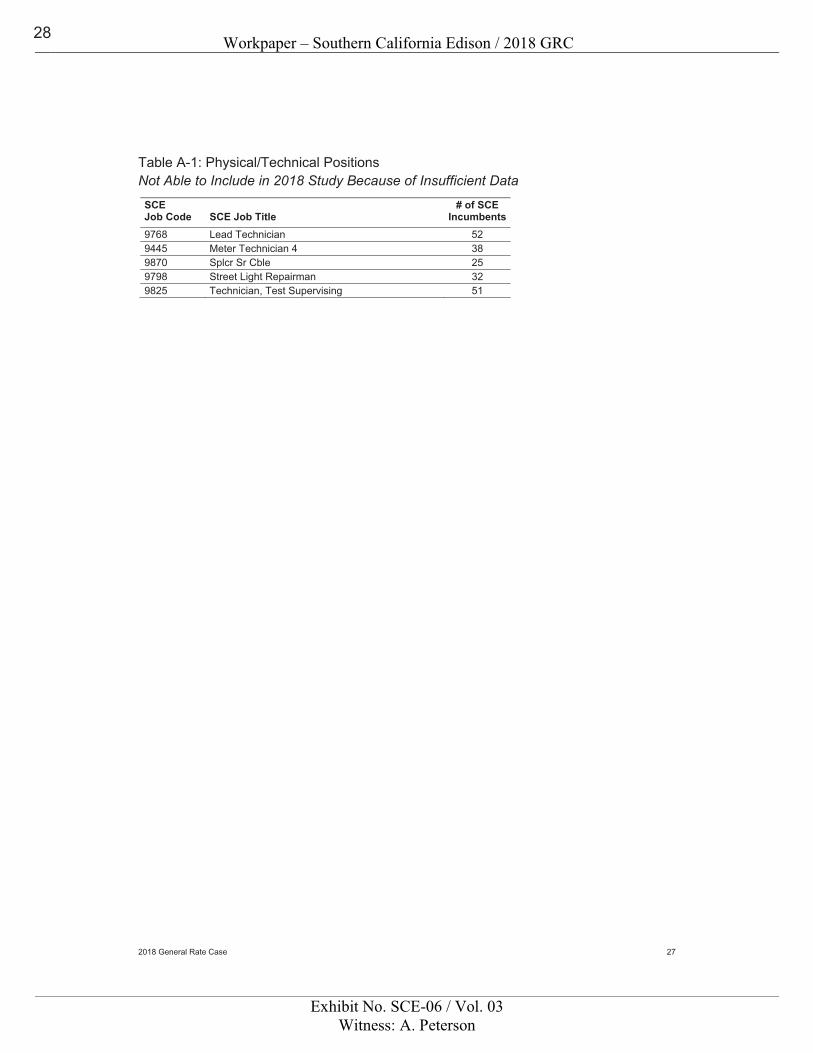
Benchmark Jobs The following tables report SCE job titles by category for all benchmark jobs covered in the 2018 Study. In total, 234 jobs were benchmarked; however sufficient market data was available for only 222 of the jobs. If the compensation surveys did not have a minimum of five companies matching, the benchmark was excluded from the Study consistent with the threshold set in the antitrust guidelines established by the U.S. Department of Justice and Federal Trade Commission regarding surveys of salaries, wages, and benefits. Benchmarks excluded from the Study due to insufficient market data are reported by job category.
Table A-1: Physical/Technical Positions Included in 2018 Study
Study Position Number
SCE Job Code SCE Job Title
# of SCE Incumbents
Comparator Group11
1 8755 Control Operator 5 Utility 2 9312 Driver Hvy Transp 14 Utility 3 9400 Electn Constrn 53 Utility 4 9481 Form Electl Crew 154 Utility 5 9525 Groundman 2 Utility 6 9528 Groundman 337 Utility 7 9519 Handlr Mtrl 2 Utility 8 9520 Handlr Mtrl 1 Utility 9 9531 Handlr Mtrl 68 Utility 10 9522 Handlr Sr Mtrl 1 Utility 11 6402 Hydro Mechanical Maintenance Tech 21 Utility 12 9803 Inspector, Electrical System 46 Utility 13 9611 Lineman 616 Utility 14 9614 Lineman(Rubber Glove Trained) 1 Utility 15 9627 Machnst Service Shop 2 Utility 16 9446 Meter Technician 5 73 Utility 17 8730 Operator Control 16 Utility 18 8776 Operator, System 131 Utility 19 8763 Opr Substation 124 Utility 20 9796 Patrolman Sr 34 Utility 21 7863 Repr Fld Srvce 2 152 Utility 22 9871 Splcr Subs Cable 8 Utility 23 9866 SPLICER CABLE 29 Utility 24 9344 Substation Electrician 112 Utility 25 9914 Techn Chemical 3 Utility 26 9929 Techn Comnctn 45 Utility 27 9934 Techn Lab 20 Utility 28 9767 Technician 34 Utility 29 9827 Technician, Test 79 Utility 30 9501 Troubleman 202 Utility 31 9993 Welder Cnstrn 4 Utility
11 In the Study, Aon Hewitt used a comparator group with two subgroups. “Utility” is the energy utility comparator subgroup. “General”
is the general industry comparator subgroup. “Combined” included all utility and general industry companies.
27
Workpaper – Southern California Edison / 2018 GRC
Exhibit No. SCE-06 / Vol. 03Witness: A. Peterson
2018 General Rate Case 27
Table A-1: Physical/Technical Positions Not Able to Include in 2018 Study Because of Insufficient Data
SCE Job Code SCE Job Title
# of SCE Incumbents
9768 Lead Technician 52 9445 Meter Technician 4 38 9870 Splcr Sr Cble 25 9798 Street Light Repairman 32 9825 Technician, Test Supervising 51
28
Workpaper – Southern California Edison / 2018 GRC
Exhibit No. SCE-06 / Vol. 03Witness: A. Peterson
2018 General Rate Case 28
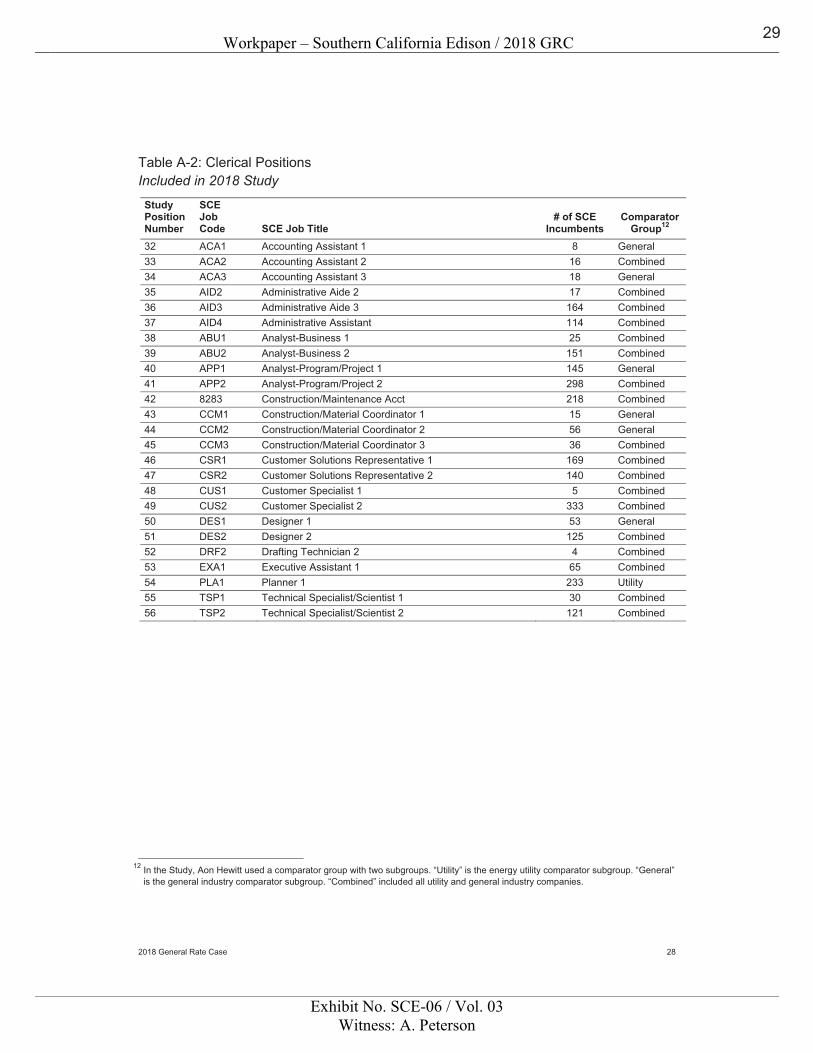
Table A-2: Clerical Positions Included in 2018 Study
Study Position Number
SCE Job Code SCE Job Title
# of SCE Incumbents
Comparator Group12
32 ACA1 Accounting Assistant 1 8 General 33 ACA2 Accounting Assistant 2 16 Combined 34 ACA3 Accounting Assistant 3 18 General 35 AID2 Administrative Aide 2 17 Combined 36 AID3 Administrative Aide 3 164 Combined 37 AID4 Administrative Assistant 114 Combined 38 ABU1 Analyst-Business 1 25 Combined 39 ABU2 Analyst-Business 2 151 Combined 40 APP1 Analyst-Program/Project 1 145 General 41 APP2 Analyst-Program/Project 2 298 Combined 42 8283 Construction/Maintenance Acct 218 Combined 43 CCM1 Construction/Material Coordinator 1 15 General 44 CCM2 Construction/Material Coordinator 2 56 General 45 CCM3 Construction/Material Coordinator 3 36 Combined 46 CSR1 Customer Solutions Representative 1 169 Combined 47 CSR2 Customer Solutions Representative 2 140 Combined 48 CUS1 Customer Specialist 1 5 Combined 49 CUS2 Customer Specialist 2 333 Combined 50 DES1 Designer 1 53 General 51 DES2 Designer 2 125 Combined 52 DRF2 Drafting Technician 2 4 Combined 53 EXA1 Executive Assistant 1 65 Combined 54 PLA1 Planner 1 233 Utility 55 TSP1 Technical Specialist/Scientist 1 30 Combined 56 TSP2 Technical Specialist/Scientist 2 121 Combined
12 In the Study, Aon Hewitt used a comparator group with two subgroups. “Utility” is the energy utility comparator subgroup. “General”
is the general industry comparator subgroup. “Combined” included all utility and general industry companies.
29
Workpaper – Southern California Edison / 2018 GRC
Exhibit No. SCE-06 / Vol. 03Witness: A. Peterson
2018 General Rate Case 29
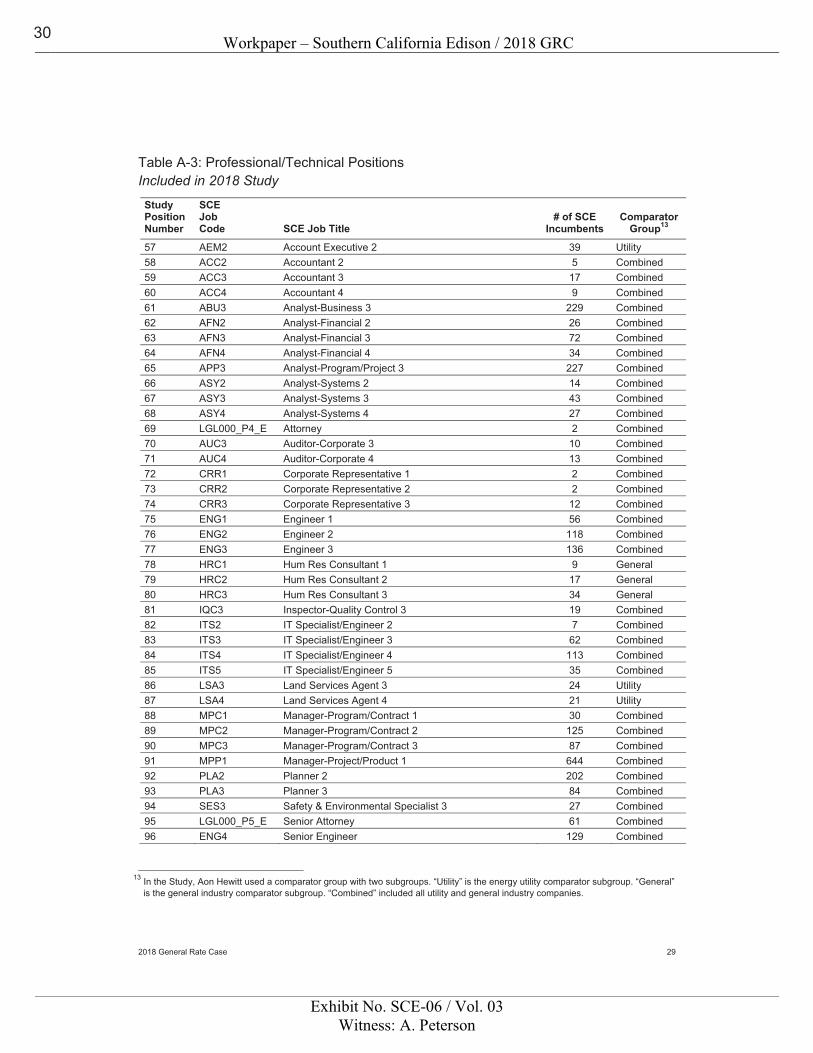
Table A-3: Professional/Technical Positions Included in 2018 Study
Study Position Number
SCE Job Code SCE Job Title
# of SCE Incumbents
Comparator Group13
57 AEM2 Account Executive 2 39 Utility 58 ACC2 Accountant 2 5 Combined 59 ACC3 Accountant 3 17 Combined 60 ACC4 Accountant 4 9 Combined 61 ABU3 Analyst-Business 3 229 Combined 62 AFN2 Analyst-Financial 2 26 Combined 63 AFN3 Analyst-Financial 3 72 Combined 64 AFN4 Analyst-Financial 4 34 Combined 65 APP3 Analyst-Program/Project 3 227 Combined 66 ASY2 Analyst-Systems 2 14 Combined 67 ASY3 Analyst-Systems 3 43 Combined 68 ASY4 Analyst-Systems 4 27 Combined 69 LGL000_P4_E Attorney 2 Combined 70 AUC3 Auditor-Corporate 3 10 Combined 71 AUC4 Auditor-Corporate 4 13 Combined 72 CRR1 Corporate Representative 1 2 Combined 73 CRR2 Corporate Representative 2 2 Combined 74 CRR3 Corporate Representative 3 12 Combined 75 ENG1 Engineer 1 56 Combined 76 ENG2 Engineer 2 118 Combined 77 ENG3 Engineer 3 136 Combined 78 HRC1 Hum Res Consultant 1 9 General 79 HRC2 Hum Res Consultant 2 17 General 80 HRC3 Hum Res Consultant 3 34 General 81 IQC3 Inspector-Quality Control 3 19 Combined 82 ITS2 IT Specialist/Engineer 2 7 Combined 83 ITS3 IT Specialist/Engineer 3 62 Combined 84 ITS4 IT Specialist/Engineer 4 113 Combined 85 ITS5 IT Specialist/Engineer 5 35 Combined 86 LSA3 Land Services Agent 3 24 Utility 87 LSA4 Land Services Agent 4 21 Utility 88 MPC1 Manager-Program/Contract 1 30 Combined 89 MPC2 Manager-Program/Contract 2 125 Combined 90 MPC3 Manager-Program/Contract 3 87 Combined 91 MPP1 Manager-Project/Product 1 644 Combined 92 PLA2 Planner 2 202 Combined 93 PLA3 Planner 3 84 Combined 94 SES3 Safety & Environmental Specialist 3 27 Combined 95 LGL000_P5_E Senior Attorney 61 Combined 96 ENG4 Senior Engineer 129 Combined
13 In the Study, Aon Hewitt used a comparator group with two subgroups. “Utility” is the energy utility comparator subgroup. “General”
is the general industry comparator subgroup. “Combined” included all utility and general industry companies.
30
Workpaper – Southern California Edison / 2018 GRC
Exhibit No. SCE-06 / Vol. 03Witness: A. Peterson
2018 General Rate Case 30
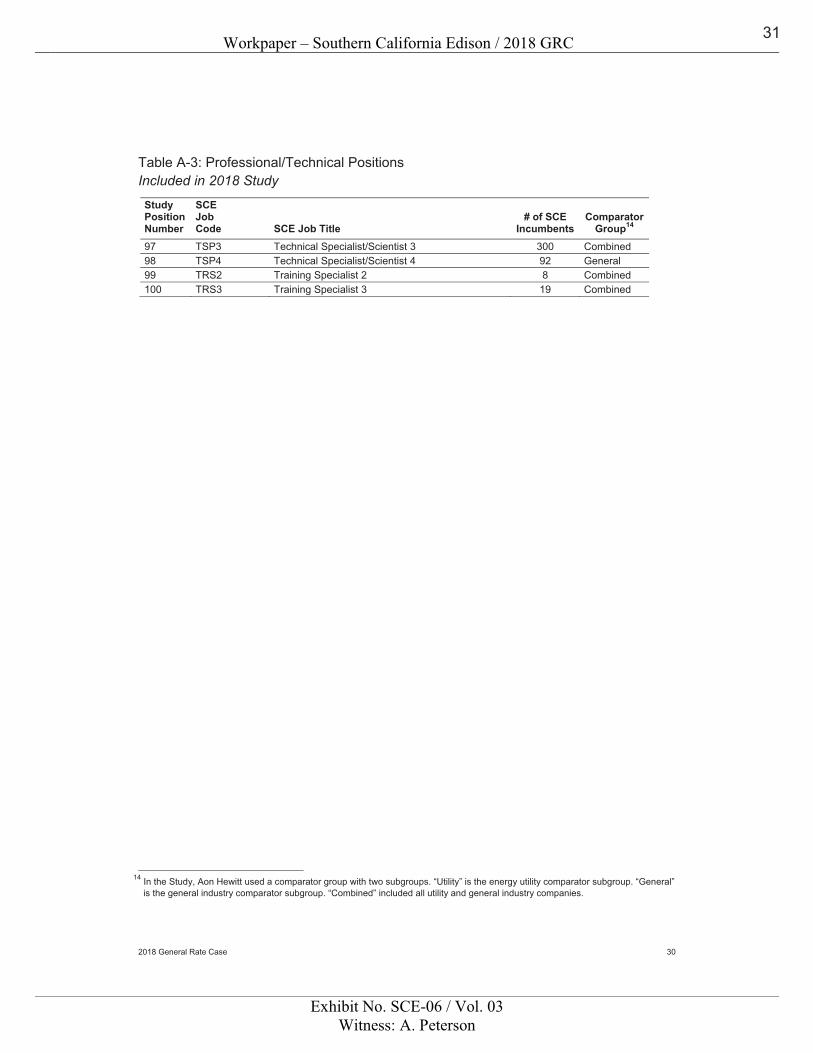
Table A-3: Professional/Technical Positions Included in 2018 Study
Study Position Number
SCE Job Code SCE Job Title
# of SCE Incumbents
Comparator Group14
97 TSP3 Technical Specialist/Scientist 3 300 Combined 98 TSP4 Technical Specialist/Scientist 4 92 General 99 TRS2 Training Specialist 2 8 Combined 100 TRS3 Training Specialist 3 19 Combined
14 In the Study, Aon Hewitt used a comparator group with two subgroups. “Utility” is the energy utility comparator subgroup. “General”
is the general industry comparator subgroup. “Combined” included all utility and general industry companies.
31
Workpaper – Southern California Edison / 2018 GRC
Exhibit No. SCE-06 / Vol. 03Witness: A. Peterson
2018 General Rate Case 31
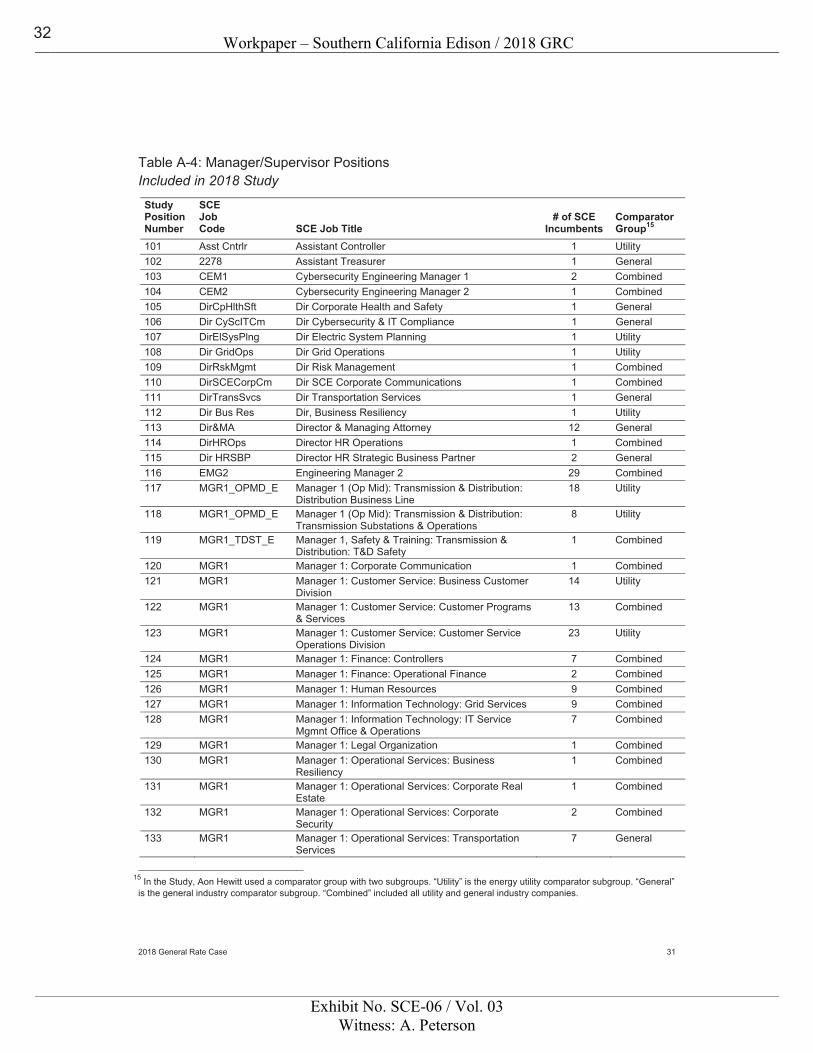
Table A-4: Manager/Supervisor Positions Included in 2018 Study
Study Position Number
SCE Job Code SCE Job Title
# of SCE Incumbents
Comparator Group15
101 Asst Cntrlr Assistant Controller 1 Utility 102 2278 Assistant Treasurer 1 General 103 CEM1 Cybersecurity Engineering Manager 1 2 Combined 104 CEM2 Cybersecurity Engineering Manager 2 1 Combined 105 DirCpHlthSft Dir Corporate Health and Safety 1 General 106 Dir CyScITCm Dir Cybersecurity & IT Compliance 1 General 107 DirElSysPlng Dir Electric System Planning 1 Utility 108 Dir GridOps Dir Grid Operations 1 Utility 109 DirRskMgmt Dir Risk Management 1 Combined 110 DirSCECorpCm Dir SCE Corporate Communications 1 Combined 111 DirTransSvcs Dir Transportation Services 1 General 112 Dir Bus Res Dir, Business Resiliency 1 Utility 113 Dir&MA Director & Managing Attorney 12 General 114 DirHROps Director HR Operations 1 Combined 115 Dir HRSBP Director HR Strategic Business Partner 2 General 116 EMG2 Engineering Manager 2 29 Combined 117 MGR1_OPMD_E Manager 1 (Op Mid): Transmission & Distribution:
Distribution Business Line 18 Utility
118 MGR1_OPMD_E Manager 1 (Op Mid): Transmission & Distribution: Transmission Substations & Operations
8 Utility
119 MGR1_TDST_E Manager 1, Safety & Training: Transmission & Distribution: T&D Safety
1 Combined
120 MGR1 Manager 1: Corporate Communication 1 Combined 121 MGR1 Manager 1: Customer Service: Business Customer
Division 14 Utility
122 MGR1 Manager 1: Customer Service: Customer Programs & Services
13 Combined
123 MGR1 Manager 1: Customer Service: Customer Service Operations Division
23 Utility
124 MGR1 Manager 1: Finance: Controllers 7 Combined 125 MGR1 Manager 1: Finance: Operational Finance 2 Combined 126 MGR1 Manager 1: Human Resources 9 Combined 127 MGR1 Manager 1: Information Technology: Grid Services 9 Combined 128 MGR1 Manager 1: Information Technology: IT Service
Mgmnt Office & Operations 7 Combined
129 MGR1 Manager 1: Legal Organization 1 Combined 130 MGR1 Manager 1: Operational Services: Business
Resiliency 1 Combined
131 MGR1 Manager 1: Operational Services: Corporate Real Estate
1 Combined
132 MGR1 Manager 1: Operational Services: Corporate Security
2 Combined
133 MGR1 Manager 1: Operational Services: Transportation Services
7 General
15 In the Study, Aon Hewitt used a comparator group with two subgroups. “Utility” is the energy utility comparator subgroup. “General” is the general industry comparator subgroup. “Combined” included all utility and general industry companies.
32

Workpaper – Southern California Edison / 2018 GRC
Exhibit No. SCE-06 / Vol. 03Witness: A. Peterson
2018 General Rate Case 32
Table A-4: Manager/Supervisor Positions Included in 2018 Study
Study Position Number
SCE Job Code SCE Job Title
# of SCE Incumbents
Comparator Group16
134 MGR1 Manager 1: Power Production 2 Utility 135 MGR1 Manager 1: Settlements & Operations Services 2 Utility
136 MGR1 Manager 1: Transmission & Distribution: Asset Management & Operations Support 6 Combined
137 MGR1 Manager 1: Transmission & Distribution: Distribution Business Line 33 Utility
138 MGR1 Manager 1: Transmission & Distribution: Engineering & Tech Srvcs Bs Ln 14 Combined
139 MGR1 Manager 1: Transmission & Distribution: T&D Safety 2 Combined
140 MGR1 Manager 1: Transmission & Distribution: Transmission Substations & Operations 26 Utility
141 MGR2 Manager 2: Audit Services 8 Combined 142 MGR2 Manager 2: Compliance and Safety 4 Combined 143 MGR2 Manager 2: Corporate Communication 5 Combined
144 MGR2 Manager 2: Customer Service: Customer Programs & Services 29 Combined
145 MGR2 Manager 2: Customer Service: Customer Service Operations Division 22 Utility
146 MGR2 Manager 2: Edison Material Supply: OS EMS Supply Management 13 Combined
147 MGR2 Manager 2: Finance 5 Combined 148 MGR2 Manager 2: Finance: Controllers 13 Combined 149 MGR2 Manager 2: Finance: Operational Finance 6 Combined 150 MGR2 Manager 2: Finance: Treasurers 1 Combined 151 MGR2 Manager 2: Human Resources 17 Combined
152 MGR2 Manager 2: Information Technology: Enterprise Architecture & Strategy 5 Combined
153 MGR2 Manager 2: Information Technology: Grid Services 15 Combined
154 MGR2 Manager 2: Information Technology: IT Service Mgmnt Office & Operations 7 Combined
155 MGR2 Manager 2: Legal Organization 8 General
156 MGR2 Manager 2: Operational Services: Business Resiliency 2 General
157 MGR2 Manager 2: Operational Services: Corporate Environmental Services 13 General
158 MGR2 Manager 2: Operational Services: Corporate Health & Safety 1 Combined
159 MGR2 Manager 2: Operational Services: Corporate Real Estate 2 General
160 MGR2 Manager 2: Operational Services: Corporate Security 1 Combined
161 MGR2 Manager 2: Operational Services: Enterprise Safety Program 1 Combined
162 MGR2 Manager 2: Operational Services: TD/PPD Supply Chain and Integrated Support Service 3 Combined
16 In the Study, Aon Hewitt used a comparator group with two subgroups. “Utility” is the energy utility comparator subgroup. “General” is the general industry comparator subgroup. “Combined” included all utility and general industry companies.
33
Workpaper – Southern California Edison / 2018 GRC
Exhibit No. SCE-06 / Vol. 03Witness: A. Peterson
2018 General Rate Case 33
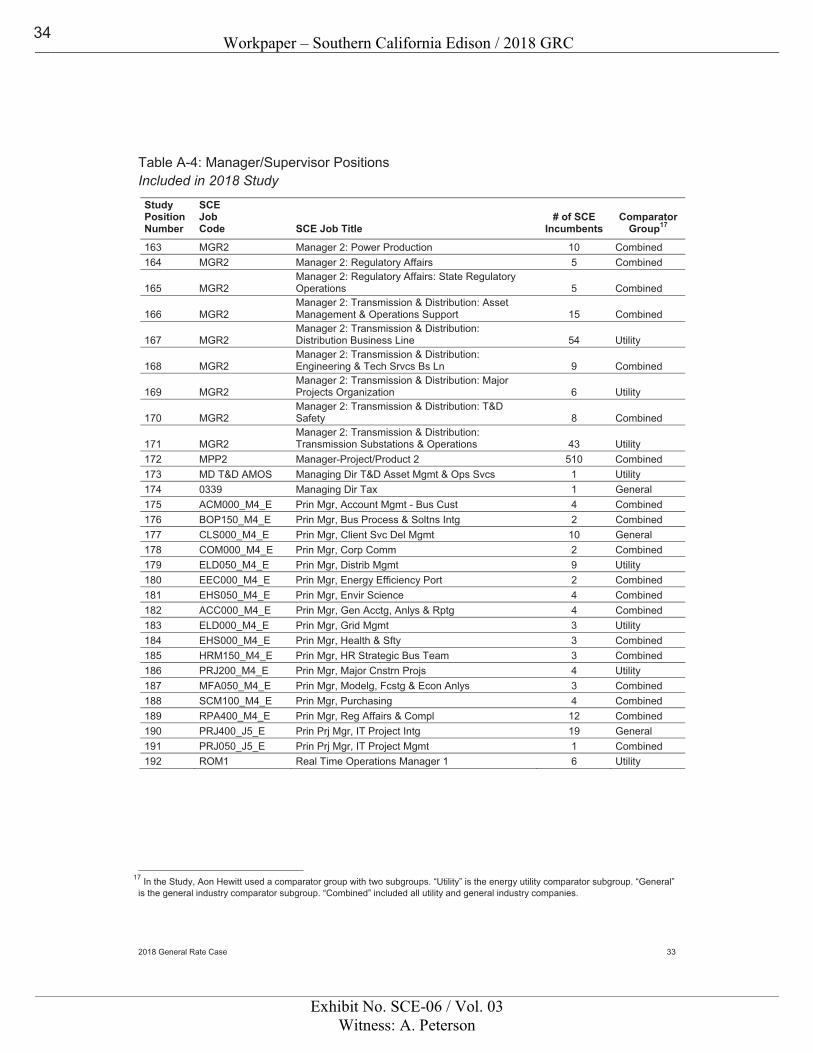
Table A-4: Manager/Supervisor Positions Included in 2018 Study
Study Position Number
SCE Job Code SCE Job Title
# of SCE Incumbents
Comparator Group17
163 MGR2 Manager 2: Power Production 10 Combined 164 MGR2 Manager 2: Regulatory Affairs 5 Combined
165 MGR2 Manager 2: Regulatory Affairs: State Regulatory Operations 5 Combined
166 MGR2 Manager 2: Transmission & Distribution: Asset Management & Operations Support 15 Combined
167 MGR2 Manager 2: Transmission & Distribution: Distribution Business Line 54 Utility
168 MGR2 Manager 2: Transmission & Distribution: Engineering & Tech Srvcs Bs Ln 9 Combined
169 MGR2 Manager 2: Transmission & Distribution: Major Projects Organization 6 Utility
170 MGR2 Manager 2: Transmission & Distribution: T&D Safety 8 Combined
171 MGR2 Manager 2: Transmission & Distribution: Transmission Substations & Operations 43 Utility
172 MPP2 Manager-Project/Product 2 510 Combined 173 MD T&D AMOS Managing Dir T&D Asset Mgmt & Ops Svcs 1 Utility 174 0339 Managing Dir Tax 1 General 175 ACM000_M4_E Prin Mgr, Account Mgmt - Bus Cust 4 Combined 176 BOP150_M4_E Prin Mgr, Bus Process & Soltns Intg 2 Combined 177 CLS000_M4_E Prin Mgr, Client Svc Del Mgmt 10 General 178 COM000_M4_E Prin Mgr, Corp Comm 2 Combined 179 ELD050_M4_E Prin Mgr, Distrib Mgmt 9 Utility 180 EEC000_M4_E Prin Mgr, Energy Efficiency Port 2 Combined 181 EHS050_M4_E Prin Mgr, Envir Science 4 Combined 182 ACC000_M4_E Prin Mgr, Gen Acctg, Anlys & Rptg 4 Combined 183 ELD000_M4_E Prin Mgr, Grid Mgmt 3 Utility 184 EHS000_M4_E Prin Mgr, Health & Sfty 3 Combined 185 HRM150_M4_E Prin Mgr, HR Strategic Bus Team 3 Combined 186 PRJ200_M4_E Prin Mgr, Major Cnstrn Projs 4 Utility 187 MFA050_M4_E Prin Mgr, Modelg, Fcstg & Econ Anlys 3 Combined 188 SCM100_M4_E Prin Mgr, Purchasing 4 Combined 189 RPA400_M4_E Prin Mgr, Reg Affairs & Compl 12 Combined 190 PRJ400_J5_E Prin Prj Mgr, IT Project Intg 19 General 191 PRJ050_J5_E Prin Prj Mgr, IT Project Mgmt 1 Combined 192 ROM1 Real Time Operations Manager 1 6 Utility
17 In the Study, Aon Hewitt used a comparator group with two subgroups. “Utility” is the energy utility comparator subgroup. “General” is the general industry comparator subgroup. “Combined” included all utility and general industry companies.
34
Workpaper – Southern California Edison / 2018 GRC
Exhibit No. SCE-06 / Vol. 03Witness: A. Peterson
2018 General Rate Case 34
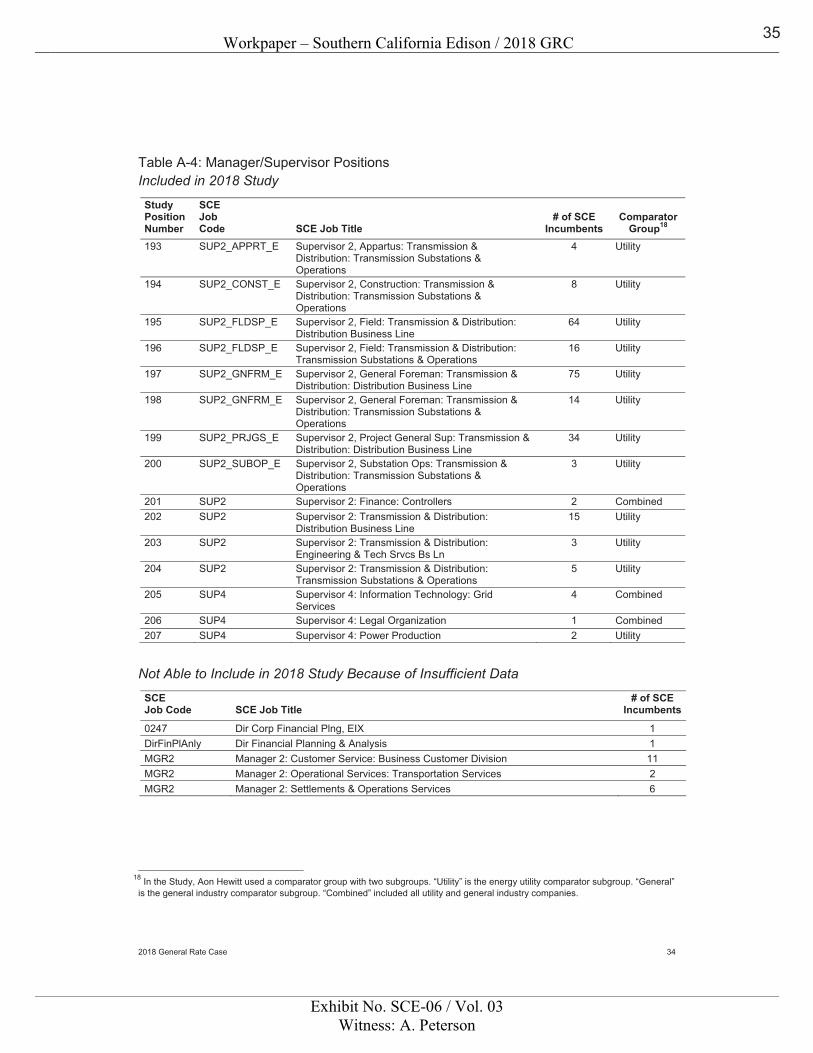
Table A-4: Manager/Supervisor Positions Included in 2018 Study
Study Position Number
SCE Job Code SCE Job Title
# of SCE Incumbents
Comparator Group18
193 SUP2_APPRT_E Supervisor 2, Appartus: Transmission & Distribution: Transmission Substations & Operations
4 Utility
194 SUP2_CONST_E Supervisor 2, Construction: Transmission & Distribution: Transmission Substations & Operations
8 Utility
195 SUP2_FLDSP_E Supervisor 2, Field: Transmission & Distribution: Distribution Business Line
64 Utility
196 SUP2_FLDSP_E Supervisor 2, Field: Transmission & Distribution: Transmission Substations & Operations
16 Utility
197 SUP2_GNFRM_E Supervisor 2, General Foreman: Transmission & Distribution: Distribution Business Line
75 Utility
198 SUP2_GNFRM_E Supervisor 2, General Foreman: Transmission & Distribution: Transmission Substations & Operations
14 Utility
199 SUP2_PRJGS_E Supervisor 2, Project General Sup: Transmission & Distribution: Distribution Business Line
34 Utility
200 SUP2_SUBOP_E Supervisor 2, Substation Ops: Transmission & Distribution: Transmission Substations & Operations
3 Utility
201 SUP2 Supervisor 2: Finance: Controllers 2 Combined 202 SUP2 Supervisor 2: Transmission & Distribution:
Distribution Business Line 15 Utility
203 SUP2 Supervisor 2: Transmission & Distribution: Engineering & Tech Srvcs Bs Ln
3 Utility
204 SUP2 Supervisor 2: Transmission & Distribution: Transmission Substations & Operations
5 Utility
205 SUP4 Supervisor 4: Information Technology: Grid Services
4 Combined
206 SUP4 Supervisor 4: Legal Organization 1 Combined 207 SUP4 Supervisor 4: Power Production 2 Utility
Not Able to Include in 2018 Study Because of Insufficient Data
SCE Job Code SCE Job Title
# of SCE Incumbents
0247 Dir Corp Financial Plng, EIX 1 DirFinPlAnly Dir Financial Planning & Analysis 1 MGR2 Manager 2: Customer Service: Business Customer Division 11 MGR2 Manager 2: Operational Services: Transportation Services 2 MGR2 Manager 2: Settlements & Operations Services 6
18 In the Study, Aon Hewitt used a comparator group with two subgroups. “Utility” is the energy utility comparator subgroup. “General” is the general industry comparator subgroup. “Combined” included all utility and general industry companies.
35
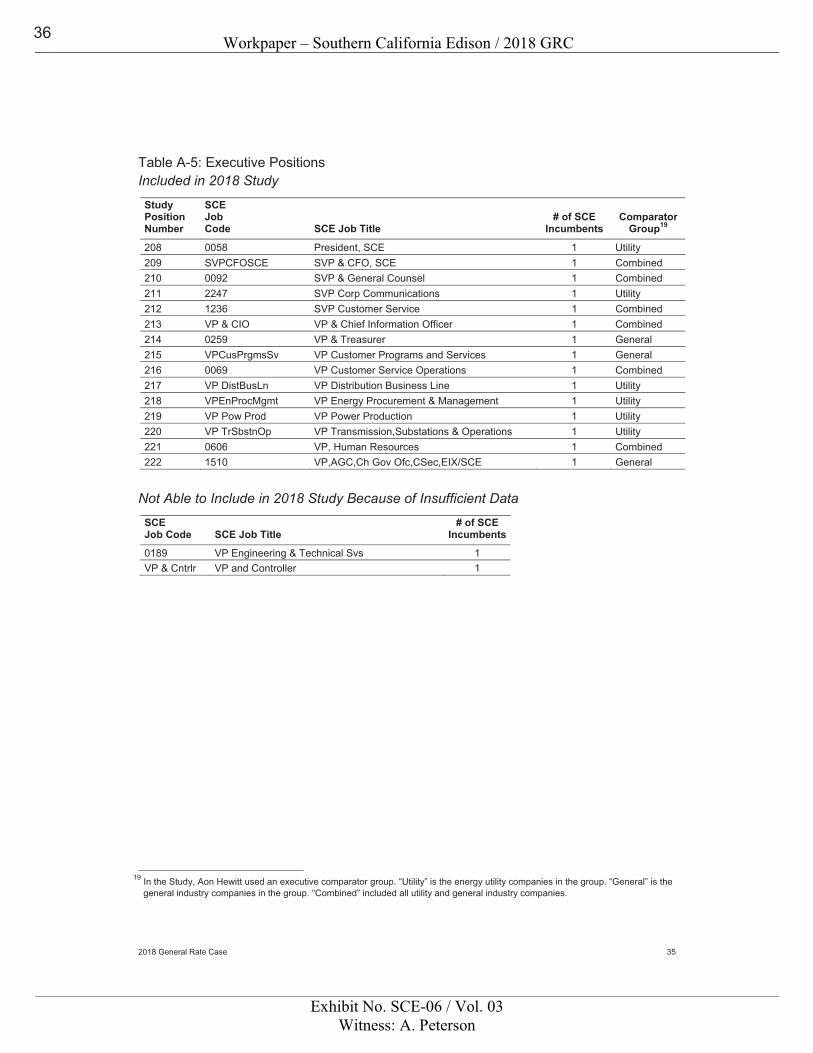
Workpaper – Southern California Edison / 2018 GRC
Exhibit No. SCE-06 / Vol. 03Witness: A. Peterson
2018 General Rate Case 35
Table A-5: Executive Positions Included in 2018 Study
Study Position Number
SCE Job Code SCE Job Title
# of SCE Incumbents
Comparator Group19
208 0058 President, SCE 1 Utility 209 SVPCFOSCE SVP & CFO, SCE 1 Combined 210 0092 SVP & General Counsel 1 Combined 211 2247 SVP Corp Communications 1 Utility 212 1236 SVP Customer Service 1 Combined 213 VP & CIO VP & Chief Information Officer 1 Combined 214 0259 VP & Treasurer 1 General 215 VPCusPrgmsSv VP Customer Programs and Services 1 General 216 0069 VP Customer Service Operations 1 Combined 217 VP DistBusLn VP Distribution Business Line 1 Utility 218 VPEnProcMgmt VP Energy Procurement & Management 1 Utility 219 VP Pow Prod VP Power Production 1 Utility 220 VP TrSbstnOp VP Transmission,Substations & Operations 1 Utility 221 0606 VP, Human Resources 1 Combined 222 1510 VP,AGC,Ch Gov Ofc,CSec,EIX/SCE 1 General
Not Able to Include in 2018 Study Because of Insufficient Data
SCE Job Code SCE Job Title
# of SCE Incumbents
0189 VP Engineering & Technical Svs 1 VP & Cntrlr VP and Controller 1
19 In the Study, Aon Hewitt used an executive comparator group. “Utility” is the energy utility companies in the group. “General” is the
general industry companies in the group. “Combined” included all utility and general industry companies.
36
Workpaper – Southern California Edison / 2018 GRC
Exhibit No. SCE-06 / Vol. 03Witness: A. Peterson
2018 General Rate Case 36
Appendix B: Comparator List
37
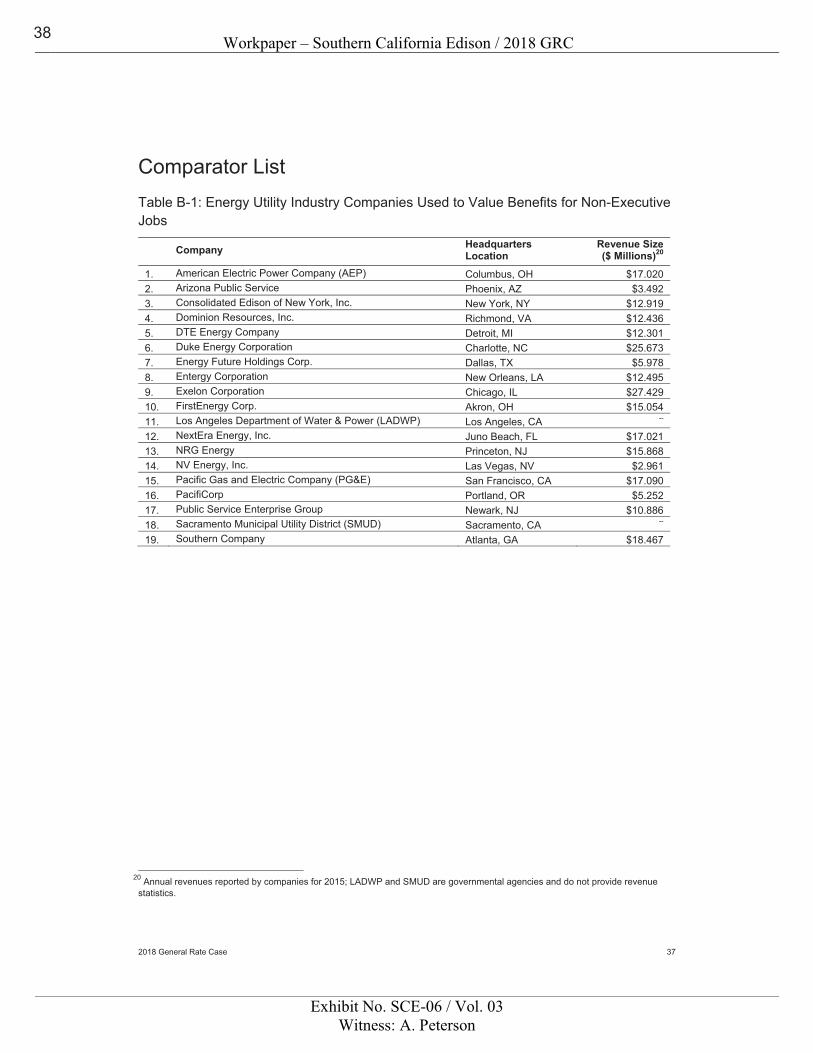
Workpaper – Southern California Edison / 2018 GRC
Exhibit No. SCE-06 / Vol. 03Witness: A. Peterson
2018 General Rate Case 37
Comparator List Table B-1: Energy Utility Industry Companies Used to Value Benefits for Non-Executive Jobs
Company Headquarters Location
Revenue Size($ Millions)20
1. American Electric Power Company (AEP) Columbus, OH $17.020 2. Arizona Public Service Phoenix, AZ $3.492 3. Consolidated Edison of New York, Inc. New York, NY $12.919 4. Dominion Resources, Inc. Richmond, VA $12.436 5. DTE Energy Company Detroit, MI $12.301 6. Duke Energy Corporation Charlotte, NC $25.673 7. Energy Future Holdings Corp. Dallas, TX $5.978 8. Entergy Corporation New Orleans, LA $12.495 9. Exelon Corporation Chicago, IL $27.429 10. FirstEnergy Corp. Akron, OH $15.054 11. Los Angeles Department of Water & Power (LADWP) Los Angeles, CA --
12. NextEra Energy, Inc. Juno Beach, FL $17.021 13. NRG Energy Princeton, NJ $15.868 14. NV Energy, Inc. Las Vegas, NV $2.961 15. Pacific Gas and Electric Company (PG&E) San Francisco, CA $17.090 16. PacifiCorp Portland, OR $5.252 17. Public Service Enterprise Group Newark, NJ $10.886 18. Sacramento Municipal Utility District (SMUD) Sacramento, CA --
19. Southern Company Atlanta, GA $18.467
20 Annual revenues reported by companies for 2015; LADWP and SMUD are governmental agencies and do not provide revenue statistics.
38
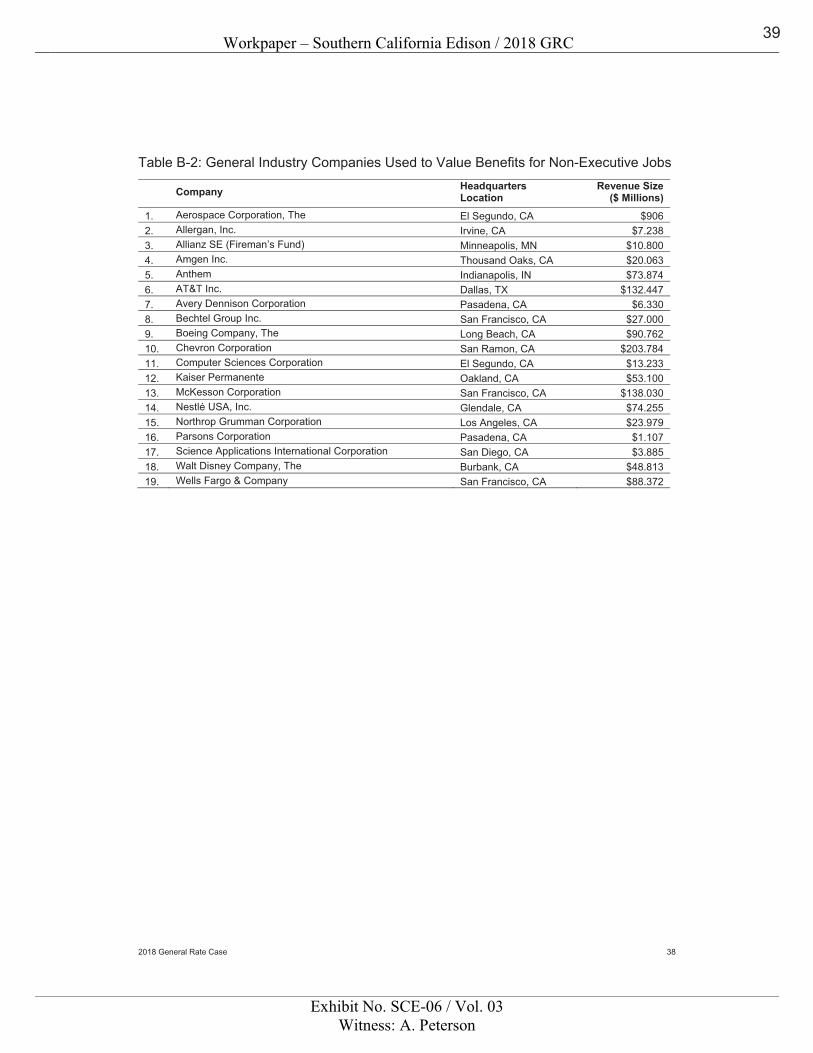
Workpaper – Southern California Edison / 2018 GRC
Exhibit No. SCE-06 / Vol. 03Witness: A. Peterson
2018 General Rate Case 38
Table B-2: General Industry Companies Used to Value Benefits for Non-Executive Jobs
Company Headquarters Location
Revenue Size($ Millions)
1. Aerospace Corporation, The El Segundo, CA $906 2. Allergan, Inc. Irvine, CA $7.238 3. Allianz SE (Fireman’s Fund) Minneapolis, MN $10.800 4. Amgen Inc. Thousand Oaks, CA $20.063 5. Anthem Indianapolis, IN $73.874 6. AT&T Inc. Dallas, TX $132.447 7. Avery Dennison Corporation Pasadena, CA $6.330 8. Bechtel Group Inc. San Francisco, CA $27.000 9. Boeing Company, The Long Beach, CA $90.762 10. Chevron Corporation San Ramon, CA $203.784 11. Computer Sciences Corporation El Segundo, CA $13.233 12. Kaiser Permanente Oakland, CA $53.100 13. McKesson Corporation San Francisco, CA $138.030 14. Nestlé USA, Inc. Glendale, CA $74.255 15. Northrop Grumman Corporation Los Angeles, CA $23.979 16. Parsons Corporation Pasadena, CA $1.107 17. Science Applications International Corporation San Diego, CA $3.885 18. Walt Disney Company, The Burbank, CA $48.813 19. Wells Fargo & Company San Francisco, CA $88.372
39
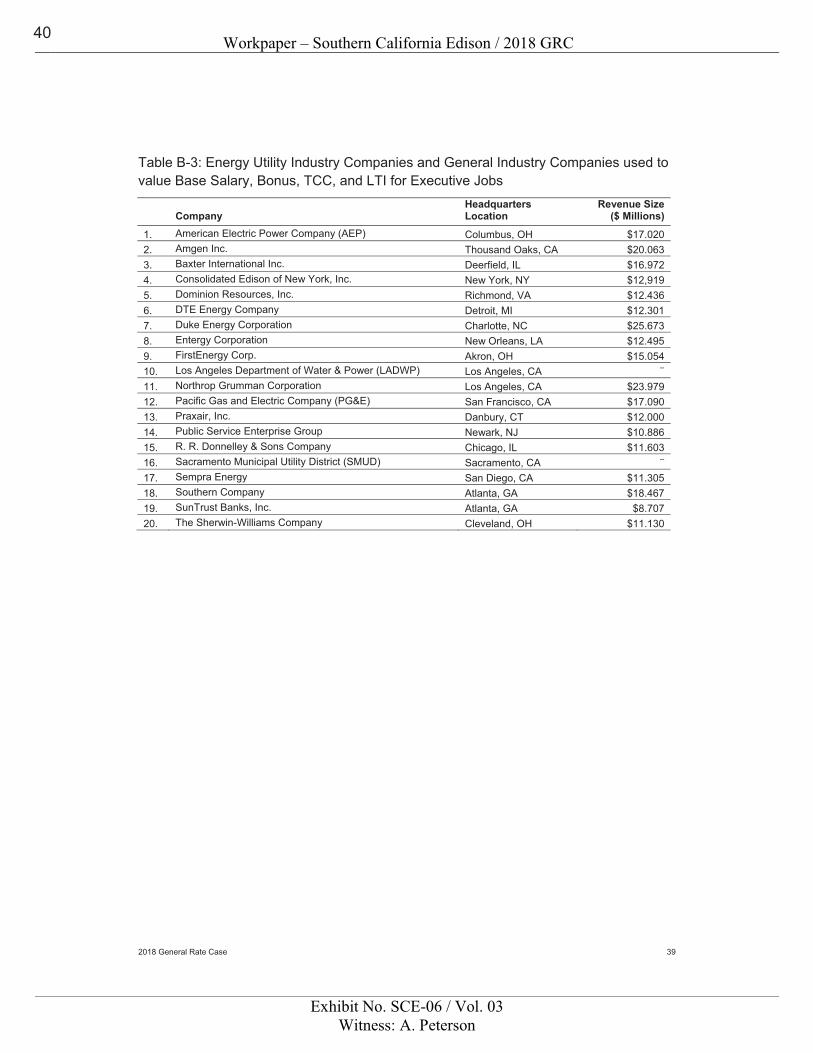
Workpaper – Southern California Edison / 2018 GRC
Exhibit No. SCE-06 / Vol. 03Witness: A. Peterson
2018 General Rate Case 39
Table B-3: Energy Utility Industry Companies and General Industry Companies used to value Base Salary, Bonus, TCC, and LTI for Executive Jobs
Company Headquarters Location
Revenue Size ($ Millions)
1. American Electric Power Company (AEP) Columbus, OH $17.020 2. Amgen Inc. Thousand Oaks, CA $20.063 3. Baxter International Inc. Deerfield, IL $16.972 4. Consolidated Edison of New York, Inc. New York, NY $12,919 5. Dominion Resources, Inc. Richmond, VA $12.436 6. DTE Energy Company Detroit, MI $12.301 7. Duke Energy Corporation Charlotte, NC $25.673 8. Entergy Corporation New Orleans, LA $12.495 9. FirstEnergy Corp. Akron, OH $15.054 10. Los Angeles Department of Water & Power (LADWP) Los Angeles, CA --
11. Northrop Grumman Corporation Los Angeles, CA $23.979 12. Pacific Gas and Electric Company (PG&E) San Francisco, CA $17.090 13. Praxair, Inc. Danbury, CT $12.000 14. Public Service Enterprise Group Newark, NJ $10.886 15. R. R. Donnelley & Sons Company Chicago, IL $11.603 16. Sacramento Municipal Utility District (SMUD) Sacramento, CA --
17. Sempra Energy San Diego, CA $11.305 18. Southern Company Atlanta, GA $18.467 19. SunTrust Banks, Inc. Atlanta, GA $8.707 20. The Sherwin-Williams Company Cleveland, OH $11.130
40
Workpaper – Southern California Edison / 2018 GRC
Exhibit No. SCE-06 / Vol. 03Witness: A. Peterson
2018 General Rate Case 40
Appendix C: Detailed Results by Category
41
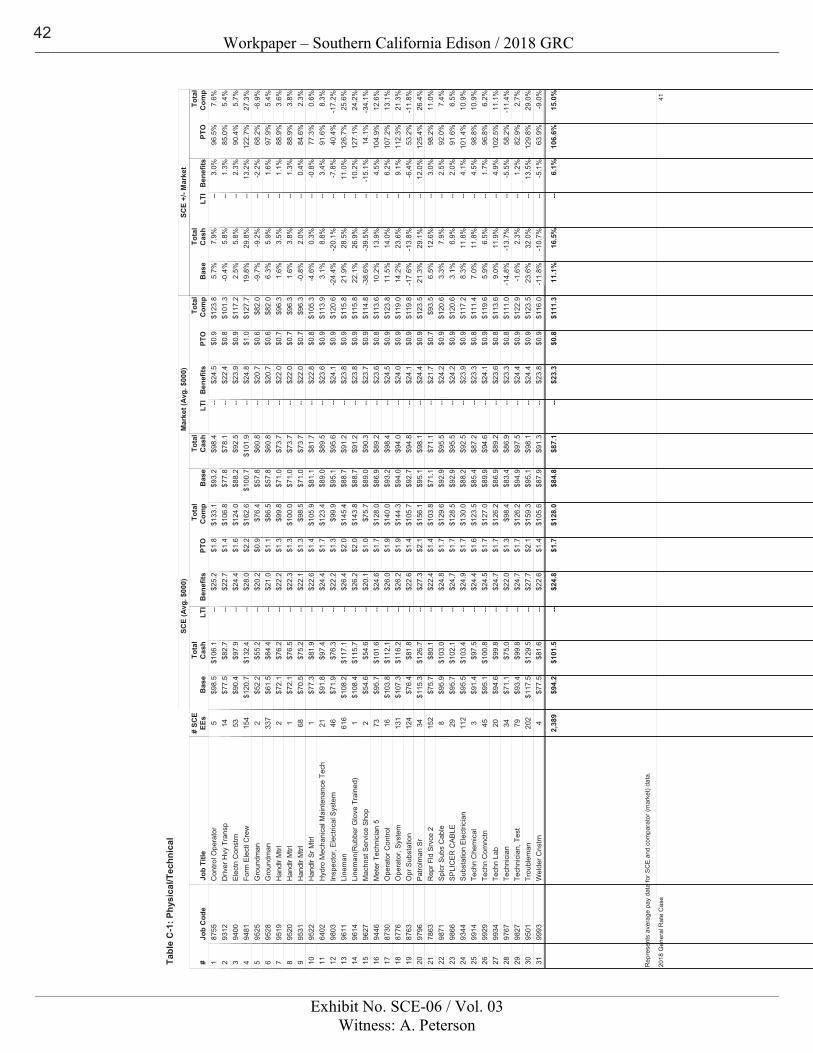
Workpaper – Southern California Edison / 2018 GRC
Exhibit No. SCE-06 / Vol. 03Witness: A. Peterson
Job
Cod
eB
ase
SCE
(Avg
. $00
0)To
tal
Cas
hLT
IB
enef
itsPT
O#
SCE
EEs
Bas
e
Mar
ket (
Avg.
$00
0)To
tal
Cas
hLT
IB
enef
itsPT
OB
ase
SCE
+/- M
arke
tTo
tal
Cas
hLT
IB
enef
itsPT
O
Tab
le C
-1: P
hysi
cal/T
echn
ical
Tota
lC
omp
Tota
lC
omp
Tota
lC
omp
Job
Title
#87
55C
ontro
l Ope
rato
r$9
8.5
$106
.1--
$93.
2$9
8.4
--5.
7%7.
9%--
$25.
2$2
4.5
3.0%
$1.8
$0.9
96.5
%5
7.6%
$123
.8$1
33.1
193
12D
river
Hvy
Tra
nsp
$77.
5$8
2.7
--$7
7.8
$78.
1--
-0.4
%5.
8%--
$22.
7$2
2.4
1.3%
$1.4
$0.8
85.0
%14
5.4%
$101
.3$1
06.8
294
00E
lect
n C
onst
rn$9
0.4
$97.
9--
$88.
2$9
2.5
--2.
5%5.
8%--
$24.
4$2
3.9
2.3%
$1.6
$0.9
90.4
%53
5.7%
$117
.2$1
24.0
394
81Fo
rm E
lect
l Cre
w$1
20.7
$132
.4--
$100
.7$1
01.9
--19
.8%
29.8
%--
$28.
0$2
4.8
13.2
%$2
.2$1
.012
2.7%
154
27.3
%$1
27.7
$162
.64
9525
Gro
undm
an$5
2.2
$55.
2--
$57.
8$6
0.8
---9
.7%
-9.2
%--
$20.
2$2
0.7
-2.2
%$0
.9$0
.668
.2%
2-6
.9%
$82.
0$7
6.4
595
28G
roun
dman
$61.
5$6
4.4
--$5
7.8
$60.
8--
6.3%
5.9%
--$2
1.0
$20.
71.
6%$1
.1$0
.697
.9%
337
5.4%
$82.
0$8
6.5
695
19H
andl
r Mtrl
$72.
1$7
6.2
--$7
1.0
$73.
7--
1.6%
3.5%
--$2
2.2
$22.
01.
1%$1
.3$0
.788
.9%
23.
6%$9
6.3
$99.
87
9520
Han
dlr M
trl$7
2.1
$76.
5--
$71.
0$7
3.7
--1.
6%3.
8%--
$22.
3$2
2.0
1.3%
$1.3
$0.7
88.9
%1
3.8%
$96.
3$1
00.0
895
31H
andl
r Mtrl
$70.
5$7
5.2
--$7
1.0
$73.
7--
-0.8
%2.
0%--
$22.
1$2
2.0
0.4%
$1.3
$0.7
84.6
%68
2.3%
$96.
3$9
8.5
995
22H
andl
r Sr M
trl$7
7.3
$81.
9--
$81.
1$8
1.7
---4
.6%
0.3%
--$2
2.6
$22.
8-0
.8%
$1.4
$0.8
77.3
%1
0.6%
$105
.3$1
05.9
1064
02H
ydro
Mec
hani
cal M
aint
enan
ce T
ech
$91.
8$9
7.4
--$8
9.0
$89.
5--
3.1%
8.8%
--$2
4.4
$23.
63.
4%$1
.7$0
.991
.6%
218.
3%$1
13.9
$123
.411
9803
Insp
ecto
r, E
lect
rical
Sys
tem
$71.
9$7
6.3
--$9
5.1
$95.
6--
-24.
4%-2
0.1%
--$2
2.2
$24.
1-7
.8%
$1.3
$0.9
40.4
%46
-17.
2%$1
20.6
$99.
912
9611
Line
man
$108
.2$1
17.1
--$8
8.7
$91.
2--
21.9
%28
.5%
--$2
6.4
$23.
811
.0%
$2.0
$0.9
126.
7%61
625
.6%
$115
.8$1
45.4
1396
14Li
nem
an(R
ubbe
r Glo
ve T
rain
ed)
$108
.4$1
15.7
--$8
8.7
$91.
2--
22.1
%26
.9%
--$2
6.2
$23.
810
.2%
$2.0
$0.9
127.
1%1
24.2
%$1
15.8
$143
.814
9627
Mac
hnst
Ser
vice
Sho
p$5
4.6
$54.
6--
$89.
0$9
0.3
---3
8.6%
-39.
5%--
$20.
1$2
3.7
-15.
1%$1
.0$0
.914
.1%
2-3
4.1%
$114
.8$7
5.7
1594
46M
eter
Tec
hnic
ian
5$9
5.7
$101
.6--
$86.
9$8
9.2
--10
.2%
13.9
%--
$24.
6$2
3.6
4.5%
$1.7
$0.8
104.
9%73
12.6
%$1
13.6
$128
.016
8730
Ope
rato
r Con
trol
$103
.8$1
12.1
--$9
3.2
$98.
4--
11.5
%14
.0%
--$2
6.0
$24.
56.
2%$1
.9$0
.910
7.2%
1613
.1%
$123
.8$1
40.0
1787
76O
pera
tor,
Syst
em$1
07.3
$116
.2--
$94.
0$9
4.0
--14
.2%
23.6
%--
$26.
2$2
4.0
9.1%
$1.9
$0.9
112.
3%13
121
.3%
$119
.0$1
44.3
1887
63O
pr S
ubst
atio
n$7
6.4
$81.
8--
$92.
7$9
4.8
---1
7.6%
-13.
8%--
$22.
6$2
4.1
-6.4
%$1
.4$0
.953
.2%
124
-11.
8%$1
19.8
$105
.719
9796
Pat
rolm
an S
r$1
15.3
$126
.7--
$95.
1$9
8.1
--21
.3%
29.1
%--
$27.
3$2
4.4
12.0
%$2
.1$0
.912
5.4%
3426
.4%
$123
.5$1
56.1
2078
63R
epr F
ld S
rvce
2$7
5.7
$80.
1--
$71.
1$7
1.1
--6.
5%12
.6%
--$2
2.4
$21.
73.
0%$1
.4$0
.798
.2%
152
11.0
%$9
3.5
$103
.821
9871
Splc
r Sub
s C
able
$95.
9$1
03.0
--$9
2.9
$95.
5--
3.3%
7.9%
--$2
4.8
$24.
22.
5%$1
.7$0
.992
.0%
87.
4%$1
20.6
$129
.622
9866
SP
LIC
ER
CAB
LE$9
5.7
$102
.1--
$92.
9$9
5.5
--3.
1%6.
9%--
$24.
7$2
4.2
2.0%
$1.7
$0.9
91.6
%29
6.5%
$120
.6$1
28.5
2393
44S
ubst
atio
n E
lect
ricia
n$9
5.5
$103
.4--
$88.
2$9
2.5
--8.
3%11
.8%
--$2
4.9
$23.
94.
1%$1
.7$0
.910
1.4%
112
10.9
%$1
17.2
$130
.024
9914
Tech
n C
hem
ical
$91.
4$9
7.5
--$8
5.4
$87.
2--
7.0%
11.8
%--
$24.
4$2
3.3
4.5%
$1.6
$0.8
98.8
%3
10.9
%$1
11.4
$123
.525
9929
Tech
n C
omnc
tn$9
5.1
$100
.8--
$89.
9$9
4.6
--5.
9%6.
5%--
$24.
5$2
4.1
1.7%
$1.7
$0.9
96.8
%45
6.2%
$119
.6$1
27.0
2699
34Te
chn
Lab
$94.
6$9
9.8
--$8
6.9
$89.
2--
9.0%
11.9
%--
$24.
7$2
3.6
4.9%
$1.7
$0.8
102.
5%20
11.1
%$1
13.6
$126
.227
9767
Tech
nici
an$7
1.1
$75.
0--
$83.
4$8
6.9
---1
4.8%
-13.
7%--
$22.
0$2
3.3
-5.5
%$1
.3$0
.858
.2%
34-1
1.4%
$111
.0$9
8.4
2898
27Te
chni
cian
, Tes
t$9
3.4
$99.
8--
$94.
9$9
7.5
---1
.6%
2.3%
--$2
4.7
$24.
41.
2%$1
.7$0
.982
.9%
792.
7%$1
22.9
$126
.229
9501
Trou
blem
an$1
17.5
$129
.5--
$95.
1$9
8.1
--23
.6%
32.0
%--
$27.
7$2
4.4
13.5
%$2
.1$0
.912
9.8%
202
29.0
%$1
23.5
$159
.330
9993
Wel
der C
nstrn
$77.
5$8
1.6
--$8
7.9
$91.
3--
-11.
8%-1
0.7%
--$2
2.6
$23.
8-5
.1%
$1.4
$0.9
63.9
%4
-9.0
%$1
16.0
$105
.631
$94.
2$1
01.5
--$8
4.8
$87.
1--
11.1
%16
.5%
--$2
4.8
$23.
36.
1%$1
.7$0
.810
6.6%
2,38
915
.0%
$111
.3$1
28.0
4120
18 G
ener
al R
ate
Cas
e
Rep
rese
nts
aver
age
pay
data
for S
CE
and
com
para
tor (
mar
ket)
data
.
42
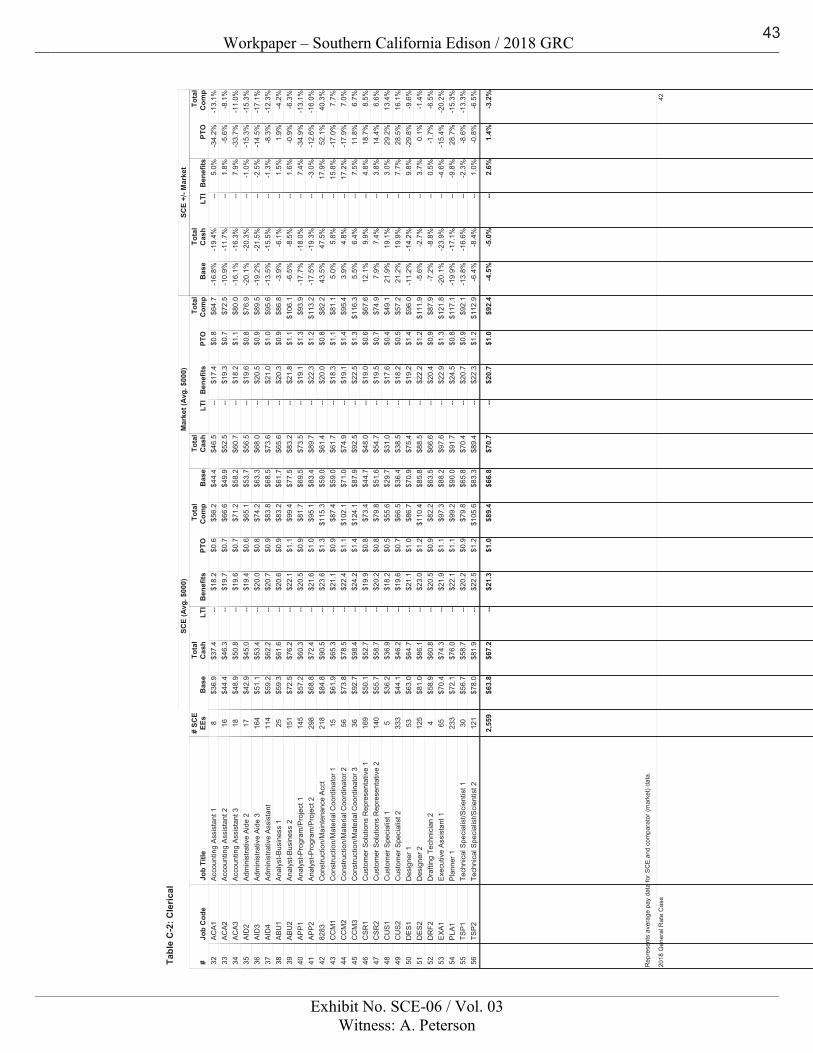
Workpaper – Southern California Edison / 2018 GRC
Exhibit No. SCE-06 / Vol. 03Witness: A. Peterson
Job
Cod
eB
ase
SCE
(Avg
. $00
0)To
tal
Cas
hLT
IB
enef
itsPT
O#
SCE
EEs
Bas
e
Mar
ket (
Avg.
$00
0)To
tal
Cas
hLT
IB
enef
itsPT
OB
ase
SCE
+/- M
arke
tTo
tal
Cas
hLT
IB
enef
itsPT
O
Tab
le C
-2: C
leric
al
Tota
lC
omp
Tota
lC
omp
Tota
lC
omp
Job
Title
#A
CA
1A
ccou
ntin
g A
ssis
tant
1$3
6.9
$37.
4--
$44.
4$4
6.5
---1
6.8%
-19.
4%--
$18.
2$1
7.4
5.0%
$0.6
$0.8
-34.
2%8
-13.
1%$6
4.7
$56.
232
AC
A2
Acc
ount
ing
Ass
ista
nt 2
$44.
4$4
6.3
--$4
9.9
$52.
5--
-10.
9%-1
1.7%
--$1
9.7
$19.
31.
8%$0
.7$0
.7-5
.6%
16-8
.1%
$72.
5$6
6.6
33A
CA
3A
ccou
ntin
g A
ssis
tant
3$4
8.9
$50.
8--
$58.
2$6
0.7
---1
6.1%
-16.
3%--
$19.
6$1
8.2
7.9%
$0.7
$1.1
-33.
7%18
-11.
0%$8
0.0
$71.
234
AID
2A
dmin
istra
tive
Aid
e 2
$42.
9$4
5.0
--$5
3.7
$56.
5--
-20.
1%-2
0.3%
--$1
9.4
$19.
6-1
.0%
$0.6
$0.8
-15.
3%17
-15.
3%$7
6.9
$65.
135
AID
3A
dmin
istra
tive
Aid
e 3
$51.
1$5
3.4
--$6
3.3
$68.
0--
-19.
2%-2
1.5%
--$2
0.0
$20.
5-2
.5%
$0.8
$0.9
-14.
5%16
4-1
7.1%
$89.
5$7
4.2
36A
ID4
Adm
inis
trativ
e A
ssis
tant
$59.
2$6
2.2
--$6
8.5
$73.
6--
-13.
5%-1
5.5%
--$2
0.7
$21.
0-1
.3%
$0.9
$1.0
-8.3
%11
4-1
2.3%
$95.
6$8
3.8
37A
BU
1A
naly
st-B
usin
ess
1$5
9.3
$61.
6--
$61.
7$6
5.6
---3
.9%
-6.1
%--
$20.
6$2
0.3
1.5%
$0.9
$0.9
1.9%
25-4
.2%
$86.
8$8
3.2
38A
BU
2A
naly
st-B
usin
ess
2$7
2.5
$76.
2--
$77.
5$8
3.2
---6
.5%
-8.5
%--
$22.
1$2
1.8
1.6%
$1.1
$1.1
-0.9
%15
1-6
.3%
$106
.1$9
9.4
39A
PP1
Ana
lyst
-Pro
gram
/Pro
ject
1$5
7.2
$60.
3--
$69.
5$7
3.5
---1
7.7%
-18.
0%--
$20.
5$1
9.1
7.4%
$0.9
$1.3
-34.
9%14
5-1
3.1%
$93.
9$8
1.7
40A
PP2
Ana
lyst
-Pro
gram
/Pro
ject
2$6
8.8
$72.
4--
$83.
4$8
9.7
---1
7.5%
-19.
3%--
$21.
6$2
2.3
-3.0
%$1
.0$1
.2-1
2.6%
298
-16.
0%$1
13.2
$95.
141
8283
Con
stru
ctio
n/M
aint
enan
ce A
cct
$84.
8$9
0.5
--$5
9.0
$61.
4--
43.5
%47
.5%
--$2
3.6
$20.
017
.9%
$1.3
$0.8
52.1
%21
840
.3%
$82.
2$1
15.3
42C
CM
1C
onst
ruct
ion/
Mat
eria
l Coo
rdin
ator
1$6
1.9
$65.
3--
$59.
0$6
1.7
--5.
0%5.
8%--
$21.
1$1
8.3
15.8
%$0
.9$1
.1-1
7.0%
157.
7%$8
1.1
$87.
443
CC
M2
Con
stru
ctio
n/M
ater
ial C
oord
inat
or 2
$73.
8$7
8.5
--$7
1.0
$74.
9--
3.9%
4.8%
--$2
2.4
$19.
117
.2%
$1.1
$1.4
-17.
9%56
7.0%
$95.
4$1
02.1
44C
CM
3C
onst
ruct
ion/
Mat
eria
l Coo
rdin
ator
3$9
2.7
$98.
4--
$87.
9$9
2.5
--5.
5%6.
4%--
$24.
2$2
2.5
7.5%
$1.4
$1.3
11.8
%36
6.7%
$116
.3$1
24.1
45C
SR
1C
usto
mer
Sol
utio
ns R
epre
sent
ativ
e 1
$50.
1$5
2.7
--$4
4.7
$48.
0--
12.1
%9.
9%--
$19.
9$1
9.0
4.8%
$0.8
$0.6
18.7
%16
98.
5%$6
7.6
$73.
446
CS
R2
Cus
tom
er S
olut
ions
Rep
rese
ntat
ive
2$5
5.7
$58.
7--
$51.
6$5
4.7
--7.
9%7.
4%--
$20.
2$1
9.5
3.8%
$0.8
$0.7
14.4
%14
06.
6%$7
4.9
$79.
847
CU
S1
Cus
tom
er S
peci
alis
t 1$3
6.2
$36.
9--
$29.
7$3
1.0
--21
.9%
19.1
%--
$18.
2$1
7.6
3.0%
$0.5
$0.4
29.2
%5
13.4
%$4
9.1
$55.
648
CU
S2
Cus
tom
er S
peci
alis
t 2$4
4.1
$46.
2--
$36.
4$3
8.5
--21
.2%
19.9
%--
$19.
6$1
8.2
7.7%
$0.7
$0.5
28.5
%33
316
.1%
$57.
2$6
6.5
49D
ES
1D
esig
ner 1
$63.
0$6
4.7
--$7
0.9
$75.
4--
-11.
2%-1
4.2%
--$2
1.1
$19.
29.
8%$1
.0$1
.4-2
9.8%
53-9
.6%
$96.
0$8
6.7
50D
ES
2D
esig
ner 2
$81.
0$8
6.1
--$8
5.8
$88.
5--
-5.6
%-2
.7%
--$2
3.0
$22.
23.
7%$1
.2$1
.20.
1%12
5-1
.4%
$111
.9$1
10.4
51D
RF2
Dra
fting
Tec
hnic
ian
2$5
8.9
$60.
8--
$63.
5$6
6.6
---7
.2%
-8.8
%--
$20.
5$2
0.4
0.5%
$0.9
$0.9
-1.7
%4
-6.5
%$8
7.9
$82.
252
EX
A1E
xecu
tive
Ass
ista
nt 1
$70.
4$7
4.3
--$8
8.2
$97.
6--
-20.
1%-2
3.9%
--$2
1.9
$22.
9-4
.6%
$1.1
$1.3
-15.
4%65
-20.
2%$1
21.8
$97.
353
PLA
1P
lann
er 1
$72.
1$7
6.0
--$9
0.0
$91.
7--
-19.
9%-1
7.1%
--$2
2.1
$24.
5-9
.8%
$1.1
$0.8
28.7
%23
3-1
5.3%
$117
.1$9
9.2
54TS
P1
Tech
nica
l Spe
cial
ist/S
cien
tist 1
$56.
7$5
8.7
--$6
5.8
$70.
4--
-13.
8%-1
6.6%
--$2
0.2
$20.
7-2
.3%
$0.9
$0.9
-8.6
%30
-13.
3%$9
2.1
$79.
855
TSP
2Te
chni
cal S
peci
alis
t/Sci
entis
t 2$7
8.0
$81.
9--
$83.
3$8
9.4
---6
.4%
-8.4
%--
$22.
5$2
2.3
1.0%
$1.2
$1.2
-0.8
%12
1-6
.5%
$112
.9$1
05.6
56
$63.
8$6
7.2
--$6
6.8
$70.
7--
-4.5
%-5
.0%
--$2
1.3
$20.
72.
6%$1
.0$1
.01.
4%2,
559
-3.2
%$9
2.4
$89.
4
4220
18 G
ener
al R
ate
Cas
e
Rep
rese
nts
aver
age
pay
data
for S
CE
and
com
para
tor (
mar
ket)
data
.
43
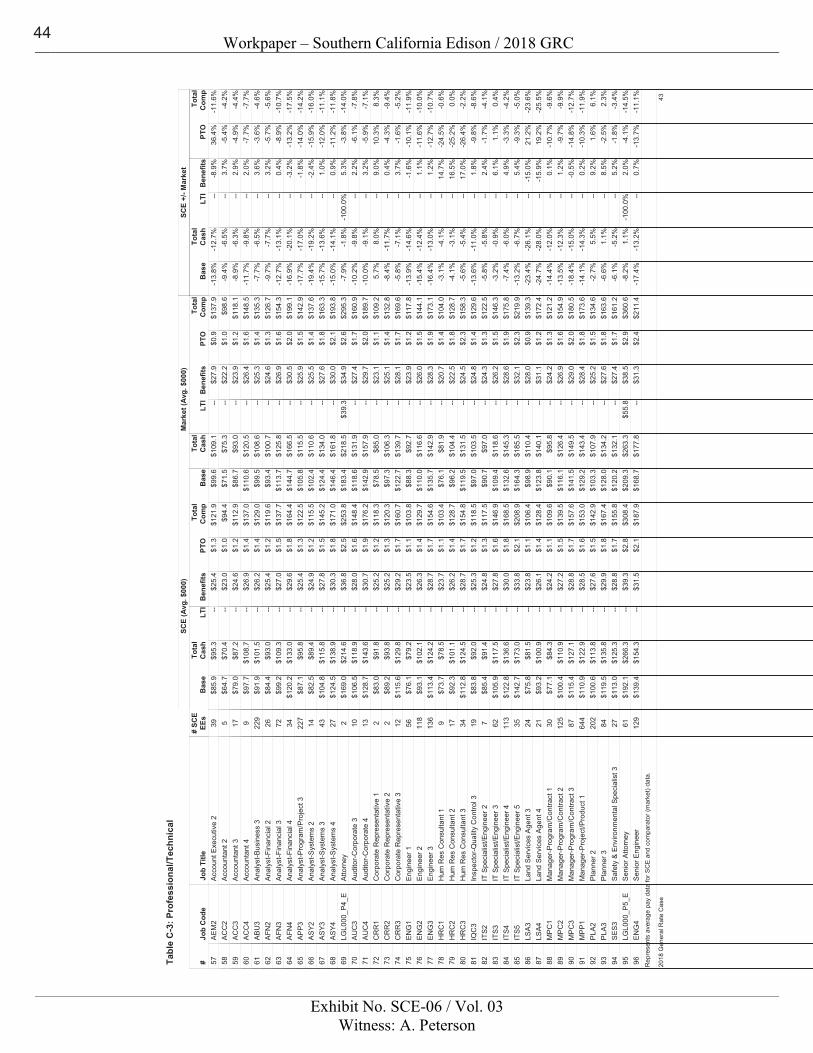
Workpaper – Southern California Edison / 2018 GRC
Exhibit No. SCE-06 / Vol. 03Witness: A. Peterson
Job
Cod
eB
ase
SCE
(Avg
. $00
0)To
tal
Cas
hLT
IB
enef
itsPT
O#
SCE
EEs
Bas
e
Mar
ket (
Avg.
$00
0)To
tal
Cas
hLT
IB
enef
itsPT
OB
ase
SCE
+/- M
arke
tTo
tal
Cas
hLT
IB
enef
itsPT
O
Tab
le C
-3: P
rofe
ssio
nal/T
echn
ical
Tota
lC
omp
Tota
lC
omp
Tota
lC
omp
Job
Title
#A
EM
2A
ccou
nt E
xecu
tive
2$8
5.9
$95.
3--
$99.
6$1
09.1
---1
3.8%
-12.
7%--
$25.
4$2
7.9
-8.9
%$1
.3$0
.936
.4%
39-1
1.6%
$137
.9$1
21.9
57A
CC
2A
ccou
ntan
t 2$6
4.7
$70.
4--
$71.
5$7
5.3
---9
.4%
-6.5
%--
$23.
0$2
2.2
3.7%
$1.0
$1.0
-5.4
%5
-4.2
%$9
8.6
$94.
458
AC
C3
Acc
ount
ant 3
$79.
0$8
7.2
--$8
6.7
$93.
0--
-8.9
%-6
.3%
--$2
4.6
$23.
92.
9%$1
.2$1
.2-4
.9%
17-4
.4%
$118
.1$1
12.9
59A
CC
4A
ccou
ntan
t 4$9
7.7
$108
.7--
$110
.6$1
20.5
---1
1.7%
-9.8
%--
$26.
9$2
6.4
2.0%
$1.4
$1.6
-7.7
%9
-7.7
%$1
48.5
$137
.060
AB
U3
Anal
yst-B
usin
ess
3$9
1.9
$101
.5--
$99.
5$1
08.6
---7
.7%
-6.5
%--
$26.
2$2
5.3
3.6%
$1.4
$1.4
-3.6
%22
9-4
.6%
$135
.3$1
29.0
61A
FN2
Ana
lyst
-Fin
anci
al 2
$84.
4$9
3.0
--$9
3.4
$100
.7--
-9.7
%-7
.7%
--$2
5.4
$24.
63.
2%$1
.2$1
.3-5
.7%
26-5
.6%
$126
.7$1
19.6
62A
FN3
Ana
lyst
-Fin
anci
al 3
$99.
2$1
09.3
--$1
13.7
$125
.8--
-12.
7%-1
3.1%
--$2
7.0
$26.
90.
4%$1
.5$1
.6-8
.9%
72-1
0.7%
$154
.3$1
37.7
63A
FN4
Ana
lyst
-Fin
anci
al 4
$120
.2$1
33.0
--$1
44.7
$166
.5--
-16.
9%-2
0.1%
--$2
9.6
$30.
5-3
.2%
$1.8
$2.0
-13.
2%34
-17.
5%$1
99.1
$164
.464
AP
P3A
naly
st-P
rogr
am/P
roje
ct 3
$87.
1$9
5.8
--$1
05.8
$115
.5--
-17.
7%-1
7.0%
--$2
5.4
$25.
9-1
.8%
$1.3
$1.5
-14.
0%22
7-1
4.2%
$142
.9$1
22.5
65A
SY2
Ana
lyst
-Sys
tem
s 2
$82.
5$8
9.4
--$1
02.4
$110
.6--
-19.
4%-1
9.2%
--$2
4.9
$25.
5-2
.4%
$1.2
$1.4
-15.
9%14
-16.
0%$1
37.6
$115
.566
AS
Y3A
naly
st-S
yste
ms
3$1
04.8
$115
.8--
$124
.4$1
34.0
---1
5.7%
-13.
6%--
$27.
8$2
7.6
1.0%
$1.5
$1.8
-12.
0%43
-11.
1%$1
63.3
$145
.267
AS
Y4A
naly
st-S
yste
ms
4$1
24.5
$138
.9--
$146
.4$1
61.8
---1
5.0%
-14.
1%--
$30.
3$3
0.0
0.9%
$1.8
$2.1
-11.
2%27
-11.
8%$1
93.8
$171
.068
LGL0
00_P
4_E
Atto
rney
$169
.0$2
14.6
--$1
83.4
$218
.5$3
9.3
-7.9
%-1
.8%
-100
.0%
$36.
8$3
4.9
5.3%
$2.5
$2.6
-3.8
%2
-14.
0%$2
95.3
$253
.869
AU
C3
Audi
tor-C
orpo
rate
3$1
06.5
$118
.9--
$118
.6$1
31.9
---1
0.2%
-9.8
%--
$28.
0$2
7.4
2.2%
$1.6
$1.7
-6.1
%10
-7.8
%$1
60.9
$148
.470
AU
C4
Audi
tor-C
orpo
rate
4$1
28.7
$143
.6--
$142
.9$1
57.9
---1
0.0%
-9.1
%--
$30.
7$2
9.7
3.2%
$1.9
$2.0
-5.9
%13
-7.1
%$1
89.7
$176
.271
CR
R1
Cor
pora
te R
epre
sent
ativ
e 1
$83.
0$9
1.8
--$7
8.5
$85.
0--
5.7%
8.0%
--$2
5.2
$23.
19.
0%$1
.2$1
.110
.3%
28.
3%$1
09.2
$118
.372
CR
R2
Cor
pora
te R
epre
sent
ativ
e 2
$89.
2$9
3.8
--$9
7.3
$106
.3--
-8.4
%-1
1.7%
--$2
5.2
$25.
10.
4%$1
.3$1
.4-4
.3%
2-9
.4%
$132
.8$1
20.3
73C
RR
3C
orpo
rate
Rep
rese
ntat
ive
3$1
15.6
$129
.8--
$122
.7$1
39.7
---5
.8%
-7.1
%--
$29.
2$2
8.1
3.7%
$1.7
$1.7
-1.6
%12
-5.2
%$1
69.6
$160
.774
EN
G1
Engi
neer
1$7
6.1
$79.
2--
$88.
3$9
2.7
---1
3.9%
-14.
6%--
$23.
5$2
3.9
-1.6
%$1
.1$1
.2-1
0.1%
56-1
1.9%
$117
.8$1
03.8
75E
NG
2En
gine
er 2
$93.
1$1
02.1
--$1
10.0
$116
.6--
-15.
4%-1
2.4%
--$2
6.3
$26.
01.
1%$1
.4$1
.5-1
1.6%
118
-10.
0%$1
44.1
$129
.776
EN
G3
Engi
neer
3$1
13.4
$124
.2--
$135
.7$1
42.9
---1
6.4%
-13.
0%--
$28.
7$2
8.3
1.2%
$1.7
$1.9
-12.
7%13
6-1
0.7%
$173
.1$1
54.6
77H
RC
1H
um R
es C
onsu
ltant
1$7
3.7
$78.
5--
$76.
1$8
1.9
---3
.1%
-4.1
%--
$23.
7$2
0.7
14.7
%$1
.1$1
.4-2
4.5%
9-0
.6%
$104
.0$1
03.4
78H
RC
2H
um R
es C
onsu
ltant
2$9
2.3
$101
.1--
$96.
2$1
04.4
---4
.1%
-3.1
%--
$26.
2$2
2.5
16.5
%$1
.4$1
.8-2
5.2%
170.
0%$1
28.7
$128
.779
HR
C3
Hum
Res
Con
sulta
nt 3
$112
.8$1
24.5
--$1
19.5
$131
.5--
-5.6
%-5
.4%
--$2
8.7
$24.
517
.0%
$1.7
$2.3
-26.
4%34
-2.2
%$1
58.3
$154
.880
IQC
3In
spec
tor-Q
ualit
y C
ontro
l 3$8
3.8
$92.
0--
$97.
0$1
03.5
---1
3.6%
-11.
0%--
$25.
3$2
4.8
1.8%
$1.2
$1.4
-9.8
%19
-8.6
%$1
29.6
$118
.581
ITS2
IT S
peci
alis
t/Eng
inee
r 2$8
5.4
$91.
4--
$90.
7$9
7.0
---5
.8%
-5.8
%--
$24.
8$2
4.3
2.4%
$1.3
$1.3
-1.7
%7
-4.1
%$1
22.5
$117
.582
ITS3
IT S
peci
alis
t/Eng
inee
r 3$1
05.9
$117
.5--
$109
.4$1
18.6
---3
.2%
-0.9
%--
$27.
8$2
6.2
6.1%
$1.6
$1.5
1.1%
620.
4%$1
46.3
$146
.983
ITS4
IT S
peci
alis
t/Eng
inee
r 4$1
22.8
$136
.6--
$132
.6$1
45.3
---7
.4%
-6.0
%--
$30.
0$2
8.6
4.9%
$1.8
$1.9
-3.3
%11
3-4
.2%
$175
.8$1
68.5
84IT
S5IT
Spe
cial
ist/E
ngin
eer 5
$142
.7$1
73.0
--$1
64.3
$185
.5--
-13.
2%-6
.7%
--$3
3.8
$32.
15.
4%$2
.1$2
.3-9
.3%
35-5
.0%
$219
.9$2
08.9
85LS
A3La
nd S
ervi
ces
Age
nt 3
$75.
8$8
1.5
--$9
8.9
$110
.4--
-23.
4%-2
6.1%
--$2
3.8
$28.
0-1
5.0%
$1.1
$0.9
21.2
%24
-23.
6%$1
39.3
$106
.486
LSA4
Land
Ser
vice
s A
gent
4$9
3.2
$100
.9--
$123
.8$1
40.1
---2
4.7%
-28.
0%--
$26.
1$3
1.1
-15.
9%$1
.4$1
.219
.2%
21-2
5.5%
$172
.4$1
28.4
87M
PC
1M
anag
er-P
rogr
am/C
ontra
ct 1
$77.
1$8
4.3
--$9
0.1
$95.
8--
-14.
4%-1
2.0%
--$2
4.2
$24.
20.
1%$1
.1$1
.3-1
0.7%
30-9
.6%
$121
.2$1
09.6
88M
PC
2M
anag
er-P
rogr
am/C
ontra
ct 2
$100
.4$1
10.9
--$1
16.1
$126
.4--
-13.
5%-1
2.3%
--$2
7.2
$26.
91.
2%$1
.5$1
.6-9
.7%
125
-9.9
%$1
54.9
$139
.589
MP
C3
Man
ager
-Pro
gram
/Con
tract
3$1
15.4
$127
.1--
$141
.5$1
49.5
---1
8.4%
-15.
0%--
$28.
8$2
9.0
-0.5
%$1
.7$2
.0-1
4.8%
87-1
2.7%
$180
.5$1
57.6
90M
PP
1M
anag
er-P
roje
ct/P
rodu
ct 1
$110
.9$1
22.9
--$1
29.2
$143
.4--
-14.
1%-1
4.3%
--$2
8.5
$28.
40.
2%$1
.6$1
.8-1
0.3%
644
-11.
9%$1
73.6
$153
.091
PLA
2Pl
anne
r 2$1
00.6
$113
.8--
$103
.3$1
07.9
---2
.7%
5.5%
--$2
7.6
$25.
29.
2%$1
.5$1
.51.
6%20
26.
1%$1
34.6
$142
.992
PLA
3Pl
anne
r 3$1
19.5
$135
.8--
$128
.0$1
34.2
---6
.6%
1.1%
--$2
9.9
$27.
68.
5%$1
.8$1
.8-2
.5%
842.
3%$1
63.6
$167
.493
SE
S3S
afet
y &
Env
ironm
enta
l Spe
cial
ist 3
$113
.0$1
25.3
--$1
20.2
$132
.1--
-6.1
%-5
.2%
--$2
8.8
$27.
45.
2%$1
.7$1
.7-1
.8%
27-3
.4%
$161
.2$1
55.8
94LG
L000
_P5_
ES
enio
r Atto
rney
$192
.1$2
66.3
--$2
09.3
$263
.3$5
5.8
-8.2
%1.
1%-1
00.0
%$3
9.3
$38.
52.
0%$2
.8$2
.9-4
.1%
61-1
4.5%
$360
.6$3
08.4
95E
NG
4Se
nior
Eng
inee
r$1
39.4
$154
.3--
$168
.7$1
77.8
---1
7.4%
-13.
2%--
$31.
5$3
1.3
0.7%
$2.1
$2.4
-13.
7%12
9-1
1.1%
$211
.4$1
87.9
96
4320
18 G
ener
al R
ate
Cas
e
Rep
rese
nts
aver
age
pay
data
for S
CE
and
com
para
tor (
mar
ket)
data
.
44
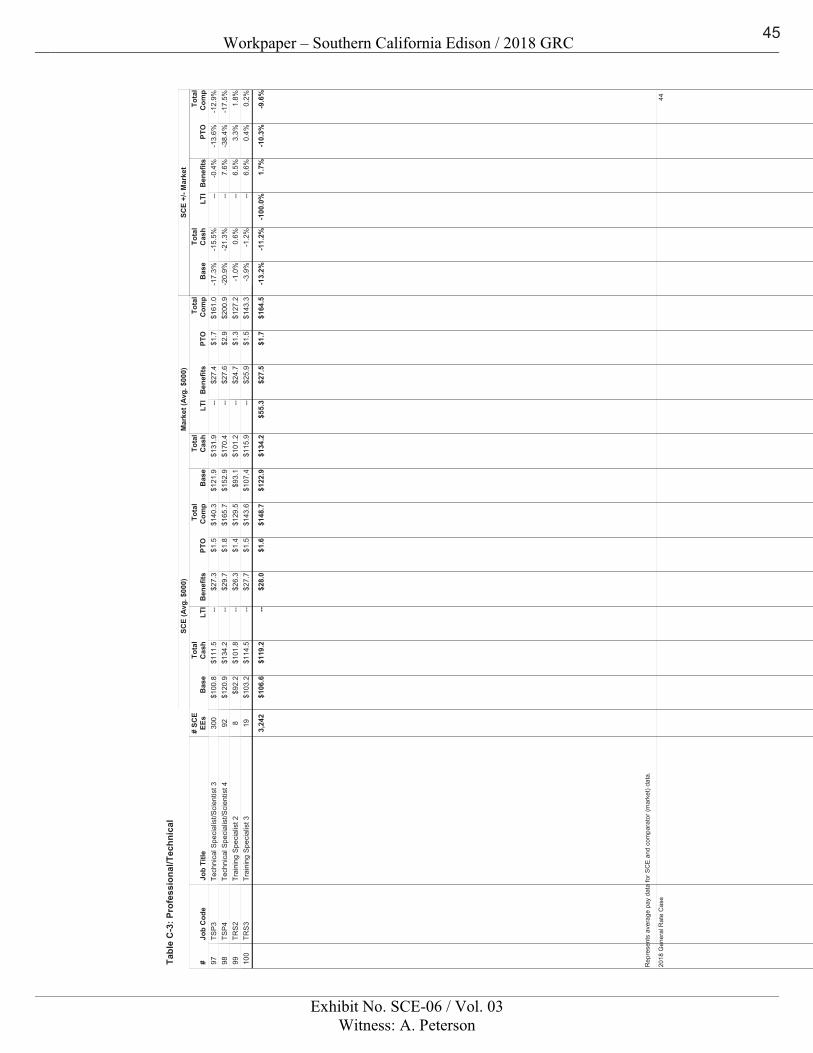
Workpaper – Southern California Edison / 2018 GRC
Exhibit No. SCE-06 / Vol. 03Witness: A. Peterson
Job
Cod
eB
ase
SCE
(Avg
. $00
0)To
tal
Cas
hLT
IB
enef
itsPT
O#
SCE
EEs
Bas
e
Mar
ket (
Avg.
$00
0)To
tal
Cas
hLT
IB
enef
itsPT
OB
ase
SCE
+/- M
arke
tTo
tal
Cas
hLT
IB
enef
itsPT
O
Tab
le C
-3: P
rofe
ssio
nal/T
echn
ical
Tota
lC
omp
Tota
lC
omp
Tota
lC
omp
Job
Title
#TS
P3
Tech
nica
l Spe
cial
ist/S
cien
tist 3
$100
.8$1
11.5
--$1
21.9
$131
.9--
-17.
3%-1
5.5%
--$2
7.3
$27.
4-0
.4%
$1.5
$1.7
-13.
6%30
0-1
2.9%
$161
.0$1
40.3
97TS
P4
Tech
nica
l Spe
cial
ist/S
cien
tist 4
$120
.9$1
34.2
--$1
52.9
$170
.4--
-20.
9%-2
1.3%
--$2
9.7
$27.
67.
6%$1
.8$2
.9-3
8.4%
92-1
7.5%
$200
.9$1
65.7
98TR
S2
Trai
ning
Spe
cial
ist 2
$92.
2$1
01.8
--$9
3.1
$101
.2--
-1.0
%0.
6%--
$26.
3$2
4.7
6.5%
$1.4
$1.3
3.3%
81.
8%$1
27.2
$129
.599
TRS
3Tr
aini
ng S
peci
alis
t 3$1
03.2
$114
.5--
$107
.4$1
15.9
---3
.9%
-1.2
%--
$27.
7$2
5.9
6.6%
$1.5
$1.5
0.4%
190.
2%$1
43.3
$143
.610
0
$106
.6$1
19.2
--$1
22.9
$134
.2$5
5.3
-13.
2%-1
1.2%
-100
.0%
$28.
0$2
7.5
1.7%
$1.6
$1.7
-10.
3%3,
242
-9.6
%$1
64.5
$148
.7
4420
18 G
ener
al R
ate
Cas
e
Rep
rese
nts
aver
age
pay
data
for S
CE
and
com
para
tor (
mar
ket)
data
.
45
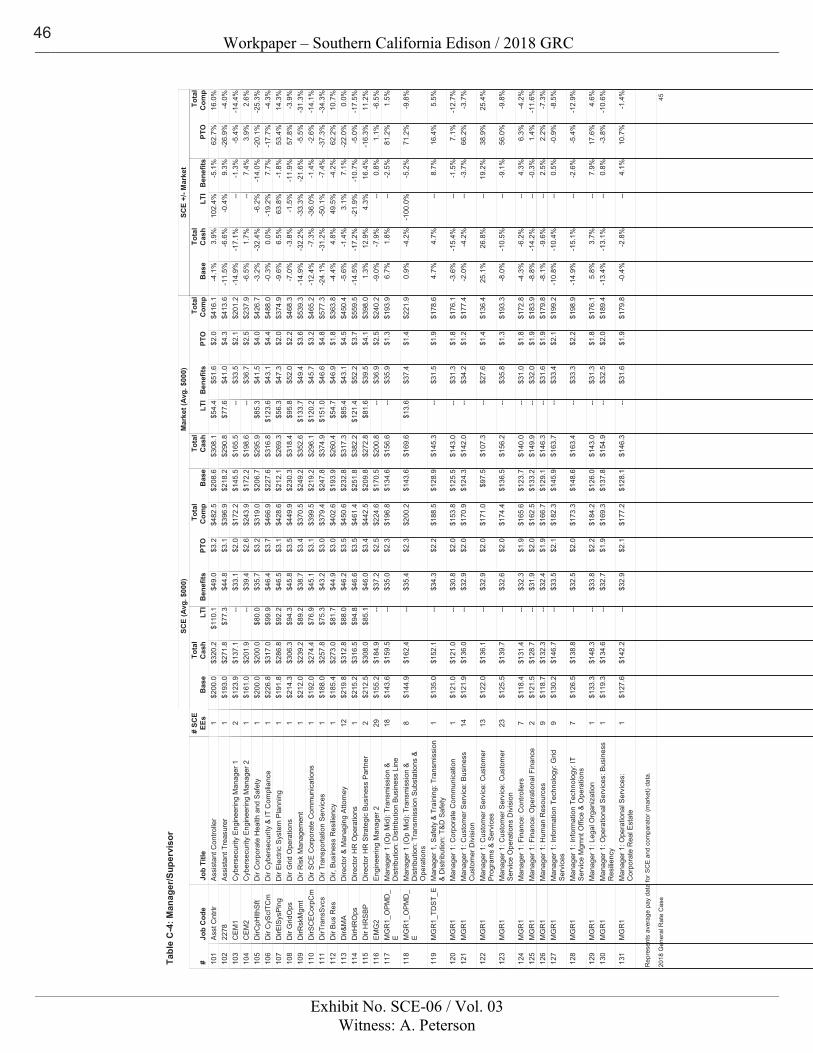
Workpaper – Southern California Edison / 2018 GRC
Exhibit No. SCE-06 / Vol. 03Witness: A. Peterson
Job
Cod
eB
ase
SCE
(Avg
. $00
0)To
tal
Cas
hLT
IB
enef
itsPT
O#
SCE
EEs
Bas
e
Mar
ket (
Avg.
$00
0)To
tal
Cas
hLT
IB
enef
itsPT
OB
ase
SCE
+/- M
arke
tTo
tal
Cas
hLT
IB
enef
itsPT
O
Tab
le C
-4: M
anag
er/S
uper
viso
r
Tota
lC
omp
Tota
lC
omp
Tota
lC
omp
Job
Title
#A
sst C
ntrlr
Ass
ista
nt C
ontro
ller
$200
.0$3
20.2
$110
.1$2
08.6
$308
.1$5
4.4
-4.1
%3.
9%10
2.4%
$49.
0$5
1.6
-5.1
%$3
.2$2
.062
.7%
116
.0%
$416
.1$4
82.5
101
2278
Ass
ista
nt T
reas
urer
$193
.0$2
71.8
$77.
3$2
18.2
$290
.8$7
7.6
-11.
5%-6
.6%
-0.4
%$4
4.8
$41.
09.
3%$3
.1$4
.3-2
6.9%
1-4
.0%
$413
.6$3
96.9
102
CE
M1
Cyb
erse
curit
y En
gine
erin
g M
anag
er 1
$123
.9$1
37.1
--$1
45.5
$165
.5--
-14.
9%-1
7.1%
--$3
3.1
$33.
5-1
.3%
$2.0
$2.1
-5.4
%2
-14.
4%$2
01.2
$172
.210
3C
EM
2C
yber
secu
rity
Engi
neer
ing
Man
ager
2$1
61.0
$201
.9--
$172
.2$1
98.6
---6
.5%
1.7%
--$3
9.4
$36.
77.
4%$2
.6$2
.53.
9%1
2.6%
$237
.9$2
43.9
104
DirC
pHlth
Sft
Dir
Cor
pora
te H
ealth
and
Saf
ety
$200
.0$2
00.0
$80.
0$2
06.7
$295
.9$8
5.3
-3.2
%-3
2.4%
-6.2
%$3
5.7
$41.
5-1
4.0%
$3.2
$4.0
-20.
1%1
-25.
3%$4
26.7
$319
.010
5D
ir C
yScI
TCm
Dir
Cyb
erse
curit
y &
IT C
ompl
ianc
e$2
26.8
$317
.0$9
9.9
$227
.6$3
16.8
$123
.6-0
.3%
0.0%
-19.
2%$4
6.4
$43.
17.
7%$3
.7$4
.4-1
7.7%
1-4
.3%
$488
.0$4
66.9
106
DirE
lSys
Pln
gD
ir E
lect
ric S
yste
m P
lann
ing
$191
.8$2
86.8
$92.
2$2
12.1
$269
.3$5
6.3
-9.6
%6.
5%63
.8%
$46.
5$4
7.3
-1.8
%$3
.1$2
.053
.4%
114
.3%
$374
.9$4
28.6
107
Dir
Grid
Ops
Dir
Grid
Ope
ratio
ns$2
14.3
$306
.3$9
4.3
$230
.3$3
18.4
$95.
8-7
.0%
-3.8
%-1
.5%
$45.
8$5
2.0
-11.
9%$3
.5$2
.257
.8%
1-3
.9%
$468
.3$4
49.9
108
DirR
skM
gmt
Dir
Ris
k M
anag
emen
t$2
12.0
$239
.2$8
9.2
$249
.2$3
52.6
$133
.7-1
4.9%
-32.
2%-3
3.3%
$38.
7$4
9.4
-21.
6%$3
.4$3
.6-5
.5%
1-3
1.3%
$539
.3$3
70.5
109
DirS
CE
Cor
pCm
Dir
SC
E C
orpo
rate
Com
mun
icat
ions
$192
.0$2
74.4
$76.
9$2
19.2
$296
.1$1
20.2
-12.
4%-7
.3%
-36.
0%$4
5.1
$45.
7-1
.4%
$3.1
$3.2
-2.6
%1
-14.
1%$4
65.2
$399
.511
0D
irTra
nsS
vcs
Dir
Tran
spor
tatio
n S
ervi
ces
$188
.0$2
57.8
$75.
3$2
47.8
$374
.9$1
51.0
-24.
1%-3
1.2%
-50.
1%$4
3.2
$46.
6-7
.4%
$3.0
$4.8
-37.
3%1
-34.
3%$5
77.3
$379
.411
1D
ir B
us R
esD
ir, B
usin
ess
Res
ilienc
y$1
85.4
$273
.0$8
1.7
$193
.9$2
60.4
$54.
7-4
.4%
4.8%
49.5
%$4
4.9
$46.
9-4
.2%
$3.0
$1.8
62.2
%1
10.7
%$3
63.8
$402
.611
2D
ir&M
AD
irect
or &
Man
agin
g A
ttorn
ey$2
19.8
$312
.8$8
8.0
$232
.8$3
17.3
$85.
4-5
.6%
-1.4
%3.
1%$4
6.2
$43.
17.
1%$3
.5$4
.5-2
2.0%
120.
0%$4
50.4
$450
.611
3D
irHR
Ops
Dire
ctor
HR
Ope
ratio
ns$2
15.2
$316
.5$9
4.8
$251
.8$3
82.2
$121
.4-1
4.5%
-17.
2%-2
1.9%
$46.
6$5
2.2
-10.
7%$3
.5$3
.7-5
.0%
1-1
7.5%
$559
.5$4
61.4
114
Dir
HR
SB
PD
irect
or H
R S
trate
gic
Bus
ines
s P
artn
er$2
12.5
$308
.0$8
5.1
$209
.8$2
72.8
$81.
61.
3%12
.9%
4.3%
$46.
0$3
9.5
16.4
%$3
.4$4
.1-1
6.3%
211
.2%
$398
.0$4
42.5
115
EM
G2
Engi
neer
ing
Man
ager
2$1
55.2
$184
.9--
$170
.5$2
00.8
---9
.0%
-7.9
%--
$37.
2$3
6.9
0.8%
$2.5
$2.5
1.1%
29-6
.5%
$240
.2$2
24.6
116
MG
R1_
OPM
D_
EM
anag
er 1
(Op
Mid
): Tr
ansm
issi
on &
D
istri
butio
n: D
istri
butio
n B
usin
ess
Line
$143
.6$1
59.5
--$1
34.6
$156
.6--
6.7%
1.8%
--$3
5.0
$35.
9-2
.5%
$2.3
$1.3
81.2
%18
1.5%
$193
.9$1
96.8
117
MG
R1_
OPM
D_
EM
anag
er 1
(Op
Mid
): Tr
ansm
issi
on &
D
istri
butio
n: T
rans
mis
sion
Sub
stat
ions
&
Ope
ratio
ns
$144
.9$1
62.4
--$1
43.6
$169
.6$1
3.6
0.9%
-4.2
%-1
00.0
%$3
5.4
$37.
4-5
.2%
$2.3
$1.4
71.2
%8
-9.8
%$2
21.9
$200
.211
8
MG
R1_
TDS
T_E
Man
ager
1, S
afet
y &
Tra
inin
g: T
rans
mis
sion
&
Dis
tribu
tion:
T&D
Saf
ety
$135
.0$1
52.1
--$1
28.9
$145
.3--
4.7%
4.7%
--$3
4.3
$31.
58.
7%$2
.2$1
.916
.4%
15.
5%$1
78.6
$188
.511
9
MG
R1
Man
ager
1: C
orpo
rate
Com
mun
icat
ion
$121
.0$1
21.0
--$1
25.5
$143
.0--
-3.6
%-1
5.4%
--$3
0.8
$31.
3-1
.5%
$2.0
$1.8
7.1%
1-1
2.7%
$176
.1$1
53.8
120
MG
R1
Man
ager
1: C
usto
mer
Ser
vice
: Bus
ines
s C
usto
mer
Div
isio
n$1
21.9
$136
.0--
$124
.3$1
42.0
---2
.0%
-4.2
%--
$32.
9$3
4.2
-3.7
%$2
.0$1
.266
.2%
14-3
.7%
$177
.4$1
70.9
121
MG
R1
Man
ager
1: C
usto
mer
Ser
vice
: Cus
tom
er
Pro
gram
s &
Ser
vice
s$1
22.0
$136
.1--
$97.
5$1
07.3
--25
.1%
26.8
%--
$32.
9$2
7.6
19.2
%$2
.0$1
.438
.9%
1325
.4%
$136
.4$1
71.0
122
MG
R1
Man
ager
1: C
usto
mer
Ser
vice
: Cus
tom
er
Ser
vice
Ope
ratio
ns D
ivis
ion
$125
.5$1
39.7
--$1
36.5
$156
.2--
-8.0
%-1
0.5%
--$3
2.6
$35.
8-9
.1%
$2.0
$1.3
56.0
%23
-9.8
%$1
93.3
$174
.412
3
MG
R1
Man
ager
1: F
inan
ce: C
ontro
llers
$118
.4$1
31.4
--$1
23.7
$140
.0--
-4.3
%-6
.2%
--$3
2.3
$31.
04.
3%$1
.9$1
.86.
3%7
-4.2
%$1
72.8
$165
.612
4M
GR
1M
anag
er 1
: Fin
ance
: Ope
ratio
nal F
inan
ce$1
21.5
$128
.7--
$133
.2$1
49.9
---8
.8%
-14.
2%--
$31.
9$3
2.0
-0.3
%$2
.0$1
.91.
4%2
-11.
6%$1
83.9
$162
.512
5M
GR
1M
anag
er 1
: Hum
an R
esou
rces
$118
.7$1
32.3
--$1
29.1
$146
.3--
-8.1
%-9
.6%
--$3
2.4
$31.
62.
5%$1
.9$1
.92.
2%9
-7.3
%$1
79.8
$166
.712
6M
GR
1M
anag
er 1
: Inf
orm
atio
n Te
chno
logy
: Grid
S
ervi
ces
$130
.2$1
46.7
--$1
45.9
$163
.7--
-10.
8%-1
0.4%
--$3
3.5
$33.
40.
5%$2
.1$2
.1-0
.9%
9-8
.5%
$199
.2$1
82.3
127
MG
R1
Man
ager
1: I
nfor
mat
ion
Tech
nolo
gy: I
T S
ervi
ce M
gmnt
Offi
ce &
Ope
ratio
ns$1
26.5
$138
.8--
$148
.6$1
63.4
---1
4.9%
-15.
1%--
$32.
5$3
3.3
-2.6
%$2
.0$2
.2-5
.4%
7-1
2.9%
$198
.9$1
73.3
128
MG
R1
Man
ager
1: L
egal
Org
aniz
atio
n$1
33.3
$148
.3--
$126
.0$1
43.0
--5.
8%3.
7%--
$33.
8$3
1.3
7.9%
$2.2
$1.8
17.6
%1
4.6%
$176
.1$1
84.2
129
MG
R1
Man
ager
1: O
pera
tiona
l Ser
vice
s: B
usin
ess
Res
ilien
cy$1
19.3
$134
.6--
$137
.8$1
54.9
---1
3.4%
-13.
1%--
$32.
7$3
2.5
0.8%
$1.9
$2.0
-3.8
%1
-10.
6%$1
89.4
$169
.313
0
MG
R1
Man
ager
1: O
pera
tiona
l Ser
vice
s:
Cor
pora
te R
eal E
stat
e$1
27.6
$142
.2--
$128
.1$1
46.3
---0
.4%
-2.8
%--
$32.
9$3
1.6
4.1%
$2.1
$1.9
10.7
%1
-1.4
%$1
79.8
$177
.213
1
4520
18 G
ener
al R
ate
Cas
e
Rep
rese
nts
aver
age
pay
data
for S
CE
and
com
para
tor (
mar
ket)
data
.
46
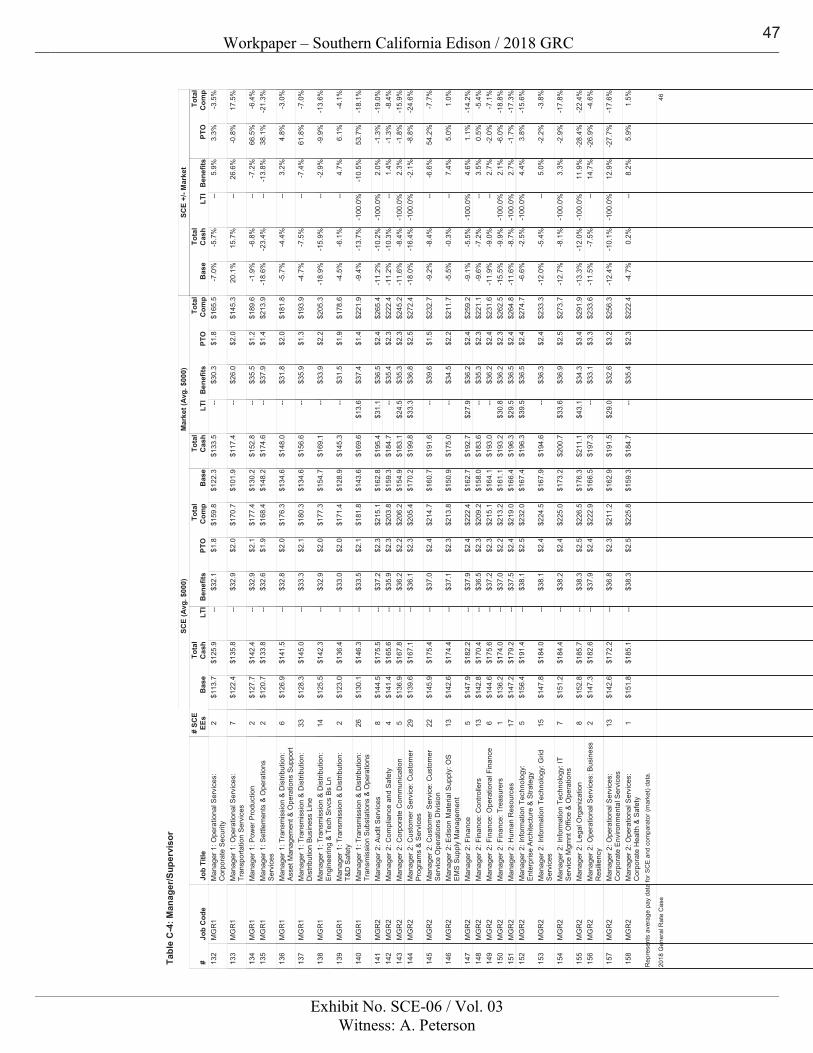
Workpaper – Southern California Edison / 2018 GRC
Exhibit No. SCE-06 / Vol. 03Witness: A. Peterson
Job
Cod
eB
ase
SCE
(Avg
. $00
0)To
tal
Cas
hLT
IB
enef
itsPT
O#
SCE
EEs
Bas
e
Mar
ket (
Avg.
$00
0)To
tal
Cas
hLT
IB
enef
itsPT
OB
ase
SCE
+/- M
arke
tTo
tal
Cas
hLT
IB
enef
itsPT
O
Tab
le C
-4: M
anag
er/S
uper
viso
r
Tota
lC
omp
Tota
lC
omp
Tota
lC
omp
Job
Title
#M
GR
1M
anag
er 1
: Ope
ratio
nal S
ervi
ces:
C
orpo
rate
Sec
urity
$113
.7$1
25.9
--$1
22.3
$133
.5--
-7.0
%-5
.7%
--$3
2.1
$30.
35.
9%$1
.8$1
.83.
3%2
-3.5
%$1
65.5
$159
.813
2
MG
R1
Man
ager
1: O
pera
tiona
l Ser
vice
s:
Tran
spor
tatio
n S
ervi
ces
$122
.4$1
35.8
--$1
01.9
$117
.4--
20.1
%15
.7%
--$3
2.9
$26.
026
.6%
$2.0
$2.0
-0.8
%7
17.5
%$1
45.3
$170
.713
3
MG
R1
Man
ager
1: P
ower
Pro
duct
ion
$127
.7$1
42.4
--$1
30.2
$152
.8--
-1.9
%-6
.8%
--$3
2.9
$35.
5-7
.2%
$2.1
$1.2
66.5
%2
-6.4
%$1
89.6
$177
.413
4M
GR
1M
anag
er 1
: Set
tlem
ents
& O
pera
tions
S
ervi
ces
$120
.7$1
33.8
--$1
48.2
$174
.6--
-18.
6%-2
3.4%
--$3
2.6
$37.
9-1
3.8%
$1.9
$1.4
38.1
%2
-21.
3%$2
13.9
$168
.413
5
MG
R1
Man
ager
1: T
rans
mis
sion
& D
istri
butio
n:
Ass
et M
anag
emen
t & O
pera
tions
Sup
port
$126
.9$1
41.5
--$1
34.6
$148
.0--
-5.7
%-4
.4%
--$3
2.8
$31.
83.
2%$2
.0$2
.04.
8%6
-3.0
%$1
81.8
$176
.313
6
MG
R1
Man
ager
1: T
rans
mis
sion
& D
istri
butio
n:
Dis
tribu
tion
Bus
ines
s Li
ne$1
28.3
$145
.0--
$134
.6$1
56.6
---4
.7%
-7.5
%--
$33.
3$3
5.9
-7.4
%$2
.1$1
.361
.8%
33-7
.0%
$193
.9$1
80.3
137
MG
R1
Man
ager
1: T
rans
mis
sion
& D
istri
butio
n:
Eng
inee
ring
& Te
ch S
rvcs
Bs
Ln$1
25.5
$142
.3--
$154
.7$1
69.1
---1
8.9%
-15.
9%--
$32.
9$3
3.9
-2.9
%$2
.0$2
.2-9
.9%
14-1
3.6%
$205
.3$1
77.3
138
MG
R1
Man
ager
1: T
rans
mis
sion
& D
istri
butio
n:
T&D
Saf
ety
$123
.0$1
36.4
--$1
28.9
$145
.3--
-4.5
%-6
.1%
--$3
3.0
$31.
54.
7%$2
.0$1
.96.
1%2
-4.1
%$1
78.6
$171
.413
9
MG
R1
Man
ager
1: T
rans
mis
sion
& D
istri
butio
n:
Tran
smis
sion
Sub
stat
ions
& O
pera
tions
$130
.1$1
46.3
--$1
43.6
$169
.6$1
3.6
-9.4
%-1
3.7%
-100
.0%
$33.
5$3
7.4
-10.
5%$2
.1$1
.453
.7%
26-1
8.1%
$221
.9$1
81.8
140
MG
R2
Man
ager
2: A
udit
Ser
vice
s$1
44.5
$175
.5--
$162
.8$1
95.4
$31.
1-1
1.2%
-10.
2%-1
00.0
%$3
7.2
$36.
52.
0%$2
.3$2
.4-1
.3%
8-1
9.0%
$265
.4$2
15.1
141
MG
R2
Man
ager
2: C
ompl
ianc
e an
d S
afet
y$1
41.4
$165
.6--
$159
.3$1
84.7
---1
1.2%
-10.
3%--
$35.
9$3
5.4
1.4%
$2.3
$2.3
-1.3
%4
-8.4
%$2
22.4
$203
.814
2M
GR
2M
anag
er 2
: Cor
pora
te C
omm
unic
atio
n$1
36.9
$167
.8--
$154
.9$1
83.1
$24.
5-1
1.6%
-8.4
%-1
00.0
%$3
6.2
$35.
32.
3%$2
.2$2
.3-1
.8%
5-1
5.9%
$245
.2$2
06.2
143
MG
R2
Man
ager
2: C
usto
mer
Ser
vice
: Cus
tom
er
Pro
gram
s &
Ser
vice
s$1
39.6
$167
.1--
$170
.2$1
99.8
$33.
3-1
8.0%
-16.
4%-1
00.0
%$3
6.1
$36.
8-2
.1%
$2.3
$2.5
-8.8
%29
-24.
6%$2
72.4
$205
.414
4
MG
R2
Man
ager
2: C
usto
mer
Ser
vice
: Cus
tom
er
Ser
vice
Ope
ratio
ns D
ivis
ion
$145
.9$1
75.4
--$1
60.7
$191
.6--
-9.2
%-8
.4%
--$3
7.0
$39.
6-6
.6%
$2.4
$1.5
54.2
%22
-7.7
%$2
32.7
$214
.714
5
MG
R2
Man
ager
2: E
diso
n M
ater
ial S
uppl
y: O
S
EM
S S
uppl
y M
anag
emen
t$1
42.6
$174
.4--
$150
.9$1
75.0
---5
.5%
-0.3
%--
$37.
1$3
4.5
7.4%
$2.3
$2.2
5.0%
131.
0%$2
11.7
$213
.814
6
MG
R2
Man
ager
2: F
inan
ce$1
47.9
$182
.2--
$162
.7$1
92.7
$27.
9-9
.1%
-5.5
%-1
00.0
%$3
7.9
$36.
24.
6%$2
.4$2
.41.
1%5
-14.
2%$2
59.2
$222
.414
7M
GR
2M
anag
er 2
: Fin
ance
: Con
trolle
rs$1
42.8
$170
.4--
$158
.0$1
83.6
---9
.6%
-7.2
%--
$36.
5$3
5.3
3.5%
$2.3
$2.3
0.5%
13-5
.4%
$221
.1$2
09.2
148
MG
R2
Man
ager
2: F
inan
ce: O
pera
tiona
l Fin
ance
$144
.6$1
75.6
--$1
64.1
$193
.0--
-11.
9%-9
.0%
--$3
7.2
$36.
22.
7%$2
.3$2
.4-2
.0%
6-7
.1%
$231
.6$2
15.1
149
MG
R2
Man
ager
2: F
inan
ce: T
reas
urer
s$1
36.2
$174
.0--
$161
.1$1
93.2
$30.
8-1
5.5%
-9.9
%-1
00.0
%$3
7.0
$36.
22.
1%$2
.2$2
.3-6
.0%
1-1
8.8%
$262
.5$2
13.2
150
MG
R2
Man
ager
2: H
uman
Res
ourc
es$1
47.2
$179
.2--
$166
.4$1
96.3
$29.
5-1
1.6%
-8.7
%-1
00.0
%$3
7.5
$36.
52.
7%$2
.4$2
.4-1
.7%
17-1
7.3%
$264
.8$2
19.0
151
MG
R2
Man
ager
2: I
nfor
mat
ion
Tech
nolo
gy:
Ent
erpr
ise
Arc
hite
ctur
e &
Stra
tegy
$156
.4$1
91.4
--$1
67.4
$196
.3$3
9.5
-6.6
%-2
.5%
-100
.0%
$38.
1$3
6.5
4.4%
$2.5
$2.4
3.8%
5-1
5.6%
$274
.7$2
32.0
152
MG
R2
Man
ager
2: I
nfor
mat
ion
Tech
nolo
gy: G
rid
Ser
vice
s$1
47.8
$184
.0--
$167
.9$1
94.6
---1
2.0%
-5.4
%--
$38.
1$3
6.3
5.0%
$2.4
$2.4
-2.2
%15
-3.8
%$2
33.3
$224
.515
3
MG
R2
Man
ager
2: I
nfor
mat
ion
Tech
nolo
gy: I
T S
ervi
ce M
gmnt
Offi
ce &
Ope
ratio
ns$1
51.2
$184
.4--
$173
.2$2
00.7
$33.
6-1
2.7%
-8.1
%-1
00.0
%$3
8.2
$36.
93.
3%$2
.4$2
.5-2
.9%
7-1
7.8%
$273
.7$2
25.0
154
MG
R2
Man
ager
2: L
egal
Org
aniz
atio
n$1
52.8
$185
.7--
$176
.3$2
11.1
$43.
1-1
3.3%
-12.
0%-1
00.0
%$3
8.3
$34.
311
.9%
$2.5
$3.4
-28.
4%8
-22.
4%$2
91.9
$226
.515
5M
GR
2M
anag
er 2
: Ope
ratio
nal S
ervi
ces:
Bus
ines
s R
esili
ency
$147
.3$1
82.6
--$1
66.5
$197
.3--
-11.
5%-7
.5%
--$3
7.9
$33.
114
.7%
$2.4
$3.3
-26.
9%2
-4.6
%$2
33.6
$222
.915
6
MG
R2
Man
ager
2: O
pera
tiona
l Ser
vice
s:
Cor
pora
te E
nviro
nmen
tal S
ervi
ces
$142
.6$1
72.2
--$1
62.9
$191
.5$2
9.0
-12.
4%-1
0.1%
-100
.0%
$36.
8$3
2.6
12.9
%$2
.3$3
.2-2
7.7%
13-1
7.6%
$256
.3$2
11.2
157
MG
R2
Man
ager
2: O
pera
tiona
l Ser
vice
s:
Cor
pora
te H
ealth
& S
afet
y$1
51.8
$185
.1--
$159
.3$1
84.7
---4
.7%
0.2%
--$3
8.3
$35.
48.
2%$2
.5$2
.35.
9%1
1.5%
$222
.4$2
25.8
158
4620
18 G
ener
al R
ate
Cas
e
Rep
rese
nts
aver
age
pay
data
for S
CE
and
com
para
tor (
mar
ket)
data
.
47
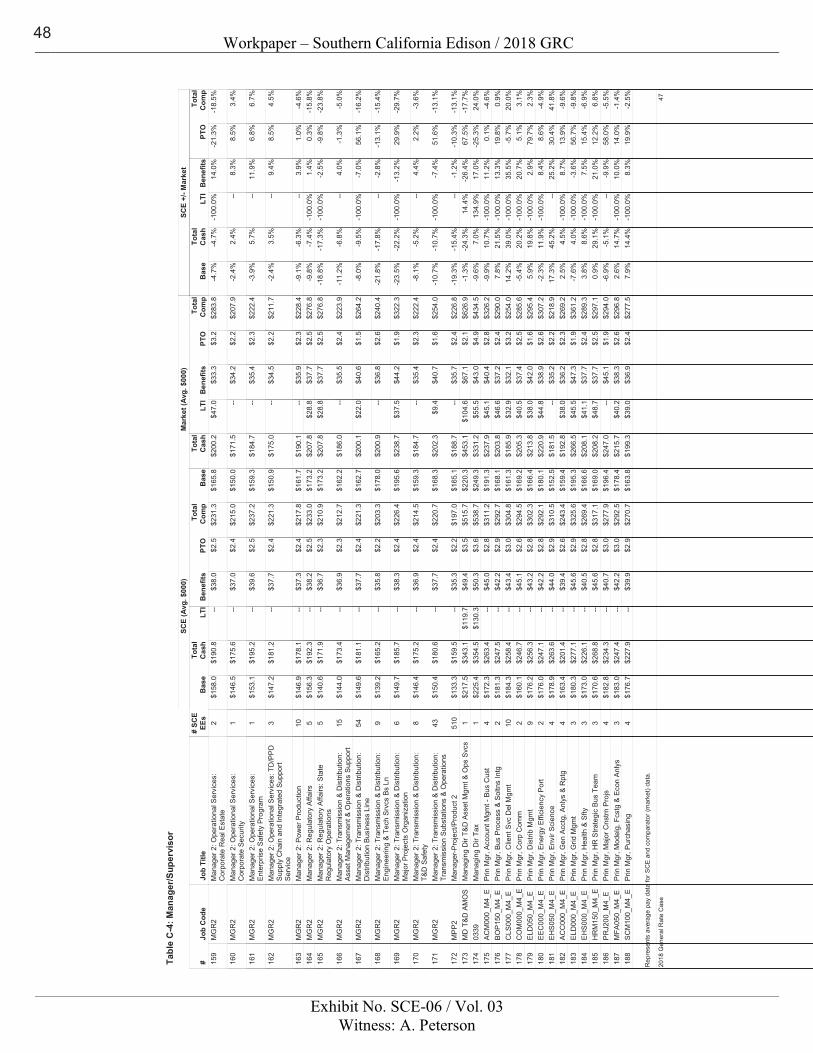
Workpaper – Southern California Edison / 2018 GRC
Exhibit No. SCE-06 / Vol. 03Witness: A. Peterson
Job
Cod
eB
ase
SCE
(Avg
. $00
0)To
tal
Cas
hLT
IB
enef
itsPT
O#
SCE
EEs
Bas
e
Mar
ket (
Avg.
$00
0)To
tal
Cas
hLT
IB
enef
itsPT
OB
ase
SCE
+/- M
arke
tTo
tal
Cas
hLT
IB
enef
itsPT
O
Tab
le C
-4: M
anag
er/S
uper
viso
r
Tota
lC
omp
Tota
lC
omp
Tota
lC
omp
Job
Title
#M
GR
2M
anag
er 2
: Ope
ratio
nal S
ervi
ces:
C
orpo
rate
Rea
l Est
ate
$158
.0$1
90.8
--$1
65.8
$200
.2$4
7.0
-4.7
%-4
.7%
-100
.0%
$38.
0$3
3.3
14.0
%$2
.5$3
.2-2
1.3%
2-1
8.5%
$283
.8$2
31.3
159
MG
R2
Man
ager
2: O
pera
tiona
l Ser
vice
s:
Cor
pora
te S
ecur
ity$1
46.5
$175
.6--
$150
.0$1
71.5
---2
.4%
2.4%
--$3
7.0
$34.
28.
3%$2
.4$2
.28.
5%1
3.4%
$207
.9$2
15.0
160
MG
R2
Man
ager
2: O
pera
tiona
l Ser
vice
s:
Ent
erpr
ise
Saf
ety
Pro
gram
$153
.1$1
95.2
--$1
59.3
$184
.7--
-3.9
%5.
7%--
$39.
6$3
5.4
11.9
%$2
.5$2
.36.
8%1
6.7%
$222
.4$2
37.2
161
MG
R2
Man
ager
2: O
pera
tiona
l Ser
vice
s: T
D/P
PD
S
uppl
y C
hain
and
Inte
grat
ed S
uppo
rt S
ervi
ce
$147
.2$1
81.2
--$1
50.9
$175
.0--
-2.4
%3.
5%--
$37.
7$3
4.5
9.4%
$2.4
$2.2
8.5%
34.
5%$2
11.7
$221
.316
2
MG
R2
Man
ager
2: P
ower
Pro
duct
ion
$146
.9$1
78.1
--$1
61.7
$190
.1--
-9.1
%-6
.3%
--$3
7.3
$35.
93.
9%$2
.4$2
.31.
0%10
-4.6
%$2
28.4
$217
.816
3M
GR
2M
anag
er 2
: Reg
ulat
ory
Affa
irs$1
56.3
$192
.3--
$173
.2$2
07.8
$28.
8-9
.8%
-7.4
%-1
00.0
%$3
8.2
$37.
71.
4%$2
.5$2
.50.
3%5
-15.
8%$2
76.8
$233
.016
4M
GR
2M
anag
er 2
: Reg
ulat
ory
Affa
irs: S
tate
R
egul
ator
y O
pera
tions
$140
.6$1
71.9
--$1
73.2
$207
.8$2
8.8
-18.
8%-1
7.3%
-100
.0%
$36.
7$3
7.7
-2.5
%$2
.3$2
.5-9
.8%
5-2
3.8%
$276
.8$2
10.9
165
MG
R2
Man
ager
2: T
rans
mis
sion
& D
istri
butio
n:
Ass
et M
anag
emen
t & O
pera
tions
Sup
port
$144
.0$1
73.4
--$1
62.2
$186
.0--
-11.
2%-6
.8%
--$3
6.9
$35.
54.
0%$2
.3$2
.4-1
.3%
15-5
.0%
$223
.9$2
12.7
166
MG
R2
Man
ager
2: T
rans
mis
sion
& D
istri
butio
n:
Dis
tribu
tion
Bus
ines
s Li
ne$1
49.6
$181
.1--
$162
.7$2
00.1
$22.
0-8
.0%
-9.5
%-1
00.0
%$3
7.7
$40.
6-7
.0%
$2.4
$1.5
56.1
%54
-16.
2%$2
64.2
$221
.316
7
MG
R2
Man
ager
2: T
rans
mis
sion
& D
istri
butio
n:
Eng
inee
ring
& Te
ch S
rvcs
Bs
Ln$1
39.2
$165
.2--
$178
.0$2
00.9
---2
1.8%
-17.
8%--
$35.
8$3
6.8
-2.8
%$2
.2$2
.6-1
3.1%
9-1
5.4%
$240
.4$2
03.3
168
MG
R2
Man
ager
2: T
rans
mis
sion
& D
istri
butio
n:
Maj
or P
roje
cts
Org
aniz
atio
n$1
49.7
$185
.7--
$195
.6$2
38.7
$37.
5-2
3.5%
-22.
2%-1
00.0
%$3
8.3
$44.
2-1
3.2%
$2.4
$1.9
29.9
%6
-29.
7%$3
22.3
$226
.416
9
MG
R2
Man
ager
2: T
rans
mis
sion
& D
istri
butio
n:
T&D
Saf
ety
$146
.4$1
75.2
--$1
59.3
$184
.7--
-8.1
%-5
.2%
--$3
6.9
$35.
44.
4%$2
.4$2
.32.
2%8
-3.6
%$2
22.4
$214
.517
0
MG
R2
Man
ager
2: T
rans
mis
sion
& D
istri
butio
n:
Tran
smis
sion
Sub
stat
ions
& O
pera
tions
$150
.4$1
80.6
--$1
68.3
$202
.3$9
.4-1
0.7%
-10.
7%-1
00.0
%$3
7.7
$40.
7-7
.4%
$2.4
$1.6
51.6
%43
-13.
1%$2
54.0
$220
.717
1
MP
P2
Man
ager
-Pro
ject
/Pro
duct
2$1
33.3
$159
.5--
$165
.1$1
88.7
---1
9.3%
-15.
4%--
$35.
3$3
5.7
-1.2
%$2
.2$2
.4-1
0.3%
510
-13.
1%$2
26.8
$197
.017
2M
D T
&D
AM
OS
Man
agin
g D
ir T&
D A
sset
Mgm
t & O
ps S
vcs
$217
.5$3
43.1
$119
.7$2
20.3
$453
.1$1
04.6
-1.3
%-2
4.3%
14.4
%$4
9.4
$67.
1-2
6.4%
$3.5
$2.1
67.5
%1
-17.
7%$6
26.9
$515
.717
303
39M
anag
ing
Dir
Tax
$225
.4$3
54.5
$130
.3$2
49.3
$331
.2$5
5.5
-9.6
%7.
0%13
4.9%
$50.
3$4
3.0
17.0
%$3
.6$4
.9-2
5.3%
124
.0%
$434
.5$5
38.7
174
AC
M00
0_M
4_E
Prin
Mgr
, Acc
ount
Mgm
t - B
us C
ust
$172
.3$2
63.4
--$1
91.3
$237
.9$4
5.1
-9.9
%10
.7%
-100
.0%
$45.
0$4
0.4
11.2
%$2
.8$2
.80.
1%4
-4.6
%$3
26.2
$311
.217
5B
OP
150_
M4_
EP
rin M
gr, B
us P
roce
ss &
Sol
tns
Intg
$181
.3$2
47.5
--$1
68.1
$203
.8$4
6.6
7.8%
21.5
%-1
00.0
%$4
2.2
$37.
213
.3%
$2.9
$2.4
19.8
%2
0.9%
$290
.0$2
92.7
176
CLS
000_
M4_
EP
rin M
gr, C
lient
Svc
Del
Mgm
t$1
84.3
$258
.4--
$161
.3$1
85.9
$32.
914
.2%
39.0
%-1
00.0
%$4
3.4
$32.
135
.5%
$3.0
$3.2
-5.7
%10
20.0
%$2
54.0
$304
.817
7C
OM
000_
M4_
EP
rin M
gr, C
orp
Com
m$1
60.1
$246
.7--
$169
.2$2
05.3
$40.
5-5
.4%
20.2
%-1
00.0
%$4
5.1
$37.
420
.7%
$2.6
$2.5
5.1%
23.
1%$2
85.6
$294
.517
8E
LD05
0_M
4_E
Prin
Mgr
, Dis
trib
Mgm
t$1
76.2
$256
.3--
$166
.4$2
13.8
$38.
05.
9%19
.8%
-100
.0%
$43.
2$4
2.0
2.9%
$2.8
$1.6
79.7
%9
2.3%
$295
.4$3
02.3
179
EE
C00
0_M
4_E
Prin
Mgr
, Ene
rgy
Effi
cien
cy P
ort
$176
.0$2
47.1
--$1
80.1
$220
.9$4
4.8
-2.3
%11
.9%
-100
.0%
$42.
2$3
8.9
8.4%
$2.8
$2.6
8.6%
2-4
.9%
$307
.2$2
92.1
180
EH
S05
0_M
4_E
Prin
Mgr
, Env
ir Sc
ienc
e$1
78.9
$263
.6--
$152
.5$1
81.5
--17
.3%
45.2
%--
$44.
0$3
5.2
25.2
%$2
.9$2
.230
.4%
441
.8%
$218
.9$3
10.5
181
AC
C00
0_M
4_E
Prin
Mgr
, Gen
Acc
tg, A
nlys
& R
ptg
$163
.4$2
01.4
--$1
59.4
$192
.8$3
8.0
2.5%
4.5%
-100
.0%
$39.
4$3
6.2
8.7%
$2.6
$2.3
13.9
%4
-9.6
%$2
69.2
$243
.418
2E
LD00
0_M
4_E
Prin
Mgr
, Grid
Mgm
t$1
80.3
$277
.1--
$195
.3$2
66.5
$45.
5-7
.6%
4.0%
-100
.0%
$45.
6$4
7.3
-3.6
%$2
.9$1
.956
.7%
3-9
.8%
$361
.2$3
25.6
183
EH
S00
0_M
4_E
Prin
Mgr
, Hea
lth &
Sfty
$173
.0$2
26.1
--$1
66.6
$208
.1$4
1.1
3.8%
8.6%
-100
.0%
$40.
5$3
7.7
7.5%
$2.8
$2.4
15.4
%3
-6.9
%$2
89.3
$269
.418
4H
RM
150_
M4_
EP
rin M
gr, H
R S
trate
gic
Bus
Tea
m$1
70.6
$268
.8--
$169
.0$2
08.2
$48.
70.
9%29
.1%
-100
.0%
$45.
6$3
7.7
21.0
%$2
.8$2
.512
.2%
36.
8%$2
97.1
$317
.118
5P
RJ2
00_M
4_E
Prin
Mgr
, Maj
or C
nstrn
Pro
js$1
82.8
$234
.3--
$196
.4$2
47.0
---6
.9%
-5.1
%--
$40.
7$4
5.1
-9.9
%$3
.0$1
.958
.0%
4-5
.5%
$294
.0$2
77.9
186
MFA
050_
M4_
EP
rin M
gr, M
odel
g, F
cstg
& E
con
Anl
ys$1
83.0
$247
.4--
$178
.4$2
15.7
$40.
22.
6%14
.7%
-100
.0%
$42.
2$3
8.3
10.0
%$3
.0$2
.614
.0%
3-1
.4%
$296
.8$2
92.5
187
SC
M10
0_M
4_E
Prin
Mgr
, Pur
chas
ing
$176
.7$2
27.9
--$1
63.8
$199
.3$3
9.0
7.9%
14.4
%-1
00.0
%$3
9.9
$36.
98.
3%$2
.9$2
.419
.9%
4-2
.5%
$277
.5$2
70.7
188
4720
18 G
ener
al R
ate
Cas
e
Rep
rese
nts
aver
age
pay
data
for S
CE
and
com
para
tor (
mar
ket)
data
.
48
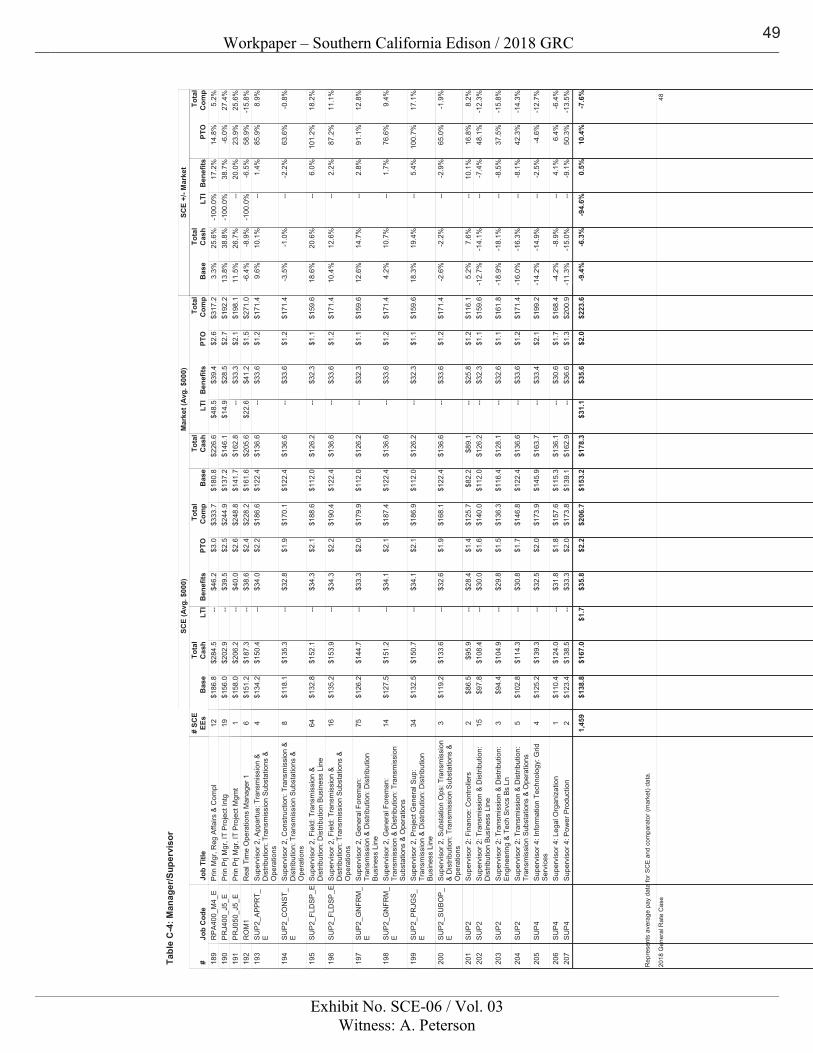
Workpaper – Southern California Edison / 2018 GRC
Exhibit No. SCE-06 / Vol. 03Witness: A. Peterson
Job
Cod
eB
ase
SCE
(Avg
. $00
0)To
tal
Cas
hLT
IB
enef
itsPT
O#
SCE
EEs
Bas
e
Mar
ket (
Avg.
$00
0)To
tal
Cas
hLT
IB
enef
itsPT
OB
ase
SCE
+/- M
arke
tTo
tal
Cas
hLT
IB
enef
itsPT
O
Tab
le C
-4: M
anag
er/S
uper
viso
r
Tota
lC
omp
Tota
lC
omp
Tota
lC
omp
Job
Title
#R
PA
400_
M4_
EP
rin M
gr, R
eg A
ffairs
& C
ompl
$186
.8$2
84.5
--$1
80.8
$226
.6$4
8.5
3.3%
25.6
%-1
00.0
%$4
6.2
$39.
417
.2%
$3.0
$2.6
14.8
%12
5.2%
$317
.2$3
33.7
189
PR
J400
_J5_
EP
rin P
rj M
gr, I
T P
roje
ct In
tg$1
56.0
$202
.9--
$137
.2$1
46.1
$14.
913
.8%
38.8
%-1
00.0
%$3
9.5
$28.
538
.7%
$2.5
$2.7
-6.0
%19
27.4
%$1
92.2
$244
.919
0P
RJ0
50_J
5_E
Prin
Prj
Mgr
, IT
Pro
ject
Mgm
t$1
58.0
$206
.2--
$141
.7$1
62.8
--11
.5%
26.7
%--
$40.
0$3
3.3
20.0
%$2
.6$2
.123
.9%
125
.6%
$198
.1$2
48.8
191
RO
M1
Rea
l Tim
e O
pera
tions
Man
ager
1$1
51.2
$187
.3--
$161
.6$2
05.6
$22.
6-6
.4%
-8.9
%-1
00.0
%$3
8.6
$41.
2-6
.5%
$2.4
$1.5
58.9
%6
-15.
8%$2
71.0
$228
.219
2S
UP
2_A
PP
RT_
ES
uper
viso
r 2, A
ppar
tus:
Tra
nsm
issi
on &
D
istri
butio
n: T
rans
mis
sion
Sub
stat
ions
&
Ope
ratio
ns
$134
.2$1
50.4
--$1
22.4
$136
.6--
9.6%
10.1
%--
$34.
0$3
3.6
1.4%
$2.2
$1.2
85.9
%4
8.9%
$171
.4$1
86.6
193
SU
P2_C
ON
ST_
ES
uper
viso
r 2, C
onst
ruct
ion:
Tra
nsm
issi
on &
D
istri
butio
n: T
rans
mis
sion
Sub
stat
ions
&
Ope
ratio
ns
$118
.1$1
35.3
--$1
22.4
$136
.6--
-3.5
%-1
.0%
--$3
2.8
$33.
6-2
.2%
$1.9
$1.2
63.6
%8
-0.8
%$1
71.4
$170
.119
4
SU
P2_
FLD
SP_E
Sup
ervi
sor 2
, Fie
ld: T
rans
mis
sion
&
Dis
tribu
tion:
Dis
tribu
tion
Bus
ines
s Li
ne$1
32.8
$152
.1--
$112
.0$1
26.2
--18
.6%
20.6
%--
$34.
3$3
2.3
6.0%
$2.1
$1.1
101.
2%64
18.2
%$1
59.6
$188
.619
5
SU
P2_
FLD
SP_E
Sup
ervi
sor 2
, Fie
ld: T
rans
mis
sion
&
Dis
tribu
tion:
Tra
nsm
issi
on S
ubst
atio
ns &
O
pera
tions
$135
.2$1
53.9
--$1
22.4
$136
.6--
10.4
%12
.6%
--$3
4.3
$33.
62.
2%$2
.2$1
.287
.2%
1611
.1%
$171
.4$1
90.4
196
SU
P2_G
NFR
M_
ES
uper
viso
r 2, G
ener
al F
orem
an:
Tran
smis
sion
& D
istri
butio
n: D
istri
butio
n B
usin
ess
Line
$126
.2$1
44.7
--$1
12.0
$126
.2--
12.6
%14
.7%
--$3
3.3
$32.
32.
8%$2
.0$1
.191
.1%
7512
.8%
$159
.6$1
79.9
197
SU
P2_G
NFR
M_
ES
uper
viso
r 2, G
ener
al F
orem
an:
Tran
smis
sion
& D
istri
butio
n: T
rans
mis
sion
S
ubst
atio
ns &
Ope
ratio
ns
$127
.5$1
51.2
--$1
22.4
$136
.6--
4.2%
10.7
%--
$34.
1$3
3.6
1.7%
$2.1
$1.2
76.6
%14
9.4%
$171
.4$1
87.4
198
SU
P2_
PR
JGS
_E
Sup
ervi
sor 2
, Pro
ject
Gen
eral
Sup
: Tr
ansm
issi
on &
Dis
tribu
tion:
Dis
tribu
tion
Bus
ines
s Li
ne
$132
.5$1
50.7
--$1
12.0
$126
.2--
18.3
%19
.4%
--$3
4.1
$32.
35.
4%$2
.1$1
.110
0.7%
3417
.1%
$159
.6$1
86.9
199
SU
P2_
SU
BO
P_
ES
uper
viso
r 2, S
ubst
atio
n O
ps: T
rans
mis
sion
&
Dis
tribu
tion:
Tra
nsm
issi
on S
ubst
atio
ns &
O
pera
tions
$119
.2$1
33.6
--$1
22.4
$136
.6--
-2.6
%-2
.2%
--$3
2.6
$33.
6-2
.9%
$1.9
$1.2
65.0
%3
-1.9
%$1
71.4
$168
.120
0
SU
P2
Sup
ervi
sor 2
: Fin
ance
: Con
trolle
rs$8
6.5
$95.
9--
$82.
2$8
9.1
--5.
2%7.
6%--
$28.
4$2
5.8
10.1
%$1
.4$1
.216
.8%
28.
2%$1
16.1
$125
.720
1S
UP
2S
uper
viso
r 2: T
rans
mis
sion
& D
istri
butio
n:
Dis
tribu
tion
Bus
ines
s Li
ne$9
7.8
$108
.4--
$112
.0$1
26.2
---1
2.7%
-14.
1%--
$30.
0$3
2.3
-7.4
%$1
.6$1
.148
.1%
15-1
2.3%
$159
.6$1
40.0
202
SU
P2
Sup
ervi
sor 2
: Tra
nsm
issi
on &
Dis
tribu
tion:
E
ngin
eerin
g &
Tech
Srv
cs B
s Ln
$94.
4$1
04.9
--$1
16.4
$128
.1--
-18.
9%-1
8.1%
--$2
9.8
$32.
6-8
.5%
$1.5
$1.1
37.5
%3
-15.
8%$1
61.8
$136
.320
3
SU
P2
Sup
ervi
sor 2
: Tra
nsm
issi
on &
Dis
tribu
tion:
Tr
ansm
issi
on S
ubst
atio
ns &
Ope
ratio
ns$1
02.8
$114
.3--
$122
.4$1
36.6
---1
6.0%
-16.
3%--
$30.
8$3
3.6
-8.1
%$1
.7$1
.242
.3%
5-1
4.3%
$171
.4$1
46.8
204
SU
P4
Sup
ervi
sor 4
: Inf
orm
atio
n Te
chno
logy
: Grid
S
ervi
ces
$125
.2$1
39.3
--$1
45.9
$163
.7--
-14.
2%-1
4.9%
--$3
2.5
$33.
4-2
.5%
$2.0
$2.1
-4.6
%4
-12.
7%$1
99.2
$173
.920
5
SU
P4
Sup
ervi
sor 4
: Leg
al O
rgan
izat
ion
$110
.4$1
24.0
--$1
15.3
$136
.1--
-4.2
%-8
.9%
--$3
1.8
$30.
64.
1%$1
.8$1
.76.
4%1
-6.4
%$1
68.4
$157
.620
6S
UP
4S
uper
viso
r 4: P
ower
Pro
duct
ion
$123
.4$1
38.5
--$1
39.1
$162
.9--
-11.
3%-1
5.0%
--$3
3.3
$36.
6-9
.1%
$2.0
$1.3
50.3
%2
-13.
5%$2
00.9
$173
.820
7
$138
.8$1
67.0
$1.7
$153
.2$1
78.3
$31.
1-9
.4%
-6.3
%-9
4.6%
$35.
8$3
5.6
0.5%
$2.2
$2.0
10.4
%1,
459
-7.6
%$2
23.6
$206
.7
4820
18 G
ener
al R
ate
Cas
e
Rep
rese
nts
aver
age
pay
data
for S
CE
and
com
para
tor (
mar
ket)
data
.
49
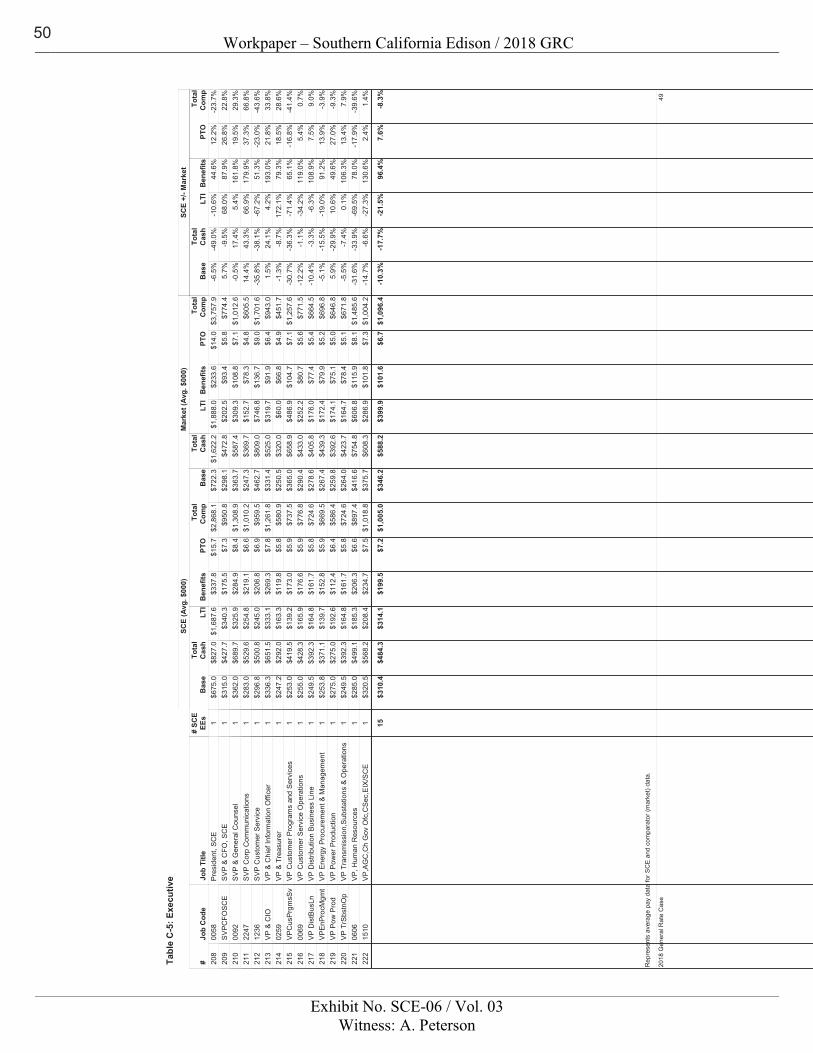
Workpaper – Southern California Edison / 2018 GRC
Exhibit No. SCE-06 / Vol. 03Witness: A. Peterson
Job
Cod
eB
ase
SCE
(Avg
. $00
0)To
tal
Cas
hLT
IB
enef
itsPT
O#
SCE
EEs
Bas
e
Mar
ket (
Avg.
$00
0)To
tal
Cas
hLT
IB
enef
itsPT
OB
ase
SCE
+/- M
arke
tTo
tal
Cas
hLT
IB
enef
itsPT
O
Tab
le C
-5: E
xecu
tive
Tota
lC
omp
Tota
lC
omp
Tota
lC
omp
Job
Title
#00
58P
resi
dent
, SC
E$6
75.0
$827
.0$1
,687
.6$7
22.3
$1,6
22.2
$1,8
88.0
-6.5
%-4
9.0%
-10.
6%$3
37.8
$233
.644
.6%
$15.
7$1
4.0
12.2
%1
-23.
7%$3
,757
.9$2
,868
.120
8S
VPC
FOSC
ESV
P &
CFO
, SC
E$3
15.0
$427
.7$3
40.3
$298
.1$4
72.8
$202
.55.
7%-9
.5%
68.0
%$1
75.5
$93.
487
.9%
$7.3
$5.8
26.8
%1
22.8
%$7
74.4
$950
.820
900
92S
VP
& G
ener
al C
ouns
el$3
62.0
$689
.7$3
25.9
$363
.7$5
87.4
$309
.3-0
.5%
17.4
%5.
4%$2
84.9
$108
.816
1.8%
$8.4
$7.1
19.5
%1
29.3
%$1
,012
.6$1
,308
.921
022
47S
VP
Cor
p C
omm
unic
atio
ns$2
83.0
$529
.6$2
54.8
$247
.3$3
69.7
$152
.714
.4%
43.3
%66
.9%
$219
.1$7
8.3
179.
9%$6
.6$4
.837
.3%
166
.8%
$605
.5$1
,010
.221
112
36S
VP
Cus
tom
er S
ervi
ce$2
96.8
$500
.8$2
45.0
$462
.7$8
09.0
$746
.8-3
5.8%
-38.
1%-6
7.2%
$206
.8$1
36.7
51.3
%$6
.9$9
.0-2
3.0%
1-4
3.6%
$1,7
01.6
$959
.521
2V
P &
CIO
VP
& C
hief
Info
rmat
ion
Offi
cer
$336
.3$6
51.5
$333
.1$3
31.4
$525
.0$3
19.7
1.5%
24.1
%4.
2%$2
69.3
$91.
919
3.0%
$7.8
$6.4
21.8
%1
33.8
%$9
43.0
$1,2
61.8
213
0259
VP &
Tre
asur
er$2
47.2
$292
.0$1
63.3
$250
.5$3
20.0
$60.
0-1
.3%
-8.7
%17
2.1%
$119
.8$6
6.8
79.3
%$5
.8$4
.918
.5%
128
.6%
$451
.7$5
80.9
214
VP
Cus
Prg
msS
vV
P C
usto
mer
Pro
gram
s an
d S
ervi
ces
$253
.0$4
19.5
$139
.2$3
65.0
$658
.9$4
86.9
-30.
7%-3
6.3%
-71.
4%$1
73.0
$104
.765
.1%
$5.9
$7.1
-16.
8%1
-41.
4%$1
,257
.6$7
37.5
215
0069
VP
Cus
tom
er S
ervi
ce O
pera
tions
$255
.0$4
28.3
$165
.9$2
90.4
$433
.0$2
52.2
-12.
2%-1
.1%
-34.
2%$1
76.6
$80.
711
9.0%
$5.9
$5.6
5.4%
10.
7%$7
71.5
$776
.821
6V
P D
istB
usLn
VP
Dis
tribu
tion
Bus
ines
s Li
ne$2
49.5
$392
.3$1
64.8
$278
.6$4
05.8
$176
.0-1
0.4%
-3.3
%-6
.3%
$161
.7$7
7.4
108.
9%$5
.8$5
.47.
5%1
9.0%
$664
.5$7
24.6
217
VP
EnP
rocM
gmt
VP
Ene
rgy
Pro
cure
men
t & M
anag
emen
t$2
53.8
$371
.1$1
39.7
$267
.4$4
39.3
$172
.4-5
.1%
-15.
5%-1
9.0%
$152
.8$7
9.9
91.2
%$5
.9$5
.213
.9%
1-3
.9%
$696
.8$6
69.5
218
VP
Pow
Pro
dV
P P
ower
Pro
duct
ion
$275
.0$2
75.0
$192
.6$2
59.8
$392
.6$1
74.1
5.9%
-29.
9%10
.6%
$112
.4$7
5.1
49.6
%$6
.4$5
.027
.0%
1-9
.3%
$646
.8$5
86.4
219
VP
TrS
bstn
Op
VP
Tra
nsm
issi
on,S
ubst
atio
ns &
Ope
ratio
ns$2
49.5
$392
.3$1
64.8
$264
.0$4
23.7
$164
.7-5
.5%
-7.4
%0.
1%$1
61.7
$78.
410
6.3%
$5.8
$5.1
13.4
%1
7.9%
$671
.8$7
24.6
220
0606
VP
, Hum
an R
esou
rces
$285
.0$4
99.1
$185
.3$4
16.6
$754
.8$6
06.8
-31.
6%-3
3.9%
-69.
5%$2
06.3
$115
.978
.0%
$6.6
$8.1
-17.
9%1
-39.
6%$1
,485
.6$8
97.4
221
1510
VP
,AG
C,C
h G
ov O
fc,C
Sec,
EIX
/SC
E$3
20.5
$568
.2$2
08.4
$375
.7$6
08.3
$286
.9-1
4.7%
-6.6
%-2
7.3%
$234
.7$1
01.8
130.
6%$7
.5$7
.32.
4%1
1.4%
$1,0
04.2
$1,0
18.8
222
$310
.4$4
84.3
$314
.1$3
46.2
$588
.2$3
99.9
-10.
3%-1
7.7%
-21.
5%$1
99.5
$101
.696
.4%
$7.2
$6.7
7.6%
15-8
.3%
$1,0
96.4
$1,0
05.0
4920
18 G
ener
al R
ate
Cas
e
Rep
rese
nts
aver
age
pay
data
for S
CE
and
com
para
tor (
mar
ket)
data
.
50
Workpaper – Southern California Edison / 2018 GRC
Exhibit No. SCE-06 / Vol. 03Witness: A. Peterson
2018 General Rate Case 50
Appendix D: Competitive Analysis Summary
51
Workpaper – Southern California Edison / 2018 GRC
Exhibit No. SCE-06 / Vol. 03Witness: A. Peterson
2018 General Rate Case 51
Competitive Analysis Summary � Table D-1—Displays SCE’s competitive status for each element of compensation. This is the same
information presented in Table 1 of the Study Results.
� Table D-2—Displays total compensation by job category and compensation element including base salary, total cash compensation, LTI, and benefits for SCE and the comparator companies. Total compensation for each compensation element is derived by adding together the compensation dollars for each incumbent covered by a benchmark job in the Study.
� Table D-3—Displays average compensation by job category and compensation element for SCE and the comparator companies. Average compensation is derived by dividing the sum of compensation dollars for all incumbents covered by benchmark jobs for each compensation element by the number of SCE incumbents covered by benchmark jobs in the Study.
52
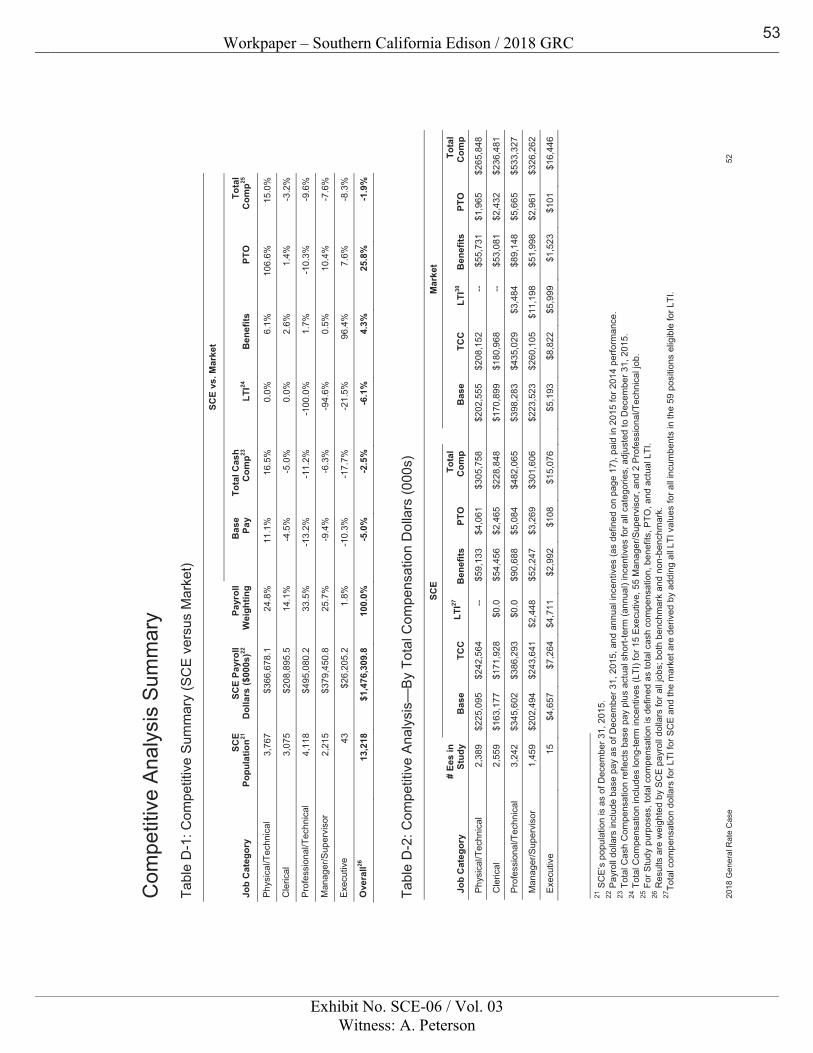
Workpaper – Southern California Edison / 2018 GRC
Exhibit No. SCE-06 / Vol. 03Witness: A. Peterson
2018
Gen
eral
Rat
e C
ase
52
Com
petit
ive
Ana
lysi
s S
umm
ary
Tabl
e D
-1: C
ompe
titiv
e S
umm
ary
(SC
E v
ersu
s M
arke
t)
SCE
vs. M
arke
t
Job
Cat
egor
y SC
E
Popu
latio
n21
SCE
Payr
oll
Dol
lars
($00
0s)22
Payr
oll
Wei
ghtin
gB
ase
Pay
Tota
l Cas
h
Com
p23
LTI24
Ben
efits
PTO
Tota
l C
omp25
Phy
sica
l/Tec
hnic
al
3,76
7 $3
66,6
78.1
24.8
%11
.1%
16.5
%
0.0%
6.1%
106.
6%15
.0%
Cle
rical
3,
075
$208
,895
.514
.1%
-4.5
%-5
.0%
0.
0%2.
6%1.
4%-3
.2%
Pro
fess
iona
l/Tec
hnic
al
4,11
8 $4
95,0
80.2
33.5
%-1
3.2%
-11.
2%
-100
.0%
1.7%
-10.
3%-9
.6%
Man
ager
/Sup
ervi
sor
2,21
5 $3
79,4
50.8
25.7
%-9
.4%
-6.3
%
-94.
6%0.
5%10
.4%
-7.6
%
Exe
cutiv
e 43
$2
6,20
5.2
1.8%
-10.
3%-1
7.7%
-2
1.5%
96.4
%7.
6%-8
.3%
Ove
rall26
13
,218
$1
,476
,309
.810
0.0%
-5.0
%-2
.5%
-6
.1%
4.3%
25.8
%-1
.9%
Tabl
e D
-2: C
ompe
titiv
e A
naly
sis—
By
Tota
l Com
pens
atio
n D
olla
rs (0
00s)
# Ee
s in
S
tudy
SCE
M
arke
t
Job
Cat
egor
y B
ase
TCC
LT
I27
Ben
efits
PT
O
Tota
l C
omp
B
ase
TCC
LT
I30
Ben
efits
PT
O
Tota
l C
omp
Phy
sica
l/Tec
hnic
al
2,38
9 $2
25,0
95
$242
,564
--
$5
9,13
3 $4
,061
$3
05,7
58
$2
02,5
55
$208
,152
--
$5
5,73
1 $1
,965
$2
65,8
48
Cle
rical
2,
559
$163
,177
$1
71,9
28
$0.0
$5
4,45
6 $2
,465
$2
28,8
48
$1
70,8
99
$180
,968
--
$5
3,08
1 $2
,432
$2
36,4
81
Pro
fess
iona
l/Tec
hnic
al
3,24
2 $3
45,6
02
$386
,293
$0
.0
$90,
688
$5,0
84
$482
,065
$398
,283
$4
35,0
29
$3,4
84
$89,
148
$5,6
65
$533
,327
Man
ager
/Sup
ervi
sor
1,45
9 $2
02,4
94
$243
,641
$2
,448
$5
2,24
7 $3
,269
$3
01,6
06
$2
23,5
23
$260
,105
$1
1,19
8 $5
1,99
8 $2
,961
$3
26,2
62
Exe
cutiv
e 15
$4
,657
$7
,264
$4
,711
$2
,992
$1
08
$15,
076
$5
,193
$8
,822
$5
,999
$1
,523
$1
01
$16,
446
21 S
CE
’s p
opul
atio
n is
as
of D
ecem
ber 3
1, 2
015.
22
Pay
roll
dolla
rs in
clud
e ba
se p
ay a
s of
Dec
embe
r 31,
201
5, a
nd a
nnua
l inc
entiv
es (a
s de
fined
on
page
17)
, pai
d in
201
5 fo
r 201
4 pe
rform
ance
. 23
Tot
al C
ash
Com
pens
atio
n re
flect
s ba
se p
ay p
lus
actu
al s
hort-
term
(ann
ual)
ince
ntiv
es fo
r all
cate
gorie
s, a
djus
ted
to D
ecem
ber 3
1, 2
015.
24
Tot
al C
ompe
nsat
ion
incl
udes
long
-term
ince
ntiv
es (L
TI) f
or 1
5 E
xecu
tive,
55
Man
ager
/Sup
ervi
sor,
and
2 P
rofe
ssio
nal/T
echn
ical
job.
25
For
Stu
dy p
urpo
ses,
tota
l com
pens
atio
n is
def
ined
as
tota
l cas
h co
mpe
nsat
ion,
ben
efits
, PTO
, and
act
ual L
TI.
26 R
esul
ts a
re w
eigh
ted
by S
CE
pay
roll
dolla
rs fo
r all
jobs
; bot
h be
nchm
ark
and
non-
benc
hmar
k.
27To
tal c
ompe
nsat
ion
dolla
rs fo
r LTI
for S
CE
and
the
mar
ket a
re d
eriv
ed b
y ad
ding
all
LTI v
alue
s fo
r all
incu
mbe
nts
in th
e 59
pos
ition
s el
igib
le fo
r LTI
.
53
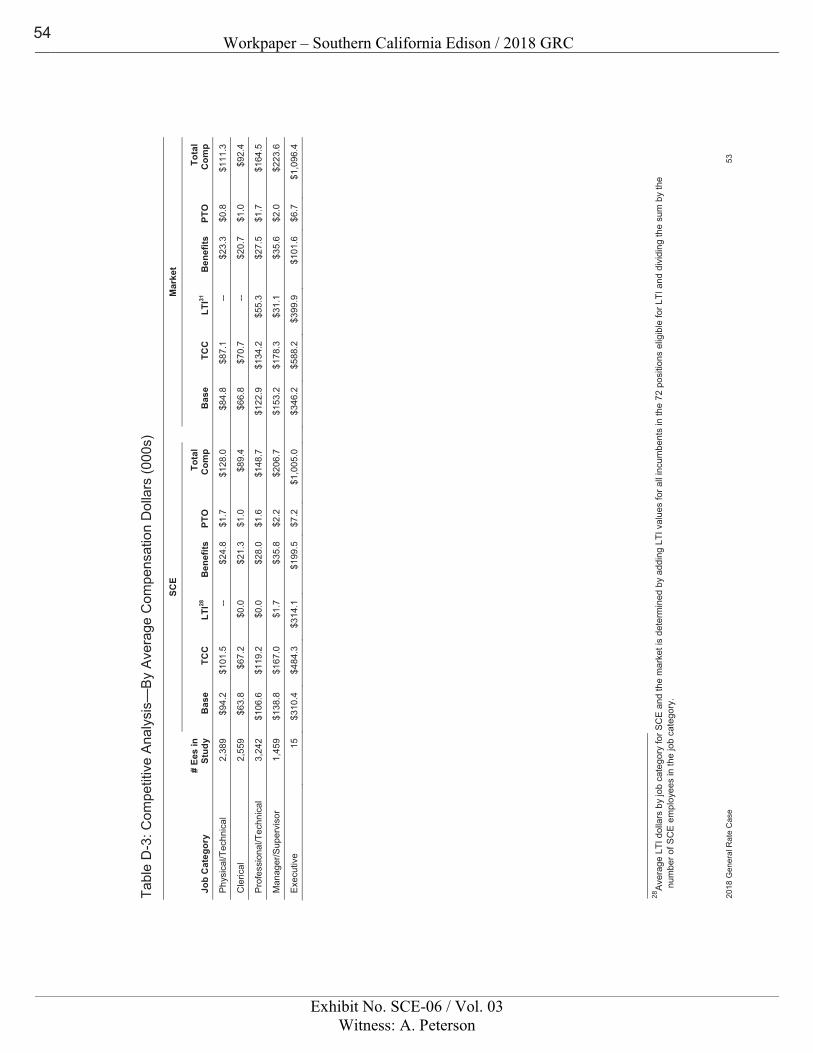
Workpaper – Southern California Edison / 2018 GRC
Exhibit No. SCE-06 / Vol. 03Witness: A. Peterson
2018
Gen
eral
Rat
e C
ase
53
Tabl
e D
-3: C
ompe
titiv
e A
naly
sis—
By
Ave
rage
Com
pens
atio
n D
olla
rs (0
00s)
# Ee
s in
S
tudy
SCE
M
arke
t
Job
Cat
egor
y B
ase
TCC
LT
I28
Ben
efits
PT
O
Tota
l C
omp
B
ase
TCC
LT
I31
Ben
efits
PT
O
Tota
l C
omp
Phy
sica
l/Tec
hnic
al
2,38
9 $9
4.2
$101
.5
--
$24.
8 $1
.7
$128
.0
$8
4.8
$87.
1 --
$2
3.3
$0.8
$1
11.3
Cle
rical
2,
559
$63.
8 $6
7.2
$0.0
$2
1.3
$1.0
$8
9.4
$6
6.8
$70.
7 --
$2
0.7
$1.0
$9
2.4
Pro
fess
iona
l/Tec
hnic
al
3,24
2 $1
06.6
$1
19.2
$0
.0
$28.
0 $1
.6
$148
.7
$1
22.9
$1
34.2
$5
5.3
$27.
5 $1
.7
$164
.5
Man
ager
/Sup
ervi
sor
1,45
9 $1
38.8
$1
67.0
$1
.7
$35.
8 $2
.2
$206
.7
$1
53.2
$1
78.3
$3
1.1
$35.
6 $2
.0
$223
.6
Exe
cutiv
e 15
$3
10.4
$4
84.3
$3
14.1
$1
99.5
$7
.2
$1,0
05.0
$346
.2
$588
.2
$399
.9
$101
.6
$6.7
$1
,096
.4
28A
vera
ge L
TI d
olla
rs b
y jo
b ca
tego
ry fo
r SC
E a
nd th
e m
arke
t is
dete
rmin
ed b
y ad
ding
LTI
val
ues
for a
ll in
cum
bent
s in
the
72 p
ositi
ons
elig
ible
for L
TI a
nd d
ivid
ing
the
sum
by
the
num
ber o
f SC
E e
mpl
oyee
s in
the
job
cate
gory
.
54
Workpaper – Southern California Edison / 2018 GRC
Exhibit No. SCE-06 / Vol. 03Witness: A. Peterson
2018 General Rate Case 54
Appendix E: Generic Job Methodology
55
Workpaper – Southern California Edison / 2018 GRC
Exhibit No. SCE-06 / Vol. 03Witness: A. Peterson
2018 General Rate Case 55
Generic Job Methodology This section summarizes the approach used to compare each of SCE’s generic job titles analyzed in this Study to market. For the 2018 Study, the Team agreed upon a method for each generic job described below that would allow Aon Hewitt to match incumbents in generic job titles to survey sources. This approach was also used for the 2015 Study.
Manager (MGR)—2 Levels There are 545 SCE incumbents assigned to a Manager level (MGR 1 or 2). This classification is used to designate general levels of Manager work. Each level has a market base salary and an annual incentive (as a percentage of salary) target. SCE assigns jobs to each level based on benchmark market pay data and the level of work required of incumbents. In addition, when making a Manager level assignment, SCE considers reporting relationships, market bonus targets, number and type of subordinates, budget authority, and impact.
The level of work is assumed to vary somewhat for all incumbents at each level, but still reflects the job description for each Manager level.
Supervisor (SUP)—3 Levels29 There are 250 SCE incumbents assigned to a Supervisor level (SUP 1, 2, or 4). This classification is used to designate the level of Supervisor; each level has a market base salary and a bonus target (which is the same percentage of base salary for all levels of Supervisor). SCE assigns jobs to a Supervisor level using market pay data for benchmark jobs. However, similar to the Manager classification, other considerations are also used, including, supervisory responsibility, subordinate pay levels, and number of direct reports and their job titles.
Matching Manager and Supervisor Titles to Market The Manager and Supervisor classifications were broken out into more discrete levels to allow comparison to market. SCE noted that within a function such as “Finance,” there are several departments (such as Controllers, Risk Management, and Treasurers). Within each of these departments are more discrete work units. Aon Hewitt benchmarked these work unit managers and supervisors to market based on their specific responsibility. Aon Hewitt then used that benchmark data for all other Managers and Supervisors at the same level in that department.
For example, within the Controllers department, there are three work units, including, “Accounting” and “Transaction Processing.” The Team decided that if Aon Hewitt was able to benchmark MGR2 jobs in the Controllers’ Accounting work unit, that data would also be applied to all MGR2 incumbents within the entire Controllers department, such as the Manager for the “Accounting Advisory & Reporting” work unit.
29 A fourth level exists, SUP3; however, no benchmarks exist for this job.
56
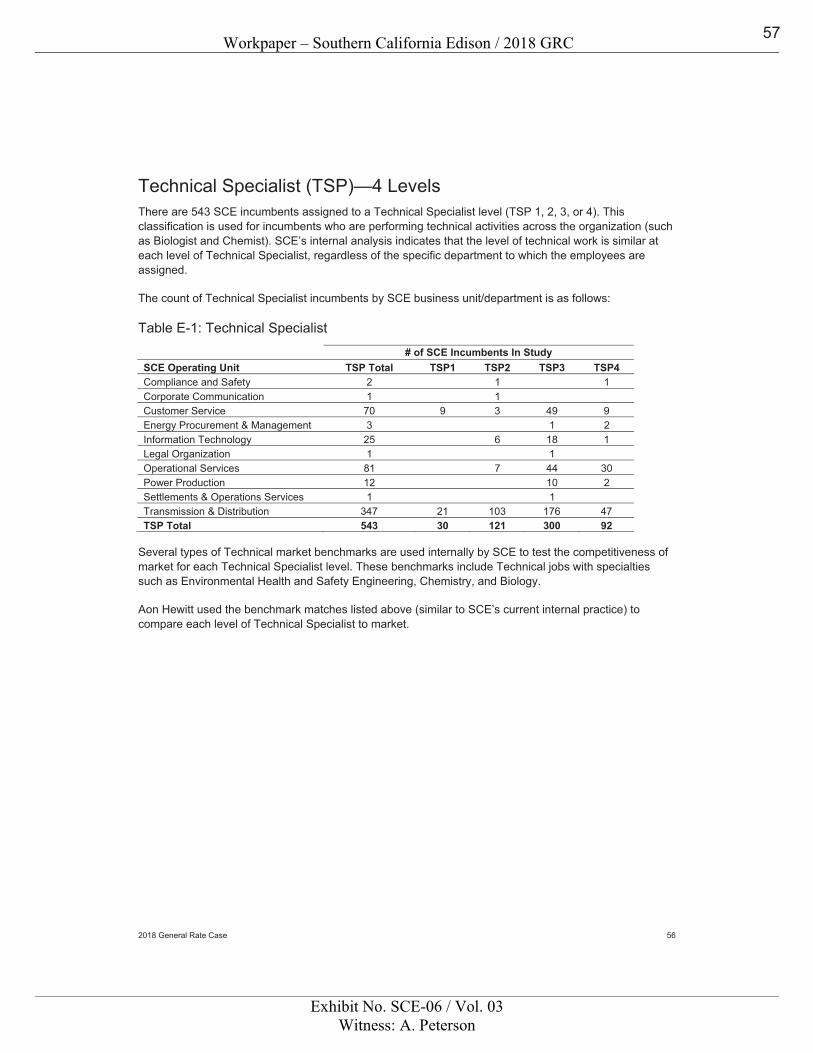
Workpaper – Southern California Edison / 2018 GRC
Exhibit No. SCE-06 / Vol. 03Witness: A. Peterson
2018 General Rate Case 56
Technical Specialist (TSP)—4 Levels There are 543 SCE incumbents assigned to a Technical Specialist level (TSP 1, 2, 3, or 4). This classification is used for incumbents who are performing technical activities across the organization (such as Biologist and Chemist). SCE’s internal analysis indicates that the level of technical work is similar at each level of Technical Specialist, regardless of the specific department to which the employees are assigned.
The count of Technical Specialist incumbents by SCE business unit/department is as follows:
Table E-1: Technical Specialist
# of SCE Incumbents In Study SCE Operating Unit TSP Total TSP1 TSP2 TSP3 TSP4 Compliance and Safety 2 1 1 Corporate Communication 1 1 Customer Service 70 9 3 49 9 Energy Procurement & Management 3 1 2 Information Technology 25 6 18 1 Legal Organization 1 1 Operational Services 81 7 44 30 Power Production 12 10 2 Settlements & Operations Services 1 1 Transmission & Distribution 347 21 103 176 47 TSP Total 543 30 121 300 92
Several types of Technical market benchmarks are used internally by SCE to test the competitiveness of market for each Technical Specialist level. These benchmarks include Technical jobs with specialties such as Environmental Health and Safety Engineering, Chemistry, and Biology.
Aon Hewitt used the benchmark matches listed above (similar to SCE’s current internal practice) to compare each level of Technical Specialist to market.
57
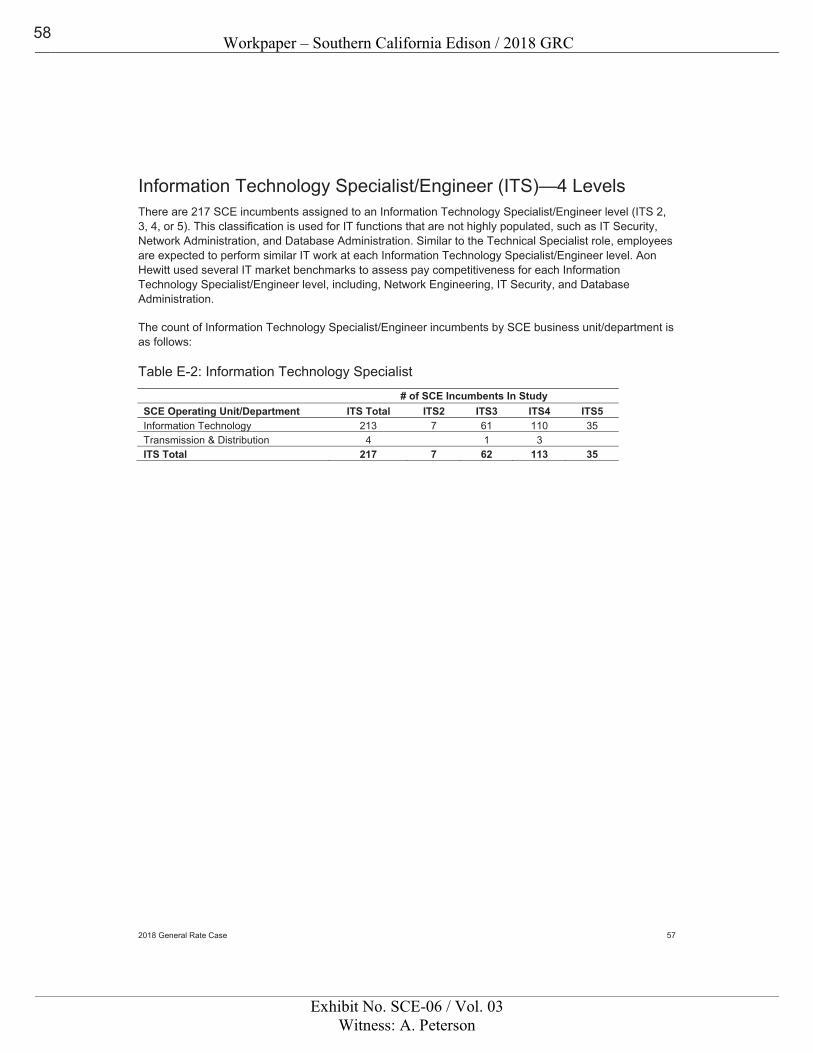
Workpaper – Southern California Edison / 2018 GRC
Exhibit No. SCE-06 / Vol. 03Witness: A. Peterson
2018 General Rate Case 57
Information Technology Specialist/Engineer (ITS)—4 Levels There are 217 SCE incumbents assigned to an Information Technology Specialist/Engineer level (ITS 2, 3, 4, or 5). This classification is used for IT functions that are not highly populated, such as IT Security, Network Administration, and Database Administration. Similar to the Technical Specialist role, employees are expected to perform similar IT work at each Information Technology Specialist/Engineer level. Aon Hewitt used several IT market benchmarks to assess pay competitiveness for each Information Technology Specialist/Engineer level, including, Network Engineering, IT Security, and Database Administration.
The count of Information Technology Specialist/Engineer incumbents by SCE business unit/department is as follows:
Table E-2: Information Technology Specialist
# of SCE Incumbents In Study SCE Operating Unit/Department ITS Total ITS2 ITS3 ITS4 ITS5 Information Technology 213 7 61 110 35 Transmission & Distribution 4 1 3 ITS Total 217 7 62 113 35
58
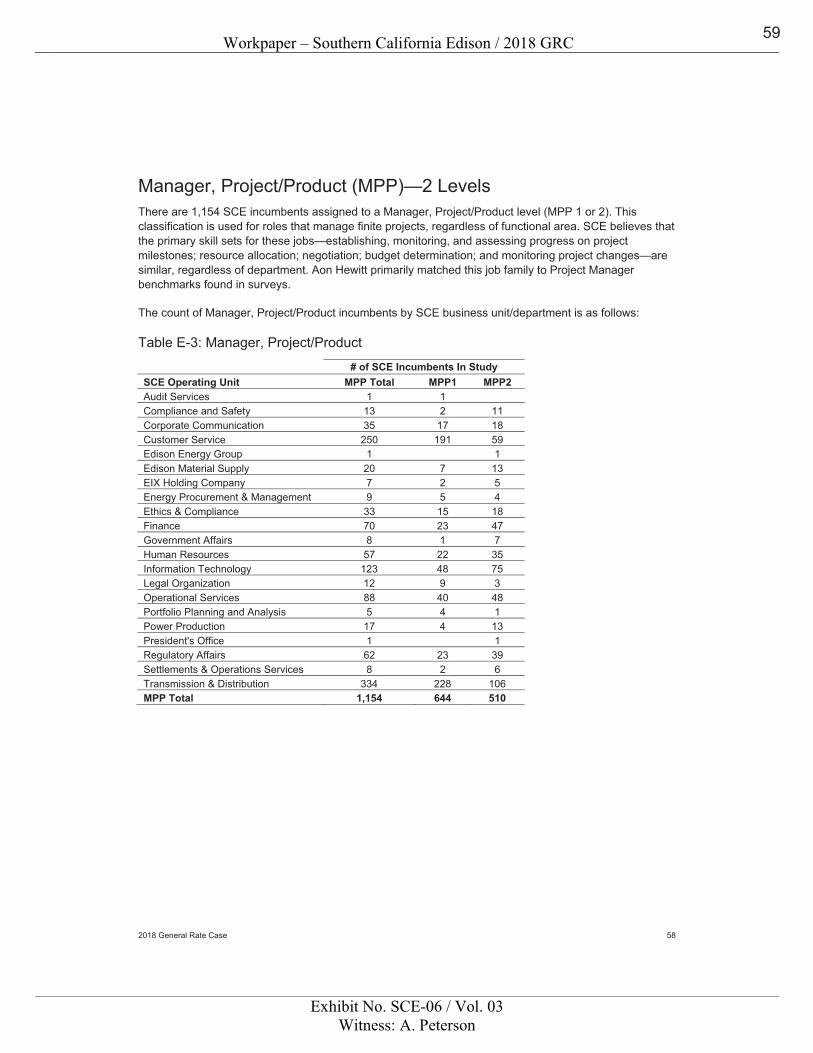
Workpaper – Southern California Edison / 2018 GRC
Exhibit No. SCE-06 / Vol. 03Witness: A. Peterson
2018 General Rate Case 58
Manager, Project/Product (MPP)—2 Levels There are 1,154 SCE incumbents assigned to a Manager, Project/Product level (MPP 1 or 2). This classification is used for roles that manage finite projects, regardless of functional area. SCE believes that the primary skill sets for these jobs—establishing, monitoring, and assessing progress on project milestones; resource allocation; negotiation; budget determination; and monitoring project changes—are similar, regardless of department. Aon Hewitt primarily matched this job family to Project Manager benchmarks found in surveys.
The count of Manager, Project/Product incumbents by SCE business unit/department is as follows:
Table E-3: Manager, Project/Product
# of SCE Incumbents In Study SCE Operating Unit MPP Total MPP1 MPP2 Audit Services 1 1 Compliance and Safety 13 2 11 Corporate Communication 35 17 18 Customer Service 250 191 59 Edison Energy Group 1 1 Edison Material Supply 20 7 13 EIX Holding Company 7 2 5 Energy Procurement & Management 9 5 4 Ethics & Compliance 33 15 18 Finance 70 23 47 Government Affairs 8 1 7 Human Resources 57 22 35 Information Technology 123 48 75 Legal Organization 12 9 3 Operational Services 88 40 48 Portfolio Planning and Analysis 5 4 1 Power Production 17 4 13 President's Office 1 1 Regulatory Affairs 62 23 39 Settlements & Operations Services 8 2 6 Transmission & Distribution 334 228 106 MPP Total 1,154 644 510
59
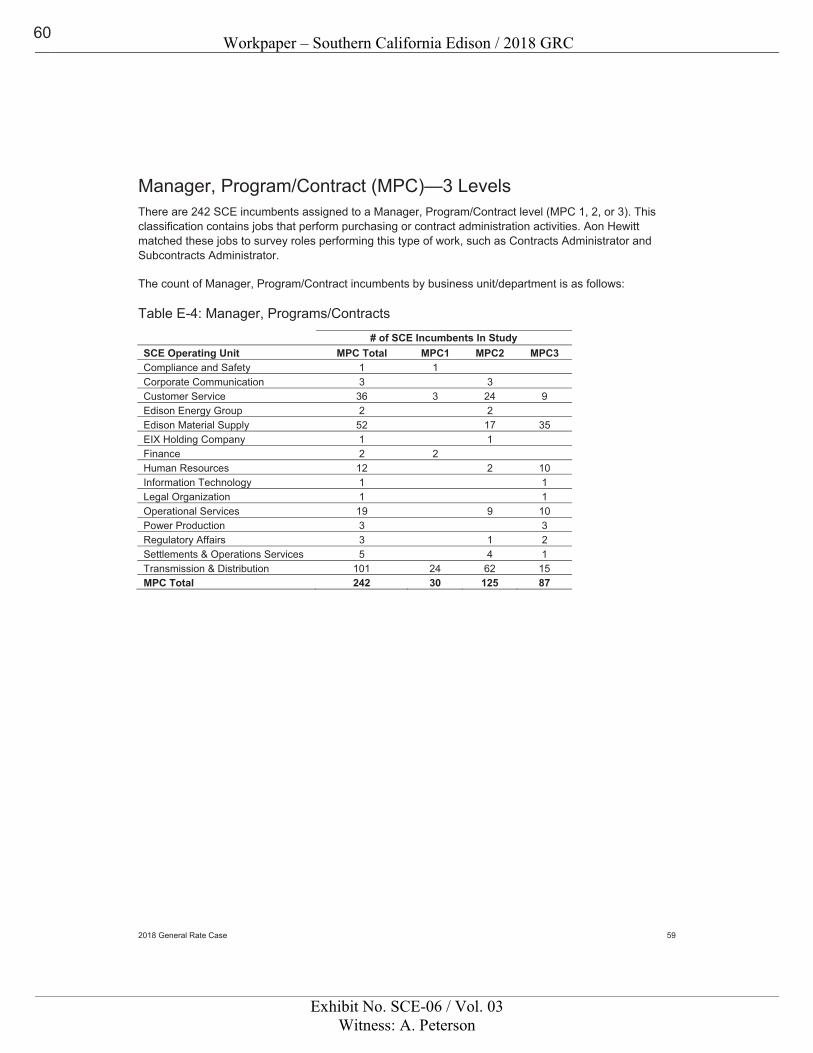
Workpaper – Southern California Edison / 2018 GRC
Exhibit No. SCE-06 / Vol. 03Witness: A. Peterson
2018 General Rate Case 59
Manager, Program/Contract (MPC)—3 Levels There are 242 SCE incumbents assigned to a Manager, Program/Contract level (MPC 1, 2, or 3). This classification contains jobs that perform purchasing or contract administration activities. Aon Hewitt matched these jobs to survey roles performing this type of work, such as Contracts Administrator and Subcontracts Administrator.
The count of Manager, Program/Contract incumbents by business unit/department is as follows:
Table E-4: Manager, Programs/Contracts
# of SCE Incumbents In Study SCE Operating Unit MPC Total MPC1 MPC2 MPC3 Compliance and Safety 1 1 Corporate Communication 3 3 Customer Service 36 3 24 9 Edison Energy Group 2 2 Edison Material Supply 52 17 35 EIX Holding Company 1 1 Finance 2 2 Human Resources 12 2 10 Information Technology 1 1 Legal Organization 1 1 Operational Services 19 9 10 Power Production 3 3 Regulatory Affairs 3 1 2 Settlements & Operations Services 5 4 1 Transmission & Distribution 101 24 62 15 MPC Total 242 30 125 87
60
Workpaper – Southern California Edison / 2018 GRC
Exhibit No. SCE-06 / Vol. 03Witness: A. Peterson
2018 General Rate Case 60
Appendix F: LTI Study Positions
61
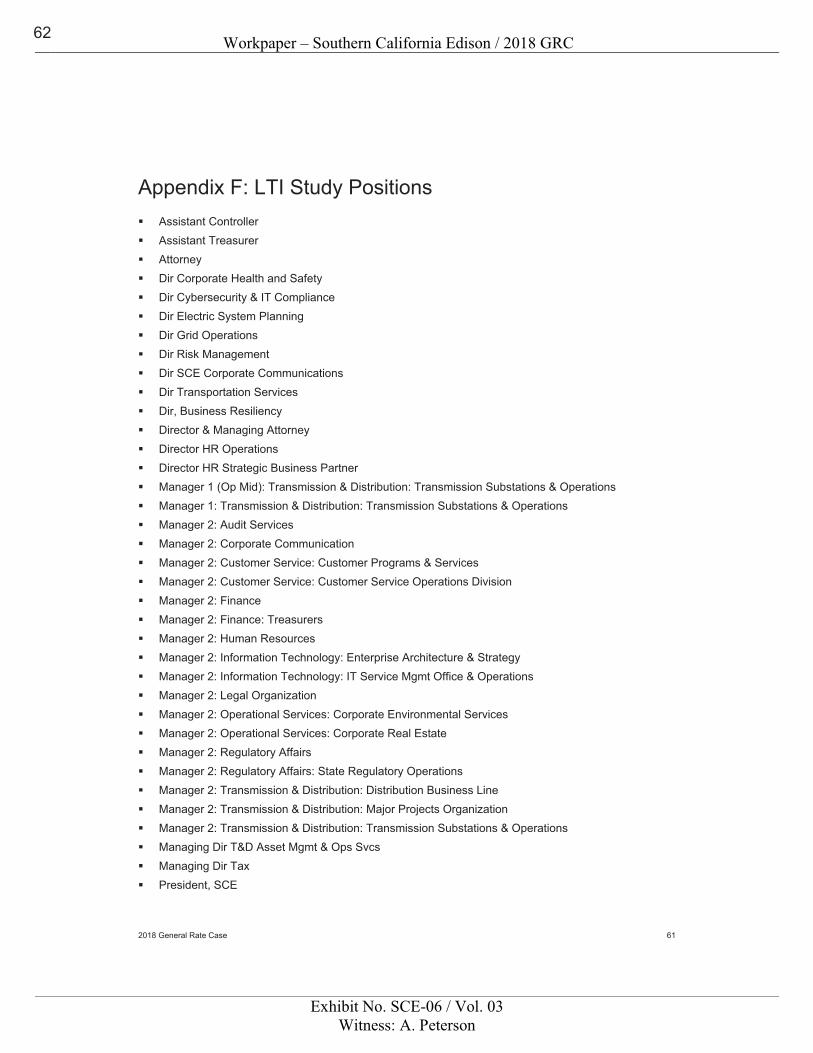
Workpaper – Southern California Edison / 2018 GRC
Exhibit No. SCE-06 / Vol. 03Witness: A. Peterson
2018 General Rate Case 61
Appendix F: LTI Study Positions � Assistant Controller � Assistant Treasurer � Attorney � Dir Corporate Health and Safety � Dir Cybersecurity & IT Compliance � Dir Electric System Planning � Dir Grid Operations � Dir Risk Management � Dir SCE Corporate Communications � Dir Transportation Services � Dir, Business Resiliency � Director & Managing Attorney � Director HR Operations � Director HR Strategic Business Partner � Manager 1 (Op Mid): Transmission & Distribution: Transmission Substations & Operations � Manager 1: Transmission & Distribution: Transmission Substations & Operations � Manager 2: Audit Services � Manager 2: Corporate Communication � Manager 2: Customer Service: Customer Programs & Services � Manager 2: Customer Service: Customer Service Operations Division � Manager 2: Finance � Manager 2: Finance: Treasurers � Manager 2: Human Resources � Manager 2: Information Technology: Enterprise Architecture & Strategy � Manager 2: Information Technology: IT Service Mgmt Office & Operations � Manager 2: Legal Organization � Manager 2: Operational Services: Corporate Environmental Services � Manager 2: Operational Services: Corporate Real Estate � Manager 2: Regulatory Affairs � Manager 2: Regulatory Affairs: State Regulatory Operations � Manager 2: Transmission & Distribution: Distribution Business Line � Manager 2: Transmission & Distribution: Major Projects Organization � Manager 2: Transmission & Distribution: Transmission Substations & Operations � Managing Dir T&D Asset Mgmt & Ops Svcs � Managing Dir Tax � President, SCE
62
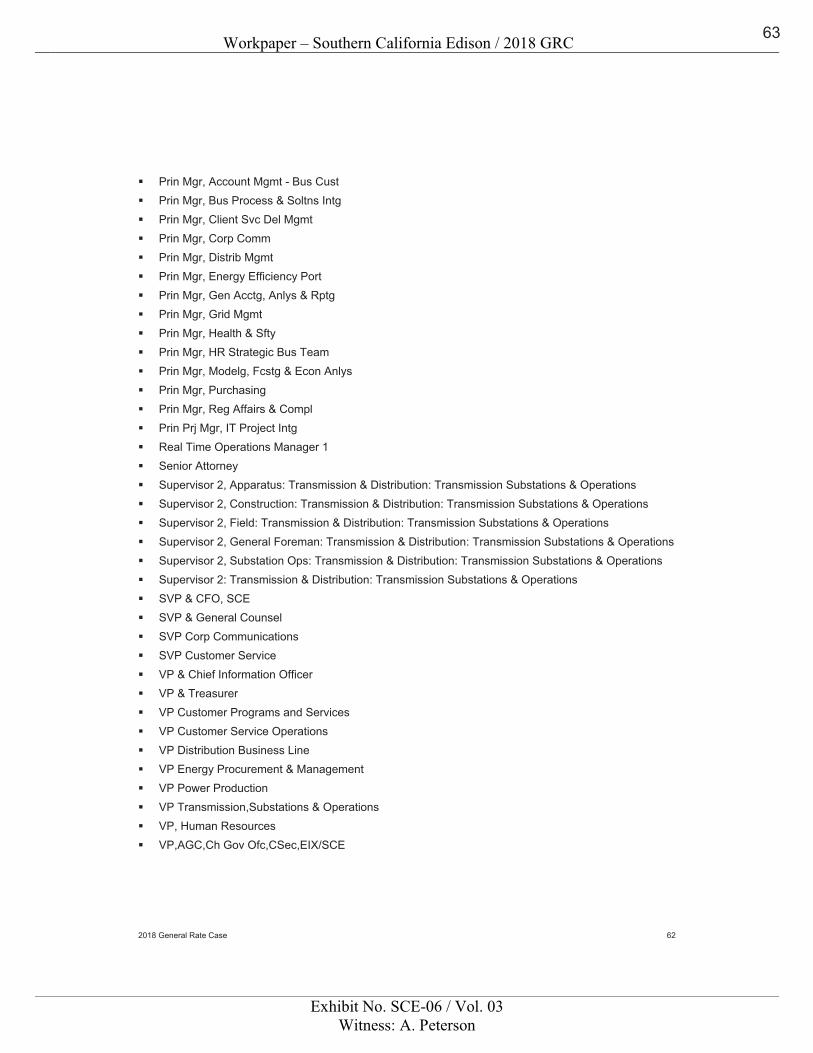
Workpaper – Southern California Edison / 2018 GRC
Exhibit No. SCE-06 / Vol. 03Witness: A. Peterson
2018 General Rate Case 62
� Prin Mgr, Account Mgmt - Bus Cust � Prin Mgr, Bus Process & Soltns Intg � Prin Mgr, Client Svc Del Mgmt � Prin Mgr, Corp Comm � Prin Mgr, Distrib Mgmt � Prin Mgr, Energy Efficiency Port � Prin Mgr, Gen Acctg, Anlys & Rptg � Prin Mgr, Grid Mgmt � Prin Mgr, Health & Sfty � Prin Mgr, HR Strategic Bus Team � Prin Mgr, Modelg, Fcstg & Econ Anlys � Prin Mgr, Purchasing � Prin Mgr, Reg Affairs & Compl � Prin Prj Mgr, IT Project Intg � Real Time Operations Manager 1 � Senior Attorney � Supervisor 2, Apparatus: Transmission & Distribution: Transmission Substations & Operations � Supervisor 2, Construction: Transmission & Distribution: Transmission Substations & Operations � Supervisor 2, Field: Transmission & Distribution: Transmission Substations & Operations � Supervisor 2, General Foreman: Transmission & Distribution: Transmission Substations & Operations � Supervisor 2, Substation Ops: Transmission & Distribution: Transmission Substations & Operations � Supervisor 2: Transmission & Distribution: Transmission Substations & Operations � SVP & CFO, SCE � SVP & General Counsel � SVP Corp Communications � SVP Customer Service � VP & Chief Information Officer � VP & Treasurer � VP Customer Programs and Services � VP Customer Service Operations � VP Distribution Business Line � VP Energy Procurement & Management � VP Power Production � VP Transmission,Substations & Operations � VP, Human Resources � VP,AGC,Ch Gov Ofc,CSec,EIX/SCE
63
Workpaper – Southern California Edison / 2018 GRC
Exhibit No. SCE-06 / Vol. 03Witness: A. Peterson
2018 General Rate Case 63
Appendix G: Benefit Calculation Samples (SCE and Comparator Company)
64
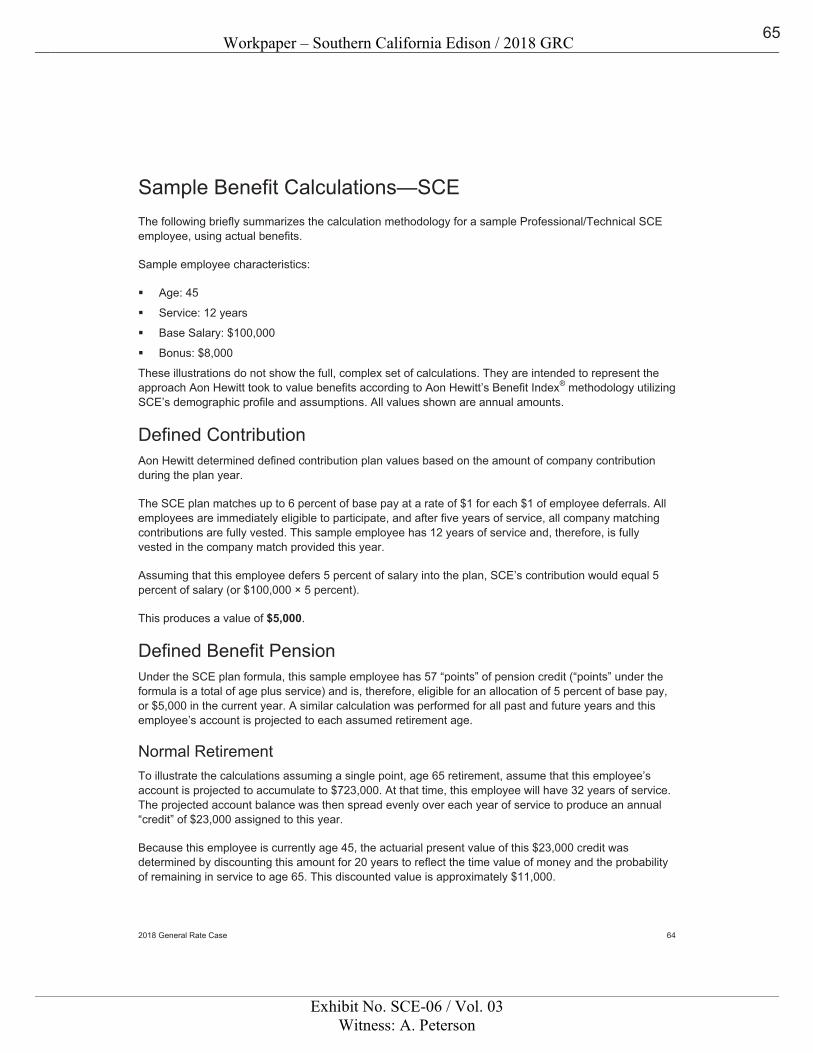
Workpaper – Southern California Edison / 2018 GRC
Exhibit No. SCE-06 / Vol. 03Witness: A. Peterson
2018 General Rate Case 64
Sample Benefit Calculations—SCE The following briefly summarizes the calculation methodology for a sample Professional/Technical SCE employee, using actual benefits.
Sample employee characteristics:
� Age: 45
� Service: 12 years
� Base Salary: $100,000
� Bonus: $8,000
These illustrations do not show the full, complex set of calculations. They are intended to represent the approach Aon Hewitt took to value benefits according to Aon Hewitt’s Benefit Index® methodology utilizing SCE’s demographic profile and assumptions. All values shown are annual amounts.
Defined Contribution Aon Hewitt determined defined contribution plan values based on the amount of company contribution during the plan year.
The SCE plan matches up to 6 percent of base pay at a rate of $1 for each $1 of employee deferrals. All employees are immediately eligible to participate, and after five years of service, all company matching contributions are fully vested. This sample employee has 12 years of service and, therefore, is fully vested in the company match provided this year.
Assuming that this employee defers 5 percent of salary into the plan, SCE’s contribution would equal 5 percent of salary (or $100,000 × 5 percent).
This produces a value of $5,000.
Defined Benefit Pension Under the SCE plan formula, this sample employee has 57 “points” of pension credit (“points” under the formula is a total of age plus service) and is, therefore, eligible for an allocation of 5 percent of base pay, or $5,000 in the current year. A similar calculation was performed for all past and future years and this employee’s account is projected to each assumed retirement age.
Normal Retirement To illustrate the calculations assuming a single point, age 65 retirement, assume that this employee’s account is projected to accumulate to $723,000. At that time, this employee will have 32 years of service. The projected account balance was then spread evenly over each year of service to produce an annual “credit” of $23,000 assigned to this year.
Because this employee is currently age 45, the actuarial present value of this $23,000 credit was determined by discounting this amount for 20 years to reflect the time value of money and the probability of remaining in service to age 65. This discounted value is approximately $11,000.
65
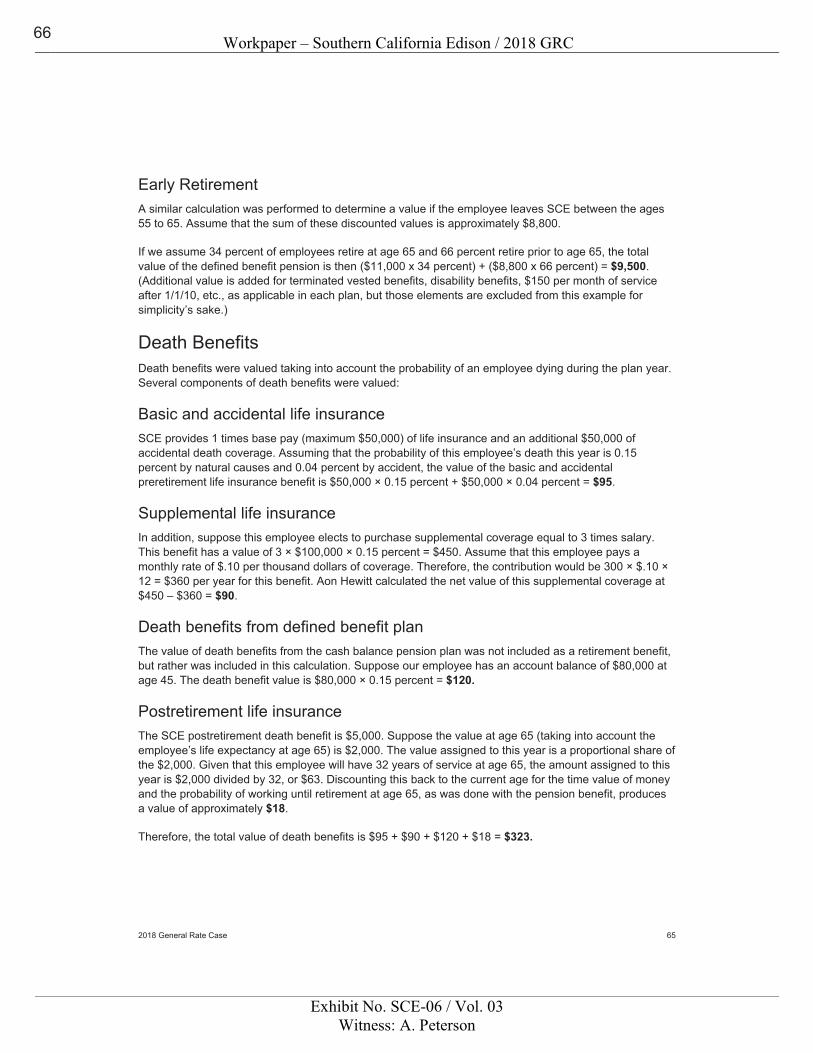
Workpaper – Southern California Edison / 2018 GRC
Exhibit No. SCE-06 / Vol. 03Witness: A. Peterson
2018 General Rate Case 65
Early Retirement A similar calculation was performed to determine a value if the employee leaves SCE between the ages 55 to 65. Assume that the sum of these discounted values is approximately $8,800.
If we assume 34 percent of employees retire at age 65 and 66 percent retire prior to age 65, the total value of the defined benefit pension is then ($11,000 x 34 percent) + ($8,800 x 66 percent) = $9,500. (Additional value is added for terminated vested benefits, disability benefits, $150 per month of service after 1/1/10, etc., as applicable in each plan, but those elements are excluded from this example for simplicity’s sake.)
Death Benefits Death benefits were valued taking into account the probability of an employee dying during the plan year. Several components of death benefits were valued:
Basic and accidental life insurance SCE provides 1 times base pay (maximum $50,000) of life insurance and an additional $50,000 of accidental death coverage. Assuming that the probability of this employee’s death this year is 0.15 percent by natural causes and 0.04 percent by accident, the value of the basic and accidental preretirement life insurance benefit is $50,000 × 0.15 percent + $50,000 × 0.04 percent = $95.
Supplemental life insurance In addition, suppose this employee elects to purchase supplemental coverage equal to 3 times salary. This benefit has a value of 3 × $100,000 × 0.15 percent = $450. Assume that this employee pays a monthly rate of $.10 per thousand dollars of coverage. Therefore, the contribution would be 300 × $.10 × 12 = $360 per year for this benefit. Aon Hewitt calculated the net value of this supplemental coverage at $450 – $360 = $90.
Death benefits from defined benefit plan The value of death benefits from the cash balance pension plan was not included as a retirement benefit, but rather was included in this calculation. Suppose our employee has an account balance of $80,000 at age 45. The death benefit value is $80,000 × 0.15 percent = $120.
Postretirement life insurance The SCE postretirement death benefit is $5,000. Suppose the value at age 65 (taking into account the employee’s life expectancy at age 65) is $2,000. The value assigned to this year is a proportional share of the $2,000. Given that this employee will have 32 years of service at age 65, the amount assigned to this year is $2,000 divided by 32, or $63. Discounting this back to the current age for the time value of money and the probability of working until retirement at age 65, as was done with the pension benefit, produces a value of approximately $18.
Therefore, the total value of death benefits is $95 + $90 + $120 + $18 = $323.
66
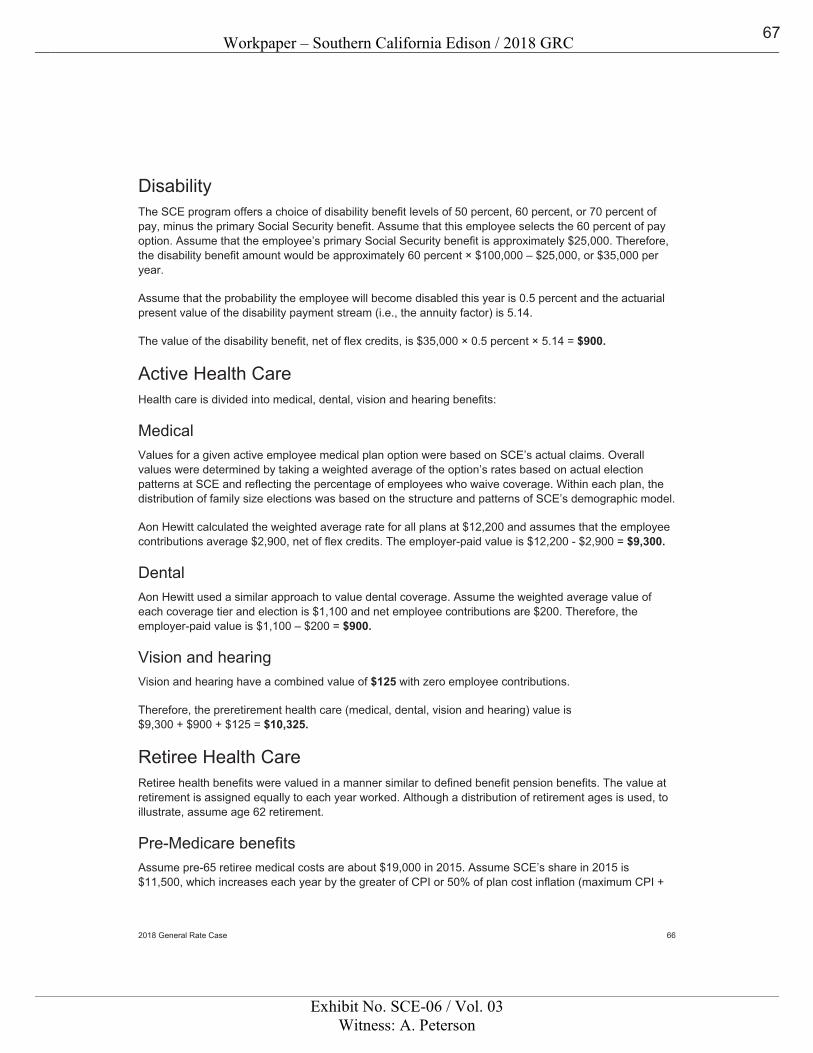
Workpaper – Southern California Edison / 2018 GRC
Exhibit No. SCE-06 / Vol. 03Witness: A. Peterson
2018 General Rate Case 66
Disability The SCE program offers a choice of disability benefit levels of 50 percent, 60 percent, or 70 percent of pay, minus the primary Social Security benefit. Assume that this employee selects the 60 percent of pay option. Assume that the employee’s primary Social Security benefit is approximately $25,000. Therefore, the disability benefit amount would be approximately 60 percent × $100,000 – $25,000, or $35,000 per year.
Assume that the probability the employee will become disabled this year is 0.5 percent and the actuarial present value of the disability payment stream (i.e., the annuity factor) is 5.14.
The value of the disability benefit, net of flex credits, is $35,000 × 0.5 percent × 5.14 = $900.
Active Health Care Health care is divided into medical, dental, vision and hearing benefits:
Medical Values for a given active employee medical plan option were based on SCE’s actual claims. Overall values were determined by taking a weighted average of the option’s rates based on actual election patterns at SCE and reflecting the percentage of employees who waive coverage. Within each plan, the distribution of family size elections was based on the structure and patterns of SCE’s demographic model.
Aon Hewitt calculated the weighted average rate for all plans at $12,200 and assumes that the employee contributions average $2,900, net of flex credits. The employer-paid value is $12,200 - $2,900 = $9,300.
Dental Aon Hewitt used a similar approach to value dental coverage. Assume the weighted average value of each coverage tier and election is $1,100 and net employee contributions are $200. Therefore, the employer-paid value is $1,100 – $200 = $900.
Vision and hearing Vision and hearing have a combined value of $125 with zero employee contributions.
Therefore, the preretirement health care (medical, dental, vision and hearing) value is $9,300 + $900 + $125 = $10,325.
Retiree Health Care Retiree health benefits were valued in a manner similar to defined benefit pension benefits. The value at retirement is assigned equally to each year worked. Although a distribution of retirement ages is used, to illustrate, assume age 62 retirement.
Pre-Medicare benefits Assume pre-65 retiree medical costs are about $19,000 in 2015. Assume SCE’s share in 2015 is $11,500, which increases each year by the greater of CPI or 50% of plan cost inflation (maximum CPI +
67

Workpaper – Southern California Edison / 2018 GRC
Exhibit No. SCE-06 / Vol. 03Witness: A. Peterson
2018 General Rate Case 67
2%). When a person who is age 45 in 2015 reaches age 62 in 2032, assume pre-65 retiree medical costs are $45,800 per year and SCE’s share is now $21,000. The retiree’s portion is $45,800 - $21,000 = $24,800. Aon Hewitt assumes the value of this benefit at age 62 is $65,000 for the 3 years of pre-Medicare coverage. Because the employee will have 29 years of service at age 62, the value of $65,000 is divided by 29 = $2,200 per working year. Discounting that to the current year for the time value of money and the probability of remaining in service until 62, gives an approximate value of $830.
Medicare-eligible Assume that at age 65 the annual cost will be approximately $24,400 per year, to reflect coordination with Medicare. Assume also that SCE will pay about $6,200 per year. Aon Hewitt estimates the actuarial, lifetime present value at age 65 is approximately $84,500. Spreading this amount over 29 years produces an annual value of $2,900. Discounting this to the current year gives an approximate present value of $1,300.
Therefore, the total retiree health value is $830 + $1,300 = $2,130.
Paid Time Off Paid time off benefits in excess of currently used days were valued similar to a pension benefit paid out as a lump sum at retirement/termination. This equals about 1.5 percent of salary.
Therefore, the value of unused paid time off is $100,000 x 1.5 percent = $1,500.
Overall Benefit Value The value for this sample SCE employee is approximately:
Benefit Area Benefit Index Value Defined Contribution $5,000 Defined Benefit 9,500 Death 323 Disability 900 Active Health Care 10,325 Retiree Health Care 2,130 Paid Time Off 1,500 Total $29,678
68
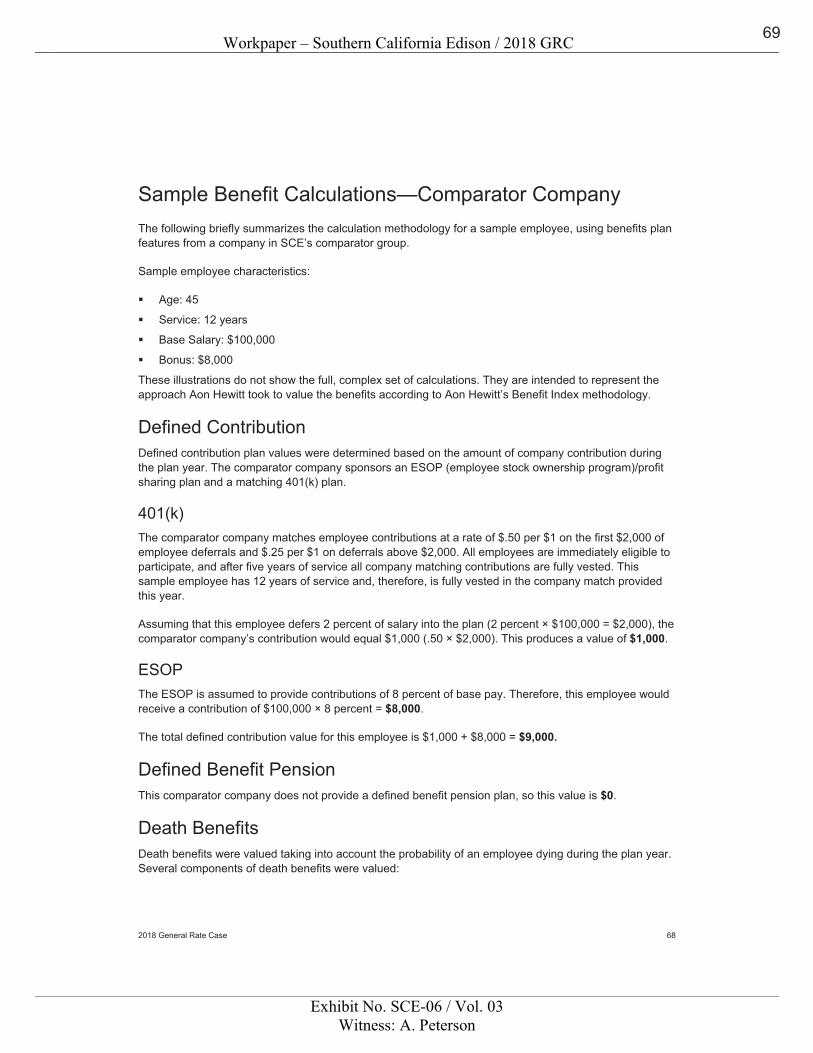
Workpaper – Southern California Edison / 2018 GRC
Exhibit No. SCE-06 / Vol. 03Witness: A. Peterson
2018 General Rate Case 68
Sample Benefit Calculations—Comparator Company The following briefly summarizes the calculation methodology for a sample employee, using benefits plan features from a company in SCE’s comparator group.
Sample employee characteristics:
� Age: 45
� Service: 12 years
� Base Salary: $100,000
� Bonus: $8,000
These illustrations do not show the full, complex set of calculations. They are intended to represent the approach Aon Hewitt took to value the benefits according to Aon Hewitt’s Benefit Index methodology.
Defined Contribution Defined contribution plan values were determined based on the amount of company contribution during the plan year. The comparator company sponsors an ESOP (employee stock ownership program)/profit sharing plan and a matching 401(k) plan.
401(k) The comparator company matches employee contributions at a rate of $.50 per $1 on the first $2,000 of employee deferrals and $.25 per $1 on deferrals above $2,000. All employees are immediately eligible to participate, and after five years of service all company matching contributions are fully vested. This sample employee has 12 years of service and, therefore, is fully vested in the company match provided this year.
Assuming that this employee defers 2 percent of salary into the plan (2 percent × $100,000 = $2,000), the comparator company’s contribution would equal $1,000 (.50 × $2,000). This produces a value of $1,000.
ESOP The ESOP is assumed to provide contributions of 8 percent of base pay. Therefore, this employee would receive a contribution of $100,000 × 8 percent = $8,000.
The total defined contribution value for this employee is $1,000 + $8,000 = $9,000.
Defined Benefit Pension This comparator company does not provide a defined benefit pension plan, so this value is $0.
Death Benefits Death benefits were valued taking into account the probability of an employee dying during the plan year. Several components of death benefits were valued:
69
Workpaper – Southern California Edison / 2018 GRC
Exhibit No. SCE-06 / Vol. 03Witness: A. Peterson
2018 General Rate Case 69
Basic and accidental life insurance The comparator company provides a basic death benefit of 2 times salary ($200,000 for this employee) and an additional 1 times salary ($100,000) of accidental death coverage. Assuming that the probability of this employee’s death this year is 0.15 percent by natural causes and 0.04 percent by accident, the value of the basic and accidental preretirement life insurance benefit is $200,000 × 0.15 percent + $100,000 × 0.04 percent = $340.
Supplemental life insurance In addition, suppose this employee elects to purchase supplemental coverage equal to 2 times salary. This benefit has a value of 2 × $100,000 × 0.15 percent = $300. Assume that this employee pays a monthly rate of $.12 per thousand dollars of coverage. Therefore, the contribution would be 200 × $.12 × 12 = $288 per year for this benefit. The net value of this supplemental coverage is $300 – $288 = $12.
Death benefits from defined benefit plan Because the comparator company does not sponsor a defined benefit plan, this value is $0.
Postretirement life insurance The comparator company does not provide a postretirement life insurance benefit. Therefore, this value is $0.
Therefore, the total value of death benefits is $340 + $12 + $0 + $0 = $352.
Disability The comparator company provides a disability benefit equal to 67 percent of annual pay, minus the family Social Security benefit. Assume that the employee’s family Social Security benefit is approximately $40,000. Therefore, the disability benefit amount would be approximately 67 percent × $100,000 – $40,000, or $27,000 per year.
Aon Hewitt assumes that the probability the employee will become disabled this year is 0.5 percent and the actuarial present value of the disability payment stream (i.e., the annuity factor) is 5.14.
The value of the disability benefit is $27,000 × 0.5 percent × 5.14 = $694.
Active Health Care Health care is divided into medical, dental, vision and hearing benefits:
Medical Values for a given active employee medical plan option were based on SCE’s actual claims. Overall values were determined by taking a weighted average of the option’s rates based on actual election patterns at SCE and reflecting the percentage of employees who waive coverage. Within each plan, the distribution of family size elections was based on the structure and patterns of SCE’s demographic model.
70
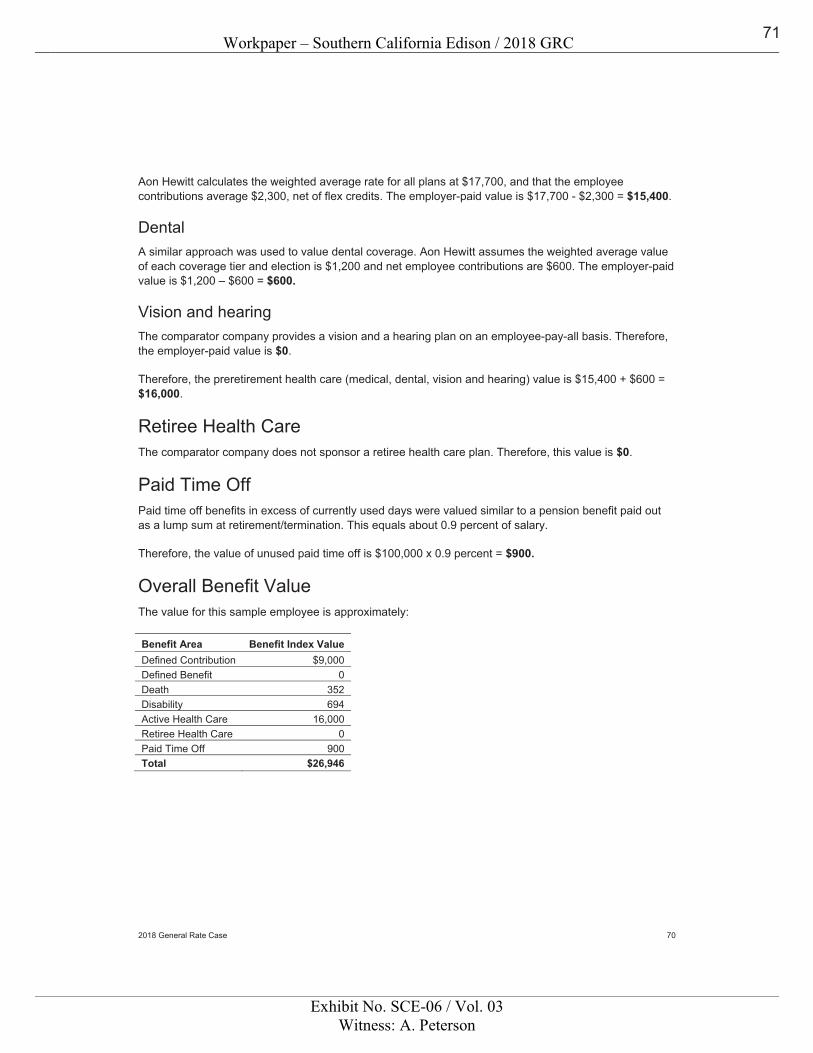
Workpaper – Southern California Edison / 2018 GRC
Exhibit No. SCE-06 / Vol. 03Witness: A. Peterson
2018 General Rate Case 70
Aon Hewitt calculates the weighted average rate for all plans at $17,700, and that the employee contributions average $2,300, net of flex credits. The employer-paid value is $17,700 - $2,300 = $15,400.
Dental A similar approach was used to value dental coverage. Aon Hewitt assumes the weighted average value of each coverage tier and election is $1,200 and net employee contributions are $600. The employer-paid value is $1,200 – $600 = $600.
Vision and hearing The comparator company provides a vision and a hearing plan on an employee-pay-all basis. Therefore, the employer-paid value is $0.
Therefore, the preretirement health care (medical, dental, vision and hearing) value is $15,400 + $600 = $16,000.
Retiree Health Care The comparator company does not sponsor a retiree health care plan. Therefore, this value is $0.
Paid Time Off Paid time off benefits in excess of currently used days were valued similar to a pension benefit paid out as a lump sum at retirement/termination. This equals about 0.9 percent of salary.
Therefore, the value of unused paid time off is $100,000 x 0.9 percent = $900.
Overall Benefit Value The value for this sample employee is approximately:
Benefit Area Benefit Index Value Defined Contribution $9,000 Defined Benefit 0 Death 352 Disability 694 Active Health Care 16,000 Retiree Health Care 0 Paid Time Off 900 Total $26,946
71

Workpaper – Southern California Edison / 2018 GRC
Exhibit No. SCE-06 / Vol. 03Witness: A. Peterson
2018 General Rate Case 71
Appendix H: Meeting Notes
72
Workpaper – Southern California Edison / 2018 GRC
Exhibit No. SCE-06 / Vol. 03Witness: A. Peterson
Consulting | Broad-Based Compensation 1
Date: March 3, 2016
To: The GRC Study Team (the Team)
From: Alison Peterson, Aon Hewitt
Subject: Meeting Notes, March 3, 2016
Meeting Attendees Name Organization
George DeMaria Southern California Edison (SCE) Colleen Hernandez SCE Rahab Mahfud SCE Michelle Ricard SCE Al Kopec Aon Hewitt (AH) Kathy Miller AH Blake Murphy AH Chelsea Penaloza AH Alison Peterson AH
Discussion Items Opening Remarks and Introductions � All participants introduced themselves.
� Aon Hewitt (AH) outlined the agenda items for the meeting and reviewed the materials that were sentout in advance to provide Team members a chance to prepare for the meeting and to make themeeting as efficient and productive as possible. Materials included:
– Materials to be used to facilitate the meeting
– A copy of the 2015 Total Compensation Study report
– Participant lists from Aon Hewitt’s 2015 Benefits Index (BI) Database and Total CompensationMeasurement (TCM) Database
– A compensation and benefits data request created by AH for Southern California Edison (SCE)
� Alison explained that AH will facilitate this and future meetings with a focus on allowing sufficient timeto explore and discuss all topics while also working to stay on track with the project timeline. Sheasked that the Team provide feedback to ensure we are meeting everyone’s needs and addressingall topics of interest.
� AH confirmed that the Team will strive to replicate the approach and methodology applied in the 2015Study and that in this meeting we will review each component to confirm our approach.
Process � The intent is to meet face-to-face but for shorter topics, or where there are conflicts with scheduling,
conference calls may need to be scheduled instead of in-person meetings. The Team agreed to the approach.
� For each meeting AH will develop facilitation materials, an agenda, and a summary of the priormeeting notes. AH will then facilitate the meetings and capture meeting notes.
73
Workpaper – Southern California Edison / 2018 GRC
Exhibit No. SCE-06 / Vol. 03Witness: A. Peterson
March 3, 2016 The GRC Study Team Page 2
2
� The Team reviewed the meeting process, team ground rules, high level project steps, timing, key deliverables, milestones and preliminary schedule.
– George and Colleen will act as Subject Matter Experts (SMEs) for SCE compensation.
– Michelle’s role will be to ensure issues are resolved, and that the Study stays on schedule.
– Rahab’s expertise will be from a regulatory perspective, including serving as a liaison if interaction is required with the regulatory team.
– Additional SMEs may be brought in around compensation and benefits topics, including bringing in SCE’s Benefits Manager for benefits discussions.
� AH described the process for reviewing the report which includes AH creating the first draft of the report and circulating it to the Team for review and comment. The Team will come together to incorporate edits and discuss any changes to come to consensus.
� The Team reviewed the meeting notes format and generally agreed that the format should remain consistent with the 2015 Study.
Methodology Job Categories � The Team reviewed the list of the five job categories (executive, managerial & supervisory,
professional/technical, physical/technical & clerical) used in the 2015 Study and agreed to use those same categories and definitions. We agreed to clarify that the executive category includes “Officers of the Company” and we will refine the description accordingly.
Pay Elements � The Team reviewed the pay elements included in the 2015 Study: base pay, total cash (base pay
plus actual bonus), benefits, and Long-Term Incentives (LTI) and asked if these are the elements to include in this Study.
� SCE proposed inclusion of target cash compensation in the Study in addition to actual total cash compensation and commented that PG&E used this approach in their most recent filing as well.
� AH noted that not all surveys include target bonus. AH additionally offered that pay practice data may be available that describes actual payouts compared to target on a broad basis. The Team agreed that it is important to ensure that the data is as reliable as actual total compensation data.
� SCE will send AH the most recent peer company Studies that include target total compensation. AH will evaluate the data to assess the reliability of target pay information and will report back out at the next meeting. The team will evaluate the analysis of target data and determine of both actual and target will be included in the 2018 Study. Pay elements to be excluded:
– Non-cash benefits such as time-off and short-term disability (part of base salary)
– Spot awards (not reflected in survey data and typically less than 1% of payroll)
SCE asked about including Spot awards in the Study given the CPUC’s interest in this area. AH explained that general industry data is available on funding of spot awards but that information is not included for specific jobs in any of the survey sources used in the Study. The Team decided not to include spot awards in the Study but will evaluate if analysis should be completed separately.
– Shift differentials and overtime (not reflected in survey data and wide variances exist)
� Treatment of Edison International (EIX) jobs
– Similar to previous Studies, SCE will identify EIX executive level jobs that spend part of their time supporting SCE. That information will be reviewed at the next Team meeting including the percentage of time spent supporting SCE. We will then include the total compensation costs related to that percentage of time in the Study.
74
Workpaper – Southern California Edison / 2018 GRC
Exhibit No. SCE-06 / Vol. 03Witness: A. Peterson
March 3, 2016 The GRC Study Team Page 3
3
Benefits � SCE commented that there are some benefits program changes since the last Study. We will invite
someone from SCE Benefits to provide an overview of those changes at the next Team meeting.
Demographic � AH recapped the process for valuing benefits including using the SCE demographic as well as
soliciting executive compensation and benefits data from the Office of Ratepayer Advocates (ORA) requested companies including California Public Utilities Commission (CPUC), Los Angeles Department of Water & Power (LADWP), and Sacramento Municipal Utility District (SMUD).
� For the 2015 Study, the ORA requested that the SCE executive population data be used to value benefits for executives. In prior Studies AH’s standard demographic profile was used in order to provide a credible sample size. AH reiterated concerns expressed during the 2015 Study process that using the small SCE executive population for valuing benefits was problematic because the sample size is not large enough to be statistically reliable. In the 2015 Study, the Team agreed to use 20 years of SCE’s executive demographic data to create a larger sample, however, that approach meant that the same executive would be included multiple times since most have several years of tenure as an executive at SCE. The Team discussed if the concerns about the small sample size warranted reverting to the use of the AH standard demographic profile only for the executive population. The SCE team will consider this and we will revisit this methodological issue at the next meeting.
Comparators � SCE explained that the comparator group(s) used in the 2018 Study will need to be circulated to the
interveners for comment.
� AH highlighted that the majority of companies used in the 2015 Study are in the current AH database. A few of the companies from the 2015 Study were acquired by another comparator. We discussed the need to target about 20 companies per comparator group in order to have a sufficient sample size and concluded that we may not need to replace the acquired companies because their pay and benefits data would still be reflected in the data of the acquirer. We also felt that adding new companies to the list could introduce change to the Study results and that that was not necessary if we could maintain the target of approximately 20 companies after accounting for the acquisitions. The team agreed that was a reasonable approach. We will revisit the list of comparators at the next meeting and finalize it.
� Data from some of the comparators does need to be updated for 2015 including CPUC, LADWP, Jacobs Engineering, Jet Propulsion Lab, PPL, SMUD, and Sempra (SDG&E and SoCalGas). AH believes we will be successful in soliciting up-to-date data, however, if we are unsuccessful in updating the data we may need to add comparators. We will begin solicitation efforts shortly.
� GenOn Energy was acquired by NRG Energy which will be included as a comparator. In addition, Constellation Energy Group was acquired by Exelon Company which is also a comparator.
� For the non-executive general industry comparator group, WellPoint Health Networks data is not available. The team will determine if a replacement in required at the next meeting.
� For the executive comparator group, the Team agreed that we will review revenue scope for all comparators to ensure they meet the guidelines of having revenue within a range of 50% to 200% of SCE’s revenue in 2015. AH will gather 2015 revenue data for review by the team and will also provide a list of companies in the 2015 database that meet this revenue requirement should we need to replace any of the 2015 comparators due to revenue size issues.
PTO � The Team discussed the approach of valuing and reporting PTO separately as was done at the
ORA’s request in the 2015 Study. The team discussed the limited impact this approach had on the Study results and noted that the methodology change added complexity, time, and cost to the last Study.
75
Workpaper – Southern California Edison / 2018 GRC
Exhibit No. SCE-06 / Vol. 03Witness: A. Peterson
March 3, 2016 The GRC Study Team Page 4
4
� SCE outlined that had PTO not been valued separately that SCE’s position to market on total compensation would have actually been lower in the last Study. SCE further commended that in addition, PG&E did not do a PTO carve out in their most recent study.
� AH suggested that the Team consider credibility of methodology, materiality to Study results, the Team’s desire to be consistent in the methodology used and the approach other peer utilities like PG&E used in their most recent Studies in evaluating whether methodological changes from the 2015 Study should be made.
� The SCE team agreed to discuss and make a decision on whether to include or exclude PTO in advance of the next Team meeting.
Compensation � AH recapped that we benchmarked 245 jobs in the last Study and that data was available for 224
jobs. That allowed us to achieve coverage of about 76% of SCE’s population. Based on parameters on benchmarking included in SCE’s Request for Proposal (RFP) for the Study, AH included 225 benchmarks in the project plan.
� SCE confirmed that we would use the same benchmarks as the 2015 Study. AH agreed this was the appropriate starting point but mentioned that some jobs from the prior Study may no longer exist and that some new high-incumbent jobs may have been created that should be included.
� SCE commented that nuclear is not part of the GRC recovery process and asked if those jobs should be excluded from the Study. SCE to clarify in advance of the next methodology meeting.
� SCE further described that other groups have also been eliminated, such as IT that was outsourced.
Generic Jobs � The Team agreed to use the same approach for jobs described as “generic” in the Study.
Study Effective Date � SCE proposed an effective date for the Study is December 31, 2015. The Team agreed.
Escalation Factor � AH described the alternatives for selecting an escalation/adjustment factor to bring the data to a
common date. AH reminded the Team that the ORA changed the methodology in the 2015 Study to use the labor escalation rate. At the time, AH pointed out that the labor escalation rate is not representative of the rate of change in market data collected from salary surveys and therefore was not an appropriate escalation factor. The best practice methodology is to apply a compensation escalation factor derived from any of the major salary increase survey studies conducted each year.
� The Team agreed that the market based salary escalation factor best represents the salary market movement and was a more appropriate factor.
� The Team agreed to compare the most recent labor escalation factor to the results of the salary escalation factors reported in the most recent survey results and make a determination on approach in the next meeting. AH will provide the salary increase information.
– As a reference, SCE provided the 2015 approved labor escalation factor of 2.68%.
Survey Sources � The Team reviewed and confirmed the list of preferred survey sources.
Labor Market Definition � AH reminded the Team of the approach used in the 2015 Study of using a national cut of the market
data adjusted for geography for non-executive jobs.
� Directors and Officers were benchmarked using revenue cuts, where available.
� The Team agreed to keep the same approved approach as the 2015 Study.
76
Workpaper – Southern California Edison / 2018 GRC
Exhibit No. SCE-06 / Vol. 03Witness: A. Peterson
March 3, 2016 The GRC Study Team Page 5
5
Long-Term Incentive Eligibility � AH recapped the methodology used when determining which jobs in the Study would include LTI
values as part of total compensation. Only jobs where 50% or more of the comparator group reports that the job is eligible for LTI will be included. The Team agreed to continue with this approach.
� AH commented that target LTI data is typically not available and therefore we may not be able to report target total compensation. AH will evaluate the availability of data and present to the team.
Next Steps and Follow-Ups � Action Items for AH include:
– Compile revenue size for the comparator groups to make sure they still fit the approved criteria.
– Evaluate survey sources for target total cash and target LTI to see what is available.
– Extract Economic Research Institute (ERI) data for geographic adjustment analysis. Confirm that the Bureau of Labor Statistics (BLS) that was used in the last Study no longer reports geographic adjustments and therefore will not be used for the 2018 Study.
– Contact participants in the benefits comparator group who did not provide plan information to determine if they will submit that information.
– Update the list of benchmark jobs with current data to reflect incumbent count and confirm the job still exists. SCE will provide the update to the data as outlined below.
– Create a spreadsheet for SCE’s use in defining the appropriate labor market for each benchmark job and provide to SCE
– Calculate the weighted average escalation factor once updated employee and job data is provided by SCE.
� Action items for SCE include:
– Clarify if nuclear jobs should be excluded from the Study.
– Review Study report and meeting notes format and content and provide suggested changes to sections, format, etc.
– SCE to send AH the most recent peer company Studies that include target total compensation to review their decision, data format and sources, including what was approved by ORA.
– Compile data on the EIX executive jobs that have SCE accountabilities and provide that information to the Team.
– Compile data on executive demographics for the past three years and present that at the next meeting.
– Respond to compensation and benefits data requests.
– Once approved, circulate the benefits comparator group list to the interveners for comment.
– Send out meeting requests for the dates selected for future meetings.
– Determine SCE’s position on:
Using the SCE executive population to create a demographic profile versus using AH’s standard demographic profile for executive positions.
Reporting of PTO values as a separate component of compensation.
Use of the labor escalation rate versus the salary increase survey escalation factor for adjusting market data to the effective date of the Study.
� The next Team meeting is scheduled for March 14 at 10 am in SCE’s Rosemead office.
77
Workpaper – Southern California Edison / 2018 GRC
Exhibit No. SCE-06 / Vol. 03Witness: A. Peterson
Consulting | Broad-Based Compensation 1
Date: March 14, 2016
To: The GRC Study Team (the Team)
From: Alison Peterson, Aon Hewitt
Subject: Meeting Notes, March 14, 2016
Meeting Attendees Name Organization
Mark Bennett Southern California Edison (SCE) George DeMaria SCE Colleen Hernandez SCE Rahab Mahfud SCE Michelle Ricard SCE Al Kopec Aon Hewitt (AH) Kathy Miller AH Blake Murphy AH Chelsea Penaloza AH Alison Peterson AH
Follow-Up on Action Items Aon Hewitt � Compile revenue size for the comparator groups to make sure they still fit the approved criteria.
(Completed)
� Evaluate survey sources for target total cash and target LTI to see what is available. (Completed)
– Target total cash and target total direct compensation is available for the primary surveys used inthe Study.
� Extract Economic Research Institute (ERI) data for geographic adjustment analysis. (Completed)
� Confirm that the Bureau of Labor Statistics (BLS) that was used in the last Study no longer reportsgeographic adjustments and therefore will not be used for the 2018 Study. (In progress)
� Contact participants in the benefits comparator group who did not provide plan information todetermine if they will submit that information. (In progress)
– Process to contact PPL, Sempra, Jacobs Engineering and Jet Propulsion has begun.
– Waiting to contact CPUC, LADWP, and SMUD until executive comparators are selected in orderto submit one data request for compensation and benefits.
� Update the list of benchmark jobs with current data to reflect incumbent count and confirm the job stillexists. (Completed)
� Create a spreadsheet for SCE’s use in defining the appropriate labor market for each benchmark joband provide to SCE. (Completed)
� Calculate the weighted average escalation factor once updated employee and job data is provided bySCE. (Completed)
78
Workpaper – Southern California Edison / 2018 GRC
Exhibit No. SCE-06 / Vol. 03Witness: A. Peterson
March 14, 2016 The GRC Study Team Page 2
2
SCE � Clarify if nuclear jobs should be excluded from the Study.
– The SCE team confirmed that nuclear jobs will be excluded from the Study.
� Review Study report and meeting notes format and content and provide suggested changes to sections, format, etc. (Completed)
� SCE to send AH the most recent peer company Studies that include target total compensation to review their decision, data format and sources, including what was approved by ORA. (Completed)
� Compile data on the EIX executive jobs that have SCE accountabilities and provide that information to the Team. (Completed)
� Compile data on executive demographics for the past three years and present that at the next meeting. (Completed)
� Respond to compensation and benefits data requests. (In progress)
� Once approved, circulate the comparator group lists to the interveners for comment.
� Send out meeting requests for the dates selected for future meetings. (Completed)
� Determine SCE’s position on:
– Using the SCE executive population to create a demographic profile versus using AH’s standard demographic profile for executive positions. (Completed)
– Reporting of PTO values as a separate component of compensation. (Completed)
– Use of the labor escalation rate versus the salary increase survey escalation factor for adjusting market data to the effective date of the Study. (Completed)
Discussion Items Methodology � SCE expressed the desire to maintain the same, approved, methodology as the last Study and
therefore decided:
– Not to include target total cash and target total compensation,
– Include PTO valuation
Aon Hewitt to come back to the Team on timing, cost and process and to submit a data request to SCE
– Include SCE executive demographic profile for valuing benefits.
– Use the labor escalation rate (2.68%) versus the salary increase rate (2.8%).
– Use national data with ERI adjustment to approximate Southern California market versus a custom data cut from the surveys.
� In the prior Study, the Team and Aon Hewitt expressed concern about some of the short-comings of the approved methodology (e.g. sample size related to using SCE’s executive population for developing a demographic profile). These concerns remain the same and Aon Hewitt will note them in the final TCS report.
� The Team reviewed the revenue size for the benefits comparators. Three companies are notably above or below the 0.5x to 2.0x of SCE revenue. The Team decided to:
– Exclude Nestle ($74.3B), Sara Lee ($4.1B), and Science Applications International ($3.9B) due to revenue size.
Include Kraft Foods, Inc. ($18.2B) and Northrop Grumman ($24.0B) as replacements.
79
Workpaper – Southern California Edison / 2018 GRC
Exhibit No. SCE-06 / Vol. 03Witness: A. Peterson
March 14, 2016 The GRC Study Team Page 3
3
– Replace Constellation Energy (which has been acquired) with Public Service Enterprise Group (PSEG). PSEG has similar characteristics in terms of size and make-up to SCE.
– Solicit participation from Praxair. If they decline to participate, replace with NRG Energy.
� The Team reviewed the in-Study job list and Study coverage (excluding directors and above as that data is still pending). The Team agreed to exclude any nuclear jobs and re-review the Study job list and coverage and add to the list, if needed.
� The Team reviewed the ERI geographic data and presented the proposed geographic factor of 12% based on weighted average of that data. AH to continue research on the availability of the BLS geographic data and come back to the team to confirm.
� The Team reviewed the list of EIX executive officers and non-officer executives with SCE accountability and the percentage of time spent on SCE work (current as of March 14). If these jobs are in the Study, data will be adjusted to reflect only SCE accountability.
Next Steps and Follow-Ups � Action Items for AH include:
– Come back to the Team on timing, cost and process and to submit a data request to SCE for PTO valuation.
– Compile a data request for CPUC, LADWP, and SMUD for compensation and benefits.
– Continue research and analysis on BLS geographic differentials.
– Continue to solicit input for benefits comparators; if no response in a week additional companies may need to be selected.
– Contact Praxair to see if they would submit salaried benefits.
– Exclude any employees in the Nuclear Organization and come back to the team with coverage.
� Action items for SCE include:
– Re-review the Study job list to determine if any additional jobs should be included.
– Complete compensation and benefits data request.
– Request custom data cuts for executive salary surveys using the executive comparators once finalized.
– Circulate comparator group lists to the interveners and give them one week to respond.
80
Workpaper – Southern California Edison / 2018 GRC
Exhibit No. SCE-06 / Vol. 03Witness: A. Peterson
Consulting | Broad-Based Compensation 1
Date: May 11, 2016
To: The GRC Study Team (the Team)
From: Alison Peterson, Aon Hewitt
Subject: Meeting Notes, May 11, 2016; Revised July 14, 2016
Meeting Attendees Name Organization
George DeMaria Southern California Edison (SCE) Colleen Hernandez SCE Rahab Mahfud SCE Michelle Ricard SCE Chelsea Penaloza AH (Aon Hewitt) Alison Peterson AH
Follow-Up on Action Items Aon Hewitt � Come back to the Team on timing, cost and process and to submit a data request to SCE for PTO
valuation. (Complete)
� Compile a data request for CPUC, LADWP, and SMUD for compensation and benefits. (Complete)
– After several attempts at requesting executive compensation and benefits data input from CPUCby both Aon Hewitt and SCE, we did not receive any submissions
� Continue research and analysis on BLS geographic differentials. (Complete; current data notavailable)
� Continue to solicit input for benefits comparators; if no response in a week additional companies mayneed to be selected. (Complete)
� Contact Praxair to see if they would submit salaried benefits. (Complete; Praixair was not responsive.Excluded for salaried benefits)
� Exclude any employees in the San Onofre Nuclear Generating Station (SONGS) Organization andcome back to the team with coverage. (Complete)
SCE � Re-review the Study job list to determine if any additional jobs should be included. (Complete)
� Complete compensation and benefits data request. (Complete)
� Request custom data cuts for executive salary surveys using the executive comparators oncefinalized. (Complete)
� Circulate comparator group lists to the GRC interveners and give them one week to respond.(Complete)
� Solicit input on executive compensation data from CPUC (Complete)
81
Workpaper – Southern California Edison / 2018 GRC
Exhibit No. SCE-06 / Vol. 03Witness: A. Peterson
May 11, 2016 The GRC Study Team Page 2
2
Discussion Items � Aon Hewitt reported on the status of compensation and benefits data collection and analysis.
– LADWP and SMUD have submitted their executive compensation and benefits data
– In response to Aon Hewitt’s request, the CPUC explained that they could not submit the requested data because of other work priorities and lack of resources.
– The team agreed that we would disclose in the 2018 Study report that we attempted to gain participation from CPUC in the Study but they were unable to provide the required data. The inclusion of such data was based upon ORA’s request during their participation in the 2015 Study.
� The proposed comparator group for the Study was circulated to interested parties and intervenors for comment. No input has been received.
� The Team reviewed Study coverage statistics and preliminary comparisons between the 2018 and 2015 results.
– Incumbent coverage is comparable with 73.2% coverage in the 2018 Study versus 75.7% in the 2015 Study
– Part of the decline in incumbent coverage is because Nuclear positions were included in 2015 but excluded in the 2018 Study resulting in a reduction of the covered incumbent population of about 2.6% or 345 employees)
� The Team reviewed the summary market data for non-executive groups overall and by benchmark job excluding benefits (base, total cash, and LTI)
– Overall SCE’s position to market is -4.9% on base salary and -2.2% on total cash. That compares to -3.3% below on base salary and -3.7% on total cash in the 2015 Study.
Base salary is lower to market because SCE’s average increase in base salary between Studies was approximately +5% while the market increased during the same time period by +7%. The slower rate of increase in base pay at SCE is likely a result of changes in the employee population (people leaving or coming to the Company) because SCE’s average base pay merit funding has been in the range of 2.5% a year (totaling approximately 7.5% over three years) which is generally in-line with the rate of increase in the market.
Total cash has moved closer to the market median increasing from -3.7% below market in 2015 to -2.2% of market in 2018. This improvement to market is attributable, in part to an average bonus payout of 142% for bonuses paid in 2015 (reported in the 2018 Study) versus an average bonus payout of 104% for bonuses paid in 2012 (and reported in the 2015 Study)
� The position to market on Long-Term Incentives (LTI) for non-executive positions has moved from -15.0% below market in the 2015 Study to -5.8% below market in the 2018 Study. The primary driver of this change is that fewer jobs were eligible for LTI in the 2018 Study.
– The team reviewed the LTI eligibility guidelines and the list of jobs that are eligible.
Next Steps and Follow-Ups � Action Items for AH include:
– Complete the benefits review and valuation and review at the next team meeting on June 2nd.
– Complete the total compensation analysis and review with the team on June 9th.
– Send the detailed benchmark results to SCE for review.
82
Workpaper – Southern California Edison / 2018 GRC
Exhibit No. SCE-06 / Vol. 03Witness: A. Peterson
Consulting | Broad-Based Compensation 1
Date: June 9, 2016
To: The GRC Study Team (the Team)
From: Alison Peterson, Aon Hewitt
Subject: Meeting Notes, June 9, 2016; Revised July 14, 2016
Meeting Attendees Name Organization
Mark Bennett Southern California Edison (SCE) George DeMaria SCE Colleen Hernandez SCE Rahab Mahfud SCE Michelle Ricard SCE Al Kopec AH (Aon Hewitt) Kathy Miller AH Chelsea Penaloza AH Alison Peterson AH
Follow-Up on Action Items Aon Hewitt � Followed up several times with CPUC; determined that they are unable to provide executive
compensation and benefits data due to other work priorities and lack of resources, so that information will not be available to include in the Study. (completed)
� Provide detail of cash compensation data for non-executives to SCE for review (completed)
� Develop draft analysis of benefits (completed)
� Develop draft executive compensation analysis (completed)
� Develop draft total compensation analysis covering all employee groups (completed)
SCE � Rahab to make final attempt to obtain executive compensation and benefits data from CPUC
(completed)
Discussion Items � Aon Hewitt recapped the approach and methodology for valuing the benefits elements for the Study.
The same methodology used in the 2015 Study was applied to the 2018 Study.
� Overall, benefits values have moved from slightly below comparators in the 2015 Study to 4.3 percentabove comparators in the 2018 Study. The primary reason for the shift for non-executives is that anumber of the utility peers reduced retirement benefits while SCE made no changes. Retirementbenefits make up the largest component of percent of pay benefits. The increase in SCE’s position tocomparators due to retirement benefits was partially offset by SCE’s lower position to comparators onhealth care. A significant portion of SCE’s employee population is enrolled in an HMO resulting inlower medical values and costs as compared to the utility and general industry comparators who havelower levels of enrollment in an HMO.
SCE’s position on PTO also increased above that of comparators. The team reviewed themethodology used to value PTO that was utilized in the 2015 Study and repeated for the 2018 Study.
83
Workpaper – Southern California Edison / 2018 GRC
Exhibit No. SCE-06 / Vol. 03Witness: A. Peterson
June 9, 2016 The GRC Study Team Page 2
2
The methodology develops a value for PTO in two parts (based on SCE’s utilization as applied to each company’s schedule of PTO days).
– Part 1: Days used during the year: The lesser of the number of PTO days provided by each company and the number of PTO days used by SCE employees were valued using Aon Hewitt’s current PTO methodology and included implicitly in salary. This is a consistent treatment for all PTO days up to the utilization assumption. Any PTO days provided above the utilization assumption would be included in Part 2.
– Part 2: Days in excess of used days during the year: Because days provided in excess of those used during the year are eligible for cash out when the employee leaves the company, these days were valued similar to a pension benefit as a lump sum at projected termination/retirement. PTO value is based on final salary and the number of unpaid days. This is consistent treatment for all PTO days above the utilization assumption. The value is added to the total benefit value.
� Regarding PTO, SCE’s position to comparator’s increased to 25.8 percent above comparators because the number of “excess days” for SCE increased by approximately one day. The increase is because employees at SCE used approximately one fewer PTO day during 2015 versus 2012 while the comparator group used about the same number of PTO days. Because PTO is a relative small component of benefits, a small shift in the excess days results in a fairly significant shift in the position to comparators.
� For the executive population, SCE has moved further above the comparators as compared to the 2015 Study results. Similar to non-executive benefits, the increase is primarily a result of a reduction in nonqualified retirement benefits for utility comparators in this group.
� The team reviewed the executive compensation data including base salary, total cash compensation (TCC) and Long-Term Incentives (LTI). Executives moved further below the comparator group on base salary, and the position to comparators on TCC shifted approximately 30 percent to move to 17.7% below comparators. In contrast, executives moved closer to the comparators on LTI, though continue to be below by 21.5%, The shift in position to comparators is difficult to isolate because there were a number of changes in the benchmark results for executives from the 2015 Study including:
– Six of the fifteen jobs included in the Study had a significant change in scope and accountabilities. As a result, the benchmark matches for these jobs changed from the 2015 Study.
– There are five new jobs in the 2018 Study
Two jobs are new to SCE and were added to the Study
One job was included in the 2015 Study; however insufficient market data was available so was excluded from the 2015 Study results
– Two jobs remained the same in scope and were included in both the 2015 and 2018 Study with no changes in incumbents
– One job remained the same but had a change in incumbents between Studies
Job Title Note President, SCE New to study; job existed in last study, but insufficient survey
data to be included in results
SVP & CFO, SCE Same survey matches; new incumbent in job
SVP & General Counsel Matches changed (to group level) from previous study
SVP Corp Communications New job since previous study
84
Workpaper – Southern California Edison / 2018 GRC
Exhibit No. SCE-06 / Vol. 03Witness: A. Peterson
June 9, 2016 The GRC Study Team Page 3
3
Job Title Note
SVP Customer Service Job scope (and matches) changed from previous study VP & Chief Information Officer New job since previous study
VP & Treasurer Matches changed (to group level) from previous study
VP Customer Programs and Services Job scope (and matches) changed from previous study
VP Customer Service Operations New job since previous study
VP Distribution Business Line New job since previous study
VP Energy Procurement & Management
Job scope (and matches) changed from previous study
VP Power Production Same job and matches, market dropped 14% on base
VP Transmission, Substations & Operations
New job since previous study
VP, Human Resources Matches changed (to corporate level) from previous study
VP, Associate General Counsel, Chief Governance Officer & Corporate Secretary, EIX/SCE
Same matches as previous study
� Aon Hewitt provided updated Study coverage statistics (73.1% of employees) and overall position to comparators on total compensation, including executives (-1.9%). The team reviewed the results and discussed the changes in position to the comparators with particular focus on the shift in benefits and PTO and the compensation elements for the executive population. The SCE team asked Aon Hewitt to provide a detailed breakdown of the executive positions so that the Team can more fully understand all of the changes that occurred with this group. Aon Hewitt will prepare that analysis for review at the next meeting.
Next Steps and Follow-Ups � Action Items for AH include:
– Identify and report which percentage of jobs are constant study to study
– Note in the body of the report changes to comparator group and explain change (i.e., mergers)
– Provide detail of the executive job changes in the June 9 meeting notes
� SCE:
– Provide feedback on Study results by June 17
85

Workpaper – Southern California Edison / 2018 GRC
Exhibit No. SCE-06 / Vol. 03Witness: A. Peterson
2018 General Rate Case 72
Appendix I: Measurement of Error
86
Workpaper – Southern California Edison / 2018 GRC
Exhibit No. SCE-06 / Vol. 03Witness: A. Peterson
2018 General Rate Case 73
Measurement of Error Following is a description of how error was measured in conducting the 2018 Study.
Error Related to Assuming All Employees Receive Salaried Benefits Aon Hewitt’s database does not have specific data for all employee types at all peer companies. However, 10 companies in the peer group disclosed that they provide different benefits to union hourly than to salaried employees. When we evaluated the difference in benefits for these groups, we found that the primary difference was in the level of employer contributions toward active and retiree medical benefits with union salaried employees receiving approximately $58 more per year than salaried employees. If you compare that with the lowest pay for a Clerical employee (the group with the lowest pay), you would find that the impact on total compensation would be about 0.16% (equals $58 / $36,900 = .158%) of pay. This percentage would, of course, be much lower for all other higher paid employees.
Aon Hewitt compared all of the benefit values for the Clerical employees who earn $36,900 and found the following summary data statistics:
� $17,765 - mean
� $2,652 - standard deviation
The calculated difference of $58 per year is clearly much smaller than one standard deviation for this employee group. The mean and standard deviation are both higher for higher paid employees.
Error Related to Benefit Aggregation To estimate the impact of aggregating benefit costs based on average pay data versus determining benefit costs for each employee, Aon Hewitt looked at the benefits for employees at different pay levels within the physical/technical group, who had average pay of $55,200, and determined a simple average of their benefit costs. We then compared the average costs for these employees to the benefit cost for an employee in the physical/technical group who earns $55,200. Aon Hewitt found that the difference between the average cost for the group and the cost for the sample employee was only $52 per year. This translates into about .09% of total compensation (equals $52 / $55,200 = .094%). For reference, Aon Hewitt compared all of the benefit values for the Physical/Technical employees who earn $55,200 and found the following summary data statistics:
� $19,871 - mean
� $3,217 - standard deviation
The mean and standard deviation are both higher for higher paid employees.
Error Related to Job Matching Inaccuracies In prior Studies, to estimate the impact of job matching inaccuracies on survey error, Aon Hewitt measured any dollar change in benchmark values resulting from changes made to benchmark positions during the review and validation process conducted jointly with ORA. Because ORA declined to participate in the 2018 Study, this process step could not be performed. However, in the 2015 and 2012 Studies, the validation process resulted in a measurement of error of -0.2% to +0.2%. For the 2018 Study, we have assumed a similar degree of error and note that none of the benchmark matches for positions that have been validated by ORA in past Studies were modified in the 2018 Study.
87
Workpaper – Southern California Edison / 2018 GRC
Exhibit No. SCE-06 / Vol. 03Witness: A. Peterson
2018 General Rate Case 74
Appendix J: Glossary of Terms
88

Workpaper – Southern California Edison / 2018 GRC
Exhibit No. SCE-06 / Vol. 03Witness: A. Peterson
2018 General Rate Case 75
Glossary of Terms The following terms are referenced in this report and are defined in this section for Study purposes.
Annuity A stream of payments, generally payable over a participant’s lifetime, but also payable for a limited time period or over the lives of a participant and beneficiary.
Annuity Factor An amount used to convert an annuity to an equivalent value paid in another form (e.g., single sum), or vice versa.
Average The arithmetic mean of a group of numbers (see “Mean” below).
Base Pay The fixed rate (whether hourly, weekly, monthly or annual), that an employee receives as compensation for work performed. Usually, these amounts are guaranteed.
Base Salary Compensation paid by the week, month or year rather than by the hour. Generally, a salary is a guaranteed amount that is not reduced for time not worked. Generally, salaries apply to higher-level professional or supervisory jobs that are exempt from the provisions of the Fair Labor Standards Act of 1938 (FLSA).
Benchmarking A process by which an organization seeks to identify information about other organizations and analyzes their practices (including pay) for comparison purposes. Benchmark jobs are specific titles used in the benchmarking process. Such jobs are commonly found at most organizations, have a high population, and perform a similar level of work.
Comparator The group of companies against which pay and benefits are compared. Typically includes companies of similar size, in the same industry, that operate in the same geographic location, and with whom the Study company competes for talent.
Deferred Stock Units A form of long-term incentives that includes an award of units that correspond in number and value to a specified number of shares of stock. Units do not represent actual ownership or equity interest and typically are subject to vesting requirements and transferability restrictions.
89
Workpaper – Southern California Edison / 2018 GRC
Exhibit No. SCE-06 / Vol. 03Witness: A. Peterson
2018 General Rate Case 76
Defined Benefit Formula/Points A formula is typically used in the calculation of an employee’s pension benefit. Often a point value, usually a combination of age and years of service (e.g., 55 years of age + 20 years of service = 75 “points”), that influences the amount of benefit received.
Defined Benefit Pension Plan Both the Employee Retirement Income Security Act of 1974 (ERISA) and the Internal Revenue Code (IRC) define any plan that is not an individual account plan as a defined benefit pension plan. It is a pension plan that specifies the benefits, or the methods of determining the benefits, but not the level or rate of contribution. Contributions are determined actuarially on the basis of the pension benefits expected to become payable.
Defined Contribution Plan A defined contribution or individual account plan as defined by the Employee Retirement Income Security Act of 1974 (ERISA) and the Internal Revenue Code (IRC) as a plan that provides for an individual account for each participant and for benefits based solely on (1) the amount contributed to the participant’s account, plus (2) any income, expenses, gains and losses, and forfeitures of accounts of other participants that may be allocated to the participant’s account. The benefit amount actually received by the participant at retirement is unknown.
Demographic Profile and Assumptions Used in Valuing Benefits Since demographics of any group (such as age, marital status, length of service) affect the inherent value of the benefit package, it is important to use information that most closely reflects the experience of that group. To facilitate comparisons that focus on program design while minimizing the impact of differences in incumbent demographics, demographic data was collected from SCE and used to value the benefits for all companies in the Study. The value of benefits is determined by applying each benefit program to each individual in the demographic profile using SCE’s actuarial assumptions for all companies in the Study. Some of these assumptions, such as mortality (used for generating the group life insurance values) and rates of disability (used for generating the long-term disability values) are based on studies from the Society of Actuaries. Economic assumptions, such as interest rates and pay increases, are based on estimates of long-term future expectations.
EAPDIS The Edward A. Powell Data Information Solutions Study survey; formerly, the Edison Electric Institute (EEI) Nonexempt Survey.
EEI Edison Electric Institute.
90
Workpaper – Southern California Edison / 2018 GRC
Exhibit No. SCE-06 / Vol. 03Witness: A. Peterson
2018 General Rate Case 77
Employee Benefits A collection of noncash compensation elements, including, but not limited to, income protection, health coverage, retirement savings, and income supplements for employees, provided in whole or in part by employer payments.
FLSA The Fair Labor Standards Act (FLSA) of 1938 established overtime, record keeping, and a floor for minimum wage. It also determined the type of positions that are exempt from the overtime provisions. Federal law requires that “nonexempt” positions receive overtime pay for hours in excess of 40 worked in a week. Some states (e.g., California) require overtime pay for nonexempt positions for hours in excess of 8 worked in one day.
Generic Job This is an SCE job that is broadly defined to include employees performing the same level of work in various parts of the organization. At many other organizations, there would be a variety of unique job titles performing these activities. At SCE, these titles are consolidated into a single job title, encompassing employees in various departments.
Health and Welfare Benefits Plans that provide dental, vision, disability, life insurance, medical, surgical, or hospital care, or benefits in the case of sickness, accident, death or unemployment.
Long-Term Incentives Any incentive plan that requires sustained performance of the firm for a period longer than one fiscal year. Most plans are based on stock value of an organization and may require investment by the participant. Stock options are the most common form of long-term incentive.
Mean A simple arithmetic mean (or average) obtained by adding a set of numbers and then dividing the sum by the number of items in the set. A weighted average is used when there are multiple observations for one or more numbers in the set. In this case, the multiple observations are counted as individual observations and are included in the numerator and the denominator of the average calculation.
Median The median of a set of data is the value that half of the data are above and half of the data are below. If there are an odd number of data points, the median is the value of the middle item when the data are arranged in ascending or descending order. If there are an even number of data points the median is the average of the two middle values when the data are arranged in ascending or descending order.
91
Workpaper – Southern California Edison / 2018 GRC
Exhibit No. SCE-06 / Vol. 03Witness: A. Peterson
2018 General Rate Case 78
Performance Share Performance shares are a common form of long-term incentive. Typically, a performance share is a promise to provide a share of stock to a recipient at no cost, subject to achievement of performance goals over a specified time frame. The award of a performance share is usually structured so that the recipient forfeits the share is they terminate employment with the company.
Phantom Stock A long-term incentive, which is based on a hypothetical value of an organization’s equity (stock), rather than its actual equity. The incentive’s value is calculated based on a formula to derive the hypothetical (or phantom) value.
Restricted Stock Restricted stock is a common form of long-term incentive. Typically, a restricted share is a promise to provide a share of stock to a recipient at no cost. The share is usually “restricted” by a vesting schedule, so that the recipient forfeits the share if they terminate employment with the company.
Shift Differentials Shift differentials are a practice of paying a premium to employees who work a less desirable shift (evenings, weekends, holidays, etc.). Shift differentials consist of a base pay rate plus a premium. The base pay rate is typically the pay rate the employee would receive for working during a typical day-time shift.
Short-Term Incentives Usually a lump-sum payment (in cash) made in addition to an employee’s base salary or for a fiscal or calendar year. Generally, these are formula-driven pay plans that are designed to reward the accomplishment of specific results. Plan awards can be based on individual, group, division, business-unit or company-wide performance, or a combination.
Standard Deviation In probability theory and statistics, the standard deviation of a statistical population, a data set, or a probability distribution is the square root of its variance. Standard deviation is a widely used measure of the variability or dispersion. It shows how much variation there is from the "average" (mean, or expected/budgeted value). A low standard deviation indicates that the data points tend to be very close to the mean, whereas high standard deviation indicates that the data is spread out over a large range of values.
Stock Appreciation Rights (SARs) This is a long-term incentive which allows the recipient to receive the increase in stock price of a share of stock over a specified maximum period of time. SARs are typically subject to vesting restrictions. They do not usually require that the recipient actually purchase shares of company stock.
92
Workpaper – Southern California Edison / 2018 GRC
Exhibit No. SCE-06 / Vol. 03Witness: A. Peterson
2018 General Rate Case 79
Stock Options Stock options are the most commonly used form of long-term incentive. Stock options allow a recipient to purchase a share of stock at a fixed price, subject to vesting restrictions and contractual term. The recipient executes the purchase by “exercising” the option, allowing them to obtain the share, regardless of current price level, for the fixed contractual price.
Target/Actual Incentive Awards The planned or expected payout from an incentive plan is the target award. Usually, target incentives are expressed as a percentage of base salary. Actual incentive awards may be higher or lower than the target incentive award.
Total Cash Compensation The typical definition was used for this Study: the sum of annual base pay and annual incentives provided by an employer to an employee. In some cases, total cash compensation also includes spot bonuses or other cash awards. For this Study, spot bonuses were excluded due to lack of consistent, reliable data among comparator groups. Additionally, overtime pay was excluded from the Study because it varies with company operating policies and staffing practices.
Total Compensation Total Compensation is the sum of all elements of compensation provided by an employer to an employee. For Study purposes, the Team defined it to include annualized base pay, incentives, and benefit values. In other studies, other extrinsic elements of pay may be included. (For example, overtime pay and shift differentials). In some definitions, intrinsic awards (e.g., job satisfaction) are considered a part of total compensation, but these are not quantifiable and consequently not included in total compensation studies.
93
Workpaper – Southern California Edison / 2018 GRC
Exhibit No. SCE-06 / Vol. 03Witness: A. Peterson
2018 General Rate Case: Total Compensation Study WorkpapersSouthern California Edison
July 2016
1
Workpaper – Southern California Edison / 2018 GRC
Exhibit No. SCE-06 / Vol. 03Witness: A. Peterson
SCE Job ListSurvey Job Matches
18
Workpapers
2
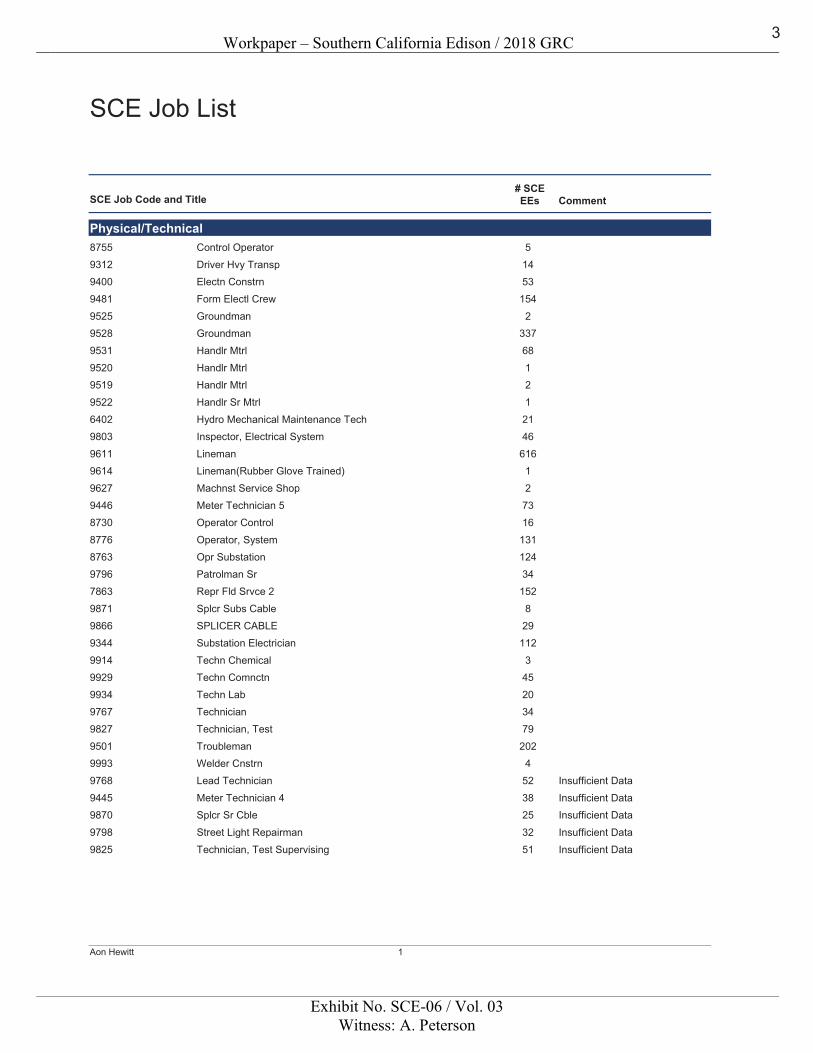
Workpaper – Southern California Edison / 2018 GRC
Exhibit No. SCE-06 / Vol. 03Witness: A. Peterson
SCE Job List
SCE Job Code and Title# SCEEEs Comment
Physical/TechnicalControl Operator8755 5
Driver Hvy Transp9312 14Electn Constrn9400 53
Form Electl Crew9481 154
Groundman9525 2Groundman9528 337
Handlr Mtrl9531 68
Handlr Mtrl9520 1Handlr Mtrl9519 2
Handlr Sr Mtrl9522 1
Hydro Mechanical Maintenance Tech6402 21Inspector, Electrical System9803 46
Lineman9611 616Lineman(Rubber Glove Trained)9614 1
Machnst Service Shop9627 2
Meter Technician 59446 73Operator Control8730 16
Operator, System8776 131
Opr Substation8763 124Patrolman Sr9796 34
Repr Fld Srvce 27863 152
Splcr Subs Cable9871 8SPLICER CABLE9866 29
Substation Electrician9344 112
Techn Chemical9914 3Techn Comnctn9929 45
Techn Lab9934 20Technician9767 34
Technician, Test9827 79
Troubleman9501 202Welder Cnstrn9993 4
Lead Technician9768 52 Insufficient Data
Meter Technician 49445 38 Insufficient DataSplcr Sr Cble9870 25 Insufficient Data
Street Light Repairman9798 32 Insufficient Data
Technician, Test Supervising9825 51 Insufficient Data
1Aon Hewitt
3
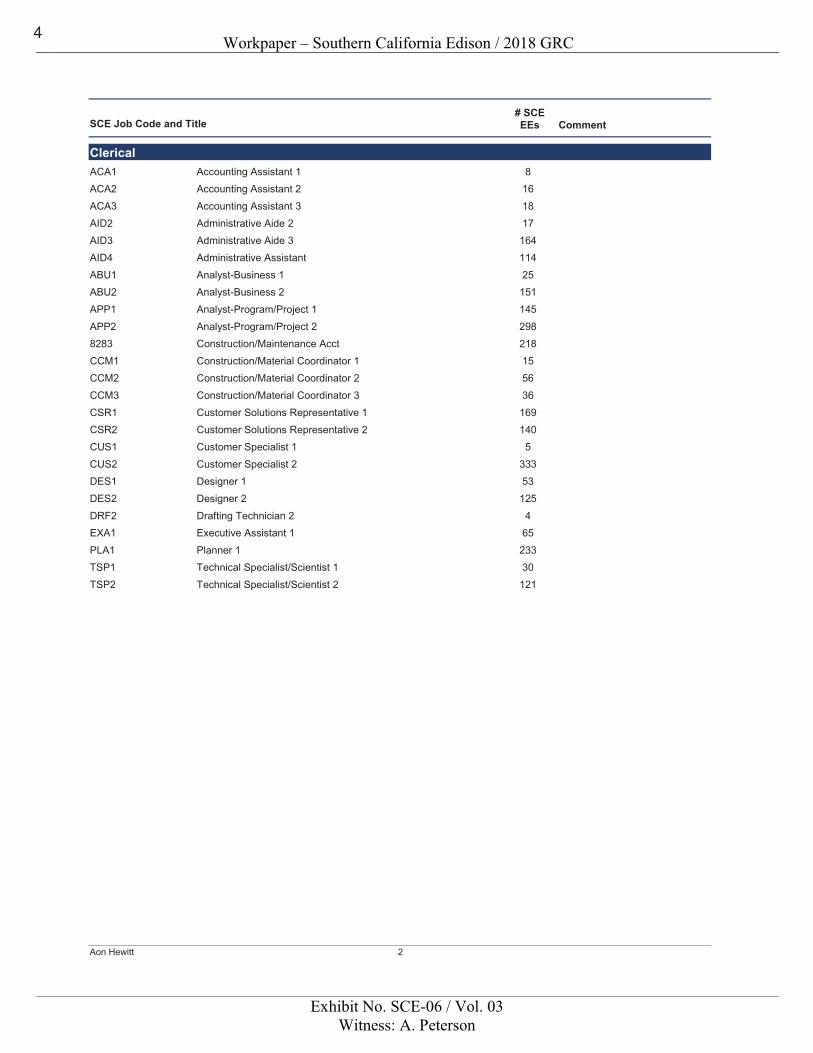
Workpaper – Southern California Edison / 2018 GRC
Exhibit No. SCE-06 / Vol. 03Witness: A. Peterson
SCE Job Code and Title# SCEEEs Comment
ClericalAccounting Assistant 1ACA1 8Accounting Assistant 2ACA2 16
Accounting Assistant 3ACA3 18
Administrative Aide 2AID2 17Administrative Aide 3AID3 164
Administrative AssistantAID4 114
Analyst-Business 1ABU1 25Analyst-Business 2ABU2 151
Analyst-Program/Project 1APP1 145
Analyst-Program/Project 2APP2 298Construction/Maintenance Acct8283 218
Construction/Material Coordinator 1CCM1 15Construction/Material Coordinator 2CCM2 56
Construction/Material Coordinator 3CCM3 36
Customer Solutions Representative 1CSR1 169Customer Solutions Representative 2CSR2 140
Customer Specialist 1CUS1 5
Customer Specialist 2CUS2 333Designer 1DES1 53
Designer 2DES2 125
Drafting Technician 2DRF2 4Executive Assistant 1EXA1 65
Planner 1PLA1 233Technical Specialist/Scientist 1TSP1 30
Technical Specialist/Scientist 2TSP2 121
2Aon Hewitt
4
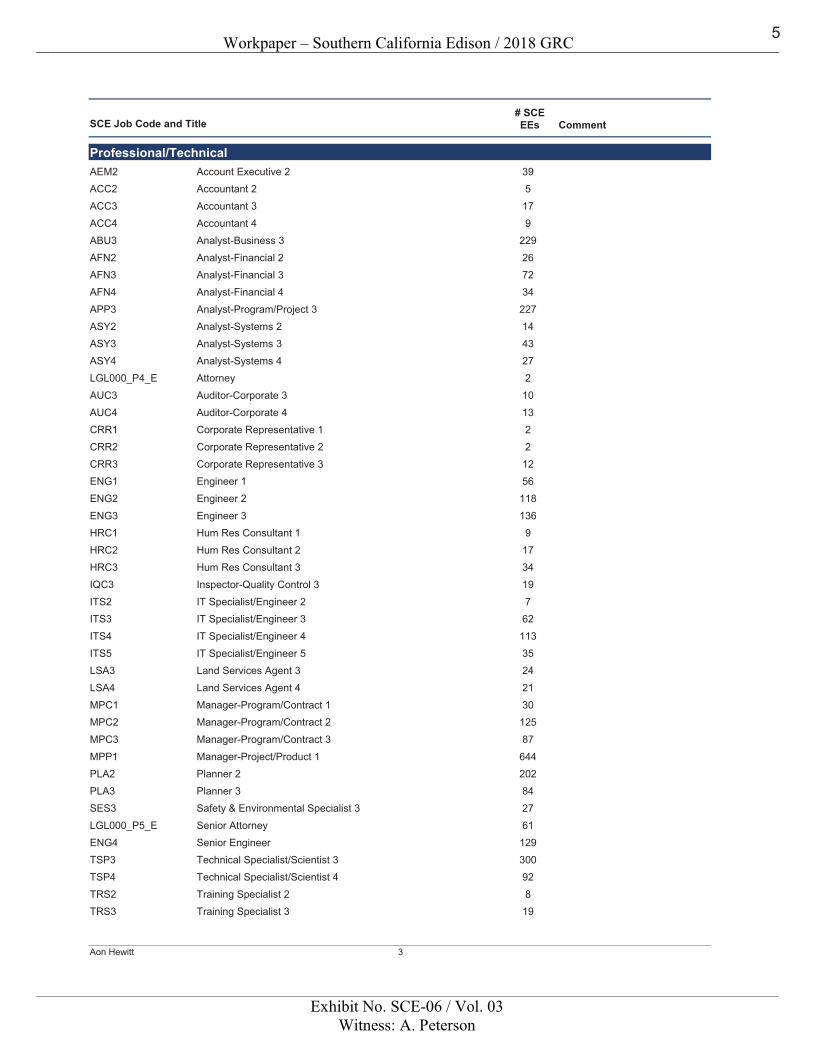
Workpaper – Southern California Edison / 2018 GRC
Exhibit No. SCE-06 / Vol. 03Witness: A. Peterson
SCE Job Code and Title# SCEEEs Comment
Professional/TechnicalAccount Executive 2AEM2 39Accountant 2ACC2 5
Accountant 3ACC3 17
Accountant 4ACC4 9Analyst-Business 3ABU3 229
Analyst-Financial 2AFN2 26
Analyst-Financial 3AFN3 72Analyst-Financial 4AFN4 34
Analyst-Program/Project 3APP3 227
Analyst-Systems 2ASY2 14Analyst-Systems 3ASY3 43
Analyst-Systems 4ASY4 27AttorneyLGL000_P4_E 2
Auditor-Corporate 3AUC3 10
Auditor-Corporate 4AUC4 13Corporate Representative 1CRR1 2
Corporate Representative 2CRR2 2
Corporate Representative 3CRR3 12Engineer 1ENG1 56
Engineer 2ENG2 118
Engineer 3ENG3 136Hum Res Consultant 1HRC1 9
Hum Res Consultant 2HRC2 17Hum Res Consultant 3HRC3 34
Inspector-Quality Control 3IQC3 19
IT Specialist/Engineer 2ITS2 7IT Specialist/Engineer 3ITS3 62
IT Specialist/Engineer 4ITS4 113
IT Specialist/Engineer 5ITS5 35Land Services Agent 3LSA3 24
Land Services Agent 4LSA4 21
Manager-Program/Contract 1MPC1 30Manager-Program/Contract 2MPC2 125
Manager-Program/Contract 3MPC3 87
Manager-Project/Product 1MPP1 644Planner 2PLA2 202
Planner 3PLA3 84Safety & Environmental Specialist 3SES3 27
Senior AttorneyLGL000_P5_E 61
Senior EngineerENG4 129Technical Specialist/Scientist 3TSP3 300
Technical Specialist/Scientist 4TSP4 92
Training Specialist 2TRS2 8Training Specialist 3TRS3 19
3Aon Hewitt
5

Workpaper – Southern California Edison / 2018 GRC
Exhibit No. SCE-06 / Vol. 03Witness: A. Peterson
SCE Job Code and Title# SCEEEs Comment
Manager/SupervisorAssistant ControllerAsst Cntrlr 1Assistant Treasurer2278 1
Cybersecurity Engineering Manager 1CEM1 2
Cybersecurity Engineering Manager 2CEM2 1Dir Corporate Health and SafetyDirCpHlthSft 1
Dir Cybersecurity & IT ComplianceDir CyScITCm 1
Dir Electric System PlanningDirElSysPlng 1Dir Grid OperationsDir GridOps 1
Dir Risk ManagementDirRskMgmt 1
Dir SCE Corporate CommunicationsDirSCECorpCm 1Dir Transportation ServicesDirTransSvcs 1
Dir, Business ResiliencyDir Bus Res 1Director & Managing AttorneyDir&MA 12
Director HR OperationsDirHROps 1
Director HR Strategic Business PartnerDir HRSBP 2Engineering Manager 2EMG2 29
Manager 1 (Op Mid): Transmission & Distribution: Distribution Business Line
MGR1_OPMD_E 18
Manager 1 (Op Mid): Transmission & Distribution: Transmission Substations & Operations
MGR1_OPMD_E 8
Manager 1, Safety & Training: Transmission & Distribution: T&D Safety
MGR1_TDST_E 1
Manager 1: Corporate CommunicationMGR1 1
Manager 1: Customer Service: Business Customer DivisionMGR1 14
Manager 1: Customer Service: Customer Programs & ServicesMGR1 13Manager 1: Customer Service: Customer Service Operations Division
MGR1 23
Manager 1: Finance: ControllersMGR1 7Manager 1: Finance: Operational FinanceMGR1 2
Manager 1: Human ResourcesMGR1 9
Manager 1: Information Technology: Grid ServicesMGR1 9Manager 1: Information Technology: IT Service Mgmnt Office & Operations
MGR1 7
Manager 1: Legal OrganizationMGR1 1Manager 1: Operational Services: Business ResiliencyMGR1 1
Manager 1: Operational Services: Corporate Real EstateMGR1 1
Manager 1: Operational Services: Corporate SecurityMGR1 2Manager 1: Operational Services: Transportation ServicesMGR1 7
Manager 1: Power ProductionMGR1 2
Manager 1: Settlements & Operations ServicesMGR1 2Manager 1: Transmission & Distribution: Asset Management & Operations Support
MGR1 6
Manager 1: Transmission & Distribution: Distribution Business LineMGR1 33Manager 1: Transmission & Distribution: Engineering & Tech Srvcs Bs Ln
MGR1 14
Manager 1: Transmission & Distribution: T&D SafetyMGR1 2Manager 1: Transmission & Distribution: Transmission Substations & Operations
MGR1 26
Manager 2: Audit ServicesMGR2 8
4Aon Hewitt
6

Workpaper – Southern California Edison / 2018 GRC
Exhibit No. SCE-06 / Vol. 03Witness: A. Peterson
SCE Job Code and Title# SCEEEs Comment
Manager/SupervisorManager 2: Compliance and SafetyMGR2 4Manager 2: Corporate CommunicationMGR2 5
Manager 2: Customer Service: Customer Programs & ServicesMGR2 29
Manager 2: Customer Service: Customer Service Operations Division
MGR2 22
Manager 2: Edison Material Supply: OS EMS Supply ManagementMGR2 13
Manager 2: FinanceMGR2 5Manager 2: Finance: ControllersMGR2 13
Manager 2: Finance: Operational FinanceMGR2 6
Manager 2: Finance: TreasurersMGR2 1Manager 2: Human ResourcesMGR2 17
Manager 2: Information Technology: Enterprise Architecture & Strategy
MGR2 5
Manager 2: Information Technology: Grid ServicesMGR2 15
Manager 2: Information Technology: IT Service Mgmnt Office & Operations
MGR2 7
Manager 2: Legal OrganizationMGR2 8Manager 2: Operational Services: Business ResiliencyMGR2 2
Manager 2: Operational Services: Corporate Environmental Services
MGR2 13
Manager 2: Operational Services: Corporate Health & SafetyMGR2 1
Manager 2: Operational Services: Corporate Real EstateMGR2 2
Manager 2: Operational Services: Corporate SecurityMGR2 1Manager 2: Operational Services: Enterprise Safety ProgramMGR2 1
Manager 2: Operational Services: TD/PPD Supply Chain and Integrated Support Service
MGR2 3
Manager 2: Power ProductionMGR2 10
Manager 2: Regulatory AffairsMGR2 5
Manager 2: Regulatory Affairs: State Regulatory OperationsMGR2 5Manager 2: Transmission & Distribution: Asset Management & Operations Support
MGR2 15
Manager 2: Transmission & Distribution: Distribution Business LineMGR2 54Manager 2: Transmission & Distribution: Engineering & Tech Srvcs Bs Ln
MGR2 9
Manager 2: Transmission & Distribution: Major Projects Organization
MGR2 6
Manager 2: Transmission & Distribution: T&D SafetyMGR2 8
Manager 2: Transmission & Distribution: Transmission Substations & Operations
MGR2 43
Manager-Project/Product 2MPP2 510
Managing Dir T&D Asset Mgmt & Ops SvcsMD T&D AMOS 1
Managing Dir Tax0339 1Prin Mgr, Account Mgmt - Bus CustACM000_M4_E 4
Prin Mgr, Bus Process & Soltns IntgBOP150_M4_E 2
Prin Mgr, Client Svc Del MgmtCLS000_M4_E 10Prin Mgr, Corp CommCOM000_M4_E 2
Prin Mgr, Distrib MgmtELD050_M4_E 9Prin Mgr, Energy Efficiency PortEEC000_M4_E 2
Prin Mgr, Envir ScienceEHS050_M4_E 4
5Aon Hewitt
7
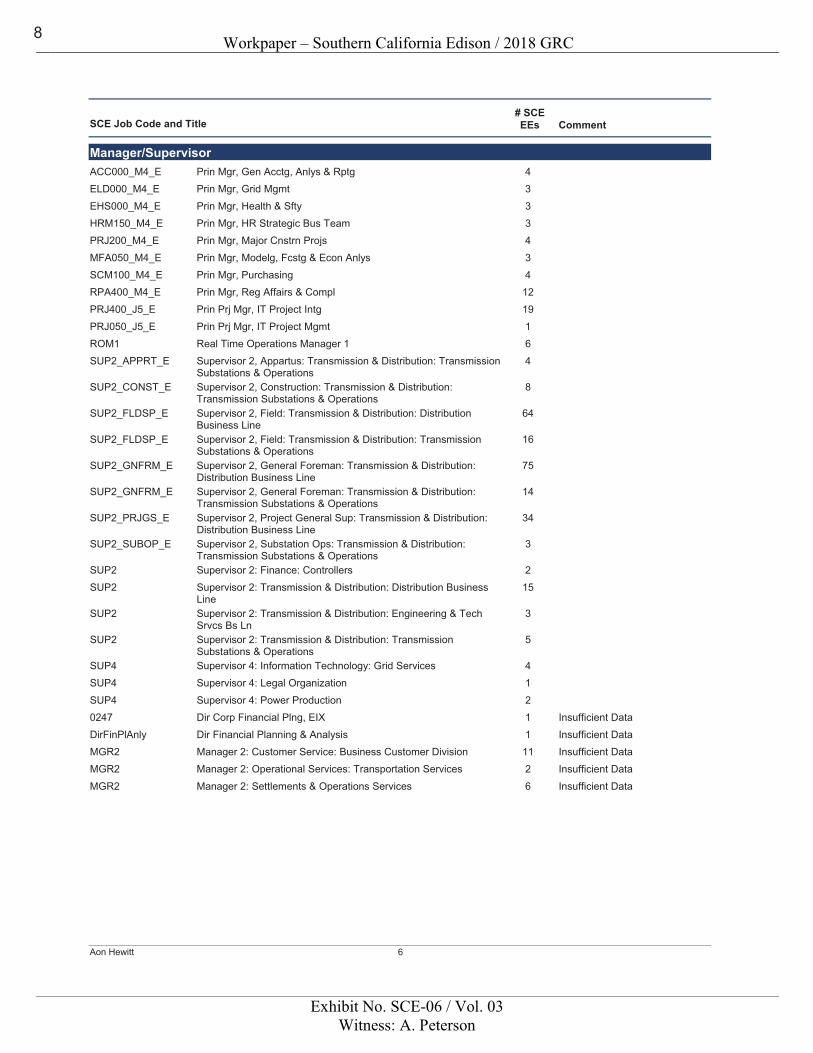
Workpaper – Southern California Edison / 2018 GRC
Exhibit No. SCE-06 / Vol. 03Witness: A. Peterson
SCE Job Code and Title# SCEEEs Comment
Manager/SupervisorPrin Mgr, Gen Acctg, Anlys & RptgACC000_M4_E 4Prin Mgr, Grid MgmtELD000_M4_E 3
Prin Mgr, Health & SftyEHS000_M4_E 3
Prin Mgr, HR Strategic Bus TeamHRM150_M4_E 3Prin Mgr, Major Cnstrn ProjsPRJ200_M4_E 4
Prin Mgr, Modelg, Fcstg & Econ AnlysMFA050_M4_E 3
Prin Mgr, PurchasingSCM100_M4_E 4Prin Mgr, Reg Affairs & ComplRPA400_M4_E 12
Prin Prj Mgr, IT Project IntgPRJ400_J5_E 19
Prin Prj Mgr, IT Project MgmtPRJ050_J5_E 1Real Time Operations Manager 1ROM1 6
Supervisor 2, Appartus: Transmission & Distribution: Transmission Substations & Operations
SUP2_APPRT_E 4
Supervisor 2, Construction: Transmission & Distribution: Transmission Substations & Operations
SUP2_CONST_E 8
Supervisor 2, Field: Transmission & Distribution: Distribution Business Line
SUP2_FLDSP_E 64
Supervisor 2, Field: Transmission & Distribution: Transmission Substations & Operations
SUP2_FLDSP_E 16
Supervisor 2, General Foreman: Transmission & Distribution: Distribution Business Line
SUP2_GNFRM_E 75
Supervisor 2, General Foreman: Transmission & Distribution: Transmission Substations & Operations
SUP2_GNFRM_E 14
Supervisor 2, Project General Sup: Transmission & Distribution: Distribution Business Line
SUP2_PRJGS_E 34
Supervisor 2, Substation Ops: Transmission & Distribution: Transmission Substations & Operations
SUP2_SUBOP_E 3
Supervisor 2: Finance: ControllersSUP2 2
Supervisor 2: Transmission & Distribution: Distribution Business Line
SUP2 15
Supervisor 2: Transmission & Distribution: Engineering & Tech Srvcs Bs Ln
SUP2 3
Supervisor 2: Transmission & Distribution: Transmission Substations & Operations
SUP2 5
Supervisor 4: Information Technology: Grid ServicesSUP4 4
Supervisor 4: Legal OrganizationSUP4 1
Supervisor 4: Power ProductionSUP4 2Dir Corp Financial Plng, EIX0247 1 Insufficient Data
Dir Financial Planning & AnalysisDirFinPlAnly 1 Insufficient Data
Manager 2: Customer Service: Business Customer DivisionMGR2 11 Insufficient DataManager 2: Operational Services: Transportation ServicesMGR2 2 Insufficient Data
Manager 2: Settlements & Operations ServicesMGR2 6 Insufficient Data
6Aon Hewitt
8

Workpaper – Southern California Edison / 2018 GRC
Exhibit No. SCE-06 / Vol. 03Witness: A. Peterson
SCE Job Code and Title# SCEEEs Comment
ExecutivePresident, SCE0058 1SVP & CFO, SCESVPCFOSCE 1
SVP & General Counsel0092 1
SVP Corp Communications2247 1SVP Customer Service1236 1
VP & Chief Information OfficerVP & CIO 1
VP & Treasurer0259 1VP Customer Programs and ServicesVPCusPrgmsSv 1
VP Customer Service Operations0069 1
VP Distribution Business LineVP DistBusLn 1VP Energy Procurement & ManagementVPEnProcMgmt 1
VP Power ProductionVP Pow Prod 1VP Transmission,Substations & OperationsVP TrSbstnOp 1
VP, Human Resources0606 1
VP,AGC,Ch Gov Ofc,CSec,EIX/SCE1510 1VP and ControllerVP & Cntrlr 1 Insufficient Data
VP Engineering & Technical Svs0189 1 Insufficient Data
7Aon Hewitt
9
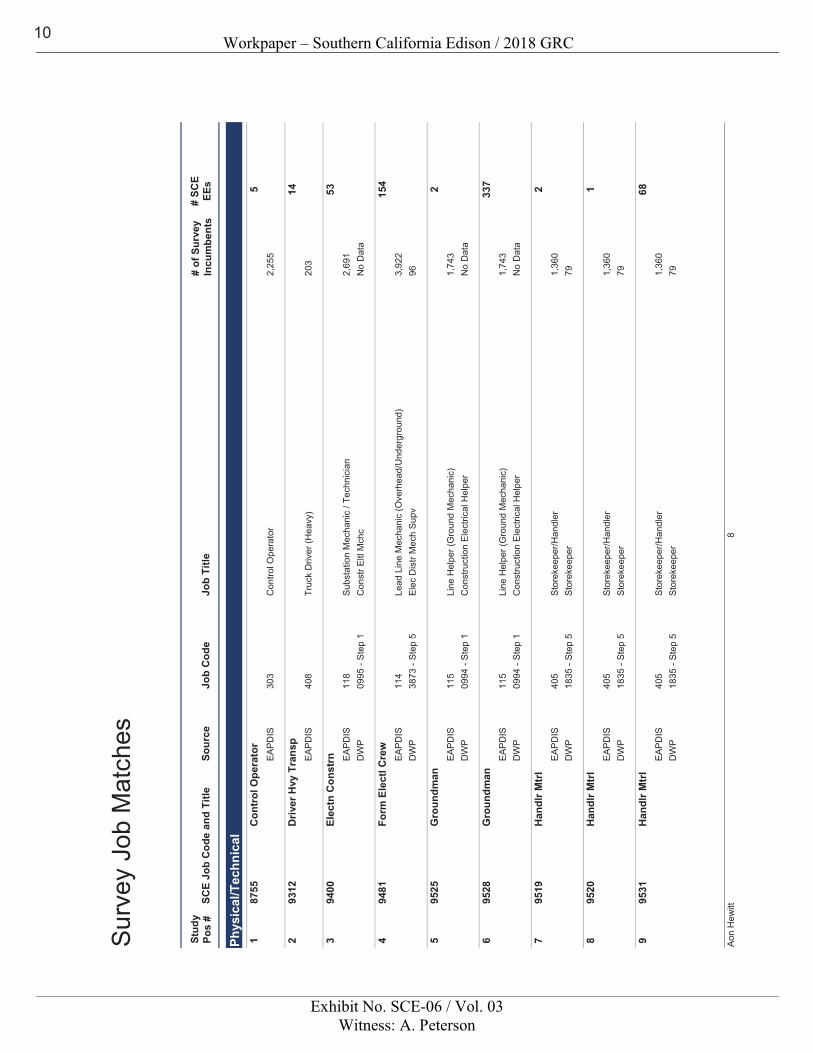
Workpaper – Southern California Edison / 2018 GRC
Exhibit No. SCE-06 / Vol. 03Witness: A. Peterson
Sur
vey
Job
Mat
ches
Sour
ceJo
b C
ode
Job
Title
SCE
Job
Cod
e an
d Ti
tle#
of S
urve
yIn
cum
bent
s#
SCE
EEs
Stud
y Po
s #
Phys
ical
/Tec
hnic
alC
ontr
ol O
pera
tor
8755
51
EA
PDIS
303
Con
trol O
pera
tor
2,25
5
Driv
er H
vy T
rans
p93
1214
2E
APD
IS40
8Tr
uck
Driv
er (H
eavy
)20
3
Elec
tn C
onst
rn94
0053
3E
APD
IS11
8S
ubst
atio
n M
echa
nic
/ Tec
hnic
ian
2,69
1D
WP
0995
- S
tep
1C
onst
r Eltl
Mch
cN
o D
ata
Form
Ele
ctl C
rew
9481
154
4E
APD
IS11
4Le
ad L
ine
Mec
hani
c (O
verh
ead/
Und
ergr
ound
)3,
922
DW
P38
73 -
Ste
p 5
Ele
c D
istr
Mec
h S
upv
96
Gro
undm
an95
252
5E
APD
IS11
5Li
ne H
elpe
r (G
roun
d M
echa
nic)
1,74
3D
WP
0994
- S
tep
1C
onst
ruct
ion
Ele
ctric
al H
elpe
rN
o D
ata
Gro
undm
an95
2833
76
EA
PDIS
115
Line
Hel
per (
Gro
und
Mec
hani
c)1,
743
DW
P09
94 -
Ste
p 1
Con
stru
ctio
n E
lect
rical
Hel
per
No
Dat
a
Han
dlr M
trl
9519
27
EA
PDIS
405
Sto
reke
eper
/Han
dler
1,36
0D
WP
1835
- S
tep
5S
tore
keep
er79
Han
dlr M
trl
9520
18
EA
PDIS
405
Sto
reke
eper
/Han
dler
1,36
0D
WP
1835
- S
tep
5S
tore
keep
er79
Han
dlr M
trl
9531
689
EA
PDIS
405
Sto
reke
eper
/Han
dler
1,36
0D
WP
1835
- S
tep
5S
tore
keep
er79
8A
on H
ewitt
10
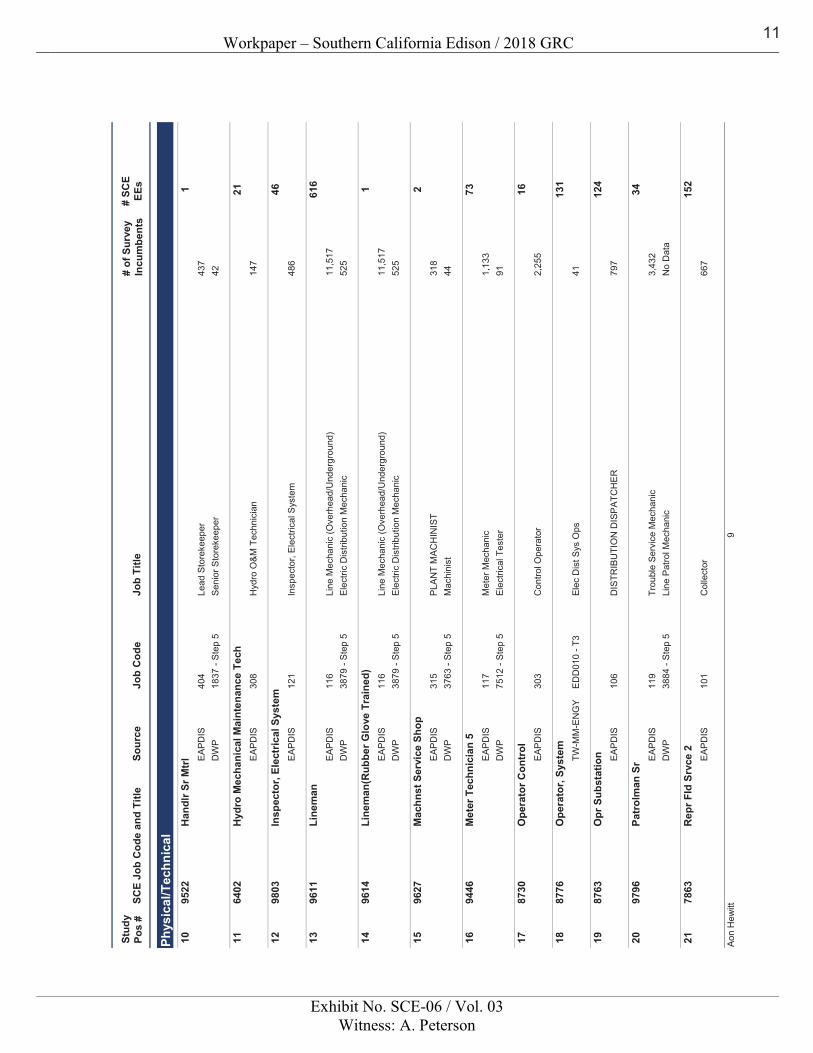
Workpaper – Southern California Edison / 2018 GRC
Exhibit No. SCE-06 / Vol. 03Witness: A. Peterson
Sour
ceJo
b C
ode
Job
Title
SCE
Job
Cod
e an
d Ti
tle#
of S
urve
yIn
cum
bent
s#
SCE
EEs
Stud
y Po
s #
Phys
ical
/Tec
hnic
alH
andl
r Sr M
trl
9522
110
EA
PDIS
404
Lead
Sto
reke
eper
437
DW
P18
37 -
Ste
p 5
Sen
ior S
tore
keep
er42
Hyd
ro M
echa
nica
l Mai
nten
ance
Tec
h64
0221
11EA
PDIS
308
Hyd
ro O
&M T
echn
icia
n14
7
Insp
ecto
r, El
ectr
ical
Sys
tem
9803
4612
EA
PDIS
121
Insp
ecto
r, E
lect
rical
Sys
tem
486
Line
man
9611
616
13E
APD
IS11
6Li
ne M
echa
nic
(Ove
rhea
d/U
nder
grou
nd)
11,5
17D
WP
3879
- S
tep
5E
lect
ric D
istri
butio
n M
echa
nic
525
Line
man
(Rub
ber G
love
Tra
ined
)96
141
14E
APD
IS11
6Li
ne M
echa
nic
(Ove
rhea
d/U
nder
grou
nd)
11,5
17D
WP
3879
- S
tep
5E
lect
ric D
istri
butio
n M
echa
nic
525
Mac
hnst
Ser
vice
Sho
p96
272
15E
APD
IS31
5P
LAN
T M
AC
HIN
IST
318
DW
P37
63 -
Ste
p 5
Mac
hini
st44
Met
er T
echn
icia
n 5
9446
7316
EA
PDIS
117
Met
er M
echa
nic
1,13
3D
WP
7512
- S
tep
5E
lect
rical
Tes
ter
91
Ope
rato
r Con
trol
8730
1617
EA
PDIS
303
Con
trol O
pera
tor
2,25
5
Ope
rato
r, Sy
stem
8776
131
18TW
-MM
-EN
GY
ED
D01
0 - T
3E
lec
Dis
t Sys
Ops
41
Opr
Sub
stat
ion
8763
124
19EA
PDIS
106
DIS
TRIB
UTI
ON
DIS
PATC
HER
797
Patr
olm
an S
r97
9634
20E
APD
IS11
9Tr
oubl
e Se
rvic
e M
echa
nic
3,43
2D
WP
3884
- S
tep
5Li
ne P
atro
l Mec
hani
cN
o D
ata
Rep
r Fld
Srv
ce 2
7863
152
21E
APD
IS10
1C
olle
ctor
667
9A
on H
ewitt
11
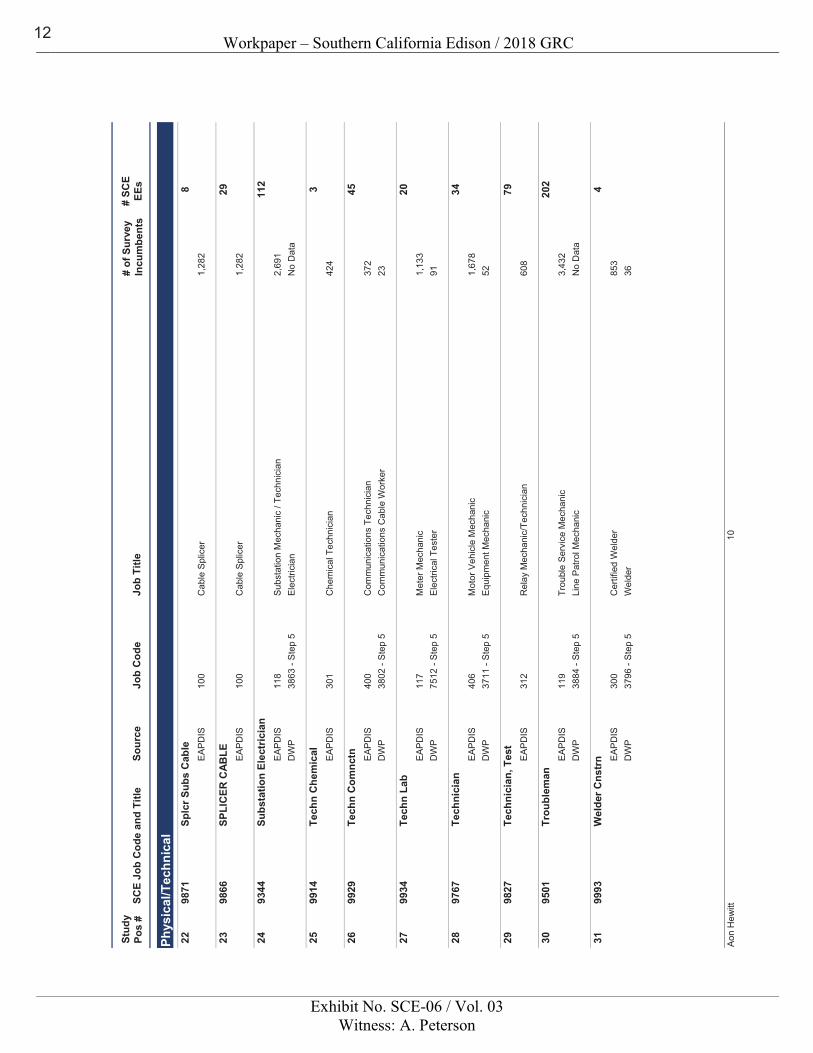
Workpaper – Southern California Edison / 2018 GRC
Exhibit No. SCE-06 / Vol. 03Witness: A. Peterson
Sour
ceJo
b C
ode
Job
Title
SCE
Job
Cod
e an
d Ti
tle#
of S
urve
yIn
cum
bent
s#
SCE
EEs
Stud
y Po
s #
Phys
ical
/Tec
hnic
alSp
lcr S
ubs
Cab
le98
718
22E
APD
IS10
0C
able
Spl
icer
1,28
2
SPLI
CER
CAB
LE98
6629
23E
APD
IS10
0C
able
Spl
icer
1,28
2
Subs
tatio
n El
ectr
icia
n93
4411
224
EA
PDIS
118
Sub
stat
ion
Mec
hani
c / T
echn
icia
n2,
691
DW
P38
63 -
Ste
p 5
Ele
ctric
ian
No
Dat
a
Tech
n C
hem
ical
9914
325
EA
PDIS
301
Che
mic
al T
echn
icia
n42
4
Tech
n C
omnc
tn99
2945
26E
APD
IS40
0C
omm
unic
atio
ns T
echn
icia
n37
2D
WP
3802
- S
tep
5C
omm
unic
atio
ns C
able
Wor
ker
23
Tech
n La
b99
3420
27E
APD
IS11
7M
eter
Mec
hani
c1,
133
DW
P75
12 -
Ste
p 5
Ele
ctric
al T
este
r91
Tech
nici
an97
6734
28E
APD
IS40
6M
otor
Veh
icle
Mec
hani
c1,
678
DW
P37
11 -
Ste
p 5
Equ
ipm
ent M
echa
nic
52
Tech
nici
an, T
est
9827
7929
EA
PDIS
312
Rel
ay M
echa
nic/
Tech
nici
an60
8
Trou
blem
an95
0120
230
EA
PDIS
119
Trou
ble
Serv
ice
Mec
hani
c3,
432
DW
P38
84 -
Ste
p 5
Line
Pat
rol M
echa
nic
No
Dat
a
Wel
der C
nstr
n99
934
31E
APD
IS30
0C
ertif
ied
Wel
der
853
DW
P37
96 -
Ste
p 5
Wel
der
36
10A
on H
ewitt
12
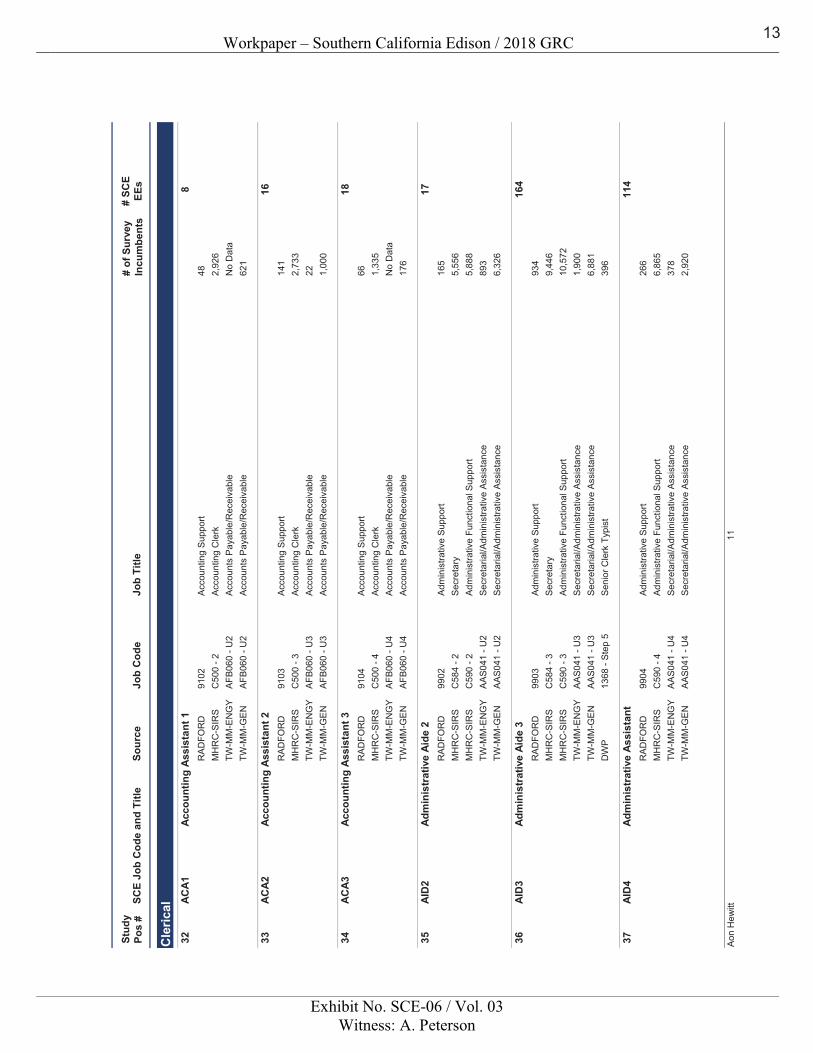
Workpaper – Southern California Edison / 2018 GRC
Exhibit No. SCE-06 / Vol. 03Witness: A. Peterson
Sour
ceJo
b C
ode
Job
Title
SCE
Job
Cod
e an
d Ti
tle#
of S
urve
yIn
cum
bent
s#
SCE
EEs
Stud
y Po
s #
Cle
rical
Acco
untin
g As
sist
ant 1
ACA1
832
RA
DFO
RD
9102
Acc
ount
ing
Sup
port
48
MH
RC
-SIR
SC
500
- 2A
ccou
ntin
g C
lerk
2,92
6TW
-MM
-EN
GY
AFB
060
- U2
Acc
ount
s P
ayab
le/R
ecei
vabl
eN
o D
ata
TW-M
M-G
EN
AFB
060
- U2
Acc
ount
s P
ayab
le/R
ecei
vabl
e62
1
Acco
untin
g As
sist
ant 2
ACA2
1633
RA
DFO
RD
9103
Acc
ount
ing
Sup
port
14
1M
HR
C-S
IRS
C50
0 - 3
Acc
ount
ing
Cle
rk2,
733
TW-M
M-E
NG
YA
FB06
0 - U
3A
ccou
nts
Pay
able
/Rec
eiva
ble
22TW
-MM
-GE
NA
FB06
0 - U
3A
ccou
nts
Pay
able
/Rec
eiva
ble
1,00
0
Acco
untin
g As
sist
ant 3
ACA3
1834
RA
DFO
RD
9104
Acc
ount
ing
Sup
port
66
MH
RC
-SIR
SC
500
- 4A
ccou
ntin
g C
lerk
1,33
5TW
-MM
-EN
GY
AFB
060
- U4
Acc
ount
s P
ayab
le/R
ecei
vabl
eN
o D
ata
TW-M
M-G
EN
AFB
060
- U4
Acc
ount
s P
ayab
le/R
ecei
vabl
e17
6
Adm
inis
trat
ive
Aide
2AI
D2
1735
RA
DFO
RD
9902
Adm
inis
trativ
e S
uppo
rt
165
MH
RC
-SIR
SC
584
- 2S
ecre
tary
5,55
6M
HR
C-S
IRS
C59
0 - 2
Adm
inis
trativ
e Fu
nctio
nal S
uppo
rt5,
888
TW-M
M-E
NG
YA
AS0
41 -
U2
Sec
reta
rial/A
dmin
istra
tive
Ass
ista
nce
893
TW-M
M-G
EN
AA
S041
- U
2S
ecre
taria
l/Adm
inis
trativ
e A
ssis
tanc
e6,
326
Adm
inis
trat
ive
Aide
3AI
D3
164
36R
AD
FOR
D99
03A
dmin
istra
tive
Sup
port
93
4M
HR
C-S
IRS
C58
4 - 3
Sec
reta
ry9,
446
MH
RC
-SIR
SC
590
- 3A
dmin
istra
tive
Func
tiona
l Sup
port
10,5
72TW
-MM
-EN
GY
AA
S041
- U
3S
ecre
taria
l/Adm
inis
trativ
e A
ssis
tanc
e1,
900
TW-M
M-G
EN
AA
S041
- U
3S
ecre
taria
l/Adm
inis
trativ
e A
ssis
tanc
e6,
881
DW
P13
68 -
Step
5S
enio
r Cle
rk T
ypis
t39
6
Adm
inis
trat
ive
Assi
stan
tAI
D4
114
37R
AD
FOR
D99
04A
dmin
istra
tive
Sup
port
26
6M
HR
C-S
IRS
C59
0 - 4
Adm
inis
trativ
e Fu
nctio
nal S
uppo
rt6,
865
TW-M
M-E
NG
YA
AS0
41 -
U4
Sec
reta
rial/A
dmin
istra
tive
Ass
ista
nce
378
TW-M
M-G
EN
AA
S041
- U
4S
ecre
taria
l/Adm
inis
trativ
e A
ssis
tanc
e2,
920
11A
on H
ewitt
13
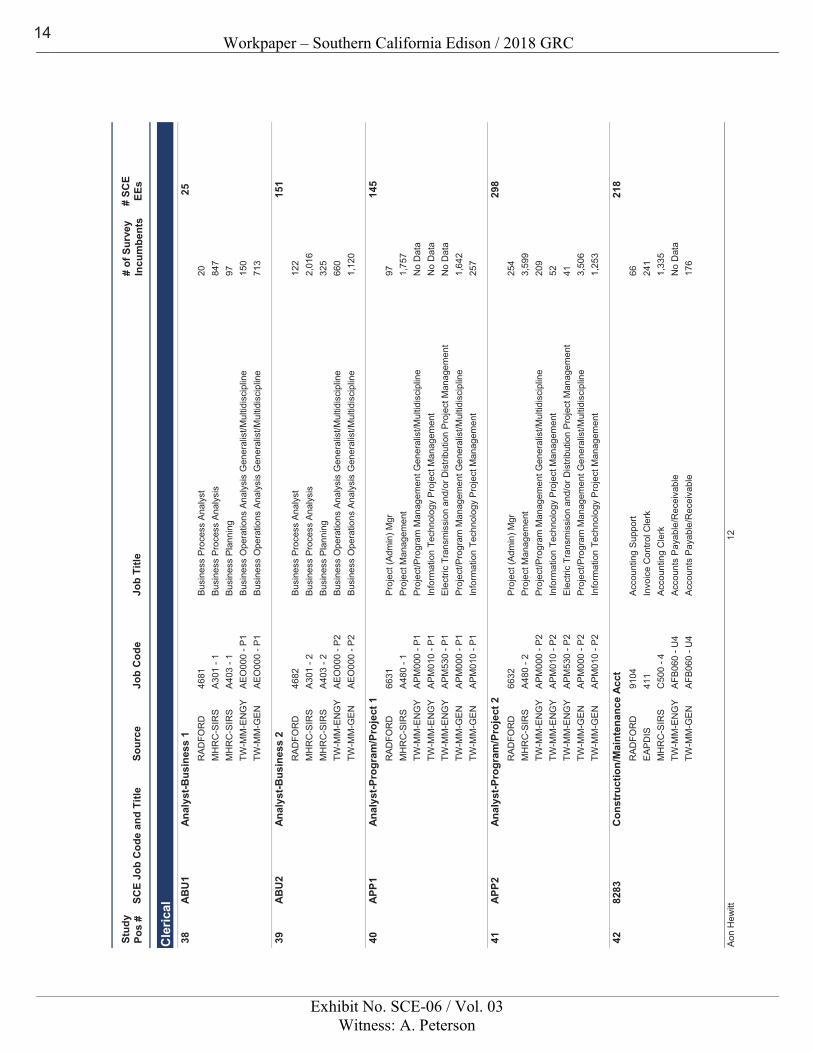
Workpaper – Southern California Edison / 2018 GRC
Exhibit No. SCE-06 / Vol. 03Witness: A. Peterson
Sour
ceJo
b C
ode
Job
Title
SCE
Job
Cod
e an
d Ti
tle#
of S
urve
yIn
cum
bent
s#
SCE
EEs
Stud
y Po
s #
Cle
rical
Anal
yst-B
usin
ess
1AB
U1
2538
RA
DFO
RD
4681
Bus
ines
s P
roce
ss A
naly
st
20M
HR
C-S
IRS
A30
1 - 1
Bus
ines
s P
roce
ss A
naly
sis
847
MH
RC
-SIR
SA
403
- 1B
usin
ess
Pla
nnin
g97
TW-M
M-E
NG
YA
EO
000
- P1
Bus
ines
s O
pera
tions
Ana
lysi
s G
ener
alis
t/Mul
tidis
cipl
ine
150
TW-M
M-G
EN
AE
O00
0 - P
1B
usin
ess
Ope
ratio
ns A
naly
sis
Gen
eral
ist/M
ultid
isci
plin
e71
3
Anal
yst-B
usin
ess
2AB
U2
151
39R
AD
FOR
D46
82B
usin
ess
Pro
cess
Ana
lyst
12
2M
HR
C-S
IRS
A30
1 - 2
Bus
ines
s P
roce
ss A
naly
sis
2,01
6M
HR
C-S
IRS
A40
3 - 2
Bus
ines
s P
lann
ing
325
TW-M
M-E
NG
YA
EO
000
- P2
Bus
ines
s O
pera
tions
Ana
lysi
s G
ener
alis
t/Mul
tidis
cipl
ine
660
TW-M
M-G
EN
AE
O00
0 - P
2B
usin
ess
Ope
ratio
ns A
naly
sis
Gen
eral
ist/M
ultid
isci
plin
e1,
120
Anal
yst-P
rogr
am/P
roje
ct 1
APP1
145
40R
AD
FOR
D66
31Pr
ojec
t (Ad
min
) Mgr
97
MH
RC
-SIR
SA
480
- 1P
roje
ct M
anag
emen
t1,
757
TW-M
M-E
NG
YA
PM
000
- P1
Pro
ject
/Pro
gram
Man
agem
ent G
ener
alis
t/Mul
tidis
cipl
ine
No
Dat
aTW
-MM
-EN
GY
AP
M01
0 - P
1In
form
atio
n Te
chno
logy
Pro
ject
Man
agem
ent
No
Dat
aTW
-MM
-EN
GY
AP
M53
0 - P
1E
lect
ric T
rans
mis
sion
and
/or D
istri
butio
n Pr
ojec
t Man
agem
ent
No
Dat
aTW
-MM
-GE
NA
PM
000
- P1
Pro
ject
/Pro
gram
Man
agem
ent G
ener
alis
t/Mul
tidis
cipl
ine
1,64
2TW
-MM
-GE
NA
PM
010
- P1
Info
rmat
ion
Tech
nolo
gy P
roje
ct M
anag
emen
t25
7
Anal
yst-P
rogr
am/P
roje
ct 2
APP2
298
41R
AD
FOR
D66
32Pr
ojec
t (Ad
min
) Mgr
25
4M
HR
C-S
IRS
A48
0 - 2
Pro
ject
Man
agem
ent
3,59
9TW
-MM
-EN
GY
AP
M00
0 - P
2P
roje
ct/P
rogr
am M
anag
emen
t Gen
eral
ist/M
ultid
isci
plin
e20
9TW
-MM
-EN
GY
AP
M01
0 - P
2In
form
atio
n Te
chno
logy
Pro
ject
Man
agem
ent
52TW
-MM
-EN
GY
AP
M53
0 - P
2E
lect
ric T
rans
mis
sion
and
/or D
istri
butio
n Pr
ojec
t Man
agem
ent
41TW
-MM
-GE
NA
PM
000
- P2
Pro
ject
/Pro
gram
Man
agem
ent G
ener
alis
t/Mul
tidis
cipl
ine
3,50
6TW
-MM
-GE
NA
PM
010
- P2
Info
rmat
ion
Tech
nolo
gy P
roje
ct M
anag
emen
t1,
253
Con
stru
ctio
n/M
aint
enan
ce A
cct
8283
218
42R
AD
FOR
D91
04A
ccou
ntin
g S
uppo
rt
66E
APD
IS41
1In
voic
e C
ontro
l Cle
rk24
1M
HR
C-S
IRS
C50
0 - 4
Acc
ount
ing
Cle
rk1,
335
TW-M
M-E
NG
YA
FB06
0 - U
4A
ccou
nts
Pay
able
/Rec
eiva
ble
No
Dat
aTW
-MM
-GE
NA
FB06
0 - U
4A
ccou
nts
Pay
able
/Rec
eiva
ble
176
12A
on H
ewitt
14
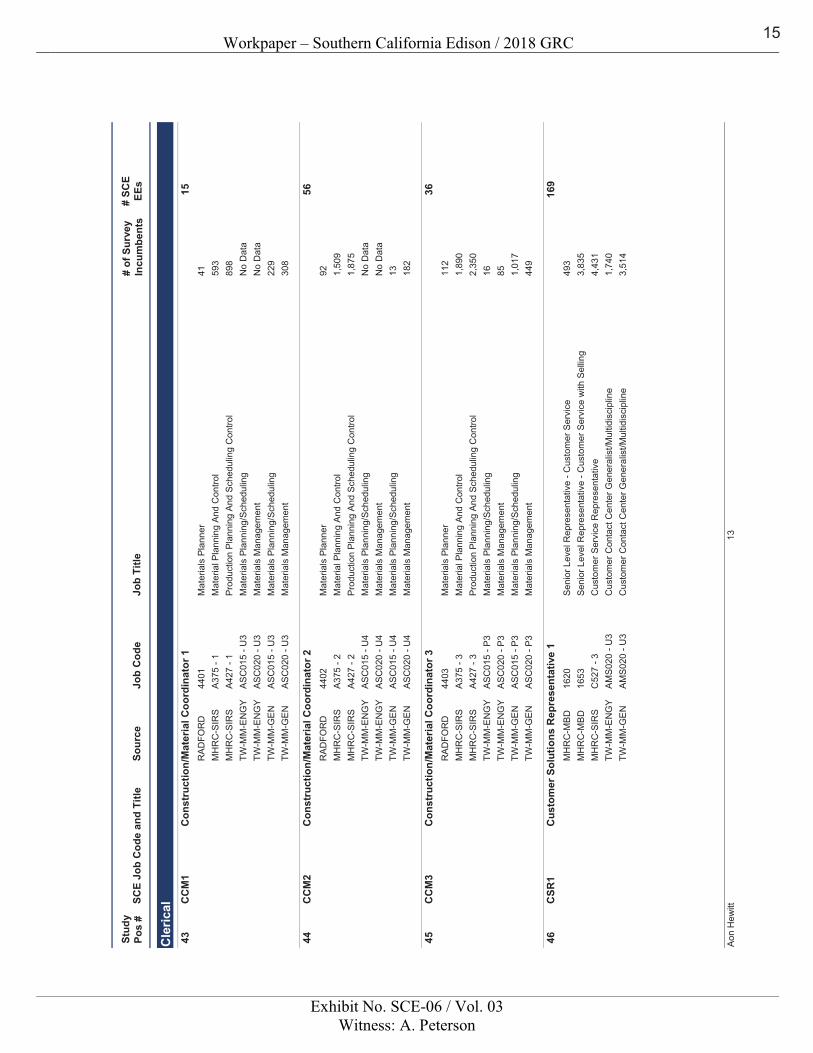
Workpaper – Southern California Edison / 2018 GRC
Exhibit No. SCE-06 / Vol. 03Witness: A. Peterson
Sour
ceJo
b C
ode
Job
Title
SCE
Job
Cod
e an
d Ti
tle#
of S
urve
yIn
cum
bent
s#
SCE
EEs
Stud
y Po
s #
Cle
rical
Con
stru
ctio
n/M
ater
ial C
oord
inat
or 1
CC
M1
1543
RA
DFO
RD
4401
Mat
eria
ls P
lann
er41
MH
RC
-SIR
SA
375
- 1M
ater
ial P
lann
ing
And
Con
trol
593
MH
RC
-SIR
SA
427
- 1P
rodu
ctio
n P
lann
ing
And
Sch
edul
ing
Con
trol
898
TW-M
M-E
NG
YA
SC
015
- U3
Mat
eria
ls P
lann
ing/
Sch
edul
ing
No
Dat
aTW
-MM
-EN
GY
AS
C02
0 - U
3M
ater
ials
Man
agem
ent
No
Dat
aTW
-MM
-GE
NA
SC
015
- U3
Mat
eria
ls P
lann
ing/
Sch
edul
ing
229
TW-M
M-G
ENAS
C02
0 - U
3M
ater
ials
Man
agem
ent
308
Con
stru
ctio
n/M
ater
ial C
oord
inat
or 2
CC
M2
5644
RA
DFO
RD
4402
Mat
eria
ls P
lann
er
92M
HR
C-S
IRS
A37
5 - 2
Mat
eria
l Pla
nnin
g A
nd C
ontro
l1,
509
MH
RC
-SIR
SA
427
- 2P
rodu
ctio
n P
lann
ing
And
Sch
edul
ing
Con
trol
1,87
5TW
-MM
-EN
GY
AS
C01
5 - U
4M
ater
ials
Pla
nnin
g/S
ched
ulin
gN
o D
ata
TW-M
M-E
NG
YA
SC
020
- U4
Mat
eria
ls M
anag
emen
tN
o D
ata
TW-M
M-G
EN
AS
C01
5 - U
4M
ater
ials
Pla
nnin
g/S
ched
ulin
g13
TW-M
M-G
ENAS
C02
0 - U
4M
ater
ials
Man
agem
ent
182
Con
stru
ctio
n/M
ater
ial C
oord
inat
or 3
CC
M3
3645
RA
DFO
RD
4403
Mat
eria
ls P
lann
er
112
MH
RC
-SIR
SA
375
- 3M
ater
ial P
lann
ing
And
Con
trol
1,89
0M
HR
C-S
IRS
A42
7 - 3
Pro
duct
ion
Pla
nnin
g A
nd S
ched
ulin
g C
ontro
l2,
350
TW-M
M-E
NG
YA
SC
015
- P3
Mat
eria
ls P
lann
ing/
Sch
edul
ing
16TW
-MM
-EN
GY
AS
C02
0 - P
3M
ater
ials
Man
agem
ent
85TW
-MM
-GE
NA
SC
015
- P3
Mat
eria
ls P
lann
ing/
Sch
edul
ing
1,01
7TW
-MM
-GE
NA
SC
020
- P3
Mat
eria
ls M
anag
emen
t44
9
Cus
tom
er S
olut
ions
Rep
rese
ntat
ive
1C
SR1
169
46M
HR
C-M
BD
1620
Sen
ior L
evel
Rep
rese
ntat
ive
- Cus
tom
er S
ervi
ce49
3M
HR
C-M
BD
1653
Sen
ior L
evel
Rep
rese
ntat
ive
- Cus
tom
er S
ervi
ce w
ith S
ellin
g3,
835
MH
RC
-SIR
SC
527
- 3C
usto
mer
Ser
vice
Rep
rese
ntat
ive
4,43
1TW
-MM
-EN
GY
AM
S02
0 - U
3C
usto
mer
Con
tact
Cen
ter G
ener
alis
t/Mul
tidis
cipl
ine
1,74
0TW
-MM
-GE
NA
MS
020
- U3
Cus
tom
er C
onta
ct C
ente
r Gen
eral
ist/M
ultid
isci
plin
e3,
514
13A
on H
ewitt
15
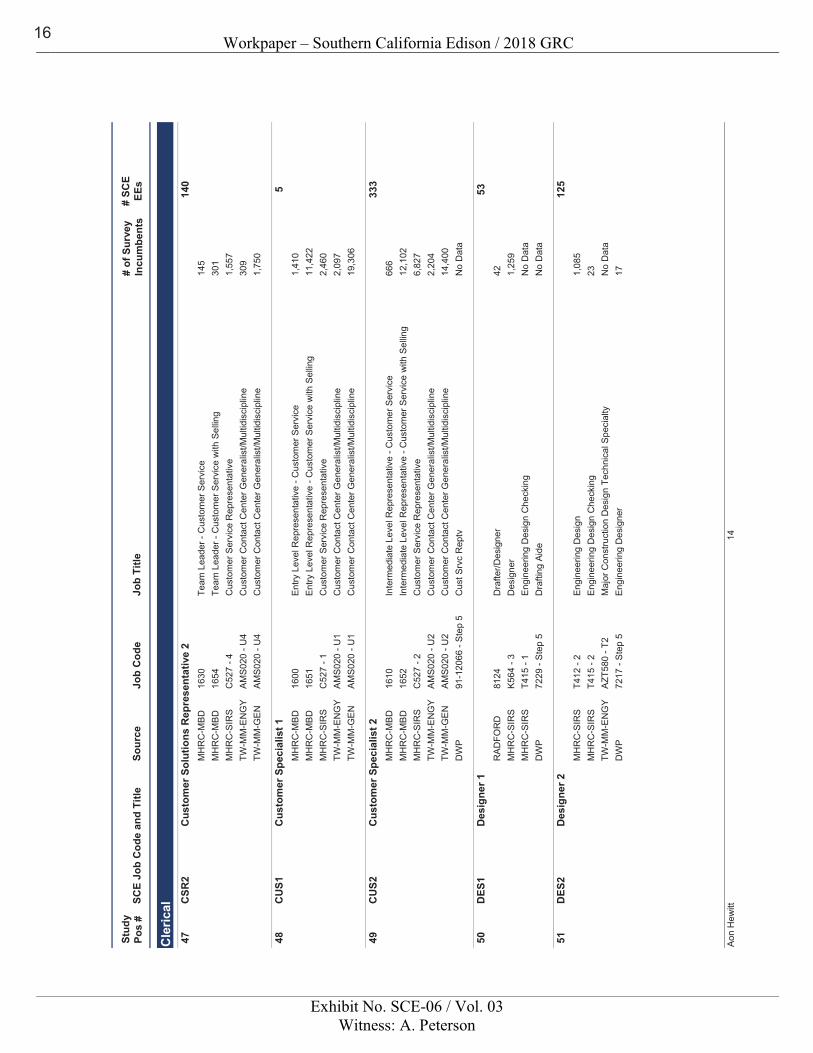
Workpaper – Southern California Edison / 2018 GRC
Exhibit No. SCE-06 / Vol. 03Witness: A. Peterson
Sour
ceJo
b C
ode
Job
Title
SCE
Job
Cod
e an
d Ti
tle#
of S
urve
yIn
cum
bent
s#
SCE
EEs
Stud
y Po
s #
Cle
rical
Cus
tom
er S
olut
ions
Rep
rese
ntat
ive
2C
SR2
140
47M
HR
C-M
BD16
30Te
am L
eade
r - C
usto
mer
Ser
vice
145
MH
RC
-MBD
1654
Team
Lea
der -
Cus
tom
er S
ervi
ce w
ith S
ellin
g30
1M
HR
C-S
IRS
C52
7 - 4
Cus
tom
er S
ervi
ce R
epre
sent
ativ
e1,
557
TW-M
M-E
NG
YA
MS
020
- U4
Cus
tom
er C
onta
ct C
ente
r Gen
eral
ist/M
ultid
isci
plin
e30
9TW
-MM
-GE
NA
MS
020
- U4
Cus
tom
er C
onta
ct C
ente
r Gen
eral
ist/M
ultid
isci
plin
e1,
750
Cus
tom
er S
peci
alis
t 1C
US1
548
MH
RC
-MB
D16
00E
ntry
Lev
el R
epre
sent
ativ
e - C
usto
mer
Ser
vice
1,41
0M
HR
C-M
BD
1651
Ent
ry L
evel
Rep
rese
ntat
ive
- Cus
tom
er S
ervi
ce w
ith S
ellin
g11
,422
MH
RC
-SIR
SC
527
- 1C
usto
mer
Ser
vice
Rep
rese
ntat
ive
2,46
0TW
-MM
-EN
GY
AM
S02
0 - U
1C
usto
mer
Con
tact
Cen
ter G
ener
alis
t/Mul
tidis
cipl
ine
2,09
7TW
-MM
-GE
NA
MS
020
- U1
Cus
tom
er C
onta
ct C
ente
r Gen
eral
ist/M
ultid
isci
plin
e19
,306
Cus
tom
er S
peci
alis
t 2C
US2
333
49M
HR
C-M
BD16
10In
term
edia
te L
evel
Rep
rese
ntat
ive
- Cus
tom
er S
ervi
ce66
6M
HR
C-M
BD
1652
Inte
rmed
iate
Lev
el R
epre
sent
ativ
e - C
usto
mer
Ser
vice
with
Sel
ling
12,1
02M
HR
C-S
IRS
C52
7 - 2
Cus
tom
er S
ervi
ce R
epre
sent
ativ
e6,
827
TW-M
M-E
NG
YA
MS
020
- U2
Cus
tom
er C
onta
ct C
ente
r Gen
eral
ist/M
ultid
isci
plin
e2,
204
TW-M
M-G
EN
AM
S02
0 - U
2C
usto
mer
Con
tact
Cen
ter G
ener
alis
t/Mul
tidis
cipl
ine
14,4
00D
WP
91-1
2066
- S
tep
5C
ust S
rvc
Rep
tvN
o D
ata
Des
igne
r 1D
ES1
5350
RA
DFO
RD
8124
Dra
fter/D
esig
ner
42M
HR
C-S
IRS
K56
4 - 3
Des
igne
r1,
259
MH
RC
-SIR
ST4
15 -
1E
ngin
eerin
g D
esig
n C
heck
ing
No
Dat
aD
WP
7229
- S
tep
5D
rafti
ng A
ide
No
Dat
a
Des
igne
r 2D
ES2
125
51M
HR
C-S
IRS
T412
- 2
Eng
inee
ring
Des
ign
1,08
5M
HR
C-S
IRS
T415
- 2
Eng
inee
ring
Des
ign
Che
ckin
g23
TW-M
M-E
NG
YA
ZT58
0 - T
2M
ajor
Con
stru
ctio
n D
esig
n Te
chni
cal S
peci
alty
No
Dat
aD
WP
7217
- S
tep
5E
ngin
eerin
g D
esig
ner
17
14A
on H
ewitt
16

Workpaper – Southern California Edison / 2018 GRC
Exhibit No. SCE-06 / Vol. 03Witness: A. Peterson
Sour
ceJo
b C
ode
Job
Title
SCE
Job
Cod
e an
d Ti
tle#
of S
urve
yIn
cum
bent
s#
SCE
EEs
Stud
y Po
s #
Cle
rical
Dra
fting
Tec
hnic
ian
2D
RF2
452
RA
DFO
RD
8122
Dra
fter/D
esig
ner
49M
HR
C-S
IRS
K56
1 - 2
Dra
fter
462
TW-M
M-E
NG
YA
ZT08
0 - T
2C
AD
/CA
E D
rafti
ng T
echn
ical
Spe
cial
ty14
1TW
-MM
-GE
NA
ZT08
0 - T
2C
AD
/CA
E D
rafti
ng T
echn
ical
Spe
cial
ty64
7D
WP
7232
- S
tep
5C
vl E
ngg
Drft
g Tc
hn75
DW
P75
51 -
Ste
p 5
Mch
l Eng
g D
rftg
Tchn
9
Exec
utiv
e As
sist
ant 1
EXA1
6553
RA
DFO
RD
6503
Exe
cutiv
e A
ssis
tant
35
4D
WP
1336
- S
tep
5U
tility
Exe
cutiv
e S
ecre
tary
25
Plan
ner 1
PLA1
233
54E
APD
IS10
5C
usto
mer
Ser
vice
Pla
nner
/Est
imat
or1,
172
Tech
nica
l Spe
cial
ist/S
cien
tist 1
TSP1
3055
MH
RC
-SIR
ST0
36 -
1E
ngin
eerin
g - E
nviro
nmen
tal,
Hea
lth a
nd S
afet
y16
3TW
-MM
-EN
GY
AZT
000
- P1
Tech
nica
l Spe
cial
ty/S
kille
d Tr
ade
Gen
eral
ist/M
ultid
isci
plin
e64
TW-M
M-G
EN
AZT
000
- P1
Tech
nica
l Spe
cial
ty/S
kille
d Tr
ade
Gen
eral
ist/M
ultid
isci
plin
e11
3
Tech
nica
l Spe
cial
ist/S
cien
tist 2
TSP2
121
56M
HR
C-S
IRS
T036
- 2
Eng
inee
ring
- Env
ironm
enta
l, H
ealth
and
Saf
ety
414
TW-M
M-E
NG
YA
ZT00
0 - P
2Te
chni
cal S
peci
alty
/Ski
lled
Trad
e G
ener
alis
t/Mul
tidis
cipl
ine
276
TW-M
M-G
EN
AZT
000
- P2
Tech
nica
l Spe
cial
ty/S
kille
d Tr
ade
Gen
eral
ist/M
ultid
isci
plin
e70
4
15A
on H
ewitt
17
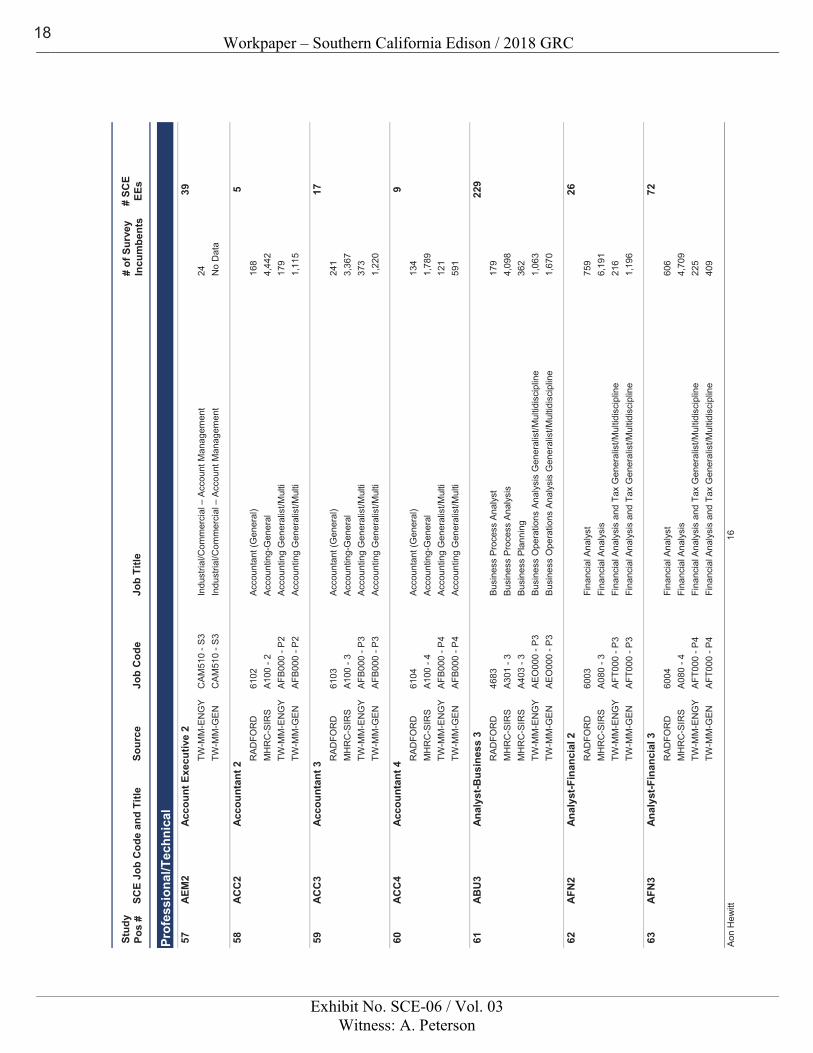
Workpaper – Southern California Edison / 2018 GRC
Exhibit No. SCE-06 / Vol. 03Witness: A. Peterson
Sour
ceJo
b C
ode
Job
Title
SCE
Job
Cod
e an
d Ti
tle#
of S
urve
yIn
cum
bent
s#
SCE
EEs
Stud
y Po
s #
Prof
essi
onal
/Tec
hnic
al Acco
unt E
xecu
tive
2AE
M2
3957
TW-M
M-E
NG
YC
AM
510
- S3
Indu
stria
l/Com
mer
cial
– A
ccou
nt M
anag
emen
t24
TW-M
M-G
EN
CA
M51
0 - S
3In
dust
rial/C
omm
erci
al –
Acc
ount
Man
agem
ent
No
Dat
a
Acco
unta
nt 2
ACC
25
58R
AD
FOR
D61
02A
ccou
ntan
t (G
ener
al)
168
MH
RC
-SIR
SA
100
- 2A
ccou
ntin
g-G
ener
al4,
442
TW-M
M-E
NG
YA
FB00
0 - P
2A
ccou
ntin
g G
ener
alis
t/Mul
ti17
9TW
-MM
-GE
NA
FB00
0 - P
2A
ccou
ntin
g G
ener
alis
t/Mul
ti1,
115
Acco
unta
nt 3
ACC
317
59R
AD
FOR
D61
03A
ccou
ntan
t (G
ener
al)
241
MH
RC
-SIR
SA
100
- 3A
ccou
ntin
g-G
ener
al3,
367
TW-M
M-E
NG
YA
FB00
0 - P
3A
ccou
ntin
g G
ener
alis
t/Mul
ti37
3TW
-MM
-GE
NA
FB00
0 - P
3A
ccou
ntin
g G
ener
alis
t/Mul
ti1,
220
Acco
unta
nt 4
ACC
49
60R
AD
FOR
D61
04A
ccou
ntan
t (G
ener
al)
134
MH
RC
-SIR
SA
100
- 4A
ccou
ntin
g-G
ener
al1,
789
TW-M
M-E
NG
YA
FB00
0 - P
4A
ccou
ntin
g G
ener
alis
t/Mul
ti12
1TW
-MM
-GE
NA
FB00
0 - P
4A
ccou
ntin
g G
ener
alis
t/Mul
ti59
1
Anal
yst-B
usin
ess
3AB
U3
229
61R
AD
FOR
D46
83B
usin
ess
Pro
cess
Ana
lyst
17
9M
HR
C-S
IRS
A30
1 - 3
Bus
ines
s P
roce
ss A
naly
sis
4,09
8M
HR
C-S
IRS
A40
3 - 3
Bus
ines
s P
lann
ing
362
TW-M
M-E
NG
YA
EO
000
- P3
Bus
ines
s O
pera
tions
Ana
lysi
s G
ener
alis
t/Mul
tidis
cipl
ine
1,06
3TW
-MM
-GE
NA
EO
000
- P3
Bus
ines
s O
pera
tions
Ana
lysi
s G
ener
alis
t/Mul
tidis
cipl
ine
1,67
0
Anal
yst-F
inan
cial
2AF
N2
2662
RA
DFO
RD
6003
Fina
ncia
l Ana
lyst
75
9M
HR
C-S
IRS
A08
0 - 3
Fina
ncia
l Ana
lysi
s6,
191
TW-M
M-E
NG
YA
FT00
0 - P
3Fi
nanc
ial A
naly
sis
and
Tax
Gen
eral
ist/M
ultid
isci
plin
e21
6TW
-MM
-GE
NA
FT00
0 - P
3Fi
nanc
ial A
naly
sis
and
Tax
Gen
eral
ist/M
ultid
isci
plin
e1,
196
Anal
yst-F
inan
cial
3AF
N3
7263
RA
DFO
RD
6004
Fina
ncia
l Ana
lyst
60
6M
HR
C-S
IRS
A08
0 - 4
Fina
ncia
l Ana
lysi
s4,
709
TW-M
M-E
NG
YA
FT00
0 - P
4Fi
nanc
ial A
naly
sis
and
Tax
Gen
eral
ist/M
ultid
isci
plin
e22
5TW
-MM
-GE
NA
FT00
0 - P
4Fi
nanc
ial A
naly
sis
and
Tax
Gen
eral
ist/M
ultid
isci
plin
e40
9
16A
on H
ewitt
18
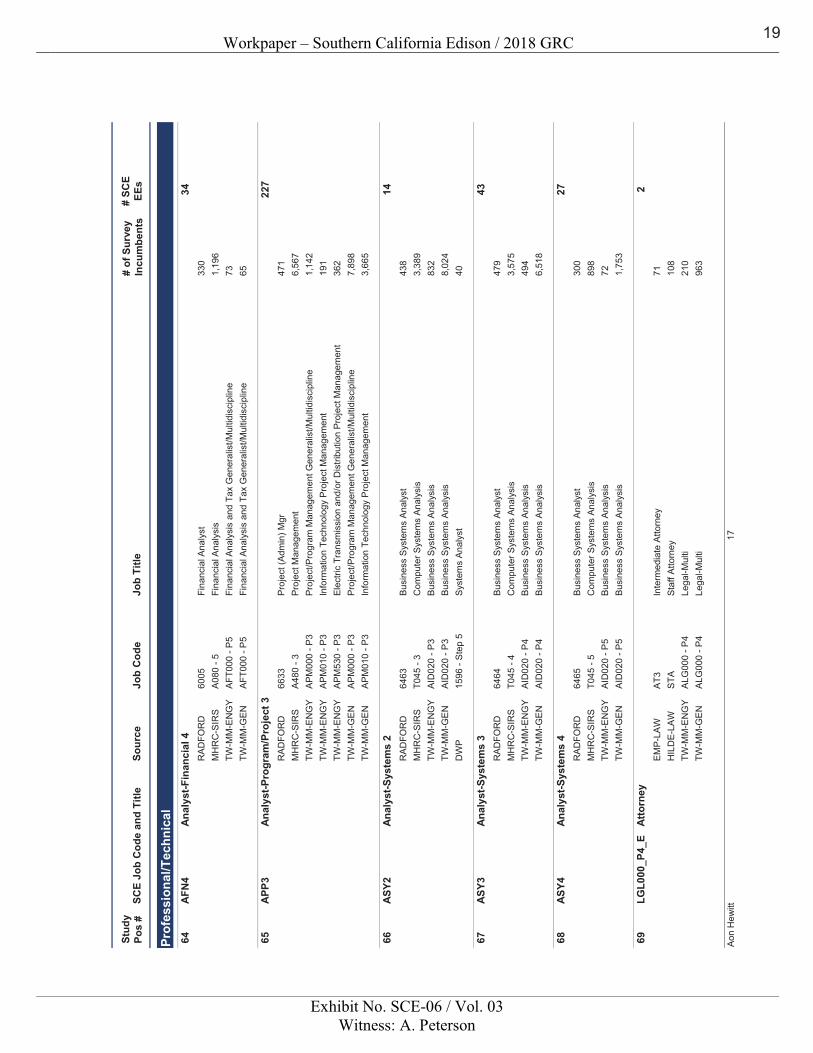
Workpaper – Southern California Edison / 2018 GRC
Exhibit No. SCE-06 / Vol. 03Witness: A. Peterson
Sour
ceJo
b C
ode
Job
Title
SCE
Job
Cod
e an
d Ti
tle#
of S
urve
yIn
cum
bent
s#
SCE
EEs
Stud
y Po
s #
Prof
essi
onal
/Tec
hnic
al Anal
yst-F
inan
cial
4AF
N4
3464
RA
DFO
RD
6005
Fina
ncia
l Ana
lyst
33
0M
HR
C-S
IRS
A08
0 - 5
Fina
ncia
l Ana
lysi
s1,
196
TW-M
M-E
NG
YA
FT00
0 - P
5Fi
nanc
ial A
naly
sis
and
Tax
Gen
eral
ist/M
ultid
isci
plin
e73
TW-M
M-G
EN
AFT
000
- P5
Fina
ncia
l Ana
lysi
s an
d Ta
x G
ener
alis
t/Mul
tidis
cipl
ine
65
Anal
yst-P
rogr
am/P
roje
ct 3
APP3
227
65R
AD
FOR
D66
33Pr
ojec
t (Ad
min
) Mgr
47
1M
HR
C-S
IRS
A48
0 - 3
Pro
ject
Man
agem
ent
6,56
7TW
-MM
-EN
GY
AP
M00
0 - P
3P
roje
ct/P
rogr
am M
anag
emen
t Gen
eral
ist/M
ultid
isci
plin
e1,
142
TW-M
M-E
NG
YA
PM
010
- P3
Info
rmat
ion
Tech
nolo
gy P
roje
ct M
anag
emen
t19
1TW
-MM
-EN
GY
AP
M53
0 - P
3E
lect
ric T
rans
mis
sion
and
/or D
istri
butio
n Pr
ojec
t Man
agem
ent
362
TW-M
M-G
EN
AP
M00
0 - P
3P
roje
ct/P
rogr
am M
anag
emen
t Gen
eral
ist/M
ultid
isci
plin
e7,
898
TW-M
M-G
EN
AP
M01
0 - P
3In
form
atio
n Te
chno
logy
Pro
ject
Man
agem
ent
3,66
5
Anal
yst-S
yste
ms
2AS
Y214
66R
AD
FOR
D64
63B
usin
ess
Sys
tem
s A
naly
st
438
MH
RC
-SIR
ST0
45 -
3C
ompu
ter S
yste
ms
Anal
ysis
3,38
9TW
-MM
-EN
GY
AID
020
- P3
Bus
ines
s S
yste
ms
Ana
lysi
s83
2TW
-MM
-GE
NA
ID02
0 - P
3B
usin
ess
Sys
tem
s A
naly
sis
8,02
4D
WP
1596
- S
tep
5S
yste
ms
Ana
lyst
40
Anal
yst-S
yste
ms
3AS
Y343
67R
AD
FOR
D64
64B
usin
ess
Sys
tem
s A
naly
st
479
MH
RC
-SIR
ST0
45 -
4C
ompu
ter S
yste
ms
Anal
ysis
3,57
5TW
-MM
-EN
GY
AID
020
- P4
Bus
ines
s S
yste
ms
Ana
lysi
s49
4TW
-MM
-GE
NA
ID02
0 - P
4B
usin
ess
Sys
tem
s A
naly
sis
6,51
8
Anal
yst-S
yste
ms
4AS
Y427
68R
AD
FOR
D64
65B
usin
ess
Sys
tem
s A
naly
st
300
MH
RC
-SIR
ST0
45 -
5C
ompu
ter S
yste
ms
Anal
ysis
898
TW-M
M-E
NG
YA
ID02
0 - P
5B
usin
ess
Sys
tem
s A
naly
sis
72TW
-MM
-GE
NA
ID02
0 - P
5B
usin
ess
Sys
tem
s A
naly
sis
1,75
3
Atto
rney
LGL0
00_P
4_E
269
EM
P-L
AW
AT3
Inte
rmed
iate
Atto
rney
71H
ILD
E-LA
WS
TAS
taff
Atto
rney
108
TW-M
M-E
NG
YA
LG00
0 - P
4Le
gal-M
ulti
210
TW-M
M-G
EN
ALG
000
- P4
Lega
l-Mul
ti96
3
17A
on H
ewitt
19
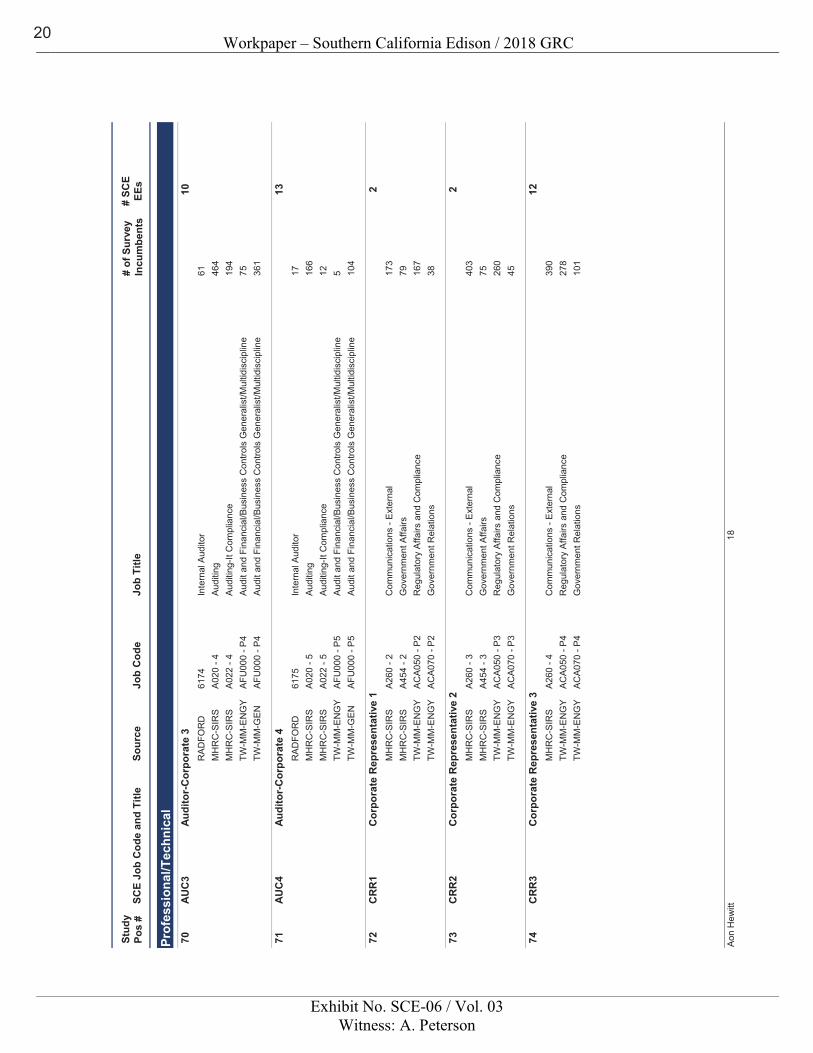
Workpaper – Southern California Edison / 2018 GRC
Exhibit No. SCE-06 / Vol. 03Witness: A. Peterson
Sour
ceJo
b C
ode
Job
Title
SCE
Job
Cod
e an
d Ti
tle#
of S
urve
yIn
cum
bent
s#
SCE
EEs
Stud
y Po
s #
Prof
essi
onal
/Tec
hnic
al Audi
tor-
Cor
pora
te 3
AUC
310
70R
AD
FOR
D61
74In
tern
al A
udito
r 61
MH
RC
-SIR
SA
020
- 4A
uditi
ng46
4M
HR
C-S
IRS
A02
2 - 4
Aud
iting
-It C
ompl
ianc
e19
4TW
-MM
-EN
GY
AFU
000
- P4
Aud
it an
d Fi
nanc
ial/B
usin
ess
Con
trols
Gen
eral
ist/M
ultid
isci
plin
e75
TW-M
M-G
EN
AFU
000
- P4
Aud
it an
d Fi
nanc
ial/B
usin
ess
Con
trols
Gen
eral
ist/M
ultid
isci
plin
e36
1
Audi
tor-
Cor
pora
te 4
AUC
413
71R
AD
FOR
D61
75In
tern
al A
udito
r 17
MH
RC
-SIR
SA
020
- 5A
uditi
ng16
6M
HR
C-S
IRS
A02
2 - 5
Aud
iting
-It C
ompl
ianc
e12
TW-M
M-E
NG
YA
FU00
0 - P
5A
udit
and
Fina
ncia
l/Bus
ines
s C
ontro
ls G
ener
alis
t/Mul
tidis
cipl
ine
5TW
-MM
-GE
NA
FU00
0 - P
5A
udit
and
Fina
ncia
l/Bus
ines
s C
ontro
ls G
ener
alis
t/Mul
tidis
cipl
ine
104
Cor
pora
te R
epre
sent
ativ
e 1
CR
R1
272
MH
RC
-SIR
SA
260
- 2C
omm
unic
atio
ns -
Ext
erna
l17
3M
HR
C-S
IRS
A45
4 - 2
Gov
ernm
ent A
ffairs
79TW
-MM
-EN
GY
AC
A05
0 - P
2R
egul
ator
y A
ffairs
and
Com
plia
nce
167
TW-M
M-E
NG
YA
CA
070
- P2
Gov
ernm
ent R
elat
ions
38
Cor
pora
te R
epre
sent
ativ
e 2
CR
R2
273
MH
RC
-SIR
SA
260
- 3C
omm
unic
atio
ns -
Ext
erna
l40
3M
HR
C-S
IRS
A45
4 - 3
Gov
ernm
ent A
ffairs
75TW
-MM
-EN
GY
AC
A05
0 - P
3R
egul
ator
y A
ffairs
and
Com
plia
nce
260
TW-M
M-E
NG
YA
CA
070
- P3
Gov
ernm
ent R
elat
ions
45
Cor
pora
te R
epre
sent
ativ
e 3
CR
R3
1274
MH
RC
-SIR
SA
260
- 4C
omm
unic
atio
ns -
Ext
erna
l39
0TW
-MM
-EN
GY
AC
A05
0 - P
4R
egul
ator
y A
ffairs
and
Com
plia
nce
278
TW-M
M-E
NG
YA
CA
070
- P4
Gov
ernm
ent R
elat
ions
101
18A
on H
ewitt
20
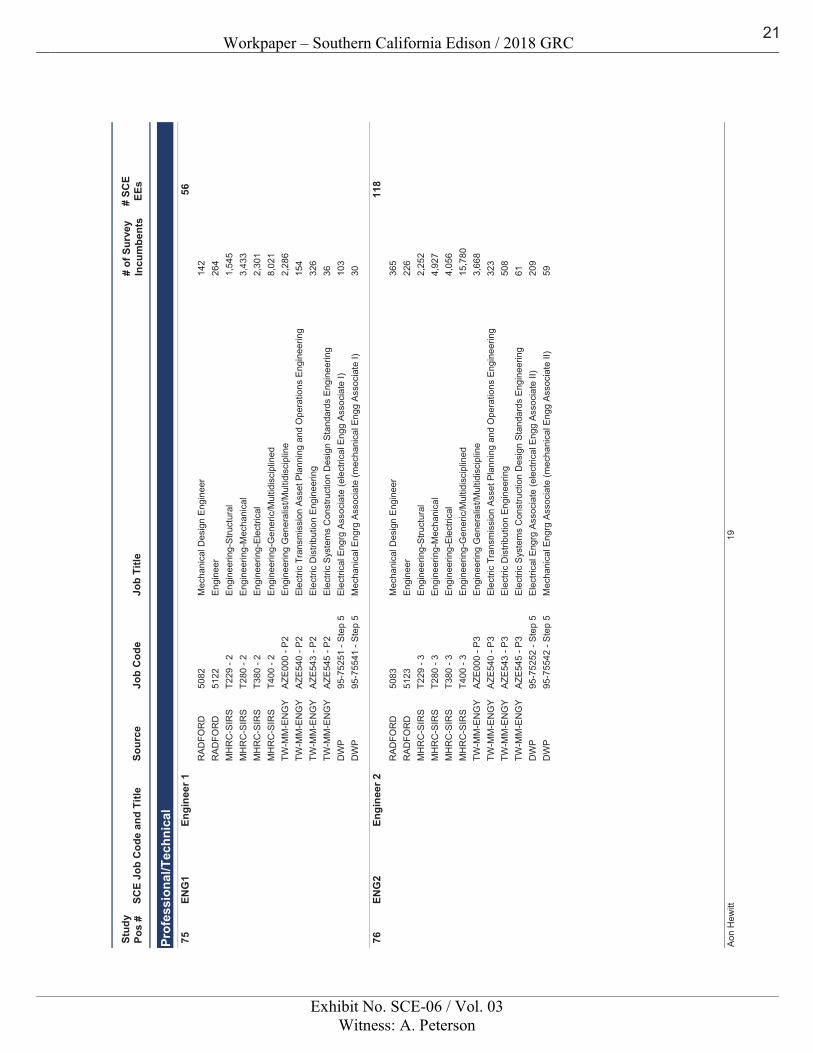
Workpaper – Southern California Edison / 2018 GRC
Exhibit No. SCE-06 / Vol. 03Witness: A. Peterson
Sour
ceJo
b C
ode
Job
Title
SCE
Job
Cod
e an
d Ti
tle#
of S
urve
yIn
cum
bent
s#
SCE
EEs
Stud
y Po
s #
Prof
essi
onal
/Tec
hnic
al Engi
neer
1EN
G1
5675
RA
DFO
RD
5082
Mec
hani
cal D
esig
n E
ngin
eer
142
RA
DFO
RD
5122
Engi
neer
26
4M
HR
C-S
IRS
T229
- 2
Eng
inee
ring-
Stru
ctur
al1,
545
MH
RC
-SIR
ST2
80 -
2E
ngin
eerin
g-M
echa
nica
l3,
433
MH
RC
-SIR
ST3
80 -
2E
ngin
eerin
g-E
lect
rical
2,30
1M
HR
C-S
IRS
T400
- 2
Eng
inee
ring-
Gen
eric
/Mul
tidis
cipl
ined
8,02
1TW
-MM
-EN
GY
AZE
000
- P2
Eng
inee
ring
Gen
eral
ist/M
ultid
isci
plin
e2,
286
TW-M
M-E
NG
YA
ZE54
0 - P
2E
lect
ric T
rans
mis
sion
Ass
et P
lann
ing
and
Ope
ratio
ns E
ngin
eerin
g15
4TW
-MM
-EN
GY
AZE
543
- P2
Ele
ctric
Dis
tribu
tion
Eng
inee
ring
326
TW-M
M-E
NG
YA
ZE54
5 - P
2E
lect
ric S
yste
ms
Con
stru
ctio
n D
esig
n S
tand
ards
Eng
inee
ring
36D
WP
95-7
5251
- S
tep
5E
lect
rical
Eng
rg A
ssoc
iate
(ele
ctric
al E
ngg
Asso
ciat
e I)
103
DW
P95
-755
41 -
Ste
p 5
Mec
hani
cal E
ngrg
Ass
ocia
te (m
echa
nica
l Eng
g A
ssoc
iate
I)30
Engi
neer
2EN
G2
118
76R
AD
FOR
D50
83M
echa
nica
l Des
ign
Eng
inee
r 36
5R
AD
FOR
D51
23En
gine
er
226
MH
RC
-SIR
ST2
29 -
3E
ngin
eerin
g-S
truct
ural
2,25
2M
HR
C-S
IRS
T280
- 3
Eng
inee
ring-
Mec
hani
cal
4,92
7M
HR
C-S
IRS
T380
- 3
Eng
inee
ring-
Ele
ctric
al4,
056
MH
RC
-SIR
ST4
00 -
3E
ngin
eerin
g-G
ener
ic/M
ultid
isci
plin
ed15
,780
TW-M
M-E
NG
YA
ZE00
0 - P
3E
ngin
eerin
g G
ener
alis
t/Mul
tidis
cipl
ine
3,66
8TW
-MM
-EN
GY
AZE
540
- P3
Ele
ctric
Tra
nsm
issi
on A
sset
Pla
nnin
g an
d O
pera
tions
Eng
inee
ring
323
TW-M
M-E
NG
YA
ZE54
3 - P
3E
lect
ric D
istri
butio
n E
ngin
eerin
g50
8TW
-MM
-EN
GY
AZE
545
- P3
Ele
ctric
Sys
tem
s C
onst
ruct
ion
Des
ign
Sta
ndar
ds E
ngin
eerin
g61
DW
P95
-752
52 -
Ste
p 5
Ele
ctric
al E
ngrg
Ass
ocia
te (e
lect
rical
Eng
g As
soci
ate
II)20
9D
WP
95-7
5542
- S
tep
5M
echa
nica
l Eng
rg A
ssoc
iate
(mec
hani
cal E
ngg
Ass
ocia
te II
)59
19A
on H
ewitt
21
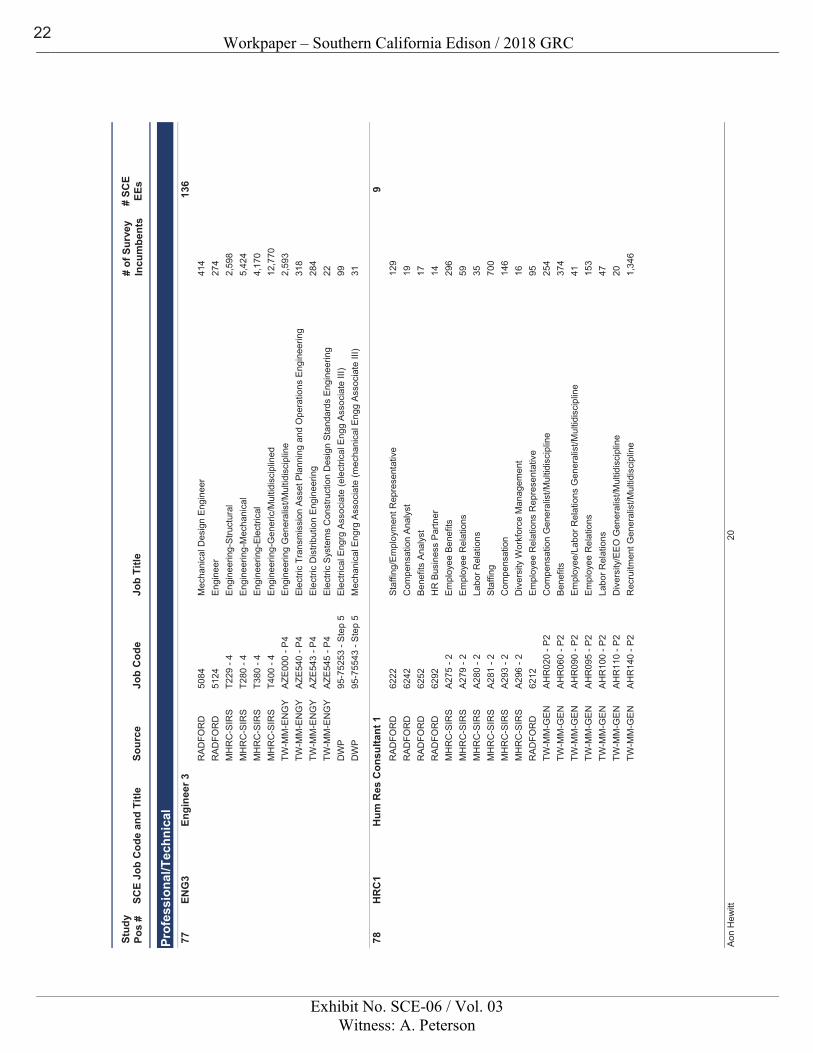
Workpaper – Southern California Edison / 2018 GRC
Exhibit No. SCE-06 / Vol. 03Witness: A. Peterson
Sour
ceJo
b C
ode
Job
Title
SCE
Job
Cod
e an
d Ti
tle#
of S
urve
yIn
cum
bent
s#
SCE
EEs
Stud
y Po
s #
Prof
essi
onal
/Tec
hnic
al Engi
neer
3EN
G3
136
77R
AD
FOR
D50
84M
echa
nica
l Des
ign
Eng
inee
r 41
4R
AD
FOR
D51
24En
gine
er
274
MH
RC
-SIR
ST2
29 -
4E
ngin
eerin
g-S
truct
ural
2,59
8M
HR
C-S
IRS
T280
- 4
Eng
inee
ring-
Mec
hani
cal
5,42
4M
HR
C-S
IRS
T380
- 4
Eng
inee
ring-
Ele
ctric
al4,
170
MH
RC
-SIR
ST4
00 -
4E
ngin
eerin
g-G
ener
ic/M
ultid
isci
plin
ed12
,770
TW-M
M-E
NG
YA
ZE00
0 - P
4E
ngin
eerin
g G
ener
alis
t/Mul
tidis
cipl
ine
2,59
3TW
-MM
-EN
GY
AZE
540
- P4
Ele
ctric
Tra
nsm
issi
on A
sset
Pla
nnin
g an
d O
pera
tions
Eng
inee
ring
318
TW-M
M-E
NG
YA
ZE54
3 - P
4E
lect
ric D
istri
butio
n E
ngin
eerin
g28
4TW
-MM
-EN
GY
AZE
545
- P4
Ele
ctric
Sys
tem
s C
onst
ruct
ion
Des
ign
Sta
ndar
ds E
ngin
eerin
g22
DW
P95
-752
53 -
Ste
p 5
Ele
ctric
al E
ngrg
Ass
ocia
te (e
lect
rical
Eng
g As
soci
ate
III)
99D
WP
95-7
5543
- S
tep
5M
echa
nica
l Eng
rg A
ssoc
iate
(mec
hani
cal E
ngg
Ass
ocia
te II
I)31
Hum
Res
Con
sulta
nt 1
HR
C1
978
RA
DFO
RD
6222
Sta
ffing
/Em
ploy
men
t Rep
rese
ntat
ive
12
9R
AD
FOR
D62
42C
ompe
nsat
ion
Anal
yst
19R
AD
FOR
D62
52B
enef
its A
naly
st
17R
AD
FOR
D62
92H
R B
usin
ess
Par
tner
14M
HR
C-S
IRS
A27
5 - 2
Em
ploy
ee B
enef
its29
6M
HR
C-S
IRS
A27
9 - 2
Em
ploy
ee R
elat
ions
59M
HR
C-S
IRS
A28
0 - 2
Labo
r Rel
atio
ns35
MH
RC
-SIR
SA
281
- 2S
taffi
ng70
0M
HR
C-S
IRS
A29
3 - 2
Com
pens
atio
n14
6M
HR
C-S
IRS
A29
6 - 2
Div
ersi
ty W
orkf
orce
Man
agem
ent
16R
AD
FOR
D62
12E
mpl
oyee
Rel
atio
ns R
epre
sent
ativ
e
95TW
-MM
-GE
NA
HR
020
- P2
Com
pens
atio
n G
ener
alis
t/Mul
tidis
cipl
ine
254
TW-M
M-G
EN
AH
R06
0 - P
2B
enef
its37
4TW
-MM
-GE
NA
HR
090
- P2
Em
ploy
ee/L
abor
Rel
atio
ns G
ener
alis
t/Mul
tidis
cipl
ine
41TW
-MM
-GE
NA
HR
095
- P2
Em
ploy
ee R
elat
ions
153
TW-M
M-G
EN
AH
R10
0 - P
2La
bor R
elat
ions
47TW
-MM
-GE
NA
HR
110
- P2
Div
ersi
ty/E
EO
Gen
eral
ist/M
ultid
isci
plin
e20
TW-M
M-G
EN
AH
R14
0 - P
2R
ecru
itmen
t Gen
eral
ist/M
ultid
isci
plin
e1,
346
20A
on H
ewitt
22
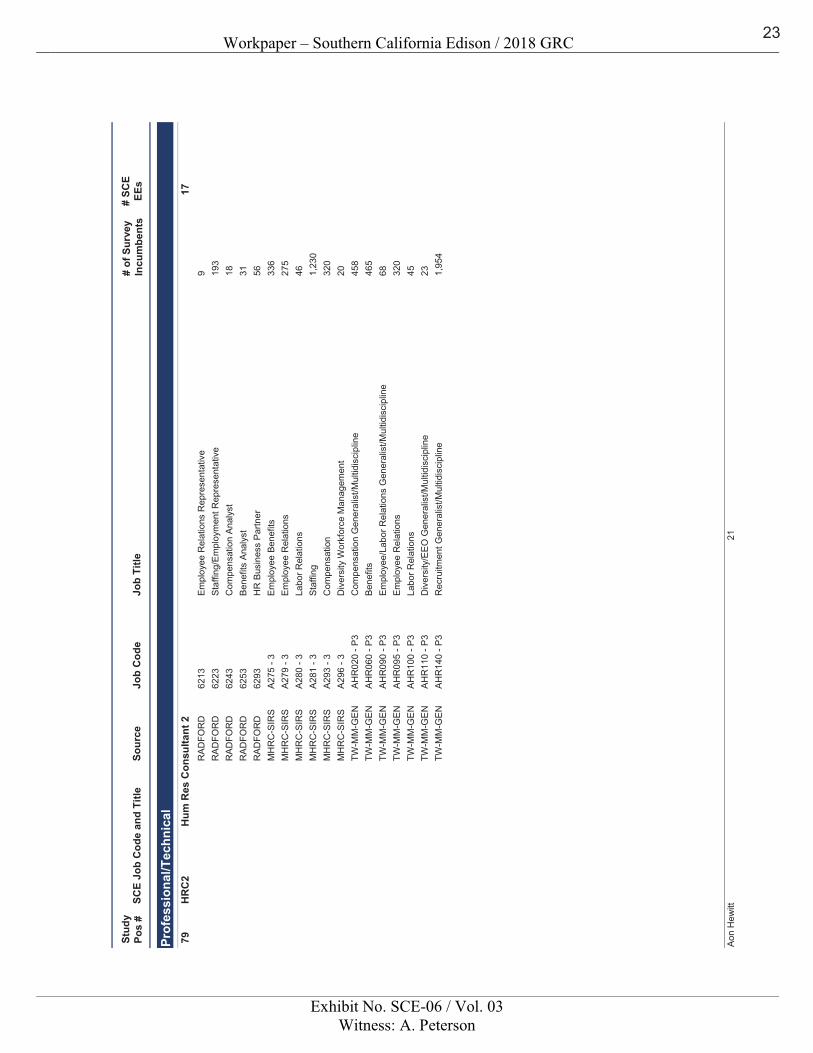
Workpaper – Southern California Edison / 2018 GRC
Exhibit No. SCE-06 / Vol. 03Witness: A. Peterson
Sour
ceJo
b C
ode
Job
Title
SCE
Job
Cod
e an
d Ti
tle#
of S
urve
yIn
cum
bent
s#
SCE
EEs
Stud
y Po
s #
Prof
essi
onal
/Tec
hnic
al Hum
Res
Con
sulta
nt 2
HR
C2
1779
RA
DFO
RD
6213
Em
ploy
ee R
elat
ions
Rep
rese
ntat
ive
9
RA
DFO
RD
6223
Sta
ffing
/Em
ploy
men
t Rep
rese
ntat
ive
19
3R
AD
FOR
D62
43C
ompe
nsat
ion
Anal
yst
18R
AD
FOR
D62
53B
enef
its A
naly
st
31R
AD
FOR
D62
93H
R B
usin
ess
Par
tner
56M
HR
C-S
IRS
A27
5 - 3
Em
ploy
ee B
enef
its33
6M
HR
C-S
IRS
A27
9 - 3
Em
ploy
ee R
elat
ions
275
MH
RC
-SIR
SA
280
- 3La
bor R
elat
ions
46M
HR
C-S
IRS
A28
1 - 3
Sta
ffing
1,23
0M
HR
C-S
IRS
A29
3 - 3
Com
pens
atio
n32
0M
HR
C-S
IRS
A29
6 - 3
Div
ersi
ty W
orkf
orce
Man
agem
ent
20TW
-MM
-GE
NA
HR
020
- P3
Com
pens
atio
n G
ener
alis
t/Mul
tidis
cipl
ine
458
TW-M
M-G
EN
AH
R06
0 - P
3B
enef
its46
5TW
-MM
-GE
NA
HR
090
- P3
Em
ploy
ee/L
abor
Rel
atio
ns G
ener
alis
t/Mul
tidis
cipl
ine
68TW
-MM
-GE
NA
HR
095
- P3
Em
ploy
ee R
elat
ions
320
TW-M
M-G
EN
AH
R10
0 - P
3La
bor R
elat
ions
45TW
-MM
-GE
NA
HR
110
- P3
Div
ersi
ty/E
EO
Gen
eral
ist/M
ultid
isci
plin
e23
TW-M
M-G
EN
AH
R14
0 - P
3R
ecru
itmen
t Gen
eral
ist/M
ultid
isci
plin
e1,
954
21A
on H
ewitt
23
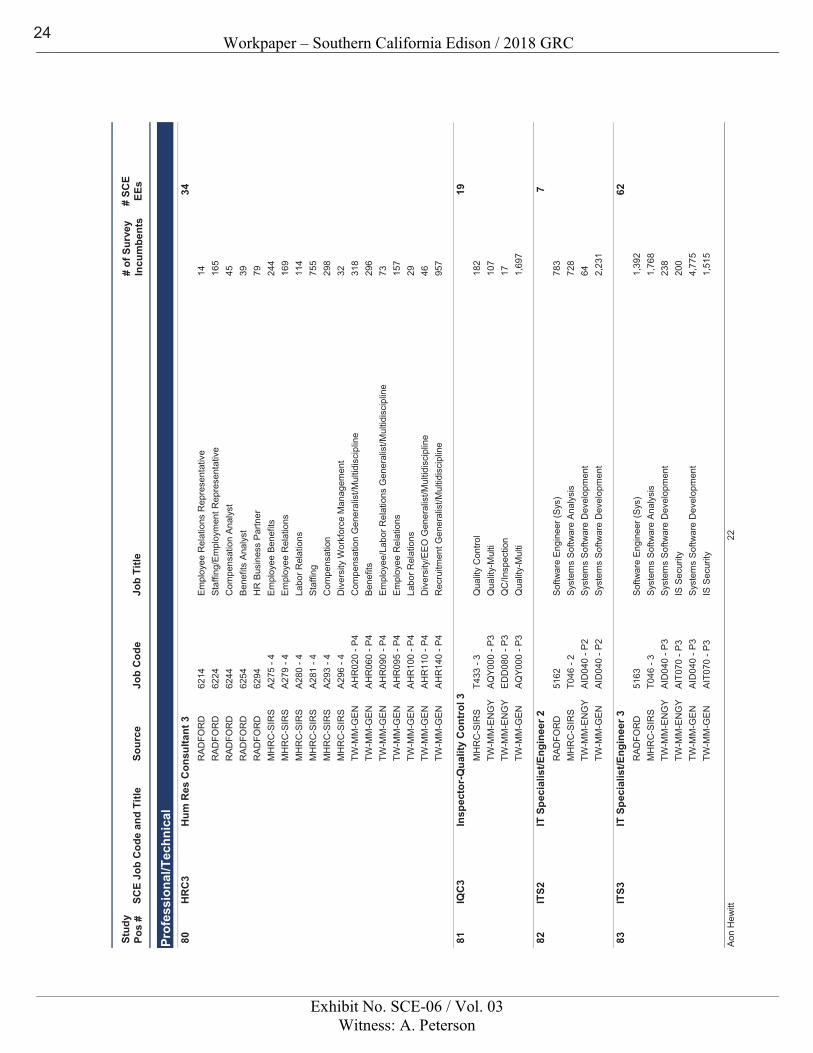
Workpaper – Southern California Edison / 2018 GRC
Exhibit No. SCE-06 / Vol. 03Witness: A. Peterson
Sour
ceJo
b C
ode
Job
Title
SCE
Job
Cod
e an
d Ti
tle#
of S
urve
yIn
cum
bent
s#
SCE
EEs
Stud
y Po
s #
Prof
essi
onal
/Tec
hnic
al Hum
Res
Con
sulta
nt 3
HR
C3
3480
RA
DFO
RD
6214
Em
ploy
ee R
elat
ions
Rep
rese
ntat
ive
14
RA
DFO
RD
6224
Sta
ffing
/Em
ploy
men
t Rep
rese
ntat
ive
16
5R
AD
FOR
D62
44C
ompe
nsat
ion
Anal
yst
45R
AD
FOR
D62
54B
enef
its A
naly
st
39R
AD
FOR
D62
94H
R B
usin
ess
Par
tner
79M
HR
C-S
IRS
A27
5 - 4
Em
ploy
ee B
enef
its24
4M
HR
C-S
IRS
A27
9 - 4
Em
ploy
ee R
elat
ions
169
MH
RC
-SIR
SA
280
- 4La
bor R
elat
ions
114
MH
RC
-SIR
SA
281
- 4S
taffi
ng75
5M
HR
C-S
IRS
A29
3 - 4
Com
pens
atio
n29
8M
HR
C-S
IRS
A29
6 - 4
Div
ersi
ty W
orkf
orce
Man
agem
ent
32TW
-MM
-GE
NA
HR
020
- P4
Com
pens
atio
n G
ener
alis
t/Mul
tidis
cipl
ine
318
TW-M
M-G
EN
AH
R06
0 - P
4B
enef
its29
6TW
-MM
-GE
NA
HR
090
- P4
Em
ploy
ee/L
abor
Rel
atio
ns G
ener
alis
t/Mul
tidis
cipl
ine
73TW
-MM
-GE
NA
HR
095
- P4
Em
ploy
ee R
elat
ions
157
TW-M
M-G
EN
AH
R10
0 - P
4La
bor R
elat
ions
29TW
-MM
-GE
NA
HR
110
- P4
Div
ersi
ty/E
EO
Gen
eral
ist/M
ultid
isci
plin
e46
TW-M
M-G
EN
AH
R14
0 - P
4R
ecru
itmen
t Gen
eral
ist/M
ultid
isci
plin
e95
7
Insp
ecto
r-Q
ualit
y C
ontr
ol 3
IQC
319
81M
HR
C-S
IRS
T433
- 3
Qua
lity
Con
trol
182
TW-M
M-E
NG
YA
QY0
00 -
P3
Qua
lity-
Mul
ti10
7TW
-MM
-EN
GY
ED
D08
0 - P
3Q
C/In
spec
tion
17TW
-MM
-GE
NA
QY0
00 -
P3
Qua
lity-
Mul
ti1,
697
IT S
peci
alis
t/Eng
inee
r 2IT
S27
82R
AD
FOR
D51
62So
ftwar
e En
gine
er (S
ys)
783
MH
RC
-SIR
ST0
46 -
2S
yste
ms
Sof
twar
e An
alys
is72
8TW
-MM
-EN
GY
AID
040
- P2
Sys
tem
s S
oftw
are
Dev
elop
men
t64
TW-M
M-G
EN
AID
040
- P2
Sys
tem
s S
oftw
are
Dev
elop
men
t2,
231
IT S
peci
alis
t/Eng
inee
r 3IT
S362
83R
AD
FOR
D51
63So
ftwar
e En
gine
er (S
ys)
1,39
2M
HR
C-S
IRS
T046
- 3
Sys
tem
s S
oftw
are
Anal
ysis
1,76
8TW
-MM
-EN
GY
AID
040
- P3
Sys
tem
s S
oftw
are
Dev
elop
men
t23
8TW
-MM
-EN
GY
AIT
070
- P3
IS S
ecur
ity20
0TW
-MM
-GE
NA
ID04
0 - P
3S
yste
ms
Sof
twar
e D
evel
opm
ent
4,77
5TW
-MM
-GE
NA
IT07
0 - P
3IS
Sec
urity
1,51
5
22A
on H
ewitt
24
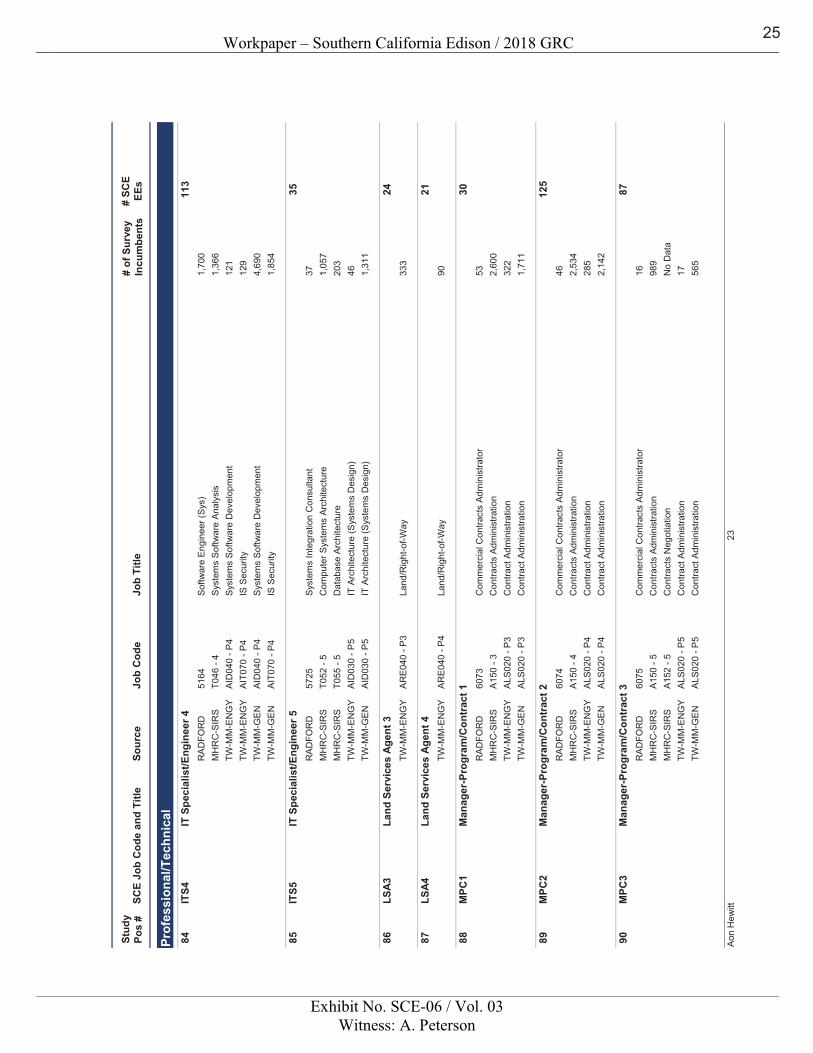
Workpaper – Southern California Edison / 2018 GRC
Exhibit No. SCE-06 / Vol. 03Witness: A. Peterson
Sour
ceJo
b C
ode
Job
Title
SCE
Job
Cod
e an
d Ti
tle#
of S
urve
yIn
cum
bent
s#
SCE
EEs
Stud
y Po
s #
Prof
essi
onal
/Tec
hnic
al IT S
peci
alis
t/Eng
inee
r 4IT
S411
384
RA
DFO
RD
5164
Softw
are
Engi
neer
(Sys
) 1,
700
MH
RC
-SIR
ST0
46 -
4S
yste
ms
Sof
twar
e An
alys
is1,
366
TW-M
M-E
NG
YA
ID04
0 - P
4S
yste
ms
Sof
twar
e D
evel
opm
ent
121
TW-M
M-E
NG
YA
IT07
0 - P
4IS
Sec
urity
129
TW-M
M-G
EN
AID
040
- P4
Sys
tem
s S
oftw
are
Dev
elop
men
t4,
690
TW-M
M-G
EN
AIT
070
- P4
IS S
ecur
ity1,
854
IT S
peci
alis
t/Eng
inee
r 5IT
S535
85R
AD
FOR
D57
25S
yste
ms
Inte
grat
ion
Con
sulta
nt37
MH
RC
-SIR
ST0
52 -
5C
ompu
ter S
yste
ms
Arch
itect
ure
1,05
7M
HR
C-S
IRS
T055
- 5
Dat
abas
e Ar
chite
ctur
e20
3TW
-MM
-EN
GY
AID
030
- P5
IT A
rchi
tect
ure
(Sys
tem
s D
esig
n)46
TW-M
M-G
EN
AID
030
- P5
IT A
rchi
tect
ure
(Sys
tem
s D
esig
n)1,
311
Land
Ser
vice
s Ag
ent 3
LSA3
2486
TW-M
M-E
NG
YA
RE
040
- P3
Land
/Rig
ht-o
f-Way
333
Land
Ser
vice
s Ag
ent 4
LSA4
2187
TW-M
M-E
NG
YA
RE
040
- P4
Land
/Rig
ht-o
f-Way
90
Man
ager
-Pro
gram
/Con
trac
t 1M
PC1
3088
RA
DFO
RD
6073
Com
mer
cial
Con
tract
s A
dmin
istra
tor
53M
HR
C-S
IRS
A150
- 3
Con
tract
s Ad
min
istra
tion
2,60
0TW
-MM
-EN
GY
ALS
020
- P3
Con
tract
Adm
inis
tratio
n32
2TW
-MM
-GE
NA
LS02
0 - P
3C
ontra
ct A
dmin
istra
tion
1,71
1
Man
ager
-Pro
gram
/Con
trac
t 2M
PC2
125
89R
AD
FOR
D60
74C
omm
erci
al C
ontra
cts
Adm
inis
trato
r 46
MH
RC
-SIR
SA1
50 -
4C
ontra
cts
Adm
inis
tratio
n2,
534
TW-M
M-E
NG
YA
LS02
0 - P
4C
ontra
ct A
dmin
istra
tion
285
TW-M
M-G
EN
ALS
020
- P4
Con
tract
Adm
inis
tratio
n2,
142
Man
ager
-Pro
gram
/Con
trac
t 3M
PC3
8790
RA
DFO
RD
6075
Com
mer
cial
Con
tract
s A
dmin
istra
tor
16M
HR
C-S
IRS
A150
- 5
Con
tract
s Ad
min
istra
tion
989
MH
RC
-SIR
SA1
52 -
5C
ontra
cts
Neg
otia
tion
No
Dat
aTW
-MM
-EN
GY
ALS
020
- P5
Con
tract
Adm
inis
tratio
n17
TW-M
M-G
EN
ALS
020
- P5
Con
tract
Adm
inis
tratio
n56
5
23A
on H
ewitt
25
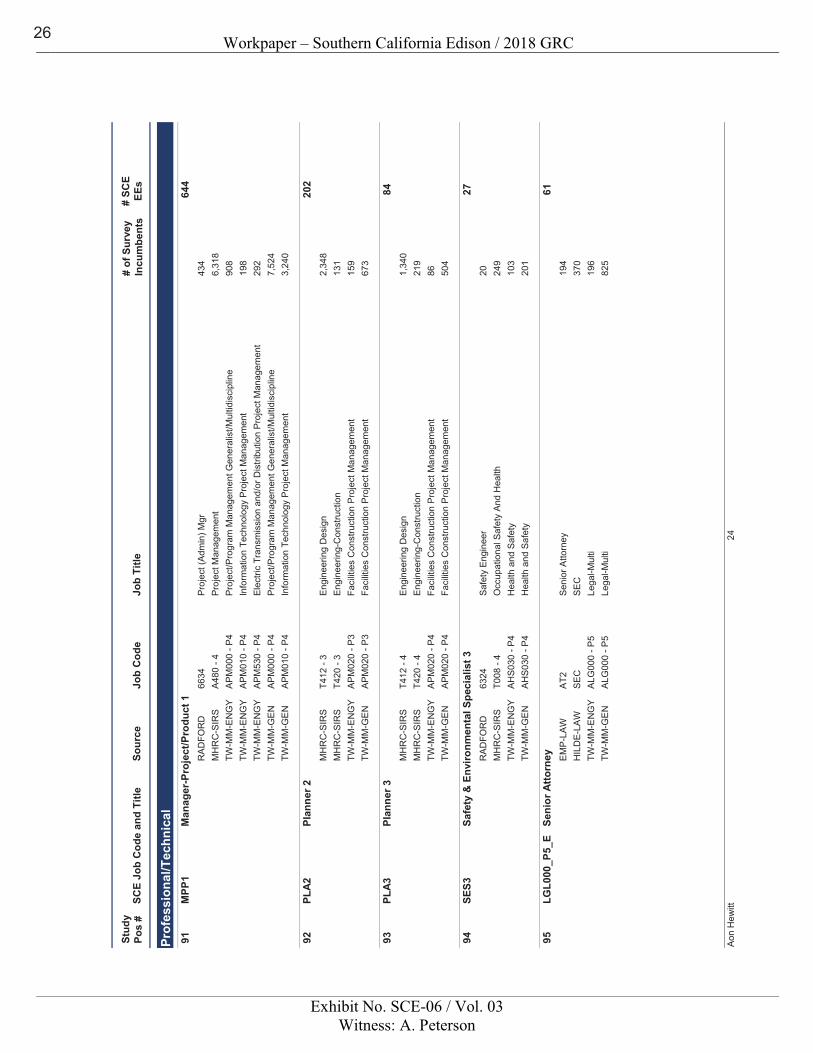
Workpaper – Southern California Edison / 2018 GRC
Exhibit No. SCE-06 / Vol. 03Witness: A. Peterson
Sour
ceJo
b C
ode
Job
Title
SCE
Job
Cod
e an
d Ti
tle#
of S
urve
yIn
cum
bent
s#
SCE
EEs
Stud
y Po
s #
Prof
essi
onal
/Tec
hnic
al Man
ager
-Pro
ject
/Pro
duct
1M
PP1
644
91R
AD
FOR
D66
34Pr
ojec
t (Ad
min
) Mgr
43
4M
HR
C-S
IRS
A48
0 - 4
Pro
ject
Man
agem
ent
6,31
8TW
-MM
-EN
GY
AP
M00
0 - P
4P
roje
ct/P
rogr
am M
anag
emen
t Gen
eral
ist/M
ultid
isci
plin
e90
8TW
-MM
-EN
GY
AP
M01
0 - P
4In
form
atio
n Te
chno
logy
Pro
ject
Man
agem
ent
198
TW-M
M-E
NG
YA
PM
530
- P4
Ele
ctric
Tra
nsm
issi
on a
nd/o
r Dis
tribu
tion
Proj
ect M
anag
emen
t29
2TW
-MM
-GE
NA
PM
000
- P4
Pro
ject
/Pro
gram
Man
agem
ent G
ener
alis
t/Mul
tidis
cipl
ine
7,52
4TW
-MM
-GE
NA
PM
010
- P4
Info
rmat
ion
Tech
nolo
gy P
roje
ct M
anag
emen
t3,
240
Plan
ner 2
PLA2
202
92M
HR
C-S
IRS
T412
- 3
Eng
inee
ring
Des
ign
2,34
8M
HR
C-S
IRS
T420
- 3
Eng
inee
ring-
Con
stru
ctio
n13
1TW
-MM
-EN
GY
AP
M02
0 - P
3Fa
cilit
ies
Con
stru
ctio
n P
roje
ct M
anag
emen
t15
9TW
-MM
-GE
NA
PM
020
- P3
Faci
litie
s C
onst
ruct
ion
Pro
ject
Man
agem
ent
673
Plan
ner 3
PLA3
8493
MH
RC
-SIR
ST4
12 -
4E
ngin
eerin
g D
esig
n1,
340
MH
RC
-SIR
ST4
20 -
4E
ngin
eerin
g-C
onst
ruct
ion
219
TW-M
M-E
NG
YA
PM
020
- P4
Faci
litie
s C
onst
ruct
ion
Pro
ject
Man
agem
ent
86TW
-MM
-GE
NA
PM
020
- P4
Faci
litie
s C
onst
ruct
ion
Pro
ject
Man
agem
ent
504
Safe
ty &
Env
ironm
enta
l Spe
cial
ist 3
SES3
2794
RA
DFO
RD
6324
Saf
ety
Engi
neer
20
MH
RC
-SIR
ST0
08 -
4O
ccup
atio
nal S
afet
y An
d H
ealth
249
TW-M
M-E
NG
YA
HS
030
- P4
Hea
lth a
nd S
afet
y10
3TW
-MM
-GE
NA
HS
030
- P4
Hea
lth a
nd S
afet
y20
1
Seni
or A
ttorn
eyLG
L000
_P5_
E61
95E
MP
-LA
WA
T2S
enio
r Atto
rney
194
HIL
DE-
LAW
SE
CS
EC
370
TW-M
M-E
NG
YA
LG00
0 - P
5Le
gal-M
ulti
196
TW-M
M-G
EN
ALG
000
- P5
Lega
l-Mul
ti82
5
24A
on H
ewitt
26
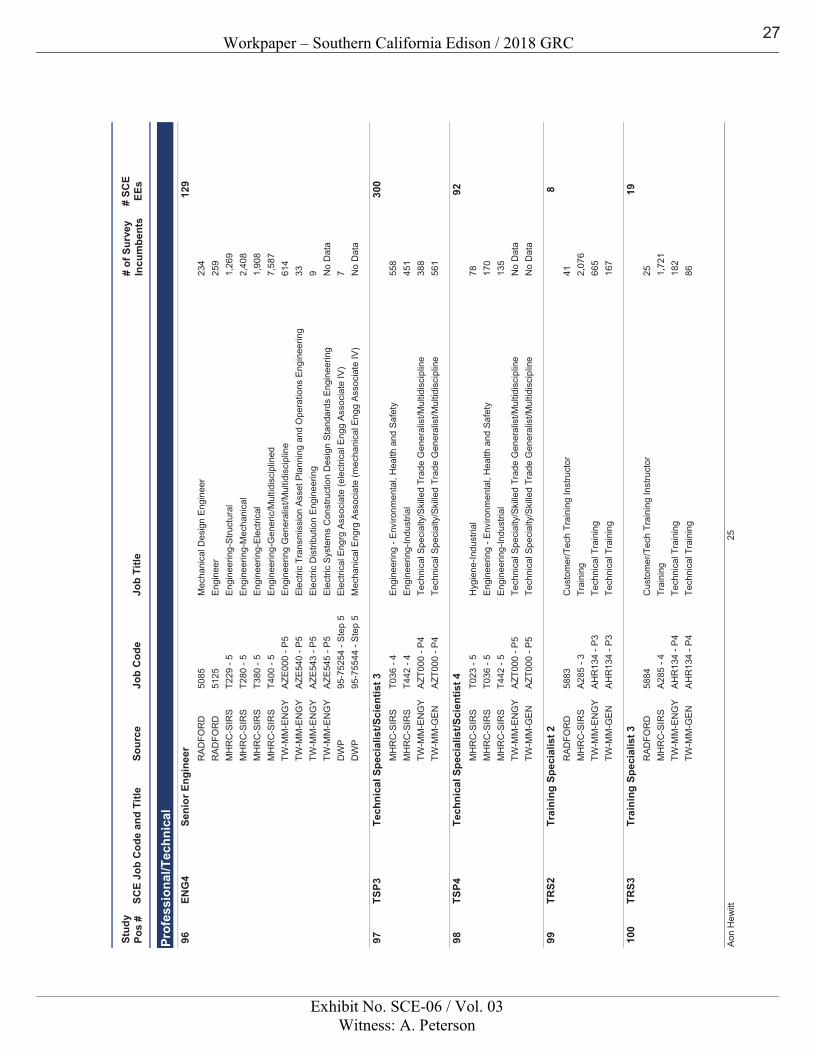
Workpaper – Southern California Edison / 2018 GRC
Exhibit No. SCE-06 / Vol. 03Witness: A. Peterson
Sour
ceJo
b C
ode
Job
Title
SCE
Job
Cod
e an
d Ti
tle#
of S
urve
yIn
cum
bent
s#
SCE
EEs
Stud
y Po
s #
Prof
essi
onal
/Tec
hnic
al Seni
or E
ngin
eer
ENG
412
996
RA
DFO
RD
5085
Mec
hani
cal D
esig
n E
ngin
eer
234
RA
DFO
RD
5125
Engi
neer
25
9M
HR
C-S
IRS
T229
- 5
Eng
inee
ring-
Stru
ctur
al1,
269
MH
RC
-SIR
ST2
80 -
5E
ngin
eerin
g-M
echa
nica
l2,
408
MH
RC
-SIR
ST3
80 -
5E
ngin
eerin
g-E
lect
rical
1,90
8M
HR
C-S
IRS
T400
- 5
Eng
inee
ring-
Gen
eric
/Mul
tidis
cipl
ined
7,58
7TW
-MM
-EN
GY
AZE
000
- P5
Eng
inee
ring
Gen
eral
ist/M
ultid
isci
plin
e61
4TW
-MM
-EN
GY
AZE
540
- P5
Ele
ctric
Tra
nsm
issi
on A
sset
Pla
nnin
g an
d O
pera
tions
Eng
inee
ring
33TW
-MM
-EN
GY
AZE
543
- P5
Ele
ctric
Dis
tribu
tion
Eng
inee
ring
9TW
-MM
-EN
GY
AZE
545
- P5
Ele
ctric
Sys
tem
s C
onst
ruct
ion
Des
ign
Sta
ndar
ds E
ngin
eerin
gN
o D
ata
DW
P95
-752
54 -
Ste
p 5
Ele
ctric
al E
ngrg
Ass
ocia
te (e
lect
rical
Eng
g As
soci
ate
IV)
7D
WP
95-7
5544
- S
tep
5M
echa
nica
l Eng
rg A
ssoc
iate
(mec
hani
cal E
ngg
Ass
ocia
te IV
)N
o D
ata
Tech
nica
l Spe
cial
ist/S
cien
tist 3
TSP3
300
97M
HR
C-S
IRS
T036
- 4
Eng
inee
ring
- Env
ironm
enta
l, H
ealth
and
Saf
ety
558
MH
RC
-SIR
ST4
42 -
4E
ngin
eerin
g-In
dust
rial
451
TW-M
M-E
NG
YA
ZT00
0 - P
4Te
chni
cal S
peci
alty
/Ski
lled
Trad
e G
ener
alis
t/Mul
tidis
cipl
ine
388
TW-M
M-G
EN
AZT
000
- P4
Tech
nica
l Spe
cial
ty/S
kille
d Tr
ade
Gen
eral
ist/M
ultid
isci
plin
e56
1
Tech
nica
l Spe
cial
ist/S
cien
tist 4
TSP4
9298
MH
RC
-SIR
ST0
23 -
5H
ygie
ne-In
dust
rial
78M
HR
C-S
IRS
T036
- 5
Eng
inee
ring
- Env
ironm
enta
l, H
ealth
and
Saf
ety
170
MH
RC
-SIR
ST4
42 -
5E
ngin
eerin
g-In
dust
rial
135
TW-M
M-E
NG
YA
ZT00
0 - P
5Te
chni
cal S
peci
alty
/Ski
lled
Trad
e G
ener
alis
t/Mul
tidis
cipl
ine
No
Dat
aTW
-MM
-GE
NA
ZT00
0 - P
5Te
chni
cal S
peci
alty
/Ski
lled
Trad
e G
ener
alis
t/Mul
tidis
cipl
ine
No
Dat
a
Trai
ning
Spe
cial
ist 2
TRS2
899
RA
DFO
RD
5883
Cus
tom
er/T
ech
Trai
ning
Inst
ruct
or
41M
HR
C-S
IRS
A28
5 - 3
Trai
ning
2,07
6TW
-MM
-EN
GY
AH
R13
4 - P
3Te
chni
cal T
rain
ing
665
TW-M
M-G
EN
AH
R13
4 - P
3Te
chni
cal T
rain
ing
167
Trai
ning
Spe
cial
ist 3
TRS3
1910
0R
AD
FOR
D58
84C
usto
mer
/Tec
h Tr
aini
ng In
stru
ctor
25
MH
RC
-SIR
SA
285
- 4Tr
aini
ng1,
721
TW-M
M-E
NG
YA
HR
134
- P4
Tech
nica
l Tra
inin
g18
2TW
-MM
-GE
NA
HR
134
- P4
Tech
nica
l Tra
inin
g86
25A
on H
ewitt
27
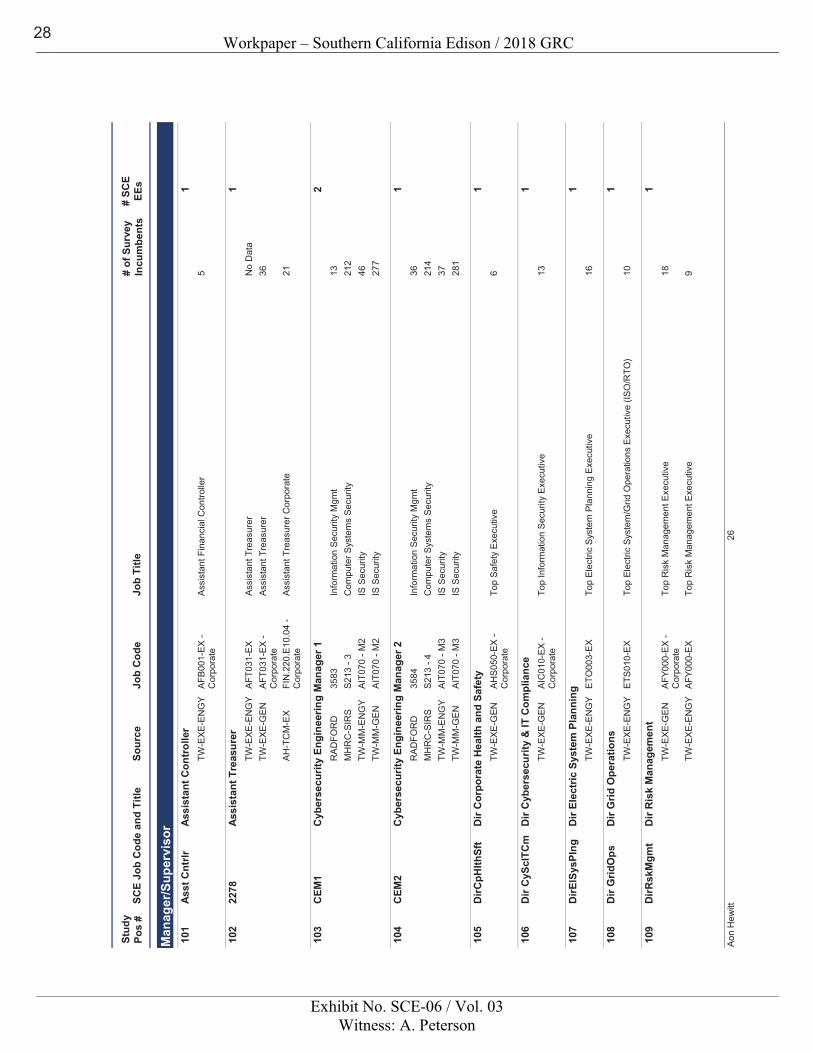
Workpaper – Southern California Edison / 2018 GRC
Exhibit No. SCE-06 / Vol. 03Witness: A. Peterson
Sour
ceJo
b C
ode
Job
Title
SCE
Job
Cod
e an
d Ti
tle#
of S
urve
yIn
cum
bent
s#
SCE
EEs
Stud
y Po
s #
Man
ager
/Sup
ervi
sor As
sist
ant C
ontr
olle
rAs
st C
ntrlr
110
1TW
-EXE
-EN
GY
AFB0
01-E
X -
Cor
pora
teA
ssis
tant
Fin
anci
al C
ontro
ller
5
Assi
stan
t Tre
asur
er22
781
102
TW-E
XE
-EN
GY
AFT
031-
EX
Ass
ista
nt T
reas
urer
No
Dat
aTW
-EX
E-G
EN
AFT
031-
EX
- C
orpo
rate
Ass
ista
nt T
reas
urer
36
AH-T
CM
-EX
FIN
.220
.E10
.04
- C
orpo
rate
Ass
ista
nt T
reas
urer
Cor
pora
te21
Cyb
erse
curit
y En
gine
erin
g M
anag
er 1
CEM
12
103
RA
DFO
RD
3583
Info
rmat
ion
Secu
rity
Mgm
t 13
MH
RC
-SIR
SS
213
- 3C
ompu
ter S
yste
ms
Secu
rity
212
TW-M
M-E
NG
YA
IT07
0 - M
2IS
Sec
urity
46
TW-M
M-G
EN
AIT
070
- M2
IS S
ecur
ity
277
Cyb
erse
curit
y En
gine
erin
g M
anag
er 2
CEM
21
104
RA
DFO
RD
3584
Info
rmat
ion
Secu
rity
Mgm
t 36
MH
RC
-SIR
SS
213
- 4C
ompu
ter S
yste
ms
Secu
rity
214
TW-M
M-E
NG
YA
IT07
0 - M
3IS
Sec
urity
37
TW-M
M-G
EN
AIT
070
- M3
IS S
ecur
ity
281
Dir
Cor
pora
te H
ealth
and
Saf
ety
DirC
pHlth
Sft
110
5TW
-EX
E-G
EN
AH
S05
0-E
X -
Cor
pora
teTo
p S
afet
y E
xecu
tive
6
Dir
Cyb
erse
curit
y &
IT C
ompl
ianc
eD
ir C
yScI
TCm
110
6TW
-EX
E-G
EN
AIC
010-
EX -
Cor
pora
teTo
p In
form
atio
n S
ecur
ity E
xecu
tive
13
Dir
Elec
tric
Sys
tem
Pla
nnin
gD
irElS
ysPl
ng1
107
TW-E
XE
-EN
GY
ETO
003-
EX
Top
Ele
ctric
Sys
tem
Pla
nnin
g E
xecu
tive
16
Dir
Grid
Ope
ratio
nsD
ir G
ridO
ps1
108
TW-E
XE
-EN
GY
ETS
010-
EX
Top
Ele
ctric
Sys
tem
/Grid
Ope
ratio
ns E
xecu
tive
(ISO
/RTO
)10
Dir
Ris
k M
anag
emen
tD
irRsk
Mgm
t1
109
TW-E
XE-G
ENAF
Y000
-EX
- C
orpo
rate
Top
Ris
k M
anag
emen
t Exe
cutiv
e18
TW-E
XE-E
NG
YAF
Y000
-EX
Top
Ris
k M
anag
emen
t Exe
cutiv
e9
26A
on H
ewitt
28
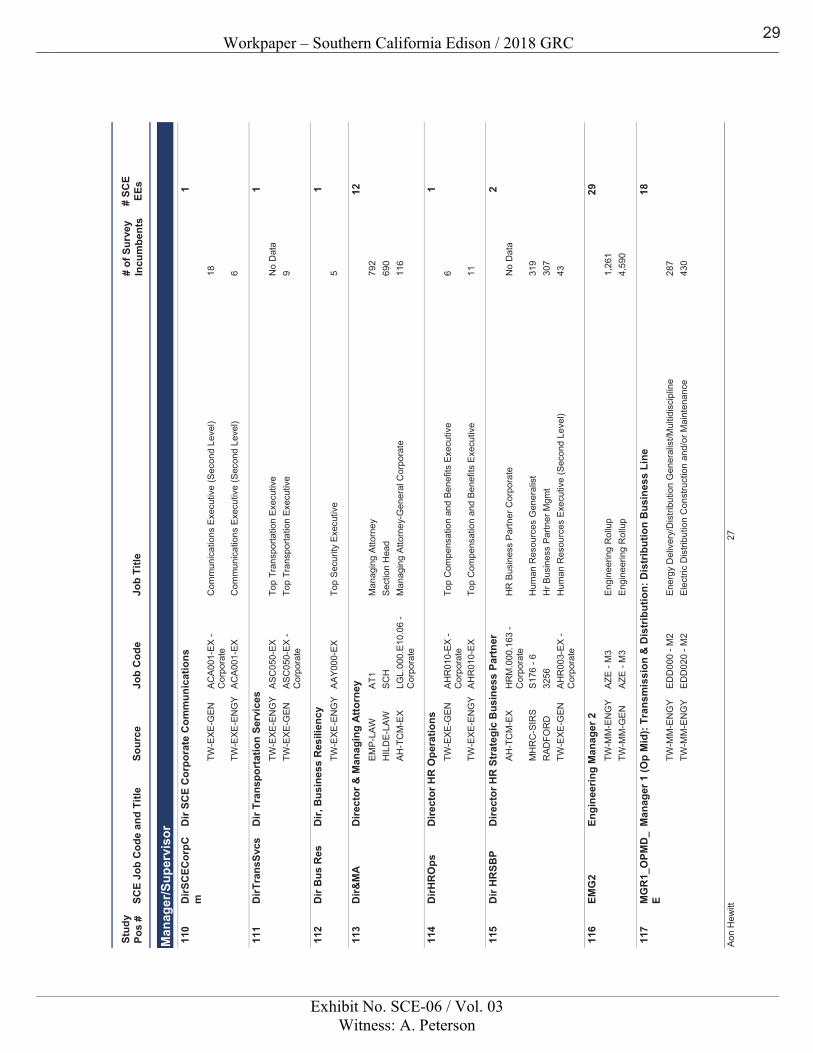
Workpaper – Southern California Edison / 2018 GRC
Exhibit No. SCE-06 / Vol. 03Witness: A. Peterson
Sour
ceJo
b C
ode
Job
Title
SCE
Job
Cod
e an
d Ti
tle#
of S
urve
yIn
cum
bent
s#
SCE
EEs
Stud
y Po
s #
Man
ager
/Sup
ervi
sor D
ir SC
E C
orpo
rate
Com
mun
icat
ions
DirS
CEC
orpC
m1
110
TW-E
XE
-GE
NA
CA
001-
EX
- C
orpo
rate
Com
mun
icat
ions
Exe
cutiv
e (S
econ
d Le
vel)
18
TW-E
XE
-EN
GY
AC
A00
1-E
XC
omm
unic
atio
ns E
xecu
tive
(Sec
ond
Leve
l)6
Dir
Tran
spor
tatio
n Se
rvic
esD
irTra
nsSv
cs1
111
TW-E
XE
-EN
GY
AS
C05
0-E
XTo
p Tr
ansp
orta
tion
Exe
cutiv
eN
o D
ata
TW-E
XE
-GE
NA
SC
050-
EX
- C
orpo
rate
Top
Tran
spor
tatio
n E
xecu
tive
9
Dir,
Bus
ines
s R
esili
ency
Dir
Bus
Res
111
2TW
-EX
E-E
NG
YA
AY0
00-E
XTo
p S
ecur
ity E
xecu
tive
5
Dire
ctor
& M
anag
ing
Atto
rney
Dir&
MA
1211
3E
MP
-LA
WA
T1M
anag
ing
Atto
rney
792
HIL
DE-
LAW
SC
HS
ectio
n H
ead
690
AH-T
CM
-EX
LGL.
000.
E10.
06 -
Cor
pora
teM
anag
ing
Atto
rney
-Gen
eral
Cor
pora
te11
6
Dire
ctor
HR
Ope
ratio
nsD
irHR
Ops
111
4TW
-EX
E-G
EN
AH
R01
0-E
X -
Cor
pora
teTo
p C
ompe
nsat
ion
and
Bene
fits
Exec
utiv
e6
TW-E
XE-E
NG
YAH
R01
0-EX
Top
Com
pens
atio
n an
d Be
nefit
s Ex
ecut
ive
11
Dire
ctor
HR
Str
ateg
ic B
usin
ess
Part
ner
Dir
HR
SBP
211
5AH
-TC
M-E
XH
RM
.000
.163
- C
orpo
rate
HR
Bus
ines
s P
artn
er C
orpo
rate
No
Dat
a
MH
RC
-SIR
SS
176
- 6H
uman
Res
ourc
es G
ener
alis
t31
9R
AD
FOR
D32
56H
r Bus
ines
s P
artn
er M
gmt
307
TW-E
XE
-GE
NA
HR
003-
EX
- C
orpo
rate
Hum
an R
esou
rces
Exe
cutiv
e (S
econ
d Le
vel)
43
Engi
neer
ing
Man
ager
2EM
G2
2911
6TW
-MM
-EN
GY
AZE
- M
3E
ngin
eerin
g R
ollu
p1,
261
TW-M
M-G
EN
AZE
- M
3E
ngin
eerin
g R
ollu
p4,
590
Man
ager
1 (O
p M
id):
Tran
smis
sion
& D
istr
ibut
ion:
Dis
trib
utio
n B
usin
ess
Line
MG
R1_
OPM
D_
E18
117
TW-M
M-E
NG
YE
DD
000
- M2
Ene
rgy
Del
iver
y/D
istri
butio
n G
ener
alis
t/Mul
tidis
cipl
ine
287
TW-M
M-E
NG
YE
DD
020
- M2
Ele
ctric
Dis
tribu
tion
Con
stru
ctio
n an
d/or
Mai
nten
ance
430
27A
on H
ewitt
29
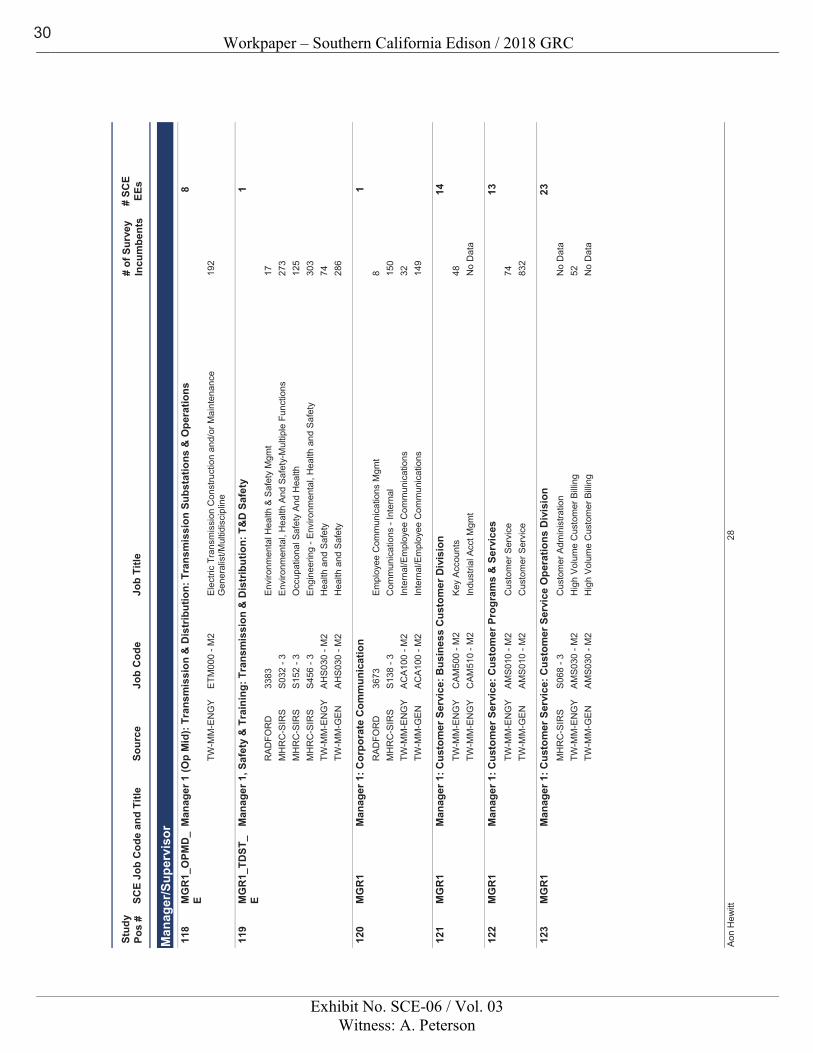
Workpaper – Southern California Edison / 2018 GRC
Exhibit No. SCE-06 / Vol. 03Witness: A. Peterson
Sour
ceJo
b C
ode
Job
Title
SCE
Job
Cod
e an
d Ti
tle#
of S
urve
yIn
cum
bent
s#
SCE
EEs
Stud
y Po
s #
Man
ager
/Sup
ervi
sor M
anag
er 1
(Op
Mid
): Tr
ansm
issi
on &
Dis
trib
utio
n: T
rans
mis
sion
Sub
stat
ions
& O
pera
tions
MG
R1_
OPM
D_
E8
118
TW-M
M-E
NG
YE
TM00
0 - M
2E
lect
ric T
rans
mis
sion
Con
stru
ctio
n an
d/or
Mai
nten
ance
G
ener
alis
t/Mul
tidis
cipl
ine
192
Man
ager
1, S
afet
y &
Tra
inin
g: T
rans
mis
sion
& D
istr
ibut
ion:
T&
D S
afet
yM
GR
1_TD
ST_
E1
119
RA
DFO
RD
3383
Env
ironm
enta
l Hea
lth &
Saf
ety
Mgm
t 17
MH
RC
-SIR
SS
032
- 3E
nviro
nmen
tal,
Hea
lth A
nd S
afet
y-M
ultip
le F
unct
ions
273
MH
RC
-SIR
SS
152
- 3O
ccup
atio
nal S
afet
y An
d H
ealth
125
MH
RC
-SIR
SS
456
- 3E
ngin
eerin
g - E
nviro
nmen
tal,
Hea
lth a
nd S
afet
y30
3TW
-MM
-EN
GY
AH
S03
0 - M
2H
ealth
and
Saf
ety
74TW
-MM
-GE
NA
HS
030
- M2
Hea
lth a
nd S
afet
y28
6
Man
ager
1: C
orpo
rate
Com
mun
icat
ion
MG
R1
112
0R
AD
FOR
D36
73E
mpl
oyee
Com
mun
icat
ions
Mgm
t 8
MH
RC
-SIR
SS
138
- 3C
omm
unic
atio
ns -
Inte
rnal
150
TW-M
M-E
NG
YA
CA
100
- M2
Inte
rnal
/Em
ploy
ee C
omm
unic
atio
ns32
TW-M
M-G
EN
AC
A10
0 - M
2In
tern
al/E
mpl
oyee
Com
mun
icat
ions
149
Man
ager
1: C
usto
mer
Ser
vice
: Bus
ines
s C
usto
mer
Div
isio
nM
GR
114
121
TW-M
M-E
NG
YC
AM
500
- M2
Key
Acc
ount
s 48
TW-M
M-E
NG
YC
AM
510
- M2
Indu
stria
l Acc
t Mgm
t N
o D
ata
Man
ager
1: C
usto
mer
Ser
vice
: Cus
tom
er P
rogr
ams
& S
ervi
ces
MG
R1
1312
2TW
-MM
-EN
GY
AM
S01
0 - M
2C
usto
mer
Ser
vice
74TW
-MM
-GE
NA
MS
010
- M2
Cus
tom
er S
ervi
ce83
2
Man
ager
1: C
usto
mer
Ser
vice
: Cus
tom
er S
ervi
ce O
pera
tions
Div
isio
nM
GR
123
123
MH
RC
-SIR
SS
068
- 3C
usto
mer
Adm
inis
tratio
nN
o D
ata
TW-M
M-E
NG
YA
MS
030
- M2
Hig
h V
olum
e C
usto
mer
Billi
ng52
TW-M
M-G
EN
AM
S03
0 - M
2H
igh
Vol
ume
Cus
tom
er B
illing
No
Dat
a
28A
on H
ewitt
30
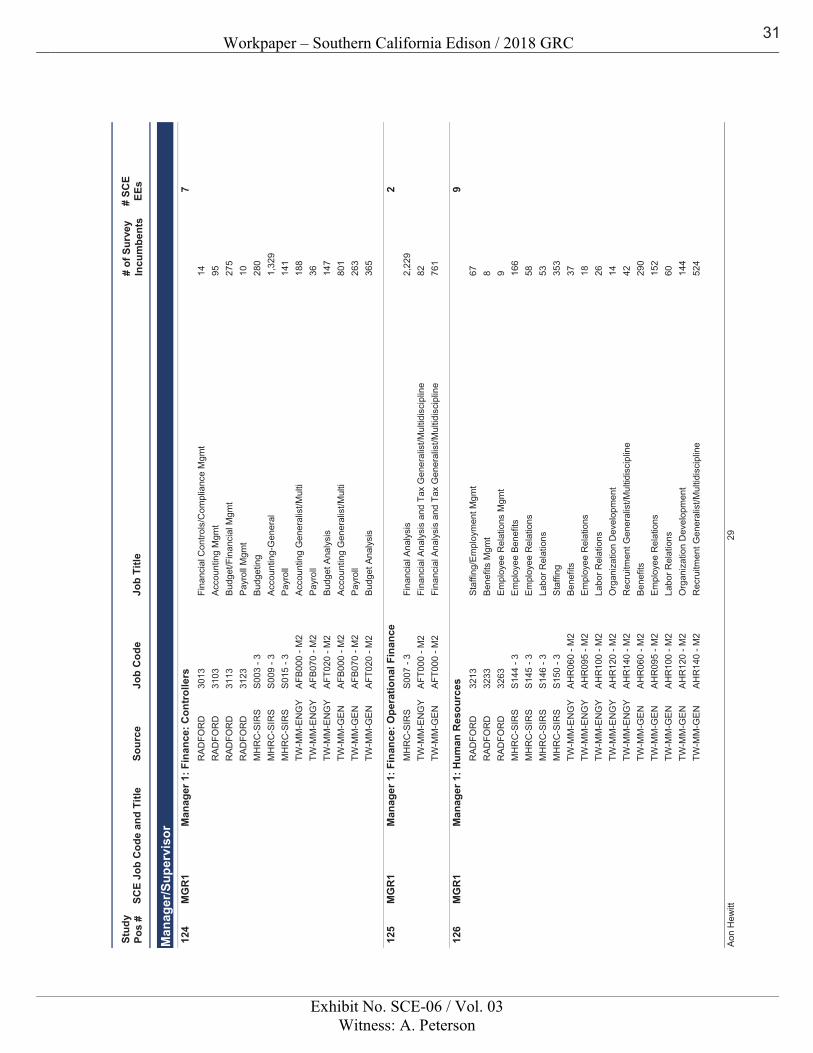
Workpaper – Southern California Edison / 2018 GRC
Exhibit No. SCE-06 / Vol. 03Witness: A. Peterson
Sour
ceJo
b C
ode
Job
Title
SCE
Job
Cod
e an
d Ti
tle#
of S
urve
yIn
cum
bent
s#
SCE
EEs
Stud
y Po
s #
Man
ager
/Sup
ervi
sor M
anag
er 1
: Fin
ance
: Con
trol
lers
MG
R1
712
4R
AD
FOR
D30
13Fi
nanc
ial C
ontro
ls/C
ompl
ianc
e M
gmt
14R
AD
FOR
D31
03A
ccou
ntin
g M
gmt
95R
AD
FOR
D31
13B
udge
t/Fin
anci
al M
gmt
275
RA
DFO
RD
3123
Payr
oll M
gmt
10M
HR
C-S
IRS
S00
3 - 3
Bud
getin
g28
0M
HR
C-S
IRS
S00
9 - 3
Acc
ount
ing-
Gen
eral
1,32
9M
HR
C-S
IRS
S01
5 - 3
Pay
roll
141
TW-M
M-E
NG
YA
FB00
0 - M
2A
ccou
ntin
g G
ener
alis
t/Mul
ti18
8TW
-MM
-EN
GY
AFB
070
- M2
Pay
roll
36TW
-MM
-EN
GY
AFT
020
- M2
Bud
get A
naly
sis
147
TW-M
M-G
EN
AFB
000
- M2
Acc
ount
ing
Gen
eral
ist/M
ulti
801
TW-M
M-G
EN
AFB
070
- M2
Pay
roll
263
TW-M
M-G
EN
AFT
020
- M2
Bud
get A
naly
sis
365
Man
ager
1: F
inan
ce: O
pera
tiona
l Fin
ance
MG
R1
212
5M
HR
C-S
IRS
S00
7 - 3
Fina
ncia
l Ana
lysi
s2,
229
TW-M
M-E
NG
YA
FT00
0 - M
2Fi
nanc
ial A
naly
sis
and
Tax
Gen
eral
ist/M
ultid
isci
plin
e82
TW-M
M-G
EN
AFT
000
- M2
Fina
ncia
l Ana
lysi
s an
d Ta
x G
ener
alis
t/Mul
tidis
cipl
ine
761
Man
ager
1: H
uman
Res
ourc
esM
GR
19
126
RA
DFO
RD
3213
Sta
ffing
/Em
ploy
men
t Mgm
t 67
RA
DFO
RD
3233
Bene
fits
Mgm
t 8
RA
DFO
RD
3263
Em
ploy
ee R
elat
ions
Mgm
t 9
MH
RC
-SIR
SS
144
- 3E
mpl
oyee
Ben
efits
166
MH
RC
-SIR
SS
145
- 3E
mpl
oyee
Rel
atio
ns58
MH
RC
-SIR
SS
146
- 3La
bor R
elat
ions
53M
HR
C-S
IRS
S15
0 - 3
Sta
ffing
353
TW-M
M-E
NG
YA
HR
060
- M2
Ben
efits
37TW
-MM
-EN
GY
AH
R09
5 - M
2E
mpl
oyee
Rel
atio
ns18
TW-M
M-E
NG
YA
HR
100
- M2
Labo
r Rel
atio
ns26
TW-M
M-E
NG
YA
HR
120
- M2
Org
aniz
atio
n D
evel
opm
ent
14TW
-MM
-EN
GY
AH
R14
0 - M
2R
ecru
itmen
t Gen
eral
ist/M
ultid
isci
plin
e42
TW-M
M-G
EN
AH
R06
0 - M
2B
enef
its29
0TW
-MM
-GE
NA
HR
095
- M2
Em
ploy
ee R
elat
ions
152
TW-M
M-G
EN
AH
R10
0 - M
2La
bor R
elat
ions
60TW
-MM
-GE
NA
HR
120
- M2
Org
aniz
atio
n D
evel
opm
ent
144
TW-M
M-G
EN
AH
R14
0 - M
2R
ecru
itmen
t Gen
eral
ist/M
ultid
isci
plin
e52
4
29A
on H
ewitt
31
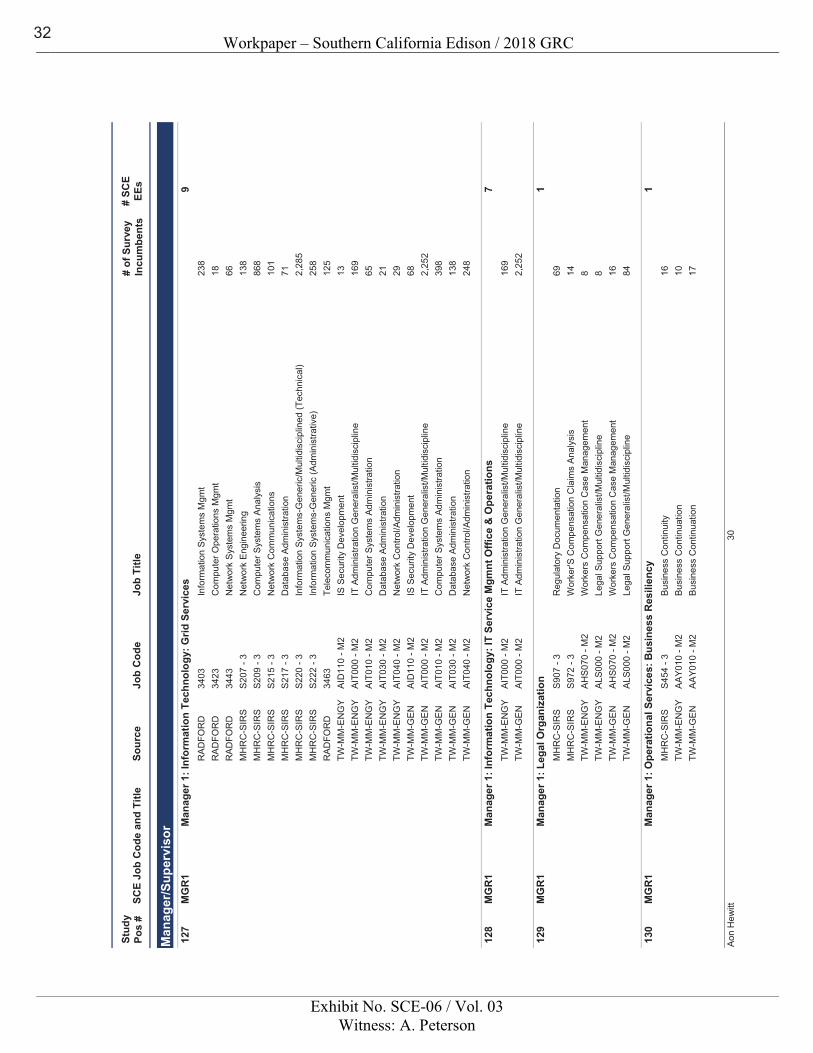
Workpaper – Southern California Edison / 2018 GRC
Exhibit No. SCE-06 / Vol. 03Witness: A. Peterson
Sour
ceJo
b C
ode
Job
Title
SCE
Job
Cod
e an
d Ti
tle#
of S
urve
yIn
cum
bent
s#
SCE
EEs
Stud
y Po
s #
Man
ager
/Sup
ervi
sor M
anag
er 1
: Inf
orm
atio
n Te
chno
logy
: Grid
Ser
vice
sM
GR
19
127
RA
DFO
RD
3403
Info
rmat
ion
Syst
ems
Mgm
t 23
8R
AD
FOR
D34
23C
ompu
ter O
pera
tions
Mgm
t 18
RA
DFO
RD
3443
Net
wor
k Sy
stem
s M
gmt
66M
HR
C-S
IRS
S20
7 - 3
Net
wor
k E
ngin
eerin
g13
8M
HR
C-S
IRS
S20
9 - 3
Com
pute
r Sys
tem
s An
alys
is86
8M
HR
C-S
IRS
S21
5 - 3
Net
wor
k C
omm
unic
atio
ns10
1M
HR
C-S
IRS
S217
- 3
Dat
abas
e Ad
min
istra
tion
71M
HR
C-S
IRS
S22
0 - 3
Info
rmat
ion
Syst
ems-
Gen
eric
/Mul
tidis
cipl
ined
(Tec
hnic
al)
2,28
5M
HR
C-S
IRS
S22
2 - 3
Info
rmat
ion
Syst
ems-
Gen
eric
(Adm
inis
trativ
e)25
8R
AD
FOR
D34
63Te
leco
mm
unic
atio
ns M
gmt
125
TW-M
M-E
NG
YA
ID11
0 - M
2IS
Sec
urity
Dev
elop
men
t13
TW-M
M-E
NG
YA
IT00
0 - M
2IT
Adm
inis
tratio
n G
ener
alis
t/Mul
tidis
cipl
ine
169
TW-M
M-E
NG
YA
IT01
0 - M
2C
ompu
ter S
yste
ms
Adm
inis
tratio
n65
TW-M
M-E
NG
YA
IT03
0 - M
2D
atab
ase
Adm
inis
tratio
n21
TW-M
M-E
NG
YA
IT04
0 - M
2N
etw
ork
Con
trol/A
dmin
istra
tion
29TW
-MM
-GE
NA
ID11
0 - M
2IS
Sec
urity
Dev
elop
men
t68
TW-M
M-G
EN
AIT
000
- M2
IT A
dmin
istra
tion
Gen
eral
ist/M
ultid
isci
plin
e2,
252
TW-M
M-G
EN
AIT
010
- M2
Com
pute
r Sys
tem
s Ad
min
istra
tion
398
TW-M
M-G
ENAI
T030
- M
2D
atab
ase
Adm
inis
tratio
n13
8TW
-MM
-GEN
AIT0
40 -
M2
Net
wor
k C
ontro
l/Adm
inis
tratio
n24
8
Man
ager
1: I
nfor
mat
ion
Tech
nolo
gy: I
T Se
rvic
e M
gmnt
Offi
ce &
Ope
ratio
nsM
GR
17
128
TW-M
M-E
NG
YA
IT00
0 - M
2IT
Adm
inis
tratio
n G
ener
alis
t/Mul
tidis
cipl
ine
169
TW-M
M-G
EN
AIT
000
- M2
IT A
dmin
istra
tion
Gen
eral
ist/M
ultid
isci
plin
e2,
252
Man
ager
1: L
egal
Org
aniz
atio
nM
GR
11
129
MH
RC
-SIR
SS
907
- 3R
egul
ator
y D
ocum
enta
tion
69M
HR
C-S
IRS
S97
2 - 3
Wor
ker'S
Com
pens
atio
n C
laim
s A
naly
sis
14TW
-MM
-EN
GY
AH
S07
0 - M
2W
orke
rs C
ompe
nsat
ion
Cas
e M
anag
emen
t8
TW-M
M-E
NG
YA
LS00
0 - M
2Le
gal S
uppo
rt G
ener
alis
t/Mul
tidis
cipl
ine
8TW
-MM
-GE
NA
HS
070
- M2
Wor
kers
Com
pens
atio
n C
ase
Man
agem
ent
16TW
-MM
-GE
NA
LS00
0 - M
2Le
gal S
uppo
rt G
ener
alis
t/Mul
tidis
cipl
ine
84
Man
ager
1: O
pera
tiona
l Ser
vice
s: B
usin
ess
Res
ilien
cyM
GR
11
130
MH
RC
-SIR
SS
454
- 3B
usin
ess
Con
tinui
ty16
TW-M
M-E
NG
YA
AY0
10 -
M2
Bus
ines
s C
ontin
uatio
n10
TW-M
M-G
EN
AA
Y010
- M
2B
usin
ess
Con
tinua
tion
17
30A
on H
ewitt
32
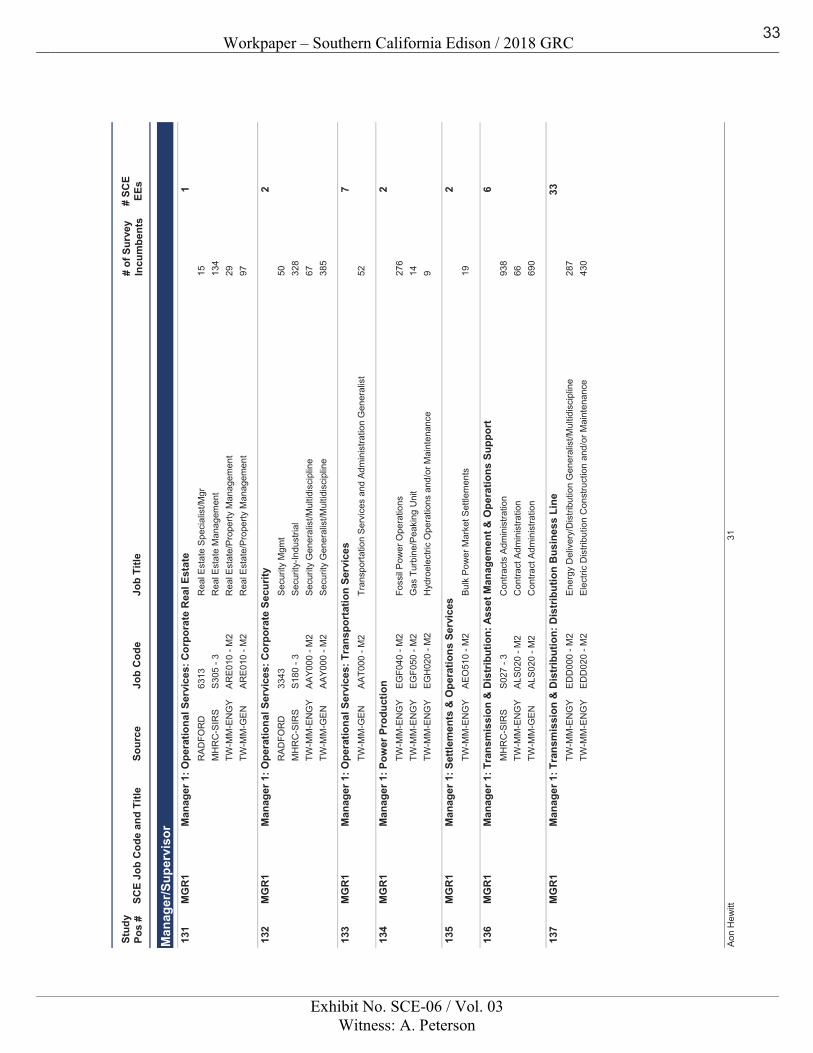
Workpaper – Southern California Edison / 2018 GRC
Exhibit No. SCE-06 / Vol. 03Witness: A. Peterson
Sour
ceJo
b C
ode
Job
Title
SCE
Job
Cod
e an
d Ti
tle#
of S
urve
yIn
cum
bent
s#
SCE
EEs
Stud
y Po
s #
Man
ager
/Sup
ervi
sor M
anag
er 1
: Ope
ratio
nal S
ervi
ces:
Cor
pora
te R
eal E
stat
eM
GR
11
131
RA
DFO
RD
6313
Rea
l Est
ate
Spe
cial
ist/M
gr
15M
HR
C-S
IRS
S30
5 - 3
Rea
l Est
ate
Man
agem
ent
134
TW-M
M-E
NG
YA
RE
010
- M2
Rea
l Est
ate/
Pro
perty
Man
agem
ent
29TW
-MM
-GEN
ARE0
10 -
M2
Rea
l Est
ate/
Prop
erty
Man
agem
ent
97
Man
ager
1: O
pera
tiona
l Ser
vice
s: C
orpo
rate
Sec
urity
MG
R1
213
2R
AD
FOR
D33
43S
ecur
ity M
gmt
50M
HR
C-S
IRS
S18
0 - 3
Sec
urity
-Indu
stria
l32
8TW
-MM
-EN
GY
AA
Y000
- M
2S
ecur
ity G
ener
alis
t/Mul
tidis
cipl
ine
67TW
-MM
-GE
NA
AY0
00 -
M2
Sec
urity
Gen
eral
ist/M
ultid
isci
plin
e38
5
Man
ager
1: O
pera
tiona
l Ser
vice
s: T
rans
port
atio
n Se
rvic
esM
GR
17
133
TW-M
M-G
EN
AA
T000
- M
2Tr
ansp
orta
tion
Ser
vice
s an
d Ad
min
istra
tion
Gen
eral
ist
52
Man
ager
1: P
ower
Pro
duct
ion
MG
R1
213
4TW
-MM
-EN
GY
EG
F040
- M
2Fo
ssil
Pow
er O
pera
tions
276
TW-M
M-E
NG
YE
GF0
50 -
M2
Gas
Tur
bine
/Pea
king
Uni
t14
TW-M
M-E
NG
YE
GH
020
- M2
Hyd
roel
ectri
c O
pera
tions
and
/or M
aint
enan
ce9
Man
ager
1: S
ettle
men
ts &
Ope
ratio
ns S
ervi
ces
MG
R1
213
5TW
-MM
-EN
GY
AE
O51
0 - M
2B
ulk
Pow
er M
arke
t Set
tlem
ents
19
Man
ager
1: T
rans
mis
sion
& D
istr
ibut
ion:
Ass
et M
anag
emen
t & O
pera
tions
Sup
port
MG
R1
613
6M
HR
C-S
IRS
S027
- 3
Con
tract
s Ad
min
istra
tion
938
TW-M
M-E
NG
YA
LS02
0 - M
2C
ontra
ct A
dmin
istra
tion
66TW
-MM
-GEN
ALS0
20 -
M2
Con
tract
Adm
inis
tratio
n69
0
Man
ager
1: T
rans
mis
sion
& D
istr
ibut
ion:
Dis
trib
utio
n B
usin
ess
Line
MG
R1
3313
7TW
-MM
-EN
GY
ED
D00
0 - M
2E
nerg
y D
eliv
ery/
Dis
tribu
tion
Gen
eral
ist/M
ultid
isci
plin
e28
7TW
-MM
-EN
GY
ED
D02
0 - M
2E
lect
ric D
istri
butio
n C
onst
ruct
ion
and/
or M
aint
enan
ce43
0
31A
on H
ewitt
33
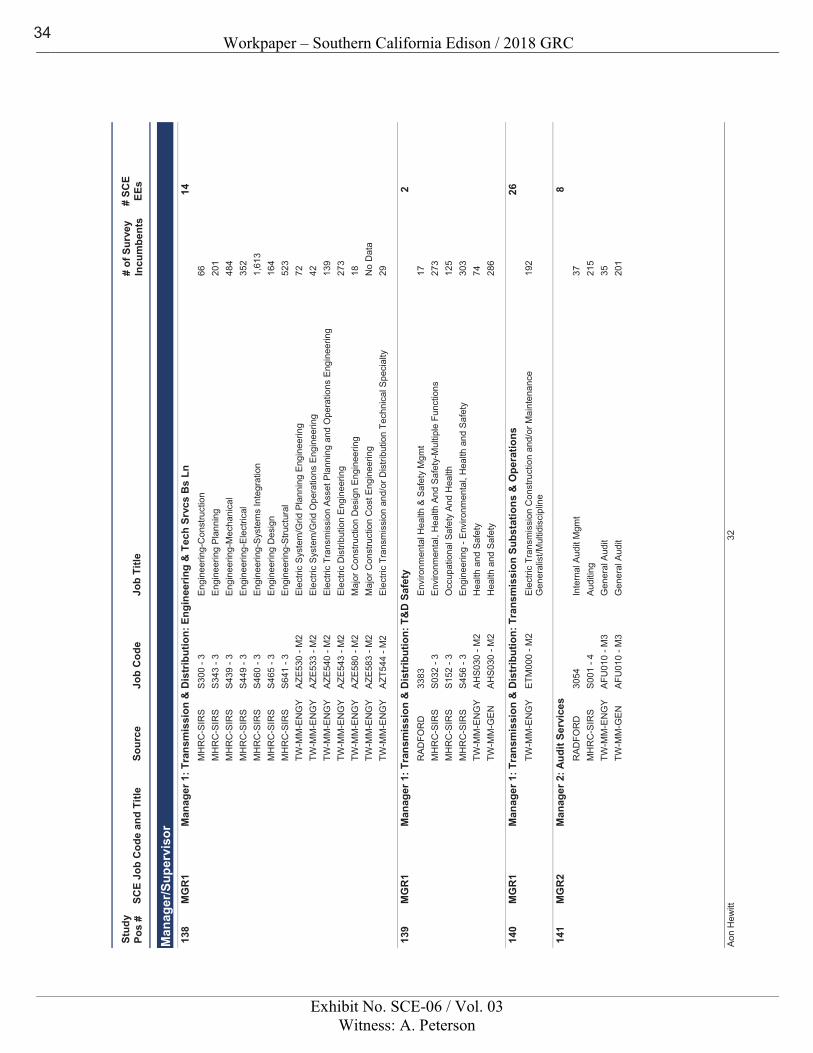
Workpaper – Southern California Edison / 2018 GRC
Exhibit No. SCE-06 / Vol. 03Witness: A. Peterson
Sour
ceJo
b C
ode
Job
Title
SCE
Job
Cod
e an
d Ti
tle#
of S
urve
yIn
cum
bent
s#
SCE
EEs
Stud
y Po
s #
Man
ager
/Sup
ervi
sor M
anag
er 1
: Tra
nsm
issi
on &
Dis
trib
utio
n: E
ngin
eerin
g &
Tec
h Sr
vcs
Bs
LnM
GR
114
138
MH
RC
-SIR
SS
300
- 3E
ngin
eerin
g-C
onst
ruct
ion
66M
HR
C-S
IRS
S34
3 - 3
Eng
inee
ring
Pla
nnin
g20
1M
HR
C-S
IRS
S43
9 - 3
Eng
inee
ring-
Mec
hani
cal
484
MH
RC
-SIR
SS
449
- 3E
ngin
eerin
g-E
lect
rical
352
MH
RC
-SIR
SS
460
- 3E
ngin
eerin
g-S
yste
ms
Inte
grat
ion
1,61
3M
HR
C-S
IRS
S46
5 - 3
Eng
inee
ring
Des
ign
164
MH
RC
-SIR
SS
641
- 3E
ngin
eerin
g-S
truct
ural
523
TW-M
M-E
NG
YA
ZE53
0 - M
2E
lect
ric S
yste
m/G
rid P
lann
ing
Eng
inee
ring
72TW
-MM
-EN
GY
AZE
533
- M2
Ele
ctric
Sys
tem
/Grid
Ope
ratio
ns E
ngin
eerin
g42
TW-M
M-E
NG
YA
ZE54
0 - M
2E
lect
ric T
rans
mis
sion
Ass
et P
lann
ing
and
Ope
ratio
ns E
ngin
eerin
g13
9TW
-MM
-EN
GY
AZE
543
- M2
Ele
ctric
Dis
tribu
tion
Eng
inee
ring
273
TW-M
M-E
NG
YA
ZE58
0 - M
2M
ajor
Con
stru
ctio
n D
esig
n E
ngin
eerin
g18
TW-M
M-E
NG
YA
ZE58
3 - M
2M
ajor
Con
stru
ctio
n C
ost E
ngin
eerin
gN
o D
ata
TW-M
M-E
NG
YA
ZT54
4 - M
2E
lect
ric T
rans
mis
sion
and
/or D
istri
butio
n Te
chni
cal S
peci
alty
29
Man
ager
1: T
rans
mis
sion
& D
istr
ibut
ion:
T&
D S
afet
yM
GR
12
139
RA
DFO
RD
3383
Env
ironm
enta
l Hea
lth &
Saf
ety
Mgm
t 17
MH
RC
-SIR
SS
032
- 3E
nviro
nmen
tal,
Hea
lth A
nd S
afet
y-M
ultip
le F
unct
ions
273
MH
RC
-SIR
SS
152
- 3O
ccup
atio
nal S
afet
y An
d H
ealth
125
MH
RC
-SIR
SS
456
- 3E
ngin
eerin
g - E
nviro
nmen
tal,
Hea
lth a
nd S
afet
y30
3TW
-MM
-EN
GY
AH
S03
0 - M
2H
ealth
and
Saf
ety
74TW
-MM
-GE
NA
HS
030
- M2
Hea
lth a
nd S
afet
y28
6
Man
ager
1: T
rans
mis
sion
& D
istr
ibut
ion:
Tra
nsm
issi
on S
ubst
atio
ns &
Ope
ratio
nsM
GR
126
140
TW-M
M-E
NG
YE
TM00
0 - M
2E
lect
ric T
rans
mis
sion
Con
stru
ctio
n an
d/or
Mai
nten
ance
G
ener
alis
t/Mul
tidis
cipl
ine
192
Man
ager
2: A
udit
Serv
ices
MG
R2
814
1R
AD
FOR
D30
54In
tern
al A
udit
Mgm
t 37
MH
RC
-SIR
SS
001
- 4A
uditi
ng21
5TW
-MM
-EN
GY
AFU
010
- M3
Gen
eral
Aud
it35
TW-M
M-G
ENAF
U01
0 - M
3G
ener
al A
udit
201
32A
on H
ewitt
34
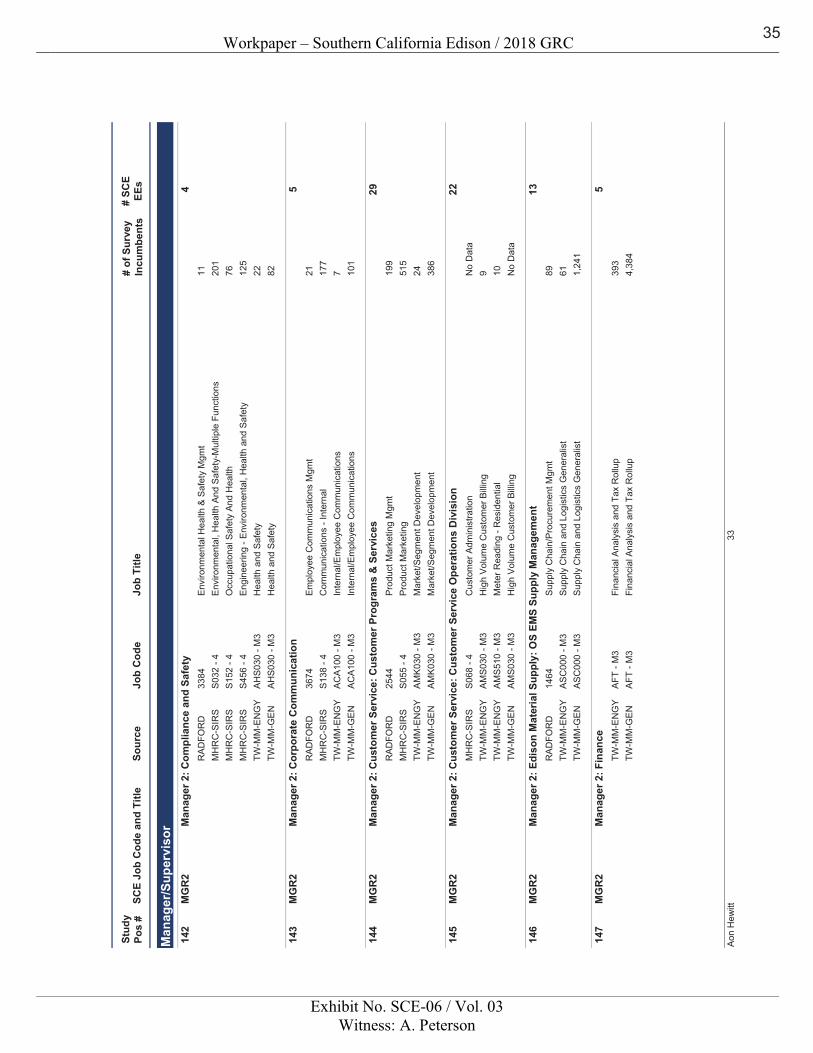
Workpaper – Southern California Edison / 2018 GRC
Exhibit No. SCE-06 / Vol. 03Witness: A. Peterson
Sour
ceJo
b C
ode
Job
Title
SCE
Job
Cod
e an
d Ti
tle#
of S
urve
yIn
cum
bent
s#
SCE
EEs
Stud
y Po
s #
Man
ager
/Sup
ervi
sor M
anag
er 2
: Com
plia
nce
and
Safe
tyM
GR
24
142
RA
DFO
RD
3384
Env
ironm
enta
l Hea
lth &
Saf
ety
Mgm
t 11
MH
RC
-SIR
SS
032
- 4E
nviro
nmen
tal,
Hea
lth A
nd S
afet
y-M
ultip
le F
unct
ions
201
MH
RC
-SIR
SS
152
- 4O
ccup
atio
nal S
afet
y An
d H
ealth
76M
HR
C-S
IRS
S45
6 - 4
Eng
inee
ring
- Env
ironm
enta
l, H
ealth
and
Saf
ety
125
TW-M
M-E
NG
YA
HS
030
- M3
Hea
lth a
nd S
afet
y22
TW-M
M-G
EN
AH
S03
0 - M
3H
ealth
and
Saf
ety
82
Man
ager
2: C
orpo
rate
Com
mun
icat
ion
MG
R2
514
3R
AD
FOR
D36
74E
mpl
oyee
Com
mun
icat
ions
Mgm
t 21
MH
RC
-SIR
SS
138
- 4C
omm
unic
atio
ns -
Inte
rnal
177
TW-M
M-E
NG
YA
CA
100
- M3
Inte
rnal
/Em
ploy
ee C
omm
unic
atio
ns7
TW-M
M-G
EN
AC
A10
0 - M
3In
tern
al/E
mpl
oyee
Com
mun
icat
ions
101
Man
ager
2: C
usto
mer
Ser
vice
: Cus
tom
er P
rogr
ams
& S
ervi
ces
MG
R2
2914
4R
AD
FOR
D25
44P
rodu
ct M
arke
ting
Mgm
t 19
9M
HR
C-S
IRS
S05
5 - 4
Pro
duct
Mar
ketin
g51
5TW
-MM
-EN
GY
AM
K03
0 - M
3M
arke
t/Seg
men
t Dev
elop
men
t24
TW-M
M-G
EN
AM
K03
0 - M
3M
arke
t/Seg
men
t Dev
elop
men
t38
6
Man
ager
2: C
usto
mer
Ser
vice
: Cus
tom
er S
ervi
ce O
pera
tions
Div
isio
nM
GR
222
145
MH
RC
-SIR
SS
068
- 4C
usto
mer
Adm
inis
tratio
nN
o D
ata
TW-M
M-E
NG
YA
MS
030
- M3
Hig
h V
olum
e C
usto
mer
Billi
ng9
TW-M
M-E
NG
YA
MS
510
- M3
Met
er R
eadi
ng -
Res
iden
tial
10TW
-MM
-GE
NA
MS
030
- M3
Hig
h V
olum
e C
usto
mer
Billi
ngN
o D
ata
Man
ager
2: E
diso
n M
ater
ial S
uppl
y: O
S EM
S Su
pply
Man
agem
ent
MG
R2
1314
6R
AD
FOR
D14
64Su
pply
Cha
in/P
rocu
rem
ent M
gmt
89TW
-MM
-EN
GY
AS
C00
0 - M
3S
uppl
y C
hain
and
Log
istic
s G
ener
alis
t61
TW-M
M-G
EN
AS
C00
0 - M
3S
uppl
y C
hain
and
Log
istic
s G
ener
alis
t1,
241
Man
ager
2: F
inan
ceM
GR
25
147
TW-M
M-E
NG
YA
FT -
M3
Fina
ncia
l Ana
lysi
s an
d Ta
x R
ollu
p39
3TW
-MM
-GE
NA
FT -
M3
Fina
ncia
l Ana
lysi
s an
d Ta
x R
ollu
p4,
384
33A
on H
ewitt
35
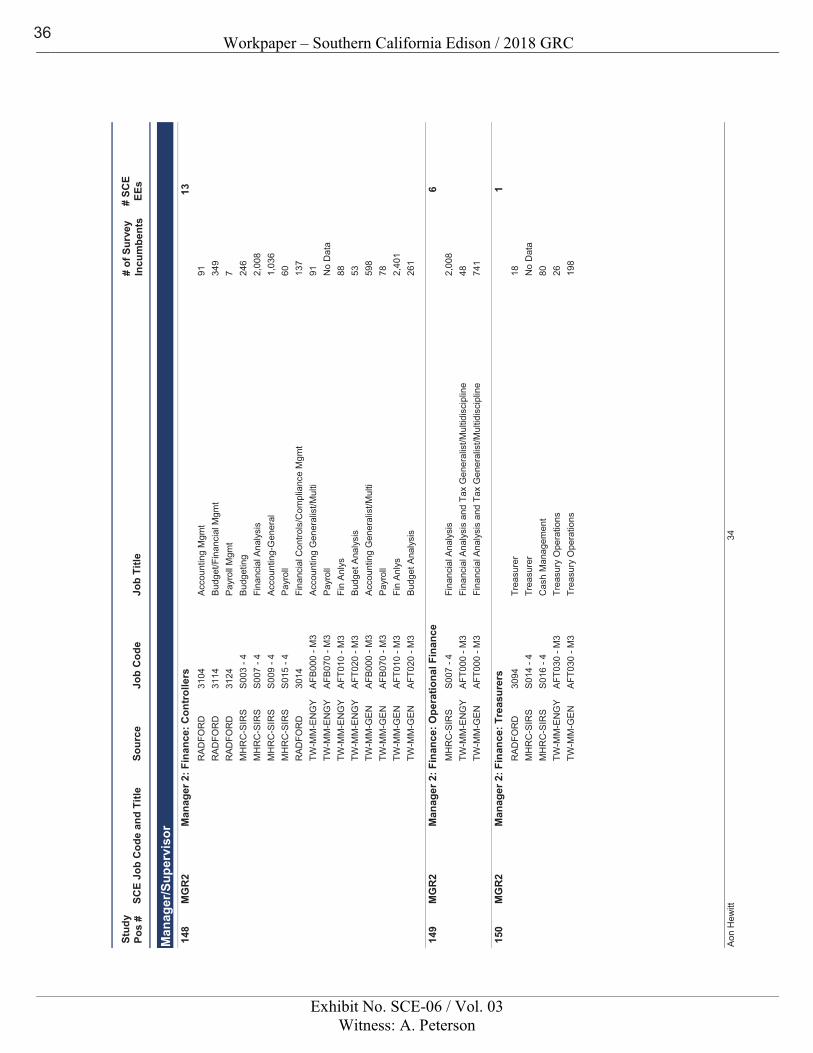
Workpaper – Southern California Edison / 2018 GRC
Exhibit No. SCE-06 / Vol. 03Witness: A. Peterson
Sour
ceJo
b C
ode
Job
Title
SCE
Job
Cod
e an
d Ti
tle#
of S
urve
yIn
cum
bent
s#
SCE
EEs
Stud
y Po
s #
Man
ager
/Sup
ervi
sor M
anag
er 2
: Fin
ance
: Con
trol
lers
MG
R2
1314
8R
AD
FOR
D31
04A
ccou
ntin
g M
gmt
91R
AD
FOR
D31
14B
udge
t/Fin
anci
al M
gmt
349
RA
DFO
RD
3124
Payr
oll M
gmt
7M
HR
C-S
IRS
S00
3 - 4
Bud
getin
g24
6M
HR
C-S
IRS
S00
7 - 4
Fina
ncia
l Ana
lysi
s2,
008
MH
RC
-SIR
SS
009
- 4A
ccou
ntin
g-G
ener
al1,
036
MH
RC
-SIR
SS
015
- 4P
ayro
ll60
RA
DFO
RD
3014
Fina
ncia
l Con
trols
/Com
plia
nce
Mgm
t 13
7TW
-MM
-EN
GY
AFB
000
- M3
Acc
ount
ing
Gen
eral
ist/M
ulti
91TW
-MM
-EN
GY
AFB
070
- M3
Pay
roll
No
Dat
aTW
-MM
-EN
GY
AFT
010
- M3
Fin
Anl
ys88
TW-M
M-E
NG
YA
FT02
0 - M
3B
udge
t Ana
lysi
s53
TW-M
M-G
EN
AFB
000
- M3
Acc
ount
ing
Gen
eral
ist/M
ulti
598
TW-M
M-G
EN
AFB
070
- M3
Pay
roll
78TW
-MM
-GE
NA
FT01
0 - M
3Fi
n A
nlys
2,40
1TW
-MM
-GE
NA
FT02
0 - M
3B
udge
t Ana
lysi
s26
1
Man
ager
2: F
inan
ce: O
pera
tiona
l Fin
ance
MG
R2
614
9M
HR
C-S
IRS
S00
7 - 4
Fina
ncia
l Ana
lysi
s2,
008
TW-M
M-E
NG
YA
FT00
0 - M
3Fi
nanc
ial A
naly
sis
and
Tax
Gen
eral
ist/M
ultid
isci
plin
e48
TW-M
M-G
EN
AFT
000
- M3
Fina
ncia
l Ana
lysi
s an
d Ta
x G
ener
alis
t/Mul
tidis
cipl
ine
741
Man
ager
2: F
inan
ce: T
reas
urer
sM
GR
21
150
RA
DFO
RD
3094
Trea
sure
r 18
MH
RC
-SIR
SS
014
- 4Tr
easu
rer
No
Dat
aM
HR
C-S
IRS
S01
6 - 4
Cas
h M
anag
emen
t80
TW-M
M-E
NG
YA
FT03
0 - M
3Tr
easu
ry O
pera
tions
26TW
-MM
-GE
NA
FT03
0 - M
3Tr
easu
ry O
pera
tions
198
34A
on H
ewitt
36
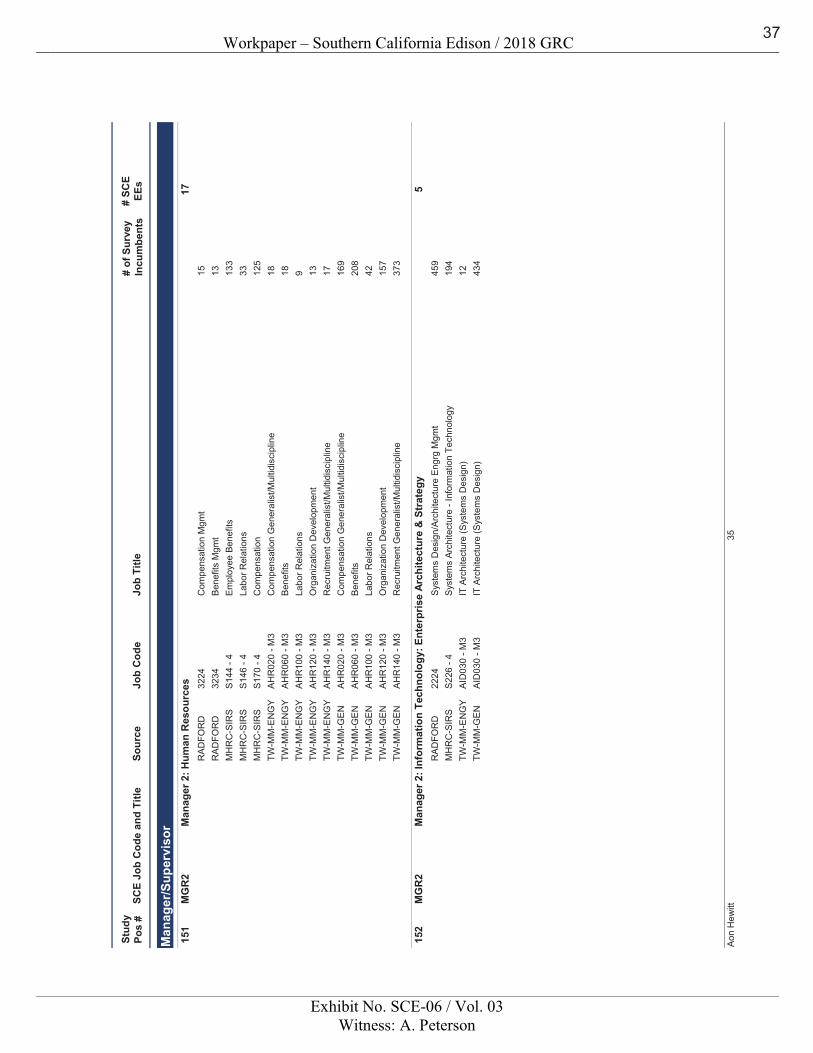
Workpaper – Southern California Edison / 2018 GRC
Exhibit No. SCE-06 / Vol. 03Witness: A. Peterson
Sour
ceJo
b C
ode
Job
Title
SCE
Job
Cod
e an
d Ti
tle#
of S
urve
yIn
cum
bent
s#
SCE
EEs
Stud
y Po
s #
Man
ager
/Sup
ervi
sor M
anag
er 2
: Hum
an R
esou
rces
MG
R2
1715
1R
AD
FOR
D32
24C
ompe
nsat
ion
Mgm
t 15
RA
DFO
RD
3234
Bene
fits
Mgm
t 13
MH
RC
-SIR
SS
144
- 4E
mpl
oyee
Ben
efits
133
MH
RC
-SIR
SS
146
- 4La
bor R
elat
ions
33M
HR
C-S
IRS
S17
0 - 4
Com
pens
atio
n12
5TW
-MM
-EN
GY
AH
R02
0 - M
3C
ompe
nsat
ion
Gen
eral
ist/M
ultid
isci
plin
e18
TW-M
M-E
NG
YA
HR
060
- M3
Ben
efits
18TW
-MM
-EN
GY
AH
R10
0 - M
3La
bor R
elat
ions
9TW
-MM
-EN
GY
AH
R12
0 - M
3O
rgan
izat
ion
Dev
elop
men
t13
TW-M
M-E
NG
YA
HR
140
- M3
Rec
ruitm
ent G
ener
alis
t/Mul
tidis
cipl
ine
17TW
-MM
-GE
NA
HR
020
- M3
Com
pens
atio
n G
ener
alis
t/Mul
tidis
cipl
ine
169
TW-M
M-G
EN
AH
R06
0 - M
3B
enef
its20
8TW
-MM
-GE
NA
HR
100
- M3
Labo
r Rel
atio
ns42
TW-M
M-G
EN
AH
R12
0 - M
3O
rgan
izat
ion
Dev
elop
men
t15
7TW
-MM
-GE
NA
HR
140
- M3
Rec
ruitm
ent G
ener
alis
t/Mul
tidis
cipl
ine
373
Man
ager
2: I
nfor
mat
ion
Tech
nolo
gy: E
nter
pris
e Ar
chite
ctur
e &
Str
ateg
yM
GR
25
152
RA
DFO
RD
2224
Sys
tem
s D
esig
n/A
rchi
tect
ure
Eng
rg M
gmt
459
MH
RC
-SIR
SS
226
- 4S
yste
ms
Arc
hite
ctur
e - I
nfor
mat
ion
Tech
nolo
gy19
4TW
-MM
-EN
GY
AID
030
- M3
IT A
rchi
tect
ure
(Sys
tem
s D
esig
n)
12TW
-MM
-GE
NA
ID03
0 - M
3IT
Arc
hite
ctur
e (S
yste
ms
Des
ign)
43
4
35A
on H
ewitt
37
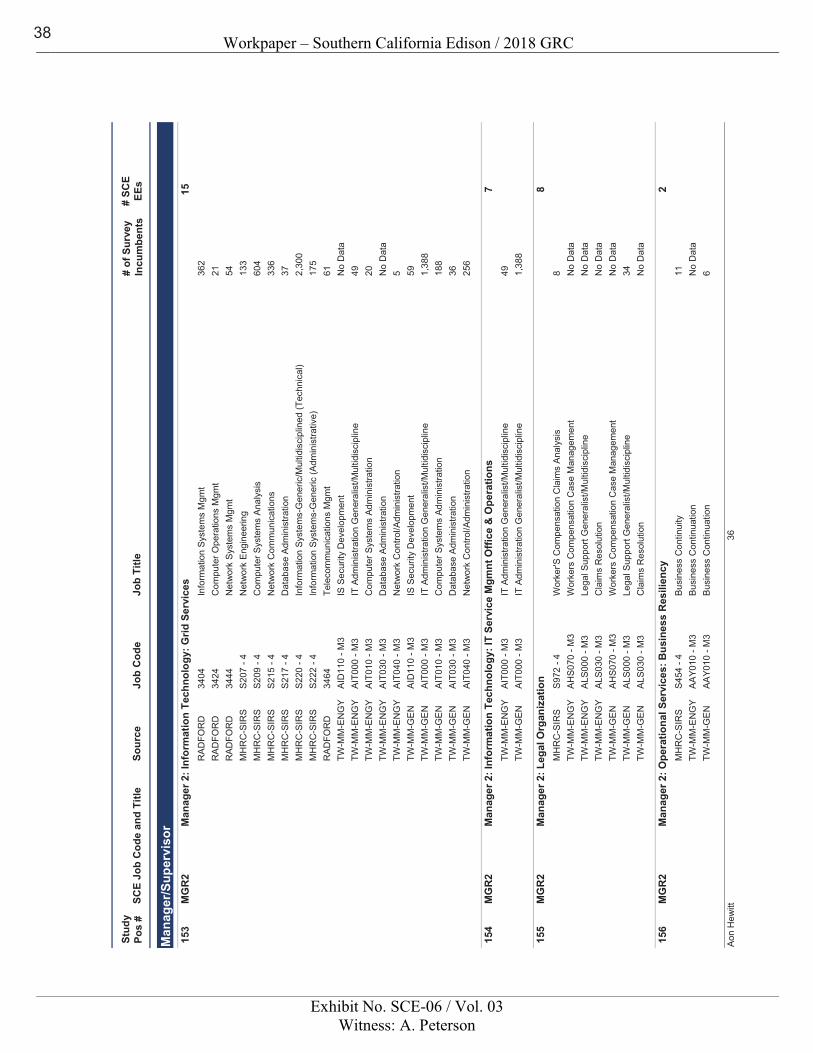
Workpaper – Southern California Edison / 2018 GRC
Exhibit No. SCE-06 / Vol. 03Witness: A. Peterson
Sour
ceJo
b C
ode
Job
Title
SCE
Job
Cod
e an
d Ti
tle#
of S
urve
yIn
cum
bent
s#
SCE
EEs
Stud
y Po
s #
Man
ager
/Sup
ervi
sor M
anag
er 2
: Inf
orm
atio
n Te
chno
logy
: Grid
Ser
vice
sM
GR
215
153
RA
DFO
RD
3404
Info
rmat
ion
Syst
ems
Mgm
t 36
2R
AD
FOR
D34
24C
ompu
ter O
pera
tions
Mgm
t 21
RA
DFO
RD
3444
Net
wor
k Sy
stem
s M
gmt
54M
HR
C-S
IRS
S20
7 - 4
Net
wor
k E
ngin
eerin
g13
3M
HR
C-S
IRS
S20
9 - 4
Com
pute
r Sys
tem
s An
alys
is60
4M
HR
C-S
IRS
S21
5 - 4
Net
wor
k C
omm
unic
atio
ns33
6M
HR
C-S
IRS
S217
- 4
Dat
abas
e Ad
min
istra
tion
37M
HR
C-S
IRS
S22
0 - 4
Info
rmat
ion
Syst
ems-
Gen
eric
/Mul
tidis
cipl
ined
(Tec
hnic
al)
2,30
0M
HR
C-S
IRS
S22
2 - 4
Info
rmat
ion
Syst
ems-
Gen
eric
(Adm
inis
trativ
e)17
5R
AD
FOR
D34
64Te
leco
mm
unic
atio
ns M
gmt
61TW
-MM
-EN
GY
AID
110
- M3
IS S
ecur
ity D
evel
opm
ent
No
Dat
aTW
-MM
-EN
GY
AIT
000
- M3
IT A
dmin
istra
tion
Gen
eral
ist/M
ultid
isci
plin
e49
TW-M
M-E
NG
YA
IT01
0 - M
3C
ompu
ter S
yste
ms
Adm
inis
tratio
n20
TW-M
M-E
NG
YA
IT03
0 - M
3D
atab
ase
Adm
inis
tratio
nN
o D
ata
TW-M
M-E
NG
YA
IT04
0 - M
3N
etw
ork
Con
trol/A
dmin
istra
tion
5TW
-MM
-GE
NA
ID11
0 - M
3IS
Sec
urity
Dev
elop
men
t59
TW-M
M-G
EN
AIT
000
- M3
IT A
dmin
istra
tion
Gen
eral
ist/M
ultid
isci
plin
e1,
388
TW-M
M-G
EN
AIT
010
- M3
Com
pute
r Sys
tem
s Ad
min
istra
tion
188
TW-M
M-G
ENAI
T030
- M
3D
atab
ase
Adm
inis
tratio
n36
TW-M
M-G
ENAI
T040
- M
3N
etw
ork
Con
trol/A
dmin
istra
tion
256
Man
ager
2: I
nfor
mat
ion
Tech
nolo
gy: I
T Se
rvic
e M
gmnt
Offi
ce &
Ope
ratio
nsM
GR
27
154
TW-M
M-E
NG
YA
IT00
0 - M
3IT
Adm
inis
tratio
n G
ener
alis
t/Mul
tidis
cipl
ine
49TW
-MM
-GE
NA
IT00
0 - M
3IT
Adm
inis
tratio
n G
ener
alis
t/Mul
tidis
cipl
ine
1,38
8
Man
ager
2: L
egal
Org
aniz
atio
nM
GR
28
155
MH
RC
-SIR
SS
972
- 4W
orke
r'S C
ompe
nsat
ion
Cla
ims
Ana
lysi
s8
TW-M
M-E
NG
YA
HS
070
- M3
Wor
kers
Com
pens
atio
n C
ase
Man
agem
ent
No
Dat
aTW
-MM
-EN
GY
ALS
000
- M3
Lega
l Sup
port
Gen
eral
ist/M
ultid
isci
plin
eN
o D
ata
TW-M
M-E
NG
YA
LS03
0 - M
3C
laim
s R
esol
utio
nN
o D
ata
TW-M
M-G
EN
AH
S07
0 - M
3W
orke
rs C
ompe
nsat
ion
Cas
e M
anag
emen
tN
o D
ata
TW-M
M-G
EN
ALS
000
- M3
Lega
l Sup
port
Gen
eral
ist/M
ultid
isci
plin
e34
TW-M
M-G
EN
ALS
030
- M3
Cla
ims
Res
olut
ion
No
Dat
a
Man
ager
2: O
pera
tiona
l Ser
vice
s: B
usin
ess
Res
ilien
cyM
GR
22
156
MH
RC
-SIR
SS
454
- 4B
usin
ess
Con
tinui
ty11
TW-M
M-E
NG
YA
AY0
10 -
M3
Bus
ines
s C
ontin
uatio
nN
o D
ata
TW-M
M-G
EN
AA
Y010
- M
3B
usin
ess
Con
tinua
tion
6
36A
on H
ewitt
38
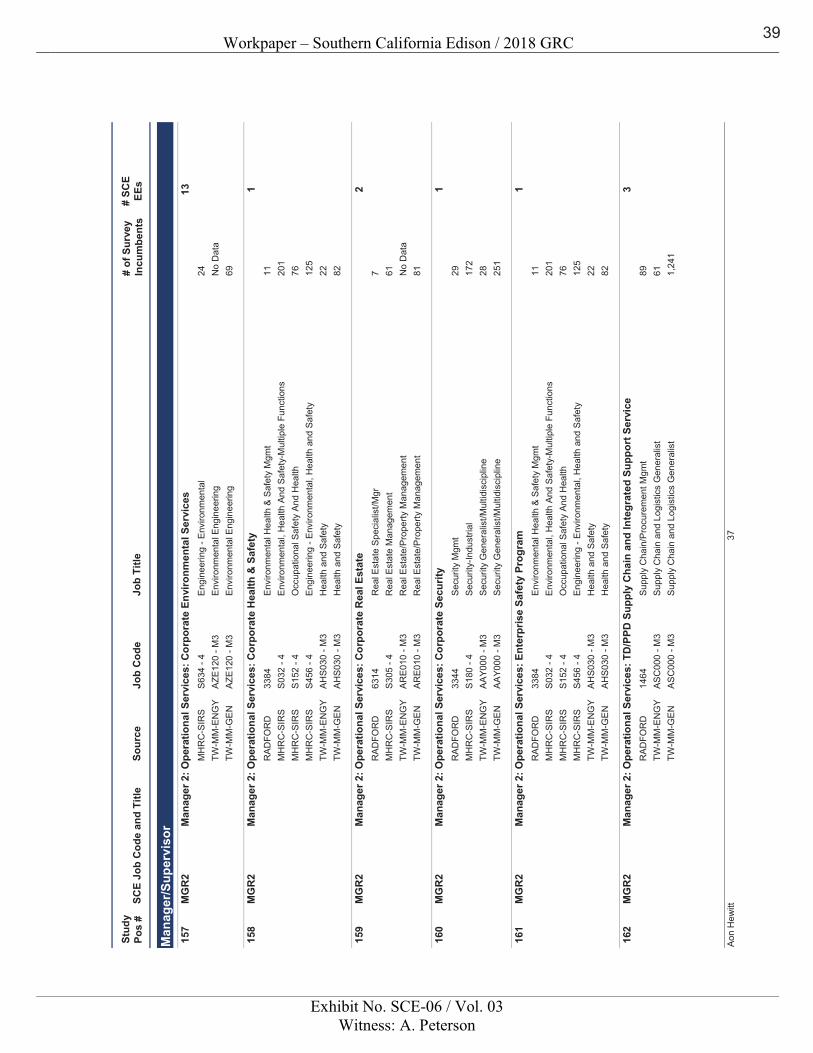
Workpaper – Southern California Edison / 2018 GRC
Exhibit No. SCE-06 / Vol. 03Witness: A. Peterson
Sour
ceJo
b C
ode
Job
Title
SCE
Job
Cod
e an
d Ti
tle#
of S
urve
yIn
cum
bent
s#
SCE
EEs
Stud
y Po
s #
Man
ager
/Sup
ervi
sor M
anag
er 2
: Ope
ratio
nal S
ervi
ces:
Cor
pora
te E
nviro
nmen
tal S
ervi
ces
MG
R2
1315
7M
HR
C-S
IRS
S63
4 - 4
Eng
inee
ring
- Env
ironm
enta
l24
TW-M
M-E
NG
YA
ZE12
0 - M
3E
nviro
nmen
tal E
ngin
eerin
g N
o D
ata
TW-M
M-G
EN
AZE
120
- M3
Env
ironm
enta
l Eng
inee
ring
69
Man
ager
2: O
pera
tiona
l Ser
vice
s: C
orpo
rate
Hea
lth &
Saf
ety
MG
R2
115
8R
AD
FOR
D33
84E
nviro
nmen
tal H
ealth
& S
afet
y M
gmt
11M
HR
C-S
IRS
S03
2 - 4
Env
ironm
enta
l, H
ealth
And
Saf
ety-
Mul
tiple
Fun
ctio
ns20
1M
HR
C-S
IRS
S15
2 - 4
Occ
upat
iona
l Saf
ety
And
Hea
lth76
MH
RC
-SIR
SS
456
- 4E
ngin
eerin
g - E
nviro
nmen
tal,
Hea
lth a
nd S
afet
y12
5TW
-MM
-EN
GY
AH
S03
0 - M
3H
ealth
and
Saf
ety
22TW
-MM
-GE
NA
HS
030
- M3
Hea
lth a
nd S
afet
y82
Man
ager
2: O
pera
tiona
l Ser
vice
s: C
orpo
rate
Rea
l Est
ate
MG
R2
215
9R
AD
FOR
D63
14R
eal E
stat
e S
peci
alis
t/Mgr
7
MH
RC
-SIR
SS
305
- 4R
eal E
stat
e M
anag
emen
t61
TW-M
M-E
NG
YA
RE
010
- M3
Rea
l Est
ate/
Pro
perty
Man
agem
ent
No
Dat
aTW
-MM
-GEN
ARE0
10 -
M3
Rea
l Est
ate/
Prop
erty
Man
agem
ent
81
Man
ager
2: O
pera
tiona
l Ser
vice
s: C
orpo
rate
Sec
urity
MG
R2
116
0R
AD
FOR
D33
44S
ecur
ity M
gmt
29M
HR
C-S
IRS
S18
0 - 4
Sec
urity
-Indu
stria
l17
2TW
-MM
-EN
GY
AA
Y000
- M
3S
ecur
ity G
ener
alis
t/Mul
tidis
cipl
ine
28TW
-MM
-GE
NA
AY0
00 -
M3
Sec
urity
Gen
eral
ist/M
ultid
isci
plin
e25
1
Man
ager
2: O
pera
tiona
l Ser
vice
s: E
nter
pris
e Sa
fety
Pro
gram
MG
R2
116
1R
AD
FOR
D33
84E
nviro
nmen
tal H
ealth
& S
afet
y M
gmt
11M
HR
C-S
IRS
S03
2 - 4
Env
ironm
enta
l, H
ealth
And
Saf
ety-
Mul
tiple
Fun
ctio
ns20
1M
HR
C-S
IRS
S15
2 - 4
Occ
upat
iona
l Saf
ety
And
Hea
lth76
MH
RC
-SIR
SS
456
- 4E
ngin
eerin
g - E
nviro
nmen
tal,
Hea
lth a
nd S
afet
y12
5TW
-MM
-EN
GY
AH
S03
0 - M
3H
ealth
and
Saf
ety
22TW
-MM
-GE
NA
HS
030
- M3
Hea
lth a
nd S
afet
y82
Man
ager
2: O
pera
tiona
l Ser
vice
s: T
D/P
PD S
uppl
y C
hain
and
Inte
grat
ed S
uppo
rt S
ervi
ceM
GR
23
162
RA
DFO
RD
1464
Supp
ly C
hain
/Pro
cure
men
t Mgm
t 89
TW-M
M-E
NG
YA
SC
000
- M3
Sup
ply
Cha
in a
nd L
ogis
tics
Gen
eral
ist
61TW
-MM
-GE
NA
SC
000
- M3
Sup
ply
Cha
in a
nd L
ogis
tics
Gen
eral
ist
1,24
1
37A
on H
ewitt
39
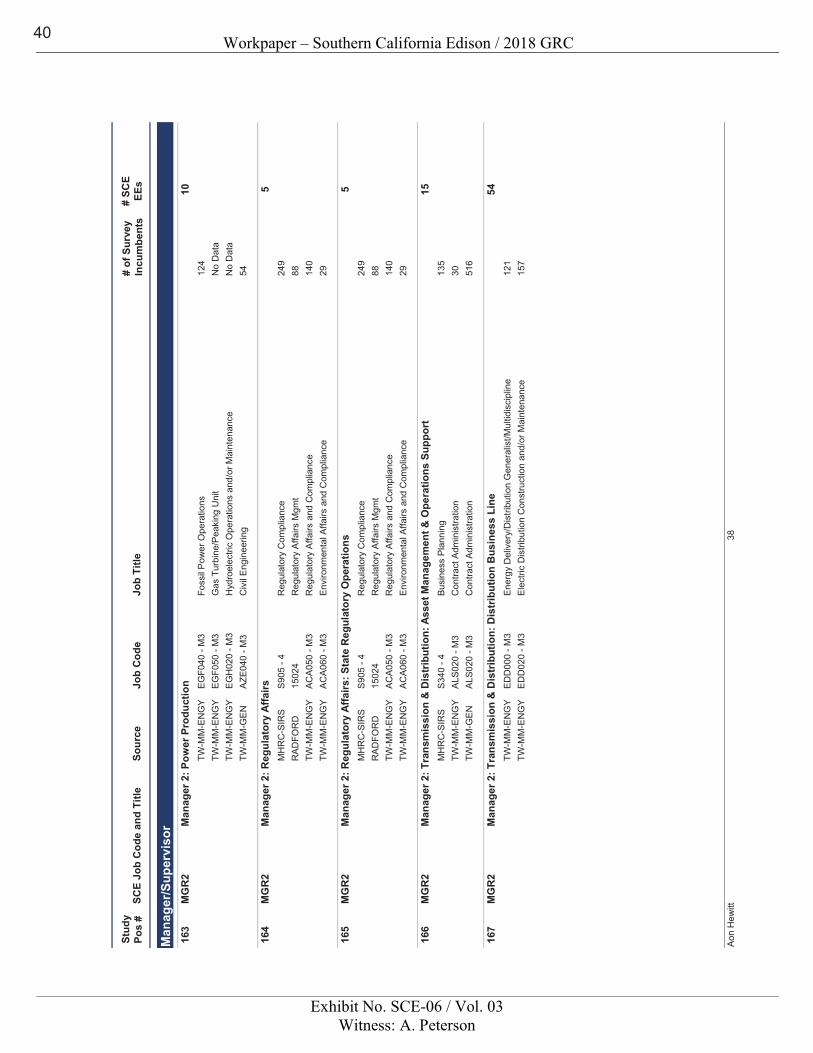
Workpaper – Southern California Edison / 2018 GRC
Exhibit No. SCE-06 / Vol. 03Witness: A. Peterson
Sour
ceJo
b C
ode
Job
Title
SCE
Job
Cod
e an
d Ti
tle#
of S
urve
yIn
cum
bent
s#
SCE
EEs
Stud
y Po
s #
Man
ager
/Sup
ervi
sor M
anag
er 2
: Pow
er P
rodu
ctio
nM
GR
210
163
TW-M
M-E
NG
YE
GF0
40 -
M3
Foss
il P
ower
Ope
ratio
ns12
4TW
-MM
-EN
GY
EG
F050
- M
3G
as T
urbi
ne/P
eaki
ng U
nit
No
Dat
aTW
-MM
-EN
GY
EG
H02
0 - M
3H
ydro
elec
tric
Ope
ratio
ns a
nd/o
r Mai
nten
ance
No
Dat
aTW
-MM
-GE
NA
ZE04
0 - M
3C
ivil
Eng
inee
ring
54
Man
ager
2: R
egul
ator
y Af
fairs
MG
R2
516
4M
HR
C-S
IRS
S90
5 - 4
Reg
ulat
ory
Com
plia
nce
249
RA
DFO
RD
1502
4R
egul
ator
y Af
fairs
Mgm
t 88
TW-M
M-E
NG
YA
CA
050
- M3
Reg
ulat
ory
Affa
irs a
nd C
ompl
ianc
e14
0TW
-MM
-EN
GY
AC
A06
0 - M
3E
nviro
nmen
tal A
ffairs
and
Com
plia
nce
29
Man
ager
2: R
egul
ator
y Af
fairs
: Sta
te R
egul
ator
y O
pera
tions
MG
R2
516
5M
HR
C-S
IRS
S90
5 - 4
Reg
ulat
ory
Com
plia
nce
249
RA
DFO
RD
1502
4R
egul
ator
y Af
fairs
Mgm
t 88
TW-M
M-E
NG
YA
CA
050
- M3
Reg
ulat
ory
Affa
irs a
nd C
ompl
ianc
e14
0TW
-MM
-EN
GY
AC
A06
0 - M
3E
nviro
nmen
tal A
ffairs
and
Com
plia
nce
29
Man
ager
2: T
rans
mis
sion
& D
istr
ibut
ion:
Ass
et M
anag
emen
t & O
pera
tions
Sup
port
MG
R2
1516
6M
HR
C-S
IRS
S34
0 - 4
Bus
ines
s P
lann
ing
135
TW-M
M-E
NG
YA
LS02
0 - M
3C
ontra
ct A
dmin
istra
tion
30TW
-MM
-GEN
ALS0
20 -
M3
Con
tract
Adm
inis
tratio
n51
6
Man
ager
2: T
rans
mis
sion
& D
istr
ibut
ion:
Dis
trib
utio
n B
usin
ess
Line
MG
R2
5416
7TW
-MM
-EN
GY
ED
D00
0 - M
3E
nerg
y D
eliv
ery/
Dis
tribu
tion
Gen
eral
ist/M
ultid
isci
plin
e12
1TW
-MM
-EN
GY
ED
D02
0 - M
3E
lect
ric D
istri
butio
n C
onst
ruct
ion
and/
or M
aint
enan
ce15
7
38A
on H
ewitt
40
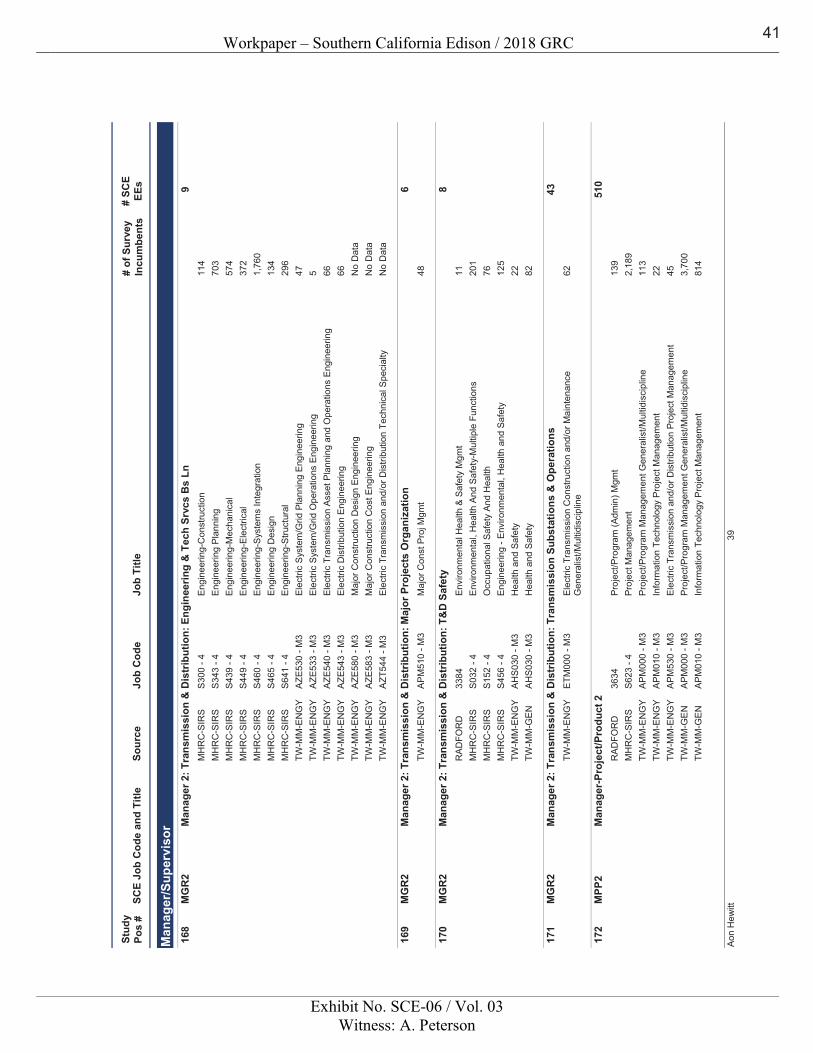
Workpaper – Southern California Edison / 2018 GRC
Exhibit No. SCE-06 / Vol. 03Witness: A. Peterson
Sour
ceJo
b C
ode
Job
Title
SCE
Job
Cod
e an
d Ti
tle#
of S
urve
yIn
cum
bent
s#
SCE
EEs
Stud
y Po
s #
Man
ager
/Sup
ervi
sor M
anag
er 2
: Tra
nsm
issi
on &
Dis
trib
utio
n: E
ngin
eerin
g &
Tec
h Sr
vcs
Bs
LnM
GR
29
168
MH
RC
-SIR
SS
300
- 4E
ngin
eerin
g-C
onst
ruct
ion
114
MH
RC
-SIR
SS
343
- 4E
ngin
eerin
g P
lann
ing
703
MH
RC
-SIR
SS
439
- 4E
ngin
eerin
g-M
echa
nica
l57
4M
HR
C-S
IRS
S44
9 - 4
Eng
inee
ring-
Ele
ctric
al37
2M
HR
C-S
IRS
S46
0 - 4
Eng
inee
ring-
Sys
tem
s In
tegr
atio
n1,
760
MH
RC
-SIR
SS
465
- 4E
ngin
eerin
g D
esig
n13
4M
HR
C-S
IRS
S64
1 - 4
Eng
inee
ring-
Stru
ctur
al29
6TW
-MM
-EN
GY
AZE
530
- M3
Ele
ctric
Sys
tem
/Grid
Pla
nnin
g E
ngin
eerin
g47
TW-M
M-E
NG
YA
ZE53
3 - M
3E
lect
ric S
yste
m/G
rid O
pera
tions
Eng
inee
ring
5TW
-MM
-EN
GY
AZE
540
- M3
Ele
ctric
Tra
nsm
issi
on A
sset
Pla
nnin
g an
d O
pera
tions
Eng
inee
ring
66TW
-MM
-EN
GY
AZE
543
- M3
Ele
ctric
Dis
tribu
tion
Eng
inee
ring
66TW
-MM
-EN
GY
AZE
580
- M3
Maj
or C
onst
ruct
ion
Des
ign
Eng
inee
ring
No
Dat
aTW
-MM
-EN
GY
AZE
583
- M3
Maj
or C
onst
ruct
ion
Cos
t Eng
inee
ring
No
Dat
aTW
-MM
-EN
GY
AZT
544
- M3
Ele
ctric
Tra
nsm
issi
on a
nd/o
r Dis
tribu
tion
Tech
nica
l Spe
cial
tyN
o D
ata
Man
ager
2: T
rans
mis
sion
& D
istr
ibut
ion:
Maj
or P
roje
cts
Org
aniz
atio
nM
GR
26
169
TW-M
M-E
NG
YA
PM
510
- M3
Maj
or C
onst
Pro
j Mgm
t48
Man
ager
2: T
rans
mis
sion
& D
istr
ibut
ion:
T&
D S
afet
yM
GR
28
170
RA
DFO
RD
3384
Env
ironm
enta
l Hea
lth &
Saf
ety
Mgm
t 11
MH
RC
-SIR
SS
032
- 4E
nviro
nmen
tal,
Hea
lth A
nd S
afet
y-M
ultip
le F
unct
ions
201
MH
RC
-SIR
SS
152
- 4O
ccup
atio
nal S
afet
y An
d H
ealth
76M
HR
C-S
IRS
S45
6 - 4
Eng
inee
ring
- Env
ironm
enta
l, H
ealth
and
Saf
ety
125
TW-M
M-E
NG
YA
HS
030
- M3
Hea
lth a
nd S
afet
y22
TW-M
M-G
EN
AH
S03
0 - M
3H
ealth
and
Saf
ety
82
Man
ager
2: T
rans
mis
sion
& D
istr
ibut
ion:
Tra
nsm
issi
on S
ubst
atio
ns &
Ope
ratio
nsM
GR
243
171
TW-M
M-E
NG
YE
TM00
0 - M
3E
lect
ric T
rans
mis
sion
Con
stru
ctio
n an
d/or
Mai
nten
ance
G
ener
alis
t/Mul
tidis
cipl
ine
62
Man
ager
-Pro
ject
/Pro
duct
2M
PP2
510
172
RA
DFO
RD
3634
Pro
ject
/Pro
gram
(Adm
in) M
gmt
139
MH
RC
-SIR
SS
623
- 4P
roje
ct M
anag
emen
t2,
189
TW-M
M-E
NG
YA
PM
000
- M3
Pro
ject
/Pro
gram
Man
agem
ent G
ener
alis
t/Mul
tidis
cipl
ine
113
TW-M
M-E
NG
YA
PM
010
- M3
Info
rmat
ion
Tech
nolo
gy P
roje
ct M
anag
emen
t22
TW-M
M-E
NG
YA
PM
530
- M3
Ele
ctric
Tra
nsm
issi
on a
nd/o
r Dis
tribu
tion
Proj
ect M
anag
emen
t45
TW-M
M-G
EN
AP
M00
0 - M
3P
roje
ct/P
rogr
am M
anag
emen
t Gen
eral
ist/M
ultid
isci
plin
e3,
700
TW-M
M-G
EN
AP
M01
0 - M
3In
form
atio
n Te
chno
logy
Pro
ject
Man
agem
ent
814
39A
on H
ewitt
41
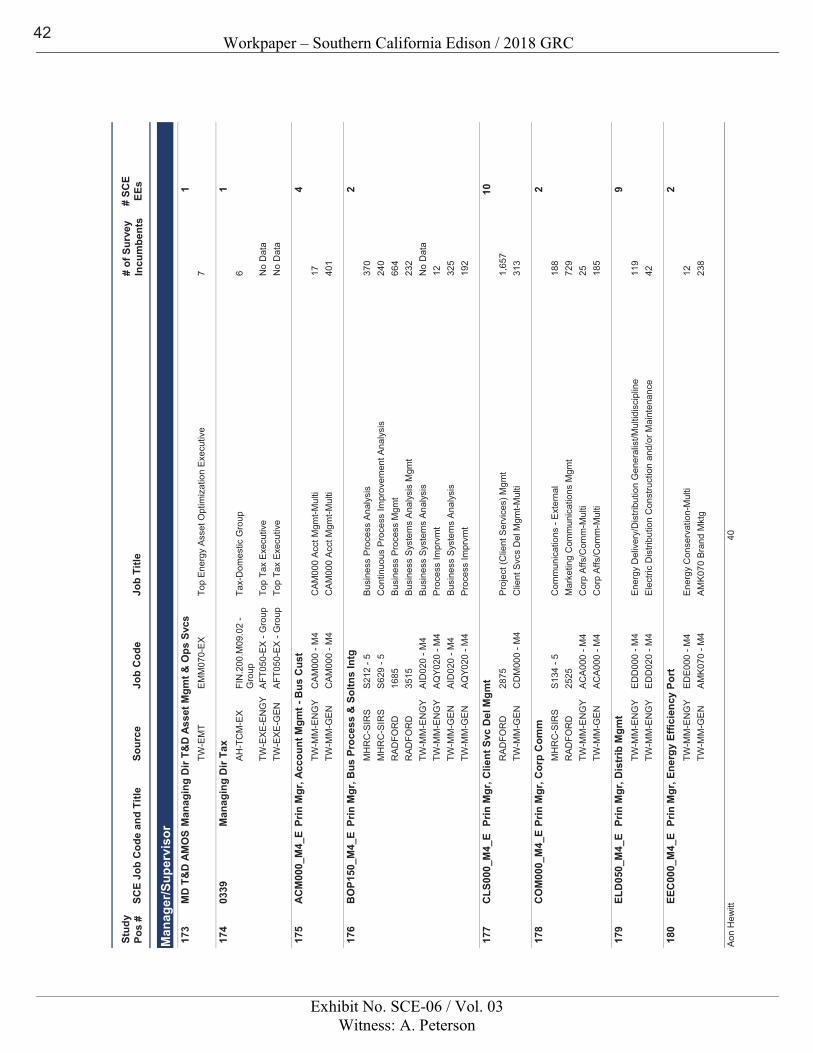
Workpaper – Southern California Edison / 2018 GRC
Exhibit No. SCE-06 / Vol. 03Witness: A. Peterson
Sour
ceJo
b C
ode
Job
Title
SCE
Job
Cod
e an
d Ti
tle#
of S
urve
yIn
cum
bent
s#
SCE
EEs
Stud
y Po
s #
Man
ager
/Sup
ervi
sor M
anag
ing
Dir
T&D
Ass
et M
gmt &
Ops
Svc
sM
D T
&D
AM
OS
117
3TW
-EM
TE
MM
070-
EX
Top
Ene
rgy
Asse
t Opt
imiz
atio
n E
xecu
tive
7
Man
agin
g D
ir Ta
x03
391
174
AH-T
CM
-EX
FIN
.200
.M09
.02
- G
roup
Tax-
Dom
estic
Gro
up6
TW-E
XE-E
NG
YAF
T050
-EX
- Gro
upTo
p Ta
x Ex
ecut
ive
No
Dat
aTW
-EX
E-G
EN
AFT
050-
EX
- G
roup
Top
Tax
Exe
cutiv
eN
o D
ata
Prin
Mgr
, Acc
ount
Mgm
t - B
us C
ust
ACM
000_
M4_
E4
175
TW-M
M-E
NG
YC
AM
000
- M4
CA
M00
0 A
cct M
gmt-M
ulti
17TW
-MM
-GE
NC
AM
000
- M4
CA
M00
0 A
cct M
gmt-M
ulti
401
Prin
Mgr
, Bus
Pro
cess
& S
oltn
s In
tgB
OP1
50_M
4_E
217
6M
HR
C-S
IRS
S21
2 - 5
Bus
ines
s P
roce
ss A
naly
sis
370
MH
RC
-SIR
SS
629
- 5C
ontin
uous
Pro
cess
Impr
ovem
ent A
naly
sis
240
RA
DFO
RD
1685
Bus
ines
s P
roce
ss M
gmt
664
RA
DFO
RD
3515
Bus
ines
s S
yste
ms
Ana
lysi
s M
gmt
232
TW-M
M-E
NG
YA
ID02
0 - M
4B
usin
ess
Sys
tem
s A
naly
sis
No
Dat
aTW
-MM
-EN
GY
AQ
Y020
- M
4P
roce
ss Im
prvm
t12
TW-M
M-G
EN
AID
020
- M4
Bus
ines
s S
yste
ms
Ana
lysi
s32
5TW
-MM
-GEN
AQY0
20 -
M4
Proc
ess
Impr
vmt
192
Prin
Mgr
, Clie
nt S
vc D
el M
gmt
CLS
000_
M4_
E10
177
RA
DFO
RD
2875
Pro
ject
(Clie
nt S
ervi
ces)
Mgm
t1,
657
TW-M
M-G
EN
CD
M00
0 - M
4C
lient
Svc
s D
el M
gmt-M
ulti
313
Prin
Mgr
, Cor
p C
omm
CO
M00
0_M
4_E
217
8M
HR
C-S
IRS
S13
4 - 5
Com
mun
icat
ions
- E
xter
nal
188
RA
DFO
RD
2525
Mar
ketin
g C
omm
unic
atio
ns M
gmt
729
TW-M
M-E
NG
YA
CA
000
- M4
Cor
p A
ffs/C
omm
-Mul
ti25
TW-M
M-G
EN
AC
A00
0 - M
4C
orp
Affs
/Com
m-M
ulti
185
Prin
Mgr
, Dis
trib
Mgm
tEL
D05
0_M
4_E
917
9TW
-MM
-EN
GY
ED
D00
0 - M
4E
nerg
y D
eliv
ery/
Dis
tribu
tion
Gen
eral
ist/M
ultid
isci
plin
e11
9TW
-MM
-EN
GY
ED
D02
0 - M
4E
lect
ric D
istri
butio
n C
onst
ruct
ion
and/
or M
aint
enan
ce42
Prin
Mgr
, Ene
rgy
Effic
ienc
y Po
rtEE
C00
0_M
4_E
218
0TW
-MM
-EN
GY
ED
E00
0 - M
4E
nerg
y C
onse
rvat
ion-
Mul
ti12
TW-M
M-G
EN
AM
K07
0 - M
4A
MK
070
Bran
d M
ktg
238
40A
on H
ewitt
42
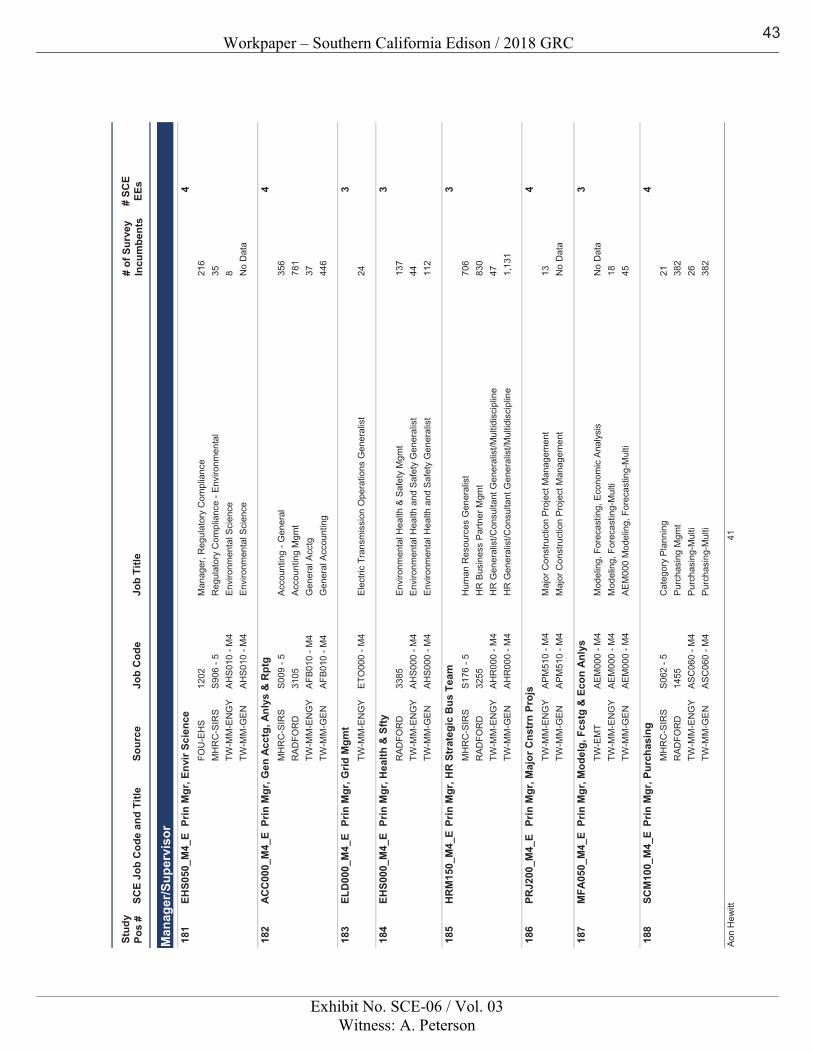
Workpaper – Southern California Edison / 2018 GRC
Exhibit No. SCE-06 / Vol. 03Witness: A. Peterson
Sour
ceJo
b C
ode
Job
Title
SCE
Job
Cod
e an
d Ti
tle#
of S
urve
yIn
cum
bent
s#
SCE
EEs
Stud
y Po
s #
Man
ager
/Sup
ervi
sor Pr
in M
gr, E
nvir
Scie
nce
EHS0
50_M
4_E
418
1FO
U-E
HS
1202
Man
ager
, Reg
ulat
ory
Com
plia
nce
216
MH
RC
-SIR
SS
906
- 5R
egul
ator
y C
ompl
ianc
e - E
nviro
nmen
tal
35TW
-MM
-EN
GY
AH
S01
0 - M
4E
nviro
nmen
tal S
cien
ce8
TW-M
M-G
EN
AH
S01
0 - M
4E
nviro
nmen
tal S
cien
ceN
o D
ata
Prin
Mgr
, Gen
Acc
tg, A
nlys
& R
ptg
ACC
000_
M4_
E4
182
MH
RC
-SIR
SS
009
- 5A
ccou
ntin
g - G
ener
al35
6R
AD
FOR
D31
05A
ccou
ntin
g M
gmt
781
TW-M
M-E
NG
YA
FB01
0 - M
4G
ener
al A
cctg
37TW
-MM
-GE
NA
FB01
0 - M
4G
ener
al A
ccou
ntin
g44
6
Prin
Mgr
, Grid
Mgm
tEL
D00
0_M
4_E
318
3TW
-MM
-EN
GY
ETO
000
- M4
Ele
ctric
Tra
nsm
issi
on O
pera
tions
Gen
eral
ist
24
Prin
Mgr
, Hea
lth &
Sfty
EHS0
00_M
4_E
318
4R
AD
FOR
D33
85E
nviro
nmen
tal H
ealth
& S
afet
y M
gmt
137
TW-M
M-E
NG
YA
HS
000
- M4
Env
ironm
enta
l Hea
lth a
nd S
afet
y G
ener
alis
t44
TW-M
M-G
EN
AH
S00
0 - M
4E
nviro
nmen
tal H
ealth
and
Saf
ety
Gen
eral
ist
112
Prin
Mgr
, HR
Str
ateg
ic B
us T
eam
HR
M15
0_M
4_E
318
5M
HR
C-S
IRS
S17
6 - 5
Hum
an R
esou
rces
Gen
eral
ist
706
RA
DFO
RD
3255
HR
Bus
ines
s Pa
rtner
Mgm
t83
0TW
-MM
-EN
GY
AH
R00
0 - M
4H
R G
ener
alis
t/Con
sulta
nt G
ener
alis
t/Mul
tidis
cipl
ine
47TW
-MM
-GE
NA
HR
000
- M4
HR
Gen
eral
ist/C
onsu
ltant
Gen
eral
ist/M
ultid
isci
plin
e1,
131
Prin
Mgr
, Maj
or C
nstr
n Pr
ojs
PRJ2
00_M
4_E
418
6TW
-MM
-EN
GY
AP
M51
0 - M
4M
ajor
Con
stru
ctio
n P
roje
ct M
anag
emen
t13
TW-M
M-G
EN
AP
M51
0 - M
4M
ajor
Con
stru
ctio
n P
roje
ct M
anag
emen
tN
o D
ata
Prin
Mgr
, Mod
elg,
Fcs
tg &
Eco
n An
lys
MFA
050_
M4_
E3
187
TW-E
MT
AE
M00
0 - M
4M
odel
ing,
For
ecas
ting,
Eco
nom
ic A
naly
sis
No
Dat
aTW
-MM
-EN
GY
AE
M00
0 - M
4M
odel
ing,
For
ecas
ting-
Mul
ti18
TW-M
M-G
EN
AE
M00
0 - M
4A
EM
000
Mod
elin
g, F
orec
astin
g-M
ulti
45
Prin
Mgr
, Pur
chas
ing
SCM
100_
M4_
E4
188
MH
RC
-SIR
SS
062
- 5C
ateg
ory
Pla
nnin
g21
RA
DFO
RD
1455
Purc
hasi
ng M
gmt
382
TW-M
M-E
NG
YA
SC
060
- M4
Pur
chas
ing-
Mul
ti26
TW-M
M-G
EN
AS
C06
0 - M
4P
urch
asin
g-M
ulti
382
41A
on H
ewitt
43
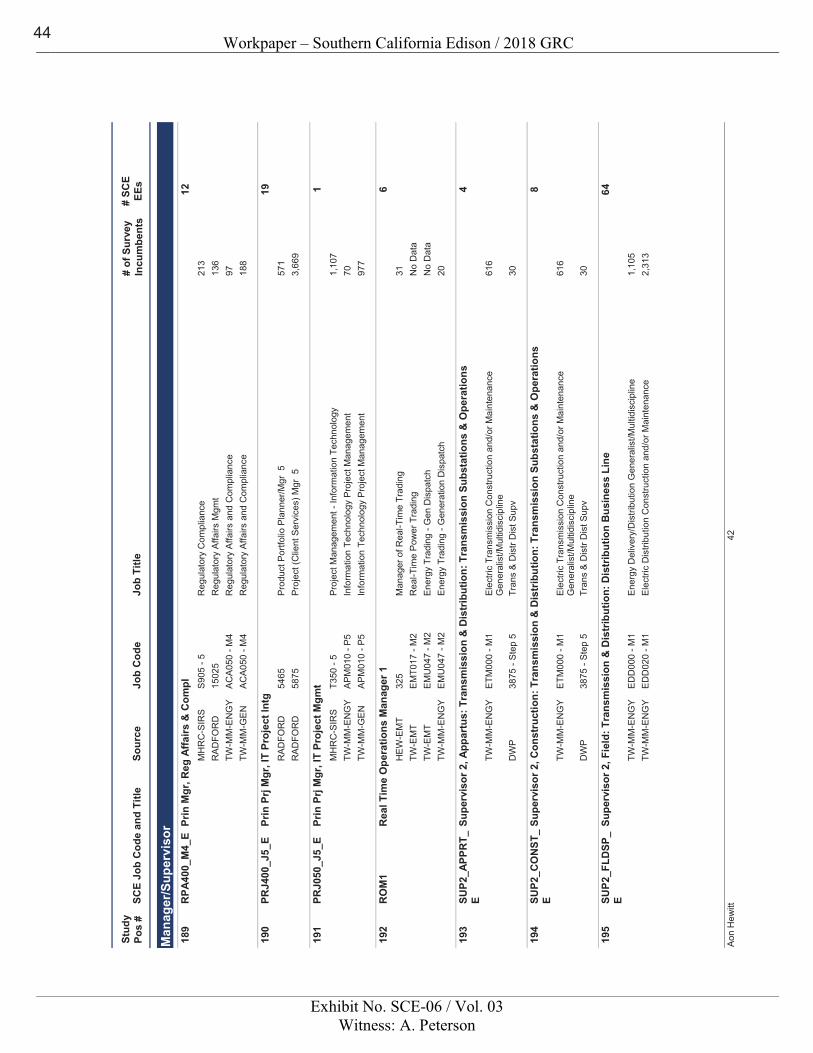
Workpaper – Southern California Edison / 2018 GRC
Exhibit No. SCE-06 / Vol. 03Witness: A. Peterson
Sour
ceJo
b C
ode
Job
Title
SCE
Job
Cod
e an
d Ti
tle#
of S
urve
yIn
cum
bent
s#
SCE
EEs
Stud
y Po
s #
Man
ager
/Sup
ervi
sor Pr
in M
gr, R
eg A
ffairs
& C
ompl
RPA
400_
M4_
E12
189
MH
RC
-SIR
SS
905
- 5R
egul
ator
y C
ompl
ianc
e21
3R
AD
FOR
D15
025
Reg
ulat
ory
Affa
irs M
gmt
136
TW-M
M-E
NG
YA
CA
050
- M4
Reg
ulat
ory
Affa
irs a
nd C
ompl
ianc
e97
TW-M
M-G
EN
AC
A05
0 - M
4R
egul
ator
y A
ffairs
and
Com
plia
nce
188
Prin
Prj
Mgr
, IT
Proj
ect I
ntg
PRJ4
00_J
5_E
1919
0R
AD
FOR
D54
65P
rodu
ct P
ortfo
lio P
lann
er/M
gr 5
571
RA
DFO
RD
5875
Pro
ject
(Clie
nt S
ervi
ces)
Mgr
53,
669
Prin
Prj
Mgr
, IT
Proj
ect M
gmt
PRJ0
50_J
5_E
119
1M
HR
C-S
IRS
T350
- 5
Pro
ject
Man
agem
ent -
Info
rmat
ion
Tech
nolo
gy1,
107
TW-M
M-E
NG
YA
PM
010
- P5
Info
rmat
ion
Tech
nolo
gy P
roje
ct M
anag
emen
t70
TW-M
M-G
EN
AP
M01
0 - P
5In
form
atio
n Te
chno
logy
Pro
ject
Man
agem
ent
977
Rea
l Tim
e O
pera
tions
Man
ager
1R
OM
16
192
HE
W-E
MT
325
Man
ager
of R
eal-T
ime
Trad
ing
31TW
-EM
TE
MT0
17 -
M2
Rea
l-Tim
e P
ower
Tra
ding
No
Dat
aTW
-EM
TE
MU
047
- M2
Ene
rgy
Trad
ing
- Gen
Dis
patc
hN
o D
ata
TW-M
M-E
NG
YE
MU
047
- M2
Ene
rgy
Trad
ing
- Gen
erat
ion
Dis
patc
h20
Supe
rvis
or 2
, App
artu
s: T
rans
mis
sion
& D
istr
ibut
ion:
Tra
nsm
issi
on S
ubst
atio
ns &
Ope
ratio
nsSU
P2_A
PPR
T_E
419
3
TW-M
M-E
NG
YE
TM00
0 - M
1E
lect
ric T
rans
mis
sion
Con
stru
ctio
n an
d/or
Mai
nten
ance
G
ener
alis
t/Mul
tidis
cipl
ine
616
DW
P38
75 -
Ste
p 5
Tran
s &
Dis
tr D
ist S
upv
30
Supe
rvis
or 2
, Con
stru
ctio
n: T
rans
mis
sion
& D
istr
ibut
ion:
Tra
nsm
issi
on S
ubst
atio
ns &
Ope
ratio
nsSU
P2_C
ON
ST_
E8
194
TW-M
M-E
NG
YE
TM00
0 - M
1E
lect
ric T
rans
mis
sion
Con
stru
ctio
n an
d/or
Mai
nten
ance
G
ener
alis
t/Mul
tidis
cipl
ine
616
DW
P38
75 -
Ste
p 5
Tran
s &
Dis
tr D
ist S
upv
30
Supe
rvis
or 2
, Fie
ld: T
rans
mis
sion
& D
istr
ibut
ion:
Dis
trib
utio
n B
usin
ess
Line
SUP2
_FLD
SP_
E64
195
TW-M
M-E
NG
YE
DD
000
- M1
Ene
rgy
Del
iver
y/D
istri
butio
n G
ener
alis
t/Mul
tidis
cipl
ine
1,10
5TW
-MM
-EN
GY
ED
D02
0 - M
1E
lect
ric D
istri
butio
n C
onst
ruct
ion
and/
or M
aint
enan
ce2,
313
42A
on H
ewitt
44
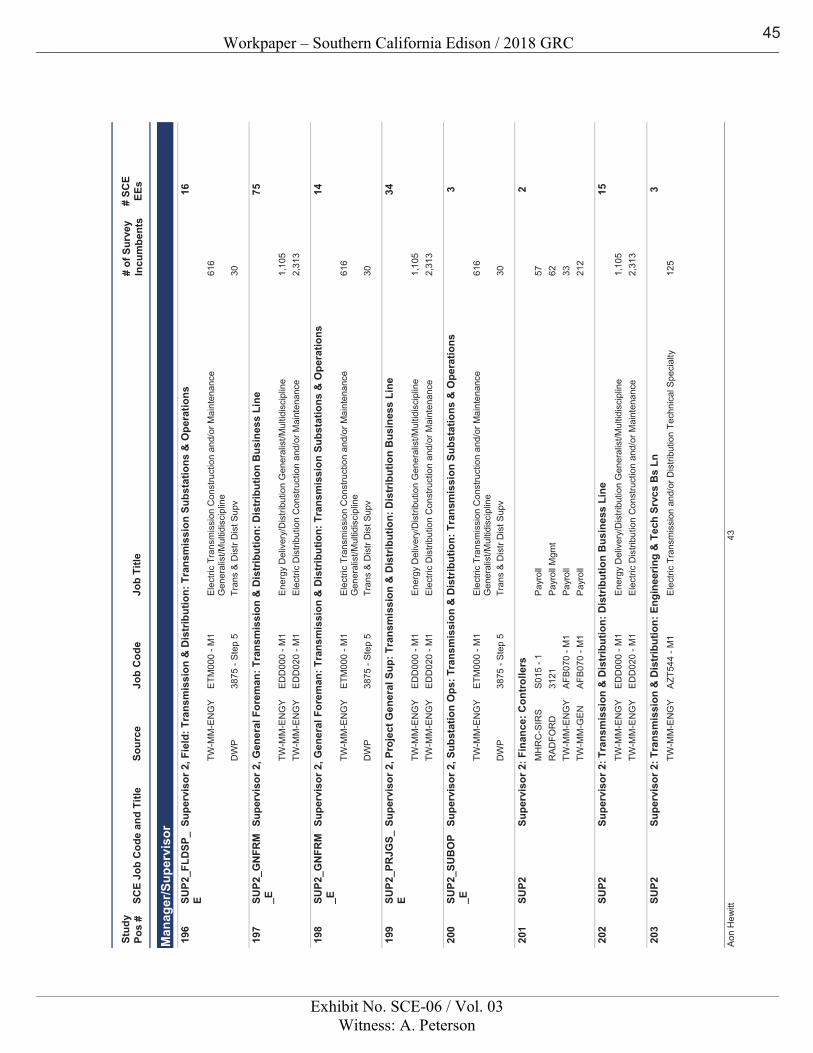
Workpaper – Southern California Edison / 2018 GRC
Exhibit No. SCE-06 / Vol. 03Witness: A. Peterson
Sour
ceJo
b C
ode
Job
Title
SCE
Job
Cod
e an
d Ti
tle#
of S
urve
yIn
cum
bent
s#
SCE
EEs
Stud
y Po
s #
Man
ager
/Sup
ervi
sor Su
perv
isor
2, F
ield
: Tra
nsm
issi
on &
Dis
trib
utio
n: T
rans
mis
sion
Sub
stat
ions
& O
pera
tions
SUP2
_FLD
SP_
E16
196
TW-M
M-E
NG
YE
TM00
0 - M
1E
lect
ric T
rans
mis
sion
Con
stru
ctio
n an
d/or
Mai
nten
ance
G
ener
alis
t/Mul
tidis
cipl
ine
616
DW
P38
75 -
Ste
p 5
Tran
s &
Dis
tr D
ist S
upv
30
Supe
rvis
or 2
, Gen
eral
For
eman
: Tra
nsm
issi
on &
Dis
trib
utio
n: D
istr
ibut
ion
Bus
ines
s Li
neSU
P2_G
NFR
M_E
7519
7
TW-M
M-E
NG
YE
DD
000
- M1
Ene
rgy
Del
iver
y/D
istri
butio
n G
ener
alis
t/Mul
tidis
cipl
ine
1,10
5TW
-MM
-EN
GY
ED
D02
0 - M
1E
lect
ric D
istri
butio
n C
onst
ruct
ion
and/
or M
aint
enan
ce2,
313
Supe
rvis
or 2
, Gen
eral
For
eman
: Tra
nsm
issi
on &
Dis
trib
utio
n: T
rans
mis
sion
Sub
stat
ions
& O
pera
tions
SUP2
_GN
FRM
_E14
198
TW-M
M-E
NG
YE
TM00
0 - M
1E
lect
ric T
rans
mis
sion
Con
stru
ctio
n an
d/or
Mai
nten
ance
G
ener
alis
t/Mul
tidis
cipl
ine
616
DW
P38
75 -
Ste
p 5
Tran
s &
Dis
tr D
ist S
upv
30
Supe
rvis
or 2
, Pro
ject
Gen
eral
Sup
: Tra
nsm
issi
on &
Dis
trib
utio
n: D
istr
ibut
ion
Bus
ines
s Li
neSU
P2_P
RJG
S_E
3419
9
TW-M
M-E
NG
YE
DD
000
- M1
Ene
rgy
Del
iver
y/D
istri
butio
n G
ener
alis
t/Mul
tidis
cipl
ine
1,10
5TW
-MM
-EN
GY
ED
D02
0 - M
1E
lect
ric D
istri
butio
n C
onst
ruct
ion
and/
or M
aint
enan
ce2,
313
Supe
rvis
or 2
, Sub
stat
ion
Ops
: Tra
nsm
issi
on &
Dis
trib
utio
n: T
rans
mis
sion
Sub
stat
ions
& O
pera
tions
SUP2
_SU
BO
P_E
320
0
TW-M
M-E
NG
YE
TM00
0 - M
1E
lect
ric T
rans
mis
sion
Con
stru
ctio
n an
d/or
Mai
nten
ance
G
ener
alis
t/Mul
tidis
cipl
ine
616
DW
P38
75 -
Ste
p 5
Tran
s &
Dis
tr D
ist S
upv
30
Supe
rvis
or 2
: Fin
ance
: Con
trol
lers
SUP2
220
1M
HR
C-S
IRS
S01
5 - 1
Pay
roll
57R
AD
FOR
D31
21Pa
yrol
l Mgm
t 62
TW-M
M-E
NG
YA
FB07
0 - M
1P
ayro
ll33
TW-M
M-G
EN
AFB
070
- M1
Pay
roll
212
Supe
rvis
or 2
: Tra
nsm
issi
on &
Dis
trib
utio
n: D
istr
ibut
ion
Bus
ines
s Li
neSU
P215
202
TW-M
M-E
NG
YE
DD
000
- M1
Ene
rgy
Del
iver
y/D
istri
butio
n G
ener
alis
t/Mul
tidis
cipl
ine
1,10
5TW
-MM
-EN
GY
ED
D02
0 - M
1E
lect
ric D
istri
butio
n C
onst
ruct
ion
and/
or M
aint
enan
ce2,
313
Supe
rvis
or 2
: Tra
nsm
issi
on &
Dis
trib
utio
n: E
ngin
eerin
g &
Tec
h Sr
vcs
Bs
LnSU
P23
203
TW-M
M-E
NG
YA
ZT54
4 - M
1E
lect
ric T
rans
mis
sion
and
/or D
istri
butio
n Te
chni
cal S
peci
alty
125
43A
on H
ewitt
45
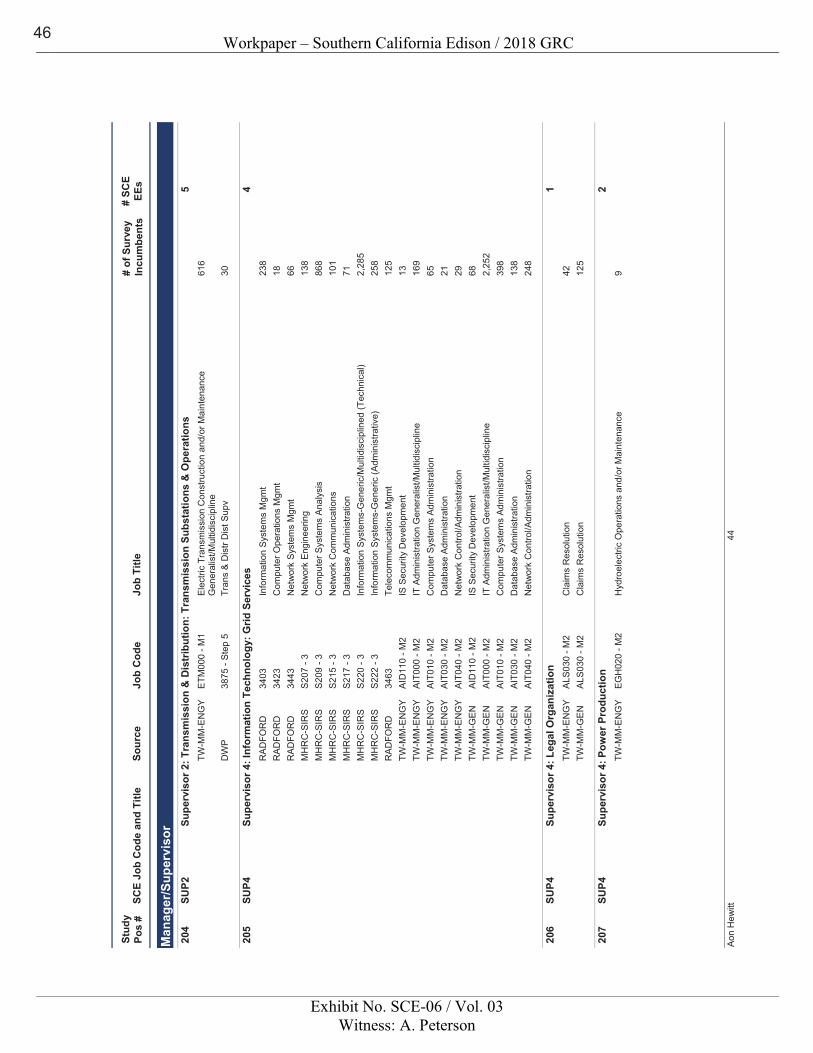
Workpaper – Southern California Edison / 2018 GRC
Exhibit No. SCE-06 / Vol. 03Witness: A. Peterson
Sour
ceJo
b C
ode
Job
Title
SCE
Job
Cod
e an
d Ti
tle#
of S
urve
yIn
cum
bent
s#
SCE
EEs
Stud
y Po
s #
Man
ager
/Sup
ervi
sor Su
perv
isor
2: T
rans
mis
sion
& D
istr
ibut
ion:
Tra
nsm
issi
on S
ubst
atio
ns &
Ope
ratio
nsSU
P25
204
TW-M
M-E
NG
YE
TM00
0 - M
1E
lect
ric T
rans
mis
sion
Con
stru
ctio
n an
d/or
Mai
nten
ance
G
ener
alis
t/Mul
tidis
cipl
ine
616
DW
P38
75 -
Ste
p 5
Tran
s &
Dis
tr D
ist S
upv
30
Supe
rvis
or 4
: Inf
orm
atio
n Te
chno
logy
: Grid
Ser
vice
sSU
P44
205
RA
DFO
RD
3403
Info
rmat
ion
Syst
ems
Mgm
t 23
8R
AD
FOR
D34
23C
ompu
ter O
pera
tions
Mgm
t 18
RA
DFO
RD
3443
Net
wor
k Sy
stem
s M
gmt
66M
HR
C-S
IRS
S20
7 - 3
Net
wor
k E
ngin
eerin
g13
8M
HR
C-S
IRS
S20
9 - 3
Com
pute
r Sys
tem
s An
alys
is86
8M
HR
C-S
IRS
S21
5 - 3
Net
wor
k C
omm
unic
atio
ns10
1M
HR
C-S
IRS
S217
- 3
Dat
abas
e Ad
min
istra
tion
71M
HR
C-S
IRS
S22
0 - 3
Info
rmat
ion
Syst
ems-
Gen
eric
/Mul
tidis
cipl
ined
(Tec
hnic
al)
2,28
5M
HR
C-S
IRS
S22
2 - 3
Info
rmat
ion
Syst
ems-
Gen
eric
(Adm
inis
trativ
e)25
8R
AD
FOR
D34
63Te
leco
mm
unic
atio
ns M
gmt
125
TW-M
M-E
NG
YA
ID11
0 - M
2IS
Sec
urity
Dev
elop
men
t13
TW-M
M-E
NG
YA
IT00
0 - M
2IT
Adm
inis
tratio
n G
ener
alis
t/Mul
tidis
cipl
ine
169
TW-M
M-E
NG
YA
IT01
0 - M
2C
ompu
ter S
yste
ms
Adm
inis
tratio
n65
TW-M
M-E
NG
YA
IT03
0 - M
2D
atab
ase
Adm
inis
tratio
n21
TW-M
M-E
NG
YA
IT04
0 - M
2N
etw
ork
Con
trol/A
dmin
istra
tion
29TW
-MM
-GE
NA
ID11
0 - M
2IS
Sec
urity
Dev
elop
men
t68
TW-M
M-G
EN
AIT
000
- M2
IT A
dmin
istra
tion
Gen
eral
ist/M
ultid
isci
plin
e2,
252
TW-M
M-G
EN
AIT
010
- M2
Com
pute
r Sys
tem
s Ad
min
istra
tion
398
TW-M
M-G
ENAI
T030
- M
2D
atab
ase
Adm
inis
tratio
n13
8TW
-MM
-GEN
AIT0
40 -
M2
Net
wor
k C
ontro
l/Adm
inis
tratio
n24
8
Supe
rvis
or 4
: Leg
al O
rgan
izat
ion
SUP4
120
6TW
-MM
-EN
GY
ALS
030
- M2
Cla
ims
Res
olut
ion
42TW
-MM
-GE
NA
LS03
0 - M
2C
laim
s R
esol
utio
n12
5
Supe
rvis
or 4
: Pow
er P
rodu
ctio
nSU
P42
207
TW-M
M-E
NG
YE
GH
020
- M2
Hyd
roel
ectri
c O
pera
tions
and
/or M
aint
enan
ce9
44A
on H
ewitt
46
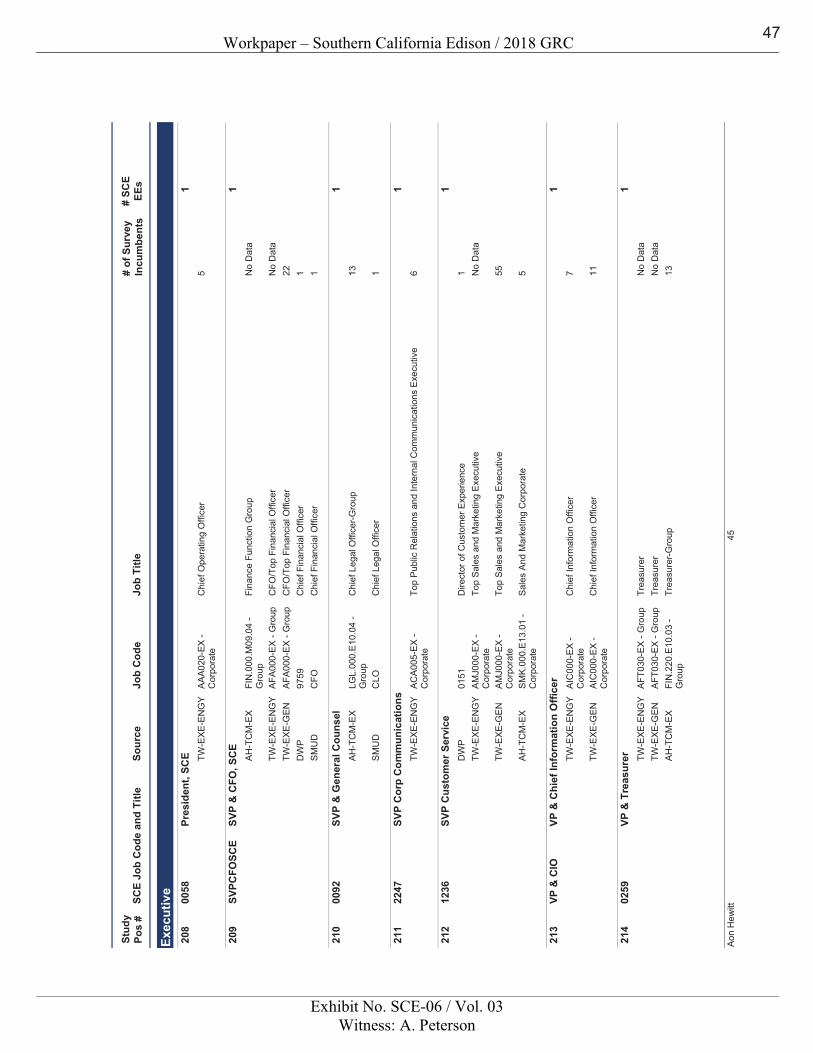
Workpaper – Southern California Edison / 2018 GRC
Exhibit No. SCE-06 / Vol. 03Witness: A. Peterson
Sour
ceJo
b C
ode
Job
Title
SCE
Job
Cod
e an
d Ti
tle#
of S
urve
yIn
cum
bent
s#
SCE
EEs
Stud
y Po
s #
Exec
utiv
ePr
esid
ent,
SCE
0058
120
8TW
-EXE
-EN
GY
AAA0
20-E
X -
Cor
pora
teC
hief
Ope
ratin
g O
ffice
r5
SVP
& C
FO, S
CE
SVPC
FOSC
E1
209
AH-T
CM
-EX
FIN
.000
.M09
.04
- G
roup
Fina
nce
Func
tion
Gro
upN
o D
ata
TW-E
XE
-EN
GY
AFA
000-
EX
- G
roup
CFO
/Top
Fin
anci
al O
ffice
rN
o D
ata
TW-E
XE
-GE
NA
FA00
0-E
X -
Gro
upC
FO/T
op F
inan
cial
Offi
cer
22D
WP
9759
Chi
ef F
inan
cial
Offi
cer
1S
MU
DC
FOC
hief
Fin
anci
al O
ffice
r1
SVP
& G
ener
al C
ouns
el00
921
210
AH-T
CM
-EX
LGL.
000.
E10.
04 -
Gro
upC
hief
Leg
al O
ffice
r-Gro
up13
SM
UD
CLO
Chi
ef L
egal
Offi
cer
1
SVP
Cor
p C
omm
unic
atio
ns22
471
211
TW-E
XE-E
NG
YAC
A005
-EX
- C
orpo
rate
Top
Pub
lic R
elat
ions
and
Inte
rnal
Com
mun
icat
ions
Exe
cutiv
e6
SVP
Cus
tom
er S
ervi
ce12
361
212
DW
P01
51D
irect
or o
f Cus
tom
er E
xper
ienc
e1
TW-E
XE-E
NG
YAM
J000
-EX
- C
orpo
rate
Top
Sal
es a
nd M
arke
ting
Exe
cutiv
eN
o D
ata
TW-E
XE-G
ENAM
J000
-EX
- C
orpo
rate
Top
Sal
es a
nd M
arke
ting
Exe
cutiv
e55
AH
-TC
M-E
XS
MK
.000
.E13
.01
- C
orpo
rate
Sal
es A
nd M
arke
ting
Cor
pora
te5
VP &
Chi
ef In
form
atio
n O
ffice
rVP
& C
IO1
213
TW-E
XE-E
NG
YAI
C00
0-EX
- C
orpo
rate
Chi
ef In
form
atio
n O
ffice
r7
TW-E
XE
-GE
NA
IC00
0-EX
- C
orpo
rate
Chi
ef In
form
atio
n O
ffice
r11
VP &
Tre
asur
er02
591
214
TW-E
XE-E
NG
YAF
T030
-EX
- Gro
upTr
easu
rer
No
Dat
aTW
-EXE
-GEN
AFT0
30-E
X - G
roup
Trea
sure
rN
o D
ata
AH-T
CM
-EX
FIN
.220
.E10
.03
- G
roup
Trea
sure
r-Gro
up13
45A
on H
ewitt
47
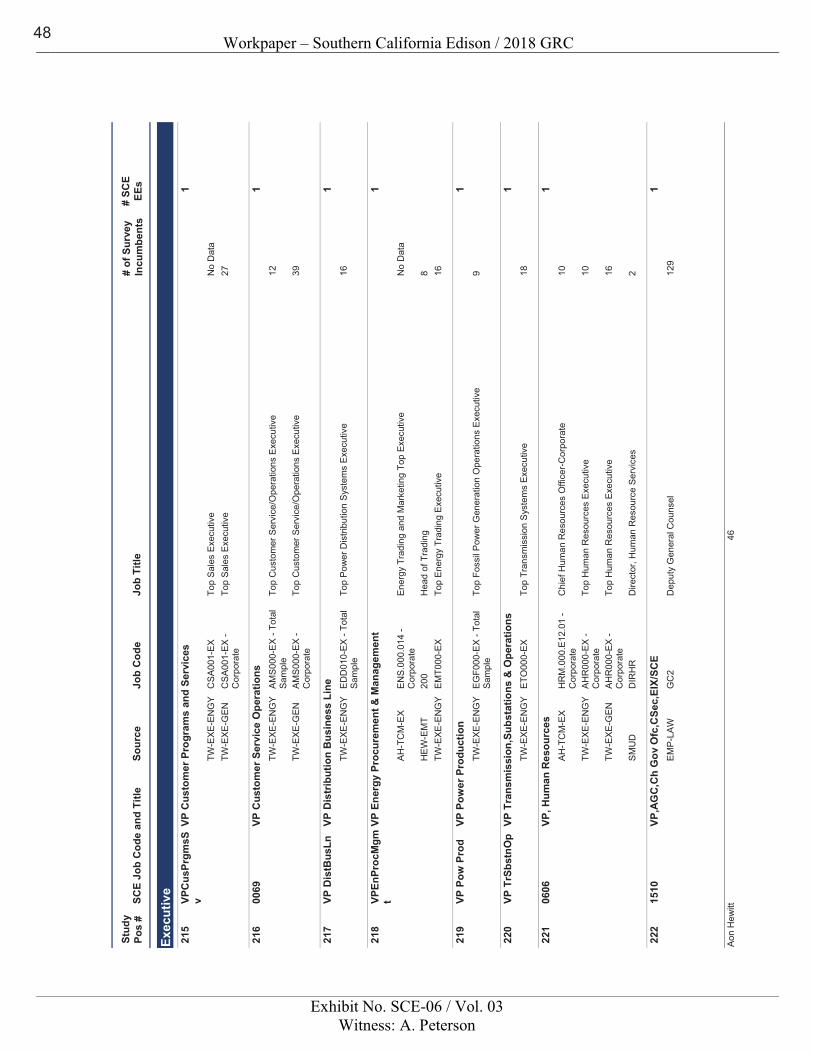
Workpaper – Southern California Edison / 2018 GRC
Exhibit No. SCE-06 / Vol. 03Witness: A. Peterson
Sour
ceJo
b C
ode
Job
Title
SCE
Job
Cod
e an
d Ti
tle#
of S
urve
yIn
cum
bent
s#
SCE
EEs
Stud
y Po
s #
Exec
utiv
eVP
Cus
tom
er P
rogr
ams
and
Serv
ices
VPC
usPr
gmsS
v1
215
TW-E
XE
-EN
GY
CS
A00
1-E
XTo
p S
ales
Exe
cutiv
eN
o D
ata
TW-E
XE
-GE
NC
SA
001-
EX
- C
orpo
rate
Top
Sale
s Ex
ecut
ive
27
VP C
usto
mer
Ser
vice
Ope
ratio
ns00
691
216
TW-E
XE
-EN
GY
AM
S00
0-E
X -
Tota
l S
ampl
eTo
p C
usto
mer
Ser
vice
/Ope
ratio
ns E
xecu
tive
12
TW-E
XE
-GE
NA
MS
000-
EX
- C
orpo
rate
Top
Cus
tom
er S
ervi
ce/O
pera
tions
Exe
cutiv
e39
VP D
istr
ibut
ion
Bus
ines
s Li
neVP
Dis
tBus
Ln1
217
TW-E
XE
-EN
GY
ED
D01
0-E
X -
Tota
l S
ampl
eTo
p P
ower
Dis
tribu
tion
Syst
ems
Exe
cutiv
e16
VP E
nerg
y Pr
ocur
emen
t & M
anag
emen
tVP
EnPr
ocM
gmt
121
8
AH-T
CM
-EX
ENS.
000.
014
- C
orpo
rate
Ene
rgy
Trad
ing
and
Mar
ketin
g To
p E
xecu
tive
No
Dat
a
HE
W-E
MT
200
Hea
d of
Tra
ding
8TW
-EX
E-E
NG
YE
MT0
00-E
XTo
p E
nerg
y Tr
adin
g E
xecu
tive
16
VP P
ower
Pro
duct
ion
VP P
ow P
rod
121
9TW
-EX
E-E
NG
YE
GF0
00-E
X - T
otal
S
ampl
eTo
p Fo
ssil
Pow
er G
ener
atio
n O
pera
tions
Exe
cutiv
e9
VP T
rans
mis
sion
,Sub
stat
ions
& O
pera
tions
VP T
rSbs
tnO
p1
220
TW-E
XE
-EN
GY
ETO
000-
EX
Top
Tran
smis
sion
Sys
tem
s Ex
ecut
ive
18
VP, H
uman
Res
ourc
es06
061
221
AH
-TC
M-E
XH
RM
.000
.E12
.01
- C
orpo
rate
Chi
ef H
uman
Res
ourc
es O
ffice
r-C
orpo
rate
10
TW-E
XE-E
NG
YAH
R00
0-EX
- C
orpo
rate
Top
Hum
an R
esou
rces
Exe
cutiv
e10
TW-E
XE
-GE
NA
HR
000-
EX
- C
orpo
rate
Top
Hum
an R
esou
rces
Exe
cutiv
e16
SMU
DD
IRH
RD
irect
or, H
uman
Res
ourc
e Se
rvic
es2
VP,A
GC
,Ch
Gov
Ofc
,CSe
c,EI
X/SC
E15
101
222
EM
P-L
AW
GC
2D
eput
y G
ener
al C
ouns
el12
9
46A
on H
ewitt
48