2018 - CIB
287
ANNUAL REPORT THE FIRST EQUATOR BANK IN CHINA
Transcript of 2018 - CIB
2018IN
DU
STRIAL BAN
K CO
.,LTD.
AN
NU
AL R
EP
OR
T
GREAT BANK LEADS TO A GREAT LIFE
Add: No. 154 Hudong Road, Fuzhou, Fujian, P.R.CT e l : (86)591-87839338F a x : (86)591-87842633P. C : 350003www.cib.com.cn
A N N U A L R E P O R TTHE FIRST EQUATOR BANK IN CHINA
2018 ANNUAL REPORT
01
Important Notice
The Company’s Board of Directors, Board of Supervisors, directors, supervisors and senior management members hereby warrant that the information contained in this report is free from false representation, misleading statement or material omission, and assume joint and several liabilities.
The Company’s 2018 annual report and its abstract were reviewed and approved at the 14th meeting of the 9th session of the Board of Directors on April 29, 2019.
The financial data and indicators contained in this annual report were prepared in compliance with the PRC Generally Accepted Accounting Principles. Unless otherwise specified, they represented the consolidated data. The monetary sums expressed in RMB in this annual report.
Deloitte Touche Tohmatsu Certified Public Accountants LLP has audited the Company’s 2018 financial statements in accordance with the Chinese Auditing Standards (“CAS”) and has issued a standard auditors’ report with unqualified opinions.
The Company’s chairman Gao Jianping, president Tao Yiping and general manager of the financial department Lai Furong hereby warrant that the financial statements in the 2018 annual report are true, accurate and complete.
The plan of dividends distribution for ordinary shares for the reporting period considered by the Board of Directors: based on the total capital of 20,774,190,751 shares, cash dividend of RMB6.9 (inclusive of tax) should be distributed for every 10 ordinary shares.
The plan of dividends distribution for preferred shares is as follows: proposed dividends for preferred shares are RMB1.482 billion in total. Of which, the total nominal value of the preferred shares of “Industrial Bank P1” is RMB13 billion, and proposed dividends to be paid for 2018 are RMB780 million with an annual dividend yield of 6%; the total nominal value of the preferred shares of “Industrial Bank P2” is RMB13 billion, and proposed dividends to be paid for 2018 are RMB702 million with an annual dividend yield of 5.40%.
Investors are advised to read the full content of this annual report carefully. Perspective and forward-looking statements regarding future financial conditions, operating performance, business development and business plan contained in this report do not constitute any substantive commitment of the Company to investors. Investors should pay attention to investment risks.
The Board of Directors specially reminds investors that the risk factors the Company is subject to have been listed in detail in this report. Please refer to “Operation Discussion and Analysis” for risk factor the Company is subject to and the risk management analysis.

INDUSTRIAL BANK
02
2018 ANNUAL REPORT
03
The year 2018 marks the 40th anniversary of China’s reform and opening up, as well as the 30th anniversary of Industrial Bank. In this landmark year, we thought long and hard about our future while relishing the thirtieth birthday of the Bank. Looking back, we believe the best commemoration of the past is to promote transformation and development with greater determination and strength in our quest to become a “first-class bank, everlasting CIB”.
History Paves the Way for the Future
Over the past 30 years, Industrial Bank has risen from a grass root company in Southeast China founded in a sparsely decorated office in accordance with an approval letter, with registered capital of RMB500 million and 60 employees, to a major banking group with prominent presence in the financial market of China, ranking among top national joint stock commercial banks in China, top 30 banks in the world, and top 500 companies globally, leaving a bright mark in the history of the rise of China’s national financial industry. This feat cannot be achieved without this great era of reform and opening up and the long-standing cares and support of many people, as well as the unwaveringly rational, practical, and aggressive efforts of those at Industrial Bank. We hereby pay our tribute to the great era, and express our sincere gratitude towards our customers, investors, Party and government agencies at all levels, and people from various sectors.
Over the past 30 years, we always rode with the tides and grasped the overall situation, adhered to differentiated development through exploration and innovation, maintained robust and compliant operations, improved ourselves through systematic reforms, and upheld our missions and responsibilities to the country. We have amassed invaluable spiritual and cultural wealth, and given unequivocal answers to the “Questions for CIB”. We have become an epitome of the spirit and culture of the era of reform and opening up.
The Present Anchors the Starting Point of the Future Journey
In 2018, upholding our 30 years of sound tradition, we calmly coped with an external situation that was stable but with alarming changes, and continued to maintain a stable and progressive development momentum, steadily growing from “5 x 5” to “6 x 6”, i.e. total assets exceeding RMB6 trillion, capital approximating RMB600 billion, net assets exceeding RMB60 billion, the number of employees exceeding 60 thousand, the number of enterprise customers exceeding 600 thousand, and the number of retail customers exceeding 60 million. This achievement adds a highlight to our 30-year history, and builds a higher starting point for our future development.
In 2018, we further adhered to our business direction and returned to the essence of service, and proactively fulfilled our social responsibilities. Financing of private enterprises and micro and small enterprises grew rapidly. Green finance and inclusive finance developed at an accelerated pace. By coordinately utilizing the five systems of “industry-based poverty alleviation, product-based poverty alleviation, channel-based poverty alleviation, targeted poverty alleviation, and education-oriented poverty alleviation”, we made constant efforts in projects to improve the wellbeing of the people and in public welfare and charity, thereby consolidating our development foundation.
In 2018, we further optimized our business structure and reformed our business models by steadfastly promoting “commercial banking + investment banking” to improve the overall strength of the Bank. The investment banking and financial market businesses increased financial supply to the real economy to further expand our advantage. The retail business increases rapidly, consolidating our base.
In 2018, we further improved our corporate governance and reformed the institutional systems. We further promoted the concept of “safety first, compliance wins” and established a more rigorous management system for internal control of risks and compliance to continuously tap into our endogenous energy for development.
Strategies Provide Guidance for Our Voyage
A once-in-a-century turbulent situation has just emerged. The call of our era is urging us on. In 2018, we further mapped out our “1234” strategic system, whereas “1” stands for one principal line that is oriented towards light assets, light capital, and high efficiency to strive for improvement while maintaining stability and accelerate transformation; “2” stands for the two major businesses – commercial banking and investment banking, with commercial banking as the main-body and investment banking as the functional arm, carried out in a customer-oriented manner; “3” stands for the three capabilities as a settlement bank, investment bank, and transaction bank to be continuously enhanced; and “4” stands for the four key areas – key branches, key industries, key customers, and key products, the strategic role of which to be strengthened.
The blueprint has been drawn, and the future is around the corner. We will anchor our strategies, and forge ahead with the maturities and poise of a 30-year-old organization to create greater value.
Chairman’s Statement
Chairman:
INDUSTRIAL BANK
04
President’s ReportIn 2018, Industrial Bank adhered to its innate market-oriented nature and persistently developed “commercial banking + investment banking”, entering a new stage of transformation and development in the year of its 30th anniversary.
Our operations were stable and growing, with assets growing by 4.59% year-on-year, non-performing loan ratio decreasing by 0.02 percentage point from the beginning of the year, provision coverage ratio stable at over 200%, and net profit increasing by 5.98% year-on-year. The adjustment and optimization of the assets-liabilities structure reflected by the liquidity indicator bore fruits. The non-interest income, which best reflected the effectiveness of “commercial banking + investment banking”, increased by 21.56% year-on-year. Its proportion in the operating income increased by 2.76 percentage points to 39.57%, driving the growth rate of operating income from negative growth to positive growth. Our Moody International rating was upgraded. We won the China Banking Social Responsibility Award for eight consecutive years, as well as many other honors such as the Best Green Bank and Best Asset Management Bank. These achievements are not only recognition of our past efforts, but also an impetus for us to work harder in the future.
By honing our capabilities in the market and self-reinvention, our business characteristics are more distinct and our business vitality is more vigorous. The annual sales of wealth management and other non-deposit financial products exceeded RMB6 trillion. The underwriting scale and number of debt financing instruments for non-financial enterprises leapt to rank first in the market. Credit bond investment increased by over 200% year-on-year. The trading volume of interest rate bond remained at the forefront of the interbank market. Assets under management of the Group exceeded RMB3 trillion. The scale of wealth management by the Bank rose against the market trend. Net value product increased by 287.88% year-on-year, with its proportion in non-principal-guarantee wealth management products increasing by 36 percentage points from the beginning of the year to 49.60%. The size of assets under custody reached RMB11.61 trillion. FICC (fixed income, currency & commodity) on behalf of the customer increased by 57.68% year-on-year. Members of the Group worked together to continuously enhance our capabilities and provide integrated financial services to our customers.
We firmly adhered to the core principle of “commercial banking + investment banking” to channel the resources of the financial market into the real economy, growing with customers. The coverage over financial institution customers exceeded 90%. Corporate customers and retail customers increased by 13.38% and 23.51%, respectively, among which private banking customers exceeded 30,000, representing an increase of 32.64%. Loans increased by more than RMB500 billion from the beginning of the year, representing an increase of 20.71%. Inclusive loans to small and micro businesses and private enterprises increased by 61.40% and 23.39%, respectively. Industrial Bank became the first Chinese-funded bank to issue green finance bonds in both domestic and overseas markets, and the commercial financial institute with the largest balance of green finance bonds issued in China, with the balance of green finance exceeding RMB800 billion. With retail credit exceeding RMB1 trillion, customers AUM approximating RMB1.8 trillion, and net operating income increasing by 26.48% year-on-year, retail finance has become an important ballast stone against market volatility.
We embraced technology with an open and win-win mentality. With the first Bank-to-Bank Platform in the industry to transform financial technology into a business model, we have established cooperative relations with 1,906 small and medium-sized financial institutions and invited 288 non-bank financial institutions to register on our cloud fund management platform, thereby building a complete financial ecosystem of “co-construction, co-ownership, sharing, and win-win”, enabling resource allocation to be more efficient and financial services to be more inclusive. We fully promoted the construction of an open bank that serves “from B to C, and from one customer to a group of customers”. We have become the leading bank in process robots, providing nearly one hundred API services to customers. Through the “Smart City” platform, we have established deep connections with 499 hospitals, 373 tourist attractions, and 1,371 transportation companies, serving more than 181 million consumers on an accumulated basis. The “Hao Xing Dong” APP cooperated with 20,000 merchants and increased the number of customers with bound cards by tenfold in a year.
In 2018, the year of our 30th anniversary, the business practice laid a solid foundation for our stable and long-term development. Faced with the ever-changing landscape and major revolution, we will continue to create and consolidate differentiated business characteristics and enhance our core competitiveness guided by the “1234” strategic system, so as to contribute more value to our customers and the real economy, and achieve glory for Industrial Bank with our efforts and perseverance.
President:

2018 ANNUAL REPORT
05
INDUSTRIAL BANK
06
Chairman of the Board of Supervisors : Jiang Yunming
2018 ANNUAL REPORT
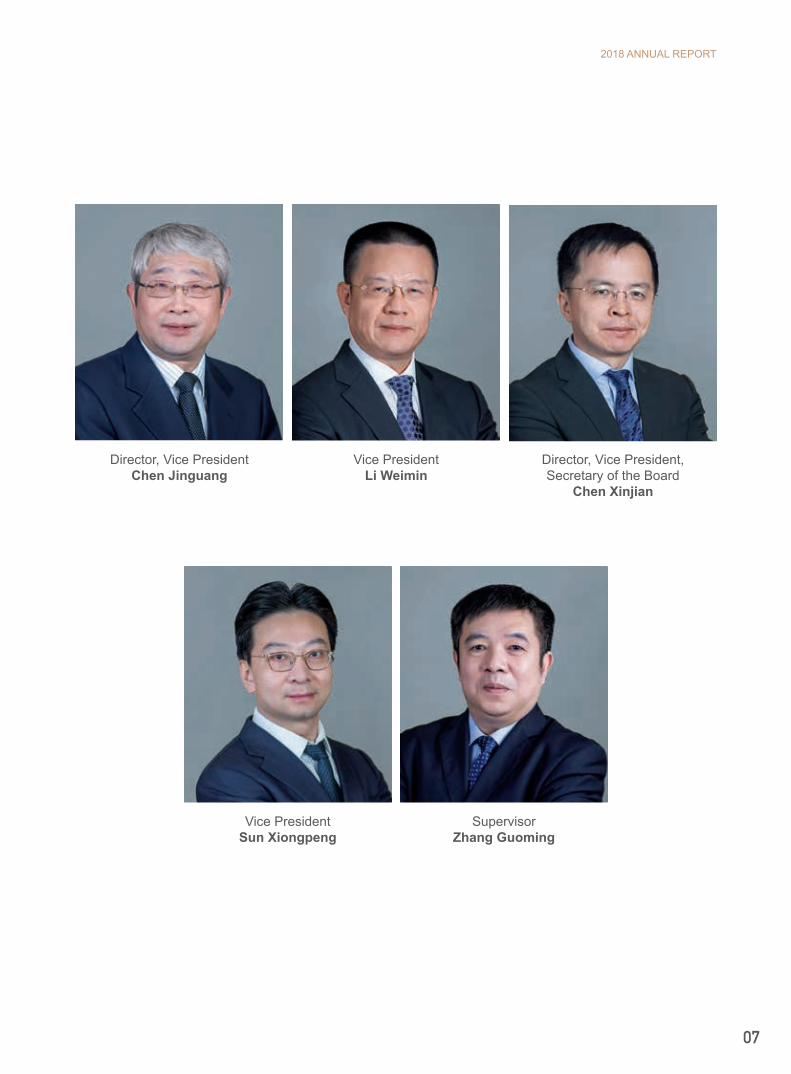
07
Director, Vice PresidentChen Jinguang
Vice PresidentLi Weimin
Vice PresidentSun Xiongpeng
SupervisorZhang Guoming
Director, Vice President, Secretary of the Board
Chen Xinjian

INDUSTRIAL BANK
08
Honors and Awards in 2018
According to the list of "2018 Top 1000 Global Banks” released by the British magazine The Banker, the Company ranked 26th in terms of tier 1 capital and 28th in terms of total assets, up two positions in both categories.
According to the US magazine Forbes' list of “Top 2000 Global Listed Companies” in 2018, the Company ranked 62nd, placing 12th among Mainland Chinese enterprises on the list and 2nd among joint stock banks on the list.
According to the list of "2018 Top 500 Financial Brands" released by the British magazine The Banker and the world-renowned brand value research institution Brand Finance, the Company ranked 20th with a brand value of USD11.972 billion, up 13% from the previous year.
According to the list of "2018 Global Banking & Finance Review Award" published by the internationally prestigious financial magazine Global Banking & Finance Review, the Company won the "2018 Best Retail Bank of China" and the "Best Green Bank of China".
Mr. Gao Jianping, chairman of the Company, was awarded the title of “40 Most Influential Entrepreneurs in Fujian for the 40th Anniversary of Reform and Opening Up”.
Won the "2018 International Pioneering Financial Institution", "2018 Financial Technology Pioneer Institution", "2018 Pioneer Asset Management Bank" and "2018 Pioneer Credit Card Product Award" in "2018 International Pioneer Financial Institution Summit Forum and Awards Ceremony" organized by the International Financial News. Mr. Gao Jianping, chairman of the Company, was awarded the “2018 Pioneer Leader in the Financial Industry”.
Won the "2018 Largest Issuance of Green Bonds in Emerging Markets" award in the 4th "Green Bond Pioneer Awards" of The Climate Bond Initiative.
Won the "Payment Innovation Star" award granted by the US magazine Global Finance.
Won the "2018 Best Innovat ion Pro ject o f China’s Financial Industry" elected by the "2018 Transformation and Innovation Summit Forum of China’s Financial Industry” organized by the International Data Corporation (IDC).
Awarded the “Financial Services Bank of the Year for Listed Companies” by the 2018 Evergreen Awards organized by Caijing magazine.
Won the "2018 Outstanding Contribution Award for Technology Innovation in Financial Industry" in the "2018 China Financial Technology Annual Conference" organized by Financial Computerizing magazine.
Won the "2018 Excellence Board of Directors of the Year of Listed Companies in China" award in the "2018 Asian Industry and Capital Summit" organized by 21st Century Business Herald.
At the Thirteenth Asian Annual Finance Summit and Award Ceremony fo r As ian F inanc ia l Competitiveness, the Company ranked 11th in competitiveness among Asian banks for 2018, placing second among joint stock banks in China, and was awarded the “Excellent Commercial Bank in Asia” and “2018 Asset Management Bank of the Year”.

2018 ANNUAL REPORT
09
Won the "Best Joint Stock Bank of the Year" in the “2018 Golden Dragon Award of Chinese Financial Institution Gold Metal List” granted by Financial Times.
Won the "2018 Financial Holding Group with Excellent Competitiveness” in 2018 Excellent Competitive Financial Institutions elected by China Business News.
Won the "2017-2018 Excellent Joint Stock Bank” in "Excellent Financial Enterprises” elected by the Economic Observer.
At the Four teenth China Corporate Socia l Responsibility International Forum organized by China News Service and China Newsweek, the Company retained the "2018 Responsible Enterprise" title.
Aw a r d e d t h e “ S u s t a i n a b l e D e v e l o p m e n t Demonstration Enterprise” in the “2018 China Corporate Social Responsibility Summit Forum, 2018CSR Competitiveness – China Corporate Social Responsibility” organized by China Business News.
Won the "Green Finance Award” in "2018 China Small and Medium Commercial Bank Pioneer List” elected by National Business Daily.
Won the “Outstanding Contribution Award by the Green Credit Committee” and the “Special Contribution Unit of the Green Credit Textbook Compilation and Review” elected by the Green Credit Committee of the China Banking Association.
Won the "2018 Best Asset Management Bank" award and "2018 Most Popular Financial Management Product” e lected by the 2018 China Asset Management Annual Conference of the 21st Century Business Herald.
Won the "Best Social Responsibility Manager Award of the Year”, the "Green Finance Award of the Year" and the "Special Contribution Outlet of the Year for Social Responsibility” granted by the China Banking Association.
Won the "Best Green Finance Bank of the Year” in the 2018 "China's Excellent Green Finance” elected by Asiamoney.
Won the "Golden Pilot" 2018 Excellent Financial Technology Bank Award and the 2018 Payment Technology Innovation Award in the 2nd China Financial Technology (Golden Pilot) Awards of the 21st Century Business Herald.
Won the "Top Ten Financial Technology Product Innovation Award" and "Top Ten Bank Intelligent Outlet Innovation Award” in "2018 China Financial Innovation Awards" granted by The Banker magazine.
Won the “2018 Junding Award for Investment Bank of All-round Banks in China” and the “2018 Junding Award for Financing Bank of Syndicates in China” by the “2018 Junding Award for Excellent Investment Banks in China” organized by Securities Times.
Won the “2018 Contribution to Ecological Civilization Construction Award” in the first “Green Hills and Clear Waters Forum - Conghua Conference” by the People’s Daily, the State Forestry and Grassland Administration, etc.
INDUSTRIAL BANK
10
Important Notice ........................................................................................................01
Chairman’s Statement ...............................................................................................03
President’s Report .....................................................................................................04
Definitions ..................................................................................................................11
Corporate Profile and Key Financial Indicators .........................................................12
Business Overview of the Company..........................................................................19
Operation Discussion and Analysis ...........................................................................22
Significant Issues.......................................................................................................81
Share Capital Changes and Shareholders of Ordinary Shares ................................91
Matters Regarding Preferred Shares.......................................................................100
Directors, Supervisors, Senior Management Members and Employees .................104
Corporate Governance ............................................................................................118
Financial Statements ...............................................................................................125
Documents Available for Inspection ........................................................................125
Appendix: Auditors' Report and Financial Statements ............................................126
CONTENTS
2018 ANNUAL REPORT
11
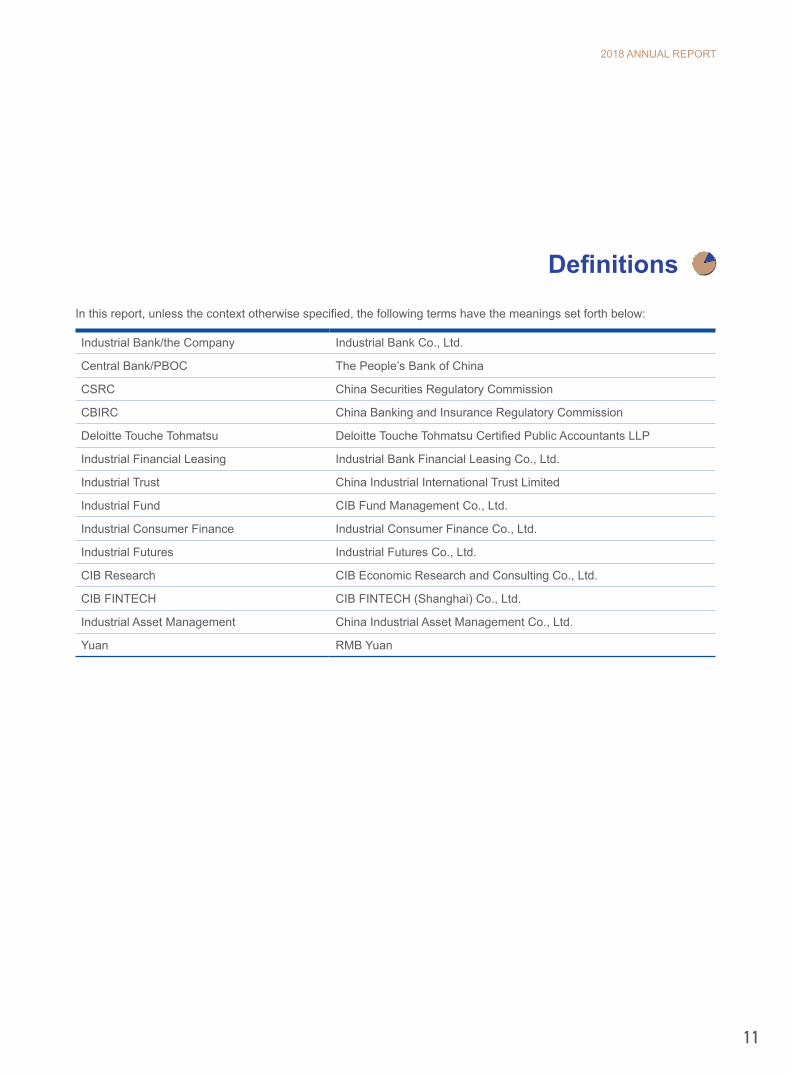
Definitions
In this report, unless the context otherwise specified, the following terms have the meanings set forth below:
Industrial Bank/the Company Industrial Bank Co., Ltd.
Central Bank/PBOC The People’s Bank of China
CSRC China Securities Regulatory Commission
CBIRC China Banking and Insurance Regulatory Commission
Deloitte Touche Tohmatsu Deloitte Touche Tohmatsu Certified Public Accountants LLP
Industrial Financial Leasing Industrial Bank Financial Leasing Co., Ltd.
Industrial Trust China Industrial International Trust Limited
Industrial Fund CIB Fund Management Co., Ltd.
Industrial Consumer Finance Industrial Consumer Finance Co., Ltd.
Industrial Futures Industrial Futures Co., Ltd.
CIB Research CIB Economic Research and Consulting Co., Ltd.
CIB FINTECH CIB FINTECH (Shanghai) Co., Ltd.
Industrial Asset Management China Industrial Asset Management Co., Ltd.
Yuan RMB Yuan

INDUSTRIAL BANK
12
Corporate Profile and Key Financial IndicatorsI. Corporate profile
Legal Chinese name: 兴业银行股份有限公司
(Abbreviation: 兴业银行 )
Legal English name: INDUSTRIAL BANK CO., LTD.
Legal representative: Gao Jianping
Secretary of the Board of Directors: Chen Xinjian
Representative of securities affairs: Lin Wei
Address: 154 Hudong Road, Fuzhou, PRC
Tel: (86) 591-87824863
Fax: (86) 591-87842633
Email: [email protected]
Registered address: 154 Hudong Road, Fuzhou, PRC
Address: 154 Hudong Road, Fuzhou, PRC
Postal Code: 350003
Website: www.cib.com.cn
Designated newspapers for information disclosure: China Securities Journal, Shanghai Securities News, Securities Times, Securities Daily
Website designated by CSRC for publishing annual reports: www.sse.com.cn
Location of annual reports filing: the Company’s office of the Board of Directors

2018 ANNUAL REPORT
13
Company stock brief introduction:
Classes of stock The stock exchange Stock abbreviation Stock code
A shares Shanghai Stock Exchange Industrial Bank 601166
Preferred shares Shanghai Stock Exchange Industrial P1 360005
Preferred shares Shanghai Stock Exchange Industrial P2 360012
Preferred shares Shanghai Stock Exchange Industrial P3 360032
Other related information:
Certified public accountants firm engaged by the Company: Deloitte Touche Tohmatsu Certified Public Accountants LLP
Office address: 30 Floor, Bund Center, 222 Yan An East Road, Shanghai, PRC
Names of the signing accountants: Hu Xiaojun, Zhang Hua
Sponsor performing continuous monitoring (1): Huatai United Securities Co., Ltd.
Office address: 6 Floor, Block A, Fengming International Building, No. 22 Fengsheng Alley, Xicheng District, Beijing
Names of signing representatives of sponsor: Zhou Jiwei, Chen Shi
Period for continuous monitoring: From April 7, 2017 to September 5, 2018
Sponsor performing continuous monitoring (2): GF Securities Co., Ltd.; Industrial Securities Co., Ltd.
Office address: 43 Floor, Metropolitan Plaza, 183 Tianhe North Road, Tianhe District, Guangzhou; No.268 Hudong Road, Fuzhou
Names of signing representatives of sponsor: Ji Gang, Wu Guangbin; Zhang Jun, Yu Xiaoqun
Period for continuous monitoring: From September 6, 2018 to December 31, 2018
This report is prepared in both Chinese and English. Should there be any discrepancy in interpretation, the Chinese version shall prevail.

INDUSTRIAL BANK
14
II. Key accounting data and financial indicators for last three years
(I) Key accounting data and financial indicators
Unit: RMB million
Item 2018 2017 Increase/decrease in 2018 compared with 2017 (%)
2016(Adjusted)
Operating income 158,287 139,975 13.08 157,087
Profit before tax 68,077 64,753 5.13 63,925
Net profit attributable to the shareholders of the parent company 60,620 57,200 5.98 53,850
Net profit attributable to the shareholders of the parent company, after deduction of non-recurring gains and losses
56,041 54,464 2.90 52,399
Basic EPS (RMB) 2.85 2.74 4.01 2.77
Diluted EPS (RMB) 2.85 2.74 4.01 2.77
Basic EPS, after deduction of non-recurring gains and losses (RMB) 2.63 2.60 1.15 2.69
ROA (%) 0.93 0.92 Up 0.01 percentage point 0.95
Weighted average ROE (%) 14.27 15.35 Down 1.08 percentage points 17.28
Weighted average ROE, after deduction of non-recurring gains and losses (%) 13.17 14.59 Down 1.42 percentage points 16.80
Cost-to-income ratio (%) 26.89 27.63 Down 0.74 percentage point 23.39
Cash flows from operating activities (356,099) (162,642) Negative in the same period of last year 203,017
Net cash flow per share from operating activities (RMB) (17.14) (7.83) Negative in the same period
of last year 10.66
Item December 31, 2018
December 31, 2017
Increase/decrease at the end of 2018 compared with the
end of 2017 (%)
December 31, 2016
Total assets 6,711,657 6,416,842 4.59 6,085,895
Shareholders’ equity attributable to the shareholders of the parent company 465,953 416,895 11.77 350,129
Shareholders’ equity attributable to the ordinary shareholders of the parent company 440,048 390,990 12.55 324,224
Net assets per share attributable to the shareholders of the parent company (RMB) 21.18 18.82 12.55 17.02
NPL ratio (%) 1.57 1.59 Down 0.02 percentage point 1.65
Provision coverage ratio (%) 207.28 211.78 Down 4.50 percentage points 210.51
Provision-to-loan ratio (%) 3.26 3.37 Down 0.11 percentage point 3.48
2018 ANNUAL REPORT
15
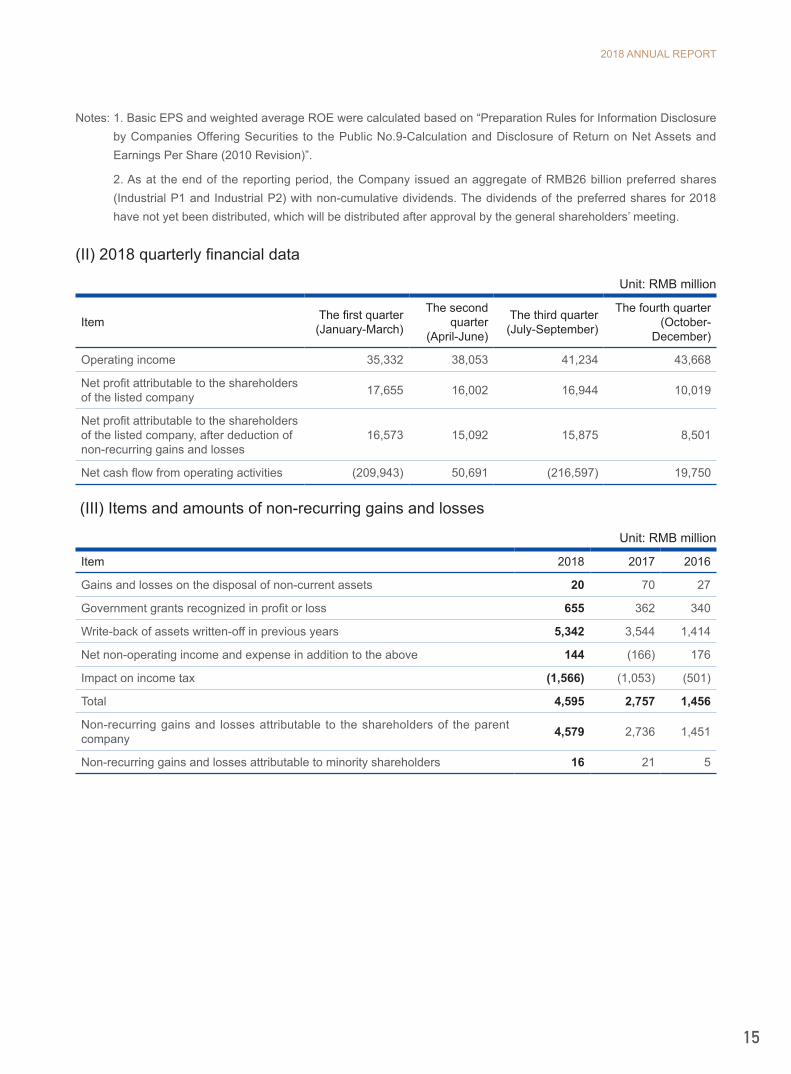
Notes: 1. Basic EPS and weighted average ROE were calculated based on “Preparation Rules for Information Disclosure by Companies Offering Securities to the Public No.9-Calculation and Disclosure of Return on Net Assets and Earnings Per Share (2010 Revision)”.
2. As at the end of the reporting period, the Company issued an aggregate of RMB26 billion preferred shares (Industrial P1 and Industrial P2) with non-cumulative dividends. The dividends of the preferred shares for 2018 have not yet been distributed, which will be distributed after approval by the general shareholders’ meeting.
(II) 2018 quarterly financial data
Unit: RMB million
Item The first quarter(January-March)
The second quarter
(April-June)
The third quarter(July-September)
The fourth quarter(October-
December)
Operating income 35,332 38,053 41,234 43,668
Net profit attributable to the shareholders of the listed company 17,655 16,002 16,944 10,019
Net profit attributable to the shareholders of the listed company, after deduction of non-recurring gains and losses
16,573 15,092 15,875 8,501
Net cash flow from operating activities (209,943) 50,691 (216,597) 19,750
(III) Items and amounts of non-recurring gains and losses
Unit: RMB million
Item 2018 2017 2016
Gains and losses on the disposal of non-current assets 20 70 27
Government grants recognized in profit or loss 655 362 340
Write-back of assets written-off in previous years 5,342 3,544 1,414
Net non-operating income and expense in addition to the above 144 (166) 176
Impact on income tax (1,566) (1,053) (501)
Total 4,595 2,757 1,456
Non-recurring gains and losses attributable to the shareholders of the parent company 4,579 2,736 1,451
Non-recurring gains and losses attributable to minority shareholders 16 21 5
INDUSTRIAL BANK
16
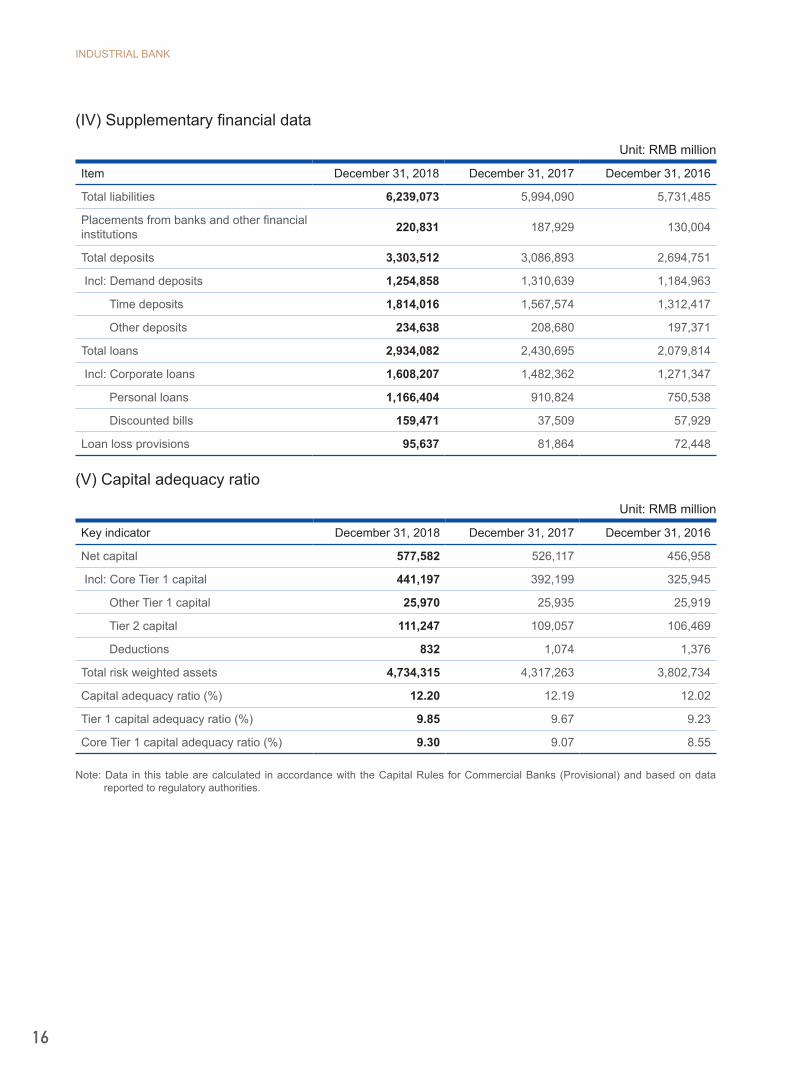
(IV) Supplementary financial data
Unit: RMB million
Item December 31, 2018 December 31, 2017 December 31, 2016
Total liabilities 6,239,073 5,994,090 5,731,485
Placements from banks and other financial institutions 220,831 187,929 130,004
Total deposits 3,303,512 3,086,893 2,694,751
Incl: Demand deposits 1,254,858 1,310,639 1,184,963
Time deposits 1,814,016 1,567,574 1,312,417
Other deposits 234,638 208,680 197,371
Total loans 2,934,082 2,430,695 2,079,814
Incl: Corporate loans 1,608,207 1,482,362 1,271,347
Personal loans 1,166,404 910,824 750,538
Discounted bills 159,471 37,509 57,929
Loan loss provisions 95,637 81,864 72,448
(V) Capital adequacy ratio
Unit: RMB million
Key indicator December 31, 2018 December 31, 2017 December 31, 2016
Net capital 577,582 526,117 456,958
Incl: Core Tier 1 capital 441,197 392,199 325,945
Other Tier 1 capital 25,970 25,935 25,919
Tier 2 capital 111,247 109,057 106,469
Deductions 832 1,074 1,376
Total risk weighted assets 4,734,315 4,317,263 3,802,734
Capital adequacy ratio (%) 12.20 12.19 12.02
Tier 1 capital adequacy ratio (%) 9.85 9.67 9.23
Core Tier 1 capital adequacy ratio (%) 9.30 9.07 8.55
Note: Data in this table are calculated in accordance with the Capital Rules for Commercial Banks (Provisional) and based on data reported to regulatory authorities.

2018 ANNUAL REPORT
17
(VI) Supplementary financial indicators
Unit: %
Key indicator Standard value
December 31, 2018
December 31, 2017
December 31, 2016
Loan-to-deposit ratio (converted to RMB) - 83.90 74.80 72.50
Liquidity ratio (converted to RMB) ≥25 66.52 60.83 59.35
Proportion of loans to the largest single borrower ≤10 1.59 2.84 1.82
Proportion of loans to the top ten borrowers ≤50 10.99 14.66 11.38
Migration ratio of normal loans - 2.10 2.17 3.62
Migration ratio of special mention loans - 43.90 26.65 63.69
Migration ratio of substandard loans - 61.36 74.46 86.99
Migration ratio of doubtful loans - 21.22 41.98 16.61
Note: 1. Data in this table are those before consolidation, and data of subsidiaries are not included in this table.2. Data in this table are calculated based on data reported to regulatory authorities.
(VII) Changes in shareholders’ equity during the reporting period
Unit: RMB million
Item Beginning balance Increase during the period
Decrease during the period Closing balance
Share capital 20,774 - - 20,774
Preferred shares 25,905 - - 25,905
Capital reserve 75,011 - - 75,011
Other comprehensive income (1,067) 3,423 - 2,356
General reserve 70,611 2,811 - 73,422
Surplus reserve 10,684 - - 10,684
Undistributed earnings 214,977 60,620 17,796 257,801
Shareholders’ equity attributable to the shareholders of the parent company 416,895 66,854 17,796 465,953
INDUSTRIAL BANK
18
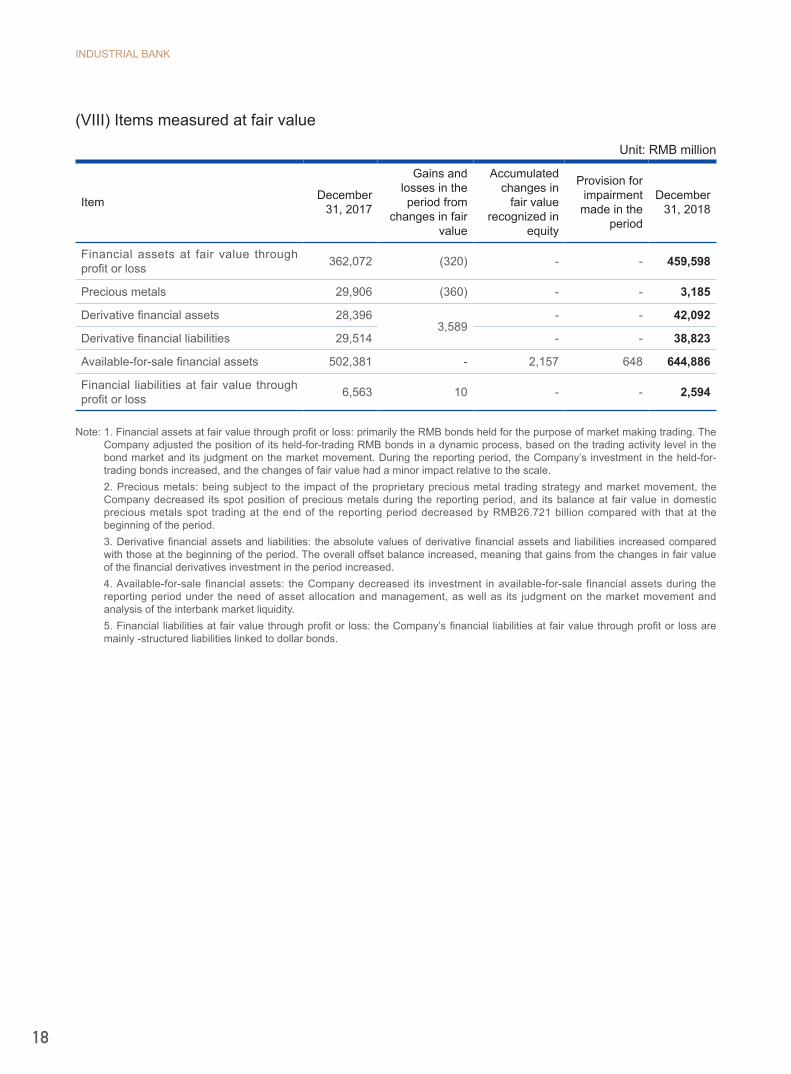
(VIII) Items measured at fair value
Unit: RMB million
Item December 31, 2017
Gains and losses in the period from
changes in fair value
Accumulated changes in
fair value recognized in
equity
Provision for impairment
made in the period
December 31, 2018
Financial assets at fair value through profit or loss 362,072 (320) - - 459,598
Precious metals 29,906 (360) - - 3,185
Derivative financial assets 28,3963,589
- - 42,092
Derivative financial liabilities 29,514 - - 38,823
Available-for-sale financial assets 502,381 - 2,157 648 644,886
Financial liabilities at fair value through profit or loss 6,563 10 - - 2,594
Note: 1. Financial assets at fair value through profit or loss: primarily the RMB bonds held for the purpose of market making trading. The Company adjusted the position of its held-for-trading RMB bonds in a dynamic process, based on the trading activity level in the bond market and its judgment on the market movement. During the reporting period, the Company’s investment in the held-for-trading bonds increased, and the changes of fair value had a minor impact relative to the scale.2. Precious metals: being subject to the impact of the proprietary precious metal trading strategy and market movement, the Company decreased its spot position of precious metals during the reporting period, and its balance at fair value in domestic precious metals spot trading at the end of the reporting period decreased by RMB26.721 billion compared with that at the beginning of the period. 3. Derivative financial assets and liabilities: the absolute values of derivative financial assets and liabilities increased compared with those at the beginning of the period. The overall offset balance increased, meaning that gains from the changes in fair value of the financial derivatives investment in the period increased.4. Available-for-sale financial assets: the Company decreased its investment in available-for-sale financial assets during the reporting period under the need of asset allocation and management, as well as its judgment on the market movement and analysis of the interbank market liquidity.5. Financial liabilities at fair value through profit or loss: the Company’s financial liabilities at fair value through profit or loss are mainly -structured liabilities linked to dollar bonds.

2018 ANNUAL REPORT
19
Business Overview of the Company
I. Main Businesses and Operation Mode of the Company and Conditions of the Industry
(I) Main businesses and operation mode
Founded in August 1988, the Company is one of the first group of joint-stock commercial banks approved by the State Council and the People’s Bank of China. On February 5, 2007, the Company was listed on the Shanghai Stock Exchange.
The Company is mainly engaged in commercial bank services, its main business scope includes: deposits taking; provision of short-, medium- and long-term loans; domestic and international settlement; bills acceptance and discounting; issue of financial bonds; agency issue, cashing and underwriting of government bonds; trading of government bonds and financial bonds; agency issue of negotiable securities except stock; trading and agency trading of negotiable securities except stock; asset custody; interbank borrowing and lending; trading or agency trading of foreign exchange; settlement and sales of foreign exchange; bank card business; L/C services and guarantee; agency collections and payments and agency insurance; safe-box services, financial consulting, credit investigation, consulting, witness business and other banking activities approved by the China banking regulation and administration agencies.
The Company has been advocating the business philosophy of “Growing Together with Sincere Service” and undertaking the mission of serving the real economy and endeavors to offer comprehensive, diversified, top-quality, and high-efficient financial services for customers. The Company has insisted on the basic keynote of progressing steadily. It developed business stably, fixed shortfalls, promoted reforms and firmly pushed forward business transformation. In addition, the Company continued to optimize its mechanism, dynamically adjusted its business structure, comprehensively strengthened risk management and laid a solid foundation, thus further boosting the efficiency in responsiveness to the market and decision making, and propelling sound and quality development in each business line.
(II) Conditions of the industry and development trend
In 2018, China was still in the transition period between old and new driving forces where the external environment was stable but changing, the economic growth rate slowed down, and the risks and hazards were exposed at an accelerated pace. Coupled with the risk prevention and deleveraging policies issued in the previous stage which still imposed many constraints on the market entities, the lingering uncertainties arising from the US-China economic and trade friction, the slowdown of the growth of the world economy as a whole, and the Fed’s continuation of the rate hikes, these factors had a certain impact on the economic fundamentals and posed great challenges to the operations and administration of the banking industry. At the same time, since the fourth quarter of 2018, by introducing a series of cushioning measures such as stabilizing the stock market, bailing out private enterprises, and stimulating consumption, the central government has shifted its policy stance to defensive easing and switched from “reducing leverage” to “stabilizing leverage” for the financial industry on the basis of specifying the overall tone of the “six stables”, gradually releasing the effects of policy adjustment. These changes alternated between long-term and short-term and their effects intertwined, creating an obstacle for simultaneously stabilizing growth, promoting transformation, and preventing risks.
Generally, although the challenges facing China’s economy are still relatively large in the short term, the general direction and main tone of de-leveraging, strengthening supervision and risk prevention have not wavered. At the industrial level, orienting towards stabilizing investment, the choices for investment of funds have increased. The pattern of continuous withdrawal of backward industries, transformation and upgrading of traditional industries, and accelerated development

INDUSTRIAL BANK
20
of emerging industries is still continuing. At the enterprise level, although the macro policy is moderately relaxed, the enterprises still face relatively high level of refinancing risk. Companies with higher debt ratios must be especially vigilant and adhere to the bottom line of compliance. At the financial market level, short-term interest rates in the market have rapidly declined. The liquidity is expected to remain relatively high in the next stage. The long-term interest rate in the market has room to fall, providing a window opportunity for structure adjustment and business development for commercial banks. In terms of business management, enterprises should emphasize the reasonable balance between business development and various new constraints, and continuously improve the differentiated core competitiveness. At the financial institution level, the current policy adjustments are beneficial for the development of financial business, but financial institutions are still in the process of filtering where those who do not advance will be left behind and those who refuse to change will be eliminated. Commercial banks must ride with the tides of development and take advantages of the reform and opening up policies to further consolidate and enhance market advantages, while prudently screening counterparties to prevent cross-contamination.
II. Explanation on Major Changes of Main Assets during the Reporting PeriodAs at the end of the reporting period, the total assets of the Company stood at RMB 6,711.657 billion, up 4.59% from the figure at the beginning of the period, of which loans increased by 20.71% from the figure at the beginning of the period; financial assets held under resale agreements decreased 17.22% from the figure at the beginning of the period; and various net investments were down by 7.31% compared with the figure at the beginning of the period. Refer to “Analysis of Balance Sheets” as discussed and analyzed in “Operation Discussion and Analysis”.
III. Analysis of Core CompetitivenessThe Company is committed to becoming an excellent integrated financial service group. It has inherited and promoted the excellent business gene of striving for innovation and fighting spirits. The Company consistently brought its business characters and professional advantages into play, and persisted in differentiating itself from peers. It continued to enhance employees’ expertise, and rely on technology as the guidance, which laid a solid foundation for the Company’s long-term and healthy development and enhanced the Company’s competitiveness.
Promoting standardized operation by improving governance structure. Since its establishment, the Company has been constantly improving its corporate governance in accordance with market-oriented operation mechanism, improving the internal operation efficiency by standardized operation and scientific management, thereby forming a standardized corporate structure system with lean management and efficient specialization. On the strength of the mechanism-based advantages of the Head Office and branches, the Company insisted on the customer-oriented strategy, aligned its management and operation with market conditions and customer needs, and built matrix management mode. Based on the requirements arising from market developments, the Company established a management structure that separates the customer departments from the product departments, and the traditional business from emerging business, and, at the same time, improved business procedures and supporting mechanism to inject new blood into transformation development by continuous changes and by taking the essence and discarding the dregs of itself.
Building service brand which is driven by business innovation. The Company insists in focusing on customer and according to their needs to enhance its scientific technology ability and prominent innovation capability. The Company has built new products and businesses in many segmented business areas and opens its own “blue ocean”, with distinct operation characteristics. The Company has built the Industrial Bank brand by business innovation and established a well-recognized product and service brand system. A batch of products and service brands including “Natural Life”, “Enjoyable Life”, “Universal Life”, “Industrial E Pay”, “Industrial Auto Finance”, “Industrial Quick Credit”, “Industrial Steward”, “Green Finance”, “Bank-to-Bank Platform”, “QianDa Money Manager” and “Direct Banking” are widely recognized in the domestic financial market.
2018 ANNUAL REPORT
21
Promote transformation and development through systematic optimization. Adhering to a customer-centered approach and oriented towards light capital, light asset, and high efficiency, the Company constantly optimizes its strategy system, promotes business transformation and development, and continuously optimizes asset-liability structure. By focusing on “commercial banking and investment banking”, the Company strengthens its characteristics and advantages of direct financing services in addition to properly carrying out indirect financing services. The Company accelerates the building of a “Three-Type” bank by enhancing the three fundamental capabilities of a settlement, investment, and transaction bank. The Company strengthens the construction of “Four Key Areas” by substantially increasing the contribution of key branches, optimizing the layout in key industries, steadily expanding the sizes of key customers, and consolidating and expanding the advantages of key products.
Opening up new space for development through intra-group integration. The Company has been persisting in the multi- market and comprehensive development. Based on two dimensions of expanding bank business and multi-industry operation, the Company steadily push forward the comprehensive and intra-group integrated process, establishing a multi-industry comprehensive financial service system focusing on banking, through which it has been transformed from a single bank to a modern comprehensive financial service group with banking business as the core, covering business areas including trust, leasing, funds, futures, asset management, consumption finance, internet finance and research and consultation. Centrally using the Group’s various licenses and platform resources, the Company continued to promote and improve the Group’s operation and management model by deepening institutional and systematic reforms, thereby enhancing the internal cohesiveness of the Group. The synergy between the parent company and subsidiaries and between subsidiaries continued to expand, especially in terms of mutual customer recommendation, channel sharing, product cross-selling, and the construction of the Group’s core business portfolio. The Group’s overall competitiveness, customer service capabilities and comprehensive business income continued to increase.
Driving digital transformation with science and technology. The Company has always adhered to the strategy of “Building the Bank through Science and Technology”. Centering on the Group’s development strategy, the Company continuously increased investment in science and technology to achieve digital transformation, so as to create a “Safe, Process-based, Open, and Smart Bank”. It focused on eight major technological areas: big data, robotic process automation (RPA), open interfaces, artificial intelligence, user experience, blockchain, cloud services and information security. In 2018, the Company further optimized the information technology management system and mechanism to invigorate science and technology efforts. It established a Digital Center of Excellence and introduced new concepts and methods such as agile models, digital design, and customer journey to deepen the integration of technology and business and further drive business agile innovation.
Building up soft strength through excellent corporate culture. The Company has continuously upheld the core values of rationality, innovation, people-based and sharing, which fostered corporate culture advocating simplicity, harmony and efficiency. In addition, we leveraged such excellent corporate culture to build up a pragmatic and aggressive operating style, which enhanced the cohesiveness of our workforce and supported the Company’s long-term development.
INDUSTRIAL BANK
22
Operation Discussion and Analysis
I. Major operations during the reporting period
(I) Overview
1. Overall operations
During the reporting period, the Company maintained the operating strategy of progressing steadily, and actively implemented the national macro-control policies and financial regulatory requirements to serve the real economy, prevent and mitigate risks, effectively promote the further optimization of the asset-liability structure, maintain good development of various businesses, and steadily improve operating performance and operating quality.
(1) Each business developed stably. As at the end of the reporting period, the total assets of the Company reached RMB6,711.657 billion, representing an increase of 4.59% from the figure at the beginning of the reporting period; the balance of domestic and foreign currency deposit was RMB3,303.512 billion, representing an increase of 7.02% from the figure at the beginning of the reporting period; the balance of domestic and foreign currency loan reached RMB2,934.082 billion, representing an increase of 20.71% from the figure at the beginning of the reporting period.
(2) Profitability maintained relatively good status. During the reporting period, the operating income recorded RMB158.287 billion, up 13.08% year-on-year, of which net fee and commission income reached RMB42.978 billion, up 10.94% year-on-year. Net profit attributable to the shareholders of the parent company for the whole year reached RMB60.620 billion, representing a year-on-year increase of 5.98%. During the reporting period, weighted average ROE was 14.27%, representing a year-on-year decrease of 1.08 percentage points, total return on assets reached 0.93%, representing a year-on-year increase of 0.01 percentage point.
(3) The quality of assets was controllable overall. As at the end of the reporting period, the balance of the Company’s NPLs stood at RMB46.140 billion, up RMB7.486 billion from the figure at the beginning of the period with NPL ratio of 1.57%, down 0.02 percentage point from the beginning of the period. During the reporting period, the provisions amounted to RMB46.404 billion, representing a year-on-year growth of 30.69%, the provision-to-loan ratio was 3.26% at the end of the reporting period, and the provision coverage ratio was 207.28%.
2. Composition of operating income and operating profit
During the reporting period, operating income of the Company was RMB158.287 billion, and its operating profit was RMB67.914 billion.
(1) The Company divided its regional branches into ten segments by importance and comparability, namely, head office (including the headquarters and its affiliated operating units), Fujian, Beijing, Shanghai, Guangdong, Zhejiang, Jiangsu, Northeast and other regions, Western China and Central China. Operating income and operating profit of various regions are set out as follows:

2018 ANNUAL REPORT
23
Unit: RMB million
Region Operating income Change over previous year (%) Operating profit Change over previous
year (%)
Head office 62,453 22.69 35,915 8.11
Fujian 19,892 13.26 8,201 23.06
Beijing 7,089 (3.67) 4,243 (27.89)
Shanghai 6,340 (18.37) 3,714 (36.61)
Guangdong 9,943 (0.16) 4,069 (25.57)
Zhejiang 3,825 77.66 659 Negative in the same period of last year
Jiangsu 5,988 74.17 2,768 2,062.50
Northeast and other regions 14,243 (0.14) (1,856) (153.21)
Western China 14,486 27.00 4,829 Negative in the same period of last year
Central China 14,028 (7.49) 5,372 (3.26)
Total 158,287 13.08 67,914 4.78
(2) The amount, proportion and year-on-year changes of the items of operating income
Unit: RMB million
Item Amount Percentage in total operating income (%)
Increase/decrease year-on-year (%)
Interest income from loans 124,819 37.01 19.15
Interest income from placements 2,707 0.80 102.47
Interest income from amount due from the Central Bank 6,545 1.94 (3.93)
Interest income from deposits in banks and other financial institutions 2,949 0.87 48.12
Interest income from resale agreements 2,824 0.84 (1.91)
Gain and loss, and interest income from investment 150,263 44.55 12.91
Fee and commission income 47,062 13.95 11.98
Interest income from financing lease 5,717 1.69 4.48
Other income (5,594) (1.65) (161.50)
Total 337,292 100 9.70

INDUSTRIAL BANK
24
3. Financial position and operating results
(1) Changes of key financial indicators and descriptions
Unit: RMB million
Item December 31, 2018
December 31, 2017
Increase/decrease over previous year-
end (%)
Brief description
Total assets 6,711,657 6,416,842 4.59
Steady and healthy development of various asset businesses due to the control of growth rate of assets and optimization of asset structure
Total liabilities 6,239,073 5,994,090 4.09Steady and healthy development of various liability businesses due to the optimization of liability structure
Shareholders’ equityattributable to theshareholders of the parent company
465,953 416,895 11.77 Transfer-in of the profit earned in the current year
Item 2018 2017
Increase/decrease over previous year
(%)
Brief description
Net profit attributable to the shareholders of the parent company
60,620 57,200 5.98
Stable growth in interest-bearing assets, interest margin increased year-on-year, revenue from intermediate business maintained steady growth; cost growth was reasonably controlled and adequate provisions were made
Weighted average ROE (%) 14.27 15.35
Down 1.08 percentage
points
The growth in net profit was slower than the growth in weighted net assets, resulting in decrease in return on net assets
Cash flows from operating activities (356,099) (162,642)
Negative in the same period of
last year
Assets and liabilities were restructured, more efforts were paid to originate on-balance sheet loans and standardized assets; non-standard assets investments were downsized
2018 ANNUAL REPORT
25
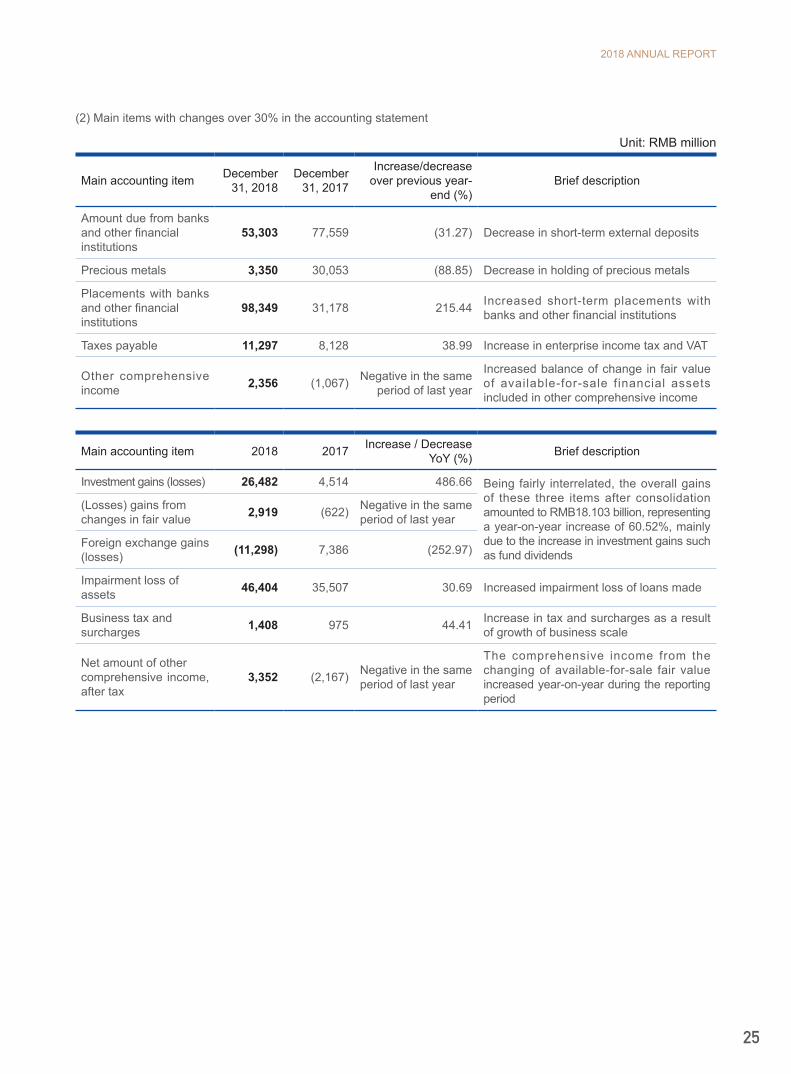
(2) Main items with changes over 30% in the accounting statement
Unit: RMB million
Main accounting item December 31, 2018
December 31, 2017
Increase/decrease over previous year-
end (%)Brief description
Amount due from banks and other financial institutions
53,303 77,559 (31.27) Decrease in short-term external deposits
Precious metals 3,350 30,053 (88.85) Decrease in holding of precious metals
Placements with banks and other financial institutions
98,349 31,178 215.44 Increased short-term placements with banks and other financial institutions
Taxes payable 11,297 8,128 38.99 Increase in enterprise income tax and VAT
Other comprehensive income 2,356 (1,067) Negative in the same
period of last year
Increased balance of change in fair value of available-for-sale financial assets included in other comprehensive income
Main accounting item 2018 2017 Increase / Decrease YoY (%) Brief description
Investment gains (losses) 26,482 4,514 486.66 Being fairly interrelated, the overall gains of these three items after consolidation amounted to RMB18.103 billion, representing a year-on-year increase of 60.52%, mainly due to the increase in investment gains such as fund dividends
(Losses) gains fromchanges in fair value 2,919 (622) Negative in the same
period of last year
Foreign exchange gains (losses) (11,298) 7,386 (252.97)
Impairment loss of assets 46,404 35,507 30.69 Increased impairment loss of loans made
Business tax and surcharges 1,408 975 44.41 Increase in tax and surcharges as a result
of growth of business scale
Net amount of other comprehensive income, after tax
3,352 (2,167) Negative in the same period of last year
The comprehensive income from the changing of available-for-sale fair value increased year-on-year during the reporting period

INDUSTRIAL BANK
26
(II) Analysis of the balance sheet
1.Asset
As at the end of the reporting period, the total assets of the Company stood at RMB6,711.657 billion, up 4.59% from the figure at the beginning of the period, of which loans increased by RMB503.387 billion or 20.71% from the figure at the beginning of the period; financial assets held under resale agreements decreased by RMB16.036 billion or 17.22% compared with the figure at the beginning of the period; and various net investments decreased by RMB227.950 billion or 7.31% compared with the figure at the beginning of the period. The composition of the total assets of the Company is shown in the table below:
Unit: RMB million
Item December 31, 2018 December 31, 2017
Balance Percentage (%) Balance Percentage (%)
Net loans and advances to customers 2,838,445 42.29 2,348,831 36.60
Investment note (1) 2,892,216 43.09 3,120,166 48.62
Financial assets held under resale agreements 77,083 1.15 93,119 1.45
Finance lease receivables 104,253 1.55 103,495 1.61
Due from banks 53,303 0.79 77,559 1.21
Placements with banks and other financial institutions 98,349 1.47 31,178 0.49
Cash and balances with central bank 475,781 7.09 466,403 7.27
Others note (2) 172,227 2.57 176,091 2.75
Total 6,711,657 100 6,416,842 100
Note: (1) Included the financial assets at fair value through profit or loss, available-for-sale financial assets, receivable account investments, held-to-maturity investments and long-term equity investments. (2) Included precious metals, derivative financial assets, interest receivable, fixed assets, construction in progress, intangible assets, goodwill, deferred tax assets and other assets.
The details of loans are set out as follows:
(1) Classification of loans
Unit: RMB million
Type December 31, 2018 December 31, 2017
Corporate loans 1,608,207 1,482,362
Personal loans 1,166,404 910,824
Discounted bills 159,471 37,509
Total 2,934,082 2,430,695

2018 ANNUAL REPORT
27
As at the end of the reporting period, corporate loans accounted for 54.81%, down 6.18 percentage points as compared with the figure at the beginning of the period; personal loans accounted for 39.75%, up 2.28 percentage points as compared with that at the beginning of the period; and discounted bills accounted for 5.44%, up 3.90 percentage points as compared with the figure at the beginning of the period. During the reporting period, the Company proactively grasped the changes in economic situation and rationally determined the credit layout of mainstream business and continued to maintain a steady and balanced development of key businesses.
(2) Loan distribution by industry
As at the end of the reporting period, the top five industries that received the largest proportion of bank loans were: “personal loans”, “manufacturing”, “leasing and commercial service”, “wholesale and retail”, and “real estate”. The details on distribution by industry are set out as follows:
Unit: RMB million
IndustryDecember 31, 2018 December 31, 2017
Loan balance
Percentage (%)
NPL ratio (%)
Loan balance
Percentage (%)
NPL ratio (%)
Agriculture, forestry, husbandry and fishery 6,967 0.23 0.66 6,958 0.29 0.89
Mining 59,421 2.03 3.39 65,503 2.69 3.71
Manufacturing 359,593 12.26 3.79 335,445 13.80 3.55
Production and supply of power, heat, gas and water 77,948 2.66 0.61 72,413 2.98 0.25
Construction 95,487 3.25 1.30 89,581 3.69 1.61
Transportation, logistics and postal service 79,355 2.70 1.15 69,794 2.87 1.13
Information transmission, software and IT service 18,046 0.62 1.96 18,083 0.73 0.33
Wholesale and retail 224,723 7.66 6.98 223,649 9.20 5.34
Accommodation and catering 3,183 0.11 0.54 3,068 0.13 4.10
Finance 21,537 0.73 0.18 23,865 0.98 0.16
Real estate 195,490 6.66 1.21 151,488 6.23 0.66
Leasing and commercial services 263,411 8.98 0.55 226,770 9.34 0.41
Scientific research and technical service 8,524 0.29 1.85 4,641 0.19 5.26
Water conservation, environment and public facility administration 173,268 5.91 0.09 163,577 6.73 0.10
Residential services, repair and other related services 1,469 0.05 1.93 2,704 0.11 1.04
Education 898 0.03 0.56 1,349 0.06 0.00
Sanitation and social services 8,427 0.29 0.57 10,848 0.45 0.06
Culture, sporting and entertainment 6,539 0.22 0.19 7,057 0.29 0.12
Public administration, social security and social organizations 3,825 0.13 0.00 5,478 0.23 0.00
International organization 96 0.00 0.00 91 0.00 0.00
Personal loans 1,166,404 39.75 0.64 910,824 37.47 0.80
Discounted bills 159,471 5.44 0.00 37,509 1.54 0.00
Total 2,934,082 100 1.57 2,430,695 100 1.59
INDUSTRIAL BANK
28
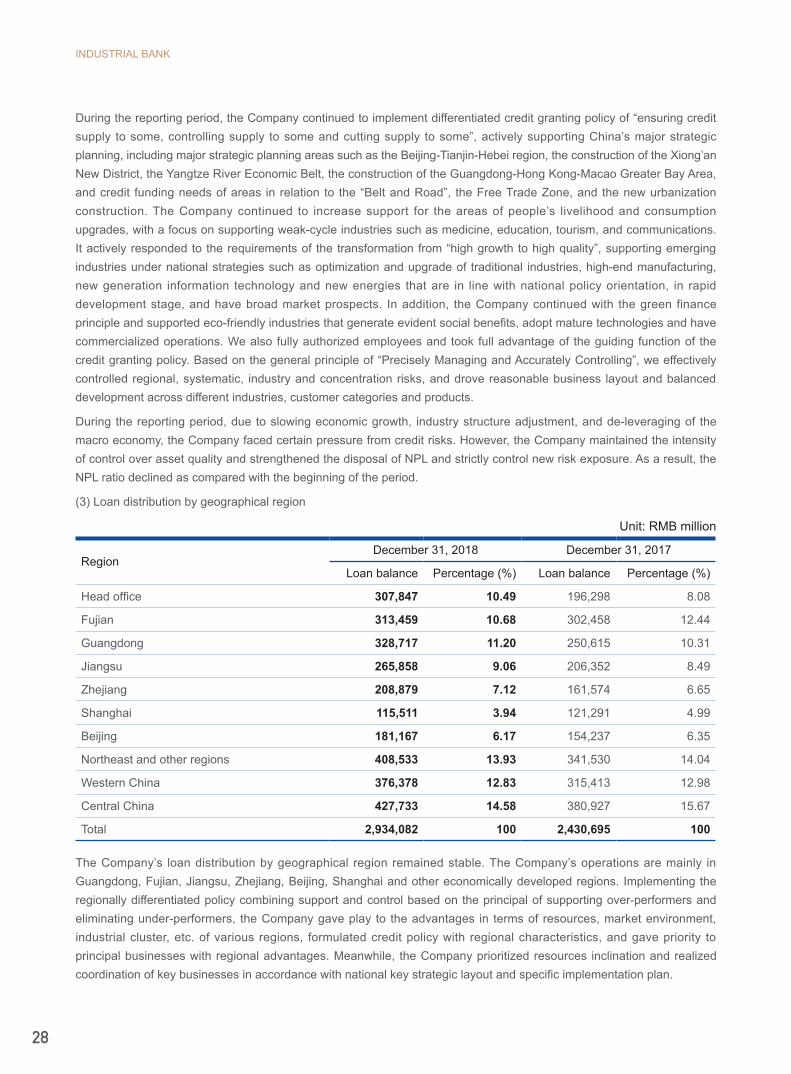
During the reporting period, the Company continued to implement differentiated credit granting policy of “ensuring credit supply to some, controlling supply to some and cutting supply to some”, actively supporting China’s major strategic planning, including major strategic planning areas such as the Beijing-Tianjin-Hebei region, the construction of the Xiong’an New District, the Yangtze River Economic Belt, the construction of the Guangdong-Hong Kong-Macao Greater Bay Area, and credit funding needs of areas in relation to the “Belt and Road”, the Free Trade Zone, and the new urbanization construction. The Company continued to increase support for the areas of people’s livelihood and consumption upgrades, with a focus on supporting weak-cycle industries such as medicine, education, tourism, and communications. It actively responded to the requirements of the transformation from “high growth to high quality”, supporting emerging industries under national strategies such as optimization and upgrade of traditional industries, high-end manufacturing, new generation information technology and new energies that are in line with national policy orientation, in rapid development stage, and have broad market prospects. In addition, the Company continued with the green finance principle and supported eco-friendly industries that generate evident social benefits, adopt mature technologies and have commercialized operations. We also fully authorized employees and took full advantage of the guiding function of the credit granting policy. Based on the general principle of “Precisely Managing and Accurately Controlling”, we effectively controlled regional, systematic, industry and concentration risks, and drove reasonable business layout and balanced development across different industries, customer categories and products.
During the reporting period, due to slowing economic growth, industry structure adjustment, and de-leveraging of the macro economy, the Company faced certain pressure from credit risks. However, the Company maintained the intensity of control over asset quality and strengthened the disposal of NPL and strictly control new risk exposure. As a result, the NPL ratio declined as compared with the beginning of the period.
(3) Loan distribution by geographical region
Unit: RMB million
RegionDecember 31, 2018 December 31, 2017
Loan balance Percentage (%) Loan balance Percentage (%)
Head office 307,847 10.49 196,298 8.08
Fujian 313,459 10.68 302,458 12.44
Guangdong 328,717 11.20 250,615 10.31
Jiangsu 265,858 9.06 206,352 8.49
Zhejiang 208,879 7.12 161,574 6.65
Shanghai 115,511 3.94 121,291 4.99
Beijing 181,167 6.17 154,237 6.35
Northeast and other regions 408,533 13.93 341,530 14.04
Western China 376,378 12.83 315,413 12.98
Central China 427,733 14.58 380,927 15.67
Total 2,934,082 100 2,430,695 100
The Company’s loan distribution by geographical region remained stable. The Company’s operations are mainly in Guangdong, Fujian, Jiangsu, Zhejiang, Beijing, Shanghai and other economically developed regions. Implementing the regionally differentiated policy combining support and control based on the principal of supporting over-performers and eliminating under-performers, the Company gave play to the advantages in terms of resources, market environment, industrial cluster, etc. of various regions, formulated credit policy with regional characteristics, and gave priority to principal businesses with regional advantages. Meanwhile, the Company prioritized resources inclination and realized coordination of key businesses in accordance with national key strategic layout and specific implementation plan.
2018 ANNUAL REPORT
29
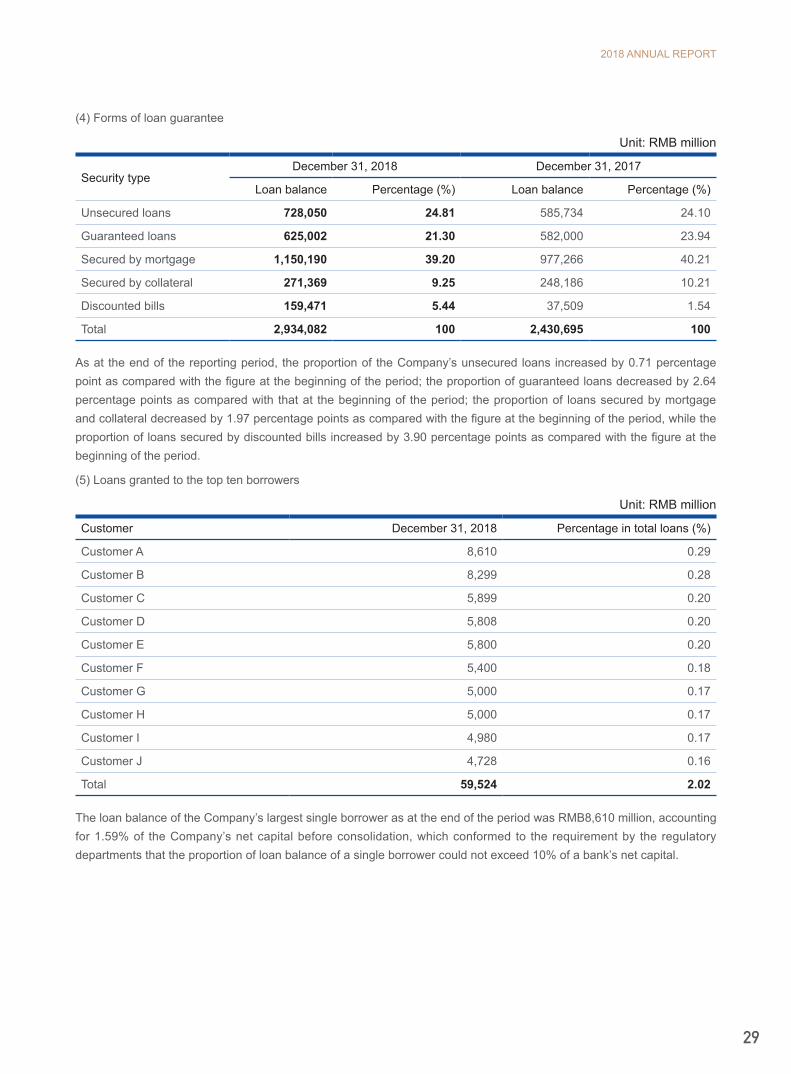
(4) Forms of loan guarantee
Unit: RMB million
Security typeDecember 31, 2018 December 31, 2017
Loan balance Percentage (%) Loan balance Percentage (%)
Unsecured loans 728,050 24.81 585,734 24.10
Guaranteed loans 625,002 21.30 582,000 23.94
Secured by mortgage 1,150,190 39.20 977,266 40.21
Secured by collateral 271,369 9.25 248,186 10.21
Discounted bills 159,471 5.44 37,509 1.54
Total 2,934,082 100 2,430,695 100
As at the end of the reporting period, the proportion of the Company’s unsecured loans increased by 0.71 percentage point as compared with the figure at the beginning of the period; the proportion of guaranteed loans decreased by 2.64 percentage points as compared with that at the beginning of the period; the proportion of loans secured by mortgage and collateral decreased by 1.97 percentage points as compared with the figure at the beginning of the period, while the proportion of loans secured by discounted bills increased by 3.90 percentage points as compared with the figure at the beginning of the period.
(5) Loans granted to the top ten borrowers
Unit: RMB million
Customer December 31, 2018 Percentage in total loans (%)
Customer A 8,610 0.29
Customer B 8,299 0.28
Customer C 5,899 0.20
Customer D 5,808 0.20
Customer E 5,800 0.20
Customer F 5,400 0.18
Customer G 5,000 0.17
Customer H 5,000 0.17
Customer I 4,980 0.17
Customer J 4,728 0.16
Total 59,524 2.02
The loan balance of the Company’s largest single borrower as at the end of the period was RMB8,610 million, accounting for 1.59% of the Company’s net capital before consolidation, which conformed to the requirement by the regulatory departments that the proportion of loan balance of a single borrower could not exceed 10% of a bank’s net capital.
INDUSTRIAL BANK
30
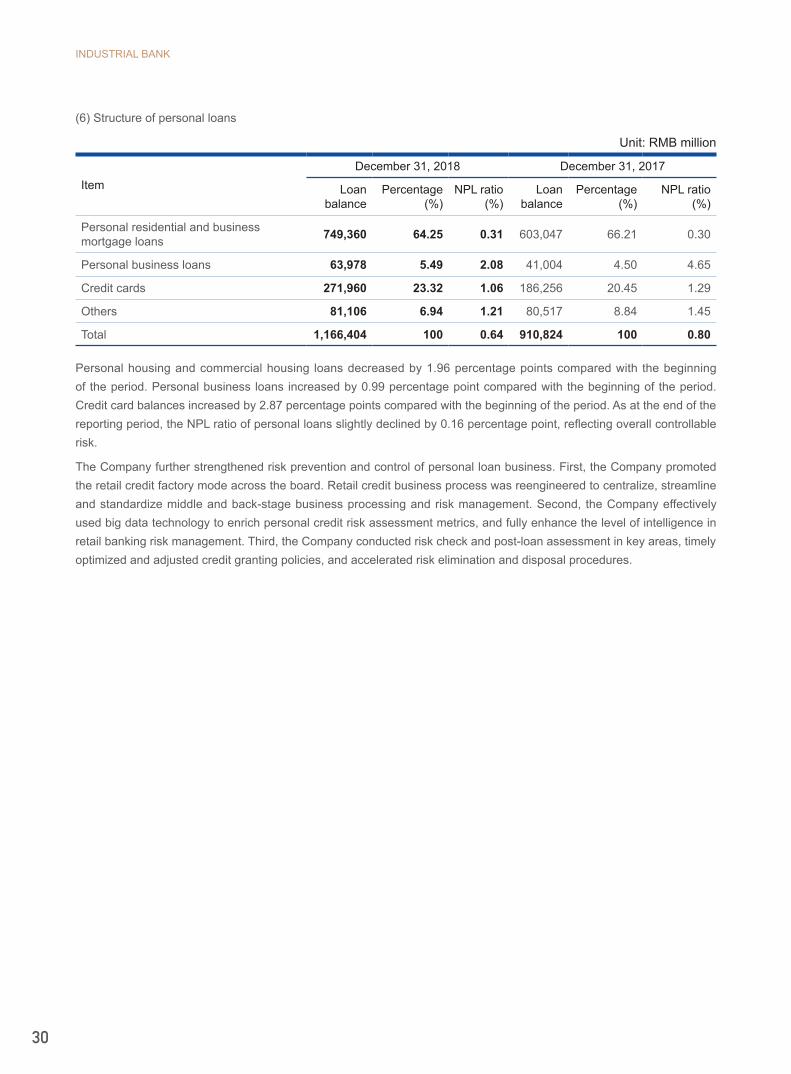
(6) Structure of personal loans
Unit: RMB million
ItemDecember 31, 2018 December 31, 2017
Loan balance
Percentage (%)
NPL ratio (%)
Loan balance
Percentage (%)
NPL ratio (%)
Personal residential and business mortgage loans 749,360 64.25 0.31 603,047 66.21 0.30
Personal business loans 63,978 5.49 2.08 41,004 4.50 4.65
Credit cards 271,960 23.32 1.06 186,256 20.45 1.29
Others 81,106 6.94 1.21 80,517 8.84 1.45
Total 1,166,404 100 0.64 910,824 100 0.80
Personal housing and commercial housing loans decreased by 1.96 percentage points compared with the beginning of the period. Personal business loans increased by 0.99 percentage point compared with the beginning of the period. Credit card balances increased by 2.87 percentage points compared with the beginning of the period. As at the end of the reporting period, the NPL ratio of personal loans slightly declined by 0.16 percentage point, reflecting overall controllable risk.
The Company further strengthened risk prevention and control of personal loan business. First, the Company promoted the retail credit factory mode across the board. Retail credit business process was reengineered to centralize, streamline and standardize middle and back-stage business processing and risk management. Second, the Company effectively used big data technology to enrich personal credit risk assessment metrics, and fully enhance the level of intelligence in retail banking risk management. Third, the Company conducted risk check and post-loan assessment in key areas, timely optimized and adjusted credit granting policies, and accelerated risk elimination and disposal procedures.
2018 ANNUAL REPORT
31
The details of investment are set out as follows:
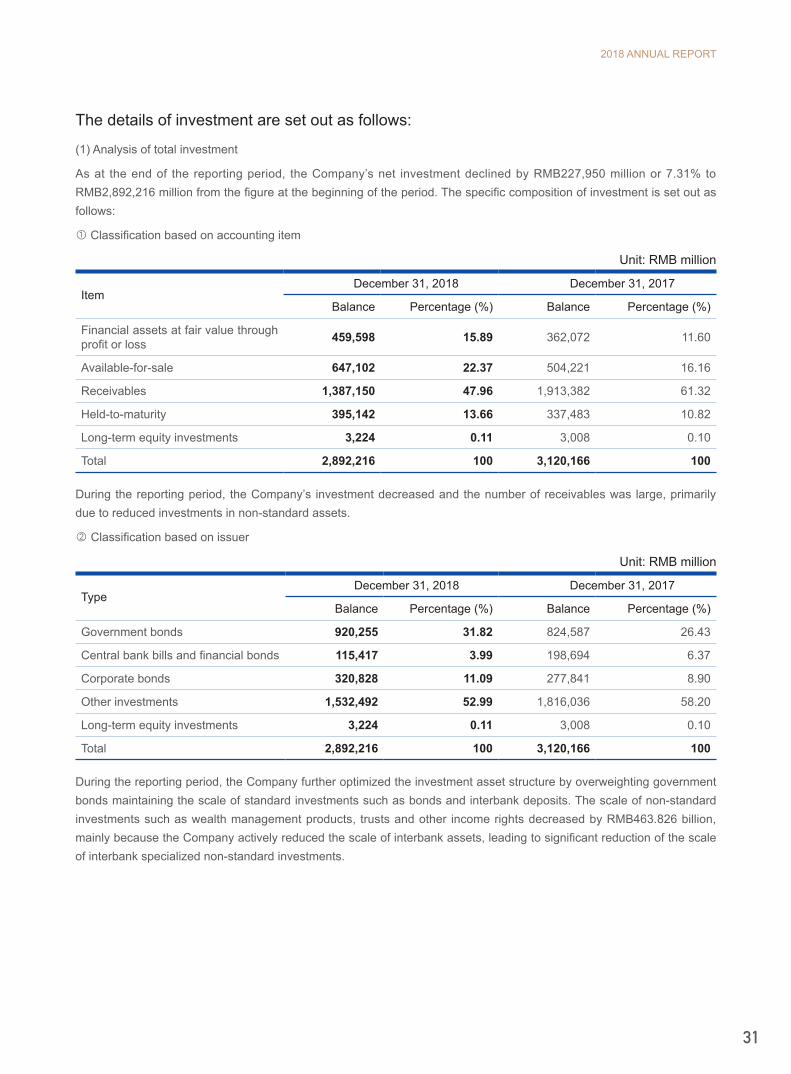
(1) Analysis of total investment
As at the end of the reporting period, the Company’s net investment declined by RMB227,950 million or 7.31% to RMB2,892,216 million from the figure at the beginning of the period. The specific composition of investment is set out as follows:
① Classification based on accounting item
Unit: RMB million
Item December 31, 2018 December 31, 2017
Balance Percentage (%) Balance Percentage (%)
Financial assets at fair value through profit or loss 459,598 15.89 362,072 11.60
Available-for-sale 647,102 22.37 504,221 16.16
Receivables 1,387,150 47.96 1,913,382 61.32
Held-to-maturity 395,142 13.66 337,483 10.82
Long-term equity investments 3,224 0.11 3,008 0.10
Total 2,892,216 100 3,120,166 100
During the reporting period, the Company’s investment decreased and the number of receivables was large, primarily due to reduced investments in non-standard assets.
② Classification based on issuer
Unit: RMB million
Type December 31, 2018 December 31, 2017
Balance Percentage (%) Balance Percentage (%)
Government bonds 920,255 31.82 824,587 26.43
Central bank bills and financial bonds 115,417 3.99 198,694 6.37
Corporate bonds 320,828 11.09 277,841 8.90
Other investments 1,532,492 52.99 1,816,036 58.20
Long-term equity investments 3,224 0.11 3,008 0.10
Total 2,892,216 100 3,120,166 100
During the reporting period, the Company further optimized the investment asset structure by overweighting government bonds maintaining the scale of standard investments such as bonds and interbank deposits. The scale of non-standard investments such as wealth management products, trusts and other income rights decreased by RMB463.826 billion, mainly because the Company actively reduced the scale of interbank assets, leading to significant reduction of the scale of interbank specialized non-standard investments.

INDUSTRIAL BANK
32
(2) Long-term equity investments
As at the end of the reporting period, the book value of the Company’s long-term equity investments was RMB3, 224 million, and the details are set out as follows:
①The Company held 294.40 million shares of Jiujiang City Commercial Bank Co., Ltd. with a proportion of equity interest of 12.23% and a book value of RMB2,892 million.
② CIB Wealth Management Co., Ltd. held the book value of other long-term equity investment of RMB280 million in total at the end of the reporting period.
③ CIB Guoxin Asset Management Co., Ltd. held the book value of other long-term equity investment of RMB52 million in total at the end of the reporting period.
Deposits with banks and other financial institutions are set out as follows:
As at the end of the reporting period, the Company had a balance of RMB53, 319 million in deposits with banks and other financial institutions, decreased RMB24,256 million or 31.27% from the figure at the beginning of the period. The main reason is that the company decreased deposits with domestic banks.
Unit: RMB million
Type December 31, 2018 December 31, 2017
Balance Percentage (%) Balance Percentage (%)
Deposits with domestic banks 29,316 54.98 61,425 79.18
Deposits with other domestic financial institutions 5,236 9.82 4,232 5.46
Deposits with foreign banks 18,694 35.06 11,918 15.36
Deposits with other foreign financial institutions 73 0.14 - -
Total 53,319 100 77,575 100
Details of financial assets held under resale agreements are set out as follows:
As at the end of the reporting period, the Company recorded a balance of RMB77.416 billion in financial assets held under resale agreements, representing a decrease of RMB15.703 billion or 16.86% compared with the beginning of the period, mainly due to the reduction in the financial assets held under resale agreements as the Company adjusted asset allocation.
Unit: RMB million
Type December 31, 2018 December 31, 2017
Balance Percentage (%) Balance Percentage (%)
Bonds 76,098 98.30 88,684 95.24
Bills 1,318 1.70 333 0.36
Trusts and other beneficial interests - - 4,102 4.40
Total 77,416 100 93,119 100
2018 ANNUAL REPORT
33
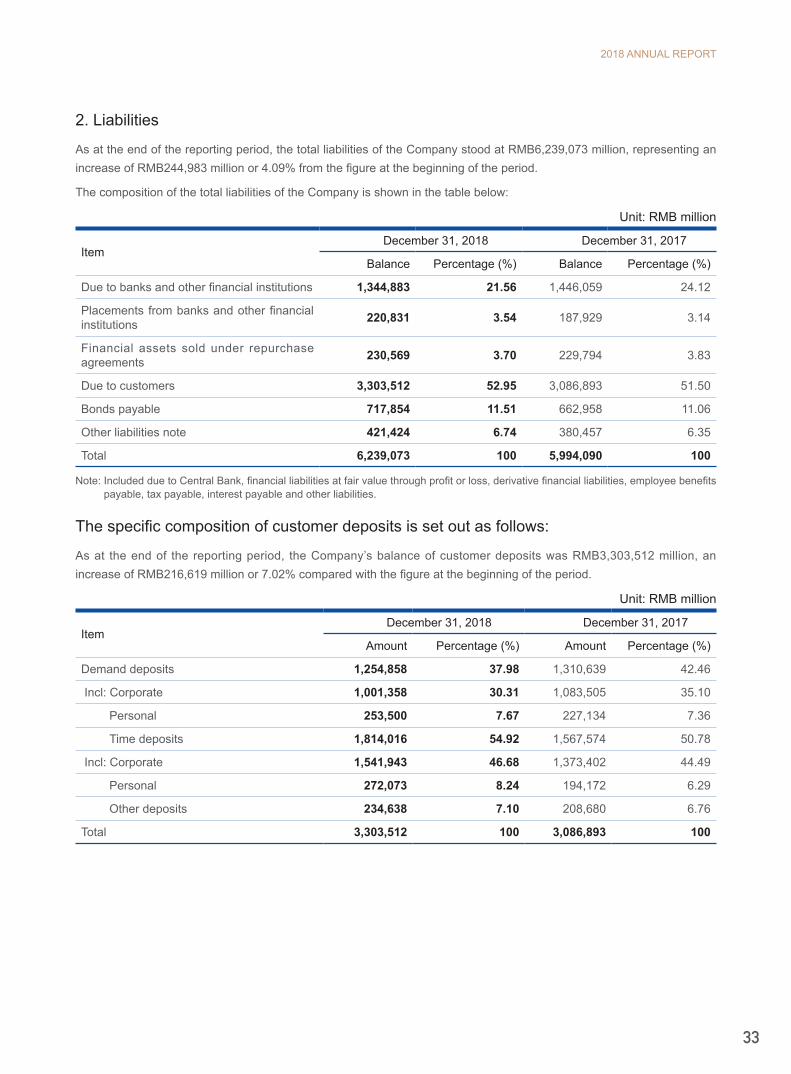
2. Liabilities
As at the end of the reporting period, the total liabilities of the Company stood at RMB6,239,073 million, representing an increase of RMB244,983 million or 4.09% from the figure at the beginning of the period.
The composition of the total liabilities of the Company is shown in the table below:
Unit: RMB million
Item December 31, 2018 December 31, 2017
Balance Percentage (%) Balance Percentage (%)
Due to banks and other financial institutions 1,344,883 21.56 1,446,059 24.12
Placements from banks and other financial institutions 220,831 3.54 187,929 3.14
Financial assets sold under repurchase agreements 230,569 3.70 229,794 3.83
Due to customers 3,303,512 52.95 3,086,893 51.50
Bonds payable 717,854 11.51 662,958 11.06
Other liabilities note 421,424 6.74 380,457 6.35
Total 6,239,073 100 5,994,090 100
Note: Included due to Central Bank, financial liabilities at fair value through profit or loss, derivative financial liabilities, employee benefits payable, tax payable, interest payable and other liabilities.
The specific composition of customer deposits is set out as follows:
As at the end of the reporting period, the Company’s balance of customer deposits was RMB3,303,512 million, an increase of RMB216,619 million or 7.02% compared with the figure at the beginning of the period.
Unit: RMB million
Item December 31, 2018 December 31, 2017
Amount Percentage (%) Amount Percentage (%)
Demand deposits 1,254,858 37.98 1,310,639 42.46
Incl: Corporate 1,001,358 30.31 1,083,505 35.10
Personal 253,500 7.67 227,134 7.36
Time deposits 1,814,016 54.92 1,567,574 50.78
Incl: Corporate 1,541,943 46.68 1,373,402 44.49
Personal 272,073 8.24 194,172 6.29
Other deposits 234,638 7.10 208,680 6.76
Total 3,303,512 100 3,086,893 100
INDUSTRIAL BANK
34
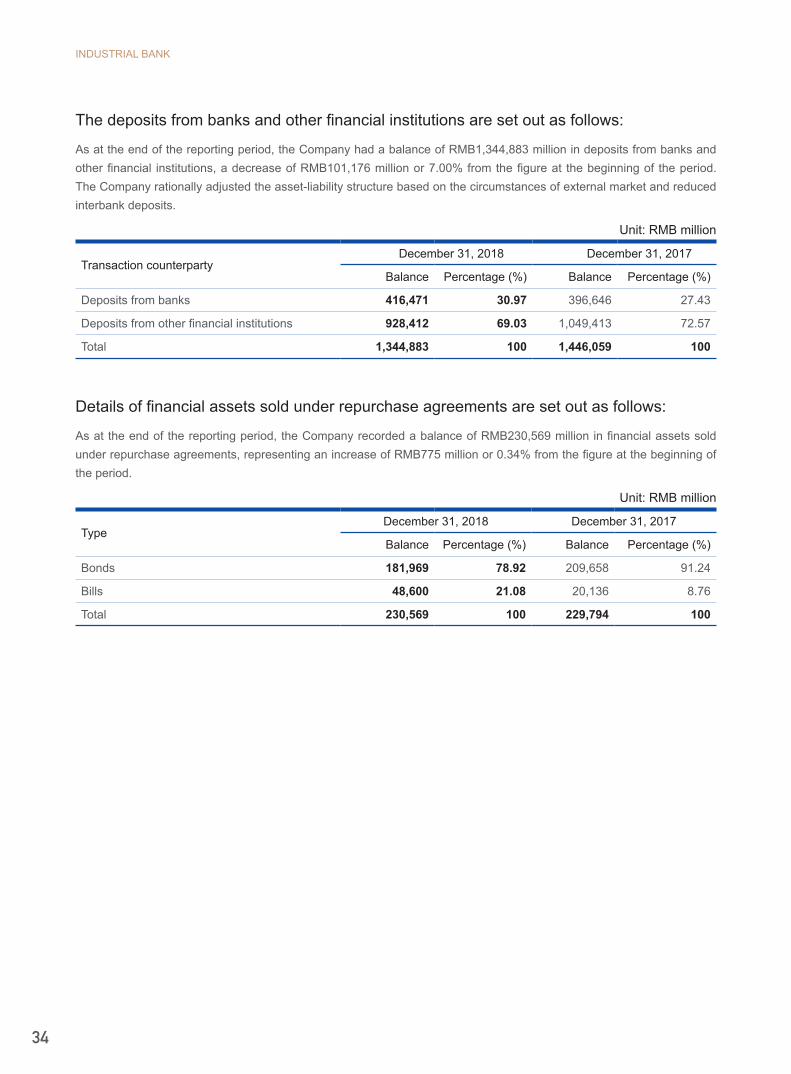
The deposits from banks and other financial institutions are set out as follows:
As at the end of the reporting period, the Company had a balance of RMB1,344,883 million in deposits from banks and other financial institutions, a decrease of RMB101,176 million or 7.00% from the figure at the beginning of the period. The Company rationally adjusted the asset-liability structure based on the circumstances of external market and reduced interbank deposits.
Unit: RMB million
Transaction counterparty December 31, 2018 December 31, 2017
Balance Percentage (%) Balance Percentage (%)
Deposits from banks 416,471 30.97 396,646 27.43
Deposits from other financial institutions 928,412 69.03 1,049,413 72.57
Total 1,344,883 100 1,446,059 100
Details of financial assets sold under repurchase agreements are set out as follows:
As at the end of the reporting period, the Company recorded a balance of RMB230,569 million in financial assets sold under repurchase agreements, representing an increase of RMB775 million or 0.34% from the figure at the beginning of the period.
Unit: RMB million
TypeDecember 31, 2018 December 31, 2017
Balance Percentage (%) Balance Percentage (%)
Bonds 181,969 78.92 209,658 91.24
Bills 48,600 21.08 20,136 8.76
Total 230,569 100 229,794 100
2018 ANNUAL REPORT
35
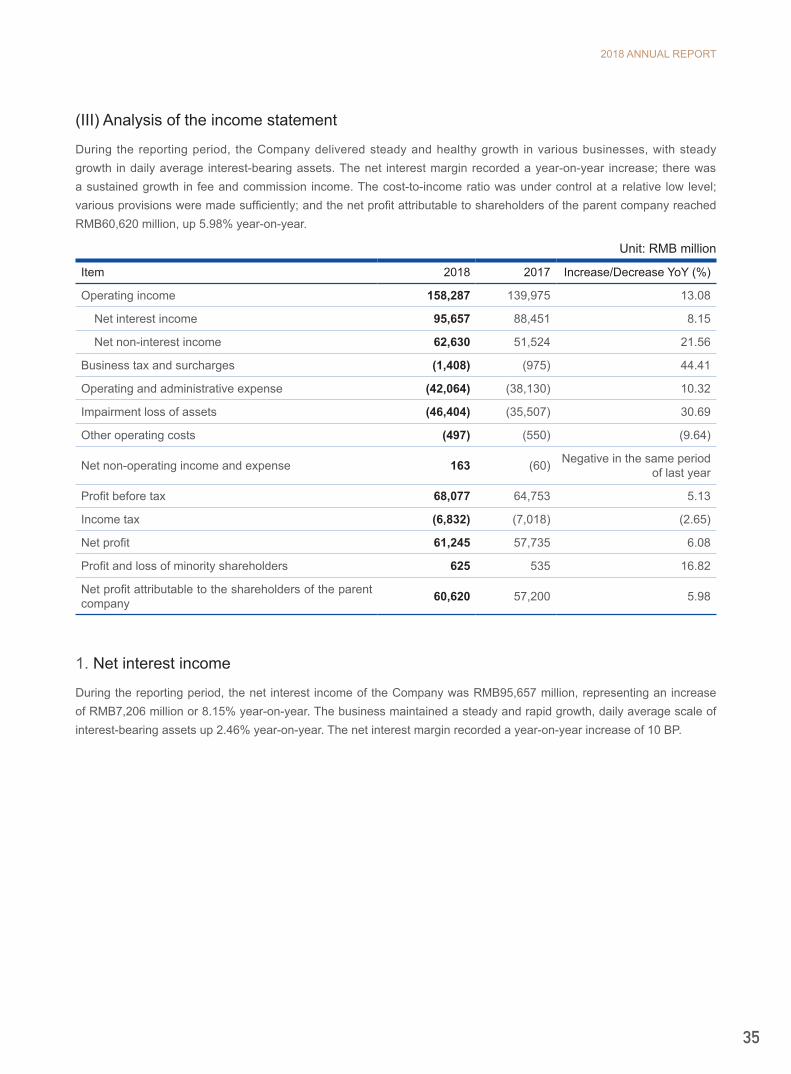
(III) Analysis of the income statement
During the reporting period, the Company delivered steady and healthy growth in various businesses, with steady growth in daily average interest-bearing assets. The net interest margin recorded a year-on-year increase; there was a sustained growth in fee and commission income. The cost-to-income ratio was under control at a relative low level; various provisions were made sufficiently; and the net profit attributable to shareholders of the parent company reached RMB60,620 million, up 5.98% year-on-year.
Unit: RMB million
Item 2018 2017 Increase/Decrease YoY (%)
Operating income 158,287 139,975 13.08
Net interest income 95,657 88,451 8.15
Net non-interest income 62,630 51,524 21.56
Business tax and surcharges (1,408) (975) 44.41
Operating and administrative expense (42,064) (38,130) 10.32
Impairment loss of assets (46,404) (35,507) 30.69
Other operating costs (497) (550) (9.64)
Net non-operating income and expense 163 (60) Negative in the same period of last year
Profit before tax 68,077 64,753 5.13
Income tax (6,832) (7,018) (2.65)
Net profit 61,245 57,735 6.08
Profit and loss of minority shareholders 625 535 16.82
Net profit attributable to the shareholders of the parent company 60,620 57,200 5.98
1. Net interest income
During the reporting period, the net interest income of the Company was RMB95,657 million, representing an increase of RMB7,206 million or 8.15% year-on-year. The business maintained a steady and rapid growth, daily average scale of interest-bearing assets up 2.46% year-on-year. The net interest margin recorded a year-on-year increase of 10 BP.

INDUSTRIAL BANK
36
The composition of interest income and interest expense during the period is set out as follows:
Unit: RMB million
Item2018 2017
Amount Percentage (%) Amount Percentage (%)
Interest income
Interest income from corporate and personal loans 121,266 44.82 103,610 41.00
Interest income from discounted bills 3,553 1.31 1,150 0.46
Interest income from investments 123,781 45.75 128,567 50.88
Interest income from the amount due from the Central Bank 6,545 2.42 6,813 2.70
Interest income from placements with banks and other financial institutions 2,707 1.00 1,337 0.53
Interest income from resale agreements 2,824 1.04 2,879 1.14
Interest income from deposits in banks and other financial institutions 2,949 1.09 1,991 0.79
Interest income from financing lease 5,717 2.11 5,472 2.17
Other interest income 1,236 0.46 825 0.33
Subtotal of interest income 270,578 100 252,644 100
Interest expense
Interest expense on loans from the Central Bank 8,639 4.94 7,105 4.33
Interest expense on deposits 69,985 40.01 54,891 33.43
Interest expense on bonds issuance 27,707 15.84 28,390 17.29
Interest expense on deposits from banks and other financial institutions 55,205 31.56 64,123 39.04
Interest expense on placements from banks and other financial institutions 8,899 5.09 6,185 3.77
Interest expense on repurchase agreements 4,259 2.43 3,358 2.05
Other interest expenses 227 0.13 141 0.09
Subtotal of interest expense 174,921 100 164,193 100
Net interest income 95,657 88,451
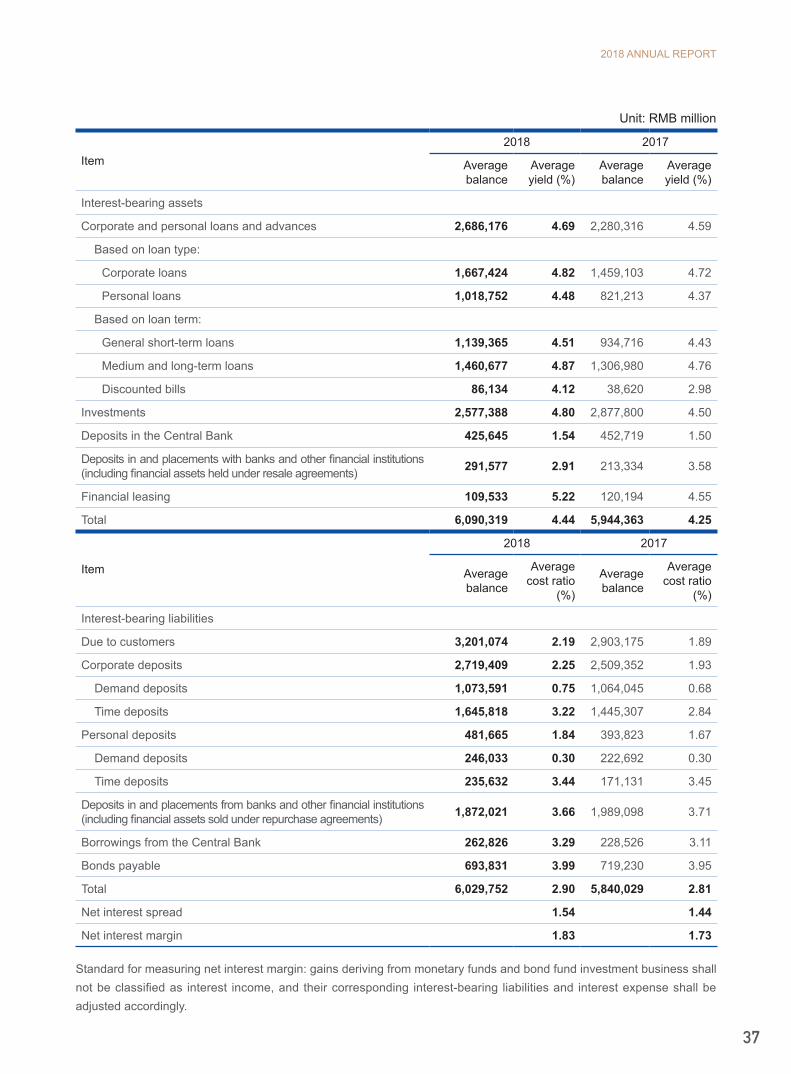
The Company’s net interest spread was 1.54%, representing an increase of 10 BP year-on-year; the net interest margin was 1.83%, representing an increase of 10 BP year-on-year. The daily average balance, annualized average yield and cost rate of the Company’s asset and liability items are as follows:
2018 ANNUAL REPORT
37
Unit: RMB million
Item 2018 2017
Average balance
Average yield (%)
Average balance
Average yield (%)
Interest-bearing assets
Corporate and personal loans and advances 2,686,176 4.69 2,280,316 4.59
Based on loan type:
Corporate loans 1,667,424 4.82 1,459,103 4.72
Personal loans 1,018,752 4.48 821,213 4.37
Based on loan term:
General short-term loans 1,139,365 4.51 934,716 4.43
Medium and long-term loans 1,460,677 4.87 1,306,980 4.76
Discounted bills 86,134 4.12 38,620 2.98
Investments 2,577,388 4.80 2,877,800 4.50
Deposits in the Central Bank 425,645 1.54 452,719 1.50
Deposits in and placements with banks and other financial institutions (including financial assets held under resale agreements) 291,577 2.91 213,334 3.58
Financial leasing 109,533 5.22 120,194 4.55
Total 6,090,319 4.44 5,944,363 4.25
Item
2018 2017
Average balance
Average cost ratio
(%)
Average balance
Average cost ratio
(%)
Interest-bearing liabilities
Due to customers 3,201,074 2.19 2,903,175 1.89
Corporate deposits 2,719,409 2.25 2,509,352 1.93
Demand deposits 1,073,591 0.75 1,064,045 0.68
Time deposits 1,645,818 3.22 1,445,307 2.84
Personal deposits 481,665 1.84 393,823 1.67
Demand deposits 246,033 0.30 222,692 0.30
Time deposits 235,632 3.44 171,131 3.45
Deposits in and placements from banks and other financial institutions (including financial assets sold under repurchase agreements) 1,872,021 3.66 1,989,098 3.71
Borrowings from the Central Bank 262,826 3.29 228,526 3.11
Bonds payable 693,831 3.99 719,230 3.95
Total 6,029,752 2.90 5,840,029 2.81
Net interest spread 1.54 1.44
Net interest margin 1.83 1.73
Standard for measuring net interest margin: gains deriving from monetary funds and bond fund investment business shall not be classified as interest income, and their corresponding interest-bearing liabilities and interest expense shall be adjusted accordingly.
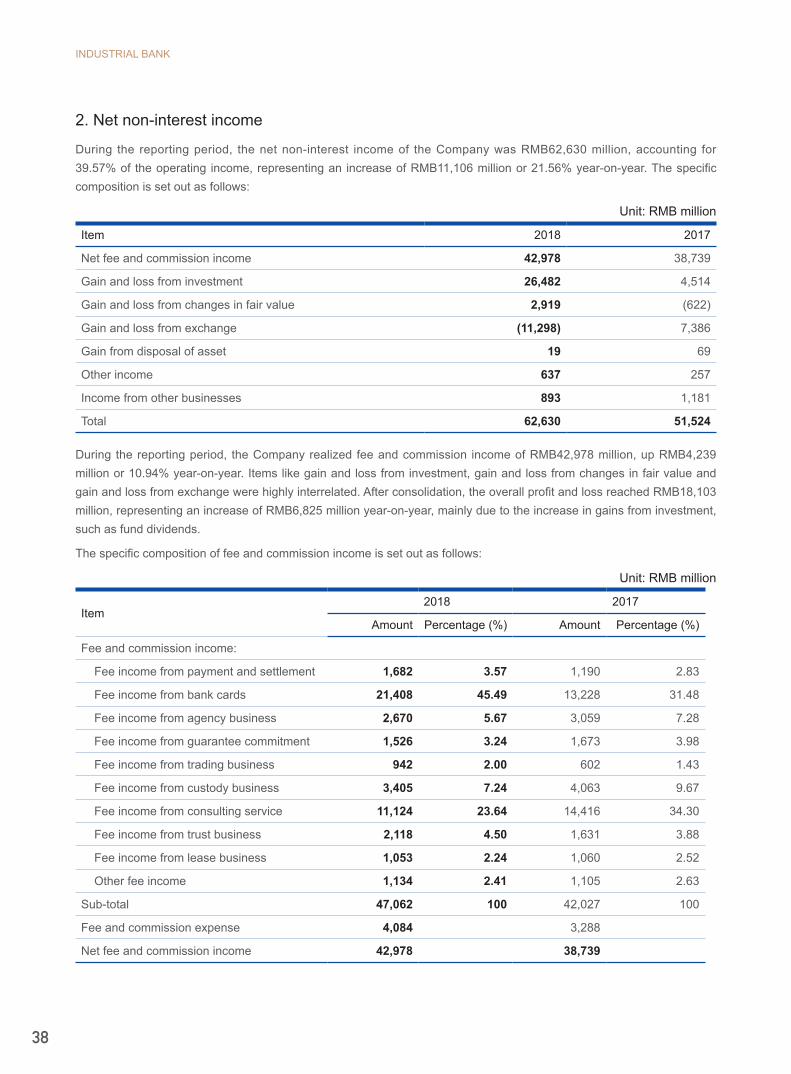
INDUSTRIAL BANK
38
2. Net non-interest income
During the reporting period, the net non-interest income of the Company was RMB62,630 million, accounting for 39.57% of the operating income, representing an increase of RMB11,106 million or 21.56% year-on-year. The specific composition is set out as follows:
Unit: RMB million
Item 2018 2017
Net fee and commission income 42,978 38,739
Gain and loss from investment 26,482 4,514
Gain and loss from changes in fair value 2,919 (622)
Gain and loss from exchange (11,298) 7,386
Gain from disposal of asset 19 69
Other income 637 257
Income from other businesses 893 1,181
Total 62,630 51,524
During the reporting period, the Company realized fee and commission income of RMB42,978 million, up RMB4,239 million or 10.94% year-on-year. Items like gain and loss from investment, gain and loss from changes in fair value and gain and loss from exchange were highly interrelated. After consolidation, the overall profit and loss reached RMB18,103 million, representing an increase of RMB6,825 million year-on-year, mainly due to the increase in gains from investment, such as fund dividends.
The specific composition of fee and commission income is set out as follows:
Unit: RMB million
Item 2018 2017
Amount Percentage (%) Amount Percentage (%)
Fee and commission income:
Fee income from payment and settlement 1,682 3.57 1,190 2.83
Fee income from bank cards 21,408 45.49 13,228 31.48
Fee income from agency business 2,670 5.67 3,059 7.28
Fee income from guarantee commitment 1,526 3.24 1,673 3.98
Fee income from trading business 942 2.00 602 1.43
Fee income from custody business 3,405 7.24 4,063 9.67
Fee income from consulting service 11,124 23.64 14,416 34.30
Fee income from trust business 2,118 4.50 1,631 3.88
Fee income from lease business 1,053 2.24 1,060 2.52
Other fee income 1,134 2.41 1,105 2.63
Sub-total 47,062 100 42,027 100
Fee and commission expense 4,084 3,288
Net fee and commission income 42,978 38,739
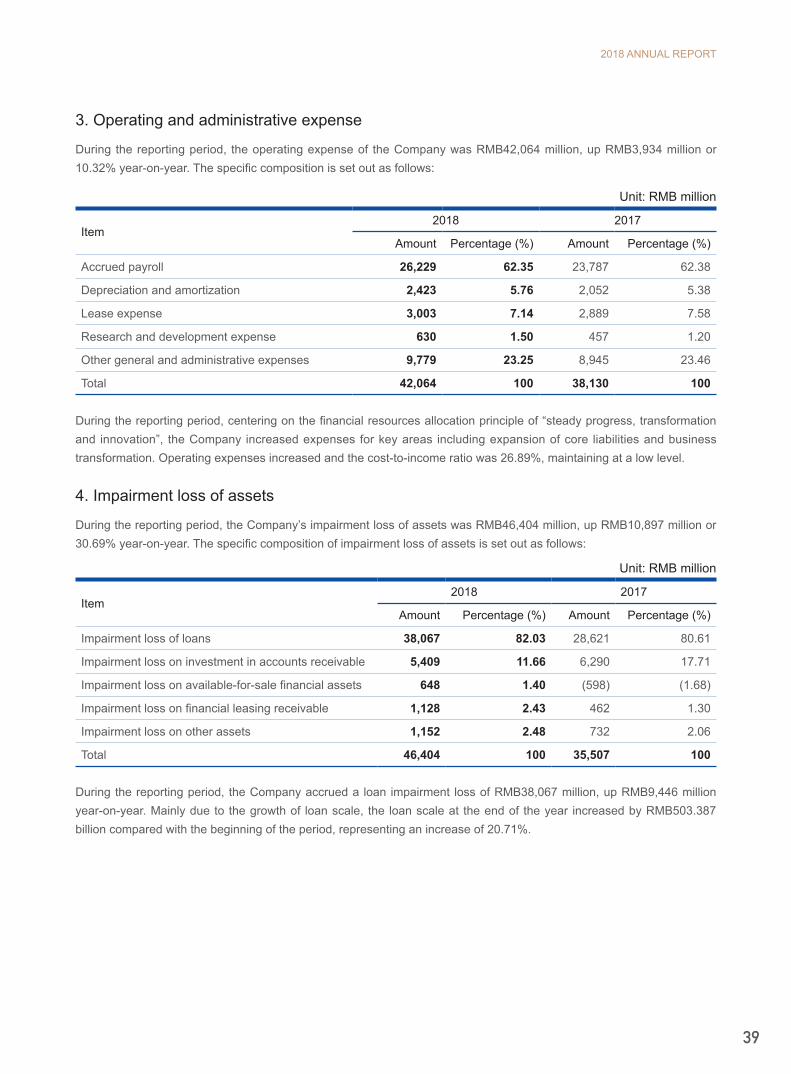
2018 ANNUAL REPORT
39
3. Operating and administrative expense
During the reporting period, the operating expense of the Company was RMB42,064 million, up RMB3,934 million or 10.32% year-on-year. The specific composition is set out as follows:
Unit: RMB million
Item2018 2017
Amount Percentage (%) Amount Percentage (%)
Accrued payroll 26,229 62.35 23,787 62.38
Depreciation and amortization 2,423 5.76 2,052 5.38
Lease expense 3,003 7.14 2,889 7.58
Research and development expense 630 1.50 457 1.20
Other general and administrative expenses 9,779 23.25 8,945 23.46
Total 42,064 100 38,130 100
During the reporting period, centering on the financial resources allocation principle of “steady progress, transformation and innovation”, the Company increased expenses for key areas including expansion of core liabilities and business transformation. Operating expenses increased and the cost-to-income ratio was 26.89%, maintaining at a low level.
4. Impairment loss of assets
During the reporting period, the Company’s impairment loss of assets was RMB46,404 million, up RMB10,897 million or 30.69% year-on-year. The specific composition of impairment loss of assets is set out as follows:
Unit: RMB million
Item2018 2017
Amount Percentage (%) Amount Percentage (%)
Impairment loss of loans 38,067 82.03 28,621 80.61
Impairment loss on investment in accounts receivable 5,409 11.66 6,290 17.71
Impairment loss on available-for-sale financial assets 648 1.40 (598) (1.68)
Impairment loss on financial leasing receivable 1,128 2.43 462 1.30
Impairment loss on other assets 1,152 2.48 732 2.06
Total 46,404 100 35,507 100
During the reporting period, the Company accrued a loan impairment loss of RMB38,067 million, up RMB9,446 million year-on-year. Mainly due to the growth of loan scale, the loan scale at the end of the year increased by RMB503.387 billion compared with the beginning of the period, representing an increase of 20.71%.

INDUSTRIAL BANK
40
5. Income tax
During the reporting period, the effective income tax rate of the Company was 10.04%. The difference between the income tax expense and the amount calculated based on the 25% statutory tax rate is set out as follows:
Unit: RMB million
Item 2018
Profit before tax 68,077
Statutory tax rate (%) 25
Income tax calculated at statutory tax rate 17,019
Effect on tax due to adjustment on the following items:
Tax-exempt income (12,105)
Non-deductible items 1,867
Adjustment on the tax of previous years 51
Income tax expense 6,832
(IV) Analysis of the cash flow statement
Unit: RMB million
Item 2018 2017
Cash flows from operating activities (356,099) (162,642)
Cash flows from investing activities 422,390 268,261
Cash flows from financing activities 10,436 (67,067)
During the reporting period, the net cash outflows from operating activities was RMB356,099 million, representing an increase of RMB193,457 million as compared with last year, mainly due to the increased efforts in loan issuance.
Net cash inflows from investing activities was RMB422,390 million, representing an increase of RMB154,129 million as compared with previous year, mainly due to the reduction of non-standard investment which resulted in a decrease in the increment of investment business.
Net cash inflows from financing activities were RMB10,436 million, representing an increase of RMB77,503 million as compared with previous year, mainly due to the year-on-year increase in interbank deposit business.
2018 ANNUAL REPORT
41
(V) Capital management
1. Capital management overview
During the reporting period, the Company had conscientiously implemented the capital management policy according to the Capital Rules for Commercial Banks (Provisional) of CBIRC. As per “2016-2020 Group Development Plan” and “Industrial Bank Medium-term Capital Management Planning (2018-2020)”, the Company will achieve healthy and sustainable development as well as make sure capital adequacy ratio meet requirements by well performing capital management policies.
In 2018, the Company realized the endogenous, balanced development of capital without external capital replenishment. In accordance with regulatory policies on external capital, it fully demonstrated the necessity and feasibility of external capital replenishment based on the actual needs of the Group’s future business development. In 2018, the Company’s general meeting and the Board of Directors considered and approved plans to issue RMB30 billion of preferred shares and RMB50 billion of secondary capital bonds. So far, RMB30 billion of preferred shares have been issued. Upon the implementation of the above capital replenishment plan, the Company’s capital strength will be further increased, and its ability to resist risks and serve the real economy will be further enhanced.
In 2018, the Company continued to implement a capital-efficient operational and management mode. Based on the annual business operation plan, the Company’s capital retaining abilities and its assets and liabilities management strategy, the Company has reasonably arranged and controlled the bank-wide risk-weighted assets scale. The Company continued to optimize risk-weighted asset quota allocation and control mechanism, as well as the assessment of rates of return on capital on each branch or subsidiary, thereby reasonably adjusting the asset structure and promoting coordinated development of on-balance sheet and off-balance sheet businesses. More emphasis is placed on the effective use of capital and the value creation of unit risk-weighted asset inputs to ensure a stable return on capital.
2. Implementation of the New Capital Accord
Since the official issuance of the Capital Rules for Commercial Banks (Provisional), the Company has steadily and orderly advanced various implementation tasks. At present, a relatively complete first pillar framework system under the New Capital Accord has been constructed, which has effectively improved the risk and capital management capability.
In terms of policy system construction, the Company has established a relatively complete organizational framework and institutional framework under the New Capital Accord, covering such areas as capital adequacy ratio management, internal rating management, exposure classification, slow mitigation determination, model measurement, system verification, rating application, stress testing, and data governance. The Company continued to carry out internal training to cultivate the business philosophy of restricting risk with capital and promote the implementation of the New Capital Accord system.
In terms of project implementation, the Company has launched non-retail internal rating, retail internal rating, credit risk-weighted assets (RWA) and market risk management systems. It has completed the optimization of retail internal score pooling model, pre-production verification and system deployment. Also, it has completed the optimization of the non-retail internal rating model and pre-production verification, and started the third-phase system upgrade.
In terms of the application of measurement tools, the Company continued to promote the application of internal rating results. Core applications mainly included authorization management, credit approval, industry limit management, and customer quotas. Advanced applications mainly included risk-adjusted return on capital (RAROC), capital measurement model construction, risk impairment test for credit assets, stress test, asset quality management, risk preference setting, comprehensive evaluation and provision, risk capital allocation management under the internal evaluation method and risk alert model for credit assets.
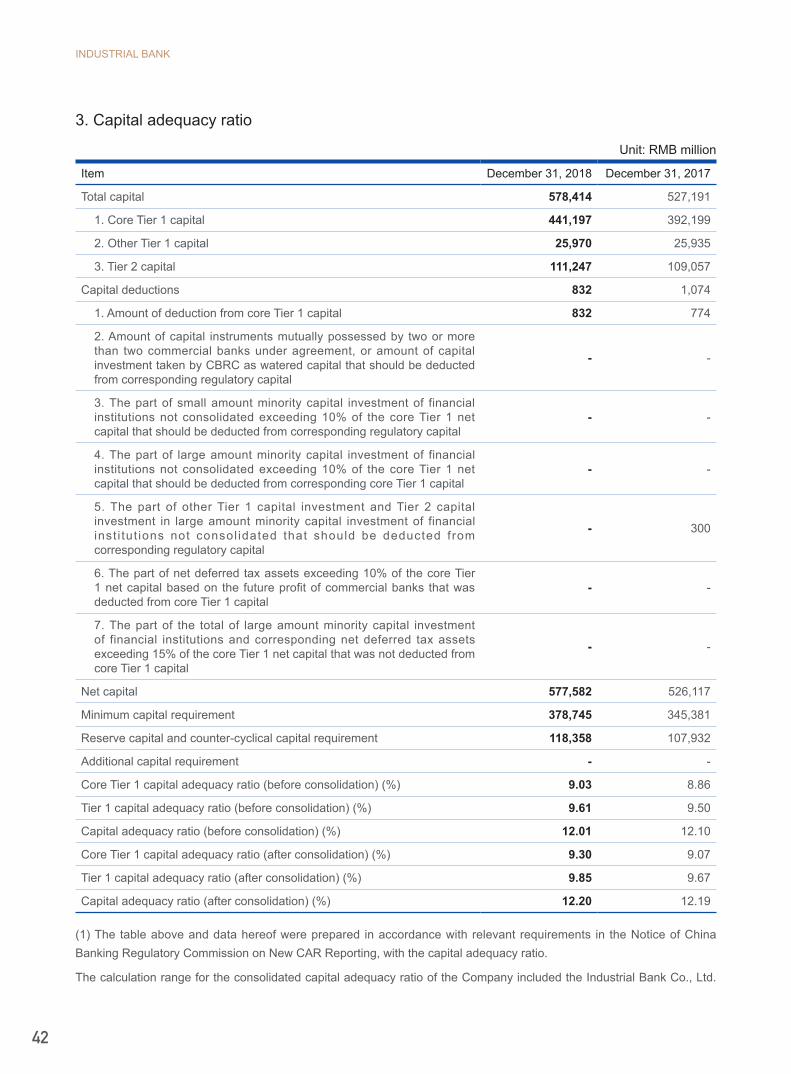
INDUSTRIAL BANK
42
3. Capital adequacy ratio
Unit: RMB million
Item December 31, 2018 December 31, 2017
Total capital 578,414 527,191
1. Core Tier 1 capital 441,197 392,199
2. Other Tier 1 capital 25,970 25,935
3. Tier 2 capital 111,247 109,057
Capital deductions 832 1,074
1. Amount of deduction from core Tier 1 capital 832 774
2. Amount of capital instruments mutually possessed by two or more than two commercial banks under agreement, or amount of capital investment taken by CBRC as watered capital that should be deducted from corresponding regulatory capital
- -
3. The part of small amount minority capital investment of financial institutions not consolidated exceeding 10% of the core Tier 1 net capital that should be deducted from corresponding regulatory capital
- -
4. The part of large amount minority capital investment of financial institutions not consolidated exceeding 10% of the core Tier 1 net capital that should be deducted from corresponding core Tier 1 capital
- -
5. The part of other Tier 1 capital investment and Tier 2 capital investment in large amount minority capital investment of financial inst i tut ions not consol idated that should be deducted from corresponding regulatory capital
- 300
6. The part of net deferred tax assets exceeding 10% of the core Tier 1 net capital based on the future profit of commercial banks that was deducted from core Tier 1 capital
- -
7. The part of the total of large amount minority capital investment of financial institutions and corresponding net deferred tax assets exceeding 15% of the core Tier 1 net capital that was not deducted from core Tier 1 capital
- -
Net capital 577,582 526,117
Minimum capital requirement 378,745 345,381
Reserve capital and counter-cyclical capital requirement 118,358 107,932
Additional capital requirement - -
Core Tier 1 capital adequacy ratio (before consolidation) (%) 9.03 8.86
Tier 1 capital adequacy ratio (before consolidation) (%) 9.61 9.50
Capital adequacy ratio (before consolidation) (%) 12.01 12.10
Core Tier 1 capital adequacy ratio (after consolidation) (%) 9.30 9.07
Tier 1 capital adequacy ratio (after consolidation) (%) 9.85 9.67
Capital adequacy ratio (after consolidation) (%) 12.20 12.19
(1) The table above and data hereof were prepared in accordance with relevant requirements in the Notice of China Banking Regulatory Commission on New CAR Reporting, with the capital adequacy ratio.
The calculation range for the consolidated capital adequacy ratio of the Company included the Industrial Bank Co., Ltd.
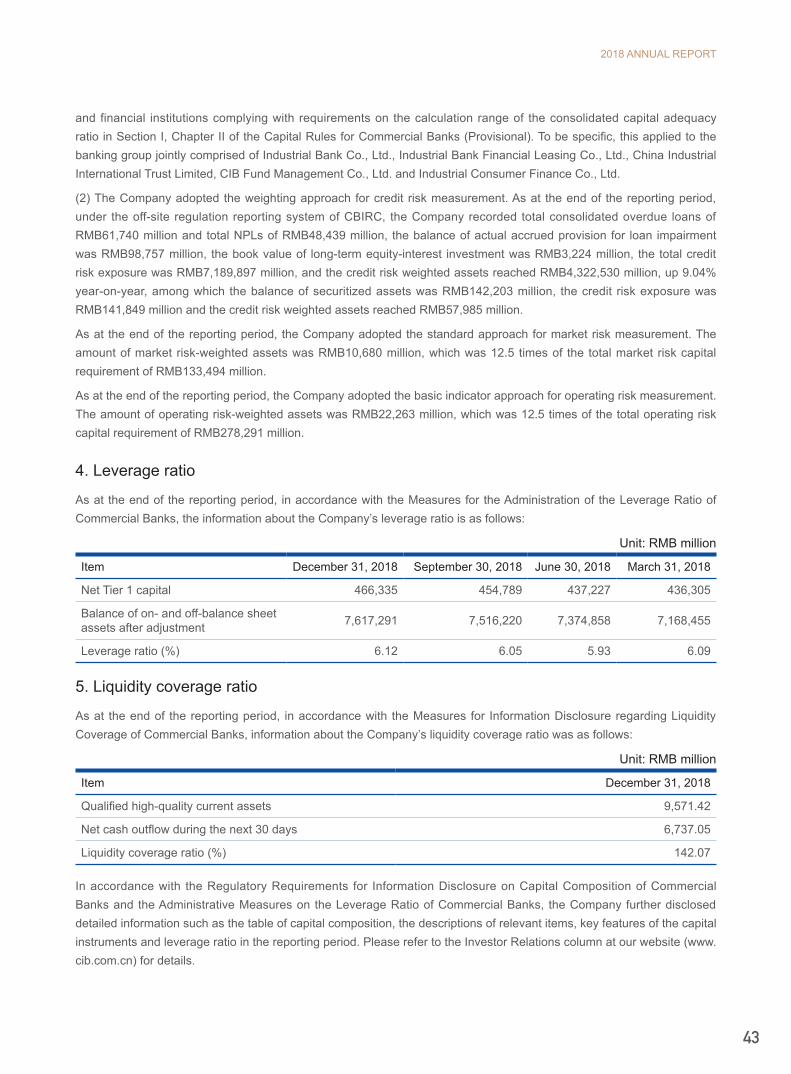
2018 ANNUAL REPORT
43
and financial institutions complying with requirements on the calculation range of the consolidated capital adequacy ratio in Section I, Chapter II of the Capital Rules for Commercial Banks (Provisional). To be specific, this applied to the banking group jointly comprised of Industrial Bank Co., Ltd., Industrial Bank Financial Leasing Co., Ltd., China Industrial International Trust Limited, CIB Fund Management Co., Ltd. and Industrial Consumer Finance Co., Ltd.
(2) The Company adopted the weighting approach for credit risk measurement. As at the end of the reporting period, under the off-site regulation reporting system of CBIRC, the Company recorded total consolidated overdue loans of RMB61,740 million and total NPLs of RMB48,439 million, the balance of actual accrued provision for loan impairment was RMB98,757 million, the book value of long-term equity-interest investment was RMB3,224 million, the total credit risk exposure was RMB7,189,897 million, and the credit risk weighted assets reached RMB4,322,530 million, up 9.04% year-on-year, among which the balance of securitized assets was RMB142,203 million, the credit risk exposure was RMB141,849 million and the credit risk weighted assets reached RMB57,985 million.
As at the end of the reporting period, the Company adopted the standard approach for market risk measurement. The amount of market risk-weighted assets was RMB10,680 million, which was 12.5 times of the total market risk capital requirement of RMB133,494 million.
As at the end of the reporting period, the Company adopted the basic indicator approach for operating risk measurement. The amount of operating risk-weighted assets was RMB22,263 million, which was 12.5 times of the total operating risk capital requirement of RMB278,291 million.
4. Leverage ratio
As at the end of the reporting period, in accordance with the Measures for the Administration of the Leverage Ratio of Commercial Banks, the information about the Company’s leverage ratio is as follows:
Unit: RMB million
Item December 31, 2018 September 30, 2018 June 30, 2018 March 31, 2018
Net Tier 1 capital 466,335 454,789 437,227 436,305
Balance of on- and off-balance sheet assets after adjustment 7,617,291 7,516,220 7,374,858 7,168,455
Leverage ratio (%) 6.12 6.05 5.93 6.09
5. Liquidity coverage ratio
As at the end of the reporting period, in accordance with the Measures for Information Disclosure regarding Liquidity Coverage of Commercial Banks, information about the Company’s liquidity coverage ratio was as follows:
Unit: RMB million
Item December 31, 2018
Qualified high-quality current assets 9,571.42
Net cash outflow during the next 30 days 6,737.05
Liquidity coverage ratio (%) 142.07
In accordance with the Regulatory Requirements for Information Disclosure on Capital Composition of Commercial Banks and the Administrative Measures on the Leverage Ratio of Commercial Banks, the Company further disclosed detailed information such as the table of capital composition, the descriptions of relevant items, key features of the capital instruments and leverage ratio in the reporting period. Please refer to the Investor Relations column at our website (www.cib.com.cn) for details.
INDUSTRIAL BANK
44
II. Discussion and analysis on future development
(I) Industrial pattern and trends
In 2019, the operating environment of commercial banks is still complicated, the policy bottom is basically clear, but the economic bottom and market bottom are still uncertain. There are both the general challenges brought about by the economic slowdown and the structural opportunities arising from policy relaxation. Specifically:
Firstly, the economic growth rate declines first and then stabilizes. Looking outward, it is expected that the Fed will continue to raise interest rates, Europe will start a rate hike process, and emerging markets will face greater pressure of capital outflow, which will have negative impact on China’s economic development and financial market stability. Looking inward, China is still in the period of transition between new and old drivers, and the risk prevention and deleveraging policies issued in the previous stage still impose many constraints on the market entities. China-US trade frictions present great uncertainties. Real estate investment, manufacturing investment, exports, and consumption growth are expected to slow down. At the same time, effects of policy adjustment will gradually be released, to the benefit of the economic growth. As a result, it is expected that China’s GDP will decline slightly from 2018, showing a trend of declining first and then stabilizing. This will pose challenges for business management work of commercial banks such as business development and risk prevention and control.
Secondly, regulatory policies slightly relax though remain stringent. The basic condition of risk prevention and strict regulation will continue. Moreover, faced with economic growth pressure, economic and financial policies are expected to be continuously adjusted and improved, including: comprehensive and rapid de-leveraging will be shifted to structural de-leveraging and stabilizing leverage; fiscal policies are expected to become more pro-active; the Central Bank will reduce the deposit reserve ratio by such means as target reserve ratio reduction through inclusive financing, reserve ratio reduction, MLF, and TMLF to drive the transition from “relaxing currency” to the “relaxing credit”, allowing the exchange rate to fluctuate to a larger extent to release the depreciation pressure; the financial regulation policy will be more gradual and pragmatic; and the policies issued will focus on “compensating for shortcomings” in compliance with international regulatory rules. Commercial banks are gradually getting out of the bottom of the policy impacts. They meet the basic conditions for steady development, and are expected return to rationality with the help of policies and achieve better development of some businesses.
Thirdly, changes in the financial market give rise to opportunities. Given the above economic and policy situation, liquidity is expected to remain reasonably abundant. However, against the backdrop of financial disintermediation and de-leveraging, the “shortfall” in deposits is even more pronounced. The overall market interest rate may drop slightly compared to 2018. The short-term interest rate is basically in place, the term spreads have declined, and the credit spreads have improved overall. At the same time, interest rate gap between China and the US may “be inverted”, increasing exchange rate fluctuation. In addition, the sentiment of the stock market is extremely pessimistic, and underpinned by policies such as resolving the risks associated with stock pledge, the probability of future reversal will increase. In this condition, it is expected that the price of capital will remain relatively low. It will be good opportunities for the investment, transaction, and structure optimization of bonds. There will be more business opportunities in the foreign exchange market and the stock market.

2018 ANNUAL REPORT
45
(II) Development strategy of the Company
In pro-actively response to the new economic normal of the “13th Five-Year Plan” period and the impact of the new financial landscape on the development of banks, the Company has developed a “1234” complete strategic system through gradually exploration, whereas “1” stands for one principal line of improvement while maintaining stability and accelerated transformation that oriented towards light assets, light capital, and high efficiency; “2” stands for the two major businesses – commercial banking and investment banking, with commercial banking as the main-body and investment banking as the functional arm, carried out in a customer-oriented manner; “3” stands for the three capabilities as a settlement bank, investment bank, and transaction bank to be continuously enhanced, emphasizing the balanced development of various business functions. We will work hard in the field of investment banking with distinctive characteristics and consolidate and enhance our advantages, while also remedy our shortcomings in commercial banking sector where the foundation is weak, so that the shortcomings are overcome; and “4” stands for the four key areas – key branches, key industries, key customers, and key products. By integrating industry resources, we will concentrate our superior strengths and precisely allocate limited resources to key areas with high development potential and good comprehensive returns.
(III) Business objectives for 2019
1. The Group’s total assets to increase by 3%-5%;
2. The balance of customer deposits to increase by approximately RMB320 billion;
3. The balance of loans to increase by approximately RMB450 billion;
4. The net profit attributable to the shareholders of the parent company to increase by approximately 4% year-on-year.
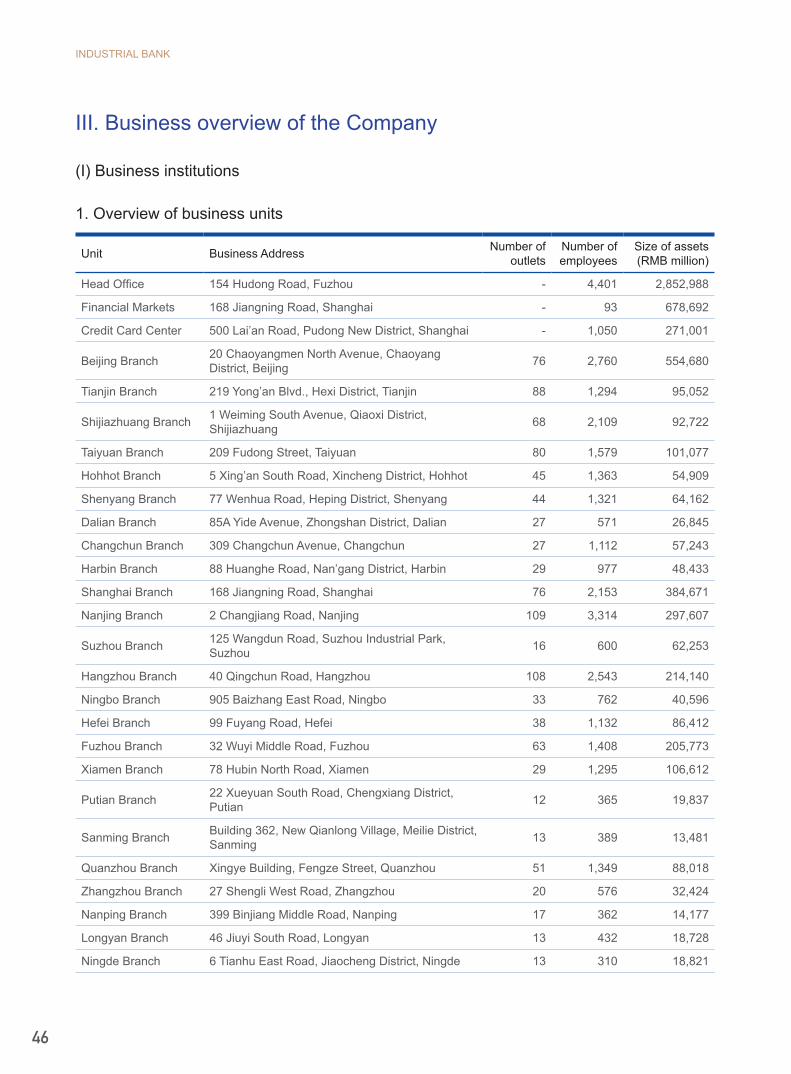
INDUSTRIAL BANK
46
III. Business overview of the Company
(I) Business institutions
1. Overview of business units
Unit Business Address Number of outlets
Number of employees
Size of assets (RMB million)
Head Office 154 Hudong Road, Fuzhou - 4,401 2,852,988
Financial Markets 168 Jiangning Road, Shanghai - 93 678,692
Credit Card Center 500 Lai’an Road, Pudong New District, Shanghai - 1,050 271,001
Beijing Branch 20 Chaoyangmen North Avenue, ChaoyangDistrict, Beijing 76 2,760 554,680
Tianjin Branch 219 Yong’an Blvd., Hexi District, Tianjin 88 1,294 95,052
Shijiazhuang Branch 1 Weiming South Avenue, Qiaoxi District, Shijiazhuang 68 2,109 92,722
Taiyuan Branch 209 Fudong Street, Taiyuan 80 1,579 101,077
Hohhot Branch 5 Xing’an South Road, Xincheng District, Hohhot 45 1,363 54,909
Shenyang Branch 77 Wenhua Road, Heping District, Shenyang 44 1,321 64,162
Dalian Branch 85A Yide Avenue, Zhongshan District, Dalian 27 571 26,845
Changchun Branch 309 Changchun Avenue, Changchun 27 1,112 57,243
Harbin Branch 88 Huanghe Road, Nan’gang District, Harbin 29 977 48,433
Shanghai Branch 168 Jiangning Road, Shanghai 76 2,153 384,671
Nanjing Branch 2 Changjiang Road, Nanjing 109 3,314 297,607
Suzhou Branch 125 Wangdun Road, Suzhou Industrial Park, Suzhou 16 600 62,253
Hangzhou Branch 40 Qingchun Road, Hangzhou 108 2,543 214,140
Ningbo Branch 905 Baizhang East Road, Ningbo 33 762 40,596
Hefei Branch 99 Fuyang Road, Hefei 38 1,132 86,412
Fuzhou Branch 32 Wuyi Middle Road, Fuzhou 63 1,408 205,773
Xiamen Branch 78 Hubin North Road, Xiamen 29 1,295 106,612
Putian Branch 22 Xueyuan South Road, Chengxiang District,Putian 12 365 19,837
Sanming Branch Building 362, New Qianlong Village, Meilie District, Sanming 13 389 13,481
Quanzhou Branch Xingye Building, Fengze Street, Quanzhou 51 1,349 88,018
Zhangzhou Branch 27 Shengli West Road, Zhangzhou 20 576 32,424
Nanping Branch 399 Binjiang Middle Road, Nanping 17 362 14,177
Longyan Branch 46 Jiuyi South Road, Longyan 13 432 18,728
Ningde Branch 6 Tianhu East Road, Jiaocheng District, Ningde 13 310 18,821

2018 ANNUAL REPORT
47
Unit Business Address Number of outlets
Number of employees
Size of assets (RMB million)
Nanchang Branch 1568 Honggu Middle Avenue, Honggutan New District, Nanchang 48 933 41,763
Ji’nan Branch 86 Jingqi Road, Ji’nan 112 3,141 182,349
Qingdao Branch 886 Tongan Road, Laoshan District, Qingdao 22 620 38,223
Zhengzhou Branch 288 Jinshui Road, Zhengzhou 51 1,544 82,683
Wuhan Branch 108 Zhongbei Road, Wuchang District, Wuhan 69 1,444 113,722
Changsha Branch 192 Shaoshan North Road, Changsha 43 1,473 125,240
Guangzhou Branch 101 Tianhe Road, Guangzhou 132 3,705 415,317
Shenzhen Branch 4013 Shennan Boulevard, Futian District, Shenzhen 49 1,615 276,368
Nanning Branch 146 Minzu Boulevard, Qingxiu District, Nanning 31 1,144 61,060
Haikou Branch 7 Jinlong Road, Longhua District, Haikou 12 434 19,820
Chongqing Branch 1 Honghuang Road, Hongqihegou Jiangbei District, Chongqing 63 1,199 116,284
Chengdu Branch 936 Shijicheng Road, Gaoxin District, Chengdu 120 1,950 118,413
Guiyang Branch 45 Zhonghua South Road, Guiyang 15 691 23,324
Kunming Branch 363 Jinbi Road, Xishan District, Kunming 28 889 39,082
Xi’an Branch 1 Tangyan Road, Xi’an 79 1,268 94,120
Lanzhou Branch 75 Qingyang Road, Chengguan District, Lanzhou 15 387 12,308
Xining Branch 54 Wusi West Road, Xining 4 257 15,683
Urumqi Branch 37 Renmin Road, Urumqi 40 775 49,371
Yinchuan Branch 239 Shanghai West Road, Jinfeng District,Yinchuan 2 181 5,044
Lhasa Branch 6 Yangdao Road, Taiyang Island, Chengguan District, Lhasa 1 94 2,394
Hong Kong Branch 3 Garden Road, Central, Hong Kong 1 295 181,839
Netting and summation adjustment within the system (1,966,329)
Total 2,032 59,659 6,549,432
Note: Data in the table above do not include subsidiaries. Only Tier 1 branches (sorted by the administrative regions) which were in operation as at the end of the reporting period are listed in the table above, while data of Tier 2 branches and other sub-branches are included in the data of Tier 1 branches according to the management structure.

INDUSTRIAL BANK
48
2. Overview of major subsidiaries
Unit: RMB million
Name of subsidiary Registered capital Total assets Net assets Operating income
Operating profit Net profit
Industrial Bank Financial Leasing Co., Ltd. 9,000 128,135 15,361 2,850 1,852 1,386
China Industrial International Trust Limited 5,000 37,605 17,542 3,592 1,806 1,360
CIB Fund Management Co., Ltd. 1,200 3,264 2,752 1,097 521 414
Industrial Consumer Finance Co., Ltd. 1,200 22,262 1,944 2,448 651 512
(1) Industrial Bank Financial Leasing Co., Ltd.
Industrial Bank Financial Leasing Co., Ltd. is a wholly-owned subsidiary of the Company with registered capital of RMB9 billion. Business scope includes financial leasing, selling and buying of financial leasing asset, fixed-income security investment, acceptance of lessee’s lease deposits, setting up project companies in domestic bonded areas to engage in finance lease business, among others.
As at the end of the reporting period, Industrial Leasing has total assets of RMB128.135 billion and total liabilities of RMB112.775 billion. Owners’ equity amounted to RMB15.361 billion. Total leasing assets on balance sheet amounted to RMB115.132 billion, which included RMB109.775 billion financing leasing assets and RMB5.357 billion operating leasing assets. During the reporting period, operating income was RMB2.850 billion, operating profit was RMB1.852 billion, and the net profit after tax was RMB1.386 billion.
Industrial Leasing has focused on key business areas that it specializes in. It has enhanced environmental impact database for the green leasing projects, allocated more resources to green leasing business, and promoted the building of a green leasing business structure. During the reporting period, Industrial Leasing has completed 37 green leasing projects with a total value of RMB9.12 billion. As at the end of the reporting period, Industrial Leasing has RMB47.7 billion worth of green leasing assets. Industrial Leasing continued to promote the aviation leasing business. When further exploring domestic market, Industrial Leasing achieved a breakthrough in overseas market. It has signed operating leasing agreements for five Q400 aircrafts with SpiceJet. Industrial Leasing also actively explored the possibility of building a strategic alliance for asset pool trading, and laid a sound foundation for global development of its aviation leasing business.
Industrial Leasing strengthened its coordination with other group members and strived to facilitate the overall development of the Group. In line with the group strategy of “four priorities” and “commercial bank + investment bank”, Industrial Leasing has explored markets with local characteristics and refined its professional positioning in the leasing market. It worked with other group members to provide integrated financial service to key customers from key industries. In addition, Industrial Leasing strengthened its cooperation with other industries as well as peers in the leasing industry. It focused on industrial leaders and leasing companies with industrial background or professional characteristics, so as to serve the key customers of the group and facilitate the transformation in the real economy.
Industrial Leasing has raised funds from diversified channels. First, Industrial Leasing focused on capital borrowing, and used capital lending as a complementary tool. It enriched its trading operations and built an RMB and foreign currency-denominated trading system with diversified counterparties. Industrial leasing also strengthened liquidity management so as to ensure it can repay funds at critical time and its projects’ capital demand can be met. Second, Industrial Leasing actively promoted the diversification of its counterparties, channels and products. It actively sought nonbanking counterparties, and strived to cover all state-owned banks, policy banks, joint-stock banks, major municipal commercial

2018 ANNUAL REPORT
49
banks, rural commercial banks, foreign banks and some nonbanking financial institutions. Third, Industrial Leasing has adopted the principle of sharing concepts, complementing each other and achieving win-win results in the asset trading operations. It traded leasing assets with financial leasing companies that are controlled by central government-owned enterprises or large financial groups, have strong core businesses and are able to generate synergies with their parents. Fourth, Industrial Leasing managed to make progress in the capital market business. During the reporting period, Industrial Leasing issued three tranches of financial debts with a total amount of RMB10 billion, and a three-year syndicated loan with an amount of USD80 million. These moves strongly supported business development of Industrial Leasing.
(2) China Industrial International Trust Limited
China Industrial International Trust Limited is a holding subsidiary of the Company with a registered capital of RMB5 billion and the Company holds 73% of the capital contribution. The business covers fund trust, movable property trust, immovable property trust, negotiable securities trust, other property or property right trust and other businesses stipulated by laws and regulations or approved by the CBIRC.
Industrial Trust has insisted on the strategy of improving efficiency, promoting transformation, adjusting structure and preventing risks. It actively shifted back to the very basic business model of trust companies, and enhanced its risk management. It vigorously promoted the active management business and steadily cut the scale of its passage business, thereby further advancing business transformation and structure adjustment, and enhancing the abilities of serving the real economy. Industrial Trust saw steady improvement in its business performance. As at the end of the reporting period, Industrial Trust’s fixed assets amounted to RMB37.605 billion, up 4.47% from the beginning of the period, owners’ equity was RMB17.542 billion, up 5.12% from the beginning of the period, and the asset under management was RMB891.299 billion. During the reporting period, the realized revenue was RMB3.592 billion, the realized total profit was RMB1.806 billion, and the net profit was RMB1.360 billion. Asset quality remained stable and all indicators met regulatory requirements.
During the reporting period, Industrial Trust continued to shift towards the active management business, and the proportion of the collective trust business continued to increase and Industrial Trust’s business mix continued to optimize. As at the end of the reporting period, the business size of subsisting trust of Industrial Trust reached RMB725.625 billion, with collective trust business accounting for 39.47%, up 7 percentage points from the beginning of the period. During the reporting period, Industrial Trust becomes the first trust company that is allowed to underwrite the new nonfinancial corporate debt financing vehicles by the National Association of Financial Market Institutional Investors. Industrial Trust commenced many innovative trust businesses, including the industry’s first note products backed by actively-managed assets. Such efforts lowered the direct financing thresholds and funding costs of small businesses, and protected investors’ rights and interests. In addition, Industrial Trust actively built green trust brand, and continued to promote business innovation. The size of its green trust business continued to grow and asset returns further hiked. As at the end of the reporting period, Industrial Trust’s subsisting green trust assets reached RMB59.671 billion, up 20.09% from the beginning of the period. In addition, Industrial Trust started to fully standardize the open-ended cash management product Yuanfeng according to the new rules governing asset management business of China. As at the end of the reporting period, the subsisting assets of Yuanfeng
INDUSTRIAL BANK
50
amounted to RMB8.220 billion, up 281.70% from the end of June 2018 when the standardization project was completed.
(3) CIB Fund Management Co., Ltd.
With a registered capital of RMB1.2 billion, of which the shareholding of the Company reaches 90%, CIB Fund Management Co., Ltd., a holding subsidiary of the Company, is principally engaged in fundraising, sales agency services, asset management for specific clients, asset management and other business as permitted by the CSRC. As at the end of the reporting period, CIB Fund has established 15 branches across the nation, including Shanghai, Beijing and Shenzhen as well as the wholly-owned fund subsidiary CIB Wealth Management Co., Ltd.
During the reporting period, CIB Fund witnessed smooth development with respect to various businesses, with its market image and brand position continuously improving. As at the end of the reporting period, the total assets of CIB Fund reached RMB3.264 billion, representing an increase of 14.97% as compared to the beginning of the period; owner’s equity was RMB2.752 billion, representing an increase of 49.08% as compared to the beginning of the period. During the period, it recorded operating revenue of RMB1.097 billion, net profit of RMB414 million and a ROE of 18.02%. Total asset scale under management at the end of the reporting period was RMB378.833 billion, of which mutual fund reached RMB164.769 billion. Size of specific accounts of the fund company reached RMB32.077 billion, and size of specific accounts of the branch companies reached RMB181.988 billion.
CIB Fund has adhered to the strategic goal of “focusing on market demand, pursuing innovation, delivering sound performance and ensuring compliance”. It has focused on enhancing its expertise, operated in a market-oriented manner and strived to differentiate its businesses. Moreover, CIB Fund actively shifted back to the basic business model of fund companies, promoted its business transformation, enhanced active management capabilities and accelerated its development in equity businesses. During the reporting period, CIB Fund launched the first equity fund and was granted the approval to issue ETF equity funds and pension target FOF funds, which enabled CIB Fund to establish a foothold in equity fund, index fund and FOF fund businesses, and further enrich its product portfolio. In addition, CIB Fund has facilitated the implementation of the Group’s “commercial bank + investment bank” strategy, and has initiated joint equity investment business with corporate partners, and built a three-party joint operation platform for capitals, products and funds. By doing this, CIB Fund established a sound cooperation mode and achieved steady business development. During the reporting period, CIB Fund undertook 16 projects, including the commencement of projects with J&H Biotechnology and Shenzhen Capital Group. In addition, it broadened the capital raising channels for equity assets of the Group. In line with the strategy of “four priorities”, CIB Fund strengthened its cooperation with other members of the Group. Through convertible bonds, exchangeable bonds and ABS, CIB Fund engaged in a loan-investment joint operation mechanism where investors can help investees get loans and lenders can help borrowers get investments. By doing this, CIB Fund helped enrich the product portfolio of the Group. CIB Fund also actively cooperated with key customers of the Group, focused on key industries and strengthened its ties with key branches. It cooperated with listed industry leaders with strong performances and their shareholders to establish merger & acquisition funds.
(4) Industrial Consumer Finance Co., Ltd.
Industrial Consumer Finance Co., Ltd. is a controlling subsidiary of the Company. It has a registered capital of RMB1.2 billion, of which the Company had a stake of 66%. It is engaged in provision of personal finance loans, deposit-taking from shareholders’ domestic subsidiaries as well as domestic shareholders, lending to domestic financial institutions, issuance of financial debts, domestic interbank lending, advisory and agency services related to consumer finance, fixed income securities investment and other business approved by the former CBRC.
Industrial Consumer Finance has strived to build strong creditability and offer loans with high integrity standards. It has aligned itself with China’s policy of consumption upgrading and the latest development trend in the consumer finance industry. Through various measures, Industrial Consumer Finance managed to enhance its core competency. As at the end of the reporting period, Industrial Consumer Finance has total financial assets of RMB22.262 billion. During the
2018 ANNUAL REPORT
51
reporting period, Industrial Consumer Finance recorded an operating income of RMB2.448 billion and a net profit of RMB512 million. Industrial Consumer Finance has strived to expand both online and offline. It has leveraged the network of the Company to expand nationwide, and strengthened its cooperation with community branches. Since its opening, Industrial Consumer Finance has referred nearly 400,000 debit card customers to the Company. Meanwhile, Industrial Consumer Finance has actively promoted its Internet finance business. It started from the “Kong Shou Dao” APP and created a series of convenient online products, which supplemented its offline operations.
Industrial Consumer Finance continued to revamp its risk management mechanism. It focused on building a full-process risk management system that covers processes before, during and after lending. First, Industrial Consumer Finance standardized the work procedures, and required in-house customer managers to inspect and visit in person, and talk and sign face to face. The offline operation has not detected any identity fraud until now. Second, Industrial Consumer Finance jointly used the traditional and emerging credit information. It attached high importance to application of frontline risk control technologies, and used machine learning algorithm to improve model development technologies and construct automatic loan approval system, which enhanced approval efficiency and risk-adjusted returns.
During the reporting period, Industrial Consumer Finance completed capital increase, and managed to grow its registered capital to RMB1.2 billion. In addition, Industrial Consumer Finance actively explored other financing channels. First, it was allowed to enter the interbank lending market, and successfully raised the first syndicated loan with a total amount of RMB933 million. Second, it made breakthroughs in asset securitization business. In December, it issued the first ABS with the value of RMB1.925 billion.
Other Important Subsidiaries
(5) Industrial Futures Co., Ltd.
China Industrial Futures Limited is a holding subsidiary of the Company with a registered capital of RMB0.5 billion. Business scope includes: commodity futures brokerage, financial futures brokerage, futures investment consulting and asset management business. Industrial Futures is a member of Shanghai Futures Exchange, Zhengzhou Commodity Exchange, Dalian Commodity Exchange and Shanghai International Energy Exchange, and is also a transaction settlement member of China Financial Futures Exchange.
During the reporting period, Industrial Futures demonstrated strong growth momentum, and further enhanced its industrial positions and reputation in the market. In terms of aggregate customers’ equity value, Industrial Futures ranked No.32 among the 149 futures companies nationwide. As at the end of the reporting period, Industrial Futures has total assets of RMB3.952 billion, up 16.86% year on year. Its aggregate customers’ equity amounted to RMB3.315 billion, up 13.71% year on year.
Industrial Futures adhered to the operating principles of “high starting points, standardization, first-class services and customer-oriented”. On the back of the advantages of its banking parent, Industrial Futures focused on its core business of traditional brokerage, and further promoted the business of risk management, asset management and financial futures. It strengthened risk management, advocated investing in a scientific manner, operated in a standardized way and managed in a strict style. It has strong reputation and is one of the relatively influential futures companies in the market. At present, Industrial Futures has established a wholly-owned risk management subsidiary - Industrial Yinxin Capital
INDUSTRIAL BANK
52
Management Co., Ltd. It has 17 branches, including subsidiaries in Shanghai, Beijing, Zhejiang, Fujian, Guangdong, Shenzhen, Henan, Dalian, among others, and 5 Futures Business Departments and Asset Management Departments directly managed by the Head Office. It has built a nationwide presence in major economic centers of China and established footholds in areas that it specializes in. In addition, Industrial Futures has effectively integrated technological, R&D, trading, compliance and internal control resources, and explored futures brokerage, investment advisory, asset management, risk management, internationalization and other innovative businesses. It is moving towards its goal of becoming a leading national integrated financial derivative services operator and provider.
(6) CIB Economic Research and Consulting Co., Ltd.
CIB Research is a wholly-owned subsidiary of the Company with a registered capital of RMB0.6 billion. Its business scope includes: researches on macro economy, asset allocation strategy, fixed income, overseas studies, green finance, exchange rate and commodities, fund research, equity research, industry research, credit rating and research services in other areas.
CIB Research adhered to the principle of “creating value through researching”. It focused on financial asset pricing and continuously enhanced its researching capabilities. It also consistently enhanced its product portfolio. Internally, CIB Research strived to facilitate the transformation and development of the Group, and actively provided research support for the Company’s development strategy of “commercial bank + investment bank”. Externally, CIB Research has served other market players and strived to provide professional and quality research services and products based on the practices of China’s financial reform and development. During the reporting period, CIB Research has provided various research and product support for internal customers. It carried in-depth analysis into key issues such as group strategy, transformation of asset management business, coordinated development of subsidiaries, among others. Based on such analysis, CIB Research provided various topical research reports and strategies. Externally, CIB Research entered into cooperation agreements with over 70 customers, including banks, non-banking financial institutions, government agencies, businesses and other market participants. These efforts made CIB Research an even more influential player in the industry and enhanced CIB Research’s brand reputation.
CIB Research further transformed its products and services. It teamed up with Shanghai Clearing House (SCH) to launch CIB Research SCH 3-5 Years Middle to High-Grade Select Credit Bond Index. This is the first credit bond index that incorporates the internal credit ratings of a third party. CIB Research has accelerated the construction of its credit product system. It seized market opportunities, acted with foresight and managed to build a comprehensive, multi-layer and standardized credit product and service portfolio that is accessible to all debt issuers in the market. It also actively organized on-site company visits to key regional debt issuers, thereby facilitating the communication between enterprises and capital market, and better serving the real economy.
CIB Research grasped the development trends in financial market. In response to customers’ demand, CIB Research has issued about 2,000 research reports, including about 1,000 highly customized reports and over 740 VIP reports. These reports covered areas including macro-economic conditions, asset-liability strategy, credit rating, fixed income, exchange rates and precious metals, green finance, industry researches and others. CIB Research’s green finance research team prepared and issued CIB Green Finance Prosperity Index (GPI) to reflect the first-hand information in development of green industry and provide guidance for development of green finance business in financial institutions. CIB Research’s exchange rate and precious metal research team focused on predicting exchange rate trends, and managed to identify the inflection points in RMB/USD exchange rates, crude oil prices and gold prices. The team has formulated VIP reports that forecast market trends, and built a research chain that projects market trends, interprets policies and introduces related products. CIB Research’s asset-liability strategy research team focused on studying banks’ asset-liability management, and constructed an analysis system that covers liability and liquidity management, capital management and asset allocation. CIB Research’s fixed income research team has correctly forecasted the market movements and corrections in the bond market, and thus enhanced its reputation and became an influential player in the fixed income field.
2018 ANNUAL REPORT
53
(7) CIB FINTECH (Shanghai) Co., Ltd.
CIB FINTECH (Shanghai) Co., Ltd. is a holding subsidiary of the Company with a registered capital of RMB0.5 billion. Business scope includes financial data cloud service and open bank integrated financial services. CIB FINTECH is a pioneer in fintech, and has established two major development courses since its establishment. The first is continuously developing and building a strong financial cloud so as to provide comprehensive financial cloud services for small and medium-sized banks and non-banking financial institutions. The second is to make breakthroughs and innovate so as to build an open banking platform, and become a connecter between the “Bank End” and “Customer End” through open banking service API and micro innovation.
CIB FINTECH’s financial cloud business continued to make progress in customer base expansion and product upgrading. As at the end of the reporting period, the financial cloud has 178 customers that operate online. In terms of customer base expansion, the financial cloud has managed to expand its customer base from municipal commercial banks, private-sector banks and rural banks to foreign banks, financial companies and financial leasing companies. In terms of product upgrading, the new generation of banking information system (including core systems) is already operational at municipal commercial banks and rural banks. In addition, CIB FINTECH has introduced disaster recovery cloud products to provide data-level and application-level disaster recovery services to financial customers. CIB FINTECH actively took part in the formulation of various industry standards, including the Financial Application Standards for Cloud Computing Technology – Technology Architecture/Safety Technology Requirements/Disaster Recovery (issued by the Financial Standards Committee) and the Reliable Financial Cloud Services – Banks (issued by the Ministry of Industry and Information Technology), among others.
In terms of innovative businesses, the open banking platform has provided 72 API services to external customers, which involved users, accounts, information, payment, security, socializing, wealth management, among others. These open APIs were connected to business ecosystems and generated new accounts, settlement deposits and other benefits for the Group and customers. As at the end of the reporting period, the open banking platform has completed 135 million transactions, which had a total value of RMB154.4 billion and introduced 179,400 customers to the bank-end. CIB FINTECH is also making breakthroughs in RPA (robotic process automation). It has developed over 10 process robots that generate good benefits in retail, auto finance, marketing and operational management. In addition, CIB FINTECH has built a sharing mechanism with leading incubators, and introduced industrial and technological partners to drive innovation. These efforts created a financial ecosystem that generates win-win results. CIB FINTECH also provided innovative incubation advisory services to external customers.
(8) China Industrial Asset Management Co., Ltd.
China Industrial Asset Management Co., Ltd. is a holding subsidiary of the Company with a registered capital of RMB1.95 billion. Industrial Asset Management was registered with the approval of the People’s Government of Fujian Province and the former CBRC on February 20, 2017, and has the qualification to massively acquire and dispose non-performing assets of financial institutions as a provincial asset management company. Its business scope includes: participating in massive acquisition, transferring and disposal of financial institutions’ non-performing assets within Fujian Province; acquiring, transferring and disposing nonfinancial institutions’ non-performing assets; debt restructuring and corporate restructuring; debt-to-equity swap, managing, investing in and disposing equity assets; bankruptcy management; investment and asset management; asset securitization; fund custody management, among others.
During the reporting period, Industrial Asset Management adhered to the strategic goal of “building first-class integrated special asset service provider in China”. It insisted on the operating principle of “winning by compliance and expertise”, and ensured its business grew in a standardized manner. Thanks to its efforts, Industrial Asset Management made breakthrough in the business of acquiring nonperforming assets, and steadily developed the business of massive disposal of nonperforming assets. Its operating results increased at a steady and rapid pace. As at the end of the reporting period, Industrial Asset Management has total assets of RMB13.376 billion, representing a growth of RMB3.766 billion from
INDUSTRIAL BANK
54
the beginning of the period. Total liabilities amounted to RMB10.234 billion, representing a growth of RMB3.662 billion from the beginning of the period. Owners’ equity hit RMB3.142 billion, representing a growth of RMB105 million from the beginning of the period. During the reporting period, its operating income reached RMB182 million, total profits amounted to RMB134 million and net profit hit RMB104 million.
Taking root in Fujian and facing the nationwide market, Industrial Asset Management will fully leverage its local AMC license to continuously explore the non-performing assets disposal business. Industrial Asset Management reinforced its role as a “financial stabilizer and safety network” for local economic development, and solidified its leading position in regional market. During the reporting period, Industrial Asset Management acquired a total of 41 non-performing asset debt packages with a total debt value of RMB15.516 billion. As at the end of the reporting period, it held 44 non-performing asset debt packages with a total debt value of RMB19.137 billion, increasing by 23 and RMB6.838 billion from the beginning of the period, respectively. During the reporting period, Industrial Asset Management acquired 19 primary-market non-performing asset packages in Fujian Province, with a debt principal of RMB6.71 billion. Industrial Asset Management has owned nearly 30% share in Fujian market, which is one of the highest in the region.
(II) Business analysis
1. Customer lines
Corporate finance business
(1) General information
The corporate finance business has followed the Chinese government’s requirements of “stabilization in six aspects”, and centered on the basic keynote of progressing steadily. It implemented the strategy of “1234” by exploring new markets and improving internal management. These efforts promoted development in all aspects of the corporate finance business. First, the business’ assets and liabilities increased in a balanced manner. As at the end of the reporting period, the corporate deposits amounted to RMB2,772.903 bil l ion, increasing by RMB114.415 billion from the beginning of the period. Corporate loans reached RMB1,771.182 billion, increasing by RMB249.241 billion from the beginning of the period. Second, the business’ customer base expanded and customer quality improved. As of the end of the reporting period, the corporate finance business has a total of 704,000 customers, up by 83,100 from the beginning of the period. The corporate finance business’ value and core customers aggregated at 96,000, up by 14,000 from the beginning of the period. The customer mix has met the regulatory requirements of “two increases and two controls”. The small business loan customers in the inclusive finance business aggregated at 36,000, up by 10,200 from the beginning of the period. Third, the corporate finance business stepped up its efforts in exploring key business areas. During the reporting period,
2018 ANNUAL REPORT
55
the business issued RMB60 billion green finance debts in domestic market, and USD938 million green bonds in overseas markets. It is the biggest green bond issuer in the market. The corporate finance business also made breakthroughs in the note financing business. All 43 branches of the Company completed the digitalization of electronic note financing operation. The supply chain finance business expanded its scale, and characteristic branches set good examples. The corporate finance business also enhanced its image as a facilitator of “smart city” building, and significantly expanded its business coverage in this regard. The cross-border settlement amount also increased significantly, and related product portfolio was further enhanced.
(2) Large customer business
During the reporting period, the large customer business focused on building a sound customer service system, expanding its customer base, enhancing customer quality, and strengthening its presence in key industries. The large customer business completed all operating goals and laid a sound foundation for the transformation of the corporate finance business.
First, customer number steadily increased. As at the end of the reporting period, the number of large corporate customers reached 39,799, up by 3,669 from the beginning of the period. The number of subsidiaries of Head Office-level key customers that cooperated with the Company reached 8,249, up by 799 from the beginning of the period. 2,952 companies that are already or plan to be listed were cooperating with the Company, up by 275 from the beginning of the period.
Second, the large customer business established the strategic customer center, which optimized the operational and organizational structure of the large customer business. In addition, the large customer business optimized the key corporate customer screening standards, expanded the screening scope of customers, implemented a budget-based management and launched key products. The large customer business kept strengthening its cooperation with large customers, especially key customers. As at the end of the reporting period, large customer corporate loans (including discounted bills) reached RMB876.383 billion, increasing by RMB111.412 billion from the beginning of the period. Daily average deposits of subsidiaries of Head Office-level key customers reached RMB496.954 billion, increasing by RMB114.197 billion from the beginning of the period. Corporate loans (including discounted bills) reached RMB385.729 billion, increasing by RMB32.871 billion from the beginning of the period. Daily average deposits of listed or to-be-listed companies that cooperated with the Company reached RMB197.486 billion, increasing by RMB48.707 billion from the beginning of the period. Financing balance reached RMB346.657 billion, increasing by RMB96.209 billion from the beginning of the period.
Third, the large customer business achieved steady growth in institutional business and auto finance business through special marketing campaigns. The institutional business for the first time was granted the qualification to act as a centralized payment agency for the central government’s national treasury. It has actively explored the agency business and strived to serve downstream customers. In the institutional business, the Company adopted marketing sand-tables for different customer categories. It adopted precision marketing measures for existing and new customers, including business bidding, system promotion, among others. This boosted the marketing efficiency and ensured high quality growth in liabilities. As at the end of the reporting period, the Company has 26,850 institutional customers, increasing by 2,082 from the beginning of the period. Daily average deposits reached RMB 692.979 billion, increasing by RMB61.760 billion from the beginning of the period. In the auto finance market, the Company strengthened marketing activities targeting key customers, accelerated the use of customized products for auto finance and promoted construction and development of “Xing Che Rong” platform. The Company is cooperating with key passenger vehicle makers, dealership groups, auto part makers, commercial vehicle makers and important construction machinery makers in China in the financial field. The Company achieved strong growth in each business indicator of the auto finance business. As of the end of the reporting period, the auto finance business has 7,895 customers, increasing by 803 from the beginning of the period. Daily average deposits reached RMB95.805 billion, increasing by RMB12.013 billion from the beginning of the period.
INDUSTRIAL BANK
56
(3) Medium and small enterprise business
The business focused on middle-sized strategic partner customers, small credit customers, as well as technological innovation finance customers. By “building platform and sand-tables, and stepping up marketing efforts”, the Company ensured quality business development. As at the end of the reporting period, the Company had 637 thousand medium and small enterprise customers, representing an increase of 77 thousand compared with the beginning of the period; the balance of medium and small enterprise loans reached RMB760.635 billion, representing an increase of RMB115.653 billion compared with the beginning of the period. Customer number and quality continued to improve, and business size steadily expanded.
First, the Company has enhanced the efficiency of the customer acquisition platform according to its business focus. The Company followed six key directions. It served supply chain clusters, provided mortgages to industrial park and plant clusters, shared risks with the government and other parties, provided financing solutions in electronic form, built non-credit customer acquisition platform, and established platform to work with equity institutions to acquire customers. Thanks to these efforts, the business’ customer acquisition channels are optimized. As of the end of the reporting period, the Company is serving 468 small enterprise clusters, with nearly 8,000 credit customers and RMB35.109 billion loan balance. Second, the Company has made steady progress in strengthening its cooperation with middle-sized strategic customers. It used big data technology to acquire new customers and pursue new opportunities from its existing customer base. Leveraging the customized products for small businesses, the Company strived to serve corporate customers who have leading positions in their niches. As at the end of the reporting period, the Company has 1,333 middle-sized strategic partner customers, and 1,658 potential strategic partner customers. Third, the Company shifted the business focus toward the lower tier of enterprises and enhanced its capability of serving small businesses. It offered guidance and industry researches on key business investment, and continuously enhanced its product portfolio. The Company also explored online financing solutions for small businesses so that it can extend more loans to small businesses and fulfill the regulatory requirements of “two increases and two controls”. As at the end of the reporting period, the small business loan customers in inclusive finance business aggregated at 36,000, up by 10,200 from the beginning of the period. Loan balances amounted to RMB91.998 billion, up by RMB34.991 billion from the beginning of the period. The loan growth rate and completion rate are among the best in the industry. Fourth, the Company transformed its business model and continued to build a technological innovation finance service system. It has improved its product and service system at faster paces, commenced the intellectual property pledge business, and enhanced the products that combine investment and loans. The Company constructed the “Zhi Ma Kai Hua – Industrial Investment” online business-matching platform, which helped technological innovation companies acquire customers and transform business models. As at the end of the reporting period, the Company has 20,200 technological innovation finance customers, up 5,631 from the beginning of the period.
(4) Transaction bank business
The transaction bank business has continued to return to the basic nature of financial services and transform its business model. It has strengthened its presence in bill business, supply chain finance, cross-border finance and cash

2018 ANNUAL REPORT
57
management business. It further moved towards the goal of becoming a settlement bank. In addition, it beefed up product innovation and optimization and strengthened its ability of serving the real economy. During the reporting period, the transaction bank unit saw steady growth in all businesses.
As at the end of the reporting period, bill acceptance transaction amount reached RMB821.104 billion, up by RMB211.229 billion or 34.63% year on year. In terms of revenue, the bill business’ revenue was less than RMB1 billion in 2016, and this figure exceeded RMB4 billion in 2018, realizing explosive growth. Balance of supply chain finance business reached RMB115.899 billion, nearly four times of that in 2016. Local and foreign currency cross-border settlement amount reached USD151.023 billion, up by USD35.86 billion or 31.14% year on year. Daily average foreign-currency deposits of domestic enterprises reached USD21.766 billion, up by USD4.344 billion or 24.93% from the beginning of the period. Based on data from the PBOC about foreign currency deposits and loans, the Company ranked No.1 among joint-stock banks in terms of foreign currency deposits and loans since April 2018. Cash management customer account transaction amount for key products reached RMB24.45 trillion. The Company also helped build the nationwide medical reform system platform, and has started from the medical system in Fujian Province. The Company became the sole strategic cooperation bank of the Medical Reform Office of Fujian Province. Number of business customers in Internet payment business increased to 31,269 in 2018 from 3,215 in 2016, a nearly 900% growth.
(5) Green finance business
In accordance with the requirements of “becoming a first-class integrated green finance service provider and a market-leading green finance group”, with the mid-term target of “Two Ten-Thousands” (i.e. the financing balance of green finance reached RMB1 trillion and the number of customers of green finance reached ten thousand) at the center, and focusing on key areas such as the development and utilization of water resource and air pollution prevention and treatment, solid waste disposal, rail public transportation, and green buildings, the green finance continued to strengthen the support of finance services to ensure the healthy and rapid development of the green finance business, further enhance its market influence and solidify its leading position in the market.
First, the green finance business developed steadily, rapidly and healthily. As at the end of the reporting period, the balance of green finance financing was RMB844.9 billion, representing an increase of RMB164.3 billion from the beginning of the period. The number of green finance customers was 12,143, which was 2,253 higher than that at the beginning of the year. The approved quota of domestic green finance bonds was RMB80 billion, and RMB60 billion was issued in the same year, with an accumulated issued amount of RMB110 billion. The total issue amount of overseas green bonds approved USD938 million, making the Company the largest green bond issuer on the market. Second, the green finance business provided even stronger expertise support and further enhanced its influence. The Company was invited to join the Green Finance Standardization Working Group of China Financial Standardization Technical Committee and the “Belt and Road” International Alliance for Green Development, and the Green Bond Standards Committee, and became the Deputy Director of the Green Finance Cooperation Committee of the Asian Financial Cooperation Association. It was invited to participate in the index planning and design for the inclusion of green credit into the MPA assessment, the update of green credit guidelines standards and the development of green industry directory. It entered into green finance strategic cooperation agreements with the governments of Gansu, Qinghai and Jilin Provinces. It entered into green finance inter-industry cooperation agreements with several local urban commercial banks and rural commercial banks such as Huzhou Bank and Anji Rural Commercial Bank to give full play to the professional advantages of green finance and promote interbank business cooperation. Third, environmental benefits are more obvious. As of the end of the reporting period, green finance support projects achieved annual savings of 29.79 million tonnes of standard coal, the annual reduction of carbon dioxide of 84.1687 million tonnes, the annual reduction of chemical oxygen demand (COD) of 3.9834 million tonnes, annual comprehensive utilization of solid waste of 45.4375 million tonnes, and annual water saving of 409.7819 million tonnes. The above volume of energy-saving emission reduction is equivalent to the closure of 193 thermal power stations of 100MW and 100 thousand taxis parking for 40 years. Fourth, brand reputation of the Company’s green finance business achieved significant results. The Company won many awards, including the “Best
INDUSTRIAL BANK
58
Green Bank of the Year” by Asiamoney and “Best Green Finance” by China Banking Association. It carried out the green finance special promotion campaign on the World Environment Day (5 June) in Hefei and Wuhan, organized “Virtuous Benefits – Green Finance Summit Forum”, compiled and published Virtuous Benefits - Exploration and Practice of Green Finance of Commercial Banks, and exclusive supported the charity event “Green Finance Media Workshop”.
Retail finance business
(1) General information
During the reporting period, the number of valuable retail customers increased rapidly, the scale of comprehensive financial assets of retail customers continued to increase, the operating efficiency increased steadily, and the proportion of retail business net operating income significantly increased. As at the end of the reporting period, the number of retail banking customers (including credit cards) was 68.5723 million, an increase of 13.0526 million over the beginning of the period. The balance of financial assets of retail customers totaled RMB1,771.4 billion, a year-on-year increase of RMB272.6 billion. During the reporting period, the income of the retail intermediary business was RMB26.977 billion, an increase of 38.22% year-on-year. Net income of retail banking was RMB45.146 billion, up 26.48% year-on-year.
(2) Asset and liability management
In respect of retail l iabil it ies, the Company continued to give priority to deposits, vigorously developing the retail liabilities, especially statutory deposit. The scale and market share of the Company’s retail l iabilit ies continued to increase. As at the end of the reporting period, the balance of personal deposits was RMB531.160 billion, representing an increase of RMB101.729 billion from the beginning of the per iod, of which savings deposits amounted to RMB458.184 billion, representing an increase of RMB80.337 billion from the beginning of the period.
In respect of retail credit business, in addition to standardizing residential mortgage loan business, the Company continued to expand inclusive finance business. As at the end of the reporting period, the balance of personal loans (excluding credit cards) was RMB873.750 billion, up 22.25% from the beginning of the year. The total amount of personal loans issued during the reporting period was RMB357.533 billion, up 38.55% year-on-year.
(3) Retail wealth management business
In respect of wealth management business, the Company actively responded to new regulatory requirements and dauntlessly innovated. It boosted the sales of bank wealth management products through net-value transformation, focusing on both the growth of scale and sales transformation. It strengthened market analysis, actively adjusted product supply strategy, and promoted the custody sales of funds, insurance and trust products. It also strengthened the coordination of the product supply of the Group’s pan-wealth management businesses. As at the end of the reporting period, the retail wealth management financial assets totaled at RMB1,280 billion, increasing by 14% year-on-year. The retail wealth management intermediate business recorded an income of RMB5.126 billion.
2018 ANNUAL REPORT
59
(4) Bank card business
The Company performed well in the innovation and management of debit card products, further consolidating the personal debit card and account base, improving service quality and ensuring compliant operations. As at the end of the reporting period, there were 52.55 million debit cards issued, an increase of 6.0160 million from the beginning of the period. The number of debit card customers was 45.5645 million, and the per capita debit card number was 1.15. The cumulative development of acquiring merchants was 992,200.
The Company strengthened the construction of the Internet platform and drove the rapid development of integrated finance business with merchants. It launched WeChat public account for merchant services which supported such functions as merchant binding, real-time push of transaction information, transaction detail inquiry, and credit card application. It deepened the construction of the payment environment by creating a demonstration project for convenient mobile payment to vigorously promote the application of mobile payment in the field of convenient payment. It launched the UnionPay Standard Condensation Code product, introduced Sunmi Industry Application Platform, and completed the upgrade of the commissioned logistics platform to maintain the competitiveness of acquiring products. During the reporting period, the Company’s express payment product bundled a total of 26.7554 million customers, recording a total transaction number of 1.996 billion and transaction value of RMB741.69 billion. The Company developed nearly 5.8557 million mobile payment customers of UnionPay cloud flash payment. The business indicators ranked top among peer banks. The Company participated in the assessment of the PBOC with the branch of Fujian Province as a key demonstration area. In the assessment, the Company’s card issue side and acquiring side in the fourth quarter of 2018 ranked first in the industry.
(5) Credit card business
As at the end of the reporting period, the Company issued 42.7128 million credit cards in aggregate, and 11.6662 million new cards were issued during the period, up 14.10% year-on-year; and a total transaction amount of RMB1,518.495 billion was achieved during the reporting period, up 53.30% year-on-year.
Seizing the historical opportunity arising from the transformation of China’s economic growth model to a consumption-driven model, the Company used financial technology to build the abilities of accurate customer acquisition, refine operations and intensive operations for credit cards. Firstly, the Company relied on its “big retail” system to actively promote the coordinated development of debit card and credit card, activate business drivers, and further explore the construction of systems and mechanisms that were compatible with the development of financial technology and highly integrated with the features of the credit card business. In response to customer needs and preferences, it improved the interest-bearing product system and the scenario system, and built a business model with refined customer tiers driven by data, achieving precise resources allocation. Secondly, the Company strengthened channel construction, optimized the card issuance structure, and improved the ability to acquire customers through marketing. It deepened the brand connotation of “Dynamic Life” through such activities as establishing strategic cooperation with Jingdong on “sports + finance” brand and carry out joint marketing, and cooperated with head websites of Internet vertical segmentation such as Mango TV and PP video on joint cards to consolidate the Company’s image of youthful vitality and as a pioneer straddling sports and finance. It accelerated the construction of the “Hao Xing Dong” APP platform, deeply optimized the customer journey, vigorously expanded O2O merchant scenarios, and explored the integrated business model of retail business based on various real-life consumption scenarios. Thirdly, it adhered to the technology-driven approach and completed the upgrade of the new generation of credit card issuing system, significantly improving system functions and performance, and further strengthening the foundation of credit card technologies. It introduced third-party big data scoring, multiple borrowing, real-time positioning and other Internet data products to enhance the ability of big data risk control and build a digital multi-dimensional risk prevention and control system with linkage between the headquarters and the branches. Fourthly, it strengthened the internal control management of compliance by carrying out key tasks such as financial chaos management and anti-money laundering and establishing a normalized self-examination and self-correction and supervision and rectification tracking mechanism to ensure the development of business in a compliant manner.
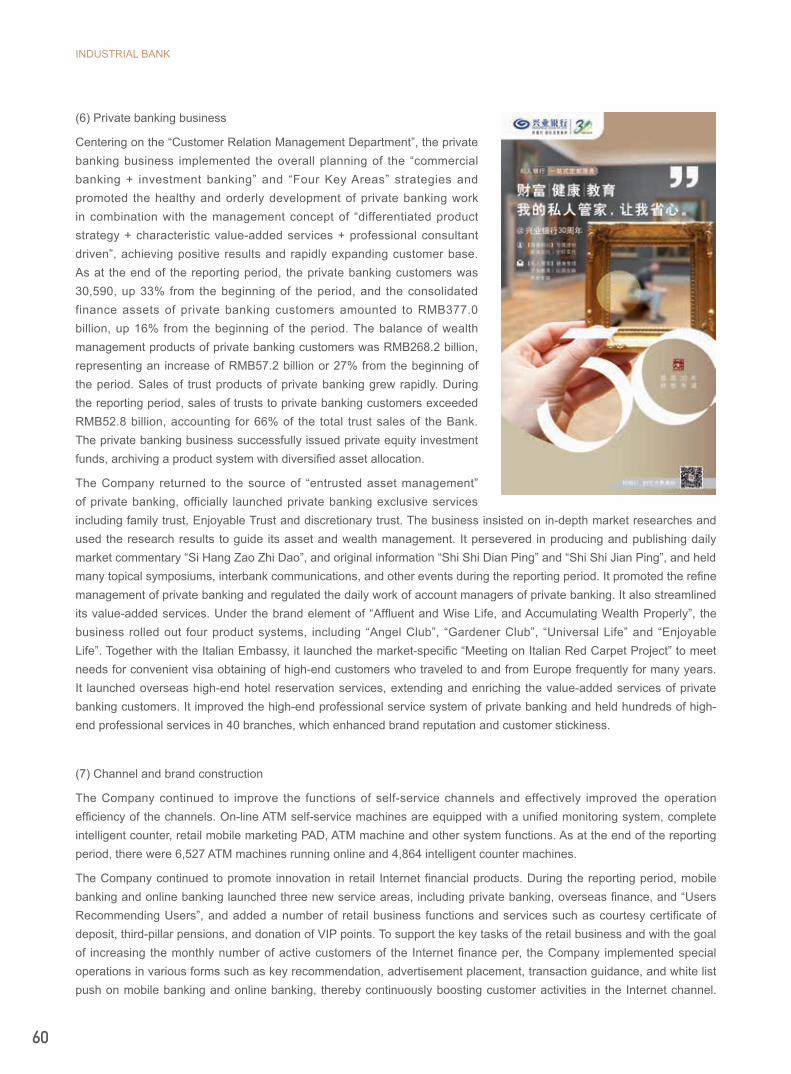
INDUSTRIAL BANK
60
(6) Private banking business
Centering on the “Customer Relation Management Department”, the private banking business implemented the overall planning of the “commercial banking + investment banking” and “Four Key Areas” strategies and promoted the healthy and orderly development of private banking work in combination with the management concept of “differentiated product strategy + characteristic value-added services + professional consultant driven”, achieving positive results and rapidly expanding customer base. As at the end of the reporting period, the private banking customers was 30,590, up 33% from the beginning of the period, and the consolidated finance assets of private banking customers amounted to RMB377.0 billion, up 16% from the beginning of the period. The balance of wealth management products of private banking customers was RMB268.2 billion, representing an increase of RMB57.2 billion or 27% from the beginning of the period. Sales of trust products of private banking grew rapidly. During the reporting period, sales of trusts to private banking customers exceeded RMB52.8 billion, accounting for 66% of the total trust sales of the Bank. The private banking business successfully issued private equity investment funds, archiving a product system with diversified asset allocation.
The Company returned to the source of “entrusted asset management” of private banking, officially launched private banking exclusive services including family trust, Enjoyable Trust and discretionary trust. The business insisted on in-depth market researches and used the research results to guide its asset and wealth management. It persevered in producing and publishing daily market commentary “Si Hang Zao Zhi Dao”, and original information “Shi Shi Dian Ping” and “Shi Shi Jian Ping”, and held many topical symposiums, interbank communications, and other events during the reporting period. It promoted the refine management of private banking and regulated the daily work of account managers of private banking. It also streamlined its value-added services. Under the brand element of “Affluent and Wise Life, and Accumulating Wealth Properly”, the business rolled out four product systems, including “Angel Club”, “Gardener Club”, “Universal Life” and “Enjoyable Life”. Together with the Italian Embassy, it launched the market-specific “Meeting on Italian Red Carpet Project” to meet needs for convenient visa obtaining of high-end customers who traveled to and from Europe frequently for many years. It launched overseas high-end hotel reservation services, extending and enriching the value-added services of private banking customers. It improved the high-end professional service system of private banking and held hundreds of high-end professional services in 40 branches, which enhanced brand reputation and customer stickiness.
(7) Channel and brand construction
The Company continued to improve the functions of self-service channels and effectively improved the operation efficiency of the channels. On-line ATM self-service machines are equipped with a unified monitoring system, complete intelligent counter, retail mobile marketing PAD, ATM machine and other system functions. As at the end of the reporting period, there were 6,527 ATM machines running online and 4,864 intelligent counter machines.
The Company continued to promote innovation in retail Internet financial products. During the reporting period, mobile banking and online banking launched three new service areas, including private banking, overseas finance, and “Users Recommending Users”, and added a number of retail business functions and services such as courtesy certificate of deposit, third-pillar pensions, and donation of VIP points. To support the key tasks of the retail business and with the goal of increasing the monthly number of active customers of the Internet finance per, the Company implemented special operations in various forms such as key recommendation, advertisement placement, transaction guidance, and white list push on mobile banking and online banking, thereby continuously boosting customer activities in the Internet channel.

2018 ANNUAL REPORT
61
As at the end of the reporting period, the monthly number of active customers of mobile banking was 12.5703 million, representing an increase of 99.5% from the beginning of the period. The number of followers of “Industrial Bank” WeChat public account was 7.713 million, representing an increase of 24.8% from the beginning of the period.
In respect of brand building, “Dynamic Life” credit card brand continued to use the Shanghai International Marathon Series and the Youth International Football Tournament to further implement the crossover marketing strategy with “sports, health, environmental protection and public welfare” as the entry point. It expanded the crossover cooperation landscape by co-sponsoring the special show of the 2019 Shanghai Spring/Summer Fashion Week by the upcoming designer SHUSHU/TONG with VISA, taking the CIB art-themed credit card products as the entry point to highlight the characteristic proposition of the “Finance + Fashion” brand and enrich the brand connotation of “Vibrant Life”. “Universal Life” created the first “Universal Life” one-stop international education platform in China and launched the “Belt and Road • Inclusive Overseas Study” personal overseas study program, combining traditional media and online media for concerted promotion. It released the “White Paper on Job Hunting in the US for Chinese Overseas Students” through Sina online live broadcast, thereby enhancing the influence of CIB overseas finance in the field of international education and enhancing the brand influence of “Universal Life”. “Wealthy Life” created a sub-brand of “China’s first cultural and creative savings product for etiquette culture – Fujin series courtesy certificate of deposit”. It promoted unified design in outlets across China through product launches and the “Financial Start of the Chinese New Year with IB” event and developed wealth business such as wealth management products for celebrities to build up the brand of characteristic businesses and further enhance the brand value. At the same time, it continuously strengthened the brand’s visual system and the promotion through all-media channels including the “Industrial Bank Wealth Management Center” public account, increased brand influence by leveraging its rich wealth management products, professional team training and hardware facilities, selected high-quality financial institutions, created a financial supermarket for commission sales of quality products, continued to promote the construction of “Wealthy Life” wealth management studio, and constantly enriched the brand connotation of “Wealthy Life”. “Enjoyable Life” continuously optimized the pension financial service system, continuously promoted the construction of the “Enjoyable Life” College, optimized the “Enjoyable Life” club, actively developed products such as pension savings and old-age wealth management, vigorously pushed forward the pilot of the third pillar of pension insurance, promoted the account management business employee benefit plan, relying on the joint efforts of the group to enhance the company’s service capability in the construction of multi-level social pension security system.
Interbank finance business
(1) General information
During the reporting period, facing changes in external regulatory policies and financial market conditions, the Company fully utilized its specialized operation and management system and talents, further strengthened compliant operation, vigorously promoted business transformation and enhanced its professional service capabilities to serve interbank customers, financial market and real economy. During the reporting period, the interbank finance business advanced robustly.
(2) Financial institutions business
The Company divided customers into different tiers and types in service and employed a market-oriented, specialized and refined operating strategy to serve customers and the market. The Company’s interbank finance services cover all sectors of the financial industry, providing diversified and differentiated integrated financial service solutions for all types of financial institutions in various industries. Meanwhile, it extends basic financial services such as settlement, deposit management, agency receipt and payment, and agency sales to corporate and individual end customers, forming a full-chain customer base service system. As at the end of the reporting period, the Company has cooperated with peer financial institutions such as banks, securities companies, fund companies, futures companies, trust companies, financial

INDUSTRIAL BANK
62
companies, financial leasing companies, financial asset management companies, and consumer finance/auto finance companies, and established agency relationships with more than 100 banks in various countries and regions, thereby further improving the global agency service network.
Deepening cooperation with various financial trading venues and intermediary platforms to effectively serve the financial market. During the reporting period, the Company continuously deepened operation with the Shanghai Clearing House, Shanghai Stock Exchange, various futures exchanges, inter-agency quotation and service systems for private offerings and other state-approved exchanges in the agency clearing, fund settlement, system construction and other aspects. It obtained the comprehensive clearing membership of the central counter-party clearing business of the RMB foreign exchange inquiry transaction of Shanghai Clearing House and the qualification of approved depository bank for deposits of overseas customers of Zhengzhou Commodity Exchange, and became the first batch of designated depository banks of the Dalian Commodity Exchange and the first depository bank to dock the new system of the Shanghai Futures Exchange. It launched an integrated comprehensive platform for fund management services of non-bank financial institutions - non-bank (financial institution) fund management cloud platform, providing a package of services to enable various non-bank financial institutions to achieve unified account management and unified fund clearing. During the reporting period, 288 institutions were newly onlined.
(3) Bank cooperation business
The Bank-to-Bank Platform is the first financial institutions cooperation brand in China. Through the platform, the Company provided integrated financial services to various small and medium-sized financial institutions, including wealth management, payment settlement, technological output, asset transfer, training and consulting, cross-border finance, capital use, capital replenishment, and investment research. As at the end of the reporting period, the number of collaborated customers of various businesses of the Bank-to-Bank Platform was 1,906, up 43.96% year-on-year. The platform accumulatively cooperated with 357 commercial banks in terms of establishment of information systems, among which 221 banks managed to operate with online information systems. During the reporting period, the platform issued a total of RMB1,161.5 billion in interbank deposits to small and medium financial institutions, and handled RMB2,708.0 billion of transactions on behalf of the People’s Bank of China’s High-Value Payment System and Bulk Electronic Payment System, Cross-border Interbank Payment System (CIPS), unified clearing platform, and super online banking system. QianDa Money Manager, the Internet wealth management platform introduced the wealth management products of a total of 38 partner banks. The number of registered customers was 13.19 million. During the reporting period, sales of financial products of QianDa Money Manager to terminal customers reached RMB489.1 billion.
With integrated financial services for small and medium financial institutions as the core, the Company promoted the construction of “a financial technology cloud + three platforms of wealth management, asset trading, and payment and settlement + international version”, maintaining a sound momentum of rapid development for all businesses. The platform has become an important carrier for the linkage of the Group and the building of an integrated financial services platform for open banks. In the field of wealth management, seizing the opportunities in the wealth management market after the issuance of new regulations, QianDa Money Manager further consolidated its leading position as a multi-bank wealth management sales platform. The platform expanded the cooperation with small and medium banks on “Wealth Cloud” wealth management agency sales business, which provided strong product and system support for the transformation of wealth management of small and medium banks. Through the technology + financial cooperation, it delivered high-quality financial products to third- and fourth-tier cities and rural areas, enabling residents in financially underdeveloped areas to easily access financial services and property income. This was an innovative initiative of the Company’s differentiated implementation of inclusive finance. “Institutional investment trading platform” (http://i.yypt.com) constituted an online portal platform for the Group to display, sell, market and trade its products to various financial institutions. As at the end of the reporting period, the number of registered institutional customers was 1,281. In the field of payment and settlement, agency receipt and payment product “Hui Shou Fu” industrious developed payment solutions for non-bank financial industries such as funds, insurance, trust, and consumer finance, recording a transaction amount of RMB87.2

2018 ANNUAL REPORT
63
billion during the reporting period. As an agent, it accesses new payment and settlement tools such as the People’s Bank of China’s High-Value Payment System and Bulk Electronic Payment System, Cross-border Interbank Payment System (CIPS), unified clearing platform, and super online banking system to help improve the coverage of rural financial institutions in the payment system of the People’s Bank of China and improve payment service environment of rural areas, accessing the unified clearing platform on behalf of over 100 banks network platform and accessing the CIPS on behalf of 119 banks. The Company became the first bank to access CIPS on behalf of provincial rural credit cooperatives, and provided comprehensive cross-border financial services for small and medium financial institutions, including agency international settlement, cross-border foreign currency clearing, and cross-border investment and financing, through cooperation of domestic and overseas members of the Group.
2. Public product line
(1) Investment banking business
The Company strove to implement the strategic layout of “commercial banking + investment banking”, actively responded to changes in the external regulatory environment, and promoted the transformation of business into “financing + intelligence”. Centering on the “1234” strategy of the Bank and oriented towards “returning to the essence and servicing the real economy”, it achieved stable business development. Firstly, it consolidated the market position of non-financial corporate debt financing instruments in the interbank market, achieving a record high for direct finance and ranking first for both the underwriting scale and number of non-financial corporate bonds in the market. Secondly, it implemented the “light investment bank” strategy, continued to promote the transition from “holding assets” to “managing assets”, continued to explore key areas such as mergers and acquisitions, asset securitization, and equity investment, and continued to explore new source of revenue. In the interbank bond market, it launched the first RMBS project that introduced pure overseas investors through “Bond Connect”. Thirdly, it explored the establishment of a “unified sales platform” that integrate investor resources to enhance the sales ability of large-scale assets, and led the creation of a sales platform and sales team for investment banking products to enhance the core competitiveness of investment banking.
As at the end of the reporting period, the underwriting scale was RMB476.28 billion for non-financial corporate debt financing instruments and USD37.3 billion for overseas bonds. The asset-backed notes (ABN) issued was RMB13.378 billion, ranking second in the market.
(2) Asset management business
During the reporting period, with the issuance of a series of new regulations such as new asset management regulations, new wealth management regulations, and management methods for financial subsidiaries, the regulatory system for wealth management of banks in the new era has taken initial shape, which were of great significance for the return of the banks’ wealth management business to its essence, the gradual and orderly break of rigid redemption, the strengthening of the risk isolation of wealth management business, and the promotion the healthy business development. The Company actively adapted to the regulatory situation and market changes, strengthened the development direction, comprehensively optimized the organizational structure and business model, consolidated the business foundation, and prevented and controlled various financial risks. As a result, the financial management scale remained stable, the business transformation progressed in an orderly manner, and the products operated stably and were well-received by customers. As at the end of the reporting period, the balance of the Company’s wealth management products was RMB1,815.759 billion. In general wealth management, the balance of non-principal-guaranteed wealth management was RMB1,224,797 billion, a year-on-year increase of 6.14%. The Company built a product framework that was “centered on fixed income and supplemented by equity and other innovative products”. As at the end of the reporting period, the balance of the Company’s net value product was RMB607.534 billion, a year-on-year increase of 287.88%.

INDUSTRIAL BANK
64
(3) Treasury business
The Company continued to consolidate the operational mechanism of centrally managing the Group’s bond investment transactions, and formed standardized systems in strategy formulation, access standards, operation management, and post-investment evaluation. It continued to consolidate the customer and product base for the FICC business to further consolidate and enhance profits and customer coverage. Meanwhile, it actively implemented the strategy of integrating investment undertaking, investment sales and investment research, and continued to promote customer base construction and asset layout centering on key industries, so as to enhance the overall efficiency of the Group. In terms of business innovation, subject to the new asset management regulations, the Company completed the creation of new structured deposits. In addition, it actively responded to the call of the state to launch the over-the-counter bond business in corporate online banking and mobile banking channels.
The Company maintained the market leading position in the areas of bonds, exchange rates and interest rates. It actively provided liquidity, ranking first in net settlement amount of bonds at Shanghai Clearing House, third in transaction volume of bond lending at China Central Depository & Clearing Co., Ltd., and fourth in transaction volume of bond repurchase of interest rate bonds in the interbank market. In terms of exchange rate, the Company ranked sixth in comprehensive transaction volume of the exchange rate at China Foreign Exchange Trade System, and ranked first in comprehensive market-making transaction volume of interest rate swaps. The Company will continue to optimize its asset portfolio structure and focus on asset transfer and market-making transactions to ensure steady growth of various businesses.
(4) Asset custody business
During the reporting period, undaunted by difficulties, the asset custody business persevered with development. All business indicators were healthy and stable, and the market position remained solid. As at the end of the reporting period, the number of online custody products of the Company was 22,771, with the scale of asset custody business totaling RMB11,606.578 billion, up RMB373.849 billion or 3.33% from the beginning of the period. During the period, the realized total income of intermediary businesses of asset custody reached RMB3.405 billion.
The Company innovated custody business development concept and continued to promote business transformation and optimization. Adapting the “custody +” concept, it strengthened the intra-group coordination, promoted the development of custody business, and improved service through product operation and system capacity building. As at the end of the reporting period, the custody business of securities investment fund products was RMB896.438 billion, up RMB173.001 billion from the beginning of the period, the custody business of private asset management product was RMB540.261 billion, up RMB20.924 billion from the beginning of the period, the custody business of trust asset management products was RMB2,605.064 billion, up RMB29.902 billion from the beginning of the period, the custody business of bank wealth management products was RMB2,440.893 billion, up RMB150.878 billion from the beginning of the period, the custody business of asset management products of fund companies was RMB773.051 billion, down RMB218.059 billion from the beginning of the period, the custody business of asset management products of securities firms’ customers was RMB1,441.445 billion, down RMB451.617 billion from the beginning of the period and the custody business of insurance asset management products was RMB645.795 billion, increased by RMB7.730 billion from the beginning of the period.

2018 ANNUAL REPORT
65
3. Operation support
(1) Operation and management
Centering on the Company’s development strategy, following the development philosophy of “operation creates value”, and with the “improving efficiency, enhancing experience, innovating development, strengthening internal control and controlling cost” at the core, the Operation and Management Department strove to promote centralization, flattening, intelligence, automation, factorization, standardization, and procedure organization, as well as innovative development in addition to properly carrying out operational support and internal control security support, thereby creating an agile, fast, safe, effective and low-cost operation management service system to support the Company’s business development.
Firstly, the coordinated management of payment services and the ability of innovative develop have been enhanced. The service time for domestic large-value transfer business was extended to 21 hours, and the Bank became the first of its kind in China to support the extension of the time of cross-border RMB payment for working days to 24 hours. The Bank became the first batch in the world to launch Swift GPI direct remittances, establish a traceable mechanism for cross-border remittances, and achieve cross-border remittances to the United States within a minimum of half a minute. The payment settlement innovative product “IB Steward” continued to develop small and micro enterprise customers, launched logistics financial services, built a science and technology investment and financing platform, and continued to maintain market leading edge. It won the “Best Financial Technology Innovation Award” of the 4th Jinsong Award presented by mpaypass.com.cn. The Company constructed a centralized and unified network payment clearing platform, implemented the “breaking direct connection” work across the Bank, and strengthened the coordinated management of online payment services. The Company thoroughly implemented the requirements for the reform of “delegating powers, improving regulation, and providing better services”, launched pilot projects for canceling account licenses, optimized account opening services for enterprises, and continued to promote light system and light process transformation provided that the real risks were controllable, thereby effectively improving electronic and standardized account management.
Secondly, the level of intelligence and intensification of operational support has been further enhanced. Channel optimization and integration of process bank, construction of smart network achieved breakthrough. Channel optimization projects for lobby services, self-service, counter operation, back-office operation and online services, and remote customer service were basically completed. The effects of construction in targeted customer positioning, refined service contents, enhanced channel coordination, improved service efficiency and quality gradually emerged. The intelligent customer service access channel was further expanded. The annual traffic diversion rate increased to 18.65%, representing an increase of 12 percentage points over the previous year. The comprehensive transformation of the tellers was steadily advanced. The scale of tellers for corporate “Settlement Steward” and the effective referral rate for “one-sentence marketing” for retail customers continued to increase. The depth and breadth of services of the centralized operation sharing platform and accounting treatment sharing platform were further expanded. Through the combination of system transformation and process optimization, scale effects such as efficiency improvement, manpower saving, and compliance risk reduction were fully manifest.
Thirdly, the Company has established the concept of “controlling risks means creating benefits” to continuously strengthen internal control management. The operation inspection and supervision system was implemented across the Bank was implemented, initially forming a tiered inspection and supervision system covering the entire bank, which specified that “the Head Office shall focuses on identifying risks, and the branches must both identify the risks and focus on basic specifications, and the outlets focus on the basic specifications”. The construction of the two internal control system platforms, the “Woodpecker” accounting case prevention system and accounting risk monitoring system, has made progress, effectively improving the coverage and accuracy of internal control management through scientific and technological means. The Company strengthened the integration and coordination between off-site and on-site inspections, moved risk check-points forward, encouraged counters to resist major violations of regulations and disciplines in relation to payment and settlement and intercept cases, and carried out intensive prevention and control of accounting cases, so as to effectively eliminate risk hazards and ensure that there were no major operational risks and loss events.
INDUSTRIAL BANK
66
(2) Information technology
The information technology work aims at digital transformation, ensuring the unification of technology platforms and data standards. The Company continued to promote the construction of a “safe, process-based bank, open, and smart bank”, focusing on eight technical fields of “information security, user experience, cloud computing, big data, artificial intelligence, blockchain, process robots, and open API”. The work has achieved positive progress and remarkable results. The Company is committed to promoting the reform of financial technology system and mechanism, exploring the embedded management of R&D personnel, and strengthening the integration of technology and business and organizational innovation. It set up a Digital Center of Excellence to enhance the leading role of financial technology in digital transformation. It invigorated the vitality of science and technology by strengthening the team and optimizing the incentive and restraint mechanism, so as to effectively drive the transformation of science and technology from “quality first” to “value first”.
In terms of the construction of a safe bank, the Company successfully completed the information security work at critical time points, achieving 99.99% of availability for important systems of production transactions. By further improving the disaster recovery system to achieve full coverage of application-level and data-level disaster recovery of important information systems, the Company passed the ISO22301 Business Continuity Management System Certification and became the first in the industry to obtain the “Excellent Level” certification for the “Service Capability Maturity Model of Data Centers for Information Technology Services”. It continuously enhanced the technical capabilities of terminal security, network security, data encryption, monitoring and analysis, greatly improving information security protection. It completed periodic security assessments for 146 systems and online security assessment for 86 systems, achieving full coverage of system online security assessment.
In terms of construction of a process-based bank, paperless was achieved for a total of 331 high-frequency transaction vouchers in relevant paperless counter projects, shortening the daily settlement time of the tellers by nearly 20 minutes. The “electronic” and “self-help” level of outlets continuously improved. The self-service projects for corporate customers incorporated a total of 108 types of business acquiring-bills of the Head Office and the branches into the unified acquiring-bill for centralized management, the self-printing rate of acquiring-bills reaching 97%. The capability of analyzing data about interbank customers rapidly improved, enabling systematic measurement of the comprehensive value of the businesses of interbank customers, thereby further expanding the depth and breadth of cooperation with existing customers. Using the RPA process robot technology, the Company has completed the robot automated processing of four business handling processes, such as “Automotive Financial Installment” and “IB Instant Loan White List”, to continuously improve business efficiency and reduce labor costs.
In terms of the open bank, the Company focused on supporting the connection of the Head Office and branches with the external ecology and continued to optimize the “Hao Xing Dong” APP. It launched the Group’s online portal “Diversified Finance”, and promoted the rapid launch of featured products such as “IB Auto Financing”, “IB Oil Card” and “Electricity Financing” to enable the capacity for building a “transaction-type and settlement-type” bank.
In terms of a smart bank, the Company focused on supporting the digital transformation of retail business through new technologies such as big data and artificial intelligence, empowering such areas as risk management and control as well as customer marketing and services. It launched a loan product named “IB Instant Loan”, which enabled retail customers to serve themselves online throughout the entire process, creating a new-generation pre-credit extension model for online retail credit and launching online lending business. It continued to carry out the construction and application of the gold list series marketing model. During the reporting period, it increased the number of VIP customers by 140,000 and the comprehensive financial assets by RMB38.6 billion. It employed biometric technologies such as face recognition and iris recognition to build “IB Eyes”, achieving application of VIP customer identification at lobbies to support differentiated service and targeted marketing of outlets. It provided professional technical support for the special cooperation tasks of Blockchain ABS custody business of JD Finance. On the first day of the launch, JD Finance synchronized 800,000 sets of asset data.
2018 ANNUAL REPORT
67
(3) E-finance
The E-finance business actively seized new opportunities for development and further strengthened the integration and overall management of the Group’s E-finance. Internally, it promoted the cross-channel, cross-line and cross-subsidiary integration to consolidate the basic platform of E-finance, exerting the synergy of E-finance to help the overall Bank. Externally, it promoted cross-platform and cross-border openness, simultaneously participating in ecology and building ecology to build an open bank. It promoted the establishment of the Group’s online operation and service system to serve the Group’s “1234” strategy, empower business development, and promote a comprehensive digital transformation of the Group’s business and operation models.
As at the end of the reporting period, the number of effective customers of mobile banking was 25,511,700, an increase of 38.31% compared with the beginning of the period; the number of effective personal banking customers was 12,980,800, an increase of 7.77% compared with the beginning of the period; the number of effective customers of corporate and interbank online banking was 343,100, an increase of 22.84% compared with the beginning of the period; the cumulative number of customers developed for direct banking was 2,593,400; the number of customers contracted by IB Steward was 171,700, with a cumulative transaction amount of RMB602.77 billion; and the transaction replacement rate of E-finance was 96.83%. The Company launched the Group’s E-finance portal “Diversified Finance”, with nearly 6 million visits. Internally, the portal provided navigation for Industrial Consumer Finance, CIB Fund, and QianDa Money Manager to facilitate cross-selling; externally, it actively cooperated with more than 10 Internet ecosystems such as “New Fujian” to achieve 1+N overall output of the Group’s finance.

INDUSTRIAL BANK
68
(III) Analysis of loan quality
1. Five-category classification of loans
Unit: RMB million
ItemDecember 31, 2018 December 31, 2017
Increase/ decrease in balance at the end of the reporting period compared with that at the end of last year (%)
Balance Percentage (%) Balance Percentage (%)
Normal 2,827,898 96.38 2,335,800 96.10 21.07
Special mention 60,044 2.05 56,241 2.31 6.76
Substandard 19,411 0.66 17,520 0.72 10.79
Doubtful 18,442 0.63 11,976 0.49 53.99
Loss 8,287 0.28 9,158 0.38 (9.51)
Total 2,934,082 100 2,430,695 100 20.71
As at the end of the reporting period, the balance of the Company’s NPLs stood at RMB46,140 million, up RMB7,486 million from the figure at the beginning of the period with NPL ratio of 1.57%, down 0.02 percentage point from the beginning of the period. The balance of special mention loans was RMB60, 044 million, up RMB3,803 million from the beginning of the period. The proportion of the special mention loans in the total loans was 2.05%, down 0.26 percentage point from the beginning of the period. The increase in non-performing loans and special mention loans is primarily due to the in-depth adjustment in macro economy and industry structure, complicated and challenging external environment, as well as the continuous materialization of credit risks in individual areas and industries. The non-performing loan balance and special mention loan balance of the Company increased, but overall NPL ratio and special mention loan ratio declined. Asset quality was overall stable.
2. Provision for and write-off of loan impairment
Unit: RMB million
Item Amount
Opening balance 81,864
Provision during the reporting period (+) 38,067
Write-off and transfer-out during the reporting period (-) (28,098)
Write-back during the reporting period of write-off in previous years (+) 5,009
Transfer-out due to the increase in discounted value of loan value (-) (1,287)
Changes in exchange rates (+) 82
Closing balance 95,637
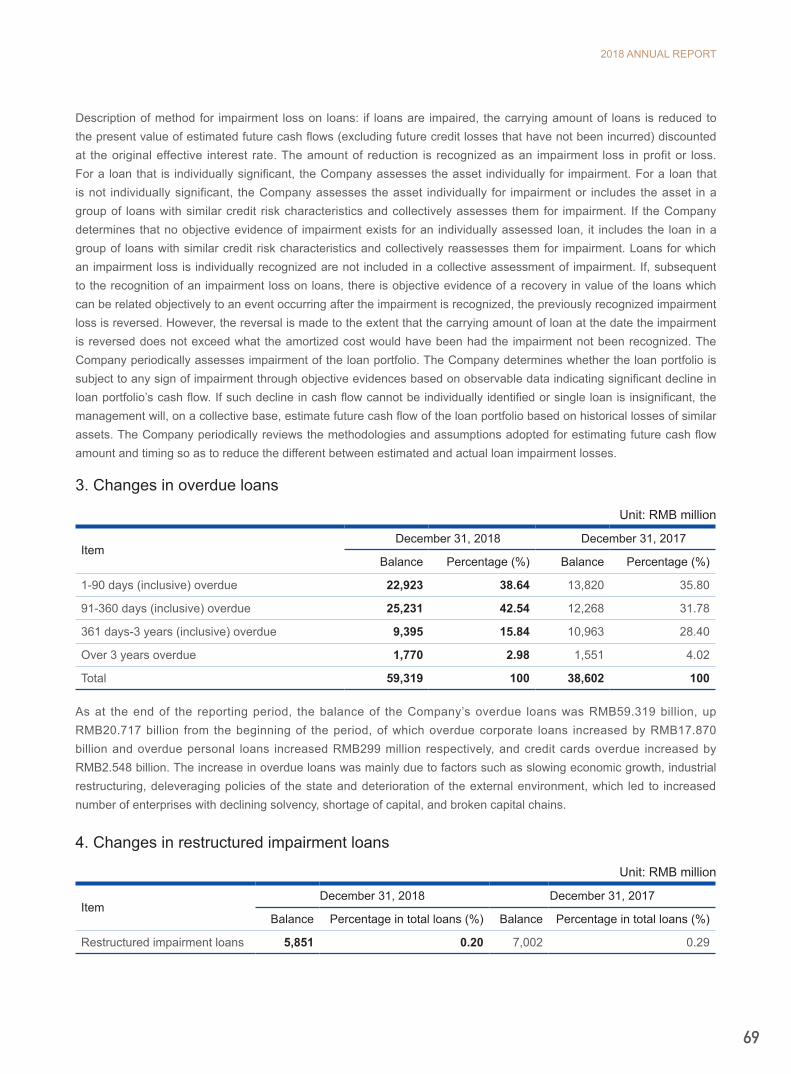
2018 ANNUAL REPORT
69
Description of method for impairment loss on loans: if loans are impaired, the carrying amount of loans is reduced to the present value of estimated future cash flows (excluding future credit losses that have not been incurred) discounted at the original effective interest rate. The amount of reduction is recognized as an impairment loss in profit or loss. For a loan that is individually significant, the Company assesses the asset individually for impairment. For a loan that is not individually significant, the Company assesses the asset individually for impairment or includes the asset in a group of loans with similar credit risk characteristics and collectively assesses them for impairment. If the Company determines that no objective evidence of impairment exists for an individually assessed loan, it includes the loan in a group of loans with similar credit risk characteristics and collectively reassesses them for impairment. Loans for which an impairment loss is individually recognized are not included in a collective assessment of impairment. If, subsequent to the recognition of an impairment loss on loans, there is objective evidence of a recovery in value of the loans which can be related objectively to an event occurring after the impairment is recognized, the previously recognized impairment loss is reversed. However, the reversal is made to the extent that the carrying amount of loan at the date the impairment is reversed does not exceed what the amortized cost would have been had the impairment not been recognized. The Company periodically assesses impairment of the loan portfolio. The Company determines whether the loan portfolio is subject to any sign of impairment through objective evidences based on observable data indicating significant decline in loan portfolio’s cash flow. If such decline in cash flow cannot be individually identified or single loan is insignificant, the management will, on a collective base, estimate future cash flow of the loan portfolio based on historical losses of similar assets. The Company periodically reviews the methodologies and assumptions adopted for estimating future cash flow amount and timing so as to reduce the different between estimated and actual loan impairment losses.
3. Changes in overdue loans
Unit: RMB million
Item December 31, 2018 December 31, 2017
Balance Percentage (%) Balance Percentage (%)
1-90 days (inclusive) overdue 22,923 38.64 13,820 35.80
91-360 days (inclusive) overdue 25,231 42.54 12,268 31.78
361 days-3 years (inclusive) overdue 9,395 15.84 10,963 28.40
Over 3 years overdue 1,770 2.98 1,551 4.02
Total 59,319 100 38,602 100
As at the end of the reporting period, the balance of the Company’s overdue loans was RMB59.319 billion, up RMB20.717 billion from the beginning of the period, of which overdue corporate loans increased by RMB17.870 billion and overdue personal loans increased RMB299 million respectively, and credit cards overdue increased by RMB2.548 billion. The increase in overdue loans was mainly due to factors such as slowing economic growth, industrial restructuring, deleveraging policies of the state and deterioration of the external environment, which led to increased number of enterprises with declining solvency, shortage of capital, and broken capital chains.
4. Changes in restructured impairment loans
Unit: RMB million
ItemDecember 31, 2018 December 31, 2017
Balance Percentage in total loans (%) Balance Percentage in total loans (%)
Restructured impairment loans 5,851 0.20 7,002 0.29
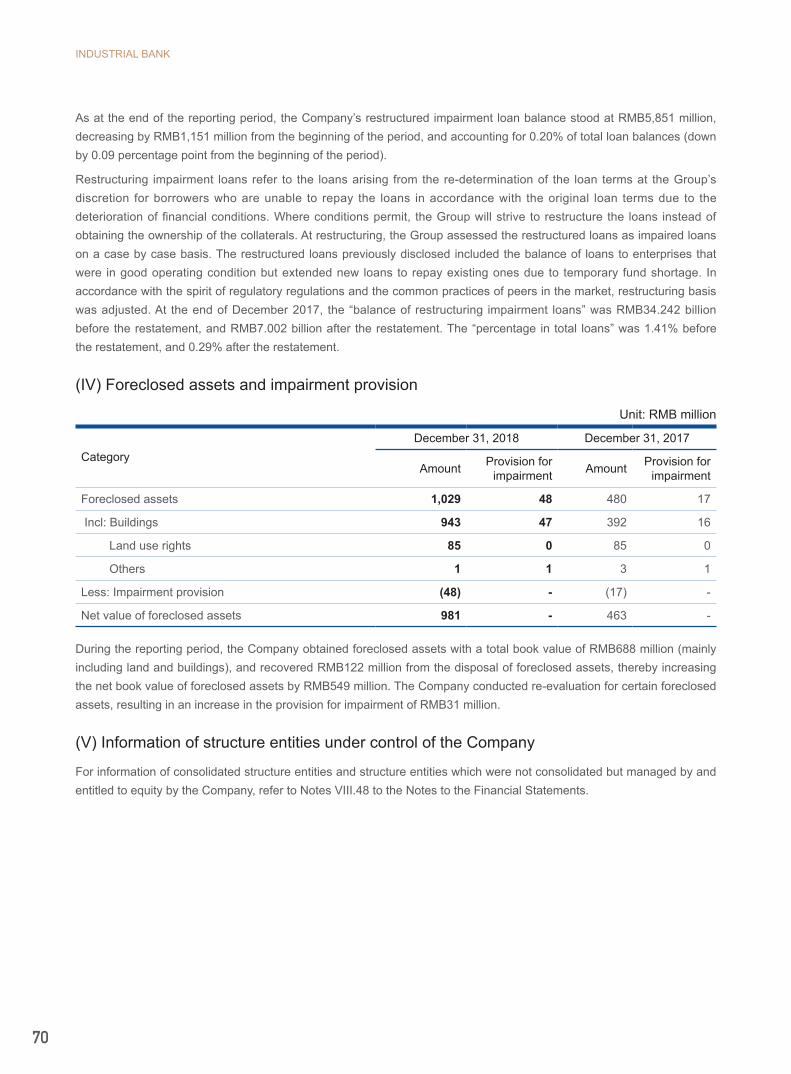
INDUSTRIAL BANK
70
As at the end of the reporting period, the Company’s restructured impairment loan balance stood at RMB5,851 million, decreasing by RMB1,151 million from the beginning of the period, and accounting for 0.20% of total loan balances (down by 0.09 percentage point from the beginning of the period).
Restructuring impairment loans refer to the loans arising from the re-determination of the loan terms at the Group’s discretion for borrowers who are unable to repay the loans in accordance with the original loan terms due to the deterioration of financial conditions. Where conditions permit, the Group will strive to restructure the loans instead of obtaining the ownership of the collaterals. At restructuring, the Group assessed the restructured loans as impaired loans on a case by case basis. The restructured loans previously disclosed included the balance of loans to enterprises that were in good operating condition but extended new loans to repay existing ones due to temporary fund shortage. In accordance with the spirit of regulatory regulations and the common practices of peers in the market, restructuring basis was adjusted. At the end of December 2017, the “balance of restructuring impairment loans” was RMB34.242 billion before the restatement, and RMB7.002 billion after the restatement. The “percentage in total loans” was 1.41% before the restatement, and 0.29% after the restatement.
(IV) Foreclosed assets and impairment provision
Unit: RMB million
CategoryDecember 31, 2018 December 31, 2017
Amount Provision for impairment Amount Provision for
impairment
Foreclosed assets 1,029 48 480 17
Incl: Buildings 943 47 392 16
Land use rights 85 0 85 0
Others 1 1 3 1
Less: Impairment provision (48) - (17) -
Net value of foreclosed assets 981 - 463 -
During the reporting period, the Company obtained foreclosed assets with a total book value of RMB688 million (mainly including land and buildings), and recovered RMB122 million from the disposal of foreclosed assets, thereby increasing the net book value of foreclosed assets by RMB549 million. The Company conducted re-evaluation for certain foreclosed assets, resulting in an increase in the provision for impairment of RMB31 million.
(V) Information of structure entities under control of the Company
For information of consolidated structure entities and structure entities which were not consolidated but managed by and entitled to equity by the Company, refer to Notes VIII.48 to the Notes to the Financial Statements.
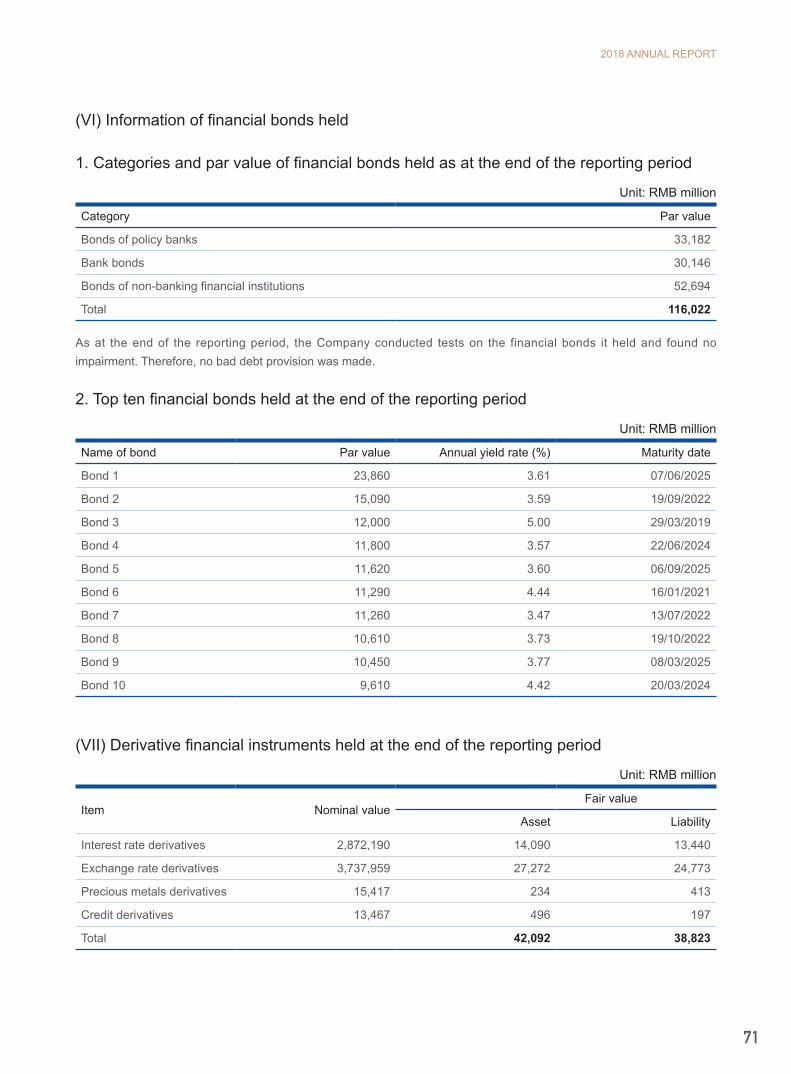
2018 ANNUAL REPORT
71
(VI) Information of financial bonds held
1. Categories and par value of financial bonds held as at the end of the reporting period
Unit: RMB million
Category Par value
Bonds of policy banks 33,182
Bank bonds 30,146
Bonds of non-banking financial institutions 52,694
Total 116,022
As at the end of the reporting period, the Company conducted tests on the financial bonds it held and found no impairment. Therefore, no bad debt provision was made.
2. Top ten financial bonds held at the end of the reporting period
Unit: RMB million
Name of bond Par value Annual yield rate (%) Maturity date
Bond 1 23,860 3.61 07/06/2025
Bond 2 15,090 3.59 19/09/2022
Bond 3 12,000 5.00 29/03/2019
Bond 4 11,800 3.57 22/06/2024
Bond 5 11,620 3.60 06/09/2025
Bond 6 11,290 4.44 16/01/2021
Bond 7 11,260 3.47 13/07/2022
Bond 8 10,610 3.73 19/10/2022
Bond 9 10,450 3.77 08/03/2025
Bond 10 9,610 4.42 20/03/2024
(VII) Derivative financial instruments held at the end of the reporting period
Unit: RMB million
Item Nominal value Fair value
Asset Liability
Interest rate derivatives 2,872,190 14,090 13,440
Exchange rate derivatives 3,737,959 27,272 24,773
Precious metals derivatives 15,417 234 413
Credit derivatives 13,467 496 197
Total 42,092 38,823
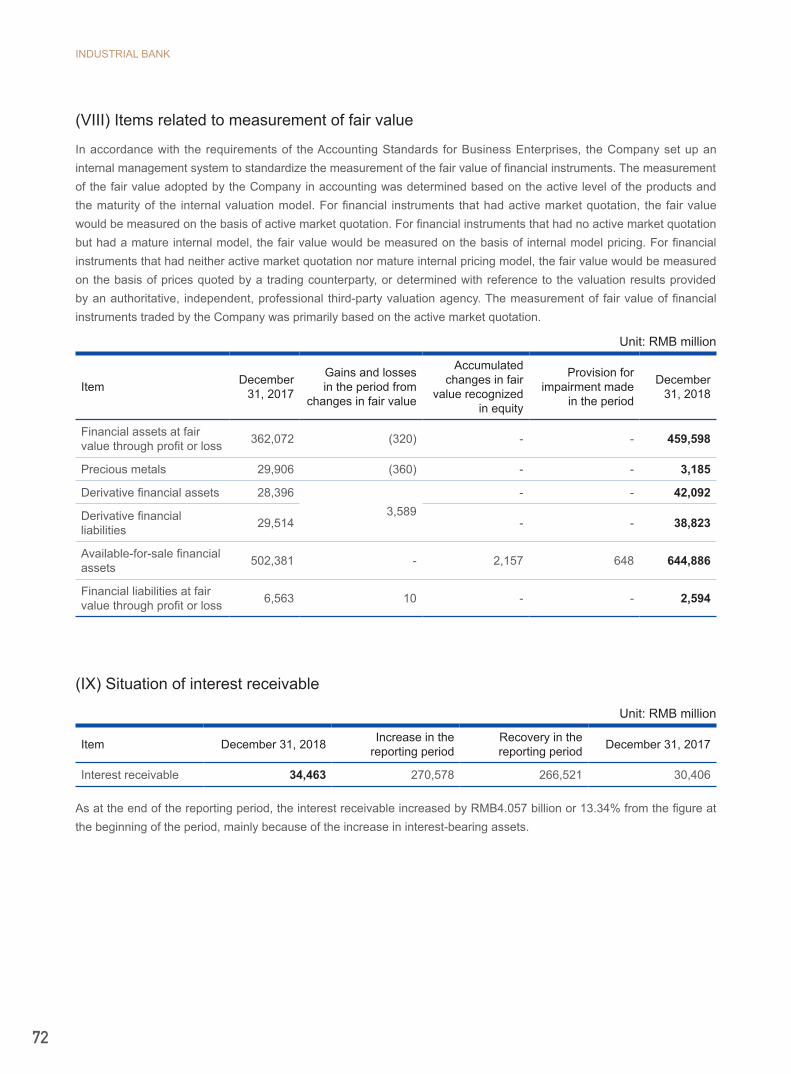
INDUSTRIAL BANK
72
(VIII) Items related to measurement of fair value
In accordance with the requirements of the Accounting Standards for Business Enterprises, the Company set up an internal management system to standardize the measurement of the fair value of financial instruments. The measurement of the fair value adopted by the Company in accounting was determined based on the active level of the products and the maturity of the internal valuation model. For financial instruments that had active market quotation, the fair value would be measured on the basis of active market quotation. For financial instruments that had no active market quotation but had a mature internal model, the fair value would be measured on the basis of internal model pricing. For financial instruments that had neither active market quotation nor mature internal pricing model, the fair value would be measured on the basis of prices quoted by a trading counterparty, or determined with reference to the valuation results provided by an authoritative, independent, professional third-party valuation agency. The measurement of fair value of financial instruments traded by the Company was primarily based on the active market quotation.
Unit: RMB million
Item December 31, 2017
Gains and losses in the period from
changes in fair value
Accumulated changes in fair
value recognized in equity
Provision for impairment made
in the period
December 31, 2018
Financial assets at fair value through profit or loss 362,072 (320) - - 459,598
Precious metals 29,906 (360) - - 3,185
Derivative financial assets 28,3963,589
- - 42,092
Derivative financial liabilities 29,514 - - 38,823
Available-for-sale financial assets 502,381 - 2,157 648 644,886
Financial liabilities at fair value through profit or loss 6,563 10 - - 2,594
(IX) Situation of interest receivable
Unit: RMB million
Item December 31, 2018 Increase in the reporting period
Recovery in the reporting period December 31, 2017
Interest receivable 34,463 270,578 266,521 30,406
As at the end of the reporting period, the interest receivable increased by RMB4.057 billion or 13.34% from the figure at the beginning of the period, mainly because of the increase in interest-bearing assets.
2018 ANNUAL REPORT
73
(X) Provision for impairment of other receivables
Unit: RMB million
Item December 31, 2018
December 31, 2017
Provision for impairment Provision method
Other receivables 16,507 15,496 1,739At the end of the period, other receivables were tested individually and collectively to make provision for impairment by taking into account of aging analysis.
(XI) Situation of off-sheet items that may have material impact on the financial position and operating results
Unit: RMB million
Item December 31, 2018 December 31, 2017
Letters of credit 112,002 85,144
Letters of guarantee 123,668 120,259
Bank acceptance 532,919 384,247
Unused credit cards commitments 284,430 208,127
Irrevocable loan commitments 38,545 41,500
(XII) Risks and risk management during the reporting period
1. Overview
Risk management is the basic guarantee for the survival and development of commercial banks. The Company regards risk management as one of the core competitiveness. It has formulated the development strategy laying equal stress on business operation and risk management, established the advance, in-process and subsequent risk control system centering on risk assets management, and improved the risk management system and operation procedures for various businesses and the risk accountability and punishment mechanism. The credit risks, market risks, liquidity risks, operation risks and other risks exposed to various businesses and customers are included in the scope of comprehensive risk management. In addition, the Company further clarified the specific duties of the Board of Directors, Board of Supervisors, senior management and executives in respect of risk management and formed a specific, clear and effective comprehensive risk management system. In daily risk management, the business department, risk management functional departments and internal audit department form “three lines of defense” of risk management with clear responsibilities and duty segregation to achieve the risk management goals.
2. Credit risk management
The Company’s credit risk management objectives are: establishing and continuously improving the credit risk management system, promoting the specialization level and refinement of credit risk management, optimizing the orientation of credit granting and customer structure, constantly reinforcing risk management and control of the overall credit business process, realizing the balance between risks and gains, and effectively controlling risks.
During the reporting period, given the macro-economic situation and industrial development prospects, the Company continued to maintain the synergy between and lay equal emphasis on risk management and business development

INDUSTRIAL BANK
74
and further improved credit risk management system and to maintain basically stable and good asset quality. First, the company further optimized its authorization and credit granting policies as well as execution of such policies. It timely adjusted and optimized authorization and continued to implement the differentiated granting policy of “assuring supply, control and stock compression”. The Company improved the Group’s unified credit extension management by continuing to promote the information construction of the Group’s unified credit extension management to build an unified customer risk view at the Group level. The Company strengthened the supervision and evaluation of the implementation of authorization and granting policy and examination of post-approval evaluation to ensure policy implementation. Secondly, the Company reinforced risk alert monitoring. It has fully used the big data analysis methods provided by the risk warning management system to strengthen the dynamic supervision and warning across the entire business process, in a bid to “identify, warn about and dispose” risky project as early as possible. It timely interpreted and implemented the regulatory policies, increased the efforts in inspection of risk hotspots and key areas. For issues found, it would strengthen management and carry out rectification. Thirdly, the Company optimized relevant performance assessment mechanism. It has set asset quality indicators in a scientific manner and combined assessment on asset quality control results with that on asset quality control process, so as to solidify the asset quality. It has added performance assessment indicators for mentioned assets, in a bid to guide operating organs to eliminate potential risks ahead of schedule. Fourthly, efforts were made for disposal of risk assets. The Company advanced the construction of a specialized non-performing asset disposal operation and management system, and continued to develop a strong and dedicated non-performing assets recovery team, so as to enhance the Company’s expertise in non-performing asset disposal. It also stepped up efforts in cash recovery, write-off and market-oriented disposal of non-performing assets, and improved the recovery ratio of writing-off accounts and maintaining records, significantly enhanced efficiency and effectiveness in non-performing asset disposal.
3. Liquidity risk management
The Company’s objectives for management of liquidity risk were: firstly, ensuring the demand of payment; secondly, improving the application efficiency of funds and guaranteeing the rapid and healthy development of all businesses; and thirdly, realizing the unification of “security, liquidity and profitability”.
During the reporting period, the Company thoroughly implemented the state’s macroeconomic policies and financial regulatory requirements. It continued to consolidate the foundation for development based on the general principle of striving for steady progress while maintaining stability, continued to promote business transformation, effectively optimized business structure, and improved liquidity risk management. The Company maintained overall sound liquidity situation, regulatory indicators met requirements and all asset liability businesses maintained balanced and coordinated development. Firstly, it gave top priority to the “sustainable growth of customer deposits” and “establishment of a long-term mechanism for deposit growth” among the tasks of the year so as to further reduce its dependence on interbank liabilities. As a result, the liability structure was further optimized, the duration of liabilities was lengthened, and the stability of liabilities gradually increased. Secondly, it further optimized the management of the branches’ asset-liability ratio, emphasizing the matching of deposit business and asset business. In 2018, the Company adopted a management policy on asset-liability ratio to optimize and foster the Company’s liability business, making it more stable and the asset-liability structure more balanced. Thirdly, the Company strengthened the monitoring and analysis of indicators related to liquidity risk. In 2018, the Company regularly monitored and analyzed liquidity risk by establishing liquidity risk indicators such as liquidity ratio, liquidity coverage ratio and net stable funding ratio, so as to thoroughly understand the condition of Company’s liquidity risk. Fourthly, the Company overweighed qualified high-quality liquid assets such as treasury bonds and local government bonds, strengthened the management of qualified high-quality liquid assets, and maintained a moderate scale and reasonable structure of high-quality liquid assets, so as to ensure that liquidity regulatory indicators continued to meet the requirements.
2018 ANNUAL REPORT
75
4. Market risk management
Market risk refers to the risk of loss of in on-balance-sheet and off-balance-sheet businesses of the Bank caused by the unfavorable changes in market price (interest rate, exchange rate, share price and commodity price), including interest risks of transaction accounts, stock risks, and exchange rate risks and commodity risks of all accounts. Interest rate risk of transaction accounts and exchange rate risk represent the major market risks confronted by the Company. The Company’s market risk management was for the purposes of: firstly, establishing and continuously improving market risk management system which matched with the risk management strategies, and satisfied standard requirements of the New Capital Accord and regulatory requirements of market risk; secondly, completing market risk management structure, policies, processes and methods; and thirdly, promoting the specialization level of market risk management, realizing centralized and unified management of market risks, and facilitating the sustainable and healthy development of relevant businesses with risks under control.
During the reporting period, the Company pro-actively responded to changes in the market environment and continuously optimized the market risk management system. It steadily promoted various tasks centering on optimizing organizational structure, augmenting management tools, and strengthening system construction. In terms of organizational structure, the Company established a comprehensive risk management system to further clarify the division of responsibilities, specifying that the Investment Banking Department and the Financial Market Risk Management Department at the Head Office shall be the leading departments for the group-related market risk management of the Bank, and the Planning & Finance Department at the Head Office shall be the leading department for the group-related account interest rate risk management of the Bank. In terms of management methods, the Company further strengthened the mark-to-market of trading accounts and optimized the monitoring of market price deviation to cover major products such as RMB and foreign currency bonds, interest rate swaps and exchange rates. It strengthened the business valuation and margin monitoring of agency derivatives to enhance the risk management of the agency business. In terms of system construction, the Company continuously optimized the fund transaction and analysis system, enhanced the coverage of complex products of the system, and improved the accuracy of system valuation and risk measurement. It completed the system upgrade for the internal model of market risk, which greatly improved the operational efficiency of the system.
(1) Interest rate risk
The Company’s bank account interest risk was primarily analyzed and measured monthly through repricing gap analysis, duration analysis, and scenario simulation. The repricing gap analysis primarily monitors the distribution and mismatch in respect of repricing periods of assets and liabilities; duration analysis monitors durations of main products as well as duration gap changes in the Company’s assets and liabilities; scenario simulations are the Company’s main measure to analyze and measure the interest rate, which cover a number of normal scenarios and stress scenarios such as standard interest rate shock, parallel shift and shape change in the yield curve, extreme interest rate changes during the past 10 years, as well as the most possible interest rate changes in future as determined by experts. We calculate changes in net interest income (NII) and economic value of equity (EVE) under such interest rate change scenarios over the next 1 year. It introduced a customer model through information systems such as the asset-liability management system to dynamically monitor and control the interest-sensitive asset-liability gap, and calculate the interest rate sensitivity of revenue and economic value to interest rate changes based on the gap analysis. The revenue analysis focused on the impact of interest rate changes on the Bank’s recent revenue, while the economic value analysis focused on the impact of interest rate changes on the present value of the Bank’s net cash flow.
For interest rate risks of transaction accounts, the Company implemented management mainly through constant improvements on the market risk indicator limit system. Risk indicators included interest rate sensitivity indicator and stop-loss indicator, which were executed by way of annual business authorization letter and regular investment strategy plan. By introducing and constantly improving the capital transaction and analysis system for system hard control of market risks, the system enabled real-time market capitalization re-evaluation and risk indicator calculation for interest rate products, and achieved process control on a transaction-by-transaction basis. The risk middle offices used the system to carry out real-time monitoring of various risk indicators of interest rate products on a transaction-by-transaction

INDUSTRIAL BANK
76
basis and an entire account basis to ensure that the interest rate risk of the trading account is controllable. Meanwhile, risk middle offices regularly conducted in-depth analysis of interest rate risk and calibrated the system model to ensure the accuracy of the measurement.
During the reporting period, the economic fundamentals in China were under downward pressure, GDP growth slowed down, corporate financing tightened, and credit default events increased. The Central Bank maintained a reasonable and abundant amount of funds through multiple RRRs and open market operations. For the whole year, the short-term interest rate declined, and the spread of middle and low rating credit widened. Overseas, the Fed raised interest rates for four times, and the yield of US dollar bonds increased as a whole. The Company’s trading accounts included mainly RMB bonds. According to the changes in the market situation, the Company pro-actively carried out duration management and strengthened credit management and control, maintaining the interest rate risk of trading accounts at a low level. In terms of interest rate risk for bank accounts, the Company flexibly adjusted its assessment policy, guided branches to adjust the term structure of funds in a timely manner, and enhanced the matching management of the sources and applications of funds, thereby achieving the effective management of interest rate risk amidst the downturn of market interest rates.
(2) Exchange rate risk
The Company’s exchange rate risk is classified into trade account exchange rate risk and bank account exchange rate risk.
The Company’s exchange rate risk of transaction accounts is subject to unified management by the Financial Markets of the Head Office. The exchange rate risk exposures arising from various business processes of all the branches were collected via the core business system to the Financial Markets of the Head Office in due course for unified management. Risk management measures focused on exposure limit management. Risk middle offices used the fund transaction and analysis system to implement real-time monitoring and in-depth analysis of limit indicators. The Company’s exchange rate exposures arose mainly from comprehensive position of RMB market making business. As an active RMB market maker, the Company has proactively controlled its exposure limits, adopted close-to-zero management for the market-making overall positions, and kept relatively low overnight risk exposure.
The bank account exchange rate risk is managed by the Planning & Finance Department of the Head Office. The risk primarily stems the exchange rate risk exposure of foreign exchange capital project, which is the largest exchange rate risk exposure of the Company. For this part of the exchange rate risk exposure arising from assets and liabilities that is inevitable in normal course of operations, the Company maintained the stability of non-trading exchange rate risk exposure by applying to the State Administration of Foreign Exchange for capital settlement or foreign exchange profit settlement.
During the reporting period, the Fed raised interest rates for four times, pushing up the US dollar index and putting the RMB exchange rate under pressure. At the same time, subject to international trade frictions and capital market turbulence, the exchange rate market volatility intensified. The Company controlled the trading exchange rate risk exposure by strengthening the management and control of self-operated intra-day exposure and day-end exposure. Meanwhile, it maintained the stability of non-trading risk exposure to keep the Bank’s exchange rate risk exposure within a reasonable range.
5. Operational risk management
During the reporting period, taking into consideration the latest regulatory requirements and operational risk trends, the Company closely integrated operational risk management tools with business operations starting from daily business management, and promoted the application of operational risk management tools for key elements such as personnel, processes, systems, and external events, so as to explore the issues identified in business management and operational processes and actively promote rectification. The Company continued to push forward the construction of business continuity plans to ensure the safe and stable operation of various businesses, and effectively improve the operational risk management foundation.

2018 ANNUAL REPORT
77
Firstly, it enhanced the use of operational risk management tools. The Company conducted operational risk assessment and monitoring on an ongoing basis. Taking into consideration regulatory penalties, cases and internal control inspections, the Company strengthened daily monitoring of risk-prone areas and management weak links, and reorganized and re-evaluated processes in key business processes and critical links to drive improvements and optimization of systems, processes and services. At the same time, the Company continuously optimized the operation of key risk indicators, strengthened alert and monitoring of key risks, and continuously improved the comprehensiveness, accuracy and timeliness of loss data collection.
Secondly, it strengthened the pre-assessment of operational risk for new products (new businesses). Through the cross-validation mechanism for data on new products (new businesses) of the management departments, the Company improved the comprehensiveness of the pre-assessment of operational risk of new products (new business), ensured that all new products (new businesses) were fully pre-assessed before being put into the market, and strengthened the capabilities of operational risk management and control for new products (new businesses).
Thirdly, it further refined the business continuity plan. The Company held the 2018 Head Office Business Continuity Management Committee Meeting to gradually improve the group-level business continuity management and recovery mechanism, and comprehensively promote the Group’s business impact analysis, special emergency plans, emergency drills and other work to meet internal and external management requirements.
6. Compliance risk management
Based on the financial regulation of “strong regulation and strict accountability”, the Company took the initiative to adapt to the new normal of supervision, continuously deepened the implementation of compliant operation concept, practiced the philosophies of “Compliance Pays” and “Compliance Wins”, and created a sound atmosphere where everyone and everything comply with regulation, implementing compliance concept throughout all business processes.
Firstly, the Company launched the “Industrial Journey” special event for execution strengthening year of compliance and internal control for 2018 to improve the long-term effective mechanism of compliance. By seizing the opportunity of the thorough implementation of national financial work conference and series regulatory documents issued by the CBIRC as well as closely centering on the main line of “Compliance Pays” and “Compliance Wins”, the Company launched the third stage of compliance management - “Industrial Journey” campaign for execution strengthening year of compliance and internal control for 2018, based on the implementation of the “Thirteen Behavioral Prohibitions for Employees” for 2016 and “Industrial Journey” compliance and internal control year campaign for 2017. This campaign continued to improve the long-term effective mechanism of compliance and internal control management and enhance the execution of compliance and internal control through “six paths” including “grasping the direction of regulation and adjusting business strategy according to the change in supervision policies; ascertaining the responsibility of the entity and improving duty performance mechanism of the business line; enhancing management efficiency as well as optimizing and integrating compliance and internal control management instruments; strictly preventing the case risk and building a three-dimensional case prevention and control system; timely correcting deviation and overcoming shortcomings to improve the normal supervision and inspection mechanism; raising the cost of violations and thoroughly implementation multi-level accountability”.
Secondly, the Company strengthened internal constraints by giving full play to the evaluation of internal control and compliance as a “lighthouse”. The Company optimized the multi-tier assessment systems of domestic branches, Hong Kong branches, subsidiaries and business departments at the Head Office, enhanced the process evaluation and imposed more positive incentives for early prevention, control and settlement of issues, so as to further reinforce the concept of proactive compliance. The Company intensified the evaluation efforts in strategic and basic work, guided organizations at all levels to increase their resources investment, attached importance to the long-term, strategic and basic work of risk compliance, and enhanced its professional support to business. Under the trend of “strong regulation and strict accountability”, the Company intensified its assessment of the evaluation and penalization of external regulation. It also enhanced the coordinated mechanism of strengthening evaluation and daily management, inspection
INDUSTRIAL BANK
78
supervision and issue rectification, defect rectification supervision, and responsibility investigation, timely analyzing and rectifying issues found during evaluation process. By enhancing management, implementation and efficiency through evaluation, it improved the refinement of management.
Thirdly, the Company improved the management instruments of compliance and internal control to further enhance the compliance and internal control management. It also strengthened the inspection of compliance in various areas, launched 2018 “rectifying market chaos” special administer of compliance and internal control and consolidated the application of the results of all inspections and governance. The Company improved the long-term effective mechanism of management by upgrading system warning, strengthening guidance and evaluation, and taking special inspections, accountability pursuit in respect of violations and other long-term mechanism for management of abnormal employee trading behavior. The Company further advanced the implementation of multi-level responsibility investigation mechanism, and continued to enhance the employees’ compliance record and violation score management, so as to build a “Household Record” for employee compliance.
Fourthly, the Company made innovative management tools to enhance the overall effectiveness of anti-money laundering. With its ongoing commitment to the “risk-based” and “corporate governance” principle, the Company vigorously set up an anti-money laundering “whole process” management mechanism for pushing the organic integration of anti-money laundering with compliance management and internal control and enhance the capabilities of pre-event prevention, during-event management and control, and post-event monitoring; ensured the effectiveness of the top-level design of anti-money laundering by amending the internal control on anti-money laundering, intervening in system at the source, applying strict customer entrance and business entrance control, and issuing reminders of key regulatory points and summary of regulation systems; made a correct judgment of the regulatory situation of international anti-money laundering, intensified the study on characteristics of regulatory policies and anti-money laundering in each business segment and in different regions, and strengthened the risk management of money laundering for cross-border business and terrorist financing; further improved the assessment system for money laundering risks, strengthened management and control on high-risk business and high-risk customers, and guided the allocation of resources towards high-risk areas; independently designed indicators for monitoring unusual transactions, set up a monitoring system based on “reasonable doubt”, and constantly improved the proprietary monitoring system for unusual transactions; optimized and improved the anti-money laundering monitoring and management system, enhanced the efficacy of anti-money laundering using technologies, and strengthened the training as well as assessment and supervision of anti-money laundering to continuously enhance the Group’s anti-money laundering compliance management standard.
Fifthly, the Company continued to enhance the professional capability of legal services. Apart from establishing work mechanism to manage the previous intervention and evaluation after unification of system management and intensifying legal compliance demonstration for innovative and major business, the Company also previously intervened the compliance and risk evaluation of products and reversed the two-skin phenomenon in relation to the disconnection of post-evaluation of systems and business development. The Company also continued to improve business system and supporting contract contexts to promote sound business development, the Company organized and carried out rearrangement and post evaluation of regulations and timely discovered and rectified the wrongdoing in implementation of business and regulations so as to provide clear, legitimate and effective regulation guarantee for the Company’s operation management. Moreover, it analyzed and concluded typical cases, issued compliance risk prompts and guided grassroots agencies in strengthening risk management and control and regulation of business operations. In accordance with the updated external laws and regulations and internal systems, the Company continued to carry our contract (including e-contract) sorting and post evaluation, so as to enhance the level of the use specification and refinement of contract texts.
Sixthly, the Company continued to enhance the professional capability of legal services. The Company continuously optimized management methods for legal compliance. It proactively aligned itself with new regulatory policies and rules, strengthened policy researches and transmissions, policy and regulation express, reminders for compliance risks, and compliance proposal, deepened legal support for the significant, difficult and innovative products and projects, and
2018 ANNUAL REPORT
79
guided the compliant operation of business. In addition, the Company enhanced legal compliance team building and talent development at each level, built a legal compliance team with effective communication, fast response and a professional leading position by all training mechanism, achieving an overall efficiency improvement of legal compliance services at different levels.
7. IT risk management
The Company formed and continue to improve the organizational structure of “three lines of defense” of IT risk management comprised of the IT Department, Law and Compliance Department, Audit Department and other relevant departments and made full use of various management instruments to realize identification, assessment, monitoring, control, sustained releasing and reporting of IT risks, adopting various measures simultaneously to steadily enhance risk management and control. During the reporting period, the Company made great efforts to upgrade the Group’s consolidated technological risk management and control, expanded technological outsourcing and pushed forward the construction of “safe bank” on an overall basis, further enhancing our guarantee capability of business continuity.
First, the Company improves the efficiency of technological risks management and control through strengthening the management synergy. It applied implementation results of several management instruments including identification and assessment of risk and control, supervision of key indicator, collection of risk incidents, compliance inspection as well as internal control evaluation into the technological risk management work of the Group, so as to push forward management synergy and consolidate risk management and control.
Second, the Company improved the integration of technological risk management system. It developed IT risk management system module, achieved online procedures, electronic data, autonomous supervision and upgraded IT risk management.
Third, the Company attached importance to technological outsourcing risk management. It included the technological outsourcing risk management into its unified outsourcing risk management system, implemented the third-party technologies outsourcing risk audit and security evaluation of the Company’s existing off-site intensive outsourcing service providers, organized and implemented rectification, and, at the same time, kept enhancing its dominating and self-controlling of core technologies in technologies outsourcing activities.
Fourth, the Company accelerated to perfect its information safety management and control system. It launched the Group’s “Xing An Quan” series theme activities of information security, carried out key work tasks of information security such as protection of personal information security and security resource allocation.
Fifth, the Company put requirements of important system prevention and control into effect. It realized an overall coverage of application-level disaster recovery in new important information system.
8. Management of reputational and country risk
(1) Management of reputational risk
The Company’s management of reputational risk was for the purpose of: actively and effectively preventing reputational risk and coping with reputation incidents, and reducing the losses and adverse impacts caused to the Company and the public to the minimum level.
The Company’s reputational risk management follows the principle of “division of labour, hierarchical management, handling by type, swift response and ongoing maintenance” for continuously increasing the effectiveness of reputation risk management. During the reporting period, based on the Sub-strategies of Reputational Risk Management and the Reputational Risk Management System, the Company incorporated the reputational risk management into the Company’s governance and comprehensive risk management system, clarified functions of different levels and divisions, adopted hierarchical classification management, and thus reinforced the effective prevention and control of reputational risks. The Company continuously perfected the operational procedures in terms of news public opinion, information
INDUSTRIAL BANK
80
disclosure and customer complaint management, raised the level of comprehensive management of coping with adverse public opinion and capacity of contingency treatment, enhanced public opinion troubleshooting and established the regulation of daily reporting of risk information, to effectively prevent, immediately control and properly cope with adverse public opinion and prevent and control reputational risk. The Company fulfilled its responsibility of disclosing information of listed company, ensuring the truthfulness, accuracy, completeness, timeliness and fairness, so as to objectively show the business characteristics and performance dynamics of the Company. The Company also incorporated reputational risk management into the comprehensive appraisal of branches, effectively facilitating and reinforcing the reputational risk management at basic operating units.
(2) Management of country risk
The Company’s management of country risk was for the purpose of: establishing and continuously improving the Company’s country risk management system based on its internationalization process and business growth, adopting proper measurement, assessment and rating system for such risk with a view to accurately identifying and assessing country risks relating to business activities and promoting sustainable and healthy development of its business.
Country risks exist in businesses including granting of credit line, international capital market business, setting up overseas institutions, transaction with correspondent banks and outsourcing service provided by overseas service provider. Based on the degree of risk, country risks are classified into five grades – low, relatively low, moderate, relatively high and high. The limit of country risks has been made according to the country classification and taking into comprehensive consideration the cross-border business development strategy and risk preference of the Company. Appropriate management is carried out for each grade. Moreover, country risks are used as major criteria for weighing the management of granting credit to customers. Based on its progress in the internationalization process and the growth of its business size, the Company will continue to improve country risk management.
2018 ANNUAL REPORT
81
Significant Issues
I. Proposal of profit distribution of ordinary shares or transfer of capital reserve
(I) Formulation, implementation or adjustment of the cash dividend policy
The Articles of Association of the Company stipulated that the profit distribution policy should include: first, the procedures for formulation and adjustment of the profit distribution policy, which specifically required that such policy should not be submitted to the general meeting unless consents of more than two thirds of directors were obtained and should not be passed unless more than two thirds of votes were obtained from present shareholders with voting rights; second, the principles of continuity and stability of profit distribution, which required that the profit distribution plan should be drafted every three years; third, profit distribution form (in cash or equity or both of them) and interval (annually or semi-annually if affordable);fourth, the profit for distribution in cash yearly not less than 10% of the realized attributable profit of the year, provided that the requirements on capital adequacy ratio were met; distributing dividend in equity at the same time if necessary; fifth, explanations for the non-distribution of dividends and the usage of the profit retained if cash dividends are not distributed for the year; and sixth, deduction of the cash dividends distributable to any shareholder which appropriates the Company’s fund in violation of regulations to repay the funds appropriated.
For the purpose of establishing a sustainable, stable and scientific investment return mechanism for investors and keeping continuity and stability of the profit distribution policy, by taking into consideration of its actual operation and future development need, the Company developed the Mid-term Shareholders’ Return Plan (2016-2018), which planned that from 2016 to 2018, should there be distributable profit, cash dividends could be distributed to shareholders of ordinary shares, and the profit used for distribution in cash should not be less than 20% (inclusive) of the realized distributable profit of the year after making up for deficits, appropriating statutory reserves and general provisions and paying dividends to shareholders of preferred shares from the realized earnings, provided that the distribution is in line with the profit distribution policy of regulatory department and it could be ensured that the regulatory requirements on capital adequacy ratio of the Company could be met. On the premise of ensuring compliance of capital adequacy ratio with regulatory requirements, when the Company distributes dividends in cash or in shares or by a combination of both, the proportion of cash dividends should not be lower than 40%.
The Company fulfilled the above profit distribution policy and cash bonus on schedule. The Company implemented the 2017 annual profit distribution plan in June 2018, based on the total share capital of 20,774,190,751 shares, the Company distributed cash dividend of RMB6.5 for every 10 shares (tax included), issued RMB13.503 billion cash dividends as a whole, whereas balance of the undistributed profit would be used for supplementing capital and carried forward to the next year. The formulation and implementation procedure of the Company’s profit distribution plan was compliant and transparent with clear and explicit dividend criteria and proportion, conforming to stipulations in the Articles of Association and requirements in the resolution of the general meeting. The Board of Directors did special research and demonstration on the returns of shareholders, and fully heard opinions of shareholders (especially medium and small shareholders) and independent directors. Relevant decision-making process and mechanism were complete, and independent directors fulfilled their duties with due diligence, thus maintaining the lawful rights and interests of medium and small shareholders.
(II) Profit distribution plan for 2018
In light of relevant provisions in the Company Law of the People’s Republic of China, the Articles of Association of
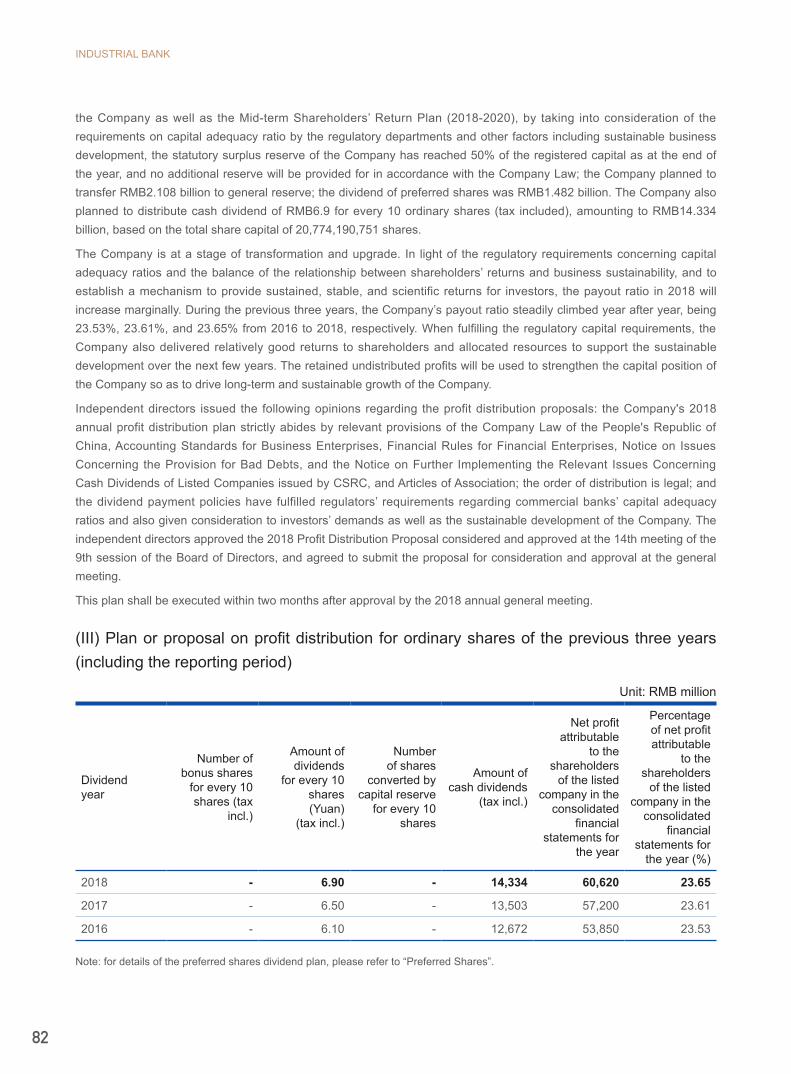
INDUSTRIAL BANK
82
the Company as well as the Mid-term Shareholders’ Return Plan (2018-2020), by taking into consideration of the requirements on capital adequacy ratio by the regulatory departments and other factors including sustainable business development, the statutory surplus reserve of the Company has reached 50% of the registered capital as at the end of the year, and no additional reserve will be provided for in accordance with the Company Law; the Company planned to transfer RMB2.108 billion to general reserve; the dividend of preferred shares was RMB1.482 billion. The Company also planned to distribute cash dividend of RMB6.9 for every 10 ordinary shares (tax included), amounting to RMB14.334 billion, based on the total share capital of 20,774,190,751 shares.
The Company is at a stage of transformation and upgrade. In light of the regulatory requirements concerning capital adequacy ratios and the balance of the relationship between shareholders’ returns and business sustainability, and to establish a mechanism to provide sustained, stable, and scientific returns for investors, the payout ratio in 2018 will increase marginally. During the previous three years, the Company’s payout ratio steadily climbed year after year, being 23.53%, 23.61%, and 23.65% from 2016 to 2018, respectively. When fulfilling the regulatory capital requirements, the Company also delivered relatively good returns to shareholders and allocated resources to support the sustainable development over the next few years. The retained undistributed profits will be used to strengthen the capital position of the Company so as to drive long-term and sustainable growth of the Company.
Independent directors issued the following opinions regarding the profit distribution proposals: the Company's 2018 annual profit distribution plan strictly abides by relevant provisions of the Company Law of the People's Republic of China, Accounting Standards for Business Enterprises, Financial Rules for Financial Enterprises, Notice on Issues Concerning the Provision for Bad Debts, and the Notice on Further Implementing the Relevant Issues Concerning Cash Dividends of Listed Companies issued by CSRC, and Articles of Association; the order of distribution is legal; and the dividend payment policies have fulfilled regulators’ requirements regarding commercial banks’ capital adequacy ratios and also given consideration to investors’ demands as well as the sustainable development of the Company. The independent directors approved the 2018 Profit Distribution Proposal considered and approved at the 14th meeting of the 9th session of the Board of Directors, and agreed to submit the proposal for consideration and approval at the general meeting.
This plan shall be executed within two months after approval by the 2018 annual general meeting.
(III) Plan or proposal on profit distribution for ordinary shares of the previous three years (including the reporting period)
Unit: RMB million
Dividend year
Number of bonus shares
for every 10 shares (tax
incl.)
Amount of dividends
for every 10 shares(Yuan)
(tax incl.)
Number of shares
converted by capital reserve
for every 10 shares
Amount of cash dividends
(tax incl.)
Net profit attributable
to the shareholders
of the listed company in the
consolidated financial
statements for the year
Percentage of net profit attributable
to the shareholders
of the listed company in the
consolidated financial
statements for the year (%)
2018 - 6.90 - 14,334 60,620 23.65
2017 - 6.50 - 13,503 57,200 23.61
2016 - 6.10 - 12,672 53,850 23.53
Note: for details of the preferred shares dividend plan, please refer to “Preferred Shares”.

2018 ANNUAL REPORT
83
II. Performance of undertakings(I) Upon approval of the CSRC, the Company issued 1,721,854,000 A shares in a non-public way. On April 7, 2017, the Company handled registration and lock-up procedures with Shanghai Branch of China Securities Depository and Clearing Corporation Limited for the newly issued A shares. The share subscribers in such non-public issuance made the following undertakings: the shares subscribed by the Finance Bureau of Fujian Province, China National Tobacco Corporation, Fujian Company of China National Tobacco Corporation, and Guangdong Company of China National Tobacco Corporation in such non-public issuance shall not be transferable within 60 months after completion of the issuance, and transfer of such shares shall be subject to other regulatory requirements concerning transfer of such shares as well as the transferees’ shareholder qualifications upon expiration of the abovementioned lock-up period. Shares subscribed by Yango Holdings Co., Ltd. and Fujian Investment and Development Group Co., Ltd. in such non-public issuance shall not be transferable within 36 months after completion of the issuance and transfer of such shares shall be subject to relevant rules of the CSRC and the Shanghai Stock Exchange. The above-mentioned shareholders performed their obligations, and the trading moratoriums of relevant shares will expire on April 6, 2022 and April 6, 2020, respectively and such shares can be listed and traded on the market from April 7, 2022 and April 7, 2020, respectively.
(II) The 2017 annual general meeting of the Company considered and approved the Mid-term Shareholders’ Return Plan (2018-2020) (for details, please refer to the announcement on the resolutions of the general meeting dated May 26, 2018), which planned that for the next three years (2018-2020), should there be distributable profit, cash dividends could be distributed to shareholders of ordinary shares, and the profit used for distribution in cash should not be less than 20% (inclusive) of the realized distributable profit of the year after making up for deficits, appropriating statutory reserves and general provisions and paying dividends to shareholders of preferred shares from the realized earnings, provided that the distribution is in line with the profit distribution policy of regulatory department and it could be ensured that the regulatory requirements on capital adequacy ratio of the Company could be met. On the premise of ensuring compliance of capital adequacy ratio with regulatory requirements, when the Company distributes dividends in cash or in shares or by a combination of both, the proportion of cash dividends should not be lower than 40%.
(III) According to relevant rules of CSRC, the Proposal on Current Period Dilutive Effect of the Non-public Issuance of Domestic Preferred Shares and Replenishment Measures were considered and approved at the 8th meeting of the 9th session of Board of Directors and the 2017 annual general meeting. The proposal specified replenishment measures in respect of the potential dilutive effect that the non-public issuance of domestic preferred shares may have on current period returns of investors, which included strengthening capital planning and management, maintaining stable and adequate capital, enhancing capital use efficiency, reasonably allocating resources; accelerating transformation and innovation and promoting the sustainable development of the Company's business; and continuously improving the sustained, stable and scientific shareholder return mechanism. In addition, the directors and senior management of the Company made undertakings in respect of effectively implementing such replenishment measures. For details, please refer to the announcements of the Company dated April 25, 2018 and May 26, 2018.
The Company and its shareholders holding 5% or more of the Company’s shares made no other undertakings during the reporting period or undertakings that lasted into the reporting period.
III. Appropriation of funds during the reporting periodDuring the reporting period, no controlling shareholder or other related parties used the capital for non-operating purpose. Deloitte Touche Tohmatsu Certified Public Accountants LLP had issued “Specification for the Funds Occupied by Controlling Shareholders and Other Related Parties of Industrial Bank Co., Ltd”.
INDUSTRIAL BANK
84
IV. Appointment of accounting firmsUpon approval of the 2017 annual general meeting, Deloitte Touche Tohmatsu Certified Public Accountants LLP was appointed to audit the 2018 annual report, review the semi-annual report and provide internal control and audit services with the total audit fee amounting to RMB10.23 million, which included fees and expenses on transportation, accommodation, stationery, communication and printing as well as related taxes, of which RMB8.53 million was for audit and review of financial statements and RMB1.70 million was for internal control audit.
Currently, Deloitte Touche Tohmatsu Certified Public Accountants LLP has provided audit service to the Company for 8 consecutive years.
V. Material lawsuits and arbitrationsDuring the reporting period, there was no lawsuit or arbitration with material effects on the Company that was required to be disclosed.
The Company may be subject to lawsuit or arbitration arising from recovery of loans or disputes with customers in the daily business process. In addition, as at the end of the reporting period, there were 204 outstanding lawsuits and arbitrations in which the Company was the defendant or respondent (including the cases in which the Company was a third party), involving an aggregate amount of RMB1.074 billion.
VI. Punitive actions against the Company and its directors, supervisors, senior management personnel and the largest shareholderDuring the reporting period, the Company, its directors, supervisors, senior management, and the largest shareholder were not subject to any inspection by authoritative agencies, any compulsory measures by judicial authorities or discipline inspection departments, any referral to judicial authorities, criminal prosecution, inspection or administrative punishment by the CSRC, deprivation of market access, identity as inappropriate candidates and open condemnation of security exchanges, or any other punishment by regulators that may have significant impact upon the Company’s operation.
VII. Integrity of the Company and the largest shareholderDuring the reporting period, there had been no refusal to implement effective judgments of a court or failure to meet debt repayment schedules in a relatively large amount by the largest shareholder.
VIII. Material related party transactions(I) The 8th meeting of the 9th session of the Board of Directors and the 2017 Annual General Meeting of the Company considered and approved the “Proposal on Non-public Issuance of Domestic Preferred Shares to China National Tobacco Corporation” , agreeing to enter into conditional preferred shares subscription agreements with 15 companies subsidies of China National Tobacco Corporation, a shareholder of the Company, pursuant to which, Jiangsu Tobacco,
2018 ANNUAL REPORT
85
Henan Tobacco, Hunan Tobacco, Zhuzhou Tobacco, Hengyang Tobacco, Shaoyang Tobacco, Yongzhou Tobacco, Chenzhou Tobacco, Hunan Tobacco Leaves, Sichuan Tobacco, Chengdu Tobacco, Guangxi Tobacco, Gansu Tobacco, Lanzhou Tobacco and Zhongwei Capital would subscribe 80,000,000 shares in aggregate of the domestic preferred shares to be issued with a total subscription amount of RMB8 billion. The above-mentioned proposed subscribers undertook not to participate in the price inquiry of the dividend rate of the preferred shares issued, and accepted the final dividend rate determined by the Company and the sponsor institution (the lead underwriter) according to the procedures and requirements stipulated by competent authorities such as the CSRC. The terms of the transaction are fair and reasonable, and the terms and execution procedures of the subscription agreement are legal and compliant, without prejudice to the interests of the Company and shareholders, especially the minority shareholders. For details, please refer to the announcements of the Company dated April 25, 2018 and May 26, 2018.
(II) The 2017 annual general meeting of the Company considered and approved the “Proposal on the Granting of Related Party Transaction Quota to Certain Related Parties”, agreeing to grant the People’s Insurance Group Co., Ltd. and its affiliates a quota of RMB54 billion for credit extension related party transactions, and RMB25.6 billion for non-credit extension related party transactions, with a term valid to April 30, 2021; change the quota of credit extension related party transactions granted to China National Tobacco Corporation and its affiliates to RMB15 billion, and the quota of the non-credit extension related party transactions to RMB5.3 billion, with a term valid to April 30, 2021; change the quota of credit extension related party transactions granted to Fujian Yango Group Co., Ltd. and its affiliates to RMB18 billion, and the quota of the non-credit extension related party transactions to RMB19.2 billion, with a term valid to April 30, 2021; change the quota of credit extension related party transactions granted to Fujian Investment & Development Group Co., Ltd. and its affiliates to RMB10 billion, and the quota of the non-credit extension related party transactions to RMB38.5 billion, with a term valid to August 28, 2019; and change the quota of credit extension related party transactions granted to Xiamen International Bank Co., Ltd. and its affiliates to RMB12.3 billion, and the quota of the non-credit extension related party transactions to RMB16.2 billion, with a term valid to August 28, 2019. The above related party transactions arose from the needs of the due course of business activities and were conducted on conditions not more favorable than those for transactions of the same type with non-related parties. The pricing of the transactions was fair, the transactions complied with the related requirements of relevant laws, regulations, rules and regulatory systems, and the method and timing of payment for the transactions were determined by reference to commercial practice. For details, please refer to the announcements of the Company dated April 25, 2018 and May 26, 2018.
(III) On September 19, 2018, the Company issued the “Announcement on the Related Party Transactions with Group Companies of Longyan Huijin Development Group Co., Ltd.”, which disclosed that the Company had non-credit extension related party transactions of RMB2.020 billion in aggregate with Longyan Huijin Group Companies (related legal persons) in the past 12 months, all of which were structured deposits and corporate wealth management services. It also disclosed that subsequently it would carry out non-credit extension related party transactions such as structural deposits, corporate wealth management, asset custody, and bond underwriting of no more than RMB1.88 billion with Longyan Huijin Group Companies (related legal persons). The amount of the above related party transactions will not exceed RMB3.9 billion in aggregate.
(IV) On December 12, 2018, the Company issued the "Announcement on Related Party Transactions with Xiamen Airlines Company Limited", which disclosed that the Company had reviewed and approved the granting of entity credit line of RMB4 billion to Xiamen Airlines Company Limited, with an exposure of no more than RMB3 billion and with a term of 3 years; the exposed credit line was guaranteed by Xiamen Airlines Hotel Management Co., Ltd.
(V) The 12th meeting of the 9th session of the Board of Directors of the Company considered and approved the “Proposal on Granting the Quota for Related Party Transactions to Certain Related Parties”, agreeing to grant Zhejiang Energy Group Co., Ltd. and its affiliates a quota for credit extension related transaction amount of RMB8 billion, non-credit extension relation party transaction of RMB100 million, with a valid term of 2 years; and agreeing to grant Longyan Huijin Development Group Co., Ltd. and its affiliates a quota for credit extension related transaction amount of RMB1.0 billion and its affiliates a quota for credit extension related transaction amount of RMB9.1 billion, with a term of 2 years.
INDUSTRIAL BANK
86
The above related party transactions arose from the needs of the due course of business activities and were conducted on conditions not more favorable than those for transactions of the same type with non-related parties. The pricing of the transactions was fair, the transactions complied with the related requirements of relevant laws, regulations, rules and regulatory systems, and the method and timing of payment for the transactions were determined by reference to commercial practice. For details, please refer to the announcement of the Company dated December 22, 2018.
As at the end of the reporting period, the balance and risk exposure (excluding deposits from related natural persons) of the Company’s related party transactions with related natural persons was RMB24 million.
Please refer to “Related party relationships and transactions” under the Notes to the Financial Statements for further details on specific data on related party transactions.
IX. Material contracts and performance thereof
(I) Material custody, lease and contracting issues
During the reporting period, the Company had no material custody, lease and contracting issues.
(II) Guarantees issues
In accordance with the relevant provisions of the CSRC, the Company carefully verified its guarantee to external parties in 2018. The Company’s external guarantee business was approved by the PBOC and the CBIRC and it was part of the Company’s regular business operations. As at the end of the reporting period, the balance of the Company’s letter of guarantee business was RMB123.668 billion. No illegal guarantee was discovered.
The Company always adheres to the principle of prudence when conducting its external guarantee business, and at the same time, it strengthens risk monitoring and management of off-balance businesses by issuing risk warnings in a timely manner and putting preventive measures in place. Under the effective supervision and management of the Board of Directors, the Company’s guarantee business operated normally and the risk concerned was under control.
The Company had no other material guarantees requiring disclosure.
(III) Other material contracts
During the reporting period, the Company did not experience any contract dispute that exerts significant impact upon the Company’s operation and management.
X. Description of other major issues (1) Building Fuzhou operating center: as considered and approved on the 6th meeting of the 9th session of the Board of Directors, the Company planned to build the Group’s Fuzhou operating center on the No.218 plot of Wusi Road, Gulou District, Fuzhou, which is expected to cost about RMB3.906 billion. Relevant constructions are in progress. For details, please refer to the Company’s announcement dated February 13, 2018.
(2) Non-public issuance of domestic preferred shares: upon consideration and approval by the 8th meeting of the 9th session of the Board of Directors and the 2017 annual general meeting of the Company, and the approval of the CBIRC and the CSRC, the Company issued no more than 300 million domestic preferred shares in aggregate, amounting to no more than RMB30 billion in aggregate, which were listed for transfer on the Integrated Business Platform of Shanghai Stock Exchange on April 26, 2019. For details, please refer to the announcements of the Company dated April 25, 2018,
2018 ANNUAL REPORT
87
May 26, 2018, August 25, 2018, December 28, 2018, April 17, 2019, and April 23, 2019.
(3) Equity participation in State Financing Guarantee Fund: upon consideration and approval by the 9th meeting of the 9th session of Board of Directors of the Company, the Company intended to contribute RMB2 billion to participate in the State Financing Guarantee Fund, with the amount of the contribution to be paid up in four years from 2018, and authorized the management to implement the plan. For details, please refer to the announcement dated May 29, 2018. During the reporting period, the Company has completed the payment of RMB500 million for the first installment of the capital contribution.
(4) Establish an asset management subsidiary: upon consideration and approval by the 10th meeting of the 9th session of Board of Directors of the Company, the Company intended to invest no more than RMB5 billion to establish a wholly-owned asset management subsidiary. For details, please refer to the Company's announcement dated August 29, 2018.
(5) Issuance green finance bonds: pursuant to the approvals of the CBIRC and the PBOC, the Company was permitted to publicly issue no more than RMB80 billion of green finance bonds in the national interbank bond market, the proceeds from which shall be specifically used for loans to green industry projects. During the reporting period, the Company has issued two tranches of green finance bonds totaling RMB60 billion. For details, please refer to the Company's announcements dated October 20, 2018, November 2, 2018, and November 28, 2018.
(6) Establishing CIB Financial Assets Investment Co., Ltd. (provisional name): upon consideration and approval by the 12th meeting of the 9th session of the Board of Directors of the Company, the Company intended to invest RMB10 billion to establish a wholly-owned subsidiary, CIB Financial Assets Investment Co., Ltd. (provisional name), which mainly engaged in the debt-to-equity conversion of banks and supporting businesses. For details, please refer to the Company's announcement dated December 22, 2018.
XI. PERFORMANCE OF SOCIAL RESPONSIBILITIES
(I) Poverty Alleviation Work
1. Targeted poverty alleviation plan
The Company’s basic strategy for targeted poverty alleviation work is strictly carrying out the implementation opinions of the General Office of the CPC Central Committee and the General Office of the State Council regarding the crucial poverty alleviation work in very poor regions. Centering on the basic strategy of “targeted poverty alleviation and targeted poverty relief”, the Company took a multi-pronged approach to financial poverty alleviation based on the actual condition, leveraging its advantages in network, capital, and expertise.
General objectives: constantly improving the poverty alleviation work mechanism to increase the availability of financial service to extreme poverty regions; enhancing credit support for extreme poverty regions. Based on the development of inclusive finance, the Company fully promoted its financial poverty alleviation work in five major areas: industry-based poverty alleviation, channel-based poverty alleviation, product-based poverty alleviation, targeted poverty alleviation and education poverty alleviation.
Main tasks: thoroughly studying and understanding the implementation opinions of the General Office of the CPC Central Committee and the General Office of the State Council regarding the crucial poverty alleviation work in extreme poverty regions, targeting key groups and key tasks for poverty alleviation, accurately catering to financial needs, accurately improving support measures, accurately strengthening work quality and efficiency, and continuously advancing financial poverty alleviation work.
Guarantee measures: convening the work meeting of the Head Office Financial Poverty Alleviation Leader Team to

INDUSTRIAL BANK
88
clarify the tasks and directions of financial poverty alleviation; adhering to the combination of targeted support and overall driving and the coordination between innovative development and risk prevention to continuously improve the evaluation mechanism for financial poverty alleviation and assessment incentive mechanism, and strengthen positive reinforcement.
2. Summary of targeted poverty alleviation plan in 2018
During the reporting period, the Company successfully completed the annual poverty alleviation plan, with details of completion and the results as follows:
As at the end of the reporting period, the balance of the Company's targeted poverty alleviation loans totaled RMB7,517 million, representing an increase of RMB1,981 million or 35.77% as compared with the beginning of the period. The balance of the targeted poverty alleviation loans in terms of units totaled RMB5,895 million, representing an increase of RMB1,653 million or 38.97% over the beginning of the period, of which, the balance of targeted poverty alleviation loans in terms of industries totaled RMB3,123 million, representing an increase of RMB1,917 million or 180.85% as compared with the beginning of the period; and the balance of targeted poverty alleviation loans in terms of individuals totaled RMB1,622 million, or the number of loans of 7,618.
3. Effects of targeted poverty alleviation
Unit: RMB million
Indicator Amount and its implementation
I. General information
1. Fund 7,517
2. Number of people served or facilitated by the targeted poverty alleviation financial loans 126,845
II. Itemized input
1. Poverty alleviation through industrial development
Number of targeted poverty alleviation industrial loans 113
Amount of targeted poverty alleviation industrial loans 3,123
Number of people facilitated by targeted poverty alleviation industrial loans 2,837
2. Poverty alleviation project loans
Number of targeted poverty alleviation project loans 21
Amount of targeted poverty alleviation project loans 2,772
Number of people served by targeted poverty alleviation project loans 117,289
3. Other investment 1,622
4. Subsequent plan of targeted poverty alleviation
According to the Company's long-term business strategy and poverty alleviation plan, work arrangements of targeted poverty alleviation and the main measures in 2019 will be as follows:
Firstly, we will optimize the outlet layout, expand current outlet coverage, and actively promote service upgrade in existing outlets to constantly increase the availability of financial services. We will promote the rapid development of featured business of the Bank-to-Bank Platform to expand the coverage of the business in poor county cities and rural areas.
Secondly, we will formulate projects for targeted poverty alleviation loans based on the actual situation in various parts of

2018 ANNUAL REPORT
89
the country and develop one policy for each project. We will expand the scope of financial service for poverty alleviation loans, and actively fulfill our social responsibilities. We will increase the credit supply to very poor regions, enhance the relending management in very poor regions and further tilt the relending to poverty alleviation work.
Thirdly, we will strengthen the communication, coordination and information sharing with local poverty alleviation departments to gain an in-depth understanding of the basic production and living conditions and financial service demands of poor households and timely obtain planning information on the development of characteristic industries, infrastructure and basic public service in poverty-stricken areas. We will provide targeted poverty alleviation financial products and service, and design a practical financial service plan to achieve "real poverty alleviation and alleviation of real poverty."
Fourthly, we will actively track the poverty alleviation industry funds led by local governments, actively participating in the design, innovation and guidance of industrial funds with notable poverty alleviation effects, great social benefits, and more controllable risks.
Fifthly, we will support the development of advantageous agriculture in poverty-stricken areas, foster market awareness of the poverty-stricken population, and propel the poverty-stricken population to achieve self-development, enabling them to become a market player with certain competitiveness in specific industries, thereby promoting the shift of financial poverty alleviation from “blood transfusion” to "blood generation".
Sixthly, the Company will strengthen the financial publicity and education in very poor regions, enhance local consumers’ awareness and abilities of identifying and preventing financial risks and using financial tools, and boost the financial consumer rights protection in very poor regions.
(II) Consumer rights and interests protection
During the reporting period, the Company actively constructed consumer rights protection system, improved the rules of procedures of the Risk Management and Consumer Rights Protection Committee, revised the management measures for consumer rights protection, and strengthened the consumer protection assessment of branches, implementing consumer rights protection through system, mechanism, concept and actions. It actively carried out public education activities such as improving consumers’ financial literacy, paying particular attention to caring for special groups, improving consumer service experience, and safeguarding consumers' legitimate rights and interests. The Company won the title of “Excellent Organization” in the event of “Financial Knowledge Popularization Month - Financial Knowledge for Households” and “Enhancing Financial Literacy” event, and the Best Performance Organization in the event of 2018 Long-distance Travelling for Popularization of Financial Knowledge of China Banking Industry.
(III) The Company has disclosed the 2018 Sustainable Development Report of Industrial Bank. For details please refer to the website of Shanghai Stock Exchange.
(IV) Environmental performances and policies
During the reporting period, the Company actively implemented the requirements of the state's differentiated credit policy, explicitly prohibiting involvement in industries with backward technology, severe pollution and resources waste and industries that were shut down and restricted development by the state, and implementing the credit extension policy of “encouraging the growth of some sectors while discouraging the expansion of others, restricting increment, and invigorating inventory” for overcapacity industries, thereby strictly controlling new credit extension for industries with severe overcapacity.
The Company continued to strengthen the application of big data analysis in risk alert to achieve forward-looking management of environmental and social risks. By streamlining key business processes, it promptly identified environmental and social risk points and control points, and combined the “early intervention” and “evaluation after union”
INDUSTRIAL BANK
90
mechanisms to improve the all-process management of environmental and social risks.
As the first bank in China to adopt the Equator Principles, the Company actively implemented the state’s low-carbon and environmental protection policy and always adhered to the green operation concept, emphasizing “green office, low-carbon life”, paying particular attention to refined energy consumption management to save energy and reduce consumption in water, electricity and paper consumption, waste recycling, energy conservation and environmental protection facilities. During the reporting period, the carbon dioxide emissions of the Company's headquarters were 24,868.13 tons.
Meanwhile, the Company adhered to green procurement. It strictly reviewed suppliers' safety, health, environmental protection and labor security in the procurement process and strengthened the environmental and social management of suppliers. The Company continued to practice the Equator Principles by applying the concepts and methods of the Equator Principles to enhance the systemization, specialization and operability of project management, gradually promote the innovation of the Company's sustainable development concept. It integrated the strategy of “sustainable development” and the social responsibility practice model of “virtual wealth” into banking business to promote the sustainable development of the entire society.

2018 ANNUAL REPORT
91
Share Capital Changes and Shareholders of Ordinary Shares
I. Changes in shares during the reporting period
(I) Changes in shares
There was no change in shares of the Company during the reporting period.
Unit: share
December 31, 2017 December 31, 2018
Number Percentage (%)
Change in
numberNumber Percentage
(%)
I. Restricted shares 1,721,854,000 8.29 - 1,721,854,000 8.29
1. State-owned shares 430,463,500 2.07 - 430,463,500 2.07
2. Shares held by state-owned legal entities 794,701,800 3.83 - 794,701,800 3.83
3. Shares held by other domestic investors 496,688,700 2.39 - 496,688,700 2.39
Incl: Shares held by domestic non-state-owned legal persons 496,688,700 2.39 - 496,688,700 2.39
Shares held by domestic natural persons 0 0 - 0 0
4. Shares held by foreign investor 0 0 - 0 0
Incl: Shares held by foreign legal persons 0 0 - 0 0
Shares held by foreign natural persons 0 0 - 0 0
II. Unrestricted floating shares 19,052,336,751 91.71 - 19,052,336,751 91.71
1. RMB ordinary shares 19,052,336,751 91.71 - 19,052,336,751 91.71
2. Domestically listed foreign shares 0 0 - 0 0
3. Overseas listed foreign shares 0 0 - 0 0
4. Others 0 0 - 0 0
III. Total shares 20,774,190,751 100 - 20,774,190,751 100
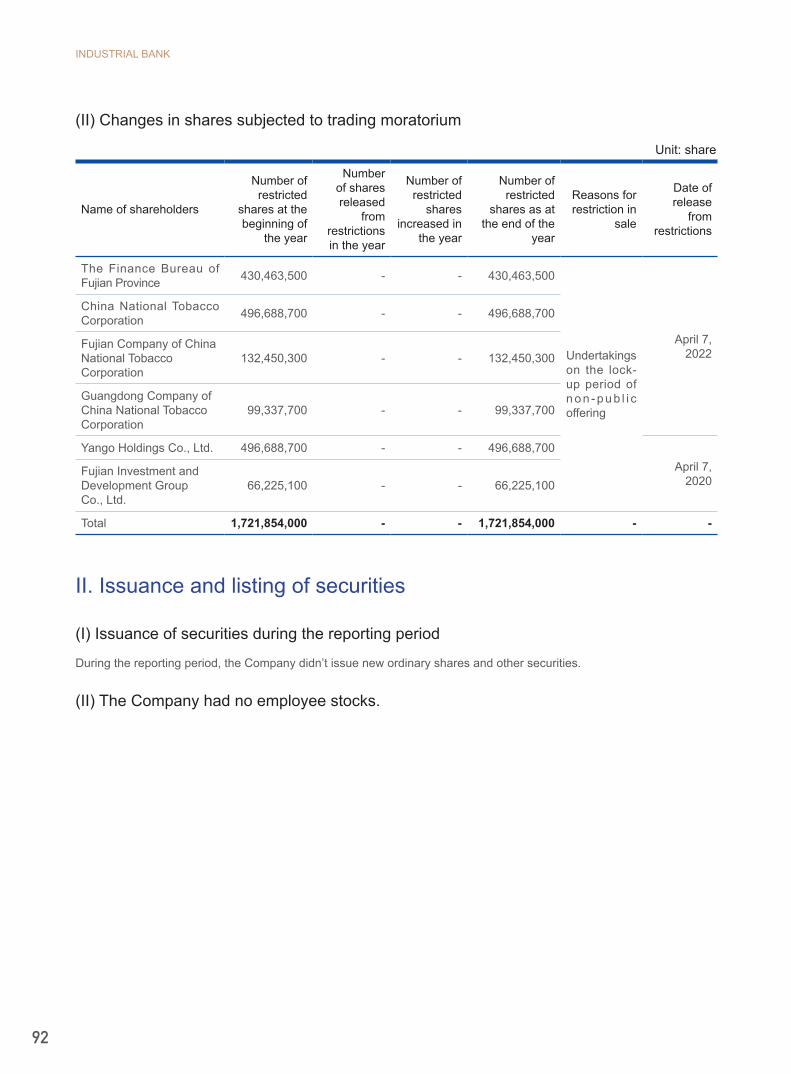
INDUSTRIAL BANK
92
(II) Changes in shares subjected to trading moratorium
Unit: share
Name of shareholders
Number of restricted
shares at the beginning of
the year
Number of shares released
from restrictions in the year
Number of restricted
shares increased in
the year
Number of restricted
shares as at the end of the
year
Reasons for restriction in
sale
Date of release
from restrictions
The Finance Bureau of Fujian Province 430,463,500 - - 430,463,500
Undertakings on the lock-up period of n o n - p u b l i c offering
April 7, 2022
China National Tobacco Corporation 496,688,700 - - 496,688,700
Fujian Company of China National Tobacco Corporation
132,450,300 - - 132,450,300
Guangdong Company ofChina National TobaccoCorporation
99,337,700 - - 99,337,700
Yango Holdings Co., Ltd. 496,688,700 - - 496,688,700April 7,
2020Fujian Investment and Development Group Co., Ltd.
66,225,100 - - 66,225,100
Total 1,721,854,000 - - 1,721,854,000 - -
II. Issuance and listing of securities
(I) Issuance of securities during the reporting period
During the reporting period, the Company didn’t issue new ordinary shares and other securities.
(II) The Company had no employee stocks.
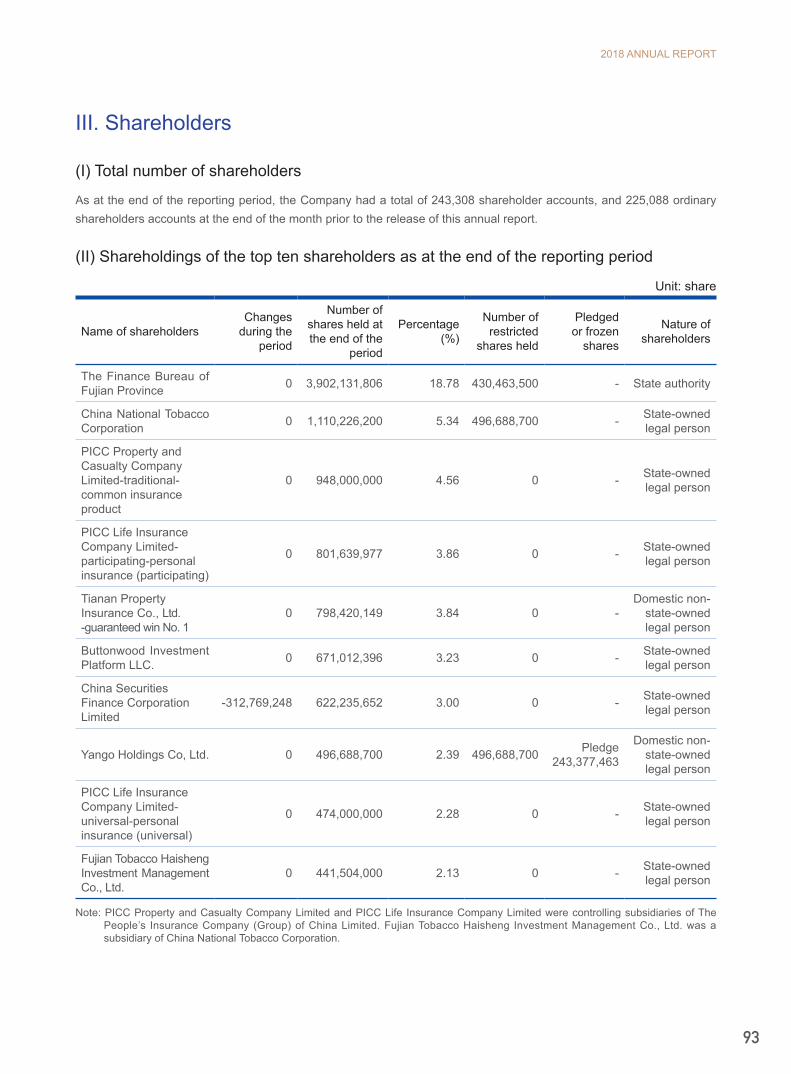
2018 ANNUAL REPORT
93
III. Shareholders
(I) Total number of shareholders
As at the end of the reporting period, the Company had a total of 243,308 shareholder accounts, and 225,088 ordinary shareholders accounts at the end of the month prior to the release of this annual report.
(II) Shareholdings of the top ten shareholders as at the end of the reporting period
Unit: share
Name of shareholdersChanges
during the period
Number of shares held at the end of the
period
Percentage (%)
Number of restricted
shares held
Pledged or frozen
shares
Nature of shareholders
The Finance Bureau of Fujian Province 0 3,902,131,806 18.78 430,463,500 - State authority
China National Tobacco Corporation 0 1,110,226,200 5.34 496,688,700 - State-owned
legal person
PICC Property and Casualty CompanyLimited-traditional-common insurance product
0 948,000,000 4.56 0 - State-owned legal person
PICC Life InsuranceCompany Limited-participating-personal insurance (participating)
0 801,639,977 3.86 0 - State-owned legal person
Tianan PropertyInsurance Co., Ltd.-guaranteed win No. 1
0 798,420,149 3.84 0 -Domestic non-
state-owned legal person
Buttonwood Investment Platform LLC. 0 671,012,396 3.23 0 - State-owned
legal person
China Securities Finance CorporationLimited
-312,769,248 622,235,652 3.00 0 - State-owned legal person
Yango Holdings Co, Ltd. 0 496,688,700 2.39 496,688,700 Pledge243,377,463
Domestic non-state-owned legal person
PICC Life InsuranceCompany Limited-universal-personal insurance (universal)
0 474,000,000 2.28 0 - State-owned legal person
Fujian Tobacco Haisheng Investment Management Co., Ltd.
0 441,504,000 2.13 0 - State-owned legal person
Note: PICC Property and Casualty Company Limited and PICC Life Insurance Company Limited were controlling subsidiaries of The People’s Insurance Company (Group) of China Limited. Fujian Tobacco Haisheng Investment Management Co., Ltd. was a subsidiary of China National Tobacco Corporation.

INDUSTRIAL BANK
94
(III) Shareholdings of the top ten shareholders of unrestricted shares
Unit: share
Name of shareholders Number of unrestricted floating shares held
Percentage of total share capital (%) Type of shares
The Finance Bureau of Fujian Province 3,471,668,306 16.71 RMB ordinary shares
PICC Property and Casualty Company Limited-traditional-common insurance product 948,000,000 4.56 RMB ordinary shares
PICC Life Insurance Company Limited-participating-personal insurance (participating) 801,639,977 3.86 RMB ordinary shares
Tian’an Property Insurance Co., Ltd.-guaranteed win No. 1 798,420,149 3.84 RMB ordinary shares
Buttonwood Investment Platform LLC. 671,012,396 3.23 RMB ordinary shares
China Securities Finance Corporation Limited 622,235,652 3.00 RMB ordinary shares
China National Tobacco Corporation 613,537,500 2.95 RMB ordinary shares
PICC Life Insurance Company Limited-universal-personal insurance (universal) 474,000,000 2.28 RMB ordinary shares
Fujian Tobacco Haisheng Investment Management Co., Ltd. 441,504,000 2.13 RMB ordinary shares
Hong Kong Securities Clearing Company Limited 396,190,230 1.91 RMB ordinary shares
Note: PICC Property and Casualty Company Limited and PICC Life Insurance Company Limited were controlling subsidiaries of The People’s Insurance Company (Group) of China Limited. Fujian Tobacco Haisheng Investment Management Co., Ltd. was a subsidiary of China National Tobacco Corporation.

2018 ANNUAL REPORT
95
(IV)Number of shares held by shareholders subject to trade restrictions as well as conditions of such restrictions
Unit: share
Name of holders of restricted sharesNumber of restricted
shares held
Availability for listing and trading of restricted shares
Condition of restrictionDate when shares
become tradable
Number of new tradable
shares
The Finance Bureau of Fujian Province 430,463,500
April 7, 2022
430,463,500 These shares could not be transferred within 60 months from the day when the offering was completed (except otherwise required by the competent regulators on the expired and transferred shares and the shareholding qualification of the transferee)
China National Tobacco Corporation 496,688,700 496,688,700
Fujian Company of China National Tobacco Corporation 132,450,300 132,450,300
Guangdong Company of China National Tobacco Corporation 99,337,700 99,337,700
Yango Holdings Co., Ltd. 496,688,700
April 7, 2020
496,688,700These shares shall not be transferable within 36 months after completion of the issuance and transfer of such shares shall be subject to relevant rules of CSRC and Shanghai Stock Exchange upon expiration of lock-up period.
Fujian Investment and Development Group Co., Ltd. 66,225,100 66,225,100
Descriptions about the association between or concerted actions of the above shareholders
Fujian Company of China National Tobacco Corporation and Guangdong Company of China National Tobacco Corporation are both subsidiaries of China National Tobacco Corporation.

INDUSTRIAL BANK
96
(V) Substantial shareholdersThe Company has no controlling shareholder or de facto controller. Pursuant to the rules of Interim Measures for Equity Management of Commercial Banks, the substantial shareholders of the Company were as follow:
1. The Finance Bureau of Fujian Province was the largest shareholder of the Company, holding 18.78% of the shares of the Company. It nominated directors to the Company and there was no case of pledge of the Company's shares. The Finance Bureau of Fujian Province is a legal person of government unit. Its legal representative is Yu Jun and the address is 5 Zhongshan Road, Fuzhou.
2. The People's Insurance Company (Group) of China Limited, PICC Property and Casualty Company Limited and PICC Life Insurance Company Limited collectively held 12.90% of the shares of the Company. They nominated directors to the Company and there was no case of pledge of the Company's shares. The People’s Insurance Company (Group) of China Limited was the controlling shareholder of PICC Property and Casualty Company Limited and PICC Life Insurance Company Limited, its controlling shareholder was the Ministry of Finance of the People's Republic of China.
The People’s Insurance Company (Group) of China Limited held 0.84% of the Company's shares. On October 20, 1949, The People’s Insurance Company of China was established in Beijing with the approval of the Government Administration Council of China. In August 1996, upon the decision of the State Council and the approval of the PBOC, The People’s Insurance Company of China was restructured as PICC (Group) Company. In October 1998, upon approval of the State Council, PICC (Group) Company was deregistered. Zhongbao Property Insurance Company Limited inherited the brand of The People’s Insurance Company of China and retained the name of The People’s Insurance Company of China. In July 2003, upon consent of the State Council and approval of the China Insurance Regulatory Commission, The People’s Insurance Company of China initiated the establishment of the PICC Property and Casualty Company Limited, and the company name was changed to PICC Holding Company. In June 2009, according to the restructuring plan approved by the State Council, the Ministry of Finance and the China Insurance Regulatory Commission approved PICC (Group) Company to carry out the general conversion, in which the Ministry of Finance exclusively initiated the establishment of The People’s Insurance Company (Group) of China Limited. The People’s Insurance Company (Group) of China Limited has been listed on the main board of the Hong Kong Stock Exchange and the main board of the Shanghai Stock Exchange with the stock codes of “01339.HK” and “601319.SH”, respectively. The registered capital of The People’s Insurance Company (Group) of China Limited is RMB42.424 billion (Note: after the listing of its A shares on November 16, 2018, the registered capital of The People’s Insurance Company (Group) of China Limited increased to RMB44.224 billion. The industrial and commercial registration procedures for the change of registered capital are currently underway), its place of registration is Beijing, and the legal representative is Miao Jianmin. Its scope of business mainly includes investment and holding shares in listed companies, insurance institutions and other financial institutions, supervision and management of various domestic and international businesses of holding investment companies, policy insurance business authorized or entrusted by the state, and other businesses approved by the former China Insurance Regulatory Commission and relevant state authorities.
PICC Property and Casualty Company Limited held 5.91% of the Company's shares. Established in July 7, 2003, it has a registered capital of RMB22.243 billion, its registered office is in Beijing and its legal representative is Miao Jianmin. Its scope of business includes: property and casualty insurance, liability insurance, credit insurance, accidental injury insurance, short-term health insurance and surety insurance in Renminbi or foreign currencies; the re-insurance of the aforesaid insurances; reinsurance and provision of consulting services related to the businesses mentioned above; service and advisory business related to various property insurance, accidental injury insurance, short-term health insurance and re-insurance; and representing insurers in conducting relevant business; investment and capital utilization business permitted by the national laws and regulations; and other businesses authorized by national laws and regulations or approved by the CBIRC.
PICC Life Insurance Company Limited held 6.14% of the Company's shares. Established in November 10, 2005, it has a registered capital of RMB25.761 billion, its registered office is in Beijing and its legal representative is Miao Jianmin. Its business includes: life insurance, health insurance, accident insurance, and the re-insurance of the aforesaid insurances,
2018 ANNUAL REPORT
97
as well as the providing agency insurance on behalf of PICC and PICC Health to the extent permitted by the former CIRC.
3. China National Tobacco Corporation, Fujian Tobacco Haisheng Investment Management Co., Ltd., China Tobacco Hunan Investment Management Co., Ltd., Fujian Company of China National Tobacco Corporation and Guangdong Company of China National Tobacco Corporation collectively held 9.68% of the shares of the Company. They nominated directors to the Company and there was no case of pledge of the Company's shares. Fujian Tobacco Haisheng Investment Management Co., Ltd., China Tobacco Hunan Investment Management Co., Ltd., Fujian Company of China National Tobacco Corporation and Guangdong Company of China National Tobacco Corporation were subsidiaries of China National Tobacco Corporation and their de facto controller was the Ministry of Finance of the People's Republic of China.
Founded in December 15, 1983, China National Tobacco Corporation held 5.34% of the shares of the Company. It's a wholly state-owned enterprise with a registered capital of RMB57.0 billion. Its registered office is in Beijing, and its legal representative is Zhang Jianmin. Its business includes production, operation and import and export trading of tobacco monopoly products and operation and management of state-owned assets.
Founded in July 18, 2005, Fujian Tobacco Haisheng Investment Management Co., Ltd. held 2.13% of the shares of the Company. It has a registered capital of RMB2.647 billion. Its registered office is in Xiamen and its legal representative is Lu Xiaodong. Its businesses include investment management (except otherwise required by the laws and regulations), being entrusted to manage legally established hotels, and other business operations that do not involve prerequisite approval permission. The controlling shareholder is Fujian Company of China National Tobacco Corporation.
Founded on October 20, 2011, China Tobacco Hunan Investment Management Co., Ltd. held 1.09% of the shares of the Company. It has a registered capital of RMB0.2 billion. Its registered office is in Changsha and its legal representative is Deng Yongzhi. Its scope of business is to carry out (with its own legal funds) investment and management in printing industry, paper product manufacturing industry, plastic membrane manufacturing industry, other tobacco product manufacturing industry, industry of integrated utilization of waste, construction industry, advertising industry, cultural activities services, conferences and exhibitions and related services, manufacturing of electronic products, manufacturing of electronic cigarette, financial industry, real estate industry, agriculture, agricultural and non-staple food processing industry, pharmaceutical manufacturing industry, unit logistics management service industry; investment consulting service; conference service; supply chain management; production, processing and sales of packaging products; and paper sales. (Items subject to approval according to the law may only be operated upon approval of relevant authorities). Its controlling shareholder China Tobacco Hunan Industrial Co., Ltd. was established on July 16, 1994 with a registered capital of RMB4.3 billion. The place of registration is Changsha, and the legal representative is Lu Ping.
Founded in November 29, 1995, Fujian Company of China National Tobacco Corporation held 0.64% of the shares of the Company. It has a registered capital of RMB137 million. Its registered office is in Fuzhou and its legal representative is Zhang Yongjun. Its businesses include operation of tobacco monopoly products (see the business license for validity period); asset management and comprehensive management. (items that are subject to the approval according to the law may only be carried out upon approval of relevant authorities)
Founded in August 31, 1989, Guangdong Company of China National Tobacco Corporation held 0.48% of the shares of the Company. It has a registered capital of RMB140 million. Its registered office was in Guangzhou and its legal representative was Liu Yiping. Its businesses include operation of cigarette, production and operation of tobacco, asset management and comprehensive management, export of tobacco monopoly products, supporting service for the import of tobacco monopoly products, and the operation of imported tobacco products in China.
4. Xishui Strong Year Co., Ltd. Inner Mongolia and Tian An Property Insurance Co., Ltd. collectively held 4.68% of the shares and nominated directors to the Company. Xishui Strong Year Co., Ltd. Inner Mongolia was the controlling shareholder of Tianan Property Insurance Co., Ltd., its controlling shareholders was Zhengyuan Investment Co., Ltd. and its de facto controller was Xiao Weihua.
INDUSTRIAL BANK
98
Xishui Strong Year Co., Ltd. Inner Mongolia held 0.61% of the shares of the Company, of which 34 million shares were pledged. It was founded on April 14, 1998 with a registered office in Wuhai, Inner Mongolia and a registered capital of RMB1.093 billion. Its legal representative is Guo Yufeng and its businesses include general business items: services for controlling company, the sales of mineral products, building materials products, chemical products, machinery equipment, hardware products, and electronic products; lease of machinery and equipment; and software development. Its controlling shareholder Zhengyuan Investment Co., Ltd. was founded on March 28, 2008 with a registered office in Baotou, Inner Mongolia and a registered capital of RMB1.340 billion. Its legal representative is Xiao Weihua.
Tianan Property Insurance Co., Ltd. held 4.07% of the shares of the Company and there was no case of pledge of the Company's shares. It was founded on January 27, 1995 with a registered office in Shanghai and a registered capital of RMB17.764 billion. Its legal representative is Guo Yufeng and its businesses include various types of property insurance denominated in Renminbi and foreign currencies, liability insurance, credit insurance, marine insurance, accidental injury insurance, health insurance and financial service insurance; responsible for various reinsurance businesses and statutory insurance businesses; establishing agency relations and business relationships with insurance agencies both domestic and abroad to act as an agent for inspections, claims, recovery and other related matters; handle capital applications approved by the CBIRC; and other businesses approved by the CBIRC.
5. Yango Holdings Co., Ltd. held 2.39% of the shares of the Company, of which 243 million shares were pledged. It nominated directors to the Company and its controlling shareholder was Yango Longjing Co., Ltd. and its de facto controllers were Lin Tengjiao and Wu Jie. It was founded on July 18, 2006 with a registered office in Fuzhou and a registered capital of RMB9.699 billion. Its legal representative was Wu Jie and its businesses include general business items, such as: the investment in information, hotel, tourism and education, investment management; the wholesale, purchase and sales of construction material, hardware, electronics and appliances. (items that are subject to the approval according to the law may only be carried out upon approval of relevant authorities). Its controlling shareholder Yango Longjing Co., Ltd. was established on December 8, 2014 with a registered office in Shanghai and a register capital of RMB2.699 billion. Its legal representative was Wu Jie.
6. Longyan Huijin Development Group Co., Ltd. held 1.05% of the shares of the Company. It nominated supervisors to the Company and there was no case of pledge of the Company's shares. The controlling shareholder is State-owned Assets Supervision and Administration Commission of Longyan City, Fujian Province. The company was established on November 9, 2010, with a registered office in Longyan and a registered capital of RMB2 billion and its legal representative is Wang Lansheng. Its business scope includes operation and management of asset investment; investment in publicly traded securities, non-security equity, and financial industry; management of equity investments; urban infrastructure construction; wholesale of coal and related products (excluding hazardous chemicals); wholesale of non-metallic ore and related products; wholesale of metal and metal ore. (items subject to approval according to the law may only be operated upon approval of relevant authorities)
7. Zhejiang Energy Group Co., Ltd., Zhejiang Zheneng Electric Power Co., Ltd. and Zhejiang Energy Group Finance Co., Ltd. collectively held 0.62% of the shares of the Company. They nominated directors to the Company and there was no case of pledge of the Company's shares. Zhejiang Energy Group Co., Ltd. was the controlling shareholder of Zhejiang Zheneng Electric Power Co., Ltd. and Zhejiang Energy Group Finance Co., Ltd. Its controlling shareholder was State-owned Assets Supervision and Administration Commission of Zhejiang Provincial People's Government.
Zhejiang Energy Group Co., Ltd. held 0.02% of the shares of the Company. The company was established on March 21, 2001 with a registered office in Hangzhou and a registered capital of RMB10 billion. Its legal representative is Tong Yahui and its businesses include the operation of state-owned assets and state-owned shares of the group companies and their affiliated companies that are authorized by the state; industrial investment development; technical advisory services, technical advisory services for coal transportation information; production and supply of electric power; development and utilization of renewable energy; operation management of oil and gas; engineering technology and service; sale of steel, nonferrous metals, construction materials, machinery equipment, electrical cables, coal (without storage); international ship transportation (operating with license); domestic water transport (operating with license); electric

2018 ANNUAL REPORT
99
machinery and equipment; new energy equipment manufacturer; private equity investment; investment consulting and asset management. (Without the approval of the financial and other regulatory authorities, it is not allowed to engage in financial service such as financing deposits, financing guarantees, and customer financing for the public) (items that are subject to the approval according to the law may only be carried out upon approval of relevant authorities)
Zhejiang Zheneng Electric Power Co., Ltd. held 0.57% of the shares of the Company. The company was established on March 14, 1992 with a registered office in Hangzhou and a registered capital of RMB13.601 billion. Its legal representative is Sun Weiheng and its businesses include: electricity generation, operation control; research and development of electric power and energy-saving technologies, technical advisory as well as the sales of energy-saving products; construction and supervision of electric power projects and power environmental protection projects; maintenance of electric equipment; power selling service(operating with license); sales of cooling, heat, hot water and steam; contractual energy management.(items that are subject to the approval according to the law may only be carried out upon approval of relevant authorities)
Zhejiang Energy Group Finance Co., Ltd. held 0.03% of the shares of the Company. The company was established on August 25, 2006 with a registered office in Hangzhou and a registered capital of RMB971 million. Its legal representative is Wang Lina and its businesses include the operation of business approved by the CBRC in accordance with relevant laws, administrative regulations and other regulations; the business scope shall be as set on in the approval documents.
INDUSTRIAL BANK
100
Matters Regarding Preferred Shares
I. Issuance and listing of preferred sharesUnit: share
Preferred shares code
Stock abbreviation
Date of issuance
Issuing price
(Yuan/share)
Dividend rate (%)
Issuance size
Date of listing
Number of shares listed
Date of delisting
360005 Industrial P1 December 3, 2014 100 6.00 130,000,000 December
19, 2014 130,000,000 None
360012 Industrial P2 June 17, 2015 100 5.40 130,000,000 July 17,
2015 130,000,000 None
360032 Industrial P3 April 3, 2019 100 4.90 300,000,000 April 26,
2019 300,000,000 None
Notes: 1. With the approval of CSRC, the Company issued 130 million preferred shares with a par value of RMB100 per share and 6.00% coupon rate in the first interest cycle through non-public offering in December 2014. After deducting the offering expenses, the net proceeds reached RMB12.958 billion, all of which were used for supplementing Tier 1 capital. Upon the completion of the issuance of the first tranche of preferred shares, the preferred shares have been listed on the integrated business platform of the Shanghai Stock Exchange since December 19, 2014.2. The Company issued the second tranche 130 million preferred shares with a par value of RMB100 per share and 5.40% coupon in the first interest cycle through non-public offering in June 2015. After deducting the offering expenses, the net proceeds reached RMB12.947 billion, all of which were used for supplementing Tier 1 capital. Upon the completion of issuance of the second tranche of preferred shares, the preferred shares have been listed on the integrated business platform of the Shanghai Stock Exchange since July 17, 2015.3. Upon approval of the CSRC, the Company issued 300 million preferred shares with a par value of RMB100 per share and 4.90% coupon in the first interest cycle through non-public offering in April 2019. After deducting the offering expenses (including tax), the net proceeds reached RMB29.933 billion. The net proceeds plus deductible input VAT tax on offering expenses amounted to a total of RMB29.937 billion, all of which were used for supplementing Tier 1 capital. Upon the completion of the issuance, the preferred shares will be listed on the integrated business platform of the Shanghai Stock Exchange since April 26, 2019.
II. Preferred shares shareholders
(I) Number of preferred shares shareholders
No. of preferred shares shareholder accounts as at the end of the reporting period 33
No. of preferred shares shareholder accounts as at the end of the month prior to the disclosure of the annual report 33
2018 ANNUAL REPORT
101
(II) Shareholdings of the top ten shareholders as at the end of the reporting period
Unit: share
Name of shareholders
Changes of number of shares
during the reporting
period
Number of shares
held at the end of the
period
Percentage (%) Type of shares
Pledged or frozen
shares
Nature of shareholders
Ping An Life InsuranceCompany of China-participating-personal insurance (participating)
0 44,114,000 16.97 Domestic preferred shares - Others
Ping An Life Insurance Company of China-universal-personal insurance (universal)
0 21,254,000 8.17 Domestic preferred shares - Others
PICC Property and Casualty Company Limited-traditional-common insurance product
0 21,254,000 8.17 Domestic preferred shares - Others
The Finance Bureau of Fujian Province 0 14,000,000 5.38 Domestic preferred
shares - State authority
Bank of Communications Schroders 0 13,474,000 5.18 Domestic preferred
shares - Others
Guangdong Finance Trust Co., Ltd. 0 12,198,000 4.69 Domestic preferred
shares - Others
PICC Life Insurance Company Limited-participating-personal insurance (participating)
0 11,450,000 4.40 Domestic preferred shares - Others
BOCI Securities Limited 0 9,044,000 3.48 Domestic preferred shares - Others
Zhonghai Trust Co., Ltd. 0 7,944,000 3.06 Domestic preferred shares - Others
Bosera Funds 0 7,944,000 3.06 Domestic preferred shares - Others
Notes: 1. All preferred shares issued by the Company are preferred shares without selling restrictions. The shareholders holding both Industrial P1 and Industrial P2 were presented in consolidation.2. The connected relationship exists among Ping An Life Insurance Company of China-participating-personal insurance (participating), Ping An Life Insurance Company of China-universal-individual insurance (universal), and Ping An Property & Casualty Insurance Company of China, Ltd. -traditional-general insurance products. Apart from that, the Company was not aware of any connected relationship or concerted relationship among the above shareholders. 3. As at the end of the period, the Finance Bureau of Fujian Province held 3,902,131,806 ordinary shares of the Company. Apart from that, the Company was not aware of any connected relationship or concerted relationship among the above shareholders and the top ten holders of ordinary shares.
INDUSTRIAL BANK
102
III. Profit distribution of preferred shares
(I) Profit distribution
The dividend distribution of the preferred shares under this issuance shall be made once in each accounting year by cash payment.
The aggregate par value of the preferred shares “Industrial P1” is RMB13 billion, the interest period of preferred shares for 2018 was from January 1, 2018 to December 31, 2018, and the proposed dividends are RMB780 million with an annual dividend yield of 6%.
The aggregate par value of the preferred shares “Industrial P2” is RMB13 billion and the interest period of preferred shares for 2018 was from January 1, 2018 to December 31, 2018, and the proposed dividends are RMB702 million with an annual dividend yield of 5.40%.
The above distribution plans will be implemented in two months after the approval of the general meeting.
(II) Distribution amount and ratio of preferred shares of the previous three years
Unit: RMB million
Year Amount Ratio
2018 1,482 100%
2017 1,482 100%
2016 1,482 100%
Note: Distribution ratio = Announced distribution amount / Agreed distribution amount for the year * 100%.
IV. During the reporting period, the Company made no repurchase of preferred shares, conversion of preferred shares into ordinary shares or restoration of voting rights of preferred shares.
V. Accounting policies adopted by the Company for the preferred shares and reasonsPursuant to the Accounting Standard for Business Enterprises No. 22 – Recognition and Measurement of Financial Instruments, Accounting Standard for Business Enterprises No.37 – Presentation and Reporting of Financial Instrument and the Distinction between Financial Liabilities and Equity Instruments and Relevant Accounting Treatments promulgated by the Ministry of Finance of the People’s Republic of China and the main terms of the issued preference shares of the Company, the Company's preferred shares meet the requirements for being accounted as an equity instrument. Therefore, the Company's issued preferred shares were accounted for as an equity instrument.
2018 ANNUAL REPORT
103
VI. Adjustments regarding the mandatory conversion price The initial mandatory conversion price of the preferred shares under the issuance shall be the average trading price (the initial mandatory conversion price of Industrial P1 and Industrial P2 is RMB9.86/share and the initial mandatory conversion price of Industrial P3 is RMB16.50/share ) of the ordinary A shares of the Company in the 20 trading days preceding the date of the resolution of the meeting of the Board at which the issuance proposal of the preferred shares was considered and approved. Following the date of the Board resolution, in the event of the issuance of bonus shares, conversion of share capital, issuance of new shares (excluding additional share capital as a result of conversion into shares of financing instruments attached with terms for conversion into ordinary shares, such as preferred shares and convertible corporate bonds, of which their share capital is increased by the conversion), rights issue, and etc., the Company shall, based on the sequence of the occurrences of the above events, undertake cumulative adjustments to the mandatory conversion prices in accordance with the specified formula.
Upon the approval of the CSRC, the Company issued 1,721,854,000 A shares in a non-public way and handled registration and lock-up procedures with Shanghai Branch of China Securities Depository and Clearing Corporation Limited for the newly issued A shares on April 7, 2017. Calculated with the formula for adjustment of compulsory conversion price of “Industrial P1” and “Industrial P2” as set out in relevant terms of the Prospectus for Non-public Issuance of Domestic Preferred Shares of Industrial Bank Co., Ltd. for 2014 and the Prospectus for Non-public Issuance of Domestic Preferred Shares (Second Tranche) of Industrial Bank Co., Ltd. for 2015, upon completion of the non-public issuance of A shares by the Company, the compulsory conversion price of "Industrial P1" and "Industrial P2" issued by the Company was adjusted from RMB9.86/share to RMB9.80/share. For details, please refer to the Company’s announcement dated April 11, 2017.
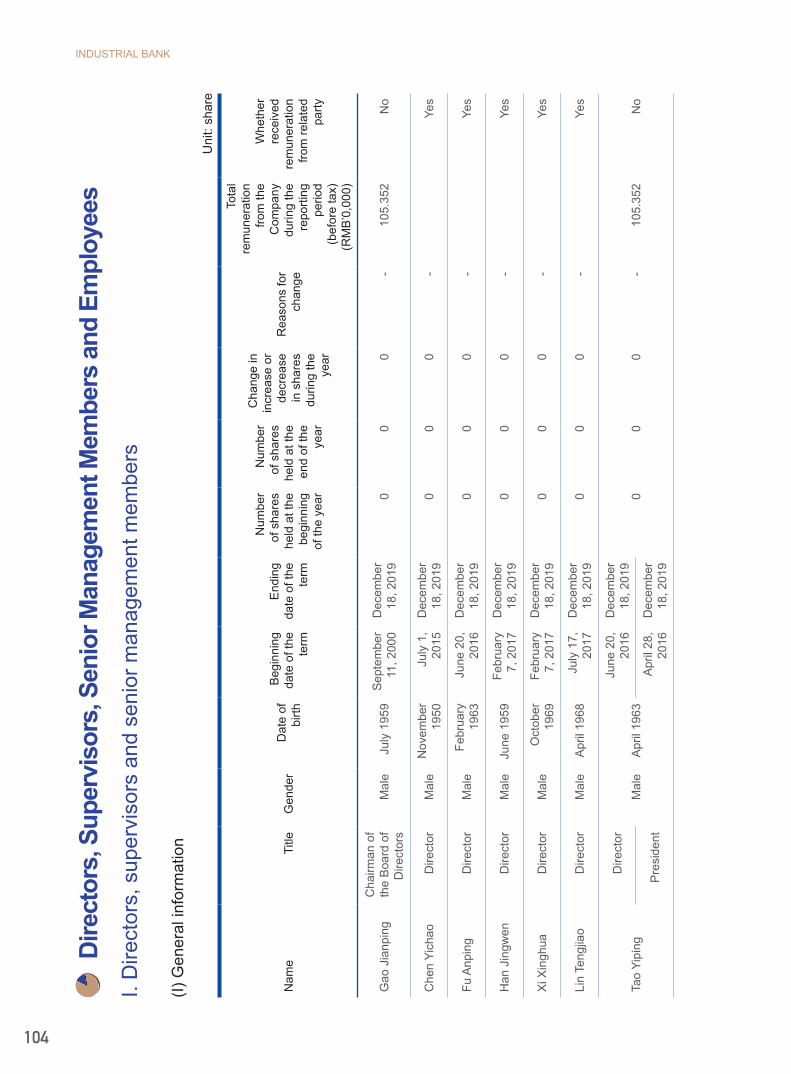
INDUSTRIAL BANK
104
Di
rect
ors,
Sup
ervi
sors
, Sen
ior M
anag
emen
t Mem
bers
and
Em
ploy
ees
I. D
irect
ors,
sup
ervi
sors
and
sen
ior m
anag
emen
t mem
bers
(I) G
ener
al in
form
atio
n
Uni
t: sh
are
Nam
eTi
tleG
ende
rD
ate
of
birth
Beg
inni
ng
date
of t
he
term
End
ing
date
of t
he
term
Num
ber
of s
hare
s he
ld a
t the
be
ginn
ing
of th
e ye
ar
Num
ber
of s
hare
s he
ld a
t the
en
d of
the
year
Cha
nge
in
incr
ease
or
decr
ease
in
sha
res
durin
g th
e ye
ar
Rea
sons
for
chan
ge
Tota
l re
mun
erat
ion
from
the
Com
pany
du
ring
the
repo
rting
pe
riod
(bef
ore
tax)
(R
MB
’0,0
00)
Whe
ther
re
ceiv
ed
rem
uner
atio
n fro
m re
late
d pa
rty
Gao
Jia
npin
gC
hairm
an o
f th
e B
oard
of
Dire
ctor
sM
ale
July
195
9S
epte
mbe
r 11
, 200
0D
ecem
ber
18, 2
019
00
0-
105.
352
No
Che
n Yi
chao
Dire
ctor
Mal
eN
ovem
ber
1950
July
1,
2015
Dec
embe
r 18
, 201
90
00
-Ye
s
Fu A
npin
gD
irect
orM
ale
Febr
uary
19
63Ju
ne 2
0,
2016
Dec
embe
r 18
, 201
90
00
-Ye
s
Han
Jin
gwen
Dire
ctor
Mal
eJu
ne 1
959
Febr
uary
7,
201
7D
ecem
ber
18, 2
019
00
0-
Yes
Xi X
ingh
uaD
irect
orM
ale
Oct
ober
19
69Fe
brua
ry
7, 2
017
Dec
embe
r 18
, 201
90
00
-Ye
s
Lin
Teng
jiao
Dire
ctor
Mal
eA
pril
1968
July
17,
20
17D
ecem
ber
18, 2
019
00
0-
Yes
Tao
Yipi
ngD
irect
orM
ale
Apr
il 19
63
June
20,
20
16D
ecem
ber
18, 2
019
00
0-
105.
352
No
Pre
side
ntA
pril
28,
2016
Dec
embe
r 18
, 201
9

2018 ANNUAL REPORT
105
Nam
eTi
tleG
ende
rD
ate
of
birth
Beg
inni
ng
date
of t
he
term
End
ing
date
of t
he
term
Num
ber
of s
hare
s he
ld a
t the
be
ginn
ing
of th
e ye
ar
Num
ber
of s
hare
s he
ld a
t the
en
d of
the
year
Cha
nge
in
incr
ease
or
decr
ease
in
sha
res
durin
g th
e ye
ar
Rea
sons
for
chan
ge
Tota
l re
mun
erat
ion
from
the
Com
pany
du
ring
the
repo
rting
pe
riod
(bef
ore
tax)
(R
MB
’0,0
00)
Whe
ther
re
ceiv
ed
rem
uner
atio
n fro
m re
late
d pa
rty
Che
n Jin
guan
gD
irect
orM
ale
Nov
embe
r 19
61
June
20,
20
16D
ecem
ber
18, 2
019
00
0-
94.8
16N
oVi
ce
pres
iden
tFe
brua
ry
4, 2
013
Dec
embe
r 18
, 201
9
Che
n X
injia
n
Dire
ctor
Mal
eO
ctob
er
1967
June
20,
20
16D
ecem
ber
18, 2
019
116,
800
116,
800
0-
94.8
16N
oVi
ce
pres
iden
tJu
ly 1
0,
2014
Dec
embe
r 18
, 201
9
Sec
reta
ry o
f th
e B
oard
of
Dire
ctor
s
Nov
embe
r 26
, 201
5D
ecem
ber
18, 2
019
Pau
l M. T
heil
Inde
pend
ent
dire
ctor
Mal
eM
ay 1
953
Dec
embe
r 24
, 201
3D
ecem
ber
18, 2
019
00
0-
30Ye
s
Zhu
Qin
gIn
depe
nden
t di
rect
orM
ale
May
195
7A
ugus
t 26,
20
14D
ecem
ber
18, 2
019
00
0-
30N
o
Liu
Shi
ping
Inde
pend
ent
dire
ctor
Mal
eA
pril
1962
Aug
ust 2
6,
2014
Dec
embe
r 18
, 201
90
00
-30
Yes
Su
Xiji
aIn
depe
nden
t di
rect
orM
ale
Sep
tem
ber
1954
Febr
uary
7,
201
7D
ecem
ber
18, 2
019
00
0-
30N
o
Lin
Hua
Inde
pend
ent
dire
ctor
Mal
eS
epte
mbe
r 19
75Ju
ly 1
, 20
15D
ecem
ber
18, 2
019
00
0-
27.6
2Ye
s
Jian
g Yu
nmin
gC
hairm
an o
f th
e B
oard
of
Sup
ervi
sors
Mal
eO
ctob
er
1965
Febr
uary
29
, 201
6D
ecem
ber
18, 2
019
00
0-
105.
352
No
Yuan
Jun
Sup
ervi
sor
Mal
eA
pril
1984
May
25,
20
18D
ecem
ber
18, 2
019
00
0-
Yes
He
Xud
ong
Sup
ervi
sor
Mal
eN
ovem
ber
1977
Dec
embe
r 19
, 201
6D
ecem
ber
18, 2
019
00
0-
Yes

INDUSTRIAL BANK
106
Nam
eTi
tleG
ende
rD
ate
of
birth
Beg
inni
ng
date
of t
he
term
End
ing
date
of t
he
term
Num
ber
of s
hare
s he
ld a
t the
be
ginn
ing
of th
e ye
ar
Num
ber
of s
hare
s he
ld a
t the
en
d of
the
year
Cha
nge
in
incr
ease
or
decr
ease
in
sha
res
durin
g th
e ye
ar
Rea
sons
for
chan
ge
Tota
l re
mun
erat
ion
from
the
Com
pany
du
ring
the
repo
rting
pe
riod
(bef
ore
tax)
(R
MB
’0,0
00)
Whe
ther
re
ceiv
ed
rem
uner
atio
n fro
m re
late
d pa
rty
Zhan
g G
uom
ing
Sup
ervi
sor
Mal
eFe
brua
ry
1966
Aug
ust 2
4,
2018
Dec
embe
r 18
, 201
90
00
-39
.507
No
Lai F
uron
gS
uper
viso
rM
ale
Oct
ober
19
68O
ctob
er
19, 2
007
Dec
embe
r 18
, 201
90
00
-34
3.6
No
Li R
uosh
anE
xter
nal
supe
rvis
orM
ale
Febr
uary
19
49D
ecem
ber
19,2
016
Dec
embe
r 18
, 201
90
00
-24
No
Ben
She
nglin
Ext
erna
l su
perv
isor
Mal
eJa
nuar
y 19
66D
ecem
ber
19, 2
016
Dec
embe
r 18
, 201
90
00
-21
.33
No
Xia
Daw
eiE
xter
nal
supe
rvis
orM
ale
Febr
uary
19
53M
ay 2
3,
2016
Dec
embe
r 18
, 201
90
00
-24
No
Li W
eim
inVi
ce
pres
iden
tM
ale
Nov
embe
r 19
67D
ecem
ber
27, 2
012
Dec
embe
r 18
, 201
950
,000
50,0
000
-94
.816
No
Sun
Xio
ngpe
ngVi
ce
pres
iden
tM
ale
Apr
il 19
67A
ugus
t 25,
20
16D
ecem
ber
18, 2
019
00
0-
94.8
16N
o
Xue
Hef
eng
Dire
ctor
Mal
eM
arch
19
69
June
20,
20
16O
ctob
er
26, 2
018
20,0
0020
,000
0-
94.8
16N
oVi
ce
pres
iden
tD
ecem
ber
27, 2
012
Oct
ober
26
, 201
8
Xu
Chi
yun
Sup
ervi
sor
Fem
ale
Aug
ust
1968
Oct
ober
15
, 201
3A
pril
23,
2018
00
0-
No
Pen
g Ji
ngua
ngS
uper
viso
rM
ale
Aug
ust
1962
Dec
embe
r 19
, 201
6A
pril1
6,
2018
06,
000
6,00
0In
crea
se in
sh
areh
oldi
ngYe
s
Li J
ian
Sup
ervi
sor
Mal
eS
epte
mbe
r 19
56O
ctob
er
15, 2
013
Aug
ust 2
4,
2018
35,5
0035
,500
0-
399.
8N
o

2018 ANNUAL REPORT
107
Note: 1. The remuneration for some of the directors, supervisors and senior management members who served full-time positions in the Company is currently under examination of the authorized department. Should there be any changes, the Company will make an announcement. During the reporting period, the total actual remuneration paid for all directors, supervisors and senior management members amounted to RMB17,899,930.2. The decision-making procedures and criteria for determination of remuneration for directors, supervisors and senior management members were as follows: the remuneration for directors, supervisors and senior management members were ratified and paid in accordance with Regulations of Industrial Bank on Independent Directors’ Allowance, Regulations of Industrial Bank on External Directors’ Allowance, and relevant policies of Fujian Province on remuneration reform for persons in charge of provincial financial institutions. The specific criteria were as follows: directors and supervisors who held full-time positions in the Company should receive remuneration for the positions they held; shareholding directors and supervisors who did not hold full-time positions in the Company should receive remuneration from the companies they served. The allowance for independent directors and external supervisors was composed of basic allowance, committee allowance and work subsidy, which would disburse in accordance with the provisions stated in Regulations of Industrial Bank on Independent Directors’ Allowance and Regulations of Industrial Bank on External Supervisors’ Allowance respectively. As for senior management members, the remuneration plan should be prepared by the compensation and assessment committee under the Board of Directors and then submitted to the Board of Directors for approval.3. The 2017 Annual Report of the Company has disclosed the annual remuneration of directors, supervisors and senior management members. Upon assessment and the confirmation by the authorized department, the remuneration of the directors, supervisors and senior management members who served full-time positions in the Company for 2017 is hereby further disclosed as follows:
Name TitleThe remainder of 2017 pre-tax
remuneration (RMB’0,000)
Gao Jianping Chairman of the Board of Directors 5.096
Tao Yiping Director and president 5.096
Chen Jinguang Director and vice president 4.586
Chen Xinjian Director, vice president, and secretary of the Board of Directors 4.586
Jiang Yunming Chairman of the Board of Supervisors 5.096
Li Weimin Vice president 4.586
Sun Xiongpeng Vice president 4.586
Xue Hefeng Director and vice president 4.586
4. None of directors, supervisors, senior management personnel of the Company received any punishment from the securities regulatory commission in recent three years.

INDUSTRIAL BANK
108
(II) Positions held by directors and supervisors in the shareholder companies
Name Shareholder company Title
Fu Anping PICC Life Insurance Company Limited Secretary of the Party committee, vice chairman, president
Han Jingwen China National Tobacco CorporationInspector of the Division of Financial Management and Supervision (Audit Division)
Xi Xinghua Tianan Property Insurance Co., Ltd. General manager of Assets Management Department
Lin Tengjiao Yango Holdings Co., Ltd. Chairman of the Board
Yuan Jun Longyan Huijin Development Group Co., Ltd. Executive deputy general manager
He Xudong Zhejiang Energy Group Co., Ltd. Deputy director of the Assets Operation Department
(III) An outline of working experience of directors, supervisors and senior management members, and their appointments or concurrent appointments in organizations other than the Company or shareholder companies
Name Working experience outlineAppointments or concurrent appointments in organizations other than the Company or shareholder companies
Gao Jianping
Bachelor degree, senior economist. He previously served as deputy general manager of the General Office of Industrial Bank, director of the Industrial Bank’s Office in Fuzhou Economic and Technological Development Zone, general manager of the General Office of Industrial Bank, head of Industrial Bank’s Shanghai Branch preparatory team, president of Industrial Bank’s Shanghai Branch, president assistant of Industrial Bank, vice president of Industrial Bank and president of Industrial Bank, secretary of communist party committee, chairman and president of Industrial Bank, and currently as member of the National Committee of CPPCC, secretary of Communist Party Committee and chairman of Industrial Bank.
M e m b e r o f t h e 1 3 t h N a t i o n a l Committee of the Chinese People’s Political Consultative Conference
Chen Yichao
Master degree, senior economist. He previously served as deputy leader of scientific research institution of Finance Bureau of Fujian Province, deputy county mayor of Changting County (temporary post), director of the information center, director of the Integrated Service Department, executive deputy director of the General Office (minister level) of Finance Bureau of Fujian Province. Currently, he has retired.
None
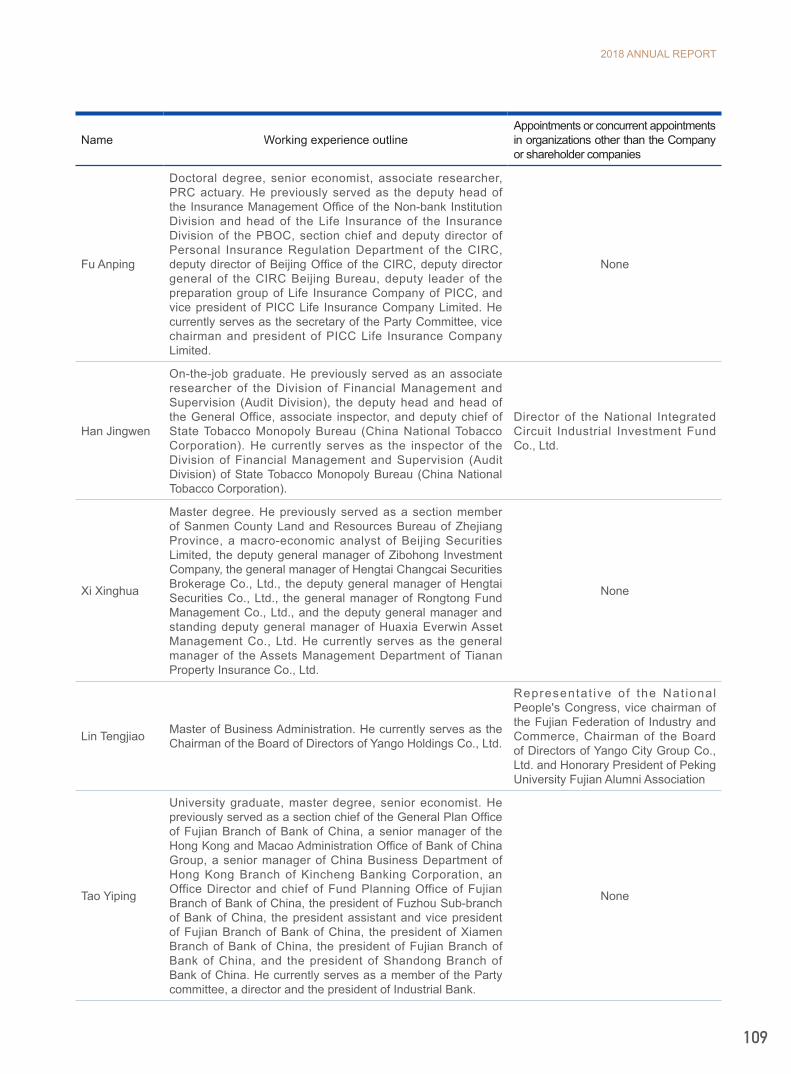
2018 ANNUAL REPORT
109
Name Working experience outlineAppointments or concurrent appointments in organizations other than the Company or shareholder companies
Fu Anping
Doctoral degree, senior economist, associate researcher, PRC actuary. He previously served as the deputy head of the Insurance Management Office of the Non-bank Institution Division and head of the Life Insurance of the Insurance Division of the PBOC, section chief and deputy director of Personal Insurance Regulation Department of the CIRC, deputy director of Beijing Office of the CIRC, deputy director general of the CIRC Beijing Bureau, deputy leader of the preparation group of Life Insurance Company of PICC, and vice president of PICC Life Insurance Company Limited. He currently serves as the secretary of the Party Committee, vice chairman and president of PICC Life Insurance Company Limited.
None
Han Jingwen
On-the-job graduate. He previously served as an associate researcher of the Division of Financial Management and Supervision (Audit Division), the deputy head and head of the General Office, associate inspector, and deputy chief of State Tobacco Monopoly Bureau (China National Tobacco Corporation). He currently serves as the inspector of the Division of Financial Management and Supervision (Audit Division) of State Tobacco Monopoly Bureau (China National Tobacco Corporation).
Director of the National Integrated Circuit Industrial Investment Fund Co., Ltd.
Xi Xinghua
Master degree. He previously served as a section member of Sanmen County Land and Resources Bureau of Zhejiang Province, a macro-economic analyst of Beijing Securities Limited, the deputy general manager of Zibohong Investment Company, the general manager of Hengtai Changcai Securities Brokerage Co., Ltd., the deputy general manager of Hengtai Securities Co., Ltd., the general manager of Rongtong Fund Management Co., Ltd., and the deputy general manager and standing deputy general manager of Huaxia Everwin Asset Management Co., Ltd. He currently serves as the general manager of the Assets Management Department of Tianan Property Insurance Co., Ltd.
None
Lin Tengjiao Master of Business Administration. He currently serves as the Chairman of the Board of Directors of Yango Holdings Co., Ltd.
Representat ive of the Nat ional People's Congress, vice chairman of the Fujian Federation of Industry and Commerce, Chairman of the Board of Directors of Yango City Group Co., Ltd. and Honorary President of Peking University Fujian Alumni Association
Tao Yiping
University graduate, master degree, senior economist. He previously served as a section chief of the General Plan Office of Fujian Branch of Bank of China, a senior manager of the Hong Kong and Macao Administration Office of Bank of China Group, a senior manager of China Business Department of Hong Kong Branch of Kincheng Banking Corporation, an Office Director and chief of Fund Planning Office of Fujian Branch of Bank of China, the president of Fuzhou Sub-branch of Bank of China, the president assistant and vice president of Fujian Branch of Bank of China, the president of Xiamen Branch of Bank of China, the president of Fujian Branch of Bank of China, and the president of Shandong Branch of Bank of China. He currently serves as a member of the Party committee, a director and the president of Industrial Bank.
None
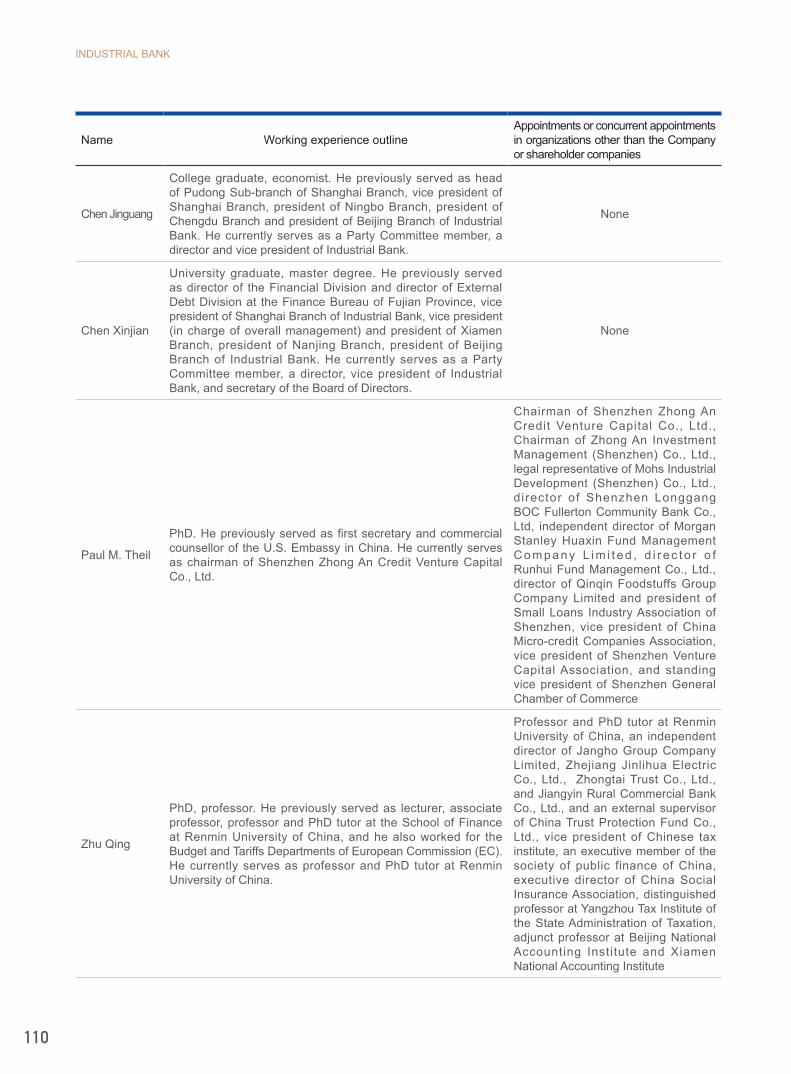
INDUSTRIAL BANK
110
Name Working experience outlineAppointments or concurrent appointments in organizations other than the Company or shareholder companies
Chen Jinguang
College graduate, economist. He previously served as head of Pudong Sub-branch of Shanghai Branch, vice president of Shanghai Branch, president of Ningbo Branch, president of Chengdu Branch and president of Beijing Branch of Industrial Bank. He currently serves as a Party Committee member, a director and vice president of Industrial Bank.
None
Chen Xinjian
University graduate, master degree. He previously served as director of the Financial Division and director of External Debt Division at the Finance Bureau of Fujian Province, vice president of Shanghai Branch of Industrial Bank, vice president (in charge of overall management) and president of Xiamen Branch, president of Nanjing Branch, president of Beijing Branch of Industrial Bank. He currently serves as a Party Committee member, a director, vice president of Industrial Bank, and secretary of the Board of Directors.
None
Paul M. Theil
PhD. He previously served as first secretary and commercial counsellor of the U.S. Embassy in China. He currently serves as chairman of Shenzhen Zhong An Credit Venture Capital Co., Ltd.
Chairman of Shenzhen Zhong An Credit Venture Capital Co., Ltd., Chairman of Zhong An Investment Management (Shenzhen) Co., Ltd., legal representative of Mohs Industrial Development (Shenzhen) Co., Ltd., director of Shenzhen Longgang BOC Fullerton Community Bank Co., Ltd, independent director of Morgan Stanley Huaxin Fund Management C o m p a n y L i m i t e d , d i r e c t o r o f Runhui Fund Management Co., Ltd., director of Qinqin Foodstuffs Group Company Limited and president of Small Loans Industry Association of Shenzhen, vice president of China Micro-credit Companies Association, vice president of Shenzhen Venture Capital Association, and standing vice president of Shenzhen General Chamber of Commerce
Zhu Qing
PhD, professor. He previously served as lecturer, associate professor, professor and PhD tutor at the School of Finance at Renmin University of China, and he also worked for the Budget and Tariffs Departments of European Commission (EC). He currently serves as professor and PhD tutor at Renmin University of China.
Professor and PhD tutor at Renmin University of China, an independent director of Jangho Group Company Limited, Zhejiang Jinlihua Electric Co., Ltd., Zhongtai Trust Co., Ltd., and Jiangyin Rural Commercial Bank Co., Ltd., and an external supervisor of China Trust Protection Fund Co., Ltd., vice president of Chinese tax institute, an executive member of the society of public finance of China, executive director of China Social Insurance Association, distinguished professor at Yangzhou Tax Institute of the State Administration of Taxation, adjunct professor at Beijing National Accounting Institute and Xiamen National Accounting Institute

2018 ANNUAL REPORT
111
Name Working experience outlineAppointments or concurrent appointments in organizations other than the Company or shareholder companies
Liu Shiping
PhD. He previously served as leader of the data mining consulting team (global financial industry) of the service division of IBM and chief adviser of Business Intelligence, providing business intelligent consulting services to over 200 financial institutions including central banks, Shanghai Stock Exchange and China Development Bank. He currently serves as president of the Global Business Intelligence Consulting (Beijing) Co., Ltd.
C h a i r m a n o f G l o b a l B u s i n e s s Intel l igence Consult ing (Beij ing) C o . , L t d . , p r o f e s s o r a n d P h D tutor at the University of Chinese Academy of Sc iences (UCAS), Associate of the Research Center of Finance Sciences and Technology of UCAS, part-t ime professor of Tongji University, chair professor of Fuzhou University, member of China Accounting Informationization Committee, vice chairman of XBRL China Executive Committee, member of Expert Advisory Committee of China Association of Technology Entrepreneurs, member of Information Technology Committee of China Association of Public Companies, member o f Independent Board Committee of China Association of Public Companies, independent director of Zhejiang Tailong Bank, independent director of Aixin Life, expert of Social Credit Legislation Exper t Group o f F inanc ia l and Economic Committee of Shanghai Mun ic ipa l Peop le ' s Cong ress , consultant of Science and Technology Advisory Group of Chengdu People's Government, senior consultant of Chongqing Qianjiang District People's Government, specially-invited expert of the Working Committee of Silk Road Internat ional Cooperat ion Working Committee, vice president of Guangdong Financial Innovation Research Association
Su Xijia
PhD, professor, Canadian nationality. He previously served as a lecturer at the Accounting Department of Shanghai University of Finance and Economics and an associate professor at the Accounting Department of College of Business, City University of Hong Kong. He currently serves as a professor at the Accounting Department of China Europe International Business School.
P r o f e s s o r a t t h e A c c o u n t i n g D e p a r t m e n t o f C h i n a E u r o p e International Business School, an independent director of China Jinmao Group, Opple Lighting Co., Ltd. and Fujian Sanmu Group Co., Ltd.
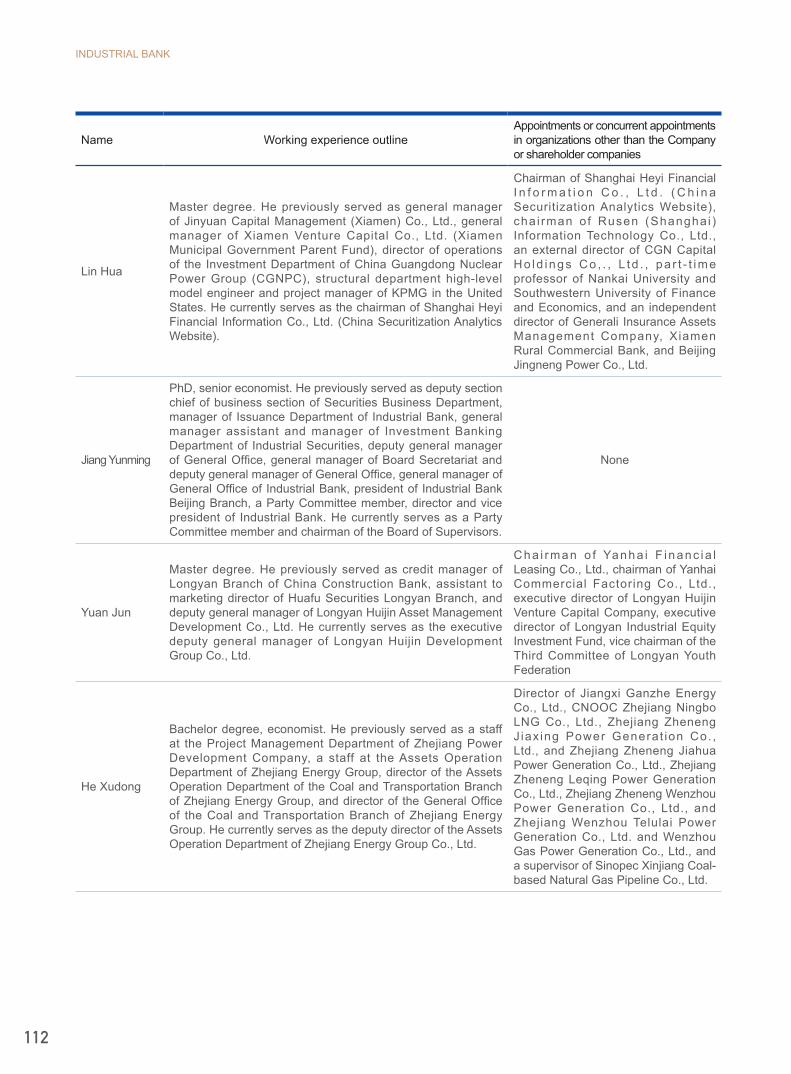
INDUSTRIAL BANK
112
Name Working experience outlineAppointments or concurrent appointments in organizations other than the Company or shareholder companies
Lin Hua
Master degree. He previously served as general manager of Jinyuan Capital Management (Xiamen) Co., Ltd., general manager of Xiamen Venture Capital Co., Ltd. (Xiamen Municipal Government Parent Fund), director of operations of the Investment Department of China Guangdong Nuclear Power Group (CGNPC), structural department high-level model engineer and project manager of KPMG in the United States. He currently serves as the chairman of Shanghai Heyi Financial Information Co., Ltd. (China Securitization Analytics Website).
Chairman of Shanghai Heyi Financial I n f o r m a t i o n C o . , L t d . ( C h i n a Securitization Analytics Website), cha i rman of Rusen (Shanghai ) Information Technology Co., Ltd., an external director of CGN Capital Ho ld ings Co , . , L td . , pa r t - t ime professor of Nankai University and Southwestern University of Finance and Economics, and an independent director of Generali Insurance Assets Management Company, Xiamen Rural Commercial Bank, and Beijing Jingneng Power Co., Ltd.
Jiang Yunming
PhD, senior economist. He previously served as deputy section chief of business section of Securities Business Department, manager of Issuance Department of Industrial Bank, general manager assistant and manager of Investment Banking Department of Industrial Securities, deputy general manager of General Office, general manager of Board Secretariat and deputy general manager of General Office, general manager of General Office of Industrial Bank, president of Industrial Bank Beijing Branch, a Party Committee member, director and vice president of Industrial Bank. He currently serves as a Party Committee member and chairman of the Board of Supervisors.
None
Yuan Jun
Master degree. He previously served as credit manager of Longyan Branch of China Construction Bank, assistant to marketing director of Huafu Securities Longyan Branch, and deputy general manager of Longyan Huijin Asset Management Development Co., Ltd. He currently serves as the executive deputy general manager of Longyan Huijin Development Group Co., Ltd.
Cha i rman o f Yanha i F inanc ia l Leasing Co., Ltd., chairman of Yanhai Commercial Factoring Co., Ltd., executive director of Longyan Huijin Venture Capital Company, executive director of Longyan Industrial Equity Investment Fund, vice chairman of the Third Committee of Longyan Youth Federation
He Xudong
Bachelor degree, economist. He previously served as a staff at the Project Management Department of Zhejiang Power Development Company, a staff at the Assets Operation Department of Zhejiang Energy Group, director of the Assets Operation Department of the Coal and Transportation Branch of Zhejiang Energy Group, and director of the General Office of the Coal and Transportation Branch of Zhejiang Energy Group. He currently serves as the deputy director of the Assets Operation Department of Zhejiang Energy Group Co., Ltd.
Director of Jiangxi Ganzhe Energy Co., Ltd., CNOOC Zhejiang Ningbo LNG Co., Ltd., Zhejiang Zheneng J iax ing Power Generat ion Co. , Ltd., and Zhejiang Zheneng Jiahua Power Generation Co., Ltd., Zhejiang Zheneng Leqing Power Generation Co., Ltd., Zhejiang Zheneng Wenzhou Power Generation Co., Ltd., and Zhejiang Wenzhou Telulai Power Generation Co., Ltd. and Wenzhou Gas Power Generation Co., Ltd., and a supervisor of Sinopec Xinjiang Coal-based Natural Gas Pipeline Co., Ltd.

2018 ANNUAL REPORT
113
Name Working experience outlineAppointments or concurrent appointments in organizations other than the Company or shareholder companies
Zhang Guoming
Bachelor degree. He previously served as deputy director (director level) of the Cadre Management Office of the Fujian Provincial Commission for Discipline Inspection, full-time deputy secretary of the Party Committee of the Fujian Provincial Commission for Discipline Inspection, and deputy director (deputy chief level) of the Inspection Office of the Fujian Provincial Party Committee. He currently serves as a member of the Party Committee, secretary of the Disciplinary Committee, and supervisor of the Industrial Bank.
None
Lai Furong
Bachelor degree, senior accountant. He previously served as vice head and head of Jin’an Sub-branch, Fuzhou Branch of Industrial Bank, deputy general manager of Finance & Accounting Department of Industrial Bank, vice president of Guangzhou Branch of Industrial Bank, vice general manager of Planning & Finance Department of Industrial Bank and general manager of Audit Department of Industrial Bank. He currently serves as a supervisor and general manager of Planning & Finance Department of Industrial Bank.
None
Li Ruoshan
PhD, professor, non-practicing certified accountant. He previously served as deputy dean of the Accounting Department and vice president of the School of Economics, Xiamen University, dean of the Accounting Department and the Finance Department, and vice president of the School of Management of Fudan University. He currently serves as MPACC academic dean, professor, PhD tutor at the School of Management of Fudan University.
MPACC academic dean, professor and PhD tutor of the School of Management at Fudan University, independent director of China Eastern Airlines, SAIC Motor Corporation L im i ted and Zhang j i ang H igh -technology Company
Ben Shenglin
PhD, professor. He previously served as senior vice president of Algemene Bank Nederland, managing director of HSBC, president of JPMorgan Chase Bank (China) Company Limited, a member of the global leadership team of Global Corporate Bank. He currently serves as a professor, dean of the Academy of Internet Finance, dean of the International Business School (in preparation) of Zhejiang University.
Professor, dean of Academy of Internet Finance, and dean of the International Business School (in preparation) of Zhejiang University, joint director of International Monetary Institute, member of the International Committee of the All-China Federation of Industry and Commerce, member of the Expert Committee of the Party’s Extra-Party Intellectuals of the United Front Work Department, member of the Standing Committee of the People's PCC and deputy director of the Economic Committee of Zhejiang Province, a counsellor of Zhejiang Provincial People’s Government, co-chairman of Zhejiang Association of Internet Finance, advisory member of Financial Experts Advisory Committee for Guangdong and executive editor of China Finance, an independent director of Bank of Ningbo Co., Ltd., Wuchan Zhongda Group Co., Ltd., and Tsingtao Brewery Co., Ltd., and an independent non-executive director of China International Capital Corporation Limited
INDUSTRIAL BANK
114
Name Working experience outlineAppointments or concurrent appointments in organizations other than the Company or shareholder companies
Xia Dawei
Master degree, professor, PhD tutor. He previous served as the dean of School of International Business Administration, president assistant and vice president of Shanghai University of Finance and Economics, and president of Shanghai National Accounting Institute. He currently serves as the director of academic committee of Shanghai National Accounting Institute.
Director of academic committee of Shanghai National Accounting Institute, vice chairman of Chinese Industrial Economic Association, vice chairman of China Association of Chief Financial Officers, chairman of Shanghai Accounting Society, consu l tan t p ro fess iona l o f the Committee for Accounting Standards of the Ministry of Finance, honorary professor of The Chinese University of Hong Kong, part-time professor of School of Management of Fudan Un ivers i ty ; en joys government al lowance of the State Counci l ; independent directors of Baoshan I ron & S tee l Co . , L td . , Guo ta i Jun’an Securities Co., Ltd., Lianhua Supermarkets Holdings Co., Ltd. and Juneyao Airlines Co., Ltd.
Li Weimin
University graduate, master degree, senior economist. He previously served as deputy manager and then manager of Operation Department of Fuzhou Branch, president assistant and manager of General Office of Fuzhou Branch, vice president of Fuzhou Branch, vice president of Nanjing Branch, president of Zhangzhou Branch, president of Zhengzhou Branch, and president of Fuzhou Branch of Industrial Bank. He currently serves as a Party Committee member and vice president of Industrial Bank.
None
Sun Xiongpeng
University graduate, master degree, senior economist. He previously served as deputy manager of the International Business Department, and manager of Business Department and Domestic Business Department of Quanzhou Branch of Industrial Bank, president assistant and vice president of Quanzhou Branch of Industrial Bank, president of Zhangzhou Branch of Industrial Bank, president of Quanzhou Branch of Industrial Bank, president of Xiamen Branch of Industrial Bank, and president of Fuzhou Branch of Industrial Bank. He currently serves as a Party Committee member and vice president of Industrial Bank.
None
2018 ANNUAL REPORT
115
(IV) Changes of directors, supervisors and senior management members during the reporting period
1. On April 16, 2018, Mr. Peng Jinguang tendered his resignation in writing to the Board of Supervisors and resigned from the position of supervisor.
2. On April 23, 2018, Ms. Xu Chiyun tendered her resignation in writing to the Board of Supervisors and resigned from the position of supervisor.
3. On May 25, 2018, at the annual general meeting of the Company for 2017, Mr. Yuan Jun was elected as a supervisor of the 7th session of the Board of Supervisors.
4. On August 24, 2018, Mr. Li Jian, an employee representative supervisor, tendered a written resignation to the Company's Board of Supervisors and resigned from the position of employee representative supervisor.
5. On August 24, 2018, the Company's employee representative assembly elected Mr. Zhang Guoming as an employee representative supervisor of the Board of Supervisors of the Company.
6. On October 26, 2018, Mr. Xue Hefeng tendered his resignation in writing to the Board of Supervisors and resigned from the position of director and vice president.
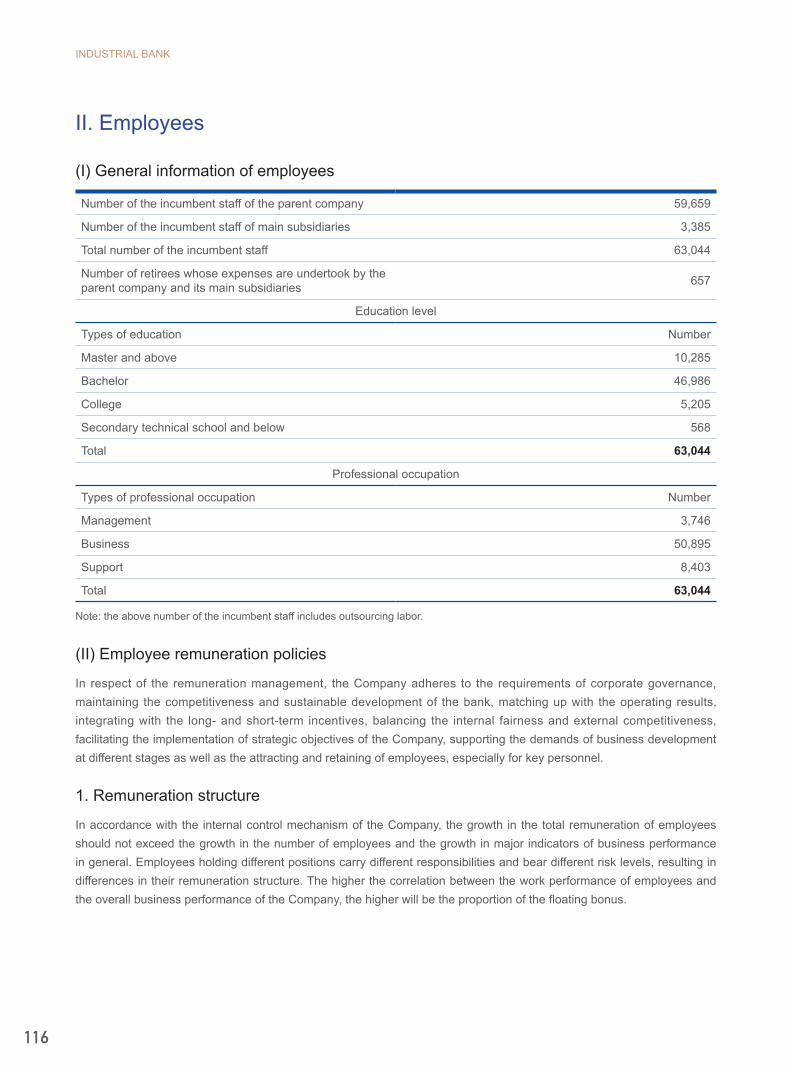
INDUSTRIAL BANK
116
II. Employees
(I) General information of employees
Number of the incumbent staff of the parent company 59,659
Number of the incumbent staff of main subsidiaries 3,385
Total number of the incumbent staff 63,044
Number of retirees whose expenses are undertook by the parent company and its main subsidiaries 657
Education level
Types of education Number
Master and above 10,285
Bachelor 46,986
College 5,205
Secondary technical school and below 568
Total 63,044
Professional occupation
Types of professional occupation Number
Management 3,746
Business 50,895
Support 8,403
Total 63,044
Note: the above number of the incumbent staff includes outsourcing labor.
(II) Employee remuneration policies
In respect of the remuneration management, the Company adheres to the requirements of corporate governance, maintaining the competitiveness and sustainable development of the bank, matching up with the operating results, integrating with the long- and short-term incentives, balancing the internal fairness and external competitiveness, facilitating the implementation of strategic objectives of the Company, supporting the demands of business development at different stages as well as the attracting and retaining of employees, especially for key personnel.
1. Remuneration structure
In accordance with the internal control mechanism of the Company, the growth in the total remuneration of employees should not exceed the growth in the number of employees and the growth in major indicators of business performance in general. Employees holding different positions carry different responsibilities and bear different risk levels, resulting in differences in their remuneration structure. The higher the correlation between the work performance of employees and the overall business performance of the Company, the higher will be the proportion of the floating bonus.

2018 ANNUAL REPORT
117
2. Remuneration policies
Performance bonus of employees is linked with the comprehensive performance of the Company, the institutions (departments) and individuals. In terms of the scope of assessment indicators, several key indicators are selected for performance assessment, including the rate of return on capital, rate of return on risk assets, non-performing loans ratio, compliance operations and evaluation on internal control. The indicators are applied to the institutions and employees, and the overall appraisal results will be linked to the bonus of employees to reflect the correlation between the remuneration and various types of risks. In order to improve the incentive and restraint mechanism, and ensure the remuneration policies are in line with the present and future risks, the payment of a certain proportion of the performance bonus to the senior management members, senior management cadres, and key business staff and employees holding key positions in the revenue-producing institutions shall be deferred and retained as risk fund. If there is a breach of regulations or discipline or extraordinary risk exposure in carrying out duties during the appraisal period, a corresponding amount shall be deducted from the risk fund of the staff held liable, so as to ensure the remuneration level of employees is consistent with their risk-adjusted performance.
3. Detailed information about remuneration of employees in positions having significant impacts on the risks of the bank
The allocation of remuneration is based on the fundamental idea of “allocation based on the value of job positions and contributions”, among which the value of job positions includes technological and managerial difficulties, risk levels and contributions to the banking system. The remuneration of employees matches with the value of their job positions and their job responsibilities. For those engaged in the risk management and compliance fields, their remuneration depends on individual capability, performance of duties, and appraisals on the team and individual basis, but has no direct relationship with the performance of other business areas, which can ensure that the remuneration of staff in the risk management and compliance fields is independent from the performance of the business lines under their supervision, and such segregation can promote the steady operations and sustainable development of the Company.
(III) Staff training schemes
The Company built a talent training system that was in line with the group-based, integrated and international strategic development, focusing on talent development for key positions. It actively innovated, optimized and upgraded various brand training programs that were closely related to strategy, business and employees’ personal growth, so as to enhance the organizational performance and employees’ professional competence. It also steadily promoted the construction of platforms for basic operation of training, talent development, knowledge sharing and problem solving, so as to accelerate strategic and cultural communication. During the reporting period, the Company won the "Best Learning Program of China Talent Development Elite Awards", "Top 100 Excellent Enterprises of China Enterprise Education”, " Innovation Achievement Gold Award of China Enterprise Training", “Best Practice Award for Performance Improvement" and other honors.
INDUSTRIAL BANK
118
Corporate Governance
I. Corporate governance overviewThe Company continued to strengthen the construction of corporate governance system and give play to the core role of the Party Committee in corporate governance, while constructing and clarifying the objectives and direction of the Board of Directors and the Board of Supervisors. The Company continued to solidify the governing concept of sustainable development, forming a modern corporate governance mechanism where all governance entities perform their respective duties and responsibilities to achieve coordinated operations and effective checks and balances. During the reporting period, The Company steadily promoted the amendment to the Articles of Association and relevant governing systems and the general meeting operated in a standard way according to the laws. The Board of Directors and the Board of Supervisors fully performed their functions in making strategic decisions and supervision. The special committees actively performed their duties of assisting in decision making and supervising. The directors and supervisors continuously enhanced their capability and professionalism in fulfilling their duties through specific investigations and inspections. The management earnestly carried out the spirit of meetings of the Board of Directors and the Board of Supervisors and effectively implemented the decision opinions of the Board of Directors and the supervision recommendations of the Board of Supervisors. The businesses of the Company witnessed the sustainable and steady development of the Company, and the interests of all shareholders and stakeholders were effectively safeguarded.
(I) Shareholders and general meetings
During the reporting period, the Company convened an annual general meeting through a combination of on-site meetings and online voting to consider and approve 21 proposals such as the report of the Board of Directors, the report of the Board of Supervisors, the financial budgets and final accounts, the distribution scheme of profit and the issuance of preference shares. The Company convened general meetings in accordance with the relevant laws and regulations, the Articles of Association of the Company, and the provisions on the rules of procedures for general meetings and standardized the implementation of discussing and voting procedures of general meetings and safeguarded the lawful rights of shareholders. Meanwhile, the Company improved its communication channels with shareholders by heeding their opinions and suggestions actively, so as to ensure that the shareholders’ right to know, the participation right and voting right for the major events in the Company could be exercised in accordance with the laws and regulations.
(II) Directors and the Board of Directors
At the end of the reporting period, the Board of Directors of the Company consists of 14 directors. By categories, it includes 10 non-executive directors (including five independent non-executive directors) and four executive directors. By geographical segments, there are 11 domestic directors and three overseas directors. There are five committees under the Board of Directors, namely, the strategy committee, the risk management & consumer protection committee, the audit & related party transaction control committee, the nomination committee and the remuneration & evaluation committee. With the exception of the strategy committee, the other four committees are chaired by the independent directors. Within the scope of responsibility stipulated by the Articles of Association, these committees gave full play to their professional strengths, carefully reviewed and discussed an array of important items and related issues, provided advice and suggestions as well as reference for decision making for the Board of Directors, improving the operating efficiency of the Board of Directors. Independent directors performed their duties diligently, focusing on the interests of the Company and all shareholders, especially minority shareholders, and issuing independent and objective opinions and suggestions on major issues. During the reporting period, six meetings of the Board of Directors were convened, 22 meetings were convened by various committees of the Board of Directors, at which 197 issues were considered or received. The Board

2018 ANNUAL REPORT
119
of Directors effectively played its role of decision-making in development of corporate strategies, study of business plans and enhancement of capital management and the group-oriented operation.
(III) Supervisors and the Board of Supervisors
During the reporting period, the Board of Supervisors has eight supervisors, including two shareholder representatives, three employee representatives and three external supervisors. Under the Board of Supervisors, two special committees were established, namely the supervision committee and the nomination, remuneration & evaluation committee. Both of the committees are headed by external supervisors. The Board of Supervisors, which placed the interests of shareholders and the Company as the top priority, fulfilled its supervision duties and was actively engaged in the project-based research and studies and the auditing investigation, overseeing the Company’s financial activities, risk management, internal control and the duty-fulfillment of the Board of Directors and the senior management. During the reporting period, the Company held five meetings of the Board of Supervisors and four meetings of the special committees of the Board of Supervisors to consider or hear 41 issues.
(IV) Senior management
During the reporting period, the five senior management members of the Company consist of one president and four vice presidents. With the authorization by laws and regulations, the Articles of Association and the Board of Directors, the president takes responsibilities of guiding the overall operation and management activities, specifically implementing the resolutions approved by the general meetings and the Board of Directors, and formulating the annual business plans and investment plans, financial budgets and final financial statements, profit distribution plans, basic management rules and specific regulations.
Several committees were established under the senior management, namely the business operation management committee, the assets & liabilities management committee, the risk management committee, the investment decision committee, the credit approval committee, the internal control committee, the major purchases committee, the business continuity management committee, the internal accountability committee, the financial science and technology committee, and the green finance business committee.
(V) Related party transactions
During the reporting period, the Company enhanced the management of related party transactions. In light of regulatory provisions of the Ministry of Finance, CBIRC, CSRC and Shanghai Stock Exchange, in couple with the Articles of Association, the general meetings, the Board of Directors, the senior management and the relevant departments of the head office and various branches, strictly conducted reviews, examinations, approvals and management of related party transactions as well as the supervision and management of approved quotas based on their respective functions, together with timely disclosure of information concerning the related party transactions, and the Board of Supervisors made supervision in compliance with the law. Related party transactions between the Company and related parties strictly abode by the principles of “fairness, openness and valuable consideration”, with fair and reasonable transaction terms and conditions which should not be more favorable than those of similar transactions conducted with non-related parties, and such fair transaction pricing could safeguard the interests of the Company and shareholders as a whole and encourage the development of the related businesses of the Company in a regulated and sustainable manner.
(VI) Information Disclosure and Investor Relations
The Company has been continuously strengthening the information disclosure system and fulfilling its obligation of information disclosure. The Company strictly complies with relevant regulatory requirements and prepares and discloses periodical reports on a periodic basis to disclose major issues fairly and timely. The Company issued more than 40 temporary announcements and governance documents on resolutions of the meeting, non-public offering progress,

INDUSTRIAL BANK
120
profit distribution, connected transaction, changes in registered capital, establishment of branches, and capital increase of subsidiaries. The Company also strengthened the internal management of information disclosure affairs, revised the “Administrative Measures for Shares (and its Changes thereof) Held by the Directors, Supervisors and Senior Management”, organized employees to protect the confidentiality of inside information and register insiders, and regularly conducted self-examination of insider trading. The Company continued to carry out various forms of investor relations activities. To enhance the adequacy, professionalism and effectiveness of investor communicate, the Company further designed to the market through comprehensively ways such as result recommendation, presidential closed meetings, securities brokers' meetings, institutional discussions, special research, and investor visits fully utilizing such means as the Shanghai Stock Exchange's "E interactive" platform and e-mail. The Company put emphasis on the interaction with and the information of the capital market and regularly prepared information reports such as the weekly and monthly reports on the capital market. The Company also paid close attention to media reports and market hot issues, and responded to and answered investors' concerns promptly.
II. Brief introduction of general meetings
Session of the meeting Date of convening Reference of appointed websites for disclosure of resolutions
Disclosure date of the publish of resolutions
2017 Annual General Meeting May 25, 2018The website of Shanghai Stock
Exchange (www.sse.com.cn) and the website of the Company(www.cib.com.cn)
May 26, 2018
III. The directors’ performance of their duties
(I) The attendance of directors in Board of Directors and shareholder’s meeting
During the reporting period, the Company convened six meetings of the Board of Directors, four of which were on-site meetings, and two was teleconference. The attendance records of directors in the Board of Directors meetings and general meetings are as follows:
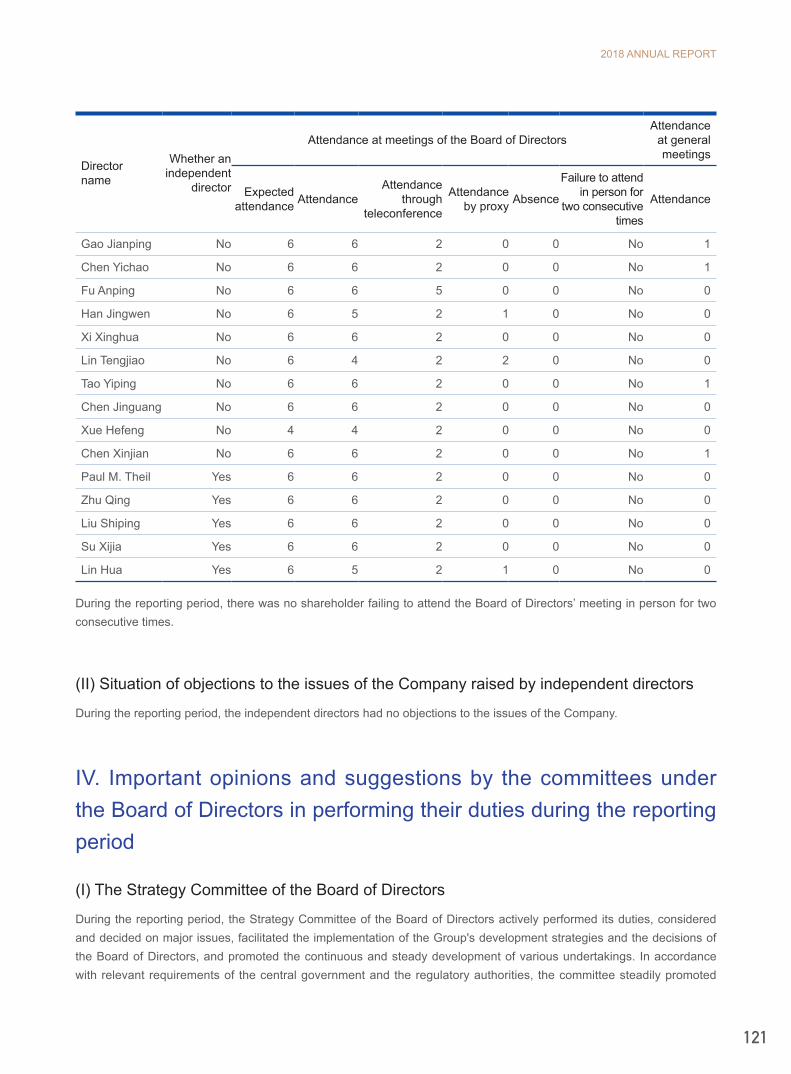
2018 ANNUAL REPORT
121
Directorname
Whether an independent
director
Attendance at meetings of the Board of DirectorsAttendance
at general meetings
Expected attendance Attendance
Attendance through
teleconference
Attendance by proxy Absence
Failure to attend in person for
two consecutive times
Attendance
Gao Jianping No 6 6 2 0 0 No 1
Chen Yichao No 6 6 2 0 0 No 1
Fu Anping No 6 6 5 0 0 No 0
Han Jingwen No 6 5 2 1 0 No 0
Xi Xinghua No 6 6 2 0 0 No 0
Lin Tengjiao No 6 4 2 2 0 No 0
Tao Yiping No 6 6 2 0 0 No 1
Chen Jinguang No 6 6 2 0 0 No 0
Xue Hefeng No 4 4 2 0 0 No 0
Chen Xinjian No 6 6 2 0 0 No 1
Paul M. Theil Yes 6 6 2 0 0 No 0
Zhu Qing Yes 6 6 2 0 0 No 0
Liu Shiping Yes 6 6 2 0 0 No 0
Su Xijia Yes 6 6 2 0 0 No 0
Lin Hua Yes 6 5 2 1 0 No 0
During the reporting period, there was no shareholder failing to attend the Board of Directors’ meeting in person for two consecutive times.
(II) Situation of objections to the issues of the Company raised by independent directors
During the reporting period, the independent directors had no objections to the issues of the Company.
IV. Important opinions and suggestions by the committees under the Board of Directors in performing their duties during the reporting period
(I) The Strategy Committee of the Board of Directors
During the reporting period, the Strategy Committee of the Board of Directors actively performed its duties, considered and decided on major issues, facilitated the implementation of the Group's development strategies and the decisions of the Board of Directors, and promoted the continuous and steady development of various undertakings. In accordance with relevant requirements of the central government and the regulatory authorities, the committee steadily promoted
INDUSTRIAL BANK
122
the revision of the Articles of Association and related systems, clarified the core role of the party committee in corporate governance, further defined the responsibilities of the “Shareholders’ general meeting, Board of Directors, Board of Supervisors, and the management” to build a solid corporate governance mechanism. Keeping abreast of the changes in the landscape, it guided the management to make progress while maintaining stability, accelerate transformation, continuously improve the ability to construct a three-type bank with commercial banking + investment banking as the main focus of business development, and promote the continuous optimization of the business structure, so as to achieve stable and growing operating results. It strengthened the analysis of the Company's operating conditions at various stages, accurately grasped the market tempo, and dynamically adjusted the business development strategy. With emphasis placed on legal compliance management, it took precautions to prevent risks for certain key businesses, promoted the disposal of risk assets in a coordinated manner, further enhanced the quality of assets, and improved the overall safety of operations. It strengthened the overall capital management by adhering to the combination of endogenous accumulation and external replenishment, effectively balancing external regulatory requirements and internal business development needs, actively promoting external capital replenishment, and continuously improving the performance appraisal mechanism with the economic added value and risk-adjusted return on capital as the core. It strengthened the transmission of internal intensive capital management to the operating organizations, and promoted the optimization of business structure and customer structure. Focusing on the total-bank strategy, it strengthened the management and control of the Group's financial statement consolidation, and guided the members of the Group to further develop the main businesses and excel at specialties centering on the “1234” strategic system. In addition, it devised and improved the naming standard and survival management of the group companies and strengthened and maintained the brand image of the Group to build an integrated financial service group in which all members advance together and coordinate positively, with balanced business and strong core competitiveness. In accordance with the overall strategic requirements of the Group, it centrally developed and optimized the development strategy of the organization and guided the planning of the layout of the organization's outlets, so as to effectively improve the overall efficiency of the branches.
(II) The Risk Management & Consumer Protection Committee of the Board of Directors
During the reporting period, the Risk Management & Consumer Protection Committee of the Board of Directors kept abreast of the changes in the external environment, carefully assessed the various risk exposure of the Company's operations, and thoroughly understood the Company's risk management and consumer rights protection, and regularly summarized and evaluated the various risk control measures, putting forward specific work opinions to promote the Company's stable and compliant operations. It implemented comprehensive risk management, strengthened risk management and control in key areas, and proposed to adhere to market-oriented and specialized operations to actively prevent major risks in the market and ensure long-term stable development. It proposed to pay attention to the process of interest rate liberalization, strengthen research and prediction of the trend of capital market, judicially devise liabilities structure and maturity allocation, explore and optimize the traditional pricing mechanism of credit contracts, and improve the overall management and control of interest rate risks. It proposed to implement various regulatory requirements, strengthen forward-looking research on anti-money laundering regulations, continuously improve the rules for anti-money laundering work, balance the relationship between anti-money laundering review and user experience, so as to continuously improve compliance management. It proposed to closely track the changes in the real estate industry, develop a business development strategy that meets the Company's needs, and adopt differentiated risk management measures. To scientifically research and predict the internal and external situation, it organized special discussions on macroeconomic situation and economic policies. Comprehensively considering the current and future trends in asset quality of the banking industry and the Company's actual situation, it suggested appropriately increasing the write-off of bad debts to further improve the quality of assets. It clarified the data governance requirements, recommended the development of data governance strategies and plans, unified data standards across the Group, and gradually streamlined and optimized business processes. Focusing on the off-site centralized outsourcing of information technology of the Bank, it proposed a series of suggestions for improving management of outsourcing risks and followed

2018 ANNUAL REPORT
123
up and supervised the implementation thereof, so as to refined and properly carry out the management and control of outsourcing risks. It promoted the improvement of consumer protection system and mechanism to improve the awareness of protecting consumers' rights and interests across the Bank and enhance the protection of consumers' rights and interests.
(III) The Audit & Related Party Transaction Control Committee of the Board of Directors
During the reporting period, the Audit & Related Party Transaction Control Committee of the Board of Directors diligently performed its duties and assisted the Board of Directors in continuously improving financial management, risk management, internal control and related party transactions management. It carefully evaluated and selected external audit institutions, successfully completed the re-engagement of accounting firm for 2018 and the tendering and selection of accounting firm for 2019, and guided the work handover between the former and the current accounting firms. It maintained close communication with the external auditor, supervised and guided the auditing and review of financial reports, emphasizing that financial auditing should be based on the basic principles of “stable, reasonable and comparable”, and conducted in-depth discussions on matters such as the implementation of new accounting standards. It reviewed the financial reports for each period and the annual budget and final accounts and comprehensively analyzed the Company's operating results, requiring that stable operations should be maintained. It guided the strengthening of internal audit and internal control, selected typical problems for tracking and rectification, and guided the full use of external regulatory inspections for identification to continuously improve internal control of compliance. Strict following the principles of openness, fairness, and transparency, it continuously strengthened the management of related party transactions, and carefully examined the amount of related party transactions granted to related parties including the People's Insurance Group Companies and China Tobacco Group Companies to ensure that major related transactions did not harm the interests of the Company and its shareholders, especially minority shareholders.
(IV) The Nomination Committee of the Board of Directors
During the reporting period, the Nomination Committee of the Board of Directors diligently fulfilled its duties granted by the Articles of Association, and revised the working rules of the committee in accordance with the latest regulatory requirements and the actual situation of the Company to further improve the appointment procedures of the chairman and the duties of the committee.
(V) The Remuneration & Evaluation Committee
During the reporting period, the remuneration and evaluation committee of the Board of Directors focused on the Company’s development strategies and annual business targets in order to conduct appraisal on the business performance of the senior management members in 2017 by following the performance appraisal criteria and the assessment procedures, formulated the 2017 Salary Distribution Plan for Senior Management Members and the 2014 Proposal on Evaluation and Disbursement Regarding Risk Fund for Senior Management Members, and giving advice on improvement of the remuneration system. Meanwhile, the committee made conclusion to the duty-fulfillment of each director for the previous year, and completed the duty-fulfillment evaluation report of the directors.
V. The description of risks discovered by the Board of SupervisorsDuring the reporting period, the Board of Supervisors made no objection to the issues under supervision during the reporting period.
INDUSTRIAL BANK
124
VI. The description of independence of the Company from its largest shareholderThe Finance Bureau of Fujian Province, which held 18.78% of the shares of the Company as at the end of the reporting period, is the largest shareholder of the Company. The Company is fully independent from its largest shareholder in all aspects including assets, personnel, finance, institutions and businesses. The major decisions of the Company are made and executed by the Company at its absolute discretion. The Company’s major shareholders have neither appropriated any capital of the Company nor requested that the Company act as a guarantor for a third party.
VII. The examination and evaluation mechanism, and the establishment and implementation of the incentive system for senior management members during the reporting periodThe senior management members of the Company were subject to the examination and assessment by the Board of Directors. By optimizing the remuneration structures for the senior management members, setting scientific and reasonable evaluation indicators and creating an evaluation mechanism linking their remuneration with responsibilities, risks and operating results, the Board of Directors of the Company provided incentives and constraints for senior management members, so as to ensure consistency between the direction of their efforts and the interests of the Company.
VIII. Assessment report on internal controlThe Company’s Board of Directors has issued a self-assessment report on internal control. Please refer to the website of Shanghai Stock Exchange for details. During the reporting period, no material deficiencies were identified in the internal control mechanisms or systems of the Company in terms of completeness and reasonableness.
IX. Description of the internal control audit reportThe Company has disclosed the internal control audit report. The Company engaged Deloitte Touche Tohmatsu Certified Public Accountants LLP in auditing the effectiveness of its internal control with regard to the Company’s financial reporting, which considered that the Company had maintained effective internal control regarding financial reporting in all material aspects in accordance with the Basic Internal Control Norms for Enterprises as well as the relevant provisions as at December 31, 2018.
2018 ANNUAL REPORT
125
Financial Statements
The Company’s financial statements 2018 have been audited by Deloitte Touche Tohmatsu Certified Public Accountants LLP and signed by certified public accountants Hu Xiaojun and Zhang Hua, who have issued a standard and unqualified auditors’ report. For full text of the financial statements, please refer to the appendix.
Documents Available for Inspection
I. Financial statements bearing the signatures and seals of the Company’s legal representative, president and financial department director.
II. Original auditors’ report bearing the seal of the accounting firm and personally signed and sealed by certified public accountants.
III. All the original documents and announcements publicized by the Company during the reporting period.
Chairman: Gao Jianping
Board of Directors of Industrial Bank Co., Ltd.
April 29, 2019
INDUSTRIAL BANK
126
Auditors' Report .......................................................................................................127
The Consolidated and Bank’s Balance Sheets .......................................................133
The Consolidated and Bank’s Income Statements ..................................................135
The Consolidated and Bank’s Cash Flow Statements ............................................137
The Consolidated Statement of Changes in Equity .................................................139
The Bank’s Statement of Changes in Equity ...........................................................141
Notes to the Financial Statements...........................................................................143
CONTENTS
Appendix: Auditors' Report and Financial Statements

2018 ANNUAL REPORT
127
AUDITORS' REPORT
De Shi Bao (Shen) Zi (19) No. P02695
To the Shareholders of Industrial Bank Co., Ltd.
I. OpinionWe have audited the financial statements of Industrial Bank Co., Ltd. (the "Bank"), which comprise the consolidated and bank’s balance sheets as at 31 December 2018, and the consolidated and bank’s income statements, the consolidated and bank’s cash flow statements, the consolidated and bank’s statement of changes in equity for the year then ended, and notes to the financial statements.
In our opinion, the financial statements of the Bank present fairly, in all material respects, the Bank's financial position as at 31 December 2018, and the results of its operations and cash flows for the year then ended in accordance with Accounting Standards for Business Enterprises.
II. Basis for the OpinionWe conducted our audit in accordance with China Standard on Auditing. Our responsibilities under those standards are further described in the Auditors' Responsibilities for the Audit of the Financial Statements section of our report. We are independent of the Bank in accordance with the China Code of Ethics for Certified Public Accountants, and we have fulfilled our other ethical responsibilities in accordance with the code. We believe that the audit evidence we have obtained is sufficient and appropriate to provide a basis for our audit opinion.
III. Key Audit MattersKey audit matters are those matters that, in our professional judgment, were of most significance in the audit of the financial statements of the current period. These matters were addressed in the context of the audit of the financial statements as a whole, and in forming our opinion thereon, and we do not provide a separate opinion on these matters. We have determined the following matters as the key audit matters that need to be communicated in our report:
INDUSTRIAL BANK
128
1. Provision for impairment of loans and advances to customers and investments classified as receivables
Description of the matter:At 31 December 2018, as stated in Note VIII, 7 to the financial statements, the loans and advances to customers comprise of loans and advances to enterprises and individuals, totalling RMB2,934,082 million, with an impairment provision of RMB95,637 million; as stated in Note VIII, 10, the investments classified as receivables totals RMB1,404,953 million, with an impairment provision of RMB17,803 million.
The major accounting policies and significant accounting estimates and judgements used to determine the provision for impairment of loans and advances to customers and investments classified as receivables are set out in Note IV, 8 and Note V, 1 to the financial statements.
The determination of the recoverability of loans and advances to customers and investments classified as receivables requires significant judgements on the factors which mainly include the financial position of the borrower and guarantor, risks associated with collaterals and specific transaction.
In view of the significance of the total amount of loans and advances to customers and investments classified as receivables to the financial statements and the fact that the provision for impairment of loans and advances to customers and investments classified as receivables involves significant management judgement and estimate, we identified the provision for impairment of loans and advances to customers and investments classified as receivables as a key audit matter.
Audit response:Our procedures on provision for impairment of loans and advances to customers and investments classified as receivables include:
(1) We understood and tested the operating effectiveness of the internal controls related to the impairment provision. These controls include both manual and automatic controls to identify the impairment of loans and advances to customers and investments classified as receivables in a timely manner, as well as the controls over impairment calculation model, including the data input and calculation of impairment provision.
(2) For loans and advances to customers and investments classified as receivables, we selected samples to perform credit review so as to assess whether an impairment has incurred and whether the Bank has identified such impairment in a proper and timely manner.
(3) For loans and advances to customers and investments classified as receivables that are assessed individually, we tested the management's forecast on future cash flows of the borrower, including the estimated recoverable amount from collaterals, and re-calculated the amount of impairment provision and compared it with the impairment provision assessed by the management, so as to assess whether a material misstatement exists.
(4) For loans and advances to customers and investments classified as receivables that are assessed collectively, we referred to industrial experience and market practices, and reviewed the applicability of the impairment model adopted by the management, and sampled and examined the historical data and the accuracy of the results of calculation.
2. Consolidation of structured entities
Description of the matter:As stated in Note VIII, 48 to the financial statements, the structured entities include the financial products, fund, asset-backed securities, trust investment programs and assets management programs etc. that are issued, managed and/or invested by the Bank.
The management determines whether the Bank is required to include the structured entities in the scope of the
2018 ANNUAL REPORT
129
consolidated financial statements by assessing the Bank's power to direct the decisions on structured entities, and the Bank's exposure to variable returns in the structured entities as well as its ability to use its power to affect such variable returns. The Bank determines whether it is acting as a principal or agent and whether the structured entities should be consolidated on the basis of the factors including scope of decision of the manager of the structured entities, the power of other parties, the rewards from rendering management service and the risk exposures of variable returns etc.
The major accounting policies and significant accounting estimates and judgements used to determine the whether to include the structured entities in the scope of consolidated financial statements or not are set out in Note IV, 5 and Note V, 7 to the financial statements.
In view of that the determination on whether the structured entities need to be included in the scope of the consolidated financial statements involves significant management judgement and has significant influence on the consolidated financial statements, we have identified the consolidation of structured entities as a key audit matter.
Audit response:Our procedures on consolidation of structured entities include:
(1) We understood and tested the operating effectiveness of the Bank's internal controls over determination on the consolidation scope of structured entities.
(2) We obtained the list of structured entities, and sampling checked related contracts, and assessed whether the Bank has control over the structured entities by performing the following audit procedures:
a. Analysed the contract terms and business structure, so as to understand the purpose of establishing the structured entities and the Bank's extent of involvement in the structured entities, and assessed the management judgement on whether the Bank has power over the structured entities;
b. Examined the terms in the structured entities' contracts that involve variable returns, including rate of management fee, expected rate of return etc., and checked them with relevant information used in management assessment; re-calculated the magnitude and variability of the Bank's variable returns in the structured entities based on the contract terms on variable returns.
c. Analysed the Bank's scope of decision, level of remuneration obtained for rendering management service to the structured entities, risk of variable returns for holding other interests in the structured entities and other parties' substantive rights, assessed whether the Bank is acting as a principal or agent in exercising the decision-making right, and compared the results of assessment with the results of management's assessment.
3. Derecognition of financial assets
Description of the matter:As stated in Note XII, 3.1 and Note XII, 3.3 to the financial statements, the Bank had various types of financial assets transfer transactions, including asset securitization and transfer of non-performing loan.
The management analyse the contractual rights and obligations agreed in the financial assets transfer transactions so as to assess whether the financial assets transfer transactions meet the criteria of transfer of financial assets in relevant accounting standards, and assess whether the Bank has transferred substantially all the risks and rewards of the ownership of the financial assets, determine whether the criteria of derecognition of financial assets are satisfied; under the circumstance that the Bank neither transferred nor retained substantially all the risks and rewards of the ownership, analyse whether the Bank has lost the control over the financial assets, so as to determine whether the criteria of derecognition are satisfied.
The major accounting policies and significant accounting estimates and judgements used to determine the derecognition of financial assets are set out in Note IV, 8 and Note V, 8 to the financial statements.
In view of the management's significant judgement on whether the transferred financial assets can be derecognized, and

INDUSTRIAL BANK
130
the significant amount of related financial assets, we have identified the derecognition of financial assets as a key audit matter.
Audit response:Our procedures on derecognition of financial assets include:
(1). We understood and tested the operating effectiveness of management's internal controls over transfer of financial assets, including the design of transaction structure and review and approval of the terms of contract, approval of the model, key parameters and assumptions adopted to test the transfer of risks and rewards of the ownership, as well as the review and approval of the result of assessment of accounting treatment.
(2). We obtained the list of transferred assets from the management, sampling checked the specific terms of financial assets transfer agreement and other related legal documents, so as to assess whether the Bank has transferred the right to receive the contractual cash flow of financial assets to another party, or whether the arrangement that the Bank receives the contractual cash flow and makes payment to another party satisfies the requirements of "pass-through test".
(3). Based on the industrial experience and practice, we performed sampling check and assessed the key assumptions and parameters used by the management in the risks and rewards transfer model, including future cash flow forecast and discount rate under multiple economic scenarios. Meanwhile, we tested the accuracy of the data calculation of the model.
(4) For financial assets that have been transferred and the Bank neither transferred nor retained substantially all the risks and rewards of the ownership, we sampling analysed the contractual terms, so as to assess whether the Bank has retained control over the transferred financial assets, and determine whether it has continuing involvement in the transferred financial assets.
IV. Other informationThe Bank's management is responsible for other information. The other information comprises the information included in the annual report, but does not include the financial statements and our auditors' report thereon.
Our opinion on the financial statements does not cover the other information, and we do not express any form of assurance conclusion thereon.
In connection with our audit of the financial statements, our responsibility is to read the other information and, in doing so, consider whether the other information is materially inconsistent with the financial statements or our knowledge obtained in the audit, or otherwise appears to be materially misstated.
If, based on the work we have performed, we conclude that there is a material misstatement of this other information, we are required to report that fact. we have nothing to report in this regard.

2018 ANNUAL REPORT
131
V. Responsibilities of the Management and Those Charged With Governance for the Financial StatementsThe Bank's management is responsible for the preparation and fair presentation of the financial statements in accordance with Accounting Standards for Business Enterprises, and designing, implementing and maintaining internal control that is necessary to enable the financial statements that are free from material misstatement, whether due to fraud or error.
In preparing the financial statements, management is responsible for assessing the Bank's ability to continue as a going concern, disclosing, as applicable, matters related to going concern and using the going concern basis of accounting unless management either intends to liquidate the Bank or to cease operations, or has no realistic alternative but to do so.
Those charged with governance are responsible for overseeing the Bank's financial statements process.
VI. Auditor's Responsibilities for the Audit of the Financial StatementsOur objectives are to obtain reasonable assurance about whether the financial statements as a whole are free from material misstatement, whether due to fraud or error, and to issue an auditors' report that includes our opinion. Reasonable assurance is a high level of assurance, but is not a guarantee that an audit conducted in accordance with China Standards on Auditing will always detect a material misstatement when it exists. Misstatements can arise from fraud or error and are considered material if, individually or in the aggregate, they could reasonably be expected to influence the economic decisions of users taken on the basis of these financial statements.
As part of an audit in accordance with China Standards on Auditing, we exercise professional judgment and maintain professional skepticism throughout the audit. We also:
(1) Identify and assess the risks of material misstatement of the financial statements, whether due to fraud or error, design and perform audit procedures responsive to those risks, and obtain audit evidence that is sufficient and appropriate to provide a basis for our opinion. The risk of not detecting a material misstatement resulting from fraud is higher than for one resulting from error, as fraud may involve collusion, forgery, intentional omissions, misrepresentations, or the override of internal control.
(2) Obtain an understanding of internal control relevant to the audit in order to design audit procedures that are appropriate in the circumstances.
(3) Evaluate the appropriateness of accounting policies used and the reasonableness of accounting estimates and related disclosures made by management.
(4) Conclude on the appropriateness of management's use of the going concern basis of accounting and, based on the audit evidence obtained, whether a material uncertainty exists related to events or conditions that may cast significant doubt on the Bank's ability to continue as a going concern. If we conclude that a material uncertainty exists, we are required to draw attention in our auditor's report to the related disclosures in the financial statements or, if such disclosures are inadequate, to express modified opinion. Our conclusions are based on the audit evidence obtained up to the date of our auditors' report. However, future events or conditions may cause the Bank to cease to continue as a going concern.
(5) Evaluate the overall presentation, structure and content of the financial statements, including the disclosures, and whether the financial statements represent the underlying transactions and events in a manner that achieves fair presentation

INDUSTRIAL BANK
132
(6) Obtain sufficient appropriate audit evidence regarding the financial information of the entities or business activities within the Bank to express an opinion on the financial statements. We are responsible for the direction, supervision and performance of the group audit. We remain solely responsible for our audit opinion.
We communicate with those charged with governance regarding, among other matters, the planned scope and timing of the audit and significant audit findings, including any significant deficiencies in internal control that we identify during our audit.
We also provide those charged with governance with a statement that we have complied with relevant ethical requirements regarding independence, and to communicate with them all relationships and other matters that may reasonably be thought to bear on our independence, and where applicable, related safeguards.
From the matters communicated with those charged with governance, we determine those matters that were of most significance in the audit of the financial statements of the current period and are therefore the key audit matters. We describe these matters in our auditor's report unless law or regulation precludes public disclosure about the matter or when, in extremely rare circumstances, we determine that a matter should not be communicated in our report because the adverse consequences of doing so would reasonably be expected to outweigh the public interest benefits of such communication.
Deloitte Touche Tohmatsu CPA LLP Chinese Certified Public Accountant
Shanghai, China (Engagement Partner)
Hu Xiaojun
Chinese Certified Public Accountant
Zhang Hua
29 April 2019
The auditors’ report and the accompanying financial statements are English translations of the Chinese auditors’ report and statutory financial statements prepared under accounting principles and practices generally accepted in the People’s Republic of China. These financial statements are not intended to present the financial position and results of operations in accordance with accounting principles and practices generally accepted in other countries and jurisdictions. In case the English version does not conform to the Chinese version, the Chinese version prevails.

2018 ANNUAL REPORT
133
THE CONSOLIDATED AND BANK’S BALANCE SHEETS
AT 31 DECEMBER 2018 UNIT: RMB IN MILLION
The Group The Bank
Note VIII 31/12/2018 31/12/2017 31/12/2018 31/12/2017
Assets
Cash and balances with Central Bank 1 475,781 466,403 475,775 466,392
Deposits with banks and other financial institutions 2 53,303 77,559 47,869 67,478
Precious metals 3,350 30,053 3,350 30,053
Placements with banks and other financial institutions 3 98,349 31,178 111,238 36,412
Financial assets at fair valuethrough profit or loss 4 459,598 362,072 413,015 337,965
Derivative financial assets 5 42,092 28,396 42,092 28,396
Financial assets purchased under resale agreements 6 77,083 93,119 73,795 89,464
Loans and advances to customers 7 2,838,445 2,348,831 2,822,075 2,341,397
Available-for-sale financial assets 8 647,102 504,221 665,685 516,016
Held-to-maturity investments 9 395,142 337,483 393,557 337,483
Investments classified as receivables 10 1,387,150 1,913,382 1,375,840 1,899,969
Finance lease receivables 11 104,253 103,495 - -
Long-term equity investments 12 3,224 3,008 17,979 16,964
Fixed assets 13 17,658 14,874 12,624 10,607
Construction in progress 14 7,872 7,124 7,852 7,122
Intangible assets 602 551 556 514
Goodwill 15 532 532 - -
Deferred tax assets 16 32,317 27,297 30,102 26,233
Other assets 17 67,804 67,264 56,028 42,102
Total assets 6,711,657 6,416,842 6,549,432 6,254,567
(Continued)
The accompanying notes form part of the financial statements.
The financial statements on pages 133 to 281 were signed by the following:
Gao Jianping
Chairman of the BoardLegal Representative
Tao Yiping
President Person in Charge of the
Accounting Body
Lai Furong
Financial Director
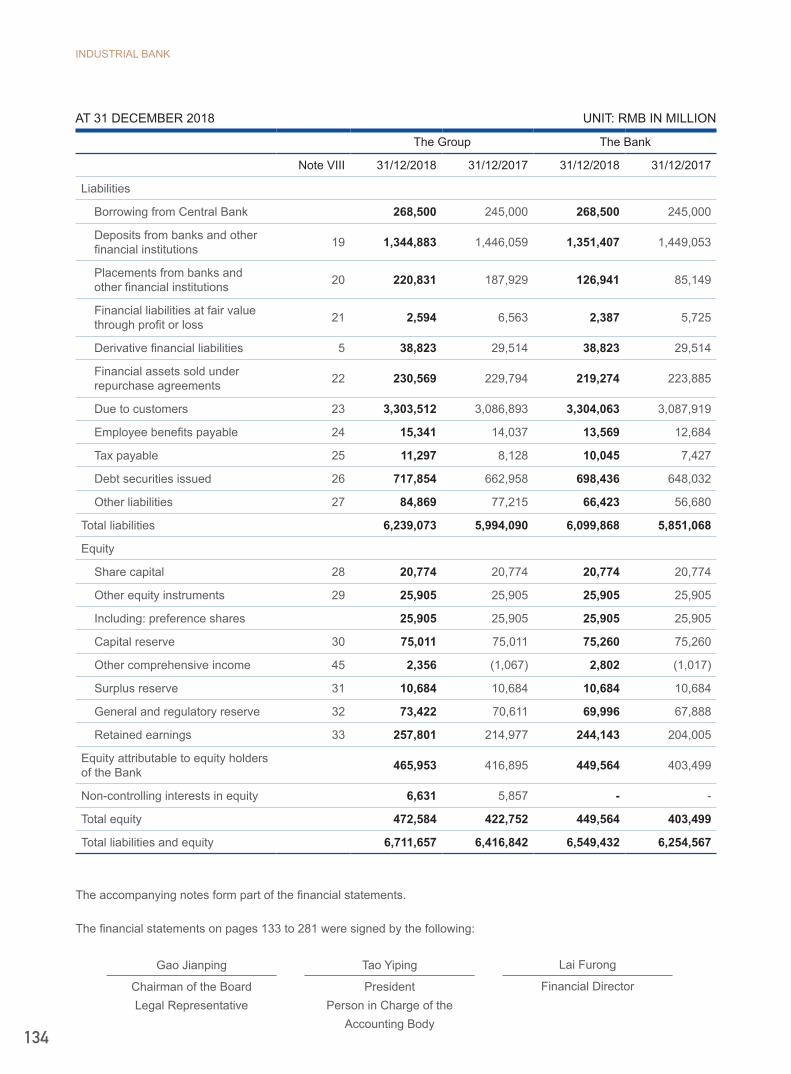
INDUSTRIAL BANK
134
AT 31 DECEMBER 2018 UNIT: RMB IN MILLION
The Group The Bank
Note VIII 31/12/2018 31/12/2017 31/12/2018 31/12/2017
Liabilities
Borrowing from Central Bank 268,500 245,000 268,500 245,000
Deposits from banks and otherfinancial institutions 19 1,344,883 1,446,059 1,351,407 1,449,053
Placements from banks and other financial institutions 20 220,831 187,929 126,941 85,149
Financial liabilities at fair valuethrough profit or loss 21 2,594 6,563 2,387 5,725
Derivative financial liabilities 5 38,823 29,514 38,823 29,514
Financial assets sold under repurchase agreements 22 230,569 229,794 219,274 223,885
Due to customers 23 3,303,512 3,086,893 3,304,063 3,087,919
Employee benefits payable 24 15,341 14,037 13,569 12,684
Tax payable 25 11,297 8,128 10,045 7,427
Debt securities issued 26 717,854 662,958 698,436 648,032
Other liabilities 27 84,869 77,215 66,423 56,680
Total liabilities 6,239,073 5,994,090 6,099,868 5,851,068
Equity
Share capital 28 20,774 20,774 20,774 20,774
Other equity instruments 29 25,905 25,905 25,905 25,905
Including: preference shares 25,905 25,905 25,905 25,905
Capital reserve 30 75,011 75,011 75,260 75,260
Other comprehensive income 45 2,356 (1,067) 2,802 (1,017)
Surplus reserve 31 10,684 10,684 10,684 10,684
General and regulatory reserve 32 73,422 70,611 69,996 67,888
Retained earnings 33 257,801 214,977 244,143 204,005
Equity attributable to equity holdersof the Bank 465,953 416,895 449,564 403,499
Non-controlling interests in equity 6,631 5,857 - -
Total equity 472,584 422,752 449,564 403,499
Total liabilities and equity 6,711,657 6,416,842 6,549,432 6,254,567
The accompanying notes form part of the financial statements.
The financial statements on pages 133 to 281 were signed by the following:
Gao Jianping
Chairman of the BoardLegal Representative
Tao Yiping
President Person in Charge of the
Accounting Body
Lai Furong
Financial Director
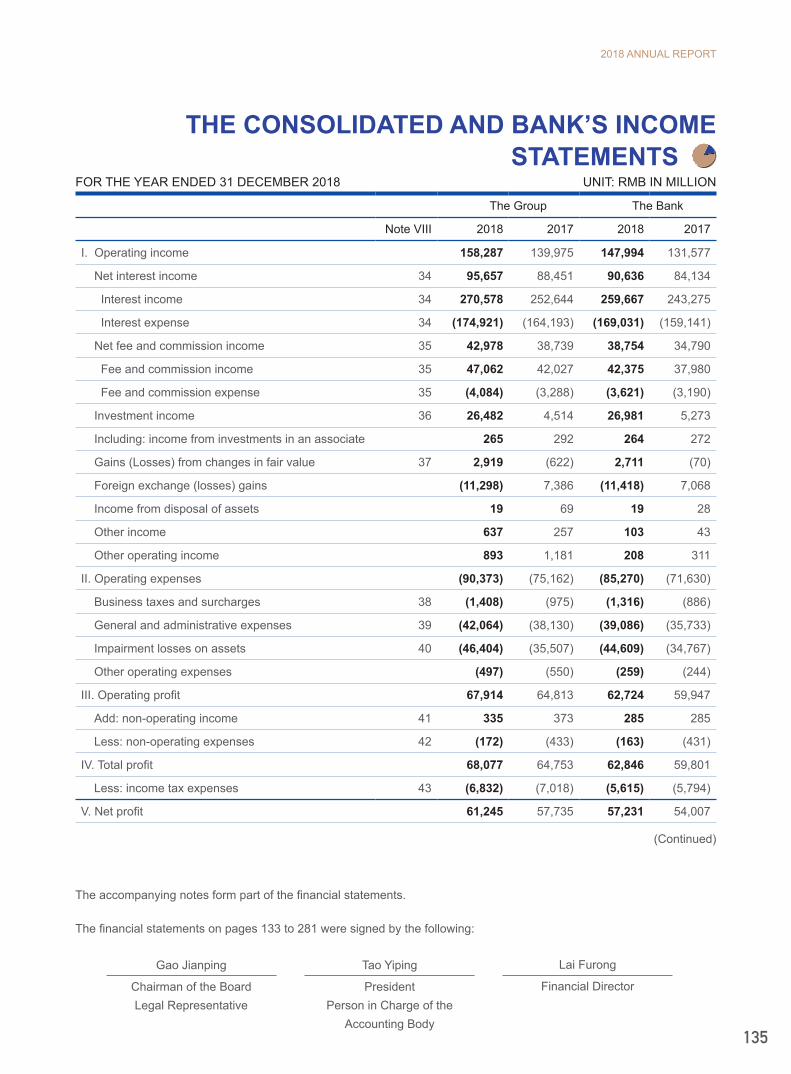
2018 ANNUAL REPORT
135
THE CONSOLIDATED AND BANK’S INCOME STATEMENTS
FOR THE YEAR ENDED 31 DECEMBER 2018 UNIT: RMB IN MILLION
The Group The Bank
Note VIII 2018 2017 2018 2017
I. Operating income 158,287 139,975 147,994 131,577
Net interest income 34 95,657 88,451 90,636 84,134
Interest income 34 270,578 252,644 259,667 243,275
Interest expense 34 (174,921) (164,193) (169,031) (159,141)
Net fee and commission income 35 42,978 38,739 38,754 34,790
Fee and commission income 35 47,062 42,027 42,375 37,980
Fee and commission expense 35 (4,084) (3,288) (3,621) (3,190)
Investment income 36 26,482 4,514 26,981 5,273
Including: income from investments in an associate 265 292 264 272
Gains (Losses) from changes in fair value 37 2,919 (622) 2,711 (70)
Foreign exchange (losses) gains (11,298) 7,386 (11,418) 7,068
Income from disposal of assets 19 69 19 28
Other income 637 257 103 43
Other operating income 893 1,181 208 311
II. Operating expenses (90,373) (75,162) (85,270) (71,630)
Business taxes and surcharges 38 (1,408) (975) (1,316) (886)
General and administrative expenses 39 (42,064) (38,130) (39,086) (35,733)
Impairment losses on assets 40 (46,404) (35,507) (44,609) (34,767)
Other operating expenses (497) (550) (259) (244)
III. Operating profit 67,914 64,813 62,724 59,947
Add: non-operating income 41 335 373 285 285
Less: non-operating expenses 42 (172) (433) (163) (431)
IV. Total profit 68,077 64,753 62,846 59,801
Less: income tax expenses 43 (6,832) (7,018) (5,615) (5,794)
V. Net profit 61,245 57,735 57,231 54,007
The accompanying notes form part of the financial statements.
The financial statements on pages 133 to 281 were signed by the following:
Gao Jianping
Chairman of the BoardLegal Representative
Tao Yiping
President Person in Charge of the
Accounting Body
Lai Furong
Financial Director
(Continued)

INDUSTRIAL BANK
136
The Group The Bank
Note VIII 2018 2017 2018 2017
1. Categorized by the nature of continuing operation:
(1) Net profit from continuing operations 61,245 57,735 57,231 54,007
(2) Net profit from discontinued operations - - - -
2. Categorized by ownership:
(1) Net profit attributable to equity holders of the Bank 60,620 57,200 57,231 54,007
(2) Non-controlling interests 625 535 - -
Ⅵ. Earnings per share
Basic earnings per share (RMB Yuan) 44 2.85 2.74 - -
Diluted earnings per share (RMB Yuan) 44 2.85 2.74 - -
Ⅶ. Other comprehensive income - net of tax 45 3,352 (2,167) 3,819 (2,122)
Other comprehensive income attributable to equity holders of the Bank 3,423 (2,152) 3,819 (2,122)
1. Items that may be reclassified subsequently to profit or loss:
(1) Gains or losses on changes in fair value of financial assets available-for-sale 3,587 (3,004) 4,007 (2,974)
(2) Translation differences of financial statements denominated in foreign currencies 24 - - -
2. Items that will not be reclassified subsequently to profit or loss:
Actuarial (losses) profits on defined benefit plans (188) 852 (188) 852
Other comprehensive income attributable to non-controlling interests (71) (15) - -
Ⅷ. Total comprehensive income 64,597 55,568 61,050 51,885
Total comprehensive income attributable to:
Equity holders of the Bank 64,043 55,048 61,050 51,885
Non-controlling interests 554 520 - -
The accompanying notes form part of the financial statements.
The financial statements on pages 133 to 281 were signed by the following:
Gao Jianping
Chairman of the BoardLegal Representative
Tao Yiping
President Person in Charge of the
Accounting Body
Lai Furong
Financial Director
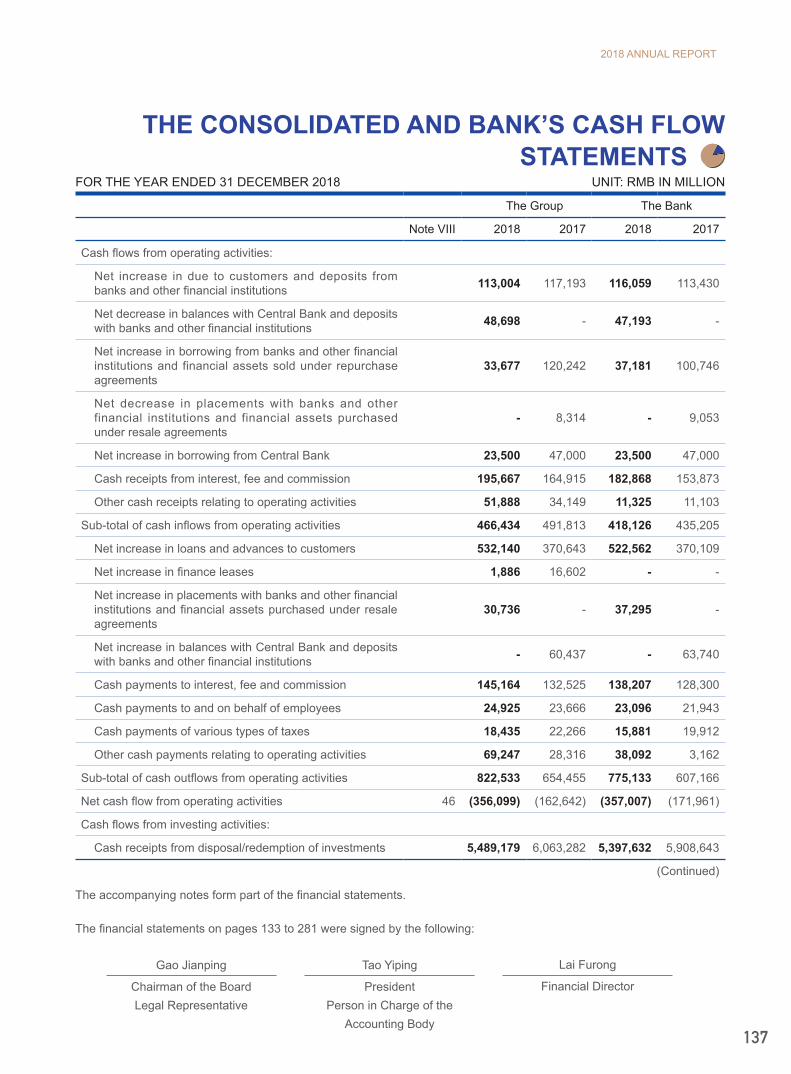
2018 ANNUAL REPORT
137
THE CONSOLIDATED AND BANK’S CASH FLOW STATEMENTS
FOR THE YEAR ENDED 31 DECEMBER 2018 UNIT: RMB IN MILLION
The Group The Bank
Note VIII 2018 2017 2018 2017
Cash flows from operating activities:
Net increase in due to customers and deposits from banks and other financial institutions 113,004 117,193 116,059 113,430
Net decrease in balances with Central Bank and deposits with banks and other financial institutions 48,698 - 47,193 -
Net increase in borrowing from banks and other financial institutions and financial assets sold under repurchase agreements
33,677 120,242 37,181 100,746
Net decrease in placements with banks and other financial institutions and financial assets purchased under resale agreements
- 8,314 - 9,053
Net increase in borrowing from Central Bank 23,500 47,000 23,500 47,000
Cash receipts from interest, fee and commission 195,667 164,915 182,868 153,873
Other cash receipts relating to operating activities 51,888 34,149 11,325 11,103
Sub-total of cash inflows from operating activities 466,434 491,813 418,126 435,205
Net increase in loans and advances to customers 532,140 370,643 522,562 370,109
Net increase in finance leases 1,886 16,602 - -
Net increase in placements with banks and other financial institutions and financial assets purchased under resale agreements
30,736 - 37,295 -
Net increase in balances with Central Bank and deposits with banks and other financial institutions - 60,437 - 63,740
Cash payments to interest, fee and commission 145,164 132,525 138,207 128,300
Cash payments to and on behalf of employees 24,925 23,666 23,096 21,943
Cash payments of various types of taxes 18,435 22,266 15,881 19,912
Other cash payments relating to operating activities 69,247 28,316 38,092 3,162
Sub-total of cash outflows from operating activities 822,533 654,455 775,133 607,166
Net cash flow from operating activities 46 (356,099) (162,642) (357,007) (171,961)
Cash flows from investing activities:
Cash receipts from disposal/redemption of investments 5,489,179 6,063,282 5,397,632 5,908,643
(Continued)
The accompanying notes form part of the financial statements.
The financial statements on pages 133 to 281 were signed by the following:
Gao Jianping
Chairman of the BoardLegal Representative
Tao Yiping
President Person in Charge of the
Accounting Body
Lai Furong
Financial Director
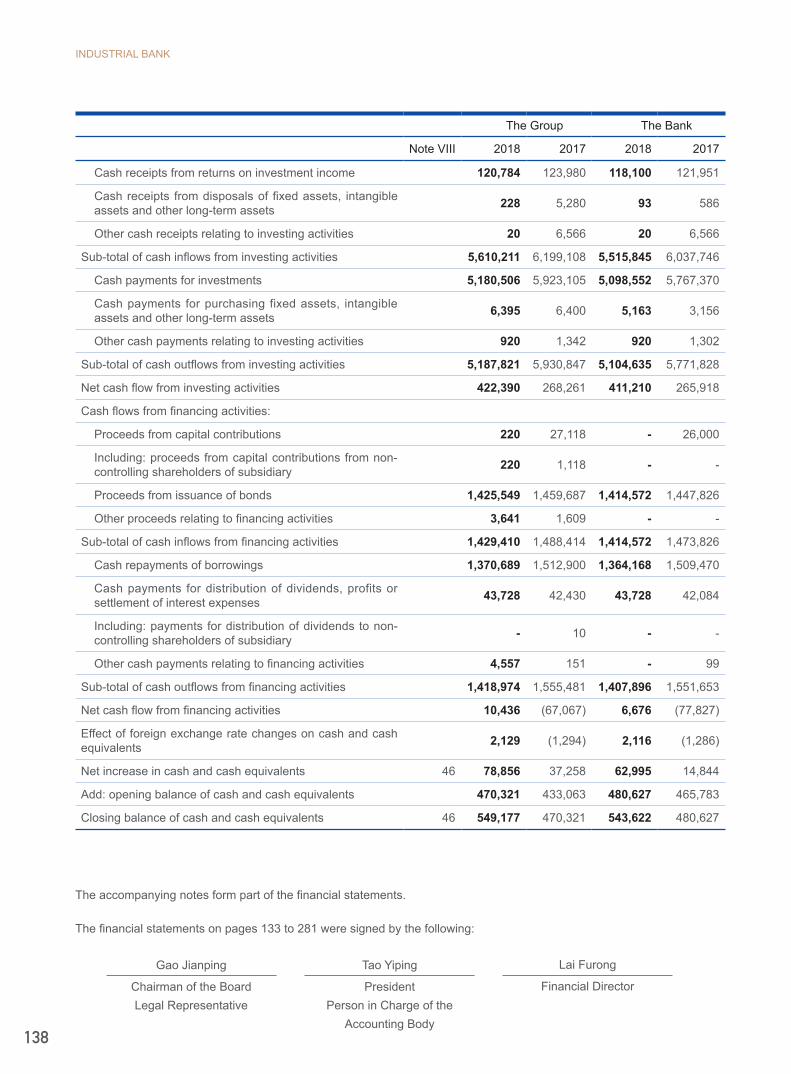
INDUSTRIAL BANK
138
The Group The Bank
Note VIII 2018 2017 2018 2017
Cash receipts from returns on investment income 120,784 123,980 118,100 121,951
Cash receipts from disposals of fixed assets, intangible assets and other long-term assets 228 5,280 93 586
Other cash receipts relating to investing activities 20 6,566 20 6,566
Sub-total of cash inflows from investing activities 5,610,211 6,199,108 5,515,845 6,037,746
Cash payments for investments 5,180,506 5,923,105 5,098,552 5,767,370
Cash payments for purchasing fixed assets, intangible assets and other long-term assets 6,395 6,400 5,163 3,156
Other cash payments relating to investing activities 920 1,342 920 1,302
Sub-total of cash outflows from investing activities 5,187,821 5,930,847 5,104,635 5,771,828
Net cash flow from investing activities 422,390 268,261 411,210 265,918
Cash flows from financing activities:
Proceeds from capital contributions 220 27,118 - 26,000
Including: proceeds from capital contributions from non-controlling shareholders of subsidiary 220 1,118 - -
Proceeds from issuance of bonds 1,425,549 1,459,687 1,414,572 1,447,826
Other proceeds relating to financing activities 3,641 1,609 - -
Sub-total of cash inflows from financing activities 1,429,410 1,488,414 1,414,572 1,473,826
Cash repayments of borrowings 1,370,689 1,512,900 1,364,168 1,509,470
Cash payments for distribution of dividends, profits or settlement of interest expenses 43,728 42,430 43,728 42,084
Including: payments for distribution of dividends to non-controlling shareholders of subsidiary - 10 - -
Other cash payments relating to financing activities 4,557 151 - 99
Sub-total of cash outflows from financing activities 1,418,974 1,555,481 1,407,896 1,551,653
Net cash flow from financing activities 10,436 (67,067) 6,676 (77,827)
Effect of foreign exchange rate changes on cash and cash equivalents 2,129 (1,294) 2,116 (1,286)
Net increase in cash and cash equivalents 46 78,856 37,258 62,995 14,844
Add: opening balance of cash and cash equivalents 470,321 433,063 480,627 465,783
Closing balance of cash and cash equivalents 46 549,177 470,321 543,622 480,627
The accompanying notes form part of the financial statements.
The financial statements on pages 133 to 281 were signed by the following:
Gao Jianping
Chairman of the BoardLegal Representative
Tao Yiping
President Person in Charge of the
Accounting Body
Lai Furong
Financial Director
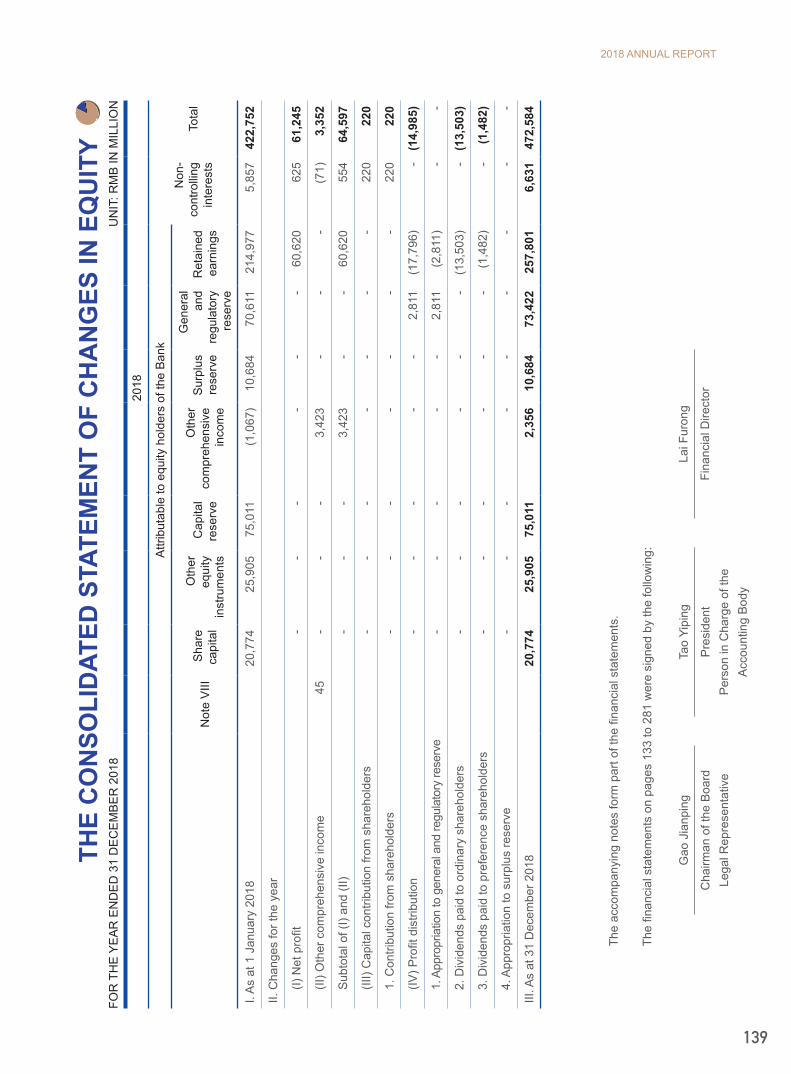
2018 ANNUAL REPORT
139
THE
CO
NSO
LID
ATED
STA
TEM
ENT
OF
CH
AN
GES
IN E
QU
ITY
FOR
TH
E Y
EA
R E
ND
ED
31
DE
CE
MB
ER
201
8
UN
IT: R
MB
IN M
ILLI
ON
2018
Attr
ibut
able
to e
quity
hol
ders
of t
he B
ank
Non
-co
ntro
lling
inte
rest
sTo
tal
Not
e V
IIIS
hare
ca
pita
l
Oth
er
equi
ty
inst
rum
ents
Cap
ital
rese
rve
Oth
erco
mpr
ehen
sive
in
com
e
Sur
plus
re
serv
e
Gen
eral
an
dre
gula
tory
re
serv
e
Ret
aine
d ea
rnin
gs
I. A
s at
1 J
anua
ry 2
018
20,7
7425
,905
75,0
11(1
,067
)10
,684
70,6
1121
4,97
75,
857
422,
752
II. C
hang
es fo
r the
yea
r
(I
) Net
pro
fit-
--
--
-60
,620
62
561
,245
(I
I) O
ther
com
preh
ensi
ve in
com
e 45
--
-3,
423
--
-(7
1)
3,35
2
S
ubto
tal o
f (I)
and
(II)
--
-3,
423
--
60,6
20
554
64,5
97
(I
II) C
apita
l con
tribu
tion
from
sha
reho
lder
s -
--
--
--
220
220
1
. Con
tribu
tion
from
sha
reho
lder
s-
--
--
--
220
220
(I
V) P
rofit
dis
tribu
tion
--
--
-2,
811
(17,
796)
-(1
4,98
5)
1. A
ppro
pria
tion
to g
ener
al a
nd re
gula
tory
rese
rve
--
--
-2,
811
(2,8
11)
--
2. D
ivid
ends
pai
d to
ord
inar
y sh
areh
olde
rs-
--
--
-(1
3,50
3)-
(13,
503)
3. D
ivid
ends
pai
d to
pre
fere
nce
shar
ehol
ders
-
--
--
-(1
,482
)-
(1,4
82)
4. A
ppro
pria
tion
to s
urpl
us re
serv
e-
--
--
--
--
III. A
s at
31
Dec
embe
r 201
820
,774
25,9
0575
,011
2,35
6 10
,684
73,4
2225
7,80
1 6,
631
472,
584
The
acco
mpa
nyin
g no
tes
form
par
t of t
he fi
nanc
ial s
tate
men
ts.
The
finan
cial
sta
tem
ents
on
page
s 13
3 to
281
wer
e si
gned
by
the
follo
win
g:
Gao
Jia
npin
g
Cha
irman
of t
he B
oard
Lega
l Rep
rese
ntat
ive
Tao
Yipi
ng
Pre
side
nt
Per
son
in C
harg
e of
the
Acc
ount
ing
Bod
y
Lai F
uron
g
Fina
ncia
l Dire
ctor
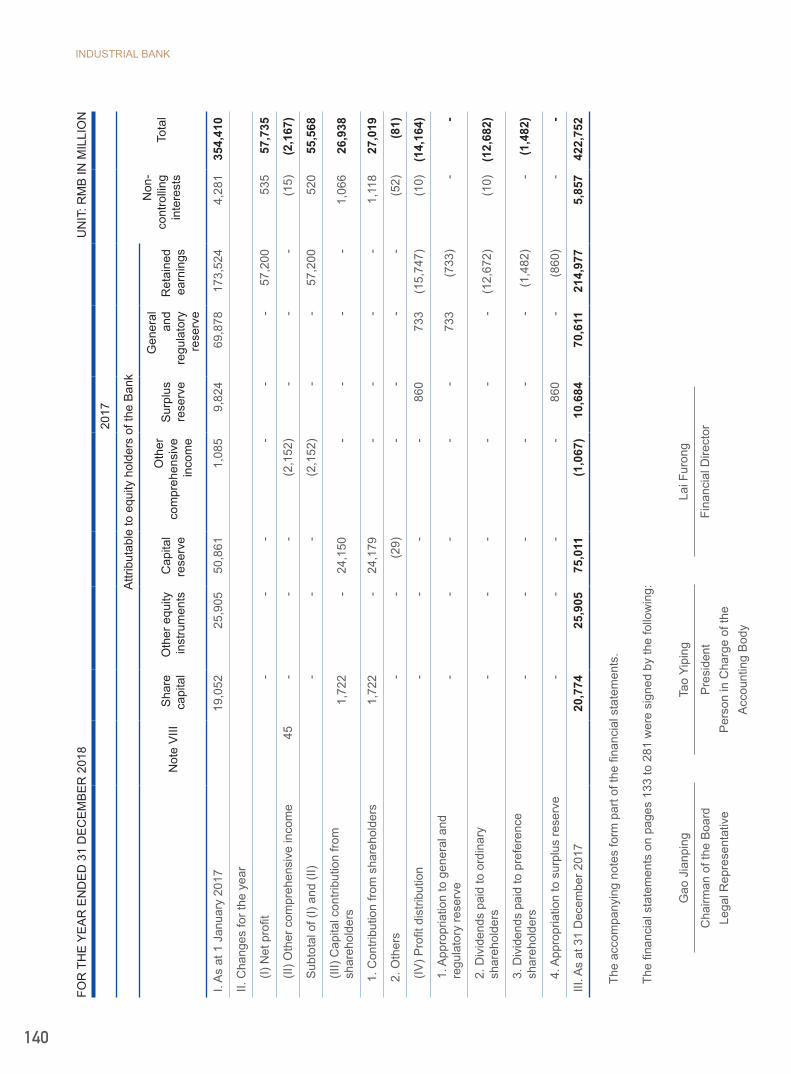
INDUSTRIAL BANK
140
FOR
TH
E Y
EA
R E
ND
ED
31
DE
CE
MB
ER
201
8
UN
IT: R
MB
IN M
ILLI
ON
2017
Attr
ibut
able
to e
quity
hol
ders
of t
he B
ank
Non
-co
ntro
lling
inte
rest
sTo
tal
Not
e V
IIIS
hare
ca
pita
lO
ther
equ
ity
inst
rum
ents
Cap
ital
rese
rve
Oth
erco
mpr
ehen
sive
in
com
e
Sur
plus
re
serv
e
Gen
eral
an
dre
gula
tory
re
serv
e
Ret
aine
d ea
rnin
gs
I. A
s at
1 J
anua
ry 2
017
19,0
52 2
5,90
550
,861
1,08
5 9
,824
69,8
7817
3,52
44,
281
354,
410
II. C
hang
es fo
r the
yea
r
(I
) Net
pro
fit-
--
--
-57
,200
535
57,7
35
(I
I) O
ther
com
preh
ensi
ve in
com
e
45-
--
(2,1
52)
--
-(1
5)(2
,167
)
S
ubto
tal o
f (I)
and
(II)
--
-(2
,152
)-
-57
,200
520
55,5
68
(I
II) C
apita
l con
tribu
tion
from
sha
reho
lder
s 1,
722
-24
,150
--
--
1,06
626
,938
1.
Con
tribu
tion
from
sha
reho
lder
s1,
722
-24
,179
--
--
1,11
827
,019
2.
Oth
ers
--
(29)
--
--
(52)
(81)
(I
V) P
rofit
dis
tribu
tion
--
--
860
733
(15,
747)
(10)
(14,
164)
1. A
ppro
pria
tion
to g
ener
al a
nd
regu
lato
ry re
serv
e -
--
--
733
(733
)-
-
2. D
ivid
ends
pai
d to
ord
inar
y sh
areh
olde
rs-
--
--
-(1
2,67
2)(1
0)(1
2,68
2)
3. D
ivid
ends
pai
d to
pre
fere
nce
shar
ehol
ders
-
--
--
-(1
,482
)-
(1,4
82)
4. A
ppro
pria
tion
to s
urpl
us re
serv
e-
--
-86
0-
(860
)-
-
III. A
s at
31
Dec
embe
r 201
720
,774
25,9
0575
,011
(1,0
67)
10,6
8470
,611
214,
977
5,85
742
2,75
2
The
acco
mpa
nyin
g no
tes
form
par
t of t
he fi
nanc
ial s
tate
men
ts.
The
finan
cial
sta
tem
ents
on
page
s 13
3 to
281
wer
e si
gned
by
the
follo
win
g:
Gao
Jia
npin
g
Cha
irman
of t
he B
oard
Lega
l Rep
rese
ntat
ive
Tao
Yipi
ng
Pre
side
nt
Per
son
in C
harg
e of
the
Acc
ount
ing
Bod
y
Lai F
uron
g
Fina
ncia
l Dire
ctor
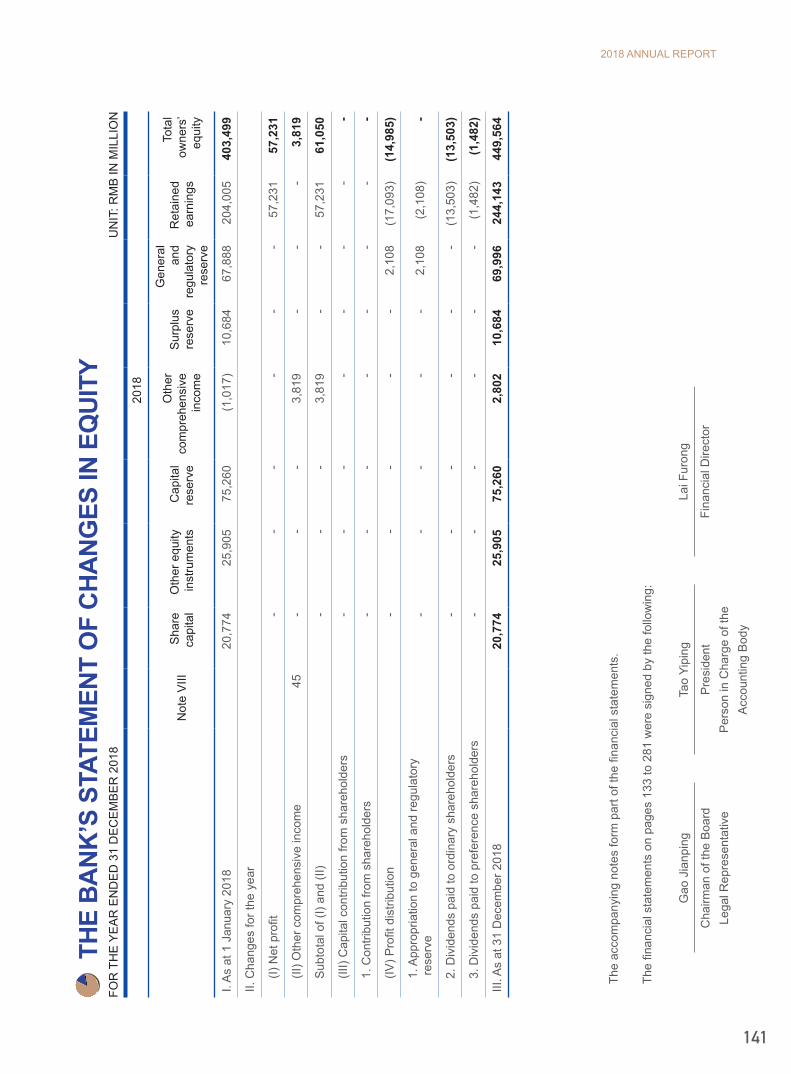
2018 ANNUAL REPORT
141
TH
E BA
NK’S
STA
TEM
ENT
OF
CHAN
GES
IN E
QUI
TYFO
R T
HE
YE
AR
EN
DE
D 3
1 D
EC
EM
BE
R 2
018
U
NIT
: RM
B IN
MIL
LIO
N
2018
Not
e V
IIIS
hare
ca
pita
lO
ther
equ
ity
inst
rum
ents
Cap
ital
rese
rve
Oth
erco
mpr
ehen
sive
in
com
e
Sur
plus
re
serv
e
Gen
eral
an
d re
gula
tory
re
serv
e
Ret
aine
d ea
rnin
gs
Tota
l ow
ners
’ eq
uity
I. A
s at
1 J
anua
ry 2
018
20,7
7425
,905
75,2
60(1
,017
)10
,684
67,8
8820
4,00
540
3,49
9
II. C
hang
es fo
r the
yea
r
(I
) Net
pro
fit-
--
--
-57
,231
57
,231
(I
I) O
ther
com
preh
ensi
ve in
com
e 45
--
-3,
819
--
-3,
819
S
ubto
tal o
f (I)
and
(II)
--
-3,
819
--
57,2
31
61,0
50
(I
II) C
apita
l con
tribu
tion
from
sha
reho
lder
s -
--
--
--
-
1
. Con
tribu
tion
from
sha
reho
lder
s-
--
--
--
-
(I
V) P
rofit
dis
tribu
tion
--
--
-2,
108
(17,
093)
(14,
985)
1
. App
ropr
iatio
n to
gen
eral
and
regu
lato
ry
res
erve
-
--
--
2,10
8(2
,108
)-
2
. Div
iden
ds p
aid
to o
rdin
ary
shar
ehol
ders
-
--
--
-(1
3,50
3)(1
3,50
3)
3
. Div
iden
ds p
aid
to p
refe
renc
e sh
areh
olde
rs-
--
--
-(1
,482
)(1
,482
)
III. A
s at
31
Dec
embe
r 201
820
,774
25,9
0575
,260
2,80
2 10
,684
69,9
9624
4,14
3 44
9,56
4
The
acco
mpa
nyin
g no
tes
form
par
t of t
he fi
nanc
ial s
tate
men
ts.
The
finan
cial
sta
tem
ents
on
page
s 13
3 to
281
wer
e si
gned
by
the
follo
win
g:
Gao
Jia
npin
g
Cha
irman
of t
he B
oard
Lega
l Rep
rese
ntat
ive
Tao
Yipi
ng
Pre
side
nt
Per
son
in C
harg
e of
the
Acc
ount
ing
Bod
y
Lai F
uron
g
Fina
ncia
l Dire
ctor
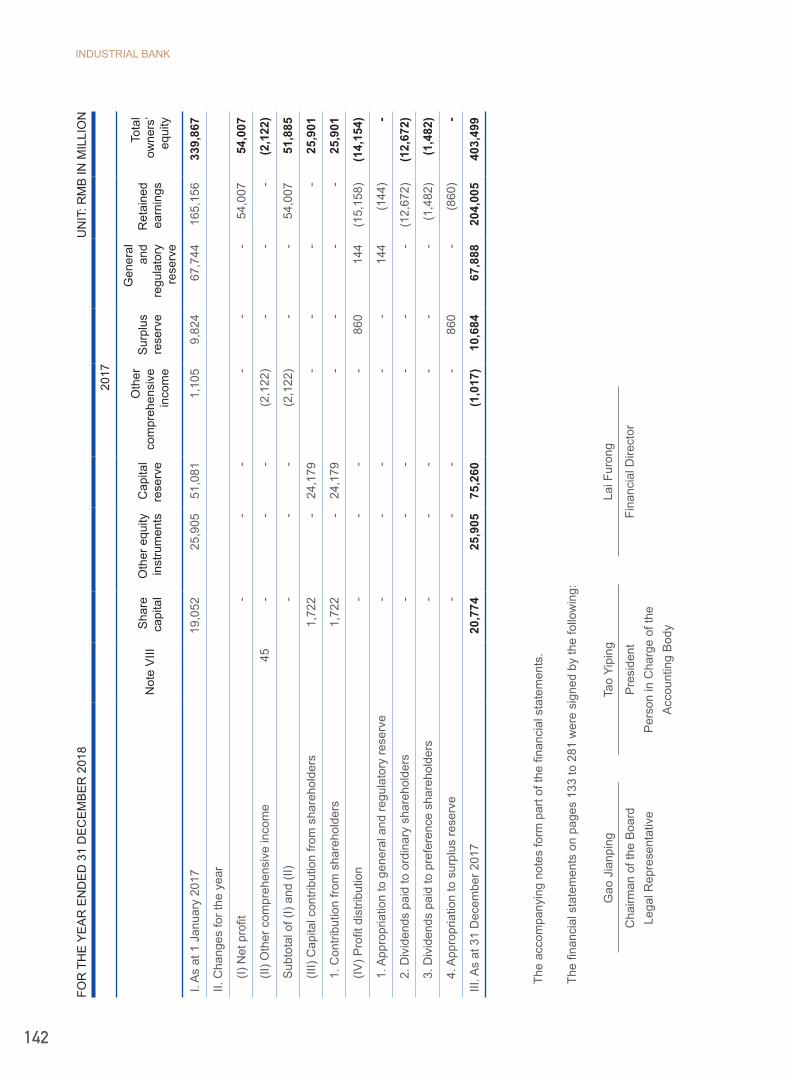
INDUSTRIAL BANK
142
FOR
TH
E Y
EA
R E
ND
ED
31
DE
CE
MB
ER
201
8
UN
IT: R
MB
IN M
ILLI
ON
2017
Not
e V
IIIS
hare
ca
pita
lO
ther
equ
ity
inst
rum
ents
Cap
ital
rese
rve
Oth
erco
mpr
ehen
sive
in
com
e
Sur
plus
re
serv
e
Gen
eral
an
d re
gula
tory
re
serv
e
Ret
aine
d ea
rnin
gs
Tota
l ow
ners
’ eq
uity
I. A
s at
1 J
anua
ry 2
017
19,0
5225
,905
51,0
811,
105
9,82
467
,744
165,
156
339,
867
II. C
hang
es fo
r the
yea
r
(I
) Net
pro
fit-
--
--
-54
,007
54,0
07
(I
I) O
ther
com
preh
ensi
ve in
com
e 45
--
-(2
,122
)-
--
(2,1
22)
S
ubto
tal o
f (I)
and
(II)
--
-(2
,122
)-
-54
,007
51,8
85
(I
II) C
apita
l con
tribu
tion
from
sha
reho
lder
s 1,
722
-24
,179
--
--
25,9
01
1
. Con
tribu
tion
from
sha
reho
lder
s1,
722
-24
,179
--
--
25,9
01
(I
V) P
rofit
dis
tribu
tion
--
--
860
144
(15,
158)
(14,
154)
1
. App
ropr
iatio
n to
gen
eral
and
regu
lato
ry re
serv
e-
--
--
144
(144
)-
2
. Div
iden
ds p
aid
to o
rdin
ary
shar
ehol
ders
-
--
--
-(1
2,67
2)(1
2,67
2)
3
. Div
iden
ds p
aid
to p
refe
renc
e sh
areh
olde
rs-
--
--
-(1
,482
)(1
,482
)
4
. App
ropr
iatio
n to
sur
plus
rese
rve
--
--
860
-(8
60)
-
III. A
s at
31
Dec
embe
r 201
720
,774
25,9
0575
,260
(1,0
17)
10,6
8467
,888
204,
005
403,
499
The
acco
mpa
nyin
g no
tes
form
par
t of t
he fi
nanc
ial s
tate
men
ts.
The
finan
cial
sta
tem
ents
on
page
s 13
3 to
281
wer
e si
gned
by
the
follo
win
g:
Gao
Jia
npin
g
Cha
irman
of t
he B
oard
Lega
l Rep
rese
ntat
ive
Tao
Yipi
ng
Pre
side
nt
Per
son
in C
harg
e of
the
Acc
ount
ing
Bod
y
Lai F
uron
g
Fina
ncia
l Dire
ctor
2018 ANNUAL REPORT
143
NOTES TO THE FINANCIAL STATEMENTS FOR THE YEAR ENDED 31 DECEMBER 2018
I. GENERAL INFORMATIONIndustrial Bank Co., Ltd. (hereinafter referred to as “the Bank”) which was formerly referred to as Fujian Industrial Bank Co., Ltd., is a joint-stock commercial bank approved by the People’s Bank of China (the "PBOC"), with the document YF [1988] No. 347 issued on 20 July 1988, in accordance with the Ratification for Deepening Reform and Opening and Accelerating the Development of Export-oriented Economy in Fujian Province (GH [1988] No.58) approved by the State Council, the Bank was listed on the Shanghai Stock Exchange on 5 February 2007 with the stock code 601166.
The Bank operates under financial services certificate No. B0013H135010001 issued by China Banking and Insurance Regulatory Commission (formerly known as China Banking Regulatory Commission, hereinafter referred to as the "CBIRC"), and business license No. 91350000158142711F issued by Fujian Provincial Administration of Industry and Commerce, the registered office of the Bank is located at154 Hudong Road, Fuzhou, Fujian Province, the PRC. The legal representative of the Bank is Mr. Gao Jian Ping.
The principal activities of the Bank comprise the provision of banking service, which includes accepting deposits from the public; granting short-term, medium-term and long-term loans; domestic and overseas settlement services; issuance of discount and acceptance bills and notes; issuing financial bonds; agency issue and encashment, underwriting and trading of government bonds; trading of government and financial bonds and debentures; agency trading and trading of marketable securities except stock; asset custody business; inter-bank lending and borrowings; sale and purchase of foreign exchange; bank card business; letters of credit and letters of guarantee; remittance and insurance agent services; safety deposit box services; financial advisory services; credit investigation, advisory and attestation services and other banking activities approved by the CBRC.
The principal activities of the Bank's subsidiaries comprise finance leasing, trust services, fund raising and marketing, asset management for specific clients, asset management, consumer finance, equity investment, industrial investment, investment management and consulting(excluding brokerage); financial consulting, business consulting, enterprise management consulting, financial data processing, commodity futures brokerage, financial futures brokerage, futures investment consulting, economic information consulting service, application software development and operational services, system integration services; Investment and assets management, participating the batch acquisition, transfer and disposal of non-performing assets of financial institutions within the province, acquisition, transfer and disposal of non-performing assets of non-financial institutions; other banking activities approved by the CBRC as well as other businesses permitted by China Securities Regulatory Commission (the "CSRC").
II. BASIS OF PREPARATION OF FINANCIAL STATEMENTSThe Bank and its subsidiaries (collectively, “the Group”) has adopted the Accounting Standards for Business Enterprises (the "ASBE") issued and implemented by the Ministry of Finance of People's Republic of China (the "MOF").
In addition, the Group has disclosed relevant financial information in accordance with Information Disclosure and Presentation Rules for Companies Offering Securities to the Public No. 15- General Provisions on Financial Reporting (Revised in 2014) and the relevant regulations released by the China Securities Regulatory Commission.
The report is prepared on a going concern basis.

INDUSTRIAL BANK
144
III. STATEMENT OF COMPLIANCE WITH THE ASBEThe financial statements of the Bank have been prepared in accordance with ASBE, and present truly and completely, the Bank's and consolidated financial position as of 31 December 2018, and the Bank's and consolidated results of operations and cash flows for the year then ended.
IV. SIGNIFICANT ACCOUNTING POLICIES AND ACCOUNTING ESTIMATES
1. Accounting period
The Group has adopted the calendar year as its accounting year, i.e. from 1 January to 31 December.
2. Basic of accounting and principle of measurement
The Group has adopted the accrual basis of accounting. Except for certain financial instruments which are measured at fair value, the Group adopts the historical cost as the principle of measurement in the financial statements. Where assets are impaired, allowance for impairment losses are made in accordance with relevant requirements.
Under historical cost, assets are recorded at the amount of cash or cash equivalents paid or the fair value of the consideration given to acquire them at the time of their acquisition. Liabilities are recorded at the amount of proceeds or assets received in exchange for the present obligation, or the amount payable under contract for assuming the present obligation, or at the amount of cash or cash equivalents expected to be paid to satisfy the liability in the normal course of business.
Fair value is the price that would be received to sell an asset or paid to transfer a liability in an orderly transaction between market participants at the measurement date. The measurement and disclosure of fair value in the financial statements are based on the fair value regardless of whether it is directly observable or estimated using valuation technique.
The fair value measurement is categorized into 3 levels subject to the observability of input and the significance of the input to the entire measurement:
• Level 1 inputs are quoted prices (unadjusted) in active markets for identical assets or liabilities that the entity can access at the measurement date.
• Level 2 inputs are inputs other than quoted prices included within Level 1 that are observable for the asset or liability, either directly or indirectly.
• Level 3 inputs are unobservable inputs for the asset or liability.
3. Functional currency
The Group and its domestic subsidiaries choose Renminbi (“RMB”) as their functional currency, while its subsidiaries overseas choose their functional currency depends on the primary economic environment in which the subsidiaries operate. The Group adopts RMB to prepare its financial statements.
4. The accounting treatment of business combinations involving enterprises under common control and business combinations not involving enterprises under common control
Business combinations are classified into business combinations involving enterprises under common control and business combinations not involving enterprises under common control.
2018 ANNUAL REPORT
145
4.1 Business combinations involving enterprises under common control
A business combination involving enterprises under common control is a business combination in which all of the combining enterprises are ultimately controlled by the same party or parties both before and after the combination, and that control is not transitory.
Assets and liabilities obtained shall be measured at their respective carrying amounts as recorded by the combining entities at the date of the combination. The difference between the carrying amount of the net assets obtained and the carrying amount of the consideration paid for the combination is adjusted to the share premium in capital reserve. If the share premium is not sufficient to absorb the difference, any excess shall be adjusted against retained earnings.
Costs that are directly attributable to the combination are charged to profit or loss in the period in which they are incurred.
4.2 Business combinations not involving enterprises under common control and goodwill
A business combination not involving enterprises under common control is a business combination in which all of the combining enterprises are not ultimately controlled by the same party or parties before and after the combination.
The cost of combination is the aggregation of the fair values, at the acquisition date, of the assets given, liabilities incurred or assumed, and the equity securities issued by the acquirer in exchange for control of the acquire. Where a business combination not involving enterprises under common control is achieved in stages that involve multiple transactions, the cost of combination is the sum of the consideration paid at the acquisition date and the fair value at the acquisition date of the acquirer's previously held interest in the acquiree. The intermediary expenses incurred by the acquirer in respect of auditing, legal services, valuation and consultancy services, etc. and other associated administrative expenses attributable to the business combination are recognised in profit or loss when they are incurred.
The acquiree’s identifiable assets, liabilities and contingent liabilities acquired by the acquirer in a business combination that meet the recognition criteria shall be measured at fair value at the acquisition date.
Where the cost of combination exceeds the acquirer’s interest in the fair value of the acquiree’s identifiable net assets, the difference is treated as an asset and recognised as goodwill, which is measured at cost on initial recognition. Where the cost of combination is less than the acquirer’s interest in the fair value of the acquiree’s identifiable net assets, the acquirer firstly reassesses the measurement of the fair values of the acquiree’s identifiable assets, liabilities and contingent liabilities and measurement of the cost of combination. If after that reassessment, the cost of combination is still less than the acquirer’s interest in the fair value of the acquiree’s identifiable net assets, the acquirer recognises the remaining difference immediately in profit or loss for the current period.
Goodwill arising on a business combination is measured at cost less accumulated impairment losses, and is presented separately in the consolidated financial statements. It is tested for impairment at least at the end of each year.
5. Preparation of consolidated financial statements
The scope of consolidated financial statements is determined on the basis of control. Control refers to the power an investor has over an investee, by virtue of which the investor enjoys variable returns by participating in related activities of the investee, and has the ability to use its power over the investee to influence the amount of its returns. Once the change in relevant facts and circumstances leads to a change in relevant elements involved in the definition of control, the Group will conduct reassessment.
Consolidation of a subsidiary begins when the Group obtains control over the subsidiary and ceases when the Group loses control of subsidiary.
For subsidiaries disposed by the Group, their results of operation and cash flows prior to the disposal date (the date when control is lost) are included in the consolidated statements of comprehensive income and consolidated statement of cash flows, as appropriate.

INDUSTRIAL BANK
146
For subsidiaries acquired through a business combination not involving enterprises under common control, their results of operation and cash flows from the acquisition date(the date when control is obtained) are included in the consolidated statements of comprehensive income and consolidated statement of cash flows, as appropriate.
No matter when the business combination occurs in the reporting period, subsidiaries acquired through a business combination involving enterprises under common control are included in the Group's scope of consolidation as if they had been included in the scope of consolidation from the date when they first came under the common control of the ultimate controlling party. Their operating results and cash flows from the beginning of the earliest reporting period are included in the consolidated income statement and consolidated statement of cash flows, as appropriate.
The significant accounting policies and accounting periods adopted by the subsidiaries are determined based on the uniform accounting policies and accounting periods set out by the Bank.
All significant intergroup accounts and transactions between the Bank and its subsidiaries or between subsidiaries are eliminated in full amount on consolidation.
The portion of subsidiaries' equity that is not attributable to the Bank is treated as non-controlling interests in equity and presented as "non-controlling interests in equity" in the consolidated statements of financial position within shareholders' equity. The portion of net profits or losses of subsidiaries for the period attributable to non-controlling interests is presented as "non-controlling interests" in the consolidated statements of comprehensive income below the "net profit" line item.
When the amount of loss for the period attributable to the non-controlling shareholders of a subsidiary exceeds the non-controlling shareholders' portion of the opening balance of owners' equity of the subsidiary, the excess amount are still allocated against non-controlling interests.
Acquisition of non-controlling interests or disposal of interest in a subsidiary that does not result in the loss of control over the subsidiary is accounted for as equity transactions. The carrying amounts of the equity attributable to equity holders of the bank and non-controlling interests in equity are adjusted to reflect the changes in their relative interests in the subsidiary. The difference between the amount by which the non-controlling interests in equity are adjusted and the fair value of the consideration paid or received is adjusted to capital reserve. If the capital reserve is not sufficient to absorb the difference, the excess are adjusted against retained earnings.
For the stepwise acquisition of equity interest till acquiring control after a few transactions and leading to business combination not involving enterprises under common control, this should be dealt with based on whether this belongs to 'package deal': if it belongs to 'package deal', transactions will be dealt as transactions to acquire control. If it does not belong to 'package deal', transactions to acquire control on acquisition date will be under accounting treatment, the fair value of acquirees' shares held before acquisition date will be revalued, and the difference between fair value and book value will be recognized in profit or loss of the current period; if acquirees' shares held before acquisition date involve in changes of other comprehensive income and other equity of owners under equity method, this will be transferred to income of acquisition date.
When the Group loses control over a subsidiary due to disposal of certain equity interest or other reasons, any retained interest is re-measured at its fair value at the date when control is lost. The difference between (i) the aggregate of the consideration received on disposal and the fair value of any retained interest and (ii) the share of the former subsidiary's net assets cumulatively calculated from the acquisition date according to the original proportion of ownership interest is recognised as investment income in the period in which control is lost. Other comprehensive income associated with investment in the former subsidiary is reclassified to investment income in the period in which control is lost.
Structured entities refers to the entities that voting rights or similar rights do not constitute decisive factors when recognise the controlling party, such as when voting rights are associated with the administration, or related activities are led by the contractual arrangements. Wealth management products, fund, trust fund plans and fund management plans could be used as examples of the structured entities.
2018 ANNUAL REPORT
147
6. Recognition criteria of cash and cash equivalents
Cash comprises cash on hand and deposits that can be readily withdrawn on demand. Cash equivalents are the Group's short-term, highly liquid investments that are readily convertible to known amounts of cash and which are subject to an insignificant risk of changes in value.
7. Transactions denominated in foreign currencies and translation of foreign currency financial statements
7.1 Transactions denominated in foreign currencies
A foreign currency transaction is recorded, on initial recognition, by applying the spot exchange rate on the date of the transaction.
At the balance sheet date, foreign currency monetary items are translated into functional currency using the spot exchange rates at the balance sheet date. Exchange differences arising from the differences between the spot exchange rates prevailing at the balance sheet date and those on initial recognition or at the previous balance sheet date are recognised in profit or loss for the period, except that exchange differences arising from changes in the carrying amounts (other than the amortised cost) of available-for-sale monetary items are recognised as other comprehensive income.
Involving in business overseas when preparing consolidated financial statements, such as foreign currency monetary items which essentially constitute net investment in a foreign operation, exchange differences arising from changes in exchange rate interests is presented as "foreign currency report translation differences" item in other comprehensive income and recognized in profit or loss disposal when disposing business overseas.
Foreign currency non-monetary items measured at historical cost are translated to the amounts in functional currency at the spot exchange rates on the dates of the transactions and the amounts in functional currency remain unchanged. Foreign currency non-monetary items measured at fair value are re-translated at the spot exchange rate on the date the fair value is determined. Difference between the re-translated functional currency amount and the original functional currency amount is treated as changes in fair value (including changes of exchange rate) and is recognised in profit and loss or as other comprehensive income.
7.2 Transactions for foreign currency financial statements
When preparing consolidated financial statements, financial statements of overseas operations in foreign currency are translated into financial statements in RMB in the following methods: All assets and liabilities in the statements of financial position are translated by applying the spot exchange rates at the balance sheet date; shareholders' equities except retained earnings are translated by applying the spot exchange rate on the date of the transaction; statements of comprehensive income and items reflecting profit distribution occurred are translated by exchange rates similar with the spot exchange rate on the date of the transaction; retained earnings at the beginning of this yeas equal to the retained earnings after translation at the end of previous year; retained earnings at the end of period are presented as profit distributions after translation; differences between assets after translation and liabilities &shareholders' equity after translation are presented as "other comprehensive income" in shareholders' equity.
Cash flow in foreign currency and cash flow of overseas institutions are translated by applying the spot exchange rates at the cash flow occurred date. Affected amount of cash and cash equivalents by exchange rate changes is presented separately as "effect of exchange rate changes on cash and cash equivalents" in the cash flow statement, as an adjustment item.
The opening balances and the comparative figures of previous year are presented at the translated amounts in the previous year's financial statements.
INDUSTRIAL BANK
148
8. Financial instruments
Financial assets and financial liabilities are recognised when the Group becomes a party to the contractual provisions of the instrument. Financial assets and financial liabilities are initially measured at fair value. For financial assets and financial liabilities at fair value through profit or loss, transaction costs are immediately recognised in profit or loss. For other financial assets and financial liabilities, transaction costs are included in their initial recognised amounts.
8.1 Effective interest method
The effective interest method is a method of calculating the amortised cost of a financial asset or a financial liability (or a group of financial assets or financial liabilities) and of allocating the interest income or interest expense over the relevant period, using the effective interest rate. The effective interest rate is the rate that exactly discounts estimated future cash flows through the expected life of the financial asset or financial liability or, where appropriate, a shorter period to the net carrying amount of the financial asset or financial liability.
When calculating the effective interest rate, the Group estimates future cash flows considering all contractual terms of the financial asset or financial liability (without considering future credit losses), and also considers all fees paid or received between the parties to the contract giving rise to the financial asset and financial liability that are an integral part of the effective interest rate, transaction costs, and premiums or discounts, etc.
8.2 Classification, recognition and measurement of financial assets
On initial recognition, the Group’s financial assets are classified into one of the four categories, including financial assets at fair value through profit or loss, held-to-maturity investments, loans and receivables, and available-for-sale financial assets. All regular way purchases or sales of financial assets are recognised and derecognised on a trade date basis.
8.2.1 Financial Assets at Fair Value through Profit or Loss ("FVTPL")
Financial assets at FVTPL include financial assets held for trading and those assigned as at fair value through profit or loss.
A financial asset is classified as held for trading if one of the following conditions is satisfied: (1) It has been acquired principally for the purpose of selling in the near term or repurchasing; or (2) On initial recognition it is part of a portfolio of identified financial instruments that the Group manages together and there is objective evidence that the Group has a recent actual pattern of short-term profit-taking; or (3) it is a derivative that is not designated and effective hedging instrument, or a financial guarantee contract, or a derivative that is linked to and must be settled by delivery of an unquoted equity instrument (without a quoted price in an active market) whose fair value cannot be reliably measured.
A financial asset is assigned as financial assets at fair value through profit or loss, on initial recognition, if one of the following conditions is satisfied: (1) the recognition could eliminate or significantly reduce profit or loss differences in recognition or measurement due to the difference in measurement basis of financial assets; or (2) It has been stated in formal written document of the Group's risk management or investment strategy, that managing and evaluating the group of financial assets or financial assets & financial liabilities on the basic of fair value, and reporting it to key management personnel; or (3) The hybrid financial instrument combines financial asset with embedded derivatives.
Financial assets at fair value through profit or loss are subsequently measured at fair value. Any gains or losses arising from changes in the fair value and any dividend or interest income earned on the financial assets are recognized in profit or loss.
8.2.2 Held-to-maturity investments
Held-to-maturity investments are non-derivative financial assets with fixed or determinable payments and fixed maturity

2018 ANNUAL REPORT
149
dates that the Group's management has the positive intention and ability to hold to maturity.
Held-to-maturity investments are subsequently measured at amortised cost using the effective interest method. Gain or loss arising from derecognition, impairment or amortisation is recognised in profit or loss.
8.2.3 Loans and receivables
Loans and receivables are non-derivative financial assets with fixed or determinable payments that are not quoted in an active market. Financial assets classified as loans and receivables by the Group include balances with Central Bank, deposits with banks and other financial institutions, placements with banks and other financial institutions, financial assets purchased under resale agreements, interest receivables, loans and advances to customers, investments classified as receivables, finance lease receivables and other receivables, etc.
Loans and receivables are subsequently measured at amortised cost using the effective interest method. Gain or loss arising from derecognition, impairment or amortisation is recognised in profit or loss.
8.2.4 Available-for-sale financial assets
Available-for-sale financial assets include non-derivative financial assets that are designated on initial recognition as available for sale, and financial assets that are not assigned as financial assets at fair value through profit or loss, loans and receivables or held-to-maturity investments.
Available-for-sale financial assets are subsequently measured at fair value, and gains or losses arising from changes in the fair value are recognised as other comprehensive income, except that impairment losses and exchange differences related to amortised cost of monetary financial assets denominated in foreign currencies are recognised in profit or loss, until the financial assets are derecognised, at which time the gains or losses are released and recognised in profit or loss.
Interests obtained and the cash dividends declared by the investee during the period in which the available-for-sale financial assets are held, are recognised in interest income and investment gains, respectively.
For investments in equity instruments that do not have a quoted market price in an active market and whose fair value cannot be reliably measured, and derivative financial assets that are linked to and must be settled by delivery of such unquoted equity instruments, they are measured at cost.
8.3 Impairment of financial assets
The Group assesses at each balance sheet date the carrying amounts of financial assets other than those at fair value through profit or loss. If there is objective evidence that a financial asset is impaired, the Group determines the amount of any impairment provision. Objective evidence that a financial asset is impaired is evidence that, arising from one or more events that occurred after the initial recognition of the asset, the estimated future cash flows of the financial asset, which can be reliably measured, have been affected.
Objective evidence that a financial asset is impaired includes the following observable events:
(1) Significant financial difficulty of the issuer or obligor;
(2) A breach of contract by the borrower, such as a default or delinquency in interest or principal payments;
(3) The Group, for economic or legal reasons relating to the borrower’s financial difficulty, granting a concession to the borrower;
(4) It becoming probable that the borrower will enter bankruptcy or other financial reorganisations;
(5) The disappearance of an active market for that financial asset because of financial difficulties of the issuer;
(6) Upon an overall assessment of a group of financial assets, observable data indicates that there is a measurable decrease in the estimated future cash flows from the group of financial assets since the initial recognition of those assets,
INDUSTRIAL BANK
150
although the decrease cannot yet be identified with the individual financial assets in the group. Such observable data includes:
- Adverse changes in the payment status of borrower in the group of assets;
- Economic conditions in the country or region of the borrower which may lead to a failure to pay the group of assets;
(7) Significant adverse changes in the technological, market, economic or legal environment in which the issuer operates, indicating that the cost of the investment in the equity instrument may not be recovered by the investor;
(8) A significant or prolonged decline in the fair value of an investment in an equity instrument below its cost.
(9) Other objective evidence indicating there is an impairment of a financial asset.
8.3.1 Impairment of financial assets measured at amortised cost
If financial assets carried at amortised cost are impaired, the carrying amounts of the financial assets are reduced to the present value of estimated future cash flows (excluding future credit losses that have not been incurred) discounted at the financial asset's original effective interest rate. The amount of reduction is recognised as an impairment loss in profit or loss. If, subsequent to the recognition of an impairment loss on financial assets carried at amortised cost, there is objective evidence of a recovery in value of the financial assets which can be related objectively to an event occurring after the impairment is recognised, the previously recognised impairment loss is reversed. However, the reversal is made to the extent that the carrying amount of the financial asset at the date the impairment is reversed does not exceed what the amortised cost would have been had the impairment not been recognised.
For a financial asset that is individually significant, the Group assesses the asset individually for impairment. For a financial asset that is not individually significant, the Group assesses the asset individually for impairment or includes the asset in a group of financial assets with similar credit risk characteristics and collectively assesses them for impairment. If the Group determines that no objective evidence of impairment exists for an individually assessed financial asset (whether significant or not), it includes the asset in a group of financial assets with similar credit risk characteristics and collectively reassesses them for impairment. Assets for which an impairment loss is individually recognised are not included in a collective assessment of impairment.
8.3.2 Impairment of available-for-sale financial assets
Objective evidence that an available-for-sale financial asset is impaired includes significant or prolonged decline in the fair value of an investment in an equity instrument below its cost. The Group assesses each available-for-sale equity instrument investment individually on balance sheet date. Impairment is indicated when the fair value of an equity instrument is lower than its initial investment cost over 50% (including 50%) or the fair value has been lower than its initial investment cost for over 12 months (including 12 months).
When an available-for-sale financial asset is impaired, the cumulative loss arising from decline in fair value previously recognised directly in other comprehensive income is reclassified from the other comprehensive income to profit or loss. The amount of the cumulative loss that is reclassified from other comprehensive income to profit or loss is the difference between the acquisition cost (net of any principal repayment and amortisation) and the current fair value, less any impairment loss on that financial asset previously recognised in profit or loss.
If, subsequent to the recognition of an impairment loss on available-for-sale financial assets, there is objective evidence of a recovery in value of the financial assets which can be related objectively to an event occurring after the impairment is recognised, the previously recognised impairment loss is reversed. The amount of reversal of impairment loss on available-for-sale equity instruments is recognised as other comprehensive income, while the amount of reversal of impairment loss on available-for-sale debt instruments is recognised in profit or loss.

2018 ANNUAL REPORT
151
8.3.3 Impairment of financial assets measured at cost
If an impairment loss has been incurred on an investment in unquoted equity instrument (without a quoted price in an active market) whose fair value cannot be reliably measured, or on a derivative financial asset that is linked to and must be settled by delivery of such an unquoted equity instrument, the carrying amount of the financial asset is reduced to the present value of estimated future cash flows discounted at the current market rate of return for a similar financial asset. The amount of reduction is recognised as an impairment loss in profit or loss. The impairment loss on such financial asset is not reversed once it is recognised.
8.4 Transfer of financial assets and derecognition of financial assets
The Group's financial assets are transferred if one of the following conditions is satisfied:
(1) Contractual rights to receive cash flow of the financial asset has been transferred; or
(2) Although the financial asset has been transferred, the Group keeps the contractual rights to receive cash flow of the financial asset and undertake the obligation to pay the received cash flow to the final transferee, and if the following conditions are satisfied simultaneously:
• The Group has the obligation to pay to the final recipient when receiving peer cash flow from the financial asset. It's deemed to satisfy this condition when the Group pays short-term advances, but it is entitled to recover the full amount of the advances and receive interest accrued in accordance with the market interest rate of bank loan.
• According to the contract, the financial asset could not be sold or pledged, but it could be offered as guarantee for paying cash flow to the final recipient.
• The Group has the obligation to pay the received cash flow to the final recipient promptly. The Group is not entitled to reinvest with the cash flow, except for the investment in cash or cash equivalent in accordance with the contract during the interval between two consecutive payments. If the Group reinvests according to the contract, it should pay the investment income to the final recipient in accordance with the provisions of the contract.
The Group derecognises a financial asset if one of the following conditions is satisfied:
(1) The contractual rights to the cash flows from the financial asset expire; or
(2) The financial asset has been transferred, and if one of the following conditions is satisfied:
• All the risks and rewards of ownership of the financial asset is transferred to the transferee; or
• The Group neither transfers nor retains substantially all the risks and rewards of ownership of the financial asset but has not retained control of the financial asset.
If the Group neither transfers nor retains substantially all the risks and rewards of ownership of a financial asset, and it retains control of the financial asset, it recognises the financial asset to the extent of its continuing involvement in the transferred financial asset.
For a transfer of a financial asset in its entirety that satisfies the derecognition criteria, the difference between (1) the carrying amount of the financial asset transferred; and (2) the sum of the consideration received from the transfer and any cumulative gain or loss that has been recognised in other comprehensive income, is recognised in profit or loss.
If a part of the transferred financial asset qualifies for derecognition, the carrying amount of the transferred financial asset is allocated between the part that continues to be recognised and the part that is derecognised, based on the respective fair values of those parts. The difference between (1) the carrying amount allocated to the part derecognised; and (2) the sum of the consideration received for the part derecognised and any cumulative gain or loss allocated to the part derecognised which has been previously recognised in other comprehensive income, is recognised in profit or loss.

INDUSTRIAL BANK
152
8.5 Asset-backed securities business
The Group securitises a portion of assets by selling these assets to structured entities, and then issue securities to its investors. Conditions of derecognising the relevant financial assets refer to Note IV 8.4. When applying the derecognising conditions of financial assets, the Group has already taken into account the extent of transfer of the risks and rewards of those assets transferred to the other structured entity, as well as the extent of control over such entity by the Group. If the derecognising conditions of securities are not satisfied, the related financial assets are not derecognised, but the funds raising from third party investors will be treated as financial liabilities; When the Group neither transfers nor retains substantially all the risks and rewards of ownership of the asset-backed securities, it shall determine whether it has retained control over the financial asset. If the Group has not retained control, it shall derecognise the financial asset and recognise the rights retained or obligations arising from the transfer as an asset or a liability respectively. If the Group has retained control, it shall recognise the financial asset to the extent of its continuing involvement in the financial asset.
8.6 Classification, recognition and measurement of financial liabilities
The Group recognises a financial liability if one of the following conditions is satisfied: (1) Contractual obligations to deliver cash or other financial assets to other parties, or (2) Contractual obligations to exchange financial assets or financial liabilities with other parties under potential adverse conditions, or (3) Non-derivative contracts provide the Group shall or may measure business with its own equity instruments in the future, and will deliver a variable number of its own equity instruments, or (4) Derivative contracts provide the Group shall or may settle business with its own equity instruments in the future, except for the derivative contracts deliver a fixed number of its own equity instruments to exchange a fixed amount of cash or other financial assets.
At initial recognition, the Group classified financial instrument as financial liabilities or equity instruments according to the contractual terms of issued financial instruments and the reflected economic substance rather than its legal form only, combining with the definition of financial liabilities and equity instruments.
On initial recognition, financial liabilities are classified into financial liabilities at fair value through profit or loss and other financial liabilities.
8.6.1 Financial liabilities at fair value through profit or loss
Financial liabilities at FVTPL consist of financial liabilities held for trading and those assigned as at FVTPL on initial recognition.
A financial liability is classified as held for trading if one of the following conditions is satisfied: (1) It has been acquired principally for the purpose of repurchasing in the near term; or (2) On initial recognition it is part of a portfolio of identified financial instruments that the Group manages together and there is objective evidence that the Group has a recent actual pattern of short-term profit-taking; or (3) It is a derivative, except for a derivative that is a designated as effective hedging instrument, or a financial guarantee contract, or a derivative that is linked to and must be settled by delivery of an unquoted equity instrument (without a quoted price in an active market) whose fair value cannot be reliably measured.
A financial liability is assigned as financial assets at fair value through profit or loss, on initial recognition, if one of the following conditions is satisfied: (1) the recognition could eliminate or significantly reduce profit or loss differences in recognition or measurement due to the difference in measurement basis of financial liability; or (2) It has been stated in formal written document of the Group's risk management or investment strategy, that managing and evaluating the group of financial liabilities or financial assets & financial liabilities on the basic of fair value, and reporting it to key management personnel; or (3) The hybrid financial instrument embedded with derivatives.
Financial liabilities at FVTPL are subsequently measured at fair value. Any gains or losses arising from changes in the fair value or any dividend or interest expenses related to the financial liabilities are recognised in profit or loss.

2018 ANNUAL REPORT
153
8.6.2 Other financial liabilities
For a derivative liability that is linked to and must be settled by delivery of an unquoted equity instrument (without a quoted price in an active market) whose fair value cannot be reliably measured, it is subsequently measured at cost. Other financial liabilities except those arising from financial guarantee contracts or loan commitments are subsequently measured at amortised cost using the effective interest method, with gain or loss arising from derecognition or amortisation recognised in profit or loss.
8.6.3 Financial guarantee contracts and loan commitments
A financial guarantee contract is a contract by which the guarantor and the lender agree that the guarantor would settle the debts or bear obligations in accordance with terms of the contract in case the borrower fails to settle the debts. Financial guarantee contracts that are not assigned as financial liabilities at fair value through profit or loss, or loan commitments to provide a loan at a below-market interest rate, which are not designated at fair value through profit or loss, are initially measured at their fair values less the directly attributable transaction costs. Subsequent to initial recognition, they are measured at the higher of: (i) the amount determined in accordance with Accounting Standard for Business Enterprises No. 13 – Contingencies; and (ii) the amount initially recognised less cumulative amortisation recognised in accordance with the principles set out in Accounting Standard for Business Enterprises No. 14 – Revenue.
8.7 Derecognition of financial liabilities
The Group derecognises a financial liability (or part of it) only when the underlying present obligation (or part of it) is discharged. An agreement between the Group (an existing borrower) and an existing lender to replace the original financial liability with a new financial liability with substantially different terms is accounted for as an extinguishment of the original financial liability and the recognition of a new financial liability.
When the Group derecognises a financial liability or a part of it, it recognises the difference between the carrying amount of the financial liability (or part of the financial liability) derecognised and the consideration paid (including any non-cash assets transferred or new financial liabilities assumed) in profit or loss.
8.8 Derivatives and embedded derivatives
Derivative financial instruments include forward exchange contracts, currency swaps, debenture income swaps, interest rate swaps, precious metal derivative contract and foreign exchange options, etc. Derivatives are initially measured at fair value at the date when the derivative contracts are entered into and are subsequently re-measured at fair value. The resulting gain or loss is recognized in profit or loss.
An embedded derivative is separated from the hybrid instrument, where the hybrid instrument is not assigned as a financial asset or financial liability at fair value through profit or loss, and treated as a standalone derivative if 1) the economic characteristics and risks of the embedded derivative are not closely related to the economic characteristics and risks of the host contract; and 2) a separate instrument with the same terms as the embedded derivative would meet the definition of a derivative. If the Group is unable to measure the embedded derivative separately either at acquisition or at a subsequent balance sheet date, it assigns the entire hybrid instrument as a financial asset or financial liability at fair value through profit or loss.
8.9 Hedge accounting
Upon initial designation of hedging relationship, the Group formally designates relevant hedging relationship and records the hedging relationship, risk management objective and strategy with formal documents. The content of the records include the hedging instruments, hedged items or transactions, and the nature of hedged risk, as well as how does the Group assess the effectiveness of the hedging instruments to offset the changes in fair value or cash flows arising from
INDUSTRIAL BANK
154
the hedged risk to which the hedged item is attributable to. The Group anticipates that these hedges is highly effective in offsetting the changes in fair value, meanwhile, the hedge is assessed for effectiveness by the Group on an ongoing basis so as to determine whether the hedge is highly effective throughout the accounting periods for which the hedging relationship was designated.
8.9.1 Fair value hedges
The fair value hedge represent the hedge against the risks of changes in fair value of the Group recognized assets or liabilities, unrecognized firm commitments and the identifiable portion of such assets or liabilities, unrecognized firm commitments, where the change in fair value is caused by certain specific risk and will affect the profit or loss for the period. For fair value hedges, the fair value change gains or losses on the hedged item attributable to the hedged risk is recognised in profit or loss, with a corresponding adjustment to the carrying amount of the hedged item; the fair value change gains or losses on the hedging instruments attributable to the hedged risk is recognised in profit or loss, with a corresponding adjustment to the carrying amount of the hedging instruments.
For a hedged item of fair value hedge, if such item was previously measured at amortized cost, its carrying amount is adjusted using hedging accounting and then amortized over the period from the adjustment date to maturity date using the effective interest rate re-calculated at the adjustment date.
Where an unrecognized firm commitment is designated as the hedged item, the cumulative fair value change on such unrecognized firm commitment attributable to the hedged risk is recognized as an asset or liability, with relevant gain or loss recognized in the profit or loss for the period.
For fair value hedge of a firm commitment to purchase assets or undertake liabilities, the cumulative fair value change on such unrecognized firm commitment attributable to the hedged risk (already recognized as an asset or liability) is adjusted against the initial recognized amount of the assets obtained or liabilities assumed for performing the firm commitment.
When the hedging instrument is expired, sold, contractually terminated or exercised, or the hedging relationship no longer satisfy the criteria of hedging amounting, or the Group cancels the designation of the hedging relationship, the Group shall cease to use fair value hedging amounting. When the hedged item is terminated, the unamortized fair value is included in profit or loss for the period.
8.10 Offsetting financial assets and financial liabilities
Where the Group has a legal right that is currently enforceable to set off the recognised financial assets and financial liabilities, and intends either to settle on a net basis, or to realise the financial asset and settle the financial liability simultaneously, a financial asset and a financial liability shall be offset and the net amount is presented in the statements of financial position. Except for the above circumstances, financial assets and financial liabilities shall be presented separately in the statements of financial position and shall not be offset.
8.11 Equity instruments
An equity instrument is any contract that evidences a residual interest in the assets of the Group after deducting all of its liabilities. The Group classified financial instruments as equity instruments when all of the following conditions is satisfied: (1) the financial instruments should not include contractual obligations to deliver cash or other financial assets to other parties or to exchange financial assets or financial liabilities with other parties under potential adverse conditions; and (2) the Group shall or may measure business with its own equity instruments in the future. If it is a non-derivative instrument, contractual obligations settled by delivering its own variable equity instruments shall not be included; if it is a derivative instrument, the Group can settle the financial instrument only through exchanging fixed amount of cash or other financial assets with fixed amount of its own equity instruments. Equity instruments issued (including refinanced), repurchased,

2018 ANNUAL REPORT
155
sold and written off by the Group are recognized as changes of equity. Change of fair value of equity instruments is not recognized by the Group. Transaction costs related to equity transaction are deducted from equity.
The Group recognizes the distribution to holders of the equity instruments as distribution of profits, and dividends paid do not affect total amount of shareholders equity.
9. Precious metal
Non-trading precious metal of the Group is initially measured at cost at acquisition, and subsequently re-measured at the lower of cost and realizable value. Trading precious metal of the Group is initially measured and subsequently re-measured at fair value. The changes in fair value arising from re-measurement are recognized in profit or loss.
10. Long-term equity investments
10.1 Determination of joint control or significant influence over investee
Control refers to the power an investor has over an investee, by virtue of which the investor enjoys variable returns by participating in related activities of the investee, and has the ability to use its power over the investee to influence the amount of its returns. Joint control is the contractually agreed sharing of control of an arrangement, which exists only when decisions about the relevant activities require unanimous consent of the parties sharing control. Significant influence is the power to participate in the financial and operating policy decisions of the investee but is not control or joint control over those policies. When determining whether an investing enterprise is able to exercise control or significant influence over an investee, the effect of potential voting rights of the investee (for example, warrants and convertible debts) held by the investing enterprises or other parties that are currently exercisable or convertible shall be considered.
10.2 Determination of initial investment cost
For the acquisition of long-term equity investments involving enterprises under the common control, the Group measures the initial cost of the long-term equity investment as the share of the carrying amount of the owner's equity of the acquired enterprise at that date. The difference between the initial costs of the long-term equity investment and cash paid or non-cash assets transferred as well as the carrying amount of the debts borne by the Group shall offset against the capital reserve. If the capital reserve is insufficient to observe the difference, the retained earnings shall be adjusted. The investment cost which adopts the equity securities issued as the consideration should be adopted as the initial investment cost of the long-term equity investment according to the proportion carrying amount of combined party's shareholder equity in the consolidated financial statement of the final controlling part, and adjust the capital reserves by the difference between the initial investment cost of long-term equity investment and the amount of issued stock's face value, which is regarded as capital stock. If the capital reserves are insufficient to absorb the difference, retained income should be adjusted. For the acquisition of enterprises under the common control through several steps of trading, it should be confirmed whether it's a package deal. If it is, these deals should be measured as one acquiring-control deal. If not, the Group measures the initial cost of the long-term equity investment as the share of the carrying amount of the owner's equity of the acquired enterprise at that date. The difference between the initial costs of the long-term equity investment and the carrying amount of long-term equity investment before acquiring control as well as the carrying amount of the debts for more shares on the acquisition date shall offset against the capital reserve. If the capital reserve is insufficient to absorb the difference, the retained earnings shall be adjusted.
For a long-term equity investment acquired through business combination not involving enterprises under common control, the initial investment cost of the long-term equity investment is the cost of acquisition on the acquisition date. For the acquisition of enterprises under the common control through several steps of trading, it should be confirmed whether it's a package deal. If it is, these deals should be measured as one acquiring-control deal. If not, the carrying amount of long-term equity investment before acquiring control and the cost of new investment is the cost of acquisition measured
INDUSTRIAL BANK
156
under cost method.
Acquisition-related costs including auditing fees, legal services fees, valuation advice fees and other relevant management fees are generally recognised in profit or loss as incurred.
Long-term equity investments other than those arising from business combination, is initially measured at cost. When the Group increases its ownership interest in the investee to the extent that the Group has joint control or significant influence, but not control, over the investee, the cost of the long-term equity investment is the aggregation of fair value of its prior ownership interest recognized in accordance with the Accounting Standards for Enterprises No. 22 - Recognition and Measurement of Financial Instruments and the additional investment cost at that date.
10.3 Subsequent measurement and recognition of profit or loss
10.3.1 Long-term equity investment accounted for using the cost method
The Bank uses the cost method for the long-term equity investment in subsidiaries in the financial statements. The subsidiary refers to the investee that controlled by the group.
Under the cost method, a long-term equity investment is measured at initial investment cost. Increasing or reducing investment will adjust the cost of long term equity investment accordingly. Investment income is recognised in the period in accordance with the attributable share of cash dividends or profit distributions declared by the investee.
10.3.2 Long-term equity investment accounted for using the equity method
The Group accounts for investment in associates using the equity method. Associates are those that the group is able to exercise significant influence over the investee.
Under the equity method, where the initial investment cost of a long-term equity investment exceeds the Group's share of the fair value of the investee’s identifiable net assets at the time of acquisition, no adjustment is made to the initial investment cost. Any excess of the Group's share of the net fair value of the identifiable assets and liabilities over the initial cost of the investment, after reassessment of the long-term equity investment, is recognised immediately in profit or loss in the period in which the investment is acquired.
Under the equity method, the Group recognizes investment income and other comprehensive income based on the Group's share of net profit or loss and other comprehensive income of the investee and adjust the carrying amount of long-term equity investment accordingly. The carrying amount of the investment decreases regarding the attributable share of cash dividends or profit distributions declared by the investee. Changes in shareholders' equity of the investee other than net profits or losses, other comprehensive income or profit distribution are correspondingly adjusted to the carrying amount of the long-term equity investment, and recognized as capital reserve. The Group recognizes its share of the investee's net profit or loss based on the fair value of the investee's identifiable assets after the adjustment of investee's net profit. When the accounting policy and accounting period adopted by the investee are inconsistent with the Group’s, the investment income and other comprehensive income are recognized based on the adjusted financial statements of the investee in accordance with the Group's accounting policies and accounting period. Unrealized profits or losses resulting from the Group's transactions with its associates and joint ventures are recognized as investment income or loss to the extent that those attributable to the Group's equity interest are eliminated. However, unrealized losses resulting from the Group's transactions with its investees in respect of impairment losses on the transferred assets shouldn’t be eliminated.
The Group discontinues recognising its share of net losses of the investee after the carrying amount of the long-term equity investment together with any long-term interests that in substance form part of its net investment in the investee is reduced to zero. If the Group has incurred obligations to assume additional losses of the investee, a provision is recognized according to the expected obligation, and recorded as investment loss for the period. Where net profits are

2018 ANNUAL REPORT
157
subsequently made by the investee, the Group resumes recognising its share of those profits only after its share of the profits exceeds the share of losses previously not recognized.
10.4 Disposal of long-term equity investments
On disposal of a long term equity investment, the difference between the proceeds actually received and the carrying amount is recognised in profit or loss for the period. When the Group reduces its ownership interest in investee but the Group continues to use the equity method, the Group reclassifies to profit or loss the proportion of the gain or loss that had previously been recognised in other comprehensive income relating to that reduction in ownership interest if that gain or loss would be reclassified to profit or loss on the investee's disposal of the related assets or liabilities. Then the equity recognized by the Group other than the change of the net profits and loss, other comprehensive income and profit distribution of the invested entity is reclassified to profit and losses on proportion. When the Group reduces its ownership interest but the Group continues to use the cost method, for the other comprehensive income recognized by the Group using equity method prior to the control over the investee or under financial instrument recognition and measurement standard, the Group reclassifies to profit or loss the proportion of the gain or loss relating to that reduction in ownership interest if that gain or loss would be reclassified to profit or loss on the investee's disposal of the related assets or liabilities. Then the other changes in owners’' equity recognized by the Group using equity method, not arising from the change of the net profits and loss, other comprehensive income or profit distribution of the invested entity is reclassified to profit and loss on proportion.
11. Fixed assets
11.1 Recognition criteria for fixed assets
Fixed assets are tangible assets that are held for use in the production or supply of goods or services, for rental to others, or for administrative purposes, and have useful lives of more than one accounting year. A fixed asset is recognised only when it is probable that economic benefits associated with the asset will flow to the Group and the cost of the asset can be measured reliably. Fixed assets are initially measured at cost.
Subsequent expenditures incurred for the fixed asset are included in the cost of the fixed asset if it is probable that economic benefits associated with the asset will flow to the Group and the cost can be measured reliably. Meanwhile the carrying amount of the replaced part is derecognised. Other subsequent expenditures are recognised in profit or loss in the period in which they are incurred.
11.2 Depreciation of each category of fixed assets
A fixed asset is depreciated over its useful life using the straight-line method since the month subsequent to the one in which it is ready for intended use. The depreciation period, estimated net residual value rate and annual depreciation rate of each category of fixed assets are as follows:
Category Depreciation period Estimated Residual value rate (%)
Annualdepreciation rate (%)
Buildings 20-30 years 0-3 3.23-5.00
Fixed assets improvement The lower of improvement period and remaining useful life 0
Office and machinery equipment 3-20 years 0-5 4.75-33.33
Transportation vehicles 5-8 years 0-3 12.50-20.00
Flight equipment 25 years or 20 years 5 or 15 3.8 or 4.25
Estimated net residual value of a fixed asset is the estimated amount that the Group would currently obtain from disposal
INDUSTRIAL BANK
158
of the asset, after deducting the estimated costs of disposal, if the asset were already of the age and in the condition expected at the end of its useful life.
11.3 Identification basis, valuation methods and depreciation methods for fixed assets acquired under finance leases
At the commencement of the lease term, the Group records the leased asset at an amount equal to the lower of the fair value of the leased asset and the present value of the minimum lease payments at the inception of the lease, and recognises a long-term payable at an amount equal to the minimum lease payments. The difference between the recorded amounts is accounted for as unrecognised finance charge. Besides, initial direct costs that are attributable to the leased item incurred during the process of negotiating and securing the lease agreement are also added to the amount recognised for the leased asset.
The Group adopts a depreciation policy for a fixed asset held under a finance lease which is consistent with that for its owned fixed asset. If there is reasonable certainty that the Group will obtain ownership of the leased asset at the end of the lease term, the leased asset is depreciated over its useful life. If there is no reasonable certainty that the Group will obtain ownership of the leased asset at the end of the lease term, the leased asset is depreciated over the shorter of the lease term and its useful life.
11.4 Other explanations
If a fixed asset is upon disposal or no future economic benefits are expected to be generated from its use or disposal, the fixed asset is derecognised. When a fixed asset is sold, transferred, retired or damaged, the amount of any proceeds on disposal of the asset net of the carrying amount and related taxes is recognised in profit or loss for the period.
The Group reviews the useful life and estimated net residual value rate of a fixed asset and the depreciation method applied at least once at each financial year-end, and accounts for any change as a change in an accounting estimate.
12. Construction in progress
Construction in progress is measured at its actual costs. The actual costs include various construction expenditures during the construction period and other relevant costs. Construction in progress is not depreciated. Construction in progress is transferred to a fixed asset or other asset when it is ready for intended use.
13. Intangible assets
Intangible assets include land use rights, franchising, etc.
An intangible asset is measured initially at cost. Expenses related to the intangible assets are recognised in the cost of intangible assets when (i) it is probable that the associated economic benefits will flow to the Group; and (ii) the associated costs can be measured reliably. Other expenses related to the intangible assets are recognized in profit or loss for the period in which it is incurred.
The acquired land use right is recognized as intangible assets. Expenses related to land use right and construction cost from buildings such as self-built factory, etc. are recognized as intangible assets and fixed assets, respectively. In the case of purchased buildings, it allocates related cost between land use right and buildings. If related cost cannot be allocated reasonably, it is recognized as fixed assets.
When an intangible asset with a finite useful life is available for use, its original cost is amortised over its estimated useful life using the straight-line method. An intangible asset with an indefinite useful life is not amortised.
For an intangible asset with a finite useful life, the Group reviews the useful life and amortisation method at the end of the period, and accounts for any change as a change in an accounting estimate. For an intangible asset with an infinite useful

2018 ANNUAL REPORT
159
life, the Group reviews the useful life. If it is evident that the duration of associated economic benefits is predictable, then estimate the useful life pursuant to amortization policies for intangible assets with finite useful life.
14. Impairment of long-term assets
The Group checks whether long-term equity investment, fixed assets, construction in progress, and intangible assets with a finite useful life will impair in every balance sheet date. If the indication of impairment of these assets exists, the Group estimates their recoverable amount. Intangible assets with indefinite useful life and intangible assets not yet available for use are tested for impairment annually, irrespective of whether there is any indication that the assets may be impaired.
Estimation of recoverable amount of the assets is based on individual asset. If the recoverable amount is difficult to estimate, the amount should be estimated by the assets group which the asset belongs to. Recoverable amount is the higher of the two: net fair value of the assets or assets group after disposal expenses, or present value of the expected cash flow from the assets.
If asset's recoverable amount is lower than its carrying amount, the allowance for impairment losses should be recognized by their balances in profit or loss for the period.
The goodwill should be tested of impairment at least in the end of the each year with related assets group or combination of assets group. In purchase date, the carrying amount of goodwill should be allocated reasonably to assets group or combinations which can benefit from the synergy of enterprise merger. If the recoverable amount of assets group or combinations of allocated goodwill is lower than its carrying amount, impairment loss should be recognized. The amount of impairment loss should offset the carrying value which is allocated to the goodwill of certain assets group or combinations at first, then it should offset the carrying amount of other assets proportionally according to the proportion of other assets' carrying amount of assets group or combination after goodwill.
The impairment losses cannot be reversed once they are recognized.
15. Long-term prepaid expenses
Long-term prepaid expenses represent expenses incurred that should be borne and amortised over the current and subsequent periods (together of more than one year). Long-term prepaid expenses are amortised using the straight-line method over the expected periods in which benefits are derived.
16. Employee benefits
16.1 Accounting method of short-term employee benefits
In an accounting period in which an employee has rendered service to the Group, the Group recognizes the short-term employee benefits for that service as a liability, and the expenditure incurred for the period is recorded in profit or loss. The employee's welfare incurred is recognized in the profit or loss for the period as well. Non-monetary benefit included in employee's welfare expenses are recorded at fair value.
Payment made by the Group regarding social security contributions for employees such as contributions on medical insurance, work injury insurance and maternity insurance, etc. and payments of housing funds, as well as trade union fund and employee education fund provided in accordance with relevant requirements, are calculated according to prescribed bases and percentages in determining the amount of employee benefits and recognized as relevant liabilities, with a corresponding charge to the profit or loss for the period in the accounting period in which employees provide services.
INDUSTRIAL BANK
160
16.2 Accounting method of post-employment benefits
Termination benefits are classified as defined contribution pension plans and defined benefit plans.
In an accounting period in which an employee has rendered service to the Group, the Group recognises the employee benefits for that service as a liability and included in profit or loss for the period.
For the defined benefit plan, the Group recognizes the obligations arising from such plan based on formula under estimated cumulated welfare method in the period in which employees render service and included in profit or loss for the period. The classifications of the costs are as follows:
• Service costs (including service costs of the period, service costs in the past, and profit and loss).
• Net value of interests from net liabilities or net assets of defined benefit plans (including interest income of planned assets, obligated interest cost of defined benefit plans and interest of influence of assets upper limit).
• The changes of recalculating the net liabilities and net assets of defined benefit plans.
Net interests of service costs and net liabilities and net assets of defined benefit plans are recorded in the profit and loss. The changes of recalculating the net liabilities and net assets of defined benefit plans, including actuarial gains or loss, planned assets yield deducting net value of interests from net liabilities or net assets of defined benefit plans, change rising from upper limit of assets deducting net value of interests from net liabilities or net assets of defined, are recorded in other comprehensive income.
The difference between the present value of defined benefit obligation and the fair value of defined benefit asset is recognized as a net asset or liability of defined benefit plans. If there is surplus, the net assets of defined benefit plans should be measured by the lower of the two: 1. the surplus of defined benefit plans; 2. upper limit of assets.
16.3 Accounting method of termination benefits
In an accounting period in which an employee has rendered service to the Group, a liability for a termination benefit and an expense accordingly are recognized at the earlier of when the Company entity can no longer withdraw the offer of the termination benefit and when the entity recognizes any related restructuring costs.
17. Assets transferred under repurchase agreements
17.1 Financial assets purchased under resale agreements
The financial assets are not recognized in the statements of financial position if they are committed to be resold at a specific price at a specific date in the future. The cost of purchasing such assets is presented under "financial assets purchased under resale agreements" in the statements of financial position. The difference between the purchasing price and reselling price is recognized as interest income during the term of the agreement using the effective interest method.
17.2 Financial assets sold under repurchase agreements
Financial assets sold subject to agreements with a commitment to repurchase at a specific future date and price are not derecognised in the statements of financial position. The proceeds from selling such assets are presented under "financial assets sold under repurchase agreements" in the statements of financial position. The difference between the selling price and repurchasing price is recognised as interest expense during the term of the agreement using the effective interest method.
2018 ANNUAL REPORT
161
18. Provisions
Provisions are recognised when the Group has a present obligation related to a contingency, it is probable that an outflow of economic benefits will be required to settle the obligation, and the amount of the obligation can be measured reliably.
The amount recognised as a provision is the best estimate of the consideration required to settle the present obligation at the balance sheet date, taking into account factors pertaining to a contingency such as the risks, uncertainties and time value of money. Where the effect of the time value of money is material, the amount of the provision is determined by discounting the related future cash outflows.
Where all or some of the expenditure required to settle a provision is expected to be reimbursed by a third party, the reimbursement is recognised as a separate asset only when it is virtually certain that reimbursement will be received, and the amount of reimbursement recognised does not exceed the carrying amount of the provision.
19. Interest income and expense
Interest income and expense is carried at amortized cost of related financial assets and liabilities using the effective interest rate method, and recognized in profit or loss. If the difference between effective interest rate and contract interest rate is an insignificant amount, contract interest rate also can be applied.
20. Fee and commission income
Fee and commission income is recognized on accrual basis when providing related service.
21. Government grants
Government grants are transfer of monetary assets and non-monetary assets from the government to the Group at no consideration, except the capital from the government as the owner. A government grant is recognised only when the Group can comply with the conditions attaching to the grant and the Group will receive the grant.
If a government grant is in the form of a transfer of a monetary asset, it is measured at the amount received or receivable. If a government grant is in the form of a non-monetary asset, it is measured at fair value. If the fair value cannot be reliably determined, it is measured at a nominal amount. A government grant measured at a nominal amount is recognised immediately in profit or loss for the period. Government grants are classified into government grants related to assets and government grants related to income according the subjects required by the Government documents.
A government grant related to an asset is offset against the carrying amount of related asset. For a government grant related to income, if the grant is a compensation for related costs or losses to be incurred in subsequent periods, the grant is recognised as deferred income, and recognised in profit or loss over the periods in which the related costs or losses are recognised. If the grant is a compensation for related expenses or losses already incurred, the grant is recognised immediately in profit or loss for the period.
A government grant related to the Group's daily activities is included in other income according to the economic business substance. A government not related to the Group's daily activities is included in non-operating income and expense.
For the repayment of a government grant already recognized, if the carrying value of related assets is written off upon initial recognition, the carrying value of the assets is adjusted; if there is any related deferred income, the repayment is offset against the carrying amount of the deferred income, and any excess is recognized in profit or loss for the period; if there is no related deferred income, it is recognized immediately in profit or loss for the period.
22. Deferred tax assets/deferred tax liabilities
The income tax expenses include current income tax and deferred income tax.
INDUSTRIAL BANK
162
22.1 Current income tax
At the balance sheet date, current income tax liabilities (or assets) for the current and prior periods are measured at the amount expected to be paid (or recovered) according to the requirements of tax laws.
22.2 Deferred tax assets and deferred tax liabilities
For temporary differences between the carrying amounts of certain assets or liabilities and their tax base, or between the nil carrying amount of those items that are not recognised as assets or liabilities and their tax base that can be determined according to tax laws, deferred tax assets and liabilities are recognised using the balance sheet liability method.
Deferred tax is generally recognised for all temporary differences. Deferred tax assets for deductible temporary differences are recognised to the extent that it is probable that taxable profits will be available against which the deductible temporary differences can be utilised. However, for temporary differences associated with the initial recognition of goodwill and the initial recognition of an asset or liability arising from a transaction (not a business combination) that affects neither the accounting profit nor taxable profits (or deductible losses) at the time of transaction, no deferred tax asset or liability is recognised.
For deductible losses and tax credits that can be carried forward, deferred tax assets are recognised to the extent that it is probable that future taxable profits will be available against which the deductible losses and tax credits can be utilised.
Deferred tax liabilities are recognised for taxable temporary differences associated with investments in subsidiaries and associates, except where the Group is able to control the timing of the reversal of the temporary difference and it is probable that the temporary difference will not reverse in the foreseeable future. Deferred tax assets arising from deductible temporary differences associated with such investments and interests are only recognised to the extent that it is probable that there will be taxable profits against which to utilise the benefits of the temporary differences and they are expected to reverse in the foreseeable future.
At the balance sheet date, deferred tax assets and liabilities are measured at the tax rates, according to tax laws, that are expected to apply in the period in which the asset is realised or the liability is settled.
Current and deferred tax expenses or income are recognised in profit or loss for the period, except when they arise from transactions or events that are directly recognised in other comprehensive income or in shareholders' equity, in which case they are recognised in other comprehensive income or in shareholders' equity; and when they arise from business combinations, in which case they adjust the carrying amount of goodwill.
At the balance sheet date, the carrying amount of deferred tax assets is reviewed and reduced if it is no longer probable that sufficient taxable profits will be available in the future to allow the benefit of deferred tax assets to be utilised. Such reduction in amount is reversed when it becomes probable that sufficient taxable profits will be available.
When the Group has a legal right to settle on a net basis and intends either to settle on a net basis or to realise the assets and settle the liabilities simultaneously, current tax assets and current tax liabilities are offset and presented on a net basis.
When the Group has a legal right to settle current tax assets and liabilities on a net basis, and deferred tax assets and deferred tax liabilities relate to income taxes levied by the same taxation authority on either the same taxable entity or different taxable entities which intend either to settle current tax assets and liabilities on a net basis or to realise the assets and liabilities simultaneously, in each future period in which significant amounts of deferred tax assets or liabilities are expected to be reversed, deferred tax assets and deferred tax liabilities are offset and presented on a net basis.

2018 ANNUAL REPORT
163
23. Fiduciary activities and agent business
The Group acts in a fiduciary activities and agent business as a trustee or an agent for customers. Customers should bear the risk and return generated by such activities. The Group only charges fee and commission. The fiduciary activities and agent business are excluded from the financial statements.
24. Lease
Leases are classified as finance leases whenever the terms of the lease transfer substantially all the risks and rewards of ownership to the lessee. All other leases are classified as operating leases.
24.1 Accounting treatment of operation leases
24.1.1 The Group as lessee under operating leases
Operating lease payments are recognized on a straight-line basis over the term of the relevant lease, and are recorded in profit or loss for the period. Initial direct costs incurred are charged to profit or loss for the period. Contingent rents are charged to profit or loss in the period in which they are actually incurred.
24.1.2 The Group as lessor under operating leases
Rental income from operating leases is recognized in profit or loss on a straight-line basis over the term of the relevant lease. Initial direct costs with more than an insignificant amount are capitalized when incurred, and are recognized in profit or loss on the same basis as rental income over the lease term. Other initial direct costs with an insignificant amount are charged to profit or loss in the period in which they are incurred. Contingent rents are charged to profit or loss in the period in which they actually arise.
24.2 Accounting treatment of finance leases
24.2.1 The Group as lessor under operating leases
The accounting treatments are set out in Note (IV) "11.3 Identification basis, valuation methods and depreciation methods for fixed assets acquired under finance leases".
Unrecognised finance charges are recognised as finance charge for the period using the effective interest method over the lease term. Contingent rents are credited to profit or loss in the period in which they are actually incurred. The net amount of minimum lease payments less unrecognised finance charges is presented as other liabilities.
24.2.2 The Group as lessor under operating leases
At the commencement of the lease term, the aggregate of the minimum lease receivable at the inception of the lease and the initial direct costs is recognised as a finance lease receivable, and the unguaranteed residual value is recorded at the same time. The difference between the aggregate of the minimum lease receivable, the initial direct costs and the unguaranteed residual value, and the aggregate of their present values is recognised as unearned finance income. The net amount of financial lease receivables less unearned finance income is listed in "financial lease receivables" for presentation.
Unearned finance income is recognised as finance income for the period using the effective interest method over the lease term. Contingent rents are credited to profit or loss in the period in which they are actually incurred.

INDUSTRIAL BANK
164
25. Other significant accounting policies and accounting estimates
Foreclosed asset
Foreclosed asset is initially measured at its fair value. At the balance sheet date, foreclosed asset is measured at the lower of carrying amount and net realizable value. The difference by which the net realizable value is lower than the carrying amount of the assets shall be provided for the current period.
On disposal of a foreclosed asset, the difference between (i) income from disposal and (ii) the carrying amount of the foreclosed asset is charged to income from disposal of assets.
If the foreclosed asset is transferred for self-use, it should be measured at the carrying amount at the transfer date. Provision is to taken into account if applicable.
26. Significant changes in accounting policies
The Group has adopted the Notice of the Revised Format of 2018 Financial Statements for General Business Enterprise (Cai Kuai (2018) No. 15, hereinafter referred to as the "Cai Kuai No.15 Document") released by MoF on 15 June 2018 since the preparation of financial statements for the year of 2018. Cai Kuai No.15 Document revised the presenting accounts in the balance sheet and income statement, the presenting contents of the line items of "Other Assets" and "Other Liabilities", and removed the line items of "Interest Receivable" and "Interest Payable". For the above changes in presenting accounts, the Group has re-presented the comparable data for prior year.
V.CRITICAL ACCOUNTING JUDGEMENTS AND KEY ASSUMPTIONS AND UNCERTAINTYIn the application of the Group’s accounting policies, which are described in Note IV, the management is required to make judgements, estimates and assumptions about the carrying amounts of assets and liabilities that are not readily apparent from other sources. The estimates and associated assumptions are based on historical experience and other factors that are considered to be relevant. Actual results may differ from these estimates.
The aforementioned estimates and underlying assumptions are reviewed on an ongoing basis. Revisions to accounting estimates are recognized in the period in which the estimate is revised if the revision affects only that period or in the period of the revision and future periods if the revision affects both current and future periods.
The followings are the key items of financial statements that the Group has made critical judgement, estimation and assumption at the balance sheet date.
1. Impairment on loans and advances to customers and investments classified as receivables
The Group reviews its loan and investments classified as receivables portfolio to assess impairment on a periodic basis. In determining whether an impairment loss should be recognized in profit or loss, the Group makes judgments as to whether there is any observable data indicating that there is an objective evidence of impairment which will have a measurable decrease in the estimated future cash flows from a portfolio of loans and advances and investments classified as receivables. When the decrease may not have been identified individually or the individual loan and investments classified as receivables is not significant, management uses estimates based on historical loss experience on a collective basis with similar credit risk characteristics to assess the impairment loss while estimating expected future cash flows. The methodology and assumptions used for estimating both the amount and timing of future cash flows are reviewed regularly to reduce any differences between loss estimates and actual loss experience.
2018 ANNUAL REPORT
165
2. Fair value of financial instruments
The Group uses various valuation techniques to determine the fair value of financial instruments which are not quoted in an active market. Valuation techniques include the use of discounted cash flows analysis, option pricing models or other valuation methods as appropriate. To the extent practical, models use only observable data; however areas such as credit risk of the Group and the counterparty, volatilities and correlations require management to make estimates. Changes in assumptions about these factors could affect the estimated fair value of financial instruments.
3. Impairment of available-for-sale financial assets
The determination of whether an available-for-sale financial asset is impaired requires significant judgement from the management. In making this judgement, the Group evaluates the duration and extent to which the fair value of an investment of equity instrument is less than its cost; and the financial health of and near-term business outlook for the investee, including factors such as industry and sector performance, technology innovation, credit ratings, delinquency rates and counterparty risk etc.
4. Classification of held-to-maturity investments
The Group classifies non-derivative financial assets with fixed or determinable payments and fixed maturity that the Group’s management has the positive intention and ability to hold to maturity as held-to-maturity investments. This classification requires significant judgement. In making this judgement, the Group evaluates its intention and ability to hold such investments to maturity. If the Group fails to hold these investments to maturity other than for specific circumstances (such as selling an insignificant amount close to maturity), it will be required to reclassify the entire portfolio of held-to-maturity investments as available-for-sale financial assets.
5. Impairment of held-to-maturity investments
The determination of whether a held-to-maturity financial asset is impaired requires significant judgement from the management. Objective evidence that a financial asset or group of assets is impaired includes a breach of contract, such as a default or delinquency in interest or principal payments, etc. In making such judgement, the impact of objective evidence for impairment on expected future cash flows of the investment is taken into account.
The followings are the key items of financial statements that the Group has made critical judgement, estimation and assumption at the balance sheet date. – continued
6. Income taxes
There are certain transactions and activities for which the ultimate tax determination is uncertain during the ordinary course of business. Whether some items can be charged before tax requires assertion from tax authority. Where the final tax outcome of these matters is different from the amounts that were initially estimated, such differences will impact the current income tax and deferred income tax in the period during which such a determination is made.
7. Consolidation of structured entities
For structured entities managed or invested by the Group, assess whether the Group is acting as a principal or an agent so as to evaluate whether the Group has control over the structured entities. The Group determines whether it is acting as a principal or an agent and whether the structured entities should by consolidated by considering the factors including decision scope of asset manager, power of other trust holders, reward from offering management service and the risk exposure to variable return.

INDUSTRIAL BANK
166
8. Derecognition of Transfer of Financial Assets
The Group transfers financial assets in a variety of ways through regular trading, asset securitization, and repurchase agreements in daily operations. The Group needs to make significant judgments and estimates in determining whether a transferred financial asset can be fully or partially derecognized. In assessing and judging, the Group takes into account a wide range of factors and determines whether the conditions for the derecognition of the financial assets are met by using a reasonable model to measure the degree of transfer of risk and return associated with the ownership of financial assets.
VI. TAXATION
1. Enterprise income tax
According to the Corporate Income Tax Law of the People's Republic of China, the income tax of domestic branches of the Bank and the Group's subsidiaries is calculated and settled at the tax rate of 15% or 25% (2017: 0% or 15% or 25%). Therein, the income tax rate for the Group's subsidiary Fujian Clearing Corp. is 15% (2017:15%); and the income tax rate for the Group's subsidiary CIB FINTECH is 25% (2017: 0%).
The income tax of overseas branches of the Bank is calculated in accordance with the local tax rate, and the difference between the overseas tax rate and domestic tax rate is settled by the head office.
The deductible items of enterprise income tax are calculated in accordance with the relevant regulations. Enterprise income tax is prepaid by domestic branches of the Bank and conducted annual filing by the head office.
2. Value-added tax
The value-added tax ("VAT") on sales is calculated using applicable tax rate on the basis of the revenue from sales determined as per tax regulations, and is paid after deducting the VAT on purchases. In accordance with the Notice on Adjustment to VAT Rates (Cai Shui [2018] No. 32) issued by MoF and State Administration of Taxation, the VAT rate for the Group is adjusted from 3%-17% to 3%-16% since 1 May 2018.
According to the Supplementary Notice on Issues relating to VAT Policies on Assets Management Products (Cai Shui [2017] No.2) and Notice on Issues relating to VAT Policies on Assets Management Products (Cai Shui [2017] No.56) issued by MoF and State Administration of Taxation, since 1 January 2018, the manager of asset management products will be the VAT taxpayer for VAT taxable behaviours occurred in the operation of asset management products. And the VAT is levied at the rate of 3% with a provisional application of simple taxation method.
3. City maintenance and construction tax
The Group's city maintenance and construction tax is calculated according to 1% ~ 7% of VAT.
4. Education surcharge
The Group's education surcharge and local education surcharge is calculated according to 3% ~ 5% of VAT.

2018 ANNUAL REPORT
167
VII. CONSOLIDATION SCOPE
1. Details of the Bank’s principal subsidiaries included in the scope of consolidation are set out as follows:
Key subsidiaries Main business place/ Place of
registrationBusiness nature
Registered capital
(RMB in Million)
Total shareholding by the Group
31/12/2018 31/12/2017
Direct (%)
Indirect (%)
Direct (%)
Indirect (%)
Industrial BankFinancial Leasing Co., Ltd. Tianjin Financial leasing 9,000 100 - 100 -
China Industrial International Trust Limited
Fuzhou Trust 5,000 73 - 73 -
CIB FundManagement Co., Ltd. (1) Fuzhou Fund
management 1,200 90 - 90 -
Industrial Consumer Finance Co., Ltd.(1) Quanzhou Consumer
finance 1,200 66 - 66-
CIIT Asset ManagementCo., Ltd. (2) (3) Shanghai
Assets management,
equity investment, industrial
investment, investment
management and consulting
3,400 -100 - 100
Industrial Wealth Asset Management Co., Ltd (2) Shanghai Assets
management 780 - 100 - 100
Industrial Futures Co., Ltd. (2) Ningbo
Merchandise, financial futures investment and
consulting service
500 - 100 - 100

INDUSTRIAL BANK
168
(1) In February 2018, the Bank increased the registered capital of its shareholding subsidiary CIB Fund Management Co., Ltd. by RMB450 million in proportion to its shareholding. After the capital increase, the registered capital of CIB Fund Management Co., Ltd. became RMB1,200 million. In June 2018, the Bank increased the registered capital of its holding subsidiary Industrial Consumer Finance Co., Ltd. by RMB330 million in proportion to its shareholding. After the capital increase, the registered capital of Industrial Consumer Finance Co., Ltd. became RMB1,200 million.
(2) The companies are the subsidiaries of the Bank’s holding subsidiaries.
(3) In June 2018, the Bank's holding subsidiary China Industrial International Trust Limited increased the registered capital of its wholly-owned subsidiary China Industrial Asset Management Limited by RMB300 million. After the capital increase, the registered capital of China Industrial Asset Management Limited is RMB3,400 million, with 100% shares held by China Industrial International Trust Limited.
2. Refer to No. VIII 48 for information of consolidated structure entities
3. Foreign exchange rate of principle items in financial statements of overseas operating entities
The operating entity of the Group converts the financial statement from foreign currency to RMB based on the following method: all assets and liabilities in the statement of financial position should be converted by spot rate at balance sheet date; equity of shareholders except for the retained earnings should be converted by spot rate when occurs; all subjects in the statements of comprehensive income and subjects which reflect the accrual distributed profit should be converted by approximate spot rate when occurs.
The exchange rate of USD, JPY, EUR, HKD, and GBP to RMB should be determined by the middle rate published by China's State Administration of Foreign Exchange (the "SAFE"). The exchange rate of other currency to RMB should be calculated by the benchmark rate of USD to RMB and rate of USD to other currency offered by SAFE.

2018 ANNUAL REPORT
169
VIII. NOTES TO ITEMS IN THE FINANCIAL STATEMENTS
1. CASH AND BALANCES WITH CENTRAL BANK
UNIT: RMB Million
The Group The Bank
31/12/2018 31/12/2017 31/12/2018 31/12/2017
Cash 5,191 5,535 5,191 5,535
Mandatory reserves (1) 391,137 444,091 391,131 444,082
Surplus deposit reserves (2) 77,820 13,989 77,820 13,987
Other reserve (3) 1,633 2,788 1,633 2,788
Total 475,781 466,403 475,775 466,392
(1) The domestic institution of the Bank places mandatory reserves mainly with the PBOC as required, including RMB reserves and foreign reserves. These reserves are not available for the Group's daily operations and can't be transferred or used without the PBOC's approval. General deposit generates from organizations deposit, non-financial-budget deposit, individual deposit, enterprise deposit, net trust funds and other deposit. On 31 December 2018, the ratio of the Bank's RMB reserves is 12% (31 December 2017: 15%), the ratio of foreign reserves is 5% (31 December 2017: 5%). According to related regulations from the PBOC, foreign reserves are non-interest bearing. The Group's subsidies' RMB reserve deposit ratio is in accordance with regulations of PBOC. Deposit ratio of mandatory reserve in Hong Kong branch is in accordance with regulations from local regulators.
(2) Surplus reserves are reserve in excess of mandatory reserve maintained with the PBOC mainly for the purpose of clearing, and transferring, etc.
(3) The majority of other deposits are the fiscal deposits placed with the Central Bank. Fiscal deposit at Central Bank refers to the fiscal deposit at PBOC by the Bank according to regulations, including the Bank's agent central budgetary revenues, local treasury deposits, etc. The fiscal deposits placed with the PBOC of institutions in mainland China are non-interest bearing.
2. DEPOSITS WITH BANKS AND OTHER FINANCIAL INSTITUTIONS
UNIT: RMB Million
The Group The Bank
31/12/2018 31/12/2017 31/12/2018 31/12/2017
Deposits with:
Domestic banks 29,316 61,425 24,108 51,427
Other domestic financial institutions 5,236 4,232 5,010 4,149
Overseas banks 18,694 11,918 18,694 11,918
Other overseas financial institutions 73 - 73 -
Subtotal 53,319 77,575 47,885 67,494
Less: Allowance for impairment losses (16) (16) (16) (16)
Net value 53,303 77,559 47,869 67,478
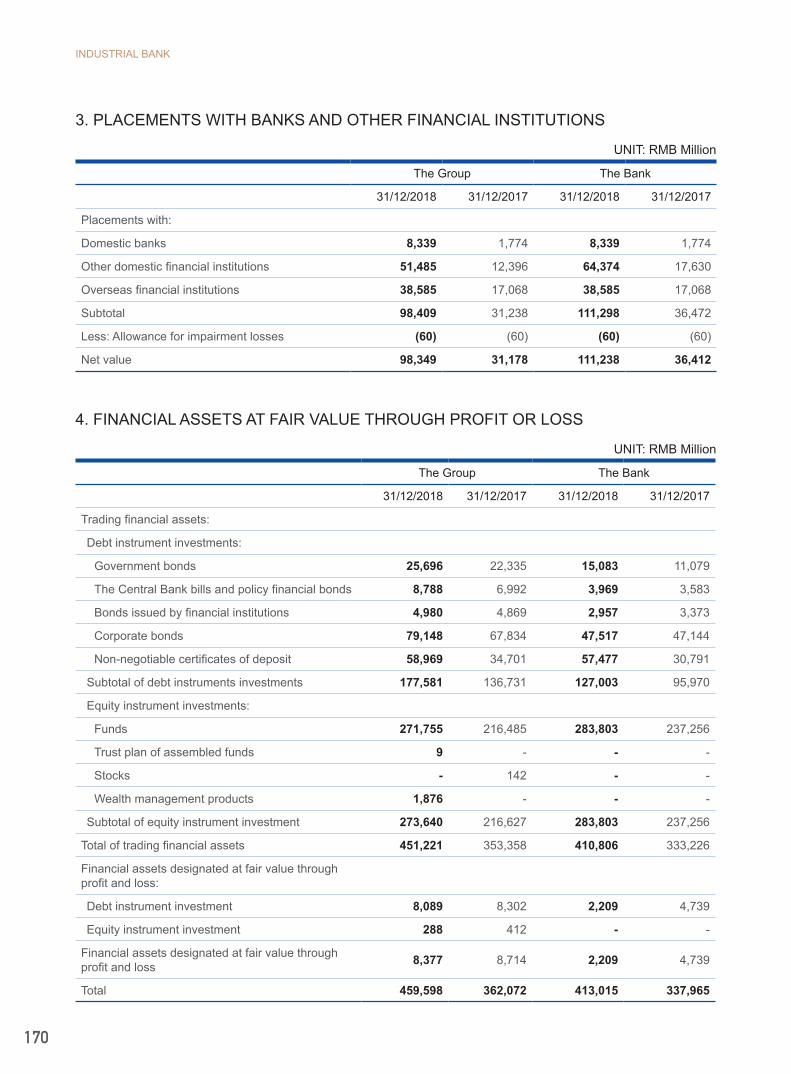
INDUSTRIAL BANK
170
3. PLACEMENTS WITH BANKS AND OTHER FINANCIAL INSTITUTIONS
UNIT: RMB Million
The Group The Bank
31/12/2018 31/12/2017 31/12/2018 31/12/2017
Placements with:
Domestic banks 8,339 1,774 8,339 1,774
Other domestic financial institutions 51,485 12,396 64,374 17,630
Overseas financial institutions 38,585 17,068 38,585 17,068
Subtotal 98,409 31,238 111,298 36,472
Less: Allowance for impairment losses (60) (60) (60) (60)
Net value 98,349 31,178 111,238 36,412
4. FINANCIAL ASSETS AT FAIR VALUE THROUGH PROFIT OR LOSS
UNIT: RMB Million
The Group The Bank
31/12/2018 31/12/2017 31/12/2018 31/12/2017
Trading financial assets:
Debt instrument investments:
Government bonds 25,696 22,335 15,083 11,079
The Central Bank bills and policy financial bonds 8,788 6,992 3,969 3,583
Bonds issued by financial institutions 4,980 4,869 2,957 3,373
Corporate bonds 79,148 67,834 47,517 47,144
Non-negotiable certificates of deposit 58,969 34,701 57,477 30,791
Subtotal of debt instruments investments 177,581 136,731 127,003 95,970
Equity instrument investments:
Funds 271,755 216,485 283,803 237,256
Trust plan of assembled funds 9 - - -
Stocks - 142 - -
Wealth management products 1,876 - - -
Subtotal of equity instrument investment 273,640 216,627 283,803 237,256
Total of trading financial assets 451,221 353,358 410,806 333,226
Financial assets designated at fair value through profit and loss:
Debt instrument investment 8,089 8,302 2,209 4,739
Equity instrument investment 288 412 - -
Financial assets designated at fair value through profit and loss 8,377 8,714 2,209 4,739
Total 459,598 362,072 413,015 337,965
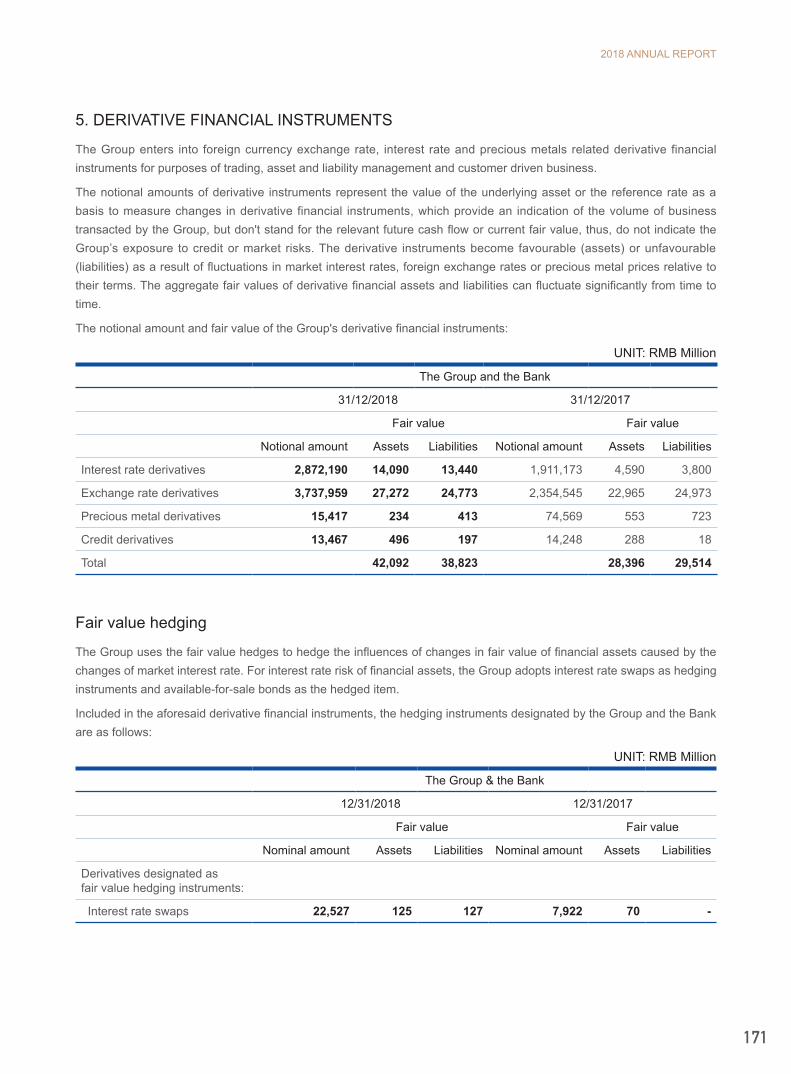
2018 ANNUAL REPORT
171
5. DERIVATIVE FINANCIAL INSTRUMENTS
The Group enters into foreign currency exchange rate, interest rate and precious metals related derivative financial instruments for purposes of trading, asset and liability management and customer driven business.
The notional amounts of derivative instruments represent the value of the underlying asset or the reference rate as a basis to measure changes in derivative financial instruments, which provide an indication of the volume of business transacted by the Group, but don't stand for the relevant future cash flow or current fair value, thus, do not indicate the Group’s exposure to credit or market risks. The derivative instruments become favourable (assets) or unfavourable (liabilities) as a result of fluctuations in market interest rates, foreign exchange rates or precious metal prices relative to their terms. The aggregate fair values of derivative financial assets and liabilities can fluctuate significantly from time to time.
The notional amount and fair value of the Group's derivative financial instruments:
UNIT: RMB Million
The Group and the Bank
31/12/2018 31/12/2017
Fair value Fair value
Notional amount Assets Liabilities Notional amount Assets Liabilities
Interest rate derivatives 2,872,190 14,090 13,440 1,911,173 4,590 3,800
Exchange rate derivatives 3,737,959 27,272 24,773 2,354,545 22,965 24,973
Precious metal derivatives 15,417 234 413 74,569 553 723
Credit derivatives 13,467 496 197 14,248 288 18
Total 42,092 38,823 28,396 29,514
Fair value hedging
The Group uses the fair value hedges to hedge the influences of changes in fair value of financial assets caused by the changes of market interest rate. For interest rate risk of financial assets, the Group adopts interest rate swaps as hedging instruments and available-for-sale bonds as the hedged item.
Included in the aforesaid derivative financial instruments, the hedging instruments designated by the Group and the Bank are as follows:
UNIT: RMB Million
The Group & the Bank
12/31/2018 12/31/2017
Fair value Fair value
Nominal amount Assets Liabilities Nominal amount Assets Liabilities
Derivatives designated as fair value hedging instruments:
Interest rate swaps 22,527 125 127 7,922 70 -
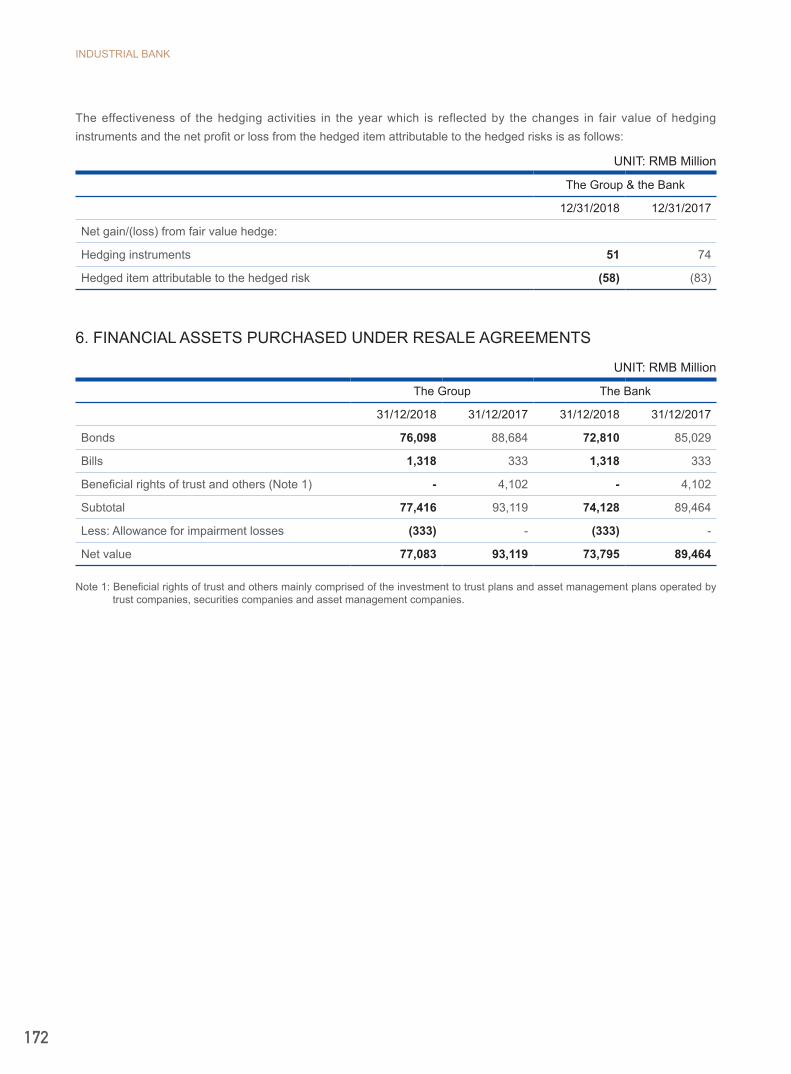
INDUSTRIAL BANK
172
The effectiveness of the hedging activities in the year which is reflected by the changes in fair value of hedging instruments and the net profit or loss from the hedged item attributable to the hedged risks is as follows:
UNIT: RMB Million
The Group & the Bank
12/31/2018 12/31/2017
Net gain/(loss) from fair value hedge:
Hedging instruments 51 74
Hedged item attributable to the hedged risk (58) (83)
6. FINANCIAL ASSETS PURCHASED UNDER RESALE AGREEMENTS
UNIT: RMB Million
The Group The Bank
31/12/2018 31/12/2017 31/12/2018 31/12/2017
Bonds 76,098 88,684 72,810 85,029
Bills 1,318 333 1,318 333
Beneficial rights of trust and others (Note 1) - 4,102 - 4,102
Subtotal 77,416 93,119 74,128 89,464
Less: Allowance for impairment losses (333) - (333) -
Net value 77,083 93,119 73,795 89,464
Note 1: Beneficial rights of trust and others mainly comprised of the investment to trust plans and asset management plans operated by trust companies, securities companies and asset management companies.

2018 ANNUAL REPORT
173
7. LOANS AND ADVANCES TO CUSTOMERS
(1) Analysis of loans and advances to customers by personal and corporate:
UNIT: RMB Million
The Group The Bank
31/12/2018 31/12/2017 31/12/2018 31/12/2017
Personal loans and advances
Residential and business mortgage loans 749,360 603,047 749,360 603,047
Credit cards 271,960 186,256 271,960 186,256
Others 145,084 121,521 124,390 111,651
Subtotal 1,166,404 910,824 1,145,710 900,954
Corporate loans and advances
Loans and advances 1,608,207 1,482,362 1,611,711 1,484,432
Discounted bills 159,471 37,509 159,471 37,509
Subtotal 1,767,678 1,519,871 1,771,182 1,521,941
Gross loans and advances 2,934,082 2,430,695 2,916,892 2,422,895
Less: Allowance for impairment losses (95,637) (81,864) (94,817) (81,498)
- Individually assessed (20,798) (16,378) (20,798) (16,378)
- Collectively assessed (74,839) (65,486) (74,019) (65,120)
Loans and advances to customers 2,838,445 2,348,831 2,822,075 2,341,397
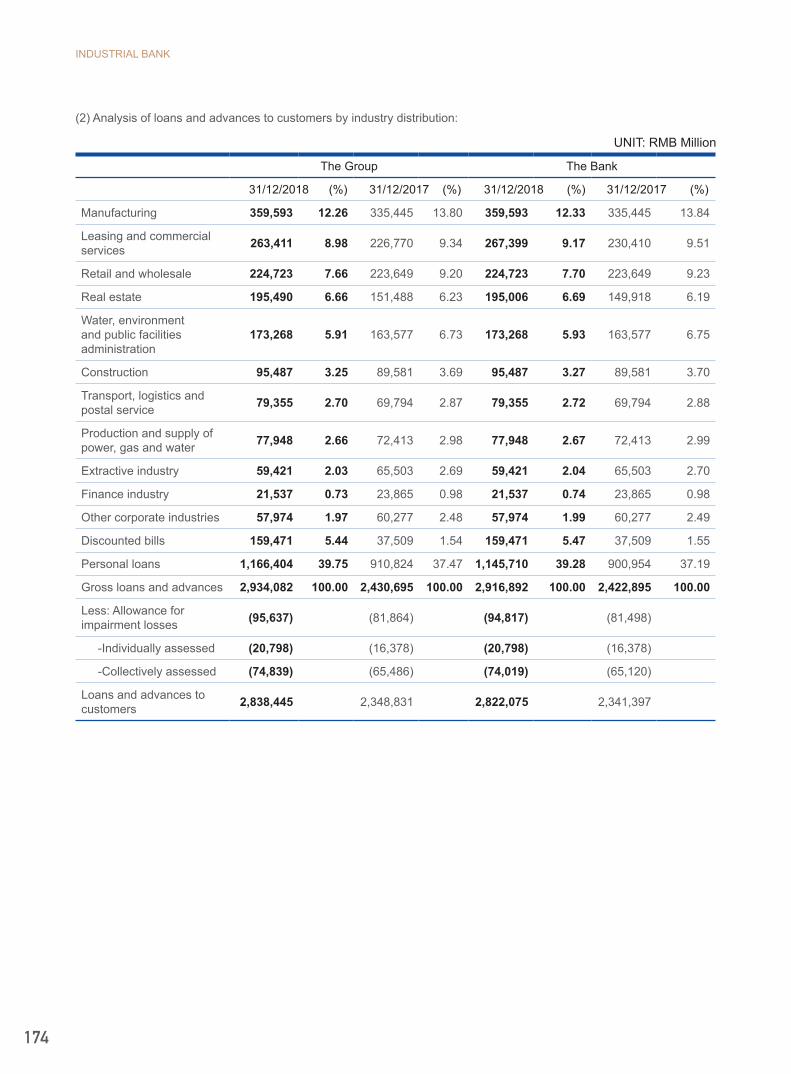
INDUSTRIAL BANK
174
(2) Analysis of loans and advances to customers by industry distribution:
UNIT: RMB Million
The Group The Bank
31/12/2018 (%) 31/12/2017 (%) 31/12/2018 (%) 31/12/2017 (%)
Manufacturing 359,593 12.26 335,445 13.80 359,593 12.33 335,445 13.84
Leasing and commercial services 263,411 8.98 226,770 9.34 267,399 9.17 230,410 9.51
Retail and wholesale 224,723 7.66 223,649 9.20 224,723 7.70 223,649 9.23
Real estate 195,490 6.66 151,488 6.23 195,006 6.69 149,918 6.19
Water, environment and public facilities administration
173,268 5.91 163,577 6.73 173,268 5.93 163,577 6.75
Construction 95,487 3.25 89,581 3.69 95,487 3.27 89,581 3.70
Transport, logistics and postal service 79,355 2.70 69,794 2.87 79,355 2.72 69,794 2.88
Production and supply of power, gas and water 77,948 2.66 72,413 2.98 77,948 2.67 72,413 2.99
Extractive industry 59,421 2.03 65,503 2.69 59,421 2.04 65,503 2.70
Finance industry 21,537 0.73 23,865 0.98 21,537 0.74 23,865 0.98
Other corporate industries 57,974 1.97 60,277 2.48 57,974 1.99 60,277 2.49
Discounted bills 159,471 5.44 37,509 1.54 159,471 5.47 37,509 1.55
Personal loans 1,166,404 39.75 910,824 37.47 1,145,710 39.28 900,954 37.19
Gross loans and advances 2,934,082 100.00 2,430,695 100.00 2,916,892 100.00 2,422,895 100.00
Less: Allowance for impairment losses (95,637) (81,864) (94,817) (81,498)
-Individually assessed (20,798) (16,378) (20,798) (16,378)
-Collectively assessed (74,839) (65,486) (74,019) (65,120)
Loans and advances to customers 2,838,445 2,348,831 2,822,075 2,341,397
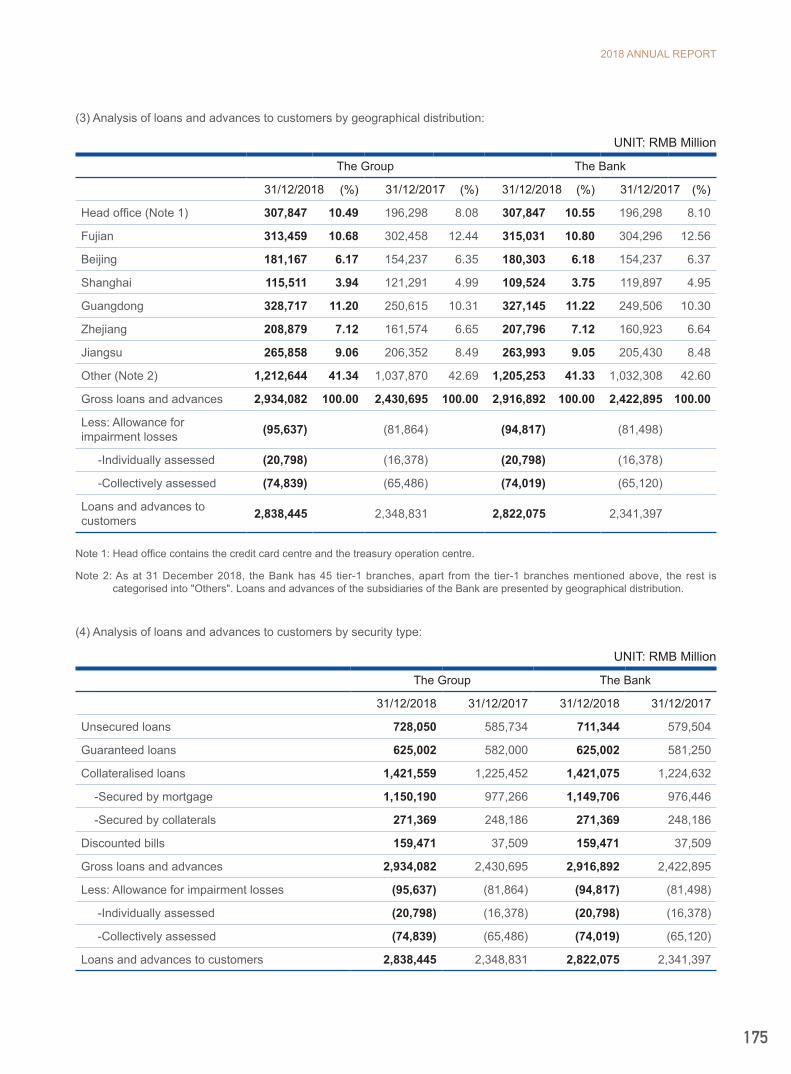
2018 ANNUAL REPORT
175
(3) Analysis of loans and advances to customers by geographical distribution:
UNIT: RMB Million
The Group The Bank
31/12/2018 31/12/2017 31/12/2018 31/12/2017
Head office (Note 1) 307,847 10.49 196,298 8.08 307,847 10.55 196,298 8.10
Fujian 313,459 10.68 302,458 12.44 315,031 10.80 304,296 12.56
Beijing 181,167 6.17 154,237 6.35 180,303 6.18 154,237 6.37
Shanghai 115,511 3.94 121,291 4.99 109,524 3.75 119,897 4.95
Guangdong 328,717 11.20 250,615 10.31 327,145 11.22 249,506 10.30
Zhejiang 208,879 7.12 161,574 6.65 207,796 7.12 160,923 6.64
Jiangsu 265,858 9.06 206,352 8.49 263,993 9.05 205,430 8.48
Other (Note 2) 1,212,644 41.34 1,037,870 42.69 1,205,253 41.33 1,032,308 42.60
Gross loans and advances 2,934,082 100.00 2,430,695 100.00 2,916,892 100.00 2,422,895 100.00
Less: Allowance for impairment losses (95,637) (81,864) (94,817) (81,498)
-Individually assessed (20,798) (16,378) (20,798) (16,378)
-Collectively assessed (74,839) (65,486) (74,019) (65,120)
Loans and advances to customers 2,838,445 2,348,831 2,822,075 2,341,397
Note 1: Head office contains the credit card centre and the treasury operation centre.
Note 2: As at 31 December 2018, the Bank has 45 tier-1 branches, apart from the tier-1 branches mentioned above, the rest is categorised into "Others". Loans and advances of the subsidiaries of the Bank are presented by geographical distribution.
(4) Analysis of loans and advances to customers by security type:
UNIT: RMB Million
The Group The Bank
31/12/2018 31/12/2017 31/12/2018 31/12/2017
Unsecured loans 728,050 585,734 711,344 579,504
Guaranteed loans 625,002 582,000 625,002 581,250
Collateralised loans 1,421,559 1,225,452 1,421,075 1,224,632
-Secured by mortgage 1,150,190 977,266 1,149,706 976,446
-Secured by collaterals 271,369 248,186 271,369 248,186
Discounted bills 159,471 37,509 159,471 37,509
Gross loans and advances 2,934,082 2,430,695 2,916,892 2,422,895
Less: Allowance for impairment losses (95,637) (81,864) (94,817) (81,498)
-Individually assessed (20,798) (16,378) (20,798) (16,378)
-Collectively assessed (74,839) (65,486) (74,019) (65,120)
Loans and advances to customers 2,838,445 2,348,831 2,822,075 2,341,397
(%) (%) (%) (%)

INDUSTRIAL BANK
176
(5) O
verd
ue lo
ans
UN
IT: R
MB
Mill
ion
The
Gro
up
31/1
2/20
1831
/12/
2017
1-90
day
s(in
clud
ing
90
days
)
90-3
60 d
ays
(incl
udin
g 36
0 da
ys)
360
days
to
3 ye
ars
(incl
udin
g 3
year
s)
over
3
year
sTo
tal
1-90
day
s(in
clud
ing
90 d
ays)
90-3
60 d
ays
(incl
udin
g 36
0 da
ys)
360
days
to
3 ye
ars
(incl
udin
g 3
year
s)
over
3 ye
ars
Tota
l
Uns
ecur
ed lo
ans
5,49
84,
242
619
6010
,419
2,54
62,
742
546
615,
895
Gua
rant
eed
loan
s8,
219
10,7
792,
444
875
22,3
174,
732
3,80
23,
927
1,16
113
,622
Col
late
ralis
ed lo
ans
9,
206
10,2
106,
332
835
26,5
836,
542
5,72
46,
490
329
19,0
85
-Sec
ured
by
mor
tgag
e7,
556
10,1
626,
213
792
24,7
236,
380
5,64
36,
228
225
18,4
76
-Sec
ured
by
colla
tera
ls1,
650
4811
943
1,86
016
281
262
104
609
Tota
l22
,923
25,2
319,
395
1,77
059
,319
13,8
2012
,268
10,9
631,
551
38,6
02
UN
IT: R
MB
Mill
ion
The
Ban
k
31/1
2/20
1831
/12/
2017
1-90
day
s (in
clud
ing
90
days
)
90-3
60 d
ays
(incl
udin
g 36
0 da
ys)
360
days
to
3 y
ears
(in
clud
ing
3 ye
ars)
over
3
year
sTo
tal
1-90
day
s (in
clud
ing
90 d
ays)
90-3
60 d
ays
(incl
udin
g 36
0 da
ys)
360
days
to
3 y
ears
(in
clud
ing
3 ye
ars)
over
3 ye
ars
Tota
l
Uns
ecur
ed lo
ans
5,20
73,
904
492
599,
662
2,35
02,
629
444
615,
484
Gua
rant
eed
loan
s8,
219
10,7
792,
444
875
22,3
174,
732
3,80
23,
927
1,16
113
,622
Col
late
ralis
ed lo
ans
9,
206
10,2
106,
332
835
26,5
836,
542
5,72
46,
490
329
19,0
85
-Sec
ured
by
mor
tgag
e7,
556
10,1
626,
213
792
24,7
236,
380
5,64
36,
228
225
18,4
76
-Sec
ured
by
colla
tera
ls1,
650
4811
943
1,86
016
281
262
104
609
Tota
l22
,632
24,8
939,
268
1,76
958
,562
13,6
2412
,155
10,8
611,
551
38,1
91
Not
e: T
he lo
an w
ill b
e ca
tego
rized
into
ove
rdue
whe
n pr
inci
pal o
r int
eres
t is
over
due
for o
ne d
ay.

2018 ANNUAL REPORT
177
(6) Allowance for impairment losses on loans and advances to customers
UNIT: RMB Million
The Group2018 2017
Individually Collectively Total Individually Collectively Total
Opening balance 16,378 65,486 81,864 12,669 59,779 72,448
Charge for the year 22,689 15,378 38,067 22,313 6,308 28,621
Write-off/Transfer out (21,099) (6,999) (28,098) (20,482) (1,047) (21,529)
-Recoveries of loans and advances written off in previous years 3,876 1,133 5,009 2,837 707 3,544
-Unwinding of discount on allowance (1,046) (241) (1,287) (959) (214) (1,173)
Fluctuation in exchange rate - 82 82 - (47) (47)
Closing balance 20,798 74,839 95,637 16,378 65,486 81,864
UNIT: RMB Million
The Bank2018 2017
Individually Collectively Total Individually Collectively Total
Opening balance 16,378 65,120 81,498 12,669 59,594 72,263
Charge for the year 22,689 14,737 37,426 22,313 6,116 28,429
Write-off/Transfer out (21,099) (6,811) (27,910) (20,482) (1,031) (21,513)
-Recoveries of loans and advances written off in previous years 3,876 1,132 5,008 2,837 702 3,539
-Unwinding of discount on allowance (1,046) (241) (1,287) (959) (214) (1,173)
Fluctuation in exchange rate - 82 82 - (47) (47)
Closing balance 20,798 74,019 94,817 16,378 65,120 81,498
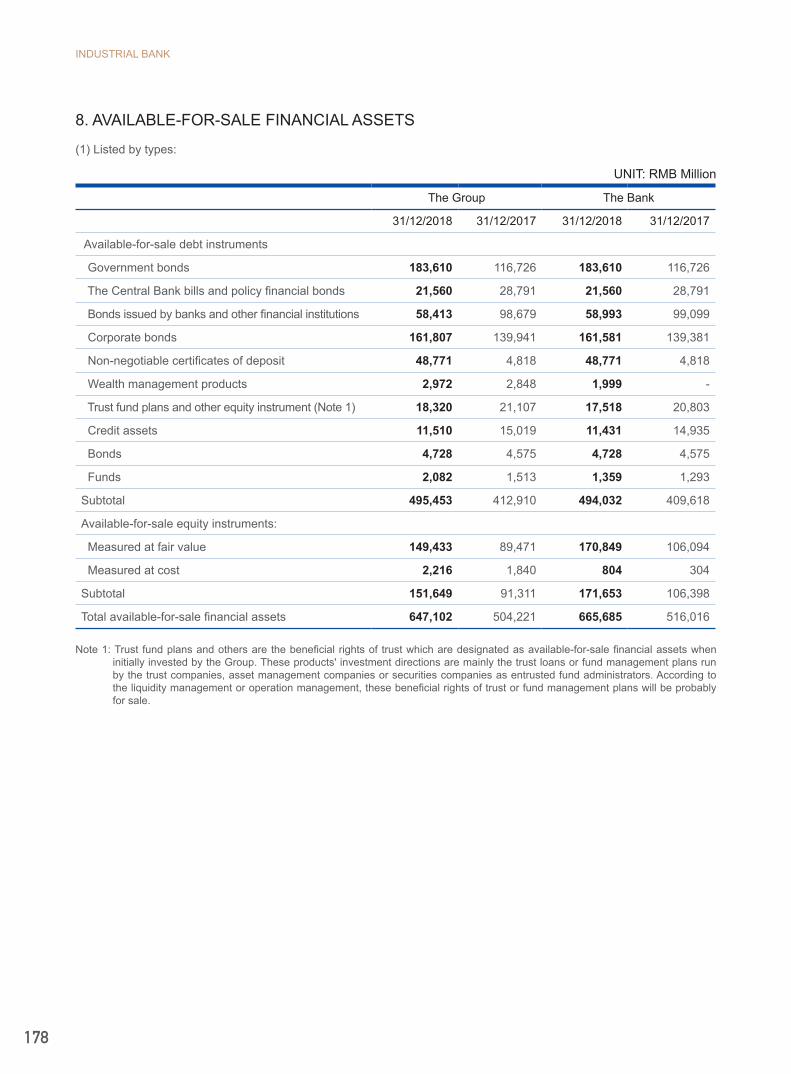
INDUSTRIAL BANK
178
8. AVAILABLE-FOR-SALE FINANCIAL ASSETS
(1) Listed by types:
UNIT: RMB Million
The Group The Bank
31/12/2018 31/12/2017 31/12/2018 31/12/2017
Available-for-sale debt instruments
Government bonds 183,610 116,726 183,610 116,726
The Central Bank bills and policy financial bonds 21,560 28,791 21,560 28,791
Bonds issued by banks and other financial institutions 58,413 98,679 58,993 99,099
Corporate bonds 161,807 139,941 161,581 139,381
Non-negotiable certificates of deposit 48,771 4,818 48,771 4,818
Wealth management products 2,972 2,848 1,999 -
Trust fund plans and other equity instrument (Note 1) 18,320 21,107 17,518 20,803
Credit assets 11,510 15,019 11,431 14,935
Bonds 4,728 4,575 4,728 4,575
Funds 2,082 1,513 1,359 1,293
Subtotal 495,453 412,910 494,032 409,618
Available-for-sale equity instruments:
Measured at fair value 149,433 89,471 170,849 106,094
Measured at cost 2,216 1,840 804 304
Subtotal 151,649 91,311 171,653 106,398
Total available-for-sale financial assets 647,102 504,221 665,685 516,016
Note 1: Trust fund plans and others are the beneficial rights of trust which are designated as available-for-sale financial assets when initially invested by the Group. These products' investment directions are mainly the trust loans or fund management plans run by the trust companies, asset management companies or securities companies as entrusted fund administrators. According to the liquidity management or operation management, these beneficial rights of trust or fund management plans will be probably for sale.
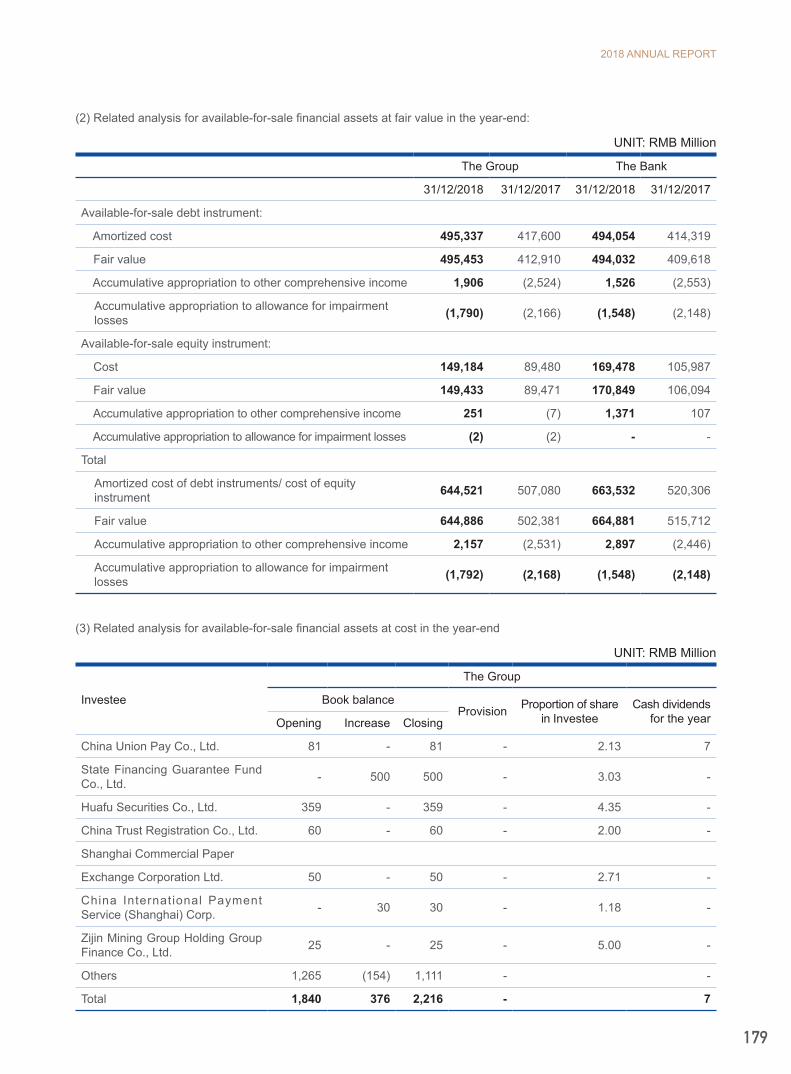
2018 ANNUAL REPORT
179
(2) Related analysis for available-for-sale financial assets at fair value in the year-end:
UNIT: RMB Million
The Group The Bank
31/12/2018 31/12/2017 31/12/2018 31/12/2017
Available-for-sale debt instrument:
Amortized cost 495,337 417,600 494,054 414,319
Fair value 495,453 412,910 494,032 409,618
Accumulative appropriation to other comprehensive income 1,906 (2,524) 1,526 (2,553)
Accumulative appropriation to allowance for impairment losses (1,790) (2,166) (1,548) (2,148)
Available-for-sale equity instrument:
Cost 149,184 89,480 169,478 105,987
Fair value 149,433 89,471 170,849 106,094
Accumulative appropriation to other comprehensive income 251 (7) 1,371 107
Accumulative appropriation to allowance for impairment losses (2) (2) - -
Total
Amortized cost of debt instruments/ cost of equity instrument 644,521 507,080 663,532 520,306
Fair value 644,886 502,381 664,881 515,712
Accumulative appropriation to other comprehensive income 2,157 (2,531) 2,897 (2,446)
Accumulative appropriation to allowance for impairment losses (1,792) (2,168) (1,548) (2,148)
(3) Related analysis for available-for-sale financial assets at cost in the year-end
UNIT: RMB Million
Investee
The Group
Book balanceProvision Proportion of share
in InvesteeCash dividends
for the yearOpening Increase Closing
China Union Pay Co., Ltd. 81 - 81 - 2.13 7
State Financing Guarantee Fund Co., Ltd. - 500 500 - 3.03 -
Huafu Securities Co., Ltd. 359 - 359 - 4.35 -
China Trust Registration Co., Ltd. 60 - 60 - 2.00 -
Shanghai Commercial Paper
Exchange Corporation Ltd. 50 - 50 - 2.71 -
China International Payment Service (Shanghai) Corp. - 30 30 - 1.18 -
Zijin Mining Group Holding Group Finance Co., Ltd. 25 - 25 - 5.00 -
Others 1,265 (154) 1,111 - -
Total 1,840 376 2,216 - 7
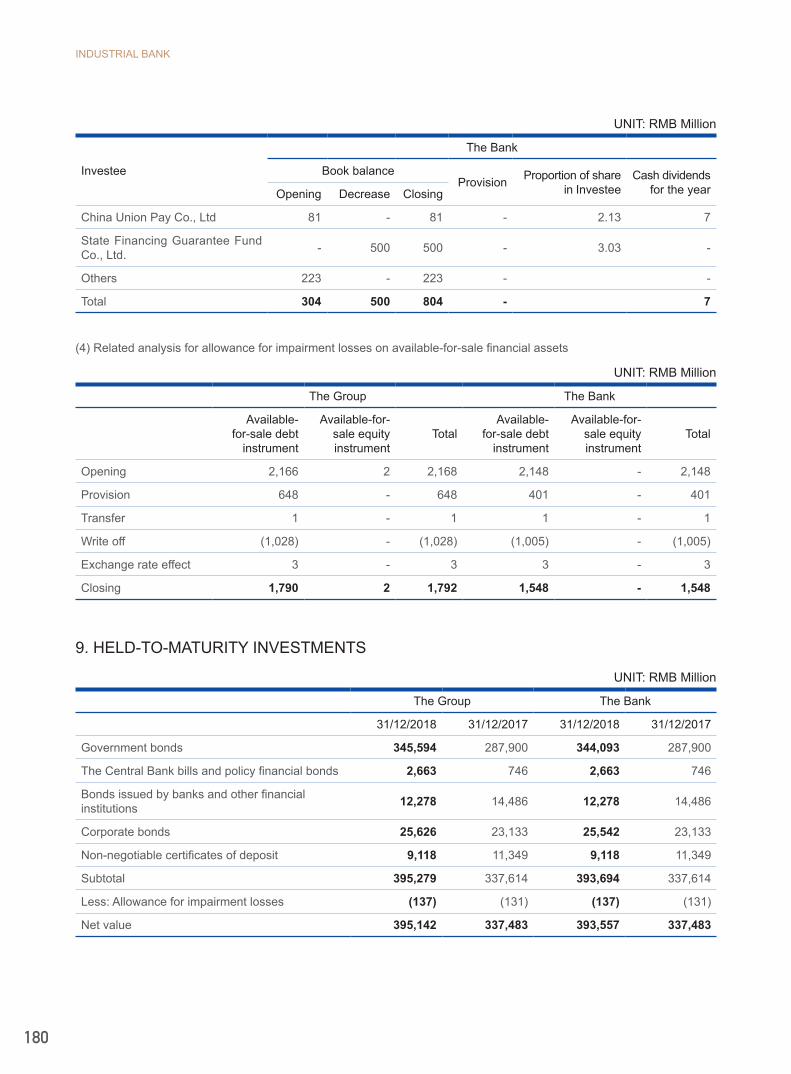
INDUSTRIAL BANK
180
UNIT: RMB Million
Investee
The Bank
Book balanceProvision Proportion of share
in InvesteeCash dividends
for the yearOpening Decrease Closing
China Union Pay Co., Ltd 81 - 81 - 2.13 7
State Financing Guarantee Fund Co., Ltd. - 500 500 - 3.03 -
Others 223 - 223 - -
Total 304 500 804 - 7
(4) Related analysis for allowance for impairment losses on available-for-sale financial assets
UNIT: RMB Million
The Group The Bank
Available-for-sale debt
instrument
Available-for-sale equity instrument
TotalAvailable-
for-sale debt instrument
Available-for-sale equity instrument
Total
Opening 2,166 2 2,168 2,148 - 2,148
Provision 648 - 648 401 - 401
Transfer 1 - 1 1 - 1
Write off (1,028) - (1,028) (1,005) - (1,005)
Exchange rate effect 3 - 3 3 - 3
Closing 1,790 2 1,792 1,548 - 1,548
9. HELD-TO-MATURITY INVESTMENTS
UNIT: RMB Million
The Group The Bank
31/12/2018 31/12/2017 31/12/2018 31/12/2017
Government bonds 345,594 287,900 344,093 287,900
The Central Bank bills and policy financial bonds 2,663 746 2,663 746
Bonds issued by banks and other financial institutions 12,278 14,486 12,278 14,486
Corporate bonds 25,626 23,133 25,542 23,133
Non-negotiable certificates of deposit 9,118 11,349 9,118 11,349
Subtotal 395,279 337,614 393,694 337,614
Less: Allowance for impairment losses (137) (131) (137) (131)
Net value 395,142 337,483 393,557 337,483
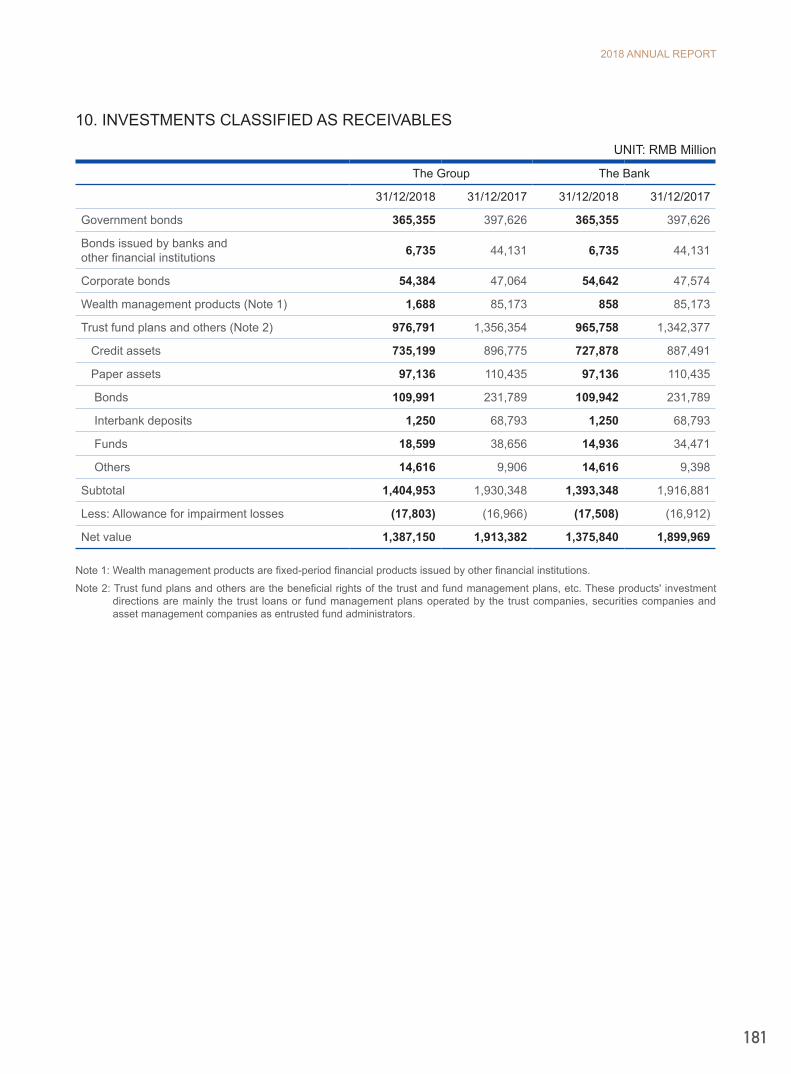
2018 ANNUAL REPORT
181
10. INVESTMENTS CLASSIFIED AS RECEIVABLES
UNIT: RMB Million
The Group The Bank
31/12/2018 31/12/2017 31/12/2018 31/12/2017
Government bonds 365,355 397,626 365,355 397,626
Bonds issued by banks and other financial institutions 6,735 44,131 6,735 44,131
Corporate bonds 54,384 47,064 54,642 47,574
Wealth management products (Note 1) 1,688 85,173 858 85,173
Trust fund plans and others (Note 2) 976,791 1,356,354 965,758 1,342,377
Credit assets 735,199 896,775 727,878 887,491
Paper assets 97,136 110,435 97,136 110,435
Bonds 109,991 231,789 109,942 231,789
Interbank deposits 1,250 68,793 1,250 68,793
Funds 18,599 38,656 14,936 34,471
Others 14,616 9,906 14,616 9,398
Subtotal 1,404,953 1,930,348 1,393,348 1,916,881
Less: Allowance for impairment losses (17,803) (16,966) (17,508) (16,912)
Net value 1,387,150 1,913,382 1,375,840 1,899,969
Note 1: Wealth management products are fixed-period financial products issued by other financial institutions.
Note 2: Trust fund plans and others are the beneficial rights of the trust and fund management plans, etc. These products' investment directions are mainly the trust loans or fund management plans operated by the trust companies, securities companies and asset management companies as entrusted fund administrators.

INDUSTRIAL BANK
182
11. FINANCE LEASE RECEIVABLES
Set out by nature:
UNIT: RMB Million
The Group
12/31/2018 12/31/2017
Finance lease receivables 122,155 120,070
Less: unrealized financing income (13,352) (13,153)
Subtotal 108,803 106,917
Less: Allowance for impairment losses (4,550) (3,422)
- Individually assessed (1,476) (355)
- Collectively assessed (3,074) (3,067)
Net value 104,253 103,495
List as follows:
UNIT: RMB Million
12/31/2018 12/31/2017
1st year subsequent to the balance sheet date 39,484 36,028
2nd year subsequent to the balance sheet date 31,516 27,799
3rd year subsequent to the balance sheet date 21,413 23,177
Subsequent periods 29,742 33,066
Subtotal 122,155 120,070
Unrealized financing income (13,352) (13,153)
Subtotal 108,803 106,917
Less: Allowance for impairment losses (4,550) (3,422)
- Individually assessed (1,476) (355)
- Collectively assessed (3,074) (3,067)
Net value 104,253 103,495
- Finance lease receivables due less than 1 year 33,698 32,921
- Finance lease receivables due more than 1 year 70,555 70,574
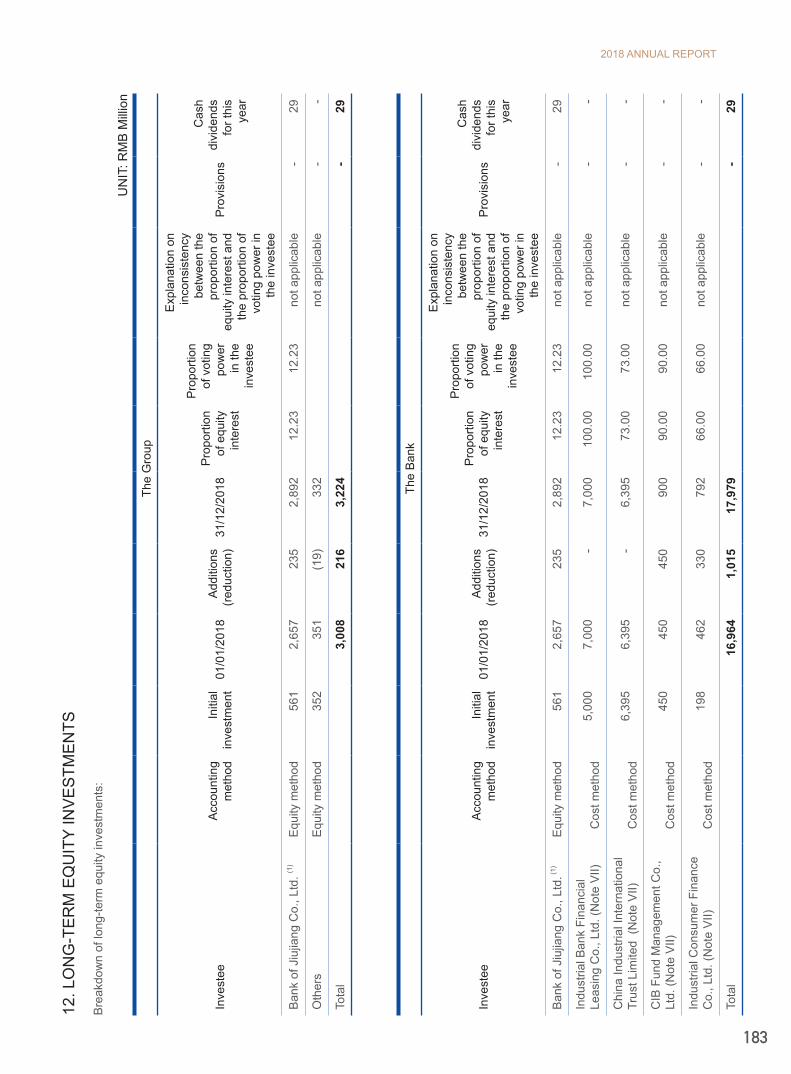
2018 ANNUAL REPORT
183
12. L
ON
G-T
ER
M E
QU
ITY
INV
ES
TME
NTS
Bre
akdo
wn
of lo
ng-te
rm e
quity
inve
stm
ents
:
UN
IT: R
MB
Mill
ion
The
Gro
up
Inve
stee
Acc
ount
ing
met
hod
Initi
alin
vest
men
t01
/01/
2018
Add
ition
s (r
educ
tion)
31/1
2/20
18P
ropo
rtion
of
equ
ity
inte
rest
Pro
porti
on
of v
otin
g po
wer
in
the
inve
stee
Exp
lana
tion
on
inco
nsis
tenc
y be
twee
n th
e pr
opor
tion
of
equi
ty in
tere
st a
nd
the
prop
ortio
n of
vo
ting
pow
er in
th
e in
vest
ee
Pro
visi
ons
Cas
h di
vide
nds
for t
his
year
Ban
k of
Jiu
jiang
Co.
, Ltd
. (1)
Equi
ty m
etho
d56
12,
657
235
2,89
212
.23
12.2
3no
t app
licab
le-
29
Oth
ers
Equi
ty m
etho
d35
235
1(1
9)33
2no
t app
licab
le-
-
Tota
l3,
008
216
3,22
4-
29
The
Ban
k
Inve
stee
Acc
ount
ing
met
hod
Initi
alin
vest
men
t01
/01/
2018
Add
ition
s (r
educ
tion)
31/1
2/20
18P
ropo
rtion
of
equ
ity
inte
rest
Pro
porti
on
of v
otin
g po
wer
in
the
inve
stee
Exp
lana
tion
on
inco
nsis
tenc
y be
twee
n th
e pr
opor
tion
of
equi
ty in
tere
st a
nd
the
prop
ortio
n of
vo
ting
pow
er in
th
e in
vest
ee
Pro
visi
ons
Cas
h di
vide
nds
for t
his
year
Ban
k of
Jiu
jiang
Co.
, Ltd
. (1)
Eq
uity
met
hod
561
2,65
723
52,
892
12.2
312
.23
not a
pplic
able
-29
Indu
stria
l Ban
k Fi
nanc
ial
Leas
ing
Co.
, Ltd
. (N
ote
VII)
Cos
t met
hod
5,00
07,
000
-7,
000
100.
0010
0.00
not a
pplic
able
--
Chi
na In
dust
rial I
nter
natio
nal
Trus
t Lim
ited
(Not
e V
II)
Cos
t met
hod
6,39
56,
395
-6,
395
73.0
073
.00
not a
pplic
able
--
CIB
Fun
d M
anag
emen
t Co.
, Lt
d. (N
ote
VII)
Cos
t met
hod
450
450
450
900
90.0
090
.00
not a
pplic
able
--
Indu
stria
l Con
sum
er F
inan
ce
Co.
, Ltd
. (N
ote
VII)
Cos
t met
hod
198
462
330
792
66.0
066
.00
not a
pplic
able
--
Tota
l16
,964
1,01
517
,979
-29

INDUSTRIAL BANK
184
(1) In accordance with the YJF [2008] No.449, approved by the CBIRC on 4 November, 2008, the Bank has acquired 102.2 million shares of Bank of Jiujiang Co., Ltd. (refers to as Bank of Jiujiang hereafter) for the price of RMB2.9 Yuan per share. As the result, the Bank holds 20% of the total shares of the Bank of Jiujiang after it expanded its share capital. In 2009, Bank of Jiujiang increases 4 shares for every 10 shares to all recorded shareholders based on the share capital by the end of August 2009 by utilizing capital reserve. The Bank currently holds 143.08 million shares of Bank of Jiujiang. In 2010, Bank of Jiujiang increases its registered capital RMB400.66 million, offered privately and subscribed in cash for the price of RMB3.3 Yuan per share. The Bank has acquired 80.12 million shares. After the acquisition, the Bank holds 223.20 million shares and the proportion of equity interest remains 20% of the total shares of the Bank of Jiujiang after it expanded its share capital. On 14 December 2011, Bank of Jiujiang increased its registered capital by RMB400 million, none of which was subscribed by the Bank, and the proportion of equity interest of the Bank was diluted to 14.72% after the capital increase. On 17 March 2017, Bank of Jiujiang issued 484 million shares through private placement. The Bank subscribed 71.2 million shares at the price of RMB6.87 per share. After the subscription, the Bank holds total 294.4 million shares in Bank of Jiujiang with its proportion of shareholding remained at 14.72% of the total share capital of Bank of Jiujiang after the capital increase. On 10 July 2018, the Bank of Jiujiang was list on the main board of SEHK, after which the shareholding ratio by the Bank was diluted to 12.23%. As the Bank sent a director to the Bank of Jiujiang and has significant influence over the Bank of Jiujiang, the equity investment is accounted for using the equity method.
(2) There are no restrictions of the investees' capital transferring capacities to the Group and the Bank on 31 December 2018.

2018 ANNUAL REPORT
185
13. FIXED ASSETS
UNIT: RMB Million
The Group
Buildings Fixed assets improvement
Office and machineryequipment
Transportation vehicles
Flight equipment Total
Cost
1/1/2018 10,690 1,059 6,065 473 4,307 22,594
Purchase 50 56 1,380 48 987 2,521
Transfers from constructions in progress 2,211 22 2 - - 2,235
Sales/disposals - (30) (429) (42) - (501)
12/31/2018 12,951 1,107 7,018 479 5,294 26,849
Accumulated depreciation
1/1/2018 2,648 421 4,160 278 210 7,717
Depreciation for the year 413 53 1,054 53 214 1,787
Eliminated on sales/disposals - (30) (264) (22) - (316)
12/31/2018 3,061 444 4,950 309 424 9,188
Net value
1/1/2018 8,042 638 1,905 195 4,097 14,877
12/31/2018 9,890 663 2,068 170 4,870 17,661
Allowance for impairment losses
1/1/2018 (3) - - - - (3)
Charged for the year - - - - - -
Eliminated on sales/disposals - - - - - -
12/31/2018 (3) - - - - (3)
Net carrying amount
1/1/2018 8,039 638 1,905 195 4,097 14,874
12/31/2018 9,887 663 2,068 170 4,870 17,658
On 31 December 2018, the cost of fight equipment leased out under operating lease business by the Group's subsidiary Industrial Bank Financial Leasing Co., Ltd. was RMB5,294 million (31 December 2017: RMB4,307 million).
Buildings cost RMB1,325 million are in use but the legal ownership registrations were still in process as at 31 December 2018 (31 December 2017: RMB1,256 million).

INDUSTRIAL BANK
186
UNIT: RMB Million
The Bank
Buildings Fixed assets improvement
Office and machineryequipment
Transportation vehicles Total
Cost
1/1/2018 10,655 1,059 5,812 437 17,963
Purchase 50 56 1,203 44 1,353
Transfers from constructions in progress 2,211 22 2 - 2,235
Sales/disposals - (30) (282) (37) (349)
12/31/2018 12,916 1,107 6,735 444 21,202
Accumulated depreciation
1/1/2018 2,637 421 4,031 264 7,353
Depreciation for the year 412 53 1,010 49 1,524
Sales/disposals - (30) (252) (20) (302)
12/31/2018 3,049 444 4,789 293 8,575
Net value
1/1/2018 8,018 638 1,781 173 10,610
12/31/2018 9,867 663 1,946 151 12,627
Allowance for impairment losses
1/1/2018 (3) - - - (3)
Charge for the year - - - - -
Sales/disposals - - - - -
12/31/2018 (3) - - - (3)
Net carrying amount
1/1/2018 8,015 638 1,781 173 10,607
12/31/2018 9,864 663 1,946 151 12,624
Buildings cost RMB1,325 million are in use but the legal ownership registrations were still in process as at 31 December 2018 (31 December 2017: RMB1,256 million).
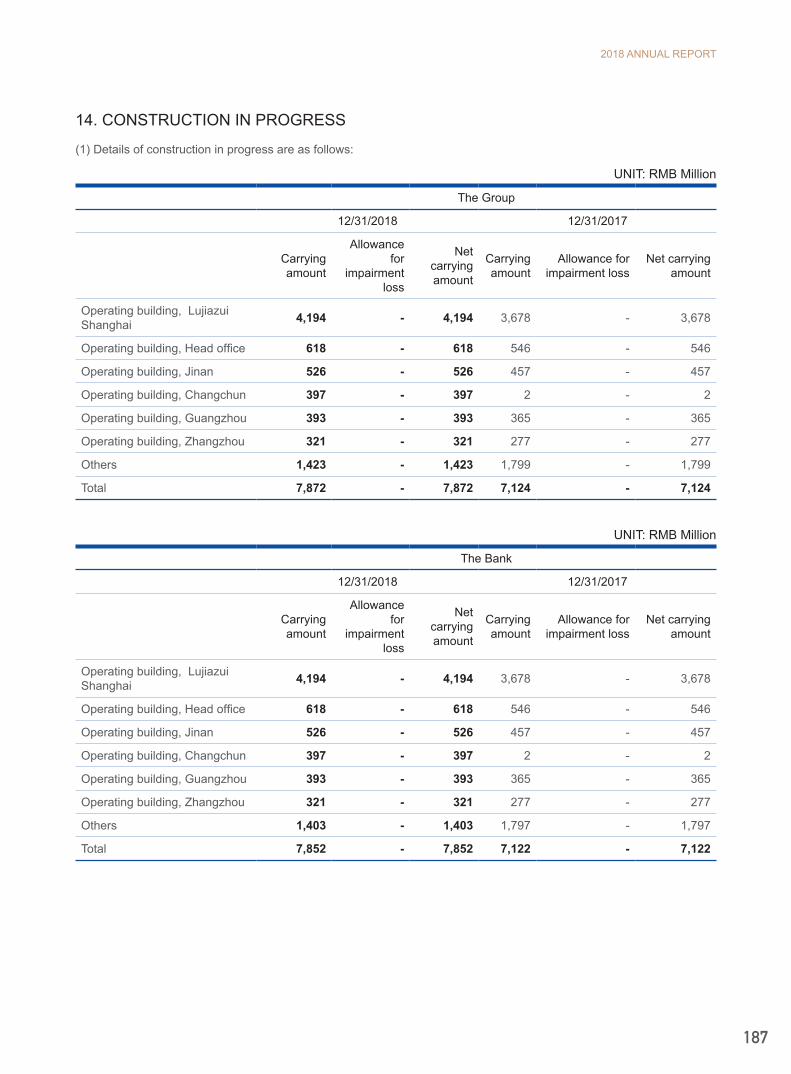
2018 ANNUAL REPORT
187
14. CONSTRUCTION IN PROGRESS
(1) Details of construction in progress are as follows:
UNIT: RMB Million
The Group
12/31/2018 12/31/2017
Carrying amount
Allowance for
impairment loss
Net carrying amount
Carrying amount
Allowance for impairment loss
Net carrying amount
Operating building, Lujiazui Shanghai 4,194 - 4,194 3,678 - 3,678
Operating building, Head office 618 - 618 546 - 546
Operating building, Jinan 526 - 526 457 - 457
Operating building, Changchun 397 - 397 2 - 2
Operating building, Guangzhou 393 - 393 365 - 365
Operating building, Zhangzhou 321 - 321 277 - 277
Others 1,423 - 1,423 1,799 - 1,799
Total 7,872 - 7,872 7,124 - 7,124
UNIT: RMB Million
The Bank
12/31/2018 12/31/2017
Carrying amount
Allowance for
impairment loss
Net carrying amount
Carrying amount
Allowance for impairment loss
Net carrying amount
Operating building, Lujiazui Shanghai 4,194 - 4,194 3,678 - 3,678
Operating building, Head office 618 - 618 546 - 546
Operating building, Jinan 526 - 526 457 - 457
Operating building, Changchun 397 - 397 2 - 2
Operating building, Guangzhou 393 - 393 365 - 365
Operating building, Zhangzhou 321 - 321 277 - 277
Others 1,403 - 1,403 1,797 - 1,797
Total 7,852 - 7,852 7,122 - 7,122

INDUSTRIAL BANK
188
(2) Significant changes in construction in progress are as follows:
UNIT: RMB Million
The Group
2018
1/1/2018 Additions (decrease)
Transfer to fixed assets
Transfer to long-term prepaid expenses 31/12/2018
Operating building, Lujiazui Shanghai 3,678 516 - - 4,194
Operating building, Head office 546 72 - - 618
Operating building, Jinan 457 69 - - 526
Operating building, Changchun 2 395 - - 397
Operating building, Guangzhou 365 28 - - 393
Operating building, Zhangzhou 277 44 - - 321
Others 1,799 2,364 2,235 505 1,423
Total 7,124 3,488 2,235 505 7,872
UNIT: RMB Million
The Bank
2018
1/1/2018 Additions (decrease)
Transfer tofixed assets
Transfer to long-term prepaid expenses 31/12/2018
Operating building, Lujiazui Shanghai 3,678 516 - - 4,194
Operating building, Head office 546 72 - - 618
Operating building, Jinan 457 69 - - 526
Operating building, Changchun 2 395 - - 397
Operating building, Guangzhou 365 28 - - 393
Operating building, Zhangzhou 277 44 - - 321
Others 1,797 2,346 2,235 505 1,403
Total 7,122 3,470 2,235 505 7,852

2018 ANNUAL REPORT
189
15. GOODWILL
UNIT: RMB Million
The Group
Investee 1/1/2018 Additions Deductions 31/12/2018 31/12/2018 Provision
China Industrial International Trust Limited 532 - - 532 -
Goodwill arose from acquisition of China Industrial International Trust Limited in February 2011, and the overweight of China Industrial Future Limited by China Industrial International Trust Limited in March, 2015.
At the end of the year, the Group performed impairment tests on goodwill based on expected future cash flow of the investee, applying appropriate discount rate, reflecting current time value of money and the risk of specific assets. No evidence shows that the recoverable amount of goodwill is less than the carrying amount as at December 2018, therefore no impairment is recognised.
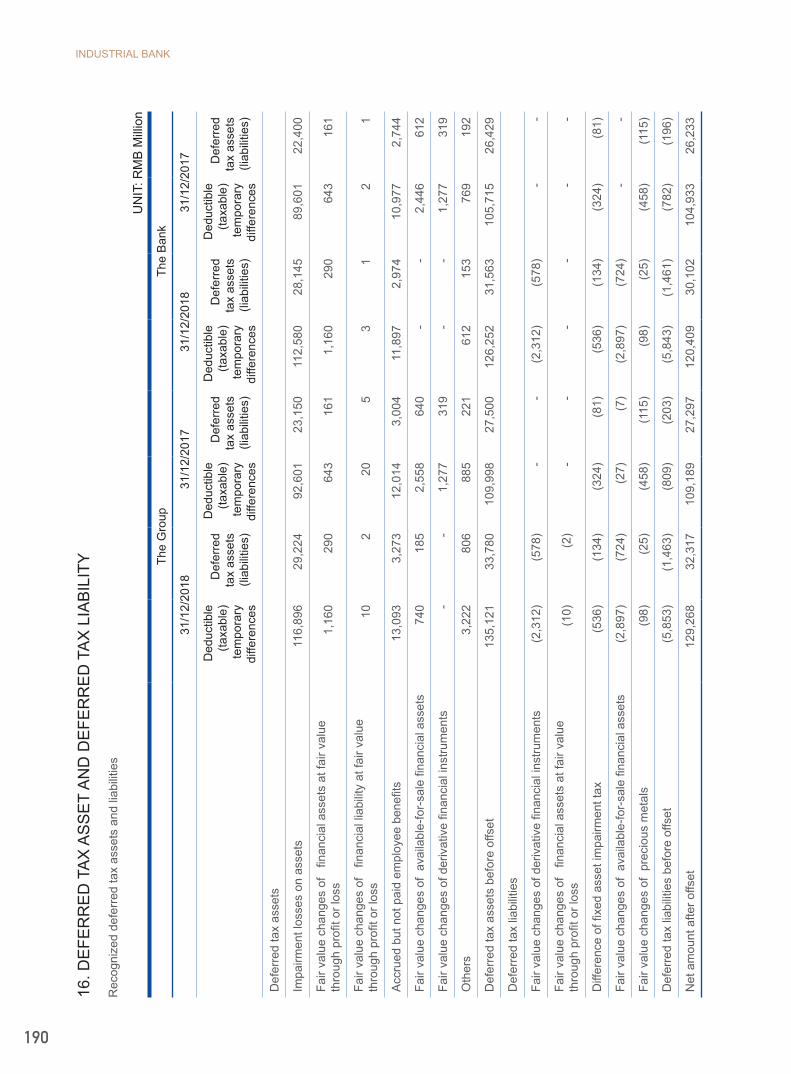
INDUSTRIAL BANK
190
16. D
EFE
RR
ED
TA
X A
SS
ET
AN
D D
EFE
RR
ED
TA
X L
IAB
ILIT
Y
Rec
ogni
zed
defe
rred
tax
asse
ts a
nd li
abili
ties
UN
IT: R
MB
Mill
ion
The
Gro
upTh
e B
ank
31/1
2/20
1831
/12/
2017
31/1
2/20
1831
/12/
2017
Ded
uctib
le
(taxa
ble)
tem
pora
ry
diffe
renc
es
Def
erre
d ta
x as
sets
(li
abili
ties)
Ded
uctib
le
(taxa
ble)
te
mpo
rary
di
ffere
nces
Def
erre
d ta
x as
sets
(li
abili
ties)
Ded
uctib
le
(taxa
ble)
te
mpo
rary
di
ffere
nces
Def
erre
d ta
x as
sets
(li
abili
ties)
Ded
uctib
le
(taxa
ble)
te
mpo
rary
di
ffere
nces
Def
erre
d ta
x as
sets
(li
abili
ties)
Def
erre
d ta
x as
sets
Impa
irmen
t los
ses
on a
sset
s11
6,89
629
,224
92,6
0123
,150
112,
580
28,1
4589
,601
22,4
00
Fair
valu
e ch
ange
s of
fin
anci
al a
sset
s at
fair
valu
e th
roug
h pr
ofit o
r los
s1,
160
290
643
161
1,16
029
064
316
1
Fair
valu
e ch
ange
s of
fin
anci
al li
abili
ty a
t fai
r val
ue
thro
ugh
profi
t or l
oss
102
205
31
21
Acc
rued
but
not
pai
d em
ploy
ee b
enefi
ts13
,093
3,27
312
,014
3,00
411
,897
2,97
410
,977
2,74
4
Fair
valu
e ch
ange
s of
ava
ilabl
e-fo
r-sa
le fi
nanc
ial a
sset
s74
0 18
5 2,
558
640
--
2,44
661
2
Fair
valu
e ch
ange
s of
der
ivat
ive
finan
cial
inst
rum
ents
--
1,27
731
9-
-1,
277
319
Oth
ers
3,22
280
688
522
161
215
376
919
2
Def
erre
d ta
x as
sets
bef
ore
offs
et13
5,12
1 33
,780
109,
998
27,5
0012
6,25
231
,563
105,
715
26,4
29
Def
erre
d ta
x lia
bilit
ies
Fair
valu
e ch
ange
s of
der
ivat
ive
finan
cial
inst
rum
ents
(2,3
12)
(578
)-
-(2
,312
)(5
78)
--
Fair
valu
e ch
ange
s of
fin
anci
al a
sset
s at
fair
valu
e th
roug
h pr
ofit o
r los
s(1
0)(2
)-
--
--
-
Diff
eren
ce o
f fixe
d as
set i
mpa
irmen
t tax
(536
)(1
34)
(324
)(8
1)(5
36)
(134
)(3
24)
(81)
Fair
valu
e ch
ange
s of
ava
ilabl
e-fo
r-sa
le fi
nanc
ial a
sset
s(2
,897
) (7
24)
(27)
(7)
(2,8
97)
(724
)-
-
Fair
valu
e ch
ange
s of
pre
ciou
s m
etal
s(9
8)(2
5)(4
58)
(115
)(9
8)(2
5)(4
58)
(115
)
Def
erre
d ta
x lia
bilit
ies
befo
re o
ffset
(5,8
53)
(1,4
63)
(809
)(2
03)
(5,8
43)
(1,4
61)
(782
)(1
96)
Net
am
ount
afte
r offs
et12
9,26
832
,317
109,
189
27,2
9712
0,40
930
,102
104,
933
26,2
33
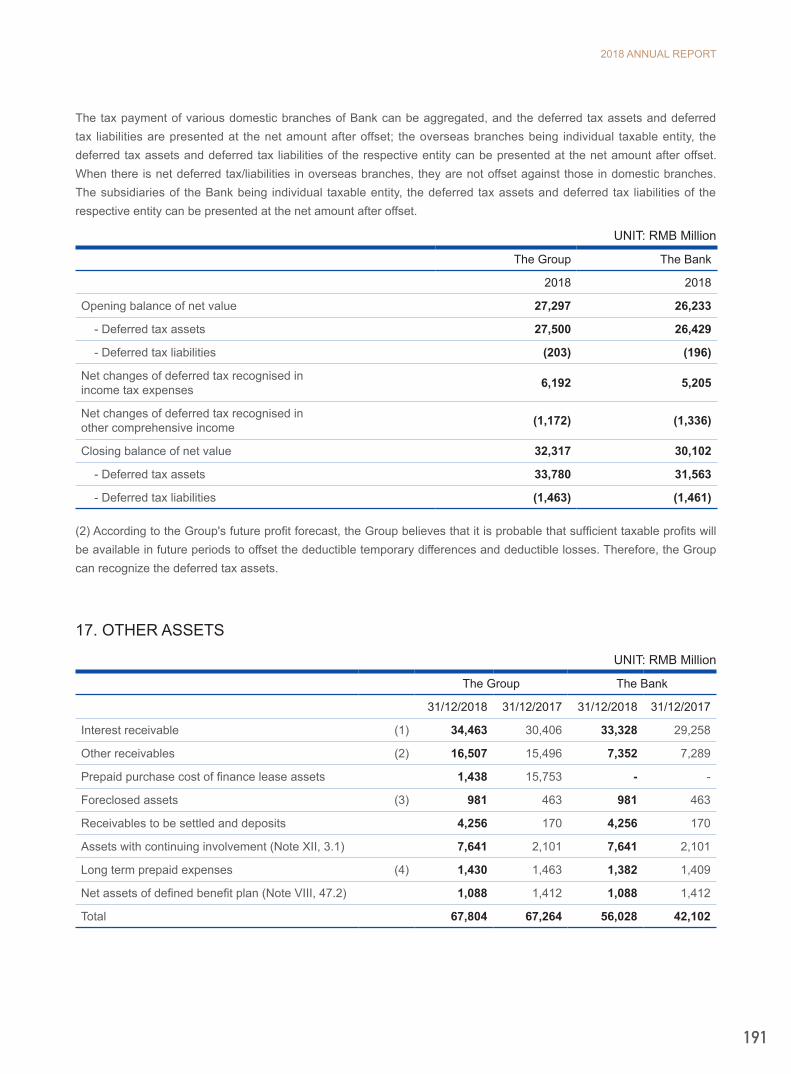
2018 ANNUAL REPORT
191
The tax payment of various domestic branches of Bank can be aggregated, and the deferred tax assets and deferred tax liabilities are presented at the net amount after offset; the overseas branches being individual taxable entity, the deferred tax assets and deferred tax liabilities of the respective entity can be presented at the net amount after offset. When there is net deferred tax/liabilities in overseas branches, they are not offset against those in domestic branches. The subsidiaries of the Bank being individual taxable entity, the deferred tax assets and deferred tax liabilities of the respective entity can be presented at the net amount after offset.
UNIT: RMB Million
The Group The Bank
2018 2018
Opening balance of net value 27,297 26,233
- Deferred tax assets 27,500 26,429
- Deferred tax liabilities (203) (196)
Net changes of deferred tax recognised inincome tax expenses 6,192 5,205
Net changes of deferred tax recognised in other comprehensive income (1,172) (1,336)
Closing balance of net value 32,317 30,102
- Deferred tax assets 33,780 31,563
- Deferred tax liabilities (1,463) (1,461)
(2) According to the Group's future profit forecast, the Group believes that it is probable that sufficient taxable profits will be available in future periods to offset the deductible temporary differences and deductible losses. Therefore, the Group can recognize the deferred tax assets.
17. OTHER ASSETS
UNIT: RMB Million
The Group The Bank
31/12/2018 31/12/2017 31/12/2018 31/12/2017
Interest receivable (1) 34,463 30,406 33,328 29,258
Other receivables (2) 16,507 15,496 7,352 7,289
Prepaid purchase cost of finance lease assets 1,438 15,753 - -
Foreclosed assets (3) 981 463 981 463
Receivables to be settled and deposits 4,256 170 4,256 170
Assets with continuing involvement (Note XII, 3.1) 7,641 2,101 7,641 2,101
Long term prepaid expenses (4) 1,430 1,463 1,382 1,409
Net assets of defined benefit plan (Note VIII, 47.2) 1,088 1,412 1,088 1,412
Total 67,804 67,264 56,028 42,102
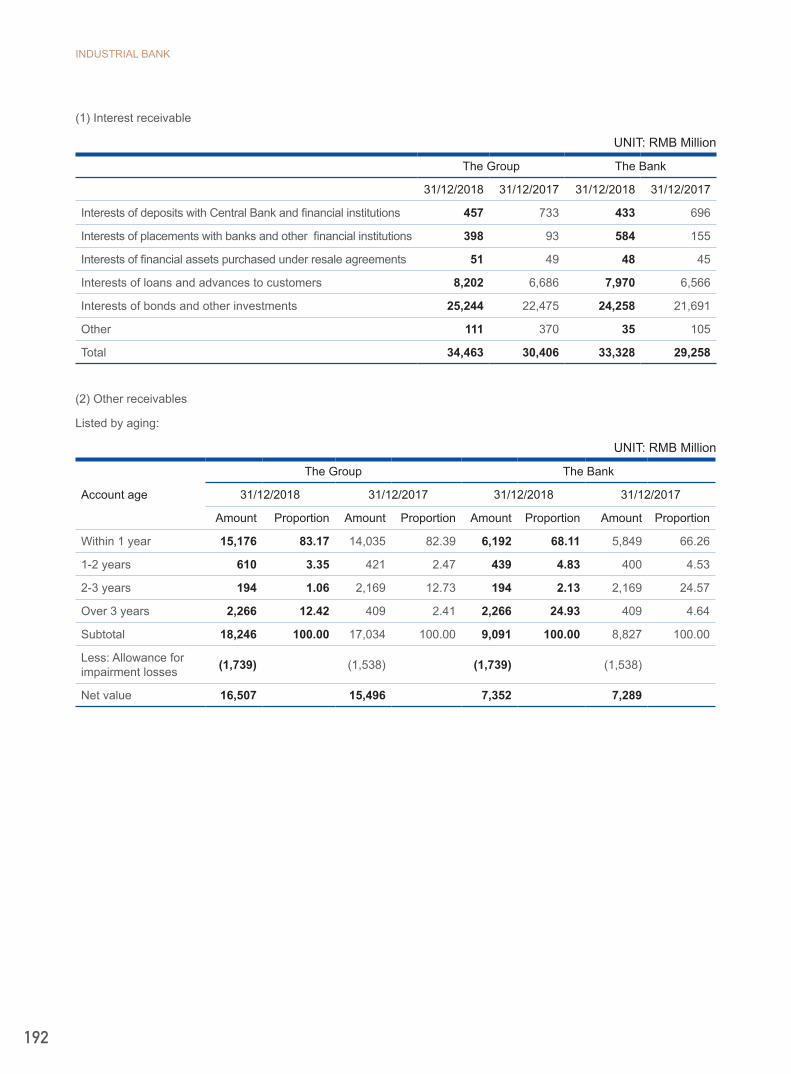
INDUSTRIAL BANK
192
(1) Interest receivable
UNIT: RMB Million
The Group The Bank
31/12/2018 31/12/2017 31/12/2018 31/12/2017
Interests of deposits with Central Bank and financial institutions 457 733 433 696
Interests of placements with banks and other financial institutions 398 93 584 155
Interests of financial assets purchased under resale agreements 51 49 48 45
Interests of loans and advances to customers 8,202 6,686 7,970 6,566
Interests of bonds and other investments 25,244 22,475 24,258 21,691
Other 111 370 35 105
Total 34,463 30,406 33,328 29,258
(2) Other receivables
Listed by aging:
UNIT: RMB Million
Account age
The Group The Bank
31/12/2018 31/12/2017 31/12/2018 31/12/2017
Amount Proportion Amount Proportion Amount Proportion Amount Proportion
Within 1 year 15,176 83.17 14,035 82.39 6,192 68.11 5,849 66.26
1-2 years 610 3.35 421 2.47 439 4.83 400 4.53
2-3 years 194 1.06 2,169 12.73 194 2.13 2,169 24.57
Over 3 years 2,266 12.42 409 2.41 2,266 24.93 409 4.64
Subtotal 18,246 100.00 17,034 100.00 9,091 100.00 8,827 100.00
Less: Allowance for impairment losses (1,739) (1,538) (1,739) (1,538)
Net value 16,507 15,496 7,352 7,289
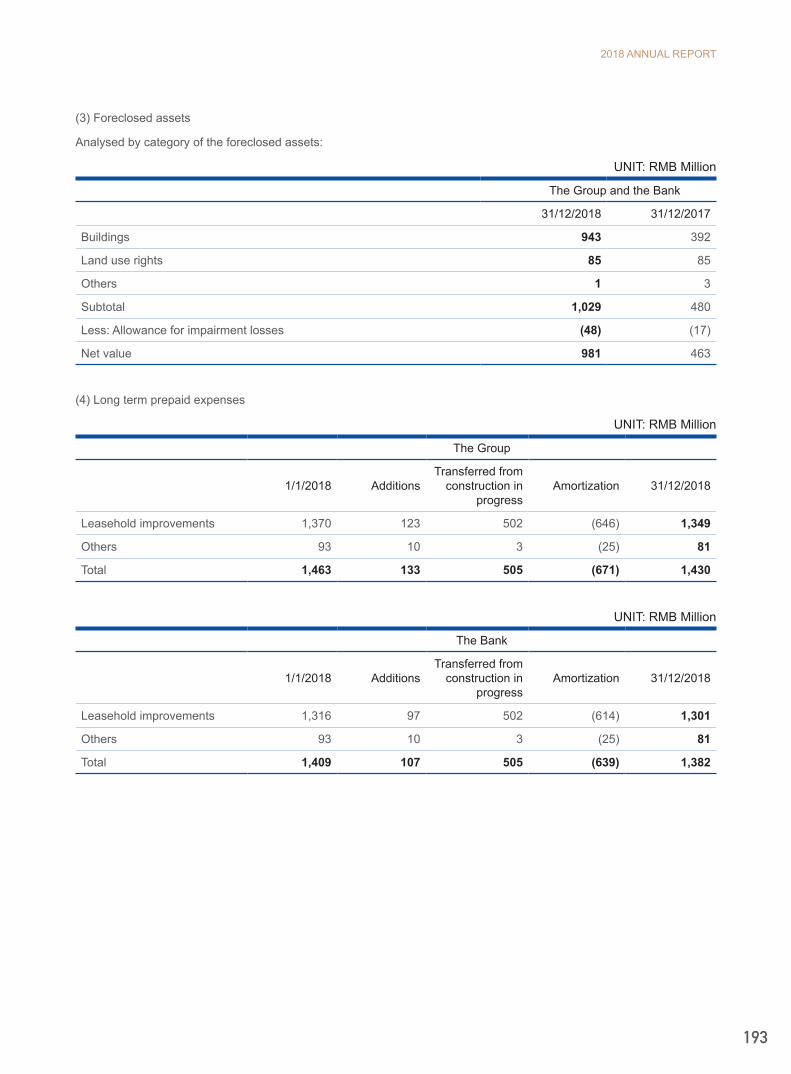
2018 ANNUAL REPORT
193
(3) Foreclosed assets
Analysed by category of the foreclosed assets:
UNIT: RMB Million
The Group and the Bank
31/12/2018 31/12/2017
Buildings 943 392
Land use rights 85 85
Others 1 3
Subtotal 1,029 480
Less: Allowance for impairment losses (48) (17)
Net value 981 463
(4) Long term prepaid expenses
UNIT: RMB Million
The Group
1/1/2018 AdditionsTransferred from
construction in progress
Amortization 31/12/2018
Leasehold improvements 1,370 123 502 (646) 1,349
Others 93 10 3 (25) 81
Total 1,463 133 505 (671) 1,430
UNIT: RMB Million
The Bank
1/1/2018 AdditionsTransferred from
construction in progress
Amortization 31/12/2018
Leasehold improvements 1,316 97 502 (614) 1,301
Others 93 10 3 (25) 81
Total 1,409 107 505 (639) 1,382
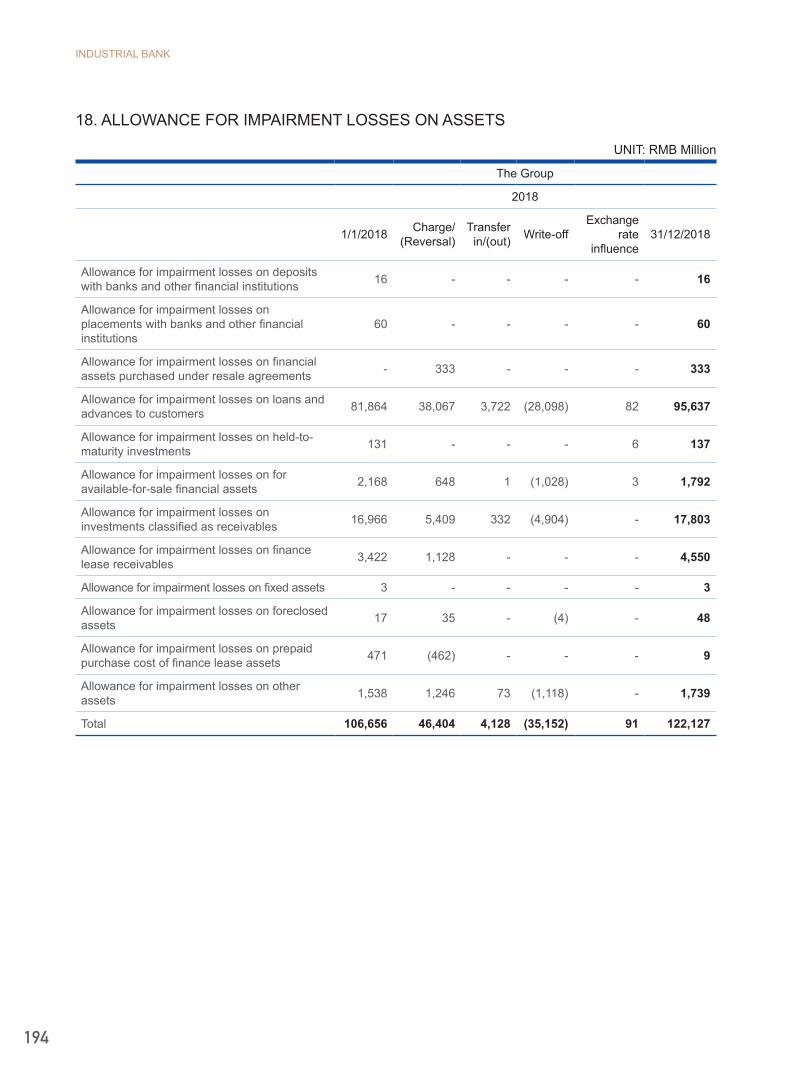
INDUSTRIAL BANK
194
18. ALLOWANCE FOR IMPAIRMENT LOSSES ON ASSETS
UNIT: RMB Million
The Group
2018
1/1/2018 Charge/ (Reversal)
Transfer in/(out) Write-off
Exchange rate
influence31/12/2018
Allowance for impairment losses on deposits with banks and other financial institutions 16 - - - - 16
Allowance for impairment losses on placements with banks and other financial institutions
60 - - - - 60
Allowance for impairment losses on financial assets purchased under resale agreements - 333 - - - 333
Allowance for impairment losses on loans and advances to customers 81,864 38,067 3,722 (28,098) 82 95,637
Allowance for impairment losses on held-to-maturity investments 131 - - - 6 137
Allowance for impairment losses on for available-for-sale financial assets 2,168 648 1 (1,028) 3 1,792
Allowance for impairment losses on investments classified as receivables 16,966 5,409 332 (4,904) - 17,803
Allowance for impairment losses on finance lease receivables 3,422 1,128 - - - 4,550
Allowance for impairment losses on fixed assets 3 - - - - 3
Allowance for impairment losses on foreclosed assets 17 35 - (4) - 48
Allowance for impairment losses on prepaid purchase cost of finance lease assets 471 (462) - - - 9
Allowance for impairment losses on other assets 1,538 1,246 73 (1,118) - 1,739
Total 106,656 46,404 4,128 (35,152) 91 122,127

2018 ANNUAL REPORT
195
UNIT: RMB Million
The Bank
2018
1/1/2018 Charge/ (Reversal)
Transfer in/(out) Write-off
Exchange rate
influence31/12/2018
Allowance for impairment losses on deposits with banks and other financial institutions 16 - - - - 16
Allowance for impairment losses on placements with banks and other financial institutions
60 - - - - 60
Allowance for impairment losses on financial assets purchased under resale agreements - 333 - - - 333
Allowance for impairment losses on loans and advances to customers 81,498 37,426 3,721 (27,910) 82 94,817
Allowance for impairment losses on held-to-maturity investments 131 - - - 6 137
Allowance for impairment losses on for available-for-sale financial assets 2,148 401 1 (1,005) 3 1,548
Allowance for impairment losses on investments classified as receivables 16,912 5,168 332 (4,904) - 17,508
Allowance for impairment losses on fixed assets 3 - - - - 3
Allowance for impairment losses on foreclosed assets 17 35 - (4) - 48
Allowance for impairment losses on other assets 1,538 1,246 73 (1,118) - 1,739
Total 102,323 44,609 4,127 (34,941) 91 116,209

INDUSTRIAL BANK
196
19. DEPOSITS FROM BANKS AND OTHER FINANCIAL INSTITUTIONS
UNIT: RMB Million
The Group The Bank
31/12/2018 31/12/2017 31/12/2018 31/12/2017
Deposits from banks:
Domestic banks 318,725 315,782 318,748 315,782
Foreign banks 97,746 80,864 97,746 80,864
Deposits from other financial institutions:
Other domestic financial institutions 928,389 1,049,413 934,890 1,052,407
Other overseas financial institutions 23 - 23 -
Total 1,344,883 1,446,059 1,351,407 1,449,053
20. PLACEMENTS FROM BANKS AND OTHER FINANCIAL INSTITUTIONS
UNIT: RMB Million
The Group The Bank
31/12/2018 31/12/2017 31/12/2018 31/12/2017
Placements from:
Domestic banks 157,077 139,711 63,188 39,100
Other domestic financial institutions 4,648 2,731 4,648 2,731
Overseas banks 59,106 45,487 59,105 43,318
Total 220,831 187,929 126,941 85,149
21. FINANCIAL LIABILITIES AT FAIR VALUE THROUGH PROFIT OR LOSS
UNIT: RMB Million
The Group The Bank
31/12/2018 31/12/2017 31/12/2018 31/12/2017
Trading financial liabilities:
Sold financing bonds - 873 - 873
Others 97 123 97 123
Financial liabilities assigned as at fair value through profit or loss 2,497 5,567 2,290 4,729
Total 2,594 6,563 2,387 5,725
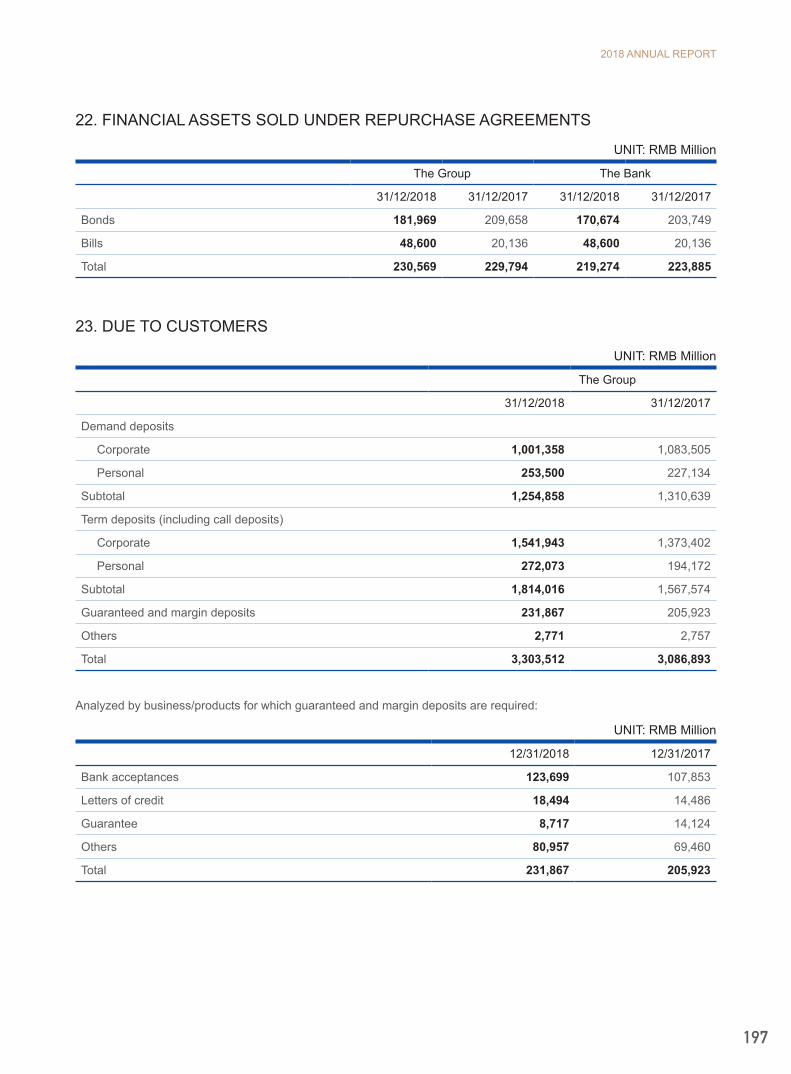
2018 ANNUAL REPORT
197
22. FINANCIAL ASSETS SOLD UNDER REPURCHASE AGREEMENTS
UNIT: RMB Million
The Group The Bank
31/12/2018 31/12/2017 31/12/2018 31/12/2017
Bonds 181,969 209,658 170,674 203,749
Bills 48,600 20,136 48,600 20,136
Total 230,569 229,794 219,274 223,885
23. DUE TO CUSTOMERS
UNIT: RMB Million
The Group
31/12/2018 31/12/2017
Demand deposits
Corporate 1,001,358 1,083,505
Personal 253,500 227,134
Subtotal 1,254,858 1,310,639
Term deposits (including call deposits)
Corporate 1,541,943 1,373,402
Personal 272,073 194,172
Subtotal 1,814,016 1,567,574
Guaranteed and margin deposits 231,867 205,923
Others 2,771 2,757
Total 3,303,512 3,086,893
Analyzed by business/products for which guaranteed and margin deposits are required:
UNIT: RMB Million
12/31/2018 12/31/2017
Bank acceptances 123,699 107,853
Letters of credit 18,494 14,486
Guarantee 8,717 14,124
Others 80,957 69,460
Total 231,867 205,923
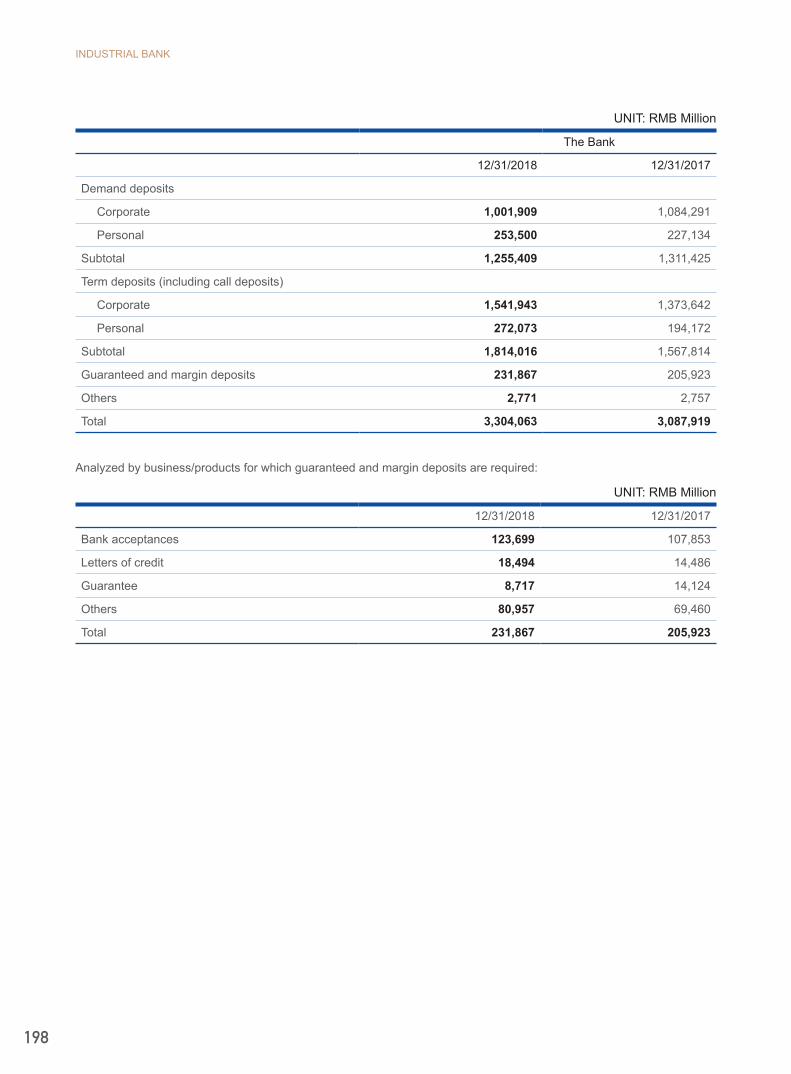
INDUSTRIAL BANK
198
UNIT: RMB Million
The Bank
12/31/2018 12/31/2017
Demand deposits
Corporate 1,001,909 1,084,291
Personal 253,500 227,134
Subtotal 1,255,409 1,311,425
Term deposits (including call deposits)
Corporate 1,541,943 1,373,642
Personal 272,073 194,172
Subtotal 1,814,016 1,567,814
Guaranteed and margin deposits 231,867 205,923
Others 2,771 2,757
Total 3,304,063 3,087,919
Analyzed by business/products for which guaranteed and margin deposits are required:
UNIT: RMB Million
12/31/2018 12/31/2017
Bank acceptances 123,699 107,853
Letters of credit 18,494 14,486
Guarantee 8,717 14,124
Others 80,957 69,460
Total 231,867 205,923
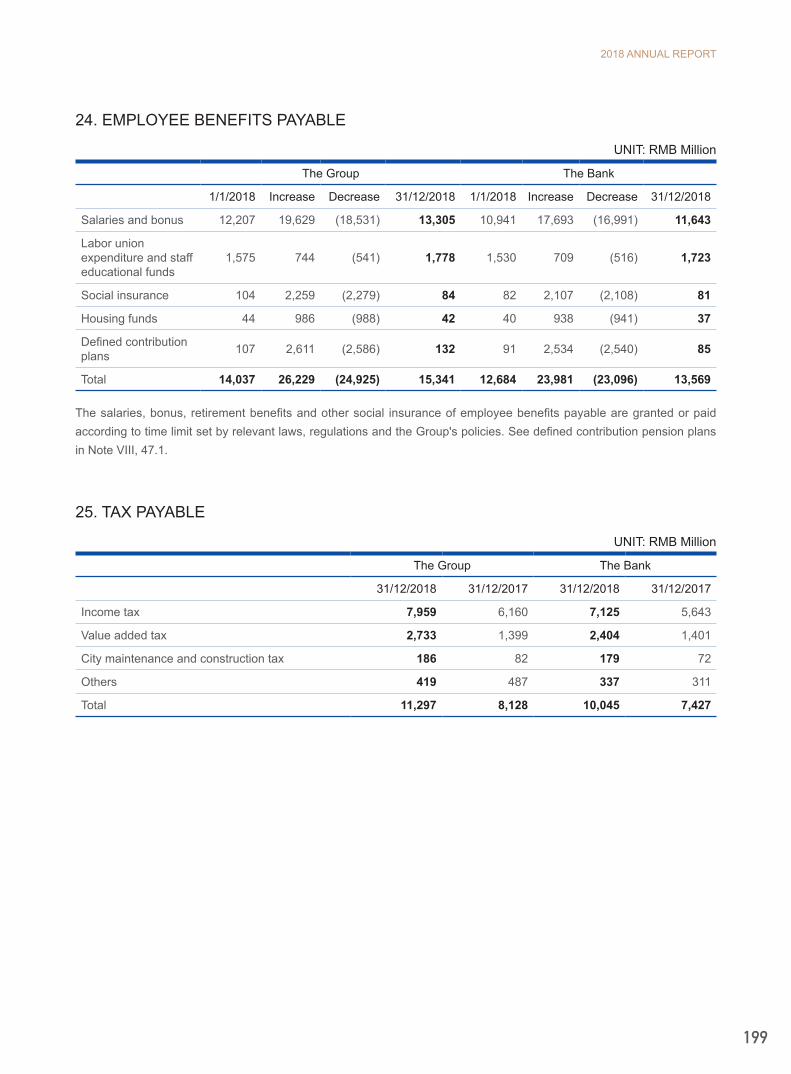
2018 ANNUAL REPORT
199
24. EMPLOYEE BENEFITS PAYABLE
UNIT: RMB Million
The Group The Bank
1/1/2018 Increase Decrease 31/12/2018 1/1/2018 Increase Decrease 31/12/2018
Salaries and bonus 12,207 19,629 (18,531) 13,305 10,941 17,693 (16,991) 11,643
Labor union expenditure and staff educational funds
1,575 744 (541) 1,778 1,530 709 (516) 1,723
Social insurance 104 2,259 (2,279) 84 82 2,107 (2,108) 81
Housing funds 44 986 (988) 42 40 938 (941) 37
Defined contribution plans 107 2,611 (2,586) 132 91 2,534 (2,540) 85
Total 14,037 26,229 (24,925) 15,341 12,684 23,981 (23,096) 13,569
The salaries, bonus, retirement benefits and other social insurance of employee benefits payable are granted or paid according to time limit set by relevant laws, regulations and the Group's policies. See defined contribution pension plans in Note VIII, 47.1.
25. TAX PAYABLE
UNIT: RMB Million
The Group The Bank
31/12/2018 31/12/2017 31/12/2018 31/12/2017
Income tax 7,959 6,160 7,125 5,643
Value added tax 2,733 1,399 2,404 1,401
City maintenance and construction tax 186 82 179 72
Others 419 487 337 311
Total 11,297 8,128 10,045 7,427
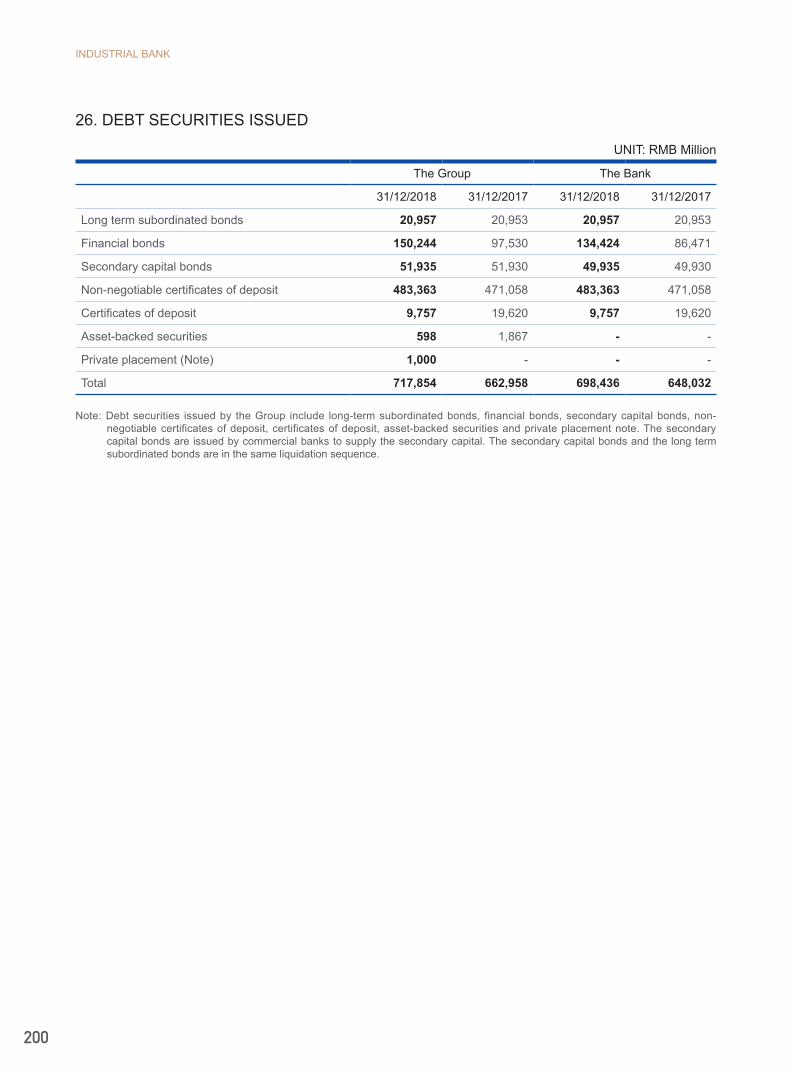
INDUSTRIAL BANK
200
26. DEBT SECURITIES ISSUED
UNIT: RMB Million
The Group The Bank
31/12/2018 31/12/2017 31/12/2018 31/12/2017
Long term subordinated bonds 20,957 20,953 20,957 20,953
Financial bonds 150,244 97,530 134,424 86,471
Secondary capital bonds 51,935 51,930 49,935 49,930
Non-negotiable certificates of deposit 483,363 471,058 483,363 471,058
Certificates of deposit 9,757 19,620 9,757 19,620
Asset-backed securities 598 1,867 - -
Private placement (Note) 1,000 - - -
Total 717,854 662,958 698,436 648,032
Note: Debt securities issued by the Group include long-term subordinated bonds, financial bonds, secondary capital bonds, non-negotiable certificates of deposit, certificates of deposit, asset-backed securities and private placement note. The secondary capital bonds are issued by commercial banks to supply the secondary capital. The secondary capital bonds and the long term subordinated bonds are in the same liquidation sequence.
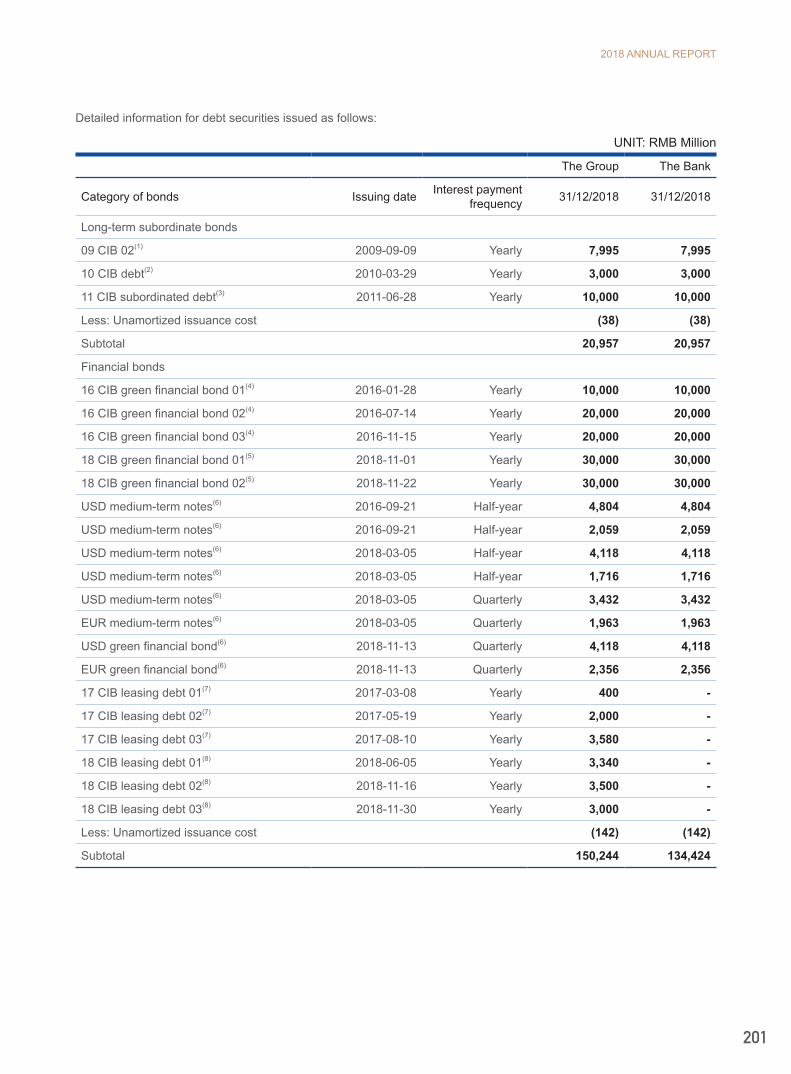
2018 ANNUAL REPORT
201
Detailed information for debt securities issued as follows:
UNIT: RMB Million
The Group The Bank
Category of bonds Issuing date Interest payment frequency 31/12/2018 31/12/2018
Long-term subordinate bonds
09 CIB 02(1) 2009-09-09 Yearly 7,995 7,995
10 CIB debt(2) 2010-03-29 Yearly 3,000 3,000
11 CIB subordinated debt(3) 2011-06-28 Yearly 10,000 10,000
Less: Unamortized issuance cost (38) (38)
Subtotal 20,957 20,957
Financial bonds
16 CIB green financial bond 01(4) 2016-01-28 Yearly 10,000 10,000
16 CIB green financial bond 02(4) 2016-07-14 Yearly 20,000 20,000
16 CIB green financial bond 03(4) 2016-11-15 Yearly 20,000 20,000
18 CIB green financial bond 01(5) 2018-11-01 Yearly 30,000 30,000
18 CIB green financial bond 02(5) 2018-11-22 Yearly 30,000 30,000
USD medium-term notes(6) 2016-09-21 Half-year 4,804 4,804
USD medium-term notes(6) 2016-09-21 Half-year 2,059 2,059
USD medium-term notes(6) 2018-03-05 Half-year 4,118 4,118
USD medium-term notes(6) 2018-03-05 Half-year 1,716 1,716
USD medium-term notes(6) 2018-03-05 Quarterly 3,432 3,432
EUR medium-term notes(6) 2018-03-05 Quarterly 1,963 1,963
USD green financial bond(6) 2018-11-13 Quarterly 4,118 4,118
EUR green financial bond(6) 2018-11-13 Quarterly 2,356 2,356
17 CIB leasing debt 01(7) 2017-03-08 Yearly 400 -
17 CIB leasing debt 02(7) 2017-05-19 Yearly 2,000 -
17 CIB leasing debt 03(7) 2017-08-10 Yearly 3,580 -
18 CIB leasing debt 01(8) 2018-06-05 Yearly 3,340 -
18 CIB leasing debt 02(8) 2018-11-16 Yearly 3,500 -
18 CIB leasing debt 03(8) 2018-11-30 Yearly 3,000 -
Less: Unamortized issuance cost (142) (142)
Subtotal 150,244 134,424

INDUSTRIAL BANK
202
UNIT: RMB Million
The Group The Bank
Type-continued Issuing date Interest payment frequency 31/12/2018 31/12/2018
Secondary capital bonds
14 CIB secondary (9) 2014-06-18 Yearly 20,000 20,000
16 CIB secondary (10) 2016-04-11 Yearly 30,000 30,000
17 CIB leasing secondary (11) 2017-09-15 Yearly 2,000 -
Less: Unamortized issuance cost (65) (65)
Subtotal 51,935 49,935
Non-negotiable certificates of deposit
Carrying value of non-negotiable certificate of deposit (12) 490,200 490,200
Less: Unamortized issuance cost (6,837) (6,837)
Subtotal 483,363 483,363
Certificate of deposit
Carrying value of certificate of deposit (13) 9,761 9,761
Accrued interest 50 50
Less: Unamortized issuance cost (54) (54)
Subtotal 9,757 9,757
Asset-backed securities
Jinxin 2017 Series 1 leasing asset-backed security (14) 598 -
Subtotal 598 -
Private placement note
18 CIB assets PPN001(15) 2018-12-20 Yearly 1,000 -
Subtotal 1,000 -
Total 717,854 698,436
(1) In September 2009, the Group issued RMB7,995 million subordinated bonds with a 15-year maturity, a fixed interest rate and a redemption option in the end of the tenth year. The annual coupon rate in first ten interest-bearing years is 5.17%, and the rate in late five years is 8.17% if the issuer does not exercise the option of redemption.
(2) In March 2010, the Group issued RMB3,000 million subordinated bond with a 15-year maturity, a fixed interest rate and a redemption right in the end of the tenth year. The annual coupon rate in first ten interest-bearing years is 4.80%, and the rate in late five years is 7.80% if the issuer does not exercise the option of redemption.
(3) In June 2011, the Group issued RMB10,000 million subordinated bond with a 15-year maturity, a fixed interest rate and a redemption right in the end of the tenth year. The annual coupon rate is 5.75% consistently.
(4) In January 2016, July 2016 and November 2016, the Group respectively issued green financial bonds of 3-year bonds amounting RMB10,000 million, 3-year bonds amounting RMB20,000 million and 5-year bonds amounting RMB20 billion with fixed rate of 2.95%, 3.20% and 3.40%.
(5) In November 2018, the Group issued two kinds of green financial bonds of 3-year bonds amounting RMB30,000 million with fixed rates of 3.99% and 3.89%.
2018 ANNUAL REPORT
203
(6) In September 2016, the Group set the medium-term notes issuing plan with limit of USD5 billion at The Stock Exchange of Hong Kong Ltd. (the "SEHK"). According to the plan, the Hong Kong branch of the Bank initially issued 3-year medium-term notes amounting USD700 million and 5-year medium-term notes amounting USD300 million at fixed annual rates of 2.00% and 2.375% respectively. The annual rate kept constant during the existence of bonds; in March 2018, the Hong Kong branch of the Bank issued 3-year medium-term notes amounting USD600 million, 5-year medium-term notes amounting USD250 million, 5-year medium-term notes amounting USD500 million and 3-year medium-term notes amounting EUR250 million at fixed annual rates of 3.50%, 3.750%, 105 basis points over the 3-month London rate for interbank lending, and 75 basis points over the 3-month Europe rate for interbank lending; in November 2018, the Hong Kong branch of the Bank issued 3-year overseas green financial bonds amounting USD600 million and 3-year overseas green financial bonds amounting EUR300 million at annual rates of 85 basis points over the 3-month London rate for interbank lending and 85 basis points over the 3-month Europe rate for interbank lending.
(7) In March 2017, May 2017 and August 2017, the Group's subsidiary China Industrial Finance Leasing Limited issued RMB500 million, RMB2,000 million and RMB4,000 million three-year fixed interest rate financial bonds at the annual rate of 4.5%, 5% and 4.7% respectively. As at 31 December 2018, the Bank holds 17 CIB leasing debt 01 of RMB100 million and 17 CIB leasing debt 03 of RMB420 million issued by China Industrial Finance Leasing Limited in March 2017 and August 2017 respectively.
(8) In June 2018, November 2018 and November 2018, the Group's subsidiary Industrial Bank Financial Leasing Co., Ltd. issued three-year fixed interest rate financial bonds amounting RMB3,500 million, RMB3,500 million and RMB3,000 million at the annual rate of 4.88%, 3.98% and 3.95% respectively. As at 31 December 2018, the "18 CIB leasing debt 01" of RMB160 million issued by Industrial Bank Financial Leasing Co., Ltd. in June 2018 was held by the Bank.
(9) In June 2014, the Group issued RMB20,000 million subordinated bond with a 10-year maturity, a fixed interest rate and a redemption right in the end of the fifth year. The annual coupon rate is 6.15% consistently.
(10) In April 2016, the Group issued RMB30,000 million subordinated bond with a 10-year maturity, a fixed interest rate and a redemption right at the end of the fifth year. The annual coupon rate is 3.74% consistently.
(11) In September 2017, the Group's subsidiary China Industrial Finance Leasing Limited issued RMB2 billion 10-year secondary capital bonds with fixed interest rate and issuer's redemption right at the end of the 5th year. During the tenure of the bonds, the annual interest rate remains at 5.15%.
(12) As at 31 December 2018, the Group had 311 unpaid non-negotiable certificates of deposit with total amount of RMB490,200 million, including 12 USD non-negotiable certificates of deposit, of which the issued par value was USD820 million (RMB5,628 million) and the terms are within 1 year; 1 HKD non-negotiable certificates of deposit, of which the issued par value was HKD200 million, with RMB175 million due within 1 year;. 1 EUR non-negotiable certificates of deposit, of which the issued par value was EUR 85 million, with RMB67 million due within 1 year; and 297 non-negotiable certificates of deposit, of which the issued par value was RMB484,330 million, with RMB465,530 million due within 1 year and the rest due in 2 to 3 years. The annual rate ranged from 2.8% to 4.9%. Except for the 39 interest-bearing debts were paid quarterly, the interest of the rest debts were paid upon maturity.
(13) As at 31 December 2018, Hong Kong branch had 21 unpaid non-negotiable certificates of deposit, of which the amount was RMB9,761 million and the terms are all less than 1 year. The amount of 10 HKD certificates was HKD5,750 million (RMB5,039 million); the amount of 10 USD certificates of deposit was USD650 million (RMB4,461 million). 1 GBP certificates of deposit with issued par value of GBP30 million (RMB261 million). The annual interest rate ranged from 1.16% to 3.56%. The interest of all certificates is paid upon maturity.
(14) In May 2017, the Group's subsidiary, Industrial Bank Financial Leasing Co., Ltd. issued "Jin Xin 2017 Series 1 leasing asset-backed security" amounting RMB4,721 million. As at 31 December 2018, the existing amount of "Jin Xin 2017 Series 1 leasing asset-backed security" is RMB1,420 million, including RMB801 million held by the initiator and RMB21 million held by the Bank. The amount held by the initiator and the bank has been offset in the consolidated financial statements.
(15) In December 2018, the Group's subsidiary, China Industrial International Trust Limited issued a three-year placement note of RMB1,000 million with an annual fixed interest rate of 4.85%.

INDUSTRIAL BANK
204
27. OTHER LIABILITIES
UNIT: RMB Million
The Group The Bank
31/12/2018 31/12/2017 31/12/2018 31/12/2017
Interest payable (1) 46,771 41,293 45,646 39,945
Bank promissory notes 848 119 848 119
Items in the process of clearance and settlement 5,304 2,111 5,304 2,111
Dividend payables 1 1 1 1
Liabilities with continuing involvement 7,641 2,101 7,641 2,101
Wealth management and entrusted investment fund 312 74 312 74
Deferred income 2,889 3,488 993 1,348
Other payables 21,103 28,028 5,678 10,981
Total 84,869 77,215 66,423 56,680
(1) Interest payable
UNIT: RMB Million
The Group The Bank
31/12/2018 31/12/2017 31/12/2018 31/12/2017
Interest of borrowings from Central Bank 4,312 3,581 4,312 3,581
Interest of deposits from banks and other financial institutions 6,719 7,589 6,743 7,599
Interest of placements from banks and other financial institutions 1,655 1,416 824 356
Interest of debt securities issued 3,512 4,505 3,200 4,237
Interest of financial assets sold under repurchase agreements 443 386 443 386
Interest due to customers 29,939 23,352 29,939 23,352
Others 191 464 185 434
Total 46,771 41,293 45,646 39,945

2018 ANNUAL REPORT
205
28. SHARE CAPITAL
UNIT: RMB Million
The Group and the Bank
1/1/2018 Change for the year 31/12/2018
Shares without limited sales restrictionsRMB ordinary shares (A shares) 19,052 - 19,052
Shares with limited sales restrictionsRMB ordinary shares (A shares) 1,722 - 1,722
Total shares 20,774 - 20,774
As at 31 December 2018, the share capital of the Bank is RMB20,774 million (31 December 2017: RMB20,774 million) with par value of RMB1 Yuan per share.
29. OTHER EQUITY INSTRUMENTS
The Bank are approved by CSRC to non-publicly issue domestic preference shares no further than RMB26 billion on 24/11/2014, in which RMB13 billion is initially issued with face value of RMB100 per share and completed in December 2014,which was verified by Deloitte Touche Tohmatsu Certified Public Accountants LLP. In June 2015, the Bank issued the second term of non-publicly domestic preference shares for RMB13 billion, with face value of RMB100 per share, which was verified by Deloitte Touche Tohmatsu Certified Public Accountants LLP. The Bank completed the issue of RMB26 billion domestic preference shares, approved in November 2014, successfully in June 2015.
Outstanding preference shares in the end of the year are as follows:
The Group and the Bank
Outstanding financialinstrument
Time Classification RatePrice(RMB/Share)
Quantity(RMB
million shares)
Amount(RMB
million)Maturity
dateConversion
requirement Condition
Preference shares 12/2014 Equity
instrument Note 1 100 130 13,000 N/A Note 3 N/A
Preference shares 06/2015 Equity
instrument Note 2 100 130 13,000 N/A Note 3 N/A
Note 1: For the first issue of the preference shares, every five year is an interest-bearing cycle from the payment deadline 8 December
2014, the dividend rate is the same in every interest-bearing cycle. The dividend rate of first cycle is determined to be 6.00%
through inquiring, by the Board of Directors in according with the shareholders' meeting authorized combining with some factors
such as national policy when issued, market conditions, specific circumstances of the Bank and requirements of investors. The
dividend rate of preference shares of this issue is not higher than annual weighted average ROE of ordinary shareholders in the
last two fiscal years. The dividend rate of preference shares of this issue is the sum of benchmark interest rate and basic interest
rate, the benchmark interest rate of the first interest-bearing cycle is national debt (which period before payment is for 5 years)
YTM's arithmetic mean (i.e. 3.45%, rounded off to 0.01%), from the fixed-rate national debt yield curve in Bank Debt published
by China Bond Information Website (or any other websites approved by Central Securities Depository Trust and Clearing
Corporation Limited ), 20 days before 8 December 2014 which is the date of the deadline for payment of preference shares
issued (excluding the day). The benchmark interest rate adjusts every 5 years from the deadline for payment of preference
shares issued. The basic interest rate is the dividend rate of first cycle deducting the benchmark interest rate, which is 2.55%.
The basic interest rate will no longer be adjusted since the issue of determining. The coupon interest rate of follow-up period is
current dividend benchmark interest rate plus an interest margin, the benchmark interest rate of current interest-bearing cycle
INDUSTRIAL BANK
206
is national debt (which period before payment is for 5 years) YTM's arithmetic mean (rounded off to 0.01%), from the fixed-rate
national debt yield curve in Bank Debt published by China Bond Information Website (or any other websites approved by Central
Securities Depository Trust and Clearing Corporation Limited), 20 days before benchmark interest rate adjustment date which
is the date of each 5 years of the deadline for payment of preference shares issued (which is 8 December). If the YTM of 5-year
treasury bonds with 5-year maturity is not available on the benchmark interest adjustment day, the benchmark interest rate or
determination principal will be determined under negotiations between the Bank and investors required by regulator.
Note 2: For the second issue of preference shares, every five year is an interest-bearing cycle from the payment deadline 24 June 2015,
the dividend rate is the same in every interest-bearing cycle. The dividend rate of first cycle is determined to be 5.40% through
inquiring, by the Board of Directors in according with the shareholders' meeting authorized combining with some factors such as
national policy when issued, market conditions, specific circumstances of the Bank and requirements of investors. The dividend
rate of preference shares of this issue is not higher than annual weighted average ROE of ordinary shareholders in the last two
fiscal years. The dividend rate of preference shares of this issue is the sum of benchmark interest rate and basic interest rate,
the benchmark interest rate of the first interest-bearing cycle is national debt (which period before payment is for 5 years) YTM's
arithmetic mean (i.e. 3.25%, rounded off to 0.01%), from the fixed-rate national debt yield curve in Bank debt published on www.
chinabond.com.cn (or any other websites approved by Central Securities Depository Trust and Clearing Corporation Limited),
20 days before 24 June 2015 which is the date of the deadline for payment of preference shares issued (excluding the day). The
benchmark interest rate adjusts every 5 years from the deadline for payment of preference shares issued. The basic interest
rate is the dividend rate of first cycle deducting the benchmark interest rate, which is 2.15%. The basic interest rate will no longer
be adjusted since the issue of determining. The coupon interest rate of follow-up period is current dividend benchmark interest
rate plus an interest margin, the benchmark interest rate of current interest-bearing cycle is national debt (which period before
payment is for 5 years) YTM's arithmetic mean (rounded off to 0.01%), from the fixed-rate national debt yield curve in Bank
Debt published on www.chinabond.com.cn (or any other websites approved by Central Securities Depository Trust and Clearing
Corporation Limited ), 20 days before benchmark interest rate adjustment date which is the date of each 5 years of the deadline
for payment of preference shares issued (which is 24 June). If the YTM of 5-year national debt with 5-year maturity is not
available on the benchmark interest adjustment day, the benchmark interest rate or determination principal will be determined
under negotiations between the Bank and investors required by regulator.
Note 3: (1) When the Bank's core tier one capital adequacy ratio fell to 5.125%, the preference shares of this issue will be examined and
decided by the CBIRC in accordance with the relevant requirements of, in accordance with the full mandatory conversion price
into ordinary shares of the Bank, when the preference shares converted into A shares of ordinary share, under any conditions no
longer be restored to preference shares.
(2) When triggered event of the secondary capital instruments issued by the Bank occurs, the preference shares of this issue will
be examined and decided by the CBIRC in accordance with the relevant requirements of, in accordance with the full mandatory
conversion price into ordinary shares of the Bank, when the preference shares converted into A shares of ordinary share, under
any conditions no longer be restored to preference shares. Among them, the secondary capital instruments triggering event
is the earlier of the following two situations: ① the CBIRC identifies if it was not conversion or written down, the Bank will be
unable to survive; ② Relevant departments identify if the public sectors don't inject or offer the same effect support, the Bank will
not survive.

2018 ANNUAL REPORT
207
The principal terms of disclosure (applicable to first and second issue of domestic preference shares):
The Bank will pay preferred dividends in cash. The preference shares of this issue use a non-cumulative dividend payment, which means dividend that is not paid in full to preference shareholders do not accrue interest to next year. After the preference shareholders of this issue obtain distribution in accordance with the agreed dividend rate, they can no longer participate in the distribution of profits remaining.
Under the premise of ensuring the capital adequacy ratio from the regulatory requirements, after the Bank covers losses, extracts mandatory reserve and other reserve, under the case of there still is retained earnings in the Bank's financial statements caliber, the Bank could allocate dividends to preference shareholders. The priority of preference shareholders dividends is higher than ordinary shareholders, payment of preference shares dividends is neither linked to ratings of banks, nor adjusted with the rating changes. The Bank could cancel payment of dividend in any case, and it does not constitute an event of default. The Bank can freely cancel the dividends distribution without constituting a breach of contract. The Bank is entitled to arrange cancelled income as payment to other debts with maturity. Canceling paying dividend shall not constitute any further restrictions on the Bank except income distribution of ordinary shares. When the Bank exercises these rights, it will take full account into the interests of preference shareholders. If payment of dividend for preference shareholders is all or part canceled, the Bank shall not pay ordinary share dividend for the fiscal year.
The right of redemption for preference shares of this issue belongs to the Bank, the Bank exercised the right of conditional redemption is under the premise of the CBIRC's approval, the Bank's preference shareholders do not have the right to request redemption of preference shares and should not form expectations that the preference shares will be redeemed.
The initial mandatory conversion price of the preference shares of this issue is the Bank A shares of ordinary share trading price on the date of 20 days before consideration by the Board of Directors of this preference shares issued, which means that mandatory initial conversion price of preference shares of this issue is RMB9.86 / share. Since the day that the issuance of preference shares program is passed by the Bank's Board of Directors, when the Bank shares change with the delivery of the stock dividend, share capital, issuance of new shares (not including any increasing share capital from conversion of financing instruments with terms that could be converted to ordinary shares) or the allotment of shares, the preference shares will be cumulatively adjusted in turn the forced conversion price in accordance with the established formula , and disclose relevant information in accordance with the provisions.
The Bank's preference shareholders are entitled with priority to ordinary shareholders of the remaining property dividing, the amount paid off is the sum of the neither canceled nor distributed dividends and the total nominal amount of the held preference shares; if it could not cover, then assign by the preference shareholders in proportion to their shareholding.
As of 30 June 2015, the Bank's net proceeds of RMB25,905 million dollars have been all used to supplement the first level capital.
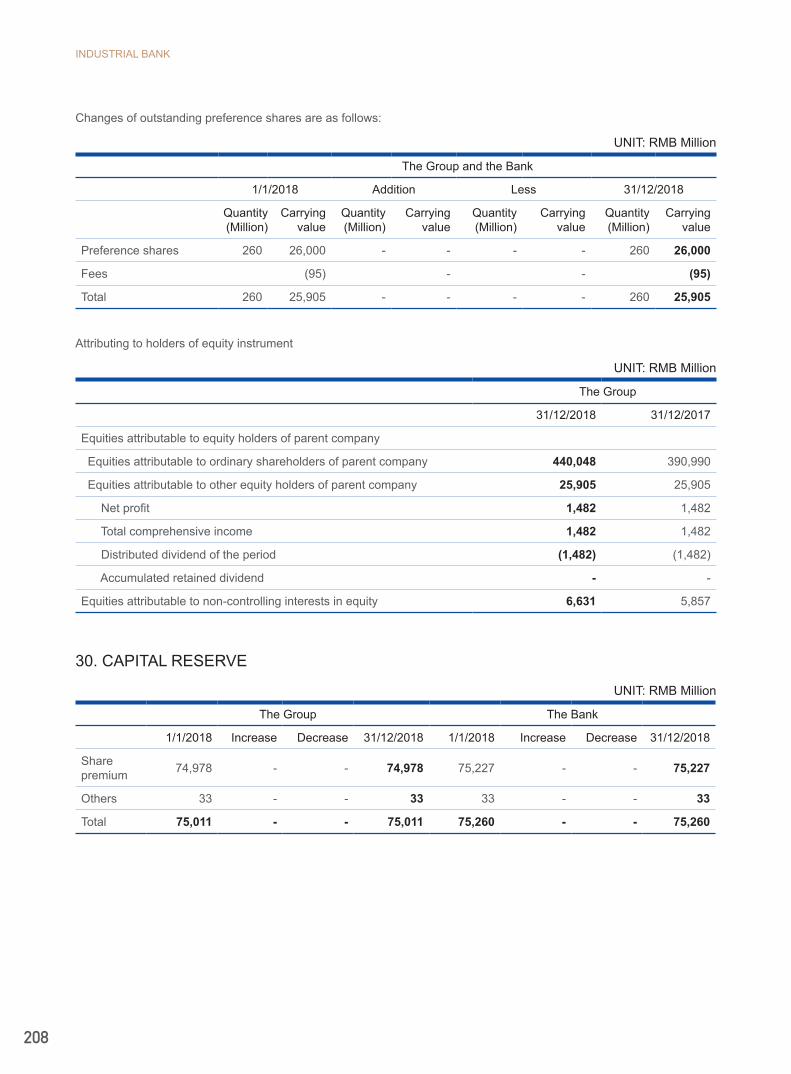
INDUSTRIAL BANK
208
Changes of outstanding preference shares are as follows:
UNIT: RMB Million
The Group and the Bank
1/1/2018 Addition Less 31/12/2018
Quantity(Million)
Carrying value
Quantity (Million)
Carrying value
Quantity(Million)
Carrying value
Quantity(Million)
Carrying value
Preference shares 260 26,000 - - - - 260 26,000
Fees (95) - - (95)
Total 260 25,905 - - - - 260 25,905
Attributing to holders of equity instrument
UNIT: RMB Million
The Group
31/12/2018 31/12/2017
Equities attributable to equity holders of parent company
Equities attributable to ordinary shareholders of parent company 440,048 390,990
Equities attributable to other equity holders of parent company 25,905 25,905
Net profit 1,482 1,482
Total comprehensive income 1,482 1,482
Distributed dividend of the period (1,482) (1,482)
Accumulated retained dividend - -
Equities attributable to non-controlling interests in equity 6,631 5,857
30. CAPITAL RESERVE
UNIT: RMB Million
The Group The Bank
1/1/2018 Increase Decrease 31/12/2018 1/1/2018 Increase Decrease 31/12/2018
Share premium 74,978 - - 74,978 75,227 - - 75,227
Others 33 - - 33 33 - - 33
Total 75,011 - - 75,011 75,260 - - 75,260

2018 ANNUAL REPORT
209
31. SURPLUS RESERVE
UNIT: RMB Million
The Group and the Bank
12/31/2018 12/31/2017
Statutory surplus reserve 10,387 10,387
Discretionary surplus reserve 297 297
Total 10,684 10,684
Under relevant PRC law, the Bank is required to transfer 10% of its net profit to a non-distributable statutory surplus reserve. Appropriation to the statutory surplus reserve may cease when the balance of this reserve has reached 50% of share capital. As of 31 December 2018, the Bank ceased to make appropriations to the statutory surplus reserves since the balance of them have reached 50% of the share capital of the Bank.
32. GENERAL AND REGULATION RESERVE
UNIT: RMB Million
The Group The Bank
2018 2017 2018 2017
General and regulatory reserve 73,422 70,611 69,996 67,888
Pursuant to (CJ[2012] No. 20) Measures on General Provision for Bad and Doubtful Debts for Financial Institutions promulgated by the MOF, the Bank is required to transfer certain percentage of its net profit to establish and maintain a general reserve within shareholders’ equity, through the appropriation of profit to address unidentified potential impairment losses. In principle, the general and regulatory reserve, accounted as profit distribution, should not be lower than 1.5% of the closing balance of gross risk-bearing assets since it is a part of shareholders' equity. Gross risk-bearing assets, include loans and advances to customers, available-for-sale financial assets, held-to-maturity investments, investments classified as receivables, long-term equity investments, deposits with banks and other financial institutions, placements with banks and other financial institutions, foreclosed assets and other receivables and so forth. As at 31 December 2018, the balance of the provision of general risk is 1.5% of the balance of risk-bearing assets at the end of the year. The subsidiaries of the Bank determine the general and regulatory reserve according to the regulation.

INDUSTRIAL BANK
210
33. RETAINED EARNINGS
UNIT: RMB Million
The Group The Bank
2018 2017 2018 2017
Opening balance 214,977 173,524 204,005 165,156
Net profit for the year 60,620 57,200 57,231 54,007
Appropriations to statutory surplus reserve - (860) - (860)
Appropriations to general and regulatory reserve (2,811) (733) (2,108) (144)
Dividends distribution of ordinary shares (13,503) (12,672) (13,503) (12,672)
Dividends distribution of preference shares (1,482) (1,482) (1,482) (1,482)
Closing balance 257,801 214,977 244,143 204,005
(1) "2018 Profit Distribution Proposal of the Bank" approved by the Board of Directors on 29 April 2019 and submitted for approval by the annual general meeting is as follows:
(i) Appropriation of RMB2,108 million to general and regulation reserve. As at 31 December 2018, the proposed appropriation of general and regulation reserve has been included in the general risk reserve.
(ii) Distribute a cash dividend of RMB6.90 per 10 shares (tax inclusive) on the basis of 20,774,190,751 ordinary shares of the Bank at issuance date of the financial statements.
(iii) The interest period of preference shares issued in 2014 is from 1 January 2018 to 31 December 2018 (the annual dividend rate is 6%), the interest period of preference shares issued in 2015 is from 1 January 2018 to 31 December 2018 (the annual dividend rate is 5.4%), the preferred dividends payable is RMB1,482 million in total.
The above profit distribution plan has not been approved by the Annual General Meeting of the Bank. The accounting treatment of dividend distribution scheme before the approval is not carried out.
(2) "2017 Profit Distribution Proposal of the Bank" approved by the Board of Directors on 24 April 2018 and approved by the annual general meeting on 25 May 2018 is as follows:
(i) Appropriation of RMB860 million to statutory surplus reserve on the basis of the Bank's net profit for 2017 amounting to RMB54,007 million . As at 31 December 2017, the proposed appropriation to statutory surplus reserve has been included in the surplus reserve.
(ii) Appropriation of RMB144 million to general and regulation reserve. As at 31 December 2017, the proposed appropriation of general and regulation reserve has been included in the general risk reserve.
(iii) Distribute a cash dividend of RMB6.50 per 10 shares (tax inclusive) on the basis of 20,774,190,751 ordinary shares of the Bank at issuance date of the financial statements.
(iv) The interest period of preference shares issued in 2014 is from 1 January 2017 to 31 December 2017 (the annual dividend rate is 6%), the interest period of preference shares issued in 2015 is from 1 January 2017 to 31 December 2017(the annual dividend rate is 5.4%), the preferred dividends payable is RMB1,482 million in total.
As at 31 December 2018, the above-mentioned dividend distribution has been completed.
(3) Surplus reserve appropriated by subsidiaries
As at 31 December 2018, the balance of the Group's retained earnings include surplus reserve appropriated by subsidiaries amounting to RMB1,613 million (31 December 2017: RMB1,360 million).
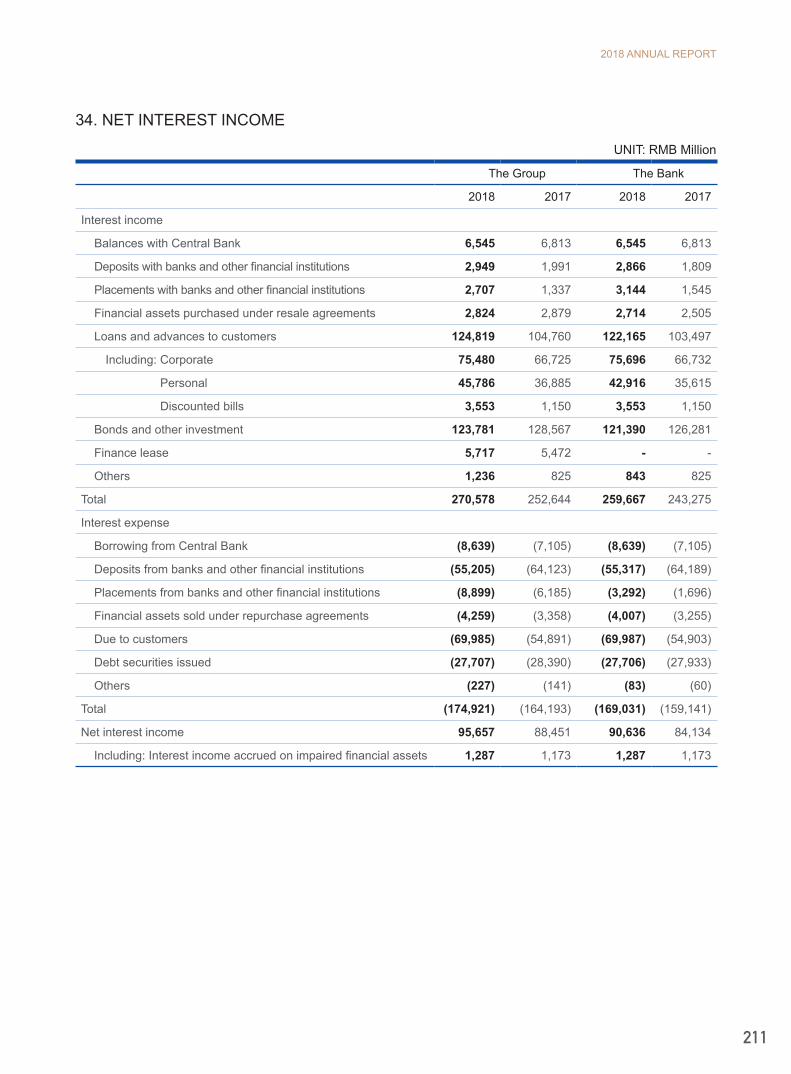
2018 ANNUAL REPORT
211
34. NET INTEREST INCOME
UNIT: RMB Million
The Group The Bank
2018 2017 2018 2017
Interest income
Balances with Central Bank 6,545 6,813 6,545 6,813
Deposits with banks and other financial institutions 2,949 1,991 2,866 1,809
Placements with banks and other financial institutions 2,707 1,337 3,144 1,545
Financial assets purchased under resale agreements 2,824 2,879 2,714 2,505
Loans and advances to customers 124,819 104,760 122,165 103,497
Including: Corporate 75,480 66,725 75,696 66,732
Personal 45,786 36,885 42,916 35,615
Discounted bills 3,553 1,150 3,553 1,150
Bonds and other investment 123,781 128,567 121,390 126,281
Finance lease 5,717 5,472 - -
Others 1,236 825 843 825
Total 270,578 252,644 259,667 243,275
Interest expense
Borrowing from Central Bank (8,639) (7,105) (8,639) (7,105)
Deposits from banks and other financial institutions (55,205) (64,123) (55,317) (64,189)
Placements from banks and other financial institutions (8,899) (6,185) (3,292) (1,696)
Financial assets sold under repurchase agreements (4,259) (3,358) (4,007) (3,255)
Due to customers (69,985) (54,891) (69,987) (54,903)
Debt securities issued (27,707) (28,390) (27,706) (27,933)
Others (227) (141) (83) (60)
Total (174,921) (164,193) (169,031) (159,141)
Net interest income 95,657 88,451 90,636 84,134
Including: Interest income accrued on impaired financial assets 1,287 1,173 1,287 1,173

INDUSTRIAL BANK
212
35. NET FEE AND COMMISSION INCOME
UNIT: RMB Million
The Group The Bank
2018 2017 2018 2017
Fee and commission income
Settlement and clearing fee 1,682 1,190 1,682 1,190
Bank card fee 21,408 13,228 21,408 13,228
Agency fee 2,670 3,059 2,635 3,032
Credit commitment fee 1,526 1,673 1,526 1,673
Transactional service fee 942 602 942 602
Custodian fee 3,405 4,063 3,405 4,063
Consultancy and advisory fee 11,124 14,416 10,202 13,458
Trust service fee 2,118 1,631 - -
Lease service fee 1,053 1,060 - -
Others 1,134 1,105 575 734
Subtotal 47,062 42,027 42,375 37,980
Fee and commission expense
Settlement and clearing expenses (1,204) (810) (1,196) (803)
Bank card expenses (1,349) (1,454) (1,349) (1,454)
Service fee for bond underwriting (278) (109) (278) (109)
Others (1,253) (915) (798) (824)
Subtotal (4,084) (3,288) (3,621) (3,190)
Net fee and commission income 42,978 38,739 38,754 34,790
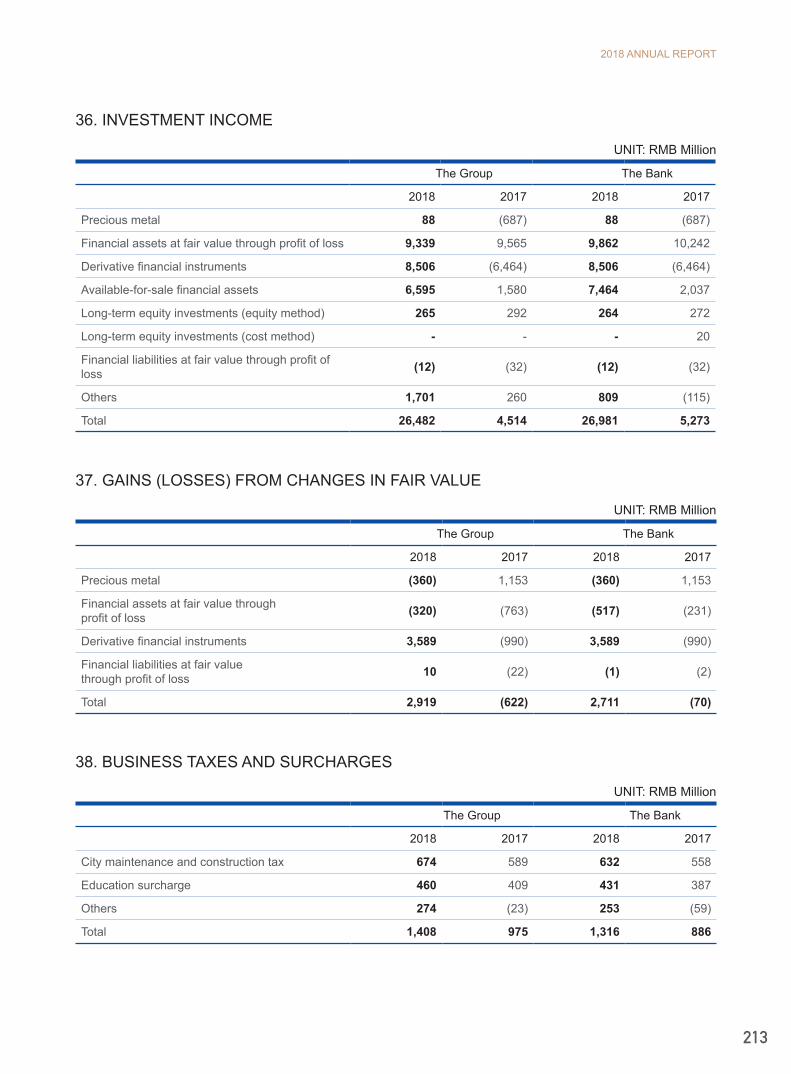
2018 ANNUAL REPORT
213
36. INVESTMENT INCOME
UNIT: RMB Million
The Group The Bank
2018 2017 2018 2017
Precious metal 88 (687) 88 (687)
Financial assets at fair value through profit of loss 9,339 9,565 9,862 10,242
Derivative financial instruments 8,506 (6,464) 8,506 (6,464)
Available-for-sale financial assets 6,595 1,580 7,464 2,037
Long-term equity investments (equity method) 265 292 264 272
Long-term equity investments (cost method) - - - 20
Financial liabilities at fair value through profit of loss (12) (32) (12) (32)
Others 1,701 260 809 (115)
Total 26,482 4,514 26,981 5,273
37. GAINS (LOSSES) FROM CHANGES IN FAIR VALUE
UNIT: RMB Million
The Group The Bank
2018 2017 2018 2017
Precious metal (360) 1,153 (360) 1,153
Financial assets at fair value throughprofit of loss (320) (763) (517) (231)
Derivative financial instruments 3,589 (990) 3,589 (990)
Financial liabilities at fair value through profit of loss 10 (22) (1) (2)
Total 2,919 (622) 2,711 (70)
38. BUSINESS TAXES AND SURCHARGES
UNIT: RMB Million
The Group The Bank
2018 2017 2018 2017
City maintenance and construction tax 674 589 632 558
Education surcharge 460 409 431 387
Others 274 (23) 253 (59)
Total 1,408 975 1,316 886

INDUSTRIAL BANK
214
39. GENERAL AND ADMINISTRATIVE EXPENSES
UNIT: RMB Million
The Group The Bank
2018 2017 2018 2017
Employee benefits 26,229 23,787 23,981 21,895
Depreciation and amortization 2,423 2,052 2,263 1,949
Lease expenses 3,003 2,889 2,804 2,719
R&D expenses 630 457 564 411
Others 9,779 8,945 9,474 8,759
Total 42,064 38,130 39,086 35,733
40. IMPAIRMENT LOSSES ON ASSETS
UNIT: RMB Million
The Group The Bank
2018 2017 2018 2017
Loans and advances to customers 38,067 28,621 37,426 28,429
Investments classified as receivables 5,409 6,290 5,168 6,236
Available-for-sale financial assets 648 (598) 401 (597)
Finance lease receivables 1,128 462 - -
Others 1,152 732 1,614 699
Total 46,404 35,507 44,609 34,767
41. NON-OPERATING INCOME
UNIT: RMB Million
The Group The Bank
2018 2017 2018 2017
Penalties and fines received 53 29 53 29
Gains from dormant accounts 15 10 15 10
Government grants 18 105 6 36
Others 249 229 211 210
Total 335 373 285 285

2018 ANNUAL REPORT
215
42. NON-OPERATING EXPENSES
UNIT: RMB Million
The Group The Bank
2018 2017 2018 2017
Donation expenses 37 21 31 20
Penalties and fines paid 86 389 86 389
Others 49 23 46 22
Total 172 433 163 431
43. INCOME TAX EXPENSES
UNIT: RMB Million
The Group The Bank
2018 2017 2018 2017
Current income tax 12,973 9,915 10,770 8,531
Deferred income tax (6,192) (2,835) (5,205) (2,666)
Adjustment in respect of income tax of prior year 51 (62) 50 (71)
Total 6,832 7,018 5,615 5,794
The tax charges can be reconciled to the profit as follows:
UNIT: RMB Million
The Group The Bank
2018 2017 2018 2017
Accounting profit 68,077 64,753 62,846 59,801
Tax calculated at applicable statutory tax rate of 25% 17,019 16,188 15,712 14,950
Adjustments:
Income not subject to tax (12,105) (9,511) (11,997) (9,399)
Items not deductible for tax purposes 1,867 403 1,850 314
Adjustment in respect of income tax of prior year 51 (62) 50 (71)
Total 6,832 7,018 5,615 5,794

INDUSTRIAL BANK
216
44. EARNINGS PER SHARE
UNIT: RMB Million
The Group
2018 2017
Current net profit attributable to ordinary shareholders of the Bank 59,138 55,718
Weighted average ordinary shares issued by the Bank (shares in million) 20,774 20,344
Basic and diluted earnings per share (RMB) 2.85 2.74
The RMB26,000 million preference shares of the Bank approved in November 2014 were successfully issued in June 2015. When calculating the earnings per share, the current net profit attributed to ordinary shareholders did not include preference shares dividends announced of insurance. In addition, it had no influence on basic earnings per share and diluted earnings per share in 2018 and 2017.

2018 ANNUAL REPORT
217
45. O
THE
R C
OM
PR
EH
EN
SIV
E IN
CO
ME
UN
IT: R
MB
Mill
ion
The
Gro
up
2018
31/1
2/20
17
Am
ount
in
curr
edbe
fore
in
com
e ta
x
Oth
er
com
preh
ensi
vein
com
e tra
nsfe
rred
to p
rofit
and
loss
Inco
me
tax
expe
nse
Bel
ong
to
shar
ehol
ders
of
the
bank
af
ter t
ax
Bel
ong
to n
on-
cont
rolli
ng
inte
rest
saf
ter t
ax
31/1
2/20
18
Oth
er c
ompr
ehen
sive
inco
me
that
will
not
be
subs
eque
ntly
cla
ssifi
ed to
pro
fit a
nd lo
ss
Incl
udin
g: A
ctua
rial p
rofit
s/lo
sses
on
defin
ed b
enefi
t pl
ans
822
(188
)-
-(1
88)
-63
4
Sub
tota
l82
2(1
88)
--
(188
)-
634
Oth
er c
ompr
ehen
sive
inco
me
that
may
be
subs
eque
ntly
cla
ssifi
ed to
pro
fit a
nd lo
ss
Incl
udin
g: P
rofit
and
loss
aris
ing
from
cha
nges
in fa
ir
val
ue o
f ava
ilabl
e-fo
r-sa
le fi
nanc
ial a
sset
s(1
,885
) (1
6,39
9)21
,087
(1,1
72)
3,58
7(7
1)1,
702
Tran
slat
ion
diffe
renc
es o
f fina
ncia
l st
atem
ents
den
omin
ated
in fo
reig
n cu
rren
cies
-24
--
24-
24
Sha
res
of o
ther
com
preh
ensi
ve in
com
e of
as
soci
ates
and
join
t ven
ture
s ac
coun
ted
for u
nder
equ
ity m
etho
d (4
)-
--
--
(4)
Sub
tota
l(1
,889
)(1
6,37
5)21
,087
(1,1
72)
3,61
1(7
1)1,
722
Tota
l(1
,067
)(1
6,56
3)21
,087
(1,1
72)
3,42
3 (
71)
2,35
6
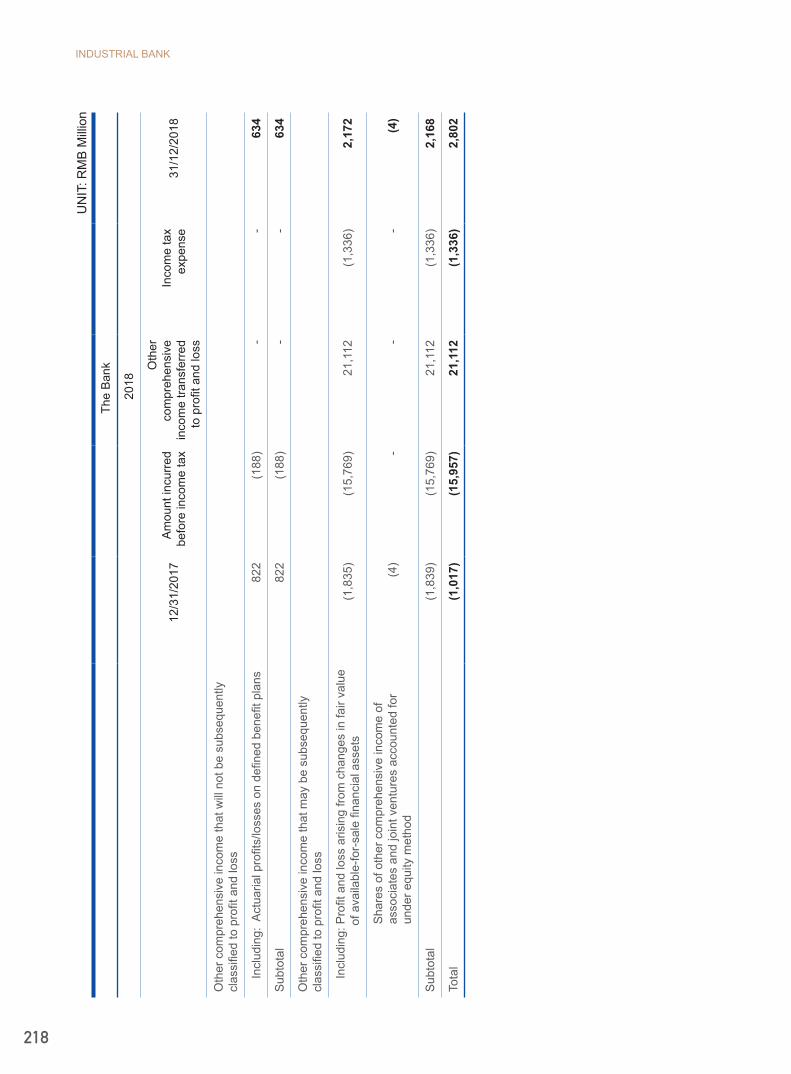
INDUSTRIAL BANK
218
UN
IT: R
MB
Mill
ion
The
Ban
k
201
8
12/3
1/20
17A
mou
nt in
curr
edbe
fore
inco
me
tax
Oth
er
com
preh
ensi
vein
com
e tra
nsfe
rred
to p
rofit
and
loss
Inco
me
tax
expe
nse
31/1
2/20
18
Oth
er c
ompr
ehen
sive
inco
me
that
will
not
be
subs
eque
ntly
cl
assi
fied
to p
rofit
and
loss
Incl
udin
g: A
ctua
rial p
rofit
s/lo
sses
on
defin
ed b
enefi
t pla
ns82
2 (1
88)
--
634
Sub
tota
l82
2 (1
88)
--
634
Oth
er c
ompr
ehen
sive
inco
me
that
may
be
subs
eque
ntly
cl
assi
fied
to p
rofit
and
loss
Incl
udin
g: P
rofit
and
loss
aris
ing
from
cha
nges
in fa
ir va
lue
o
f ava
ilabl
e-fo
r-sa
le fi
nanc
ial a
sset
s(1
,835
)(1
5,76
9)21
,112
(1,3
36)
2,17
2
Sha
res
of o
ther
com
preh
ensi
ve in
com
e of
as
soci
ates
and
join
t ven
ture
s ac
coun
ted
for
unde
r equ
ity m
etho
d (4
)-
--
(4)
Sub
tota
l(1
,839
)(1
5,76
9)21
,112
(1,3
36)
2,16
8
Tota
l(1
,017
)(1
5,95
7)21
,112
(1,3
36)
2,80
2

2018 ANNUAL REPORT
219
46. SUPPLEMENTARY INFORMATION TO THE CASH FLOW STATEMENT
(1) Supplementary information to the cash flow statement
UNIT: RMB Million
The Group The Bank
2018 2017 2018 2017
1. Reconciliation of net profit to cash flows from operating activities
Net profit 61,245 57,735 57,231 54,007
Add: Impairment losses on assets 46,404 35,507 44,609 34,767
Depreciation of fixed assets 1,787 1,551 1,524 1,181
Amortization of intangible assets 116 102 100 89
Amortization of long-term prepaid expenses 671 704 639 679
Gains from disposal of fixed assets, intangible assets and other long-term assets (20) (70) (20) (29)
Interest income of bonds and other investments (123,781) (128,567) (121,390) (126,281)
Interest income of impairment financial assets (1,287) (1,173) (1,287) (1,173)
(Gains) Losses from changes in fair value (2,919) 622 (2,711) 70
Investment income (26,482) (4,514) (26,981) (5,273)
Interest expense for debt securities issued 27,707 28,390 27,706 27,933
Increase in deferred tax assets (6,735) (2,943) (5,746) (2,775)
Increase in deferred tax liabilities 543 108 541 109
Increase in receivables of operating activities (515,206) (437,550) (514,854) (427,653)
Increase in payables of operating activities 181,858 287,456 183,632 272,388
Net cash flow from operating activities (356,099) (162,642) (357,007) (171,961)
2. Changes in cash and cash equivalents
Closing balance of cash and cash equivalents 549,177 470,321 543,622 480,627
Less: Opening balance of cash and cash equivalents 470,321 433,063 480,627 465,783
Net increase of cash and cash equivalents 78,856 37,258 62,995 14,844
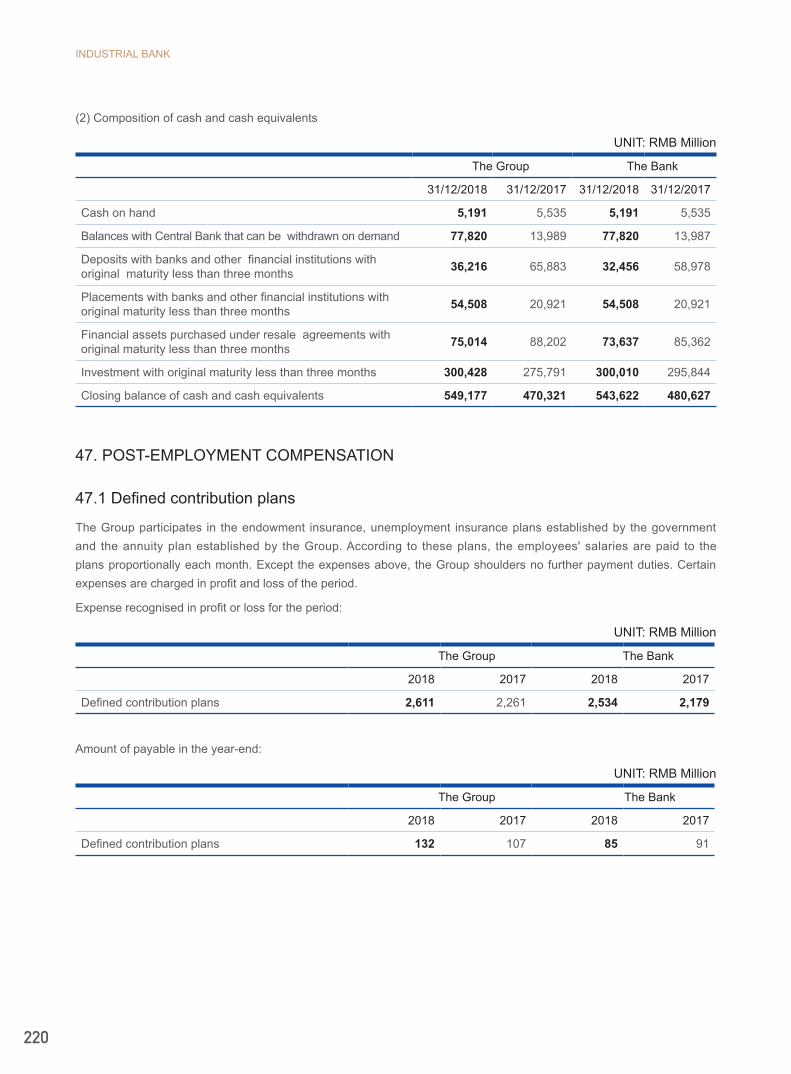
INDUSTRIAL BANK
220
(2) Composition of cash and cash equivalents
UNIT: RMB Million
The Group The Bank
31/12/2018 31/12/2017 31/12/2018 31/12/2017
Cash on hand 5,191 5,535 5,191 5,535
Balances with Central Bank that can be withdrawn on demand 77,820 13,989 77,820 13,987
Deposits with banks and other financial institutions with original maturity less than three months 36,216 65,883 32,456 58,978
Placements with banks and other financial institutions with original maturity less than three months 54,508 20,921 54,508 20,921
Financial assets purchased under resale agreements with original maturity less than three months 75,014 88,202 73,637 85,362
Investment with original maturity less than three months 300,428 275,791 300,010 295,844
Closing balance of cash and cash equivalents 549,177 470,321 543,622 480,627
47. POST-EMPLOYMENT COMPENSATION
47.1 Defined contribution plans
The Group participates in the endowment insurance, unemployment insurance plans established by the government and the annuity plan established by the Group. According to these plans, the employees' salaries are paid to the plans proportionally each month. Except the expenses above, the Group shoulders no further payment duties. Certain expenses are charged in profit and loss of the period.
Expense recognised in profit or loss for the period:
UNIT: RMB Million
The Group The Bank
2018 2017 2018 2017
Defined contribution plans 2,611 2,261 2,534 2,179
Amount of payable in the year-end:
UNIT: RMB Million
The Group The Bank
2018 2017 2018 2017
Defined contribution plans 132 107 85 91
2018 ANNUAL REPORT
221
47.2 Defined benefit plans
The Group offers complementary retiring benefit plans to employees who start their service before 31 December 2007. The Group invited Tower Watson Consulting Group (Shanghai) to estimate the present value. The project estimates the future cash flow based on rate of inflation and rate of death, and recognizes its present value by discount rate. Discount rate is measured by the national debt market income rate in which the period of defined benefit plans and currency on balance sheet date. Past service costs will be charged in profit and loss in the period of revising the plans. The net interest is recognized by the net liabilities or assets of defined benefit plans timing appropriate discount rate.
In the Current year, the effect of defined benefit plans recognized as expenses is RMB136 million; actuary losses included in other comprehensive income is RMB188 million. The closing balance of net assets of defined benefit plans amounting to RMB1,088 million, representing the fair value of the defined benefit plans assets net of the present value of defined benefit plans obligation, is charged to other assets. (Note VIII, 17).
As of 31 December 2018, the Group benefit plans set was in the period of the average benefit obligation for about 7-8 years (31 December 2017:10-11 years).
Defined benefit plan makes the Group face the actuarial risks that include interest rate risk and longevity risk. Government bond yielding down will lead to a defined benefit plan duty value added. The present value of defined benefit plan duty is calculated based on the best estimate of employees participating in the scheme of the mortality rate, and the increase in life expectancy will lead to an increase in plan liabilities.
In determining the set of major actuarial present value using the benefit plan obligations assumed discount rate, mortality rate. The discount rate is 3.25% (2017: 4.00%) as at 31 December 2018. Mortality assumptions are based on the men and women pension service table released by Chinese Insurance Regulatory Commission (China experience life table of life insurance "2010-2013"). The men and women workers retire at the age of 60 and retired at the age of 55 on average expected residual life for 25.34 years and 34.03 years respectively.
The following sensitivity analysis is based on the reasonably possible changes of corresponding hypothesis that occurring at the end of the reporting period (all other assumptions unchanged):
If the discount rate increase (decrease) by 25 basis points, then the present value of defined benefit plan duty will be reduced by RMB43 million (an increase of RMB45 million).
As part of hypothesis may have relevance, a hypothesis cannot be isolated to change, so the sensitivity analysis cannot reflect the actual changes in benefit obligations set value.
In the sensitivity analysis, the net debt of defined benefit plan and the related debt recognized in the statement of financial position share the same calculation method.
Compared with the previous year, the method for sensitivity analysis and the hypothesis didn’t change.
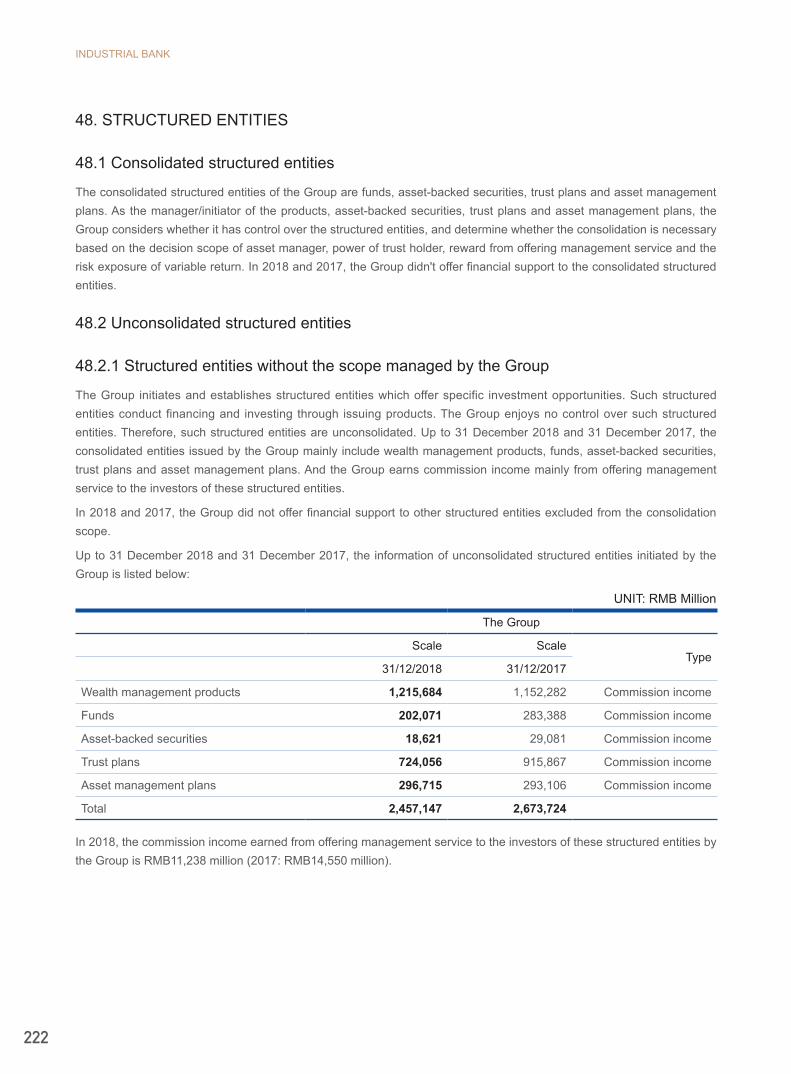
INDUSTRIAL BANK
222
48. STRUCTURED ENTITIES
48.1 Consolidated structured entities
The consolidated structured entities of the Group are funds, asset-backed securities, trust plans and asset management plans. As the manager/initiator of the products, asset-backed securities, trust plans and asset management plans, the Group considers whether it has control over the structured entities, and determine whether the consolidation is necessary based on the decision scope of asset manager, power of trust holder, reward from offering management service and the risk exposure of variable return. In 2018 and 2017, the Group didn't offer financial support to the consolidated structured entities.
48.2 Unconsolidated structured entities
48.2.1 Structured entities without the scope managed by the Group
The Group initiates and establishes structured entities which offer specific investment opportunities. Such structured entities conduct financing and investing through issuing products. The Group enjoys no control over such structured entities. Therefore, such structured entities are unconsolidated. Up to 31 December 2018 and 31 December 2017, the consolidated entities issued by the Group mainly include wealth management products, funds, asset-backed securities, trust plans and asset management plans. And the Group earns commission income mainly from offering management service to the investors of these structured entities.
In 2018 and 2017, the Group did not offer financial support to other structured entities excluded from the consolidation scope.
Up to 31 December 2018 and 31 December 2017, the information of unconsolidated structured entities initiated by the Group is listed below:
UNIT: RMB Million
The Group
Scale ScaleType
31/12/2018 31/12/2017
Wealth management products 1,215,684 1,152,282 Commission income
Funds 202,071 283,388 Commission income
Asset-backed securities 18,621 29,081 Commission income
Trust plans 724,056 915,867 Commission income
Asset management plans 296,715 293,106 Commission income
Total 2,457,147 2,673,724
In 2018, the commission income earned from offering management service to the investors of these structured entities by the Group is RMB11,238 million (2017: RMB14,550 million).
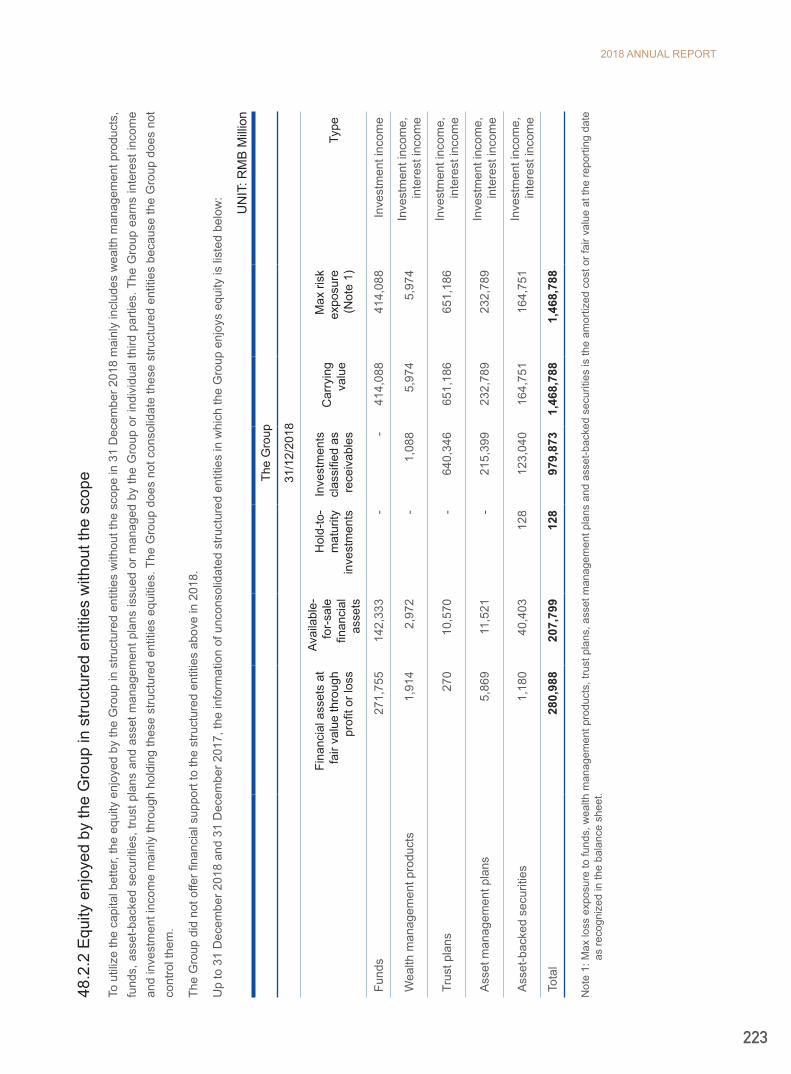
2018 ANNUAL REPORT
223
48.2
.2 E
quity
enj
oyed
by
the
Gro
up in
stru
ctur
ed e
ntiti
es w
ithou
t the
sco
pe
To u
tiliz
e th
e ca
pita
l bet
ter,
the
equi
ty e
njoy
ed b
y th
e G
roup
in s
truct
ured
ent
ities
with
out t
he s
cope
in 3
1 D
ecem
ber 2
018
mai
nly
incl
udes
wea
lth m
anag
emen
t pro
duct
s,
fund
s, a
sset
-bac
ked
secu
ritie
s, tr
ust p
lans
and
ass
et m
anag
emen
t pla
ns is
sued
or m
anag
ed b
y th
e G
roup
or i
ndiv
idua
l thi
rd p
artie
s. T
he G
roup
ear
ns in
tere
st in
com
e an
d in
vest
men
t inc
ome
mai
nly
thro
ugh
hold
ing
thes
e st
ruct
ured
ent
ities
equ
ities
. The
Gro
up d
oes
not c
onso
lidat
e th
ese
stru
ctur
ed e
ntiti
es b
ecau
se th
e G
roup
doe
s no
t co
ntro
l the
m.
The
Gro
up d
id n
ot o
ffer fi
nanc
ial s
uppo
rt to
the
stru
ctur
ed e
ntiti
es a
bove
in 2
018.
Up
to 3
1 D
ecem
ber 2
018
and
31 D
ecem
ber 2
017,
the
info
rmat
ion
of u
ncon
solid
ated
stru
ctur
ed e
ntiti
es in
whi
ch th
e G
roup
enj
oys
equi
ty is
list
ed b
elow
:
UN
IT: R
MB
Mill
ion
The
Gro
up
31/1
2/20
18
Fina
ncia
l ass
ets
at
fair
valu
e th
roug
h pr
ofit o
r los
s
Avai
labl
e-fo
r-sa
le
finan
cial
as
sets
Hol
d-to
-m
atur
ity
inve
stm
ents
Inve
stm
ents
clas
sifie
d as
re
ceiv
able
s
Car
ryin
g va
lue
Max
risk
ex
posu
re
(Not
e 1)
Type
Fund
s27
1,75
514
2,33
3-
-41
4,08
841
4,08
8In
vest
men
t inc
ome
Wea
lth m
anag
emen
t pro
duct
s1,
914
2,97
2-
1,08
85,
974
5,97
4In
vest
men
t inc
ome,
in
tere
st in
com
e
Trus
t pla
ns27
010
,570
-64
0,34
6 65
1,18
665
1,18
6In
vest
men
t inc
ome,
in
tere
st in
com
e
Ass
et m
anag
emen
t pla
ns5,
869
11,5
21-
215,
399
232,
789
232,
789
Inve
stm
ent i
ncom
e,
inte
rest
inco
me
Ass
et-b
acke
d se
curit
ies
1,18
040
,403
128
123,
040
164,
751
164,
751
Inve
stm
ent i
ncom
e,
inte
rest
inco
me
Tota
l28
0,98
820
7,79
912
897
9,87
31,
468,
788
1,46
8,78
8
Not
e 1:
Max
loss
exp
osur
e to
fund
s, w
ealth
man
agem
ent p
rodu
cts,
trus
t pla
ns, a
sset
man
agem
ent p
lans
and
ass
et-b
acke
d se
curit
ies
is th
e am
ortiz
ed c
ost o
r fai
r val
ue a
t the
repo
rting
dat
e as
reco
gniz
ed in
the
bala
nce
shee
t.

INDUSTRIAL BANK
224
UN
IT: R
MB
Mill
ion
The
Gro
up
31/1
2/20
17
Fina
ncia
l as
sets
hel
dun
der
resa
le
agre
emen
t
Fina
ncia
l ass
ets at
fair
valu
e th
roug
h pr
ofit o
r los
s
Avai
labl
e-fo
r-sa
le
finan
cial
as
sets
Hol
d-to
-m
atur
ity
inve
stm
ents
Inve
stm
ents
cl
assi
fied
as
rece
ivab
les
Car
ryin
g va
lue
Max
risk
ex
posu
re(N
ote
1)Ty
pe
Fund
s-
216,
511
81,4
89-
-29
8,00
029
8,00
0In
vest
men
t inc
ome
Wea
lth m
anag
emen
t pro
duct
s-
32,
848
-84
,614
87,4
6587
,465
Inve
stm
ent i
ncom
e,
inte
rest
inco
me
Trus
t pla
ns80
016
29,
832
-80
5,44
181
6,23
581
6,23
5In
vest
men
t inc
ome,
in
tere
st in
com
e
Ass
et m
anag
emen
t pla
ns3,
302
3,78
414
,541
-31
5,45
833
7,08
533
7,08
5In
vest
men
t inc
ome,
in
tere
st in
com
e
Ass
et-b
acke
d se
curit
ies
-2,
635
29,3
354
242,
125
274,
099
274,
099
Inve
stm
ent i
ncom
e,
inte
rest
inco
me
Tota
l4,
102
223,
095
138,
045
41,
447,
638
1,81
2,88
41,
812,
884
Not
e 1:
Max
loss
exp
osur
e to
fund
s, w
ealth
man
agem
ent p
rodu
cts,
trus
t pla
ns, a
sset
man
agem
ent p
lans
and
ass
et-b
acke
d se
curit
ies
is th
e am
ortiz
ed c
ost o
r fai
r val
ue a
t the
repo
rting
dat
e as
reco
gniz
ed in
the
bala
nce
shee
t.

2018 ANNUAL REPORT
225
IX. SEGMENT REPORTINGSenior management of the Group evaluates the operations of the Group in accordance with their economic areas of the respective branches and subsidiaries. Each branch serves its local customers and few customers in other regions. The Group does not deeply depend on one single external customer. Through the review of internal reports, the management of the Group conducts performance evaluation and determines the allocation of resources. Segment reporting is presented in a manner consistent with the Group's internal management and reports.
Segment accounting policies are consistent with the accounting policies of the consolidated financial statements. Inter-segment transfer transactions are measured at the actual transaction prices.
The Group includes the head office (including the head office and the operating institutions of the head office), Fujian, Beijing, Shanghai, Guangdong, Zhejiang, Jiangsu, northeast and other region, western region, central region, a total of ten segments, of which branches within the northeast and other region, western region, central region are presented in a consolidated manner.
Among them, the northeast and other region includes: Harbin branch, Changchun branch, Shenyang branch, Dalian branch, Tianjin branch, Jinan branch, Qingdao branch, Haikou branch, Hong Kong branch and Industrial Bank Financial Leasing Co., Ltd.;
Western region includes: Chengdu branch, Chongqing branch, Guiyang branch, Xi'an branch, Kunming branch, Nanning branch, Urumqi branch, Lanzhou branch, Yinchuan branch, Xining branch and Lhasa branch.
Central region includes: Hohhot branch, Shijiazhuang branch, Zhengzhou branch, Taiyuan branch, Hefei branch, Changsha branch, Wuhan branch and Nanchang branch.

INDUSTRIAL BANK
226
UN
IT: R
MB
Mill
ion
The
Gro
up
2018
Hea
d of
fice
Fujia
nB
eijin
gS
hang
hai
Gua
ngdo
ngZh
ejia
ngJi
angs
uN
orth
east
an
d o
ther
re
gion
Wes
tern
re
gion
Cen
tral
regi
onE
limin
atio
nsTo
tal
Ope
ratin
g in
com
e62
,453
19,8
927,
089
6,34
09,
943
3,82
55,
988
14,2
4314
,486
14,0
28-
158,
287
Net
inte
rest
inco
me
18,6
3813
,982
6,42
25,
508
8,71
63,
171
5,27
49,
200
13,0
1611
,730
-95
,657
Incl
udin
g: N
et in
ter-
segm
ent
inte
rest
inco
me
(67,
656)
6,57
911
,729
9,72
611
,878
1,59
61,
148
5,87
410
,546
8,58
0-
-
Net
fee
and
com
mis
sion
inco
me
28,4
124,
422
627
763
1,03
560
865
02,
992
1,31
32,
156
-42
,978
Oth
er in
com
e15
,403
1,48
840
6919
246
642,
051
157
142
-19
,652
Ope
ratin
g ex
pens
es(2
6,53
8)(1
1,69
1)(2
,846
)(2
,626
)(5
,874
)(3
,166
)(3
,220
)(1
6,09
9)(9
,657
)(8
,656
)-
(90,
373)
Ope
ratin
g pr
ofit
35,9
158,
201
4,24
33,
714
4,06
965
92,
768
(1,8
56)
4,82
95,
372
-67
,914
Add
: Non
-ope
ratin
g in
com
e64
687
2762
1013
4813
23-
335
Less
: Non
-ope
ratin
g ex
pens
es(6
9)(2
9)(2
)(3
)(1
5)(7
)(3
)(1
4) (8
)(2
2)-
(172
)
Tota
l pro
fit35
,910
8,24
04,
248
3,73
84,
116
662
2,77
8(1
,822
)4,
834
5,37
3-
68,0
77
Less
: Inc
ome
tax
expe
nses
(6,8
32)
Net
pro
fit61
,245
Seg
men
t ass
ets
3,75
7,97
753
7,22
555
4,17
538
3,86
869
1,66
925
4,73
636
0,37
783
8,75
853
5,36
969
8,54
1(1
,933
,355
)6,
679,
340
Incl
udin
g: In
vest
men
t in
an
asso
ciat
e3,
224
Und
istri
bute
d as
sets
32,3
17
Tota
l ass
ets
6,71
1,65
7
Seg
men
t lia
bilit
ies
3,39
2,73
750
6,85
155
0,32
437
8,71
568
7,50
525
3,45
435
7,59
882
1,54
853
0,71
4 6
92,9
82(1
,933
,355
)6,
239,
073
Und
istri
bute
d lia
bilit
ies
-
Tota
l lia
bilit
ies
6,23
9,07
3
Sup
plem
enta
l inf
orm
atio
n
Cre
dit c
omm
itmen
ts28
4,43
559
,244
24,8
3732
,968
95,9
7643
,599
72,8
9716
7,25
111
7,48
419
2,87
3-
1,09
1,56
4
Dep
reci
atio
n an
d am
ortiz
atio
n40
636
611
869
155
9716
735
129
140
3-
2,42
3
Cap
ital e
xpen
ditu
res
1,70
965
213
460
314
311
012
01,
762
353
566
-6,
152

2018 ANNUAL REPORT
227
UN
IT: R
MB
Mill
ion
The
Gro
up -
cont
inue
d
2017
Hea
d of
fice
Fujia
nB
eijin
gS
hang
hai
Gua
ngdo
ngZh
ejia
ngJi
angs
u
Nor
thea
st
and
othe
r re
gion
Wes
tern
regi
onC
entra
lre
gion
Elim
inat
ions
Tota
l
Ope
ratin
g in
com
e50
,903
17,5
637,
359
7,76
79,
959
2,15
33,
438
14,2
6311
,406
15,1
64-
139,
975
Net
inte
rest
inco
me
19,7
4112
,557
6,23
46,
208
8,19
81,
397
2,28
68,
771
9,73
713
,322
-88
,451
Incl
udin
g: N
et in
ter-
segm
ent
inte
rest
inco
me
(67,
542)
7,68
110
,112
9,33
311
,666
976
402
6,63
99,
903
10,8
30-
-
Net
fee
and
com
mis
sion
inco
me
21,9
974,
025
1,07
31,
514
1,67
573
61,
119
3,21
51,
603
1,78
2-
38,7
39
Oth
er in
com
e9,
165
981
5245
8620
332,
277
6660
-12
,785
Ope
ratin
g ex
pens
es(1
7,68
3)(1
0,89
9) (1
,475
)(1
,908
)(4
,492
)(3
,481
)(3
,310
)(1
0,77
5)(1
1,52
8)(9
,611
)-
(75,
162)
Ope
ratin
g pr
ofit
33,2
206,
664
5,88
45,
859
5,46
7(1
,328
)12
83,
488
(122
)5,
553
-64
,813
Add
: Non
-ope
ratin
g in
com
e44
106
520
1918
1520
9234
-37
3
Less
: Non
-ope
ratin
g ex
pens
es(4
)(1
2)(1
2)(7
)(5
)(4
)(1
)(2
39)
(10)
(139
)-
(433
)
Tota
l pro
fit33
,260
6,75
85,
877
5,87
25,
481
(1,3
14)
142
3,26
9(4
0)5,
448
-64
,753
Less
: Inc
ome
tax
expe
nses
(7
,018
)
Net
pro
fit
57,7
35
Seg
men
t ass
ets
3,72
7,90
750
6,94
048
7,65
638
6,21
768
6,74
922
1,85
832
8,01
580
5,37
155
5,33
669
1,50
4(2
,008
,008
)6,
389,
545
Incl
udin
g: In
vest
men
t in
an
asso
ciat
e
3,00
8
Und
istri
bute
d as
sets
27,2
97
Tota
l ass
ets
6,41
6,84
2
Seg
men
t lia
bilit
ies
3,39
1,82
748
5,30
648
1,60
337
9,60
268
1,33
222
3,15
332
7,87
379
0,01
755
5,49
7 6
85,8
88(2
,008
,008
)5,
994,
090
Und
istri
bute
d lia
bilit
ies
-
Tota
l lia
bilit
ies
5,99
4,09
0
Sup
plem
enta
l inf
orm
atio
n
Cre
dit c
omm
itmen
ts20
8,12
759
,613
20,9
4311
,970
57,5
0431
,820
46,4
0914
8,08
696
,080
158,
725
-83
9,27
7
Dep
reci
atio
n an
d am
ortiz
atio
n35
728
110
262
154
7815
127
924
034
8-
2,05
2
Cap
ital e
xpen
ditu
res
511
546
2136
481
7111
74,
021
535
369
-6,
708

INDUSTRIAL BANK
228
X. RELATED PARTY RELATIONSHIP AND TRANSACTIONS
1. Related Party Relationship
The Group
Related parties with no controlling interest
(1) Shareholders holding more than 5% (inclusive) of the Bank’s shares
Name Economic nature
Place ofregistration
Registered capital
(RMB 100 Million)
Principal activities
Legalrepresentative
The Finance Bureau of Fujian Province
Legal entity of government
agenciesFuzhou -
Administration of Fujian
provincial fiscal and tax policy
Yu Jun
PICC Property and Casualty Company Limited (1)
Incorporated Company
Beijing 222.43 Insurance services Miao Jianmin
PICC Life Insurance Company Limited (1)
Incorporated Company
Beijing
257.61
Insurance services Miao Jianmin
China National Tobacco Corporation(1) Owned by thewhole people Beijing 570
Production, and sales
of tobacco products
Zhang Jianmin
Fujian Tobacco Haisheng Investment Management Co., Ltd. (1)
Limited Company Xiamen 26.47 Investment
management Lu Xiaodong
China Tobacco Hunan Investment Management Co., Ltd. (1)
Limited Company Changsha 2 Investment
management Deng Yongzhi
The People’s Insurance Company (Group) of China Limited (1)
IncorporatedCompany Beijing 424.24
Investment management
and insurance services
Miao Jianmin
Fujian Company of China National Tobacco Corporation (1)
Owned by thewhole people Fuzhou 1.37
Sales of tobacco
productsZhang Yongjun
Guangdong Company ofChina national Tobacco Corporation (1)
Owned by thewhole people Guangzhou 1.40
Production and sales oftobacco
products
Liu Yiping
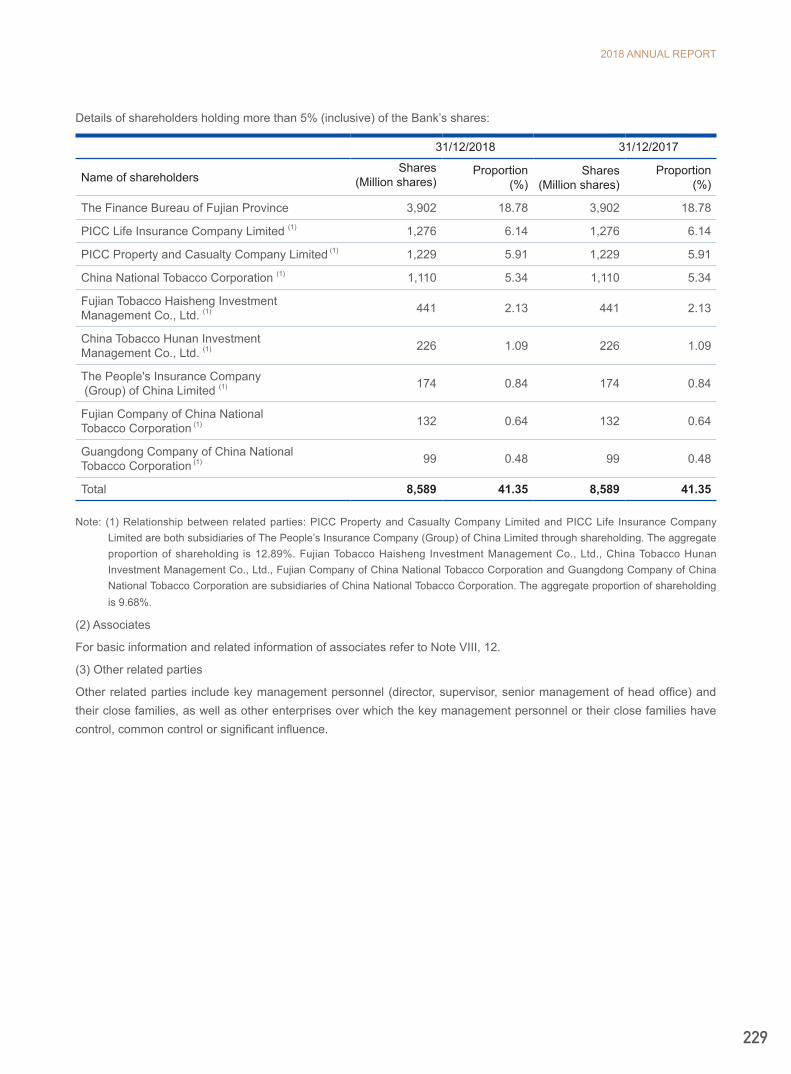
2018 ANNUAL REPORT
229
Details of shareholders holding more than 5% (inclusive) of the Bank’s shares:
31/12/2018 31/12/2017
Name of shareholdersShares
(Million shares)Proportion
(%)Shares
(Million shares)Proportion
(%)
The Finance Bureau of Fujian Province 3,902 18.78 3,902 18.78
PICC Life Insurance Company Limited (1) 1,276 6.14 1,276 6.14
PICC Property and Casualty Company Limited (1) 1,229 5.91 1,229 5.91
China National Tobacco Corporation (1) 1,110 5.34 1,110 5.34
Fujian Tobacco Haisheng Investment Management Co., Ltd. (1) 441 2.13 441 2.13
China Tobacco Hunan Investment Management Co., Ltd. (1) 226 1.09 226 1.09
The People's Insurance Company (Group) of China Limited (1) 174 0.84 174 0.84
Fujian Company of China National Tobacco Corporation (1) 132 0.64 132 0.64
Guangdong Company of China National Tobacco Corporation (1) 99 0.48 99 0.48
Total 8,589 41.35 8,589 41.35
Note: (1) Relationship between related parties: PICC Property and Casualty Company Limited and PICC Life Insurance Company Limited are both subsidiaries of The People’s Insurance Company (Group) of China Limited through shareholding. The aggregate proportion of shareholding is 12.89%. Fujian Tobacco Haisheng Investment Management Co., Ltd., China Tobacco Hunan Investment Management Co., Ltd., Fujian Company of China National Tobacco Corporation and Guangdong Company of China National Tobacco Corporation are subsidiaries of China National Tobacco Corporation. The aggregate proportion of shareholding is 9.68%.
(2) Associates
For basic information and related information of associates refer to Note VIII, 12.
(3) Other related parties
Other related parties include key management personnel (director, supervisor, senior management of head office) and their close families, as well as other enterprises over which the key management personnel or their close families have control, common control or significant influence.

INDUSTRIAL BANK
230
2. Related party transactions
The conditions and prices of related party transactions between the Group and the Bank are determined according to the Group's contract, and are examined and approved in accordance with the transaction type and content of transaction by corresponding decision-making authority.
2.1 Interest income
UNIT: RMB Million
Related party 2018 2017
The People's Insurance Company (Group) of China Limited and its related parties 84 128
China Tobacco and its related parties - 25
Associates 137 87
Fujian Yango Holdings Group and its related parties 474 152
Fujian I&D Group Co., Ltd. and its related parties 30 29
Zhejiang Energy Group Co., Ltd. and its related parties 1 -
Xiamen International Bank Co., Ltd. 1 3
Xiamen Air - 12
Others 55 1
Total 782 437
2.2 Interest expense
UNIT: RMB Million
Related party 2018 2017
The Finance Bureau of Fujian Province and its subsidiaries 325 296
The People's Insurance Company (Group) of China Limited and its related parties 369 463
China Tobacco and its related parties 1,619 947
Associates 12 4
Fujian Yango Holdings Group and its related parties 50 59
Fujian I&D Group Co., Ltd. and its related parties 44 8
Zhejiang Energy Group Co., Ltd. and its related parties 26 -
Longyan Huijin Development Group Co., Ltd. and its related parties 11 -
Xiamen International Bank Co., Ltd. 1 10
Others 40 16
Total 2,497 1,803
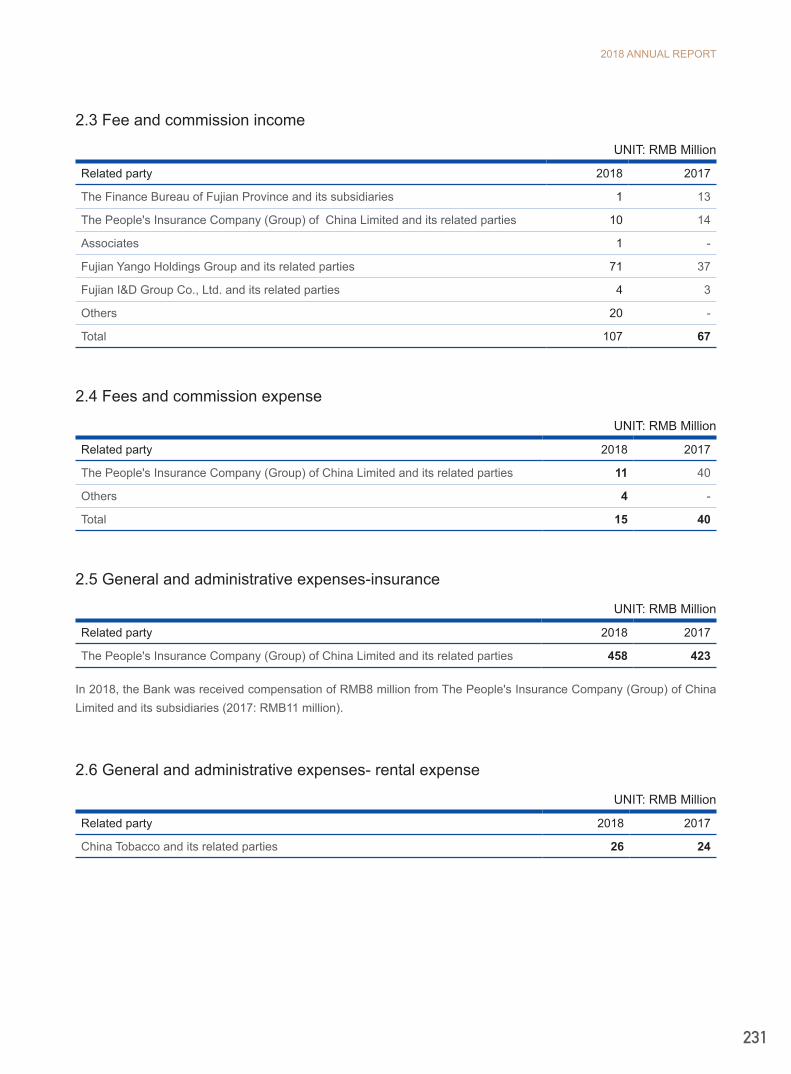
2018 ANNUAL REPORT
231
2.3 Fee and commission income
UNIT: RMB Million
Related party 2018 2017
The Finance Bureau of Fujian Province and its subsidiaries 1 13
The People's Insurance Company (Group) of China Limited and its related parties 10 14
Associates 1 -
Fujian Yango Holdings Group and its related parties 71 37
Fujian I&D Group Co., Ltd. and its related parties 4 3
Others 20 -
Total 107 67
2.4 Fees and commission expense
UNIT: RMB Million
Related party 2018 2017
The People's Insurance Company (Group) of China Limited and its related parties 11 40
Others 4 -
Total 15 40
2.5 General and administrative expenses-insurance
UNIT: RMB Million
Related party 2018 2017
The People's Insurance Company (Group) of China Limited and its related parties 458 423
In 2018, the Bank was received compensation of RMB8 million from The People's Insurance Company (Group) of China Limited and its subsidiaries (2017: RMB11 million).
2.6 General and administrative expenses- rental expense
UNIT: RMB Million
Related party 2018 2017
China Tobacco and its related parties 26 24
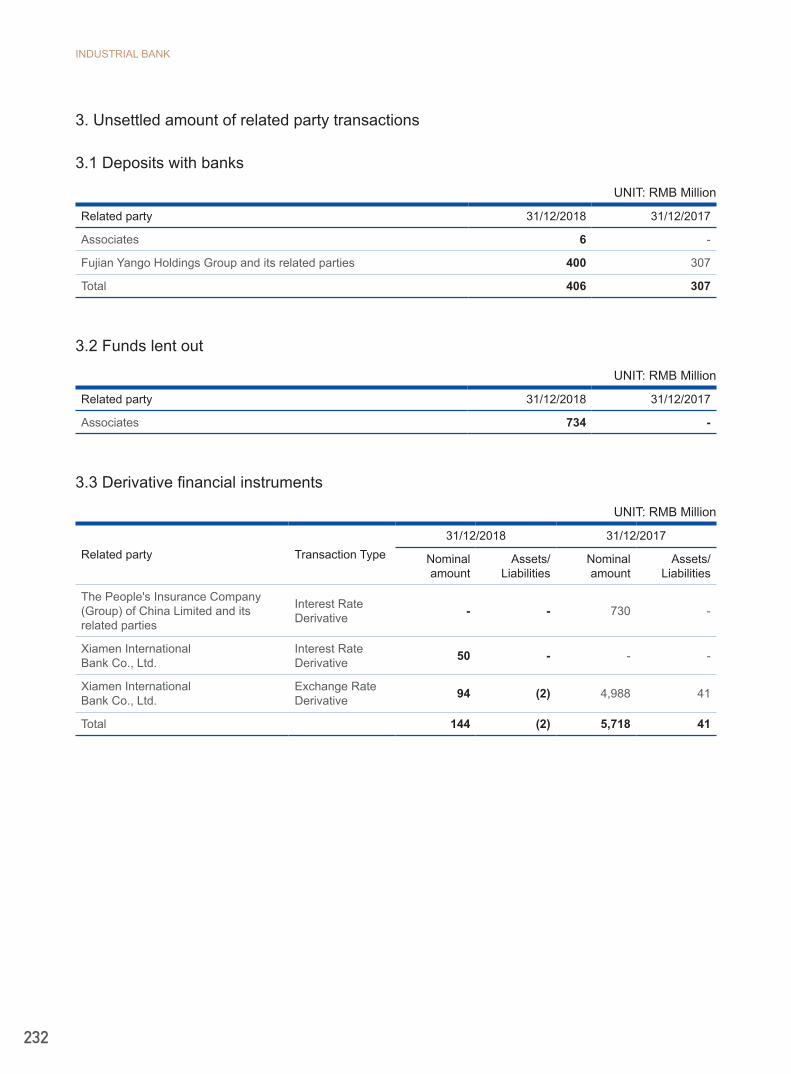
INDUSTRIAL BANK
232
3. Unsettled amount of related party transactions
3.1 Deposits with banks
UNIT: RMB Million
Related party 31/12/2018 31/12/2017
Associates 6 -
Fujian Yango Holdings Group and its related parties 400 307
Total 406 307
3.2 Funds lent out
UNIT: RMB Million
Related party 31/12/2018 31/12/2017
Associates 734 -
3.3 Derivative financial instruments
UNIT: RMB Million
Related party Transaction Type31/12/2018 31/12/2017
Nominal amount
Assets/Liabilities
Nominal amount
Assets/Liabilities
The People's Insurance Company (Group) of China Limited and its related parties
Interest Rate Derivative - - 730 -
Xiamen International Bank Co., Ltd.
Interest Rate Derivative 50 - - -
Xiamen International Bank Co., Ltd.
Exchange Rate Derivative 94 (2) 4,988 41
Total 144 (2) 5,718 41

2018 ANNUAL REPORT
233
3.4 Interest receivable
UNIT: RMB Million
Related party 31/12/2018 31/12/2017
The People's Insurance Company (Group) of China Limited and its related parties 7 52
Associates 63 26
Fujian Yango Holdings Group and its related parties 63 62
Fujian I&D Group Co., Ltd. and its related parties 2 7
Xiamen International Bank Co., Ltd. 1 -
Others 2 -
Total 138 147
3.5 Available-for-sale financial assets
UNIT: RMB Million
Related party 31/12/2018 31/12/2017
Fujian Yango Holdings Group and its related parties - 112
Fujian I&D Group Co., Ltd. and its related parties - 120
Xiamen International Bank Co., Ltd. 400 147
Others 30 -
Total 430 379
3.6 Investments classified as receivables
UNIT: RMB Million
Related party 31/12/2018 31/12/2017
The People's Insurance Company (Group) of China Limited and its related parties 600 2,400
Associates 4,949 5,330
Fujian Yango Holdings Group and its related parties 5,781 4,488
Others 1,552 -
Total 12,882 12,218

INDUSTRIAL BANK
234
3.7 Held-for-trading financial assets
UNIT: RMB Million
Related party 31/12/2018 31/12/2017
Fujian Yango Holdings Group and its related parties 441 513
Fujian I&D Group Co., Ltd. and its related parties - 460
Xiamen International Bank Co., Ltd. 2,840 393
Total 3,281 1,366
3.8 Loans and advances to customers
UNIT: RMB Million
Related party 31/12/2018 31/12/2017
The People's Insurance Company (Group) of China Limited and its related parties 50 -
Fujian Yango Holdings Group and its related parties 4,187 3,068
Fujian I&D Group Co., Ltd. and its related parties 3,151 -
Zhejiang Energy Group Co., Ltd. and its related parties 250 -
Others 45 16
Total 7,683 3,084
3.9 Deposits from banks and other financial institution
UNIT: RMB Million
Related party 31/12/2018 31/12/2017
Associates 31 213
Fujian Yango Holdings Group and its related parties 15 83
Xiamen International Bank Co., Ltd. 2 82
Others 100 369
Total 148 747
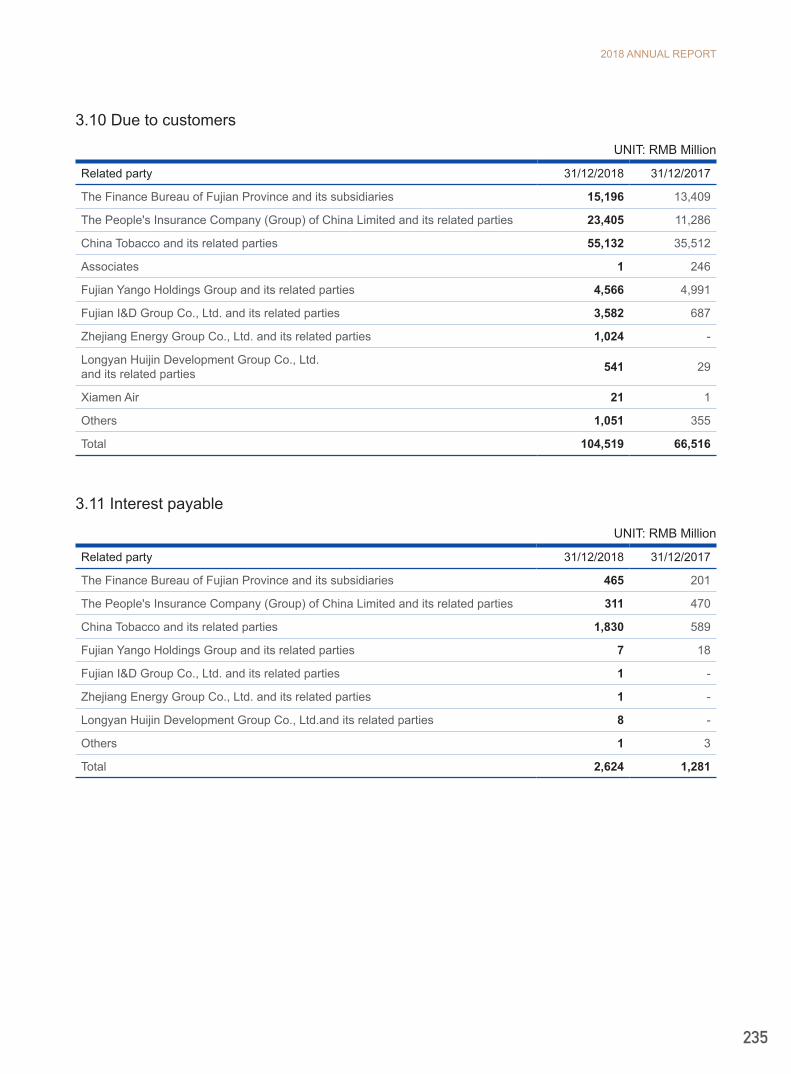
2018 ANNUAL REPORT
235
3.10 Due to customers
UNIT: RMB Million
Related party 31/12/2018 31/12/2017
The Finance Bureau of Fujian Province and its subsidiaries 15,196 13,409
The People's Insurance Company (Group) of China Limited and its related parties 23,405 11,286
China Tobacco and its related parties 55,132 35,512
Associates 1 246
Fujian Yango Holdings Group and its related parties 4,566 4,991
Fujian I&D Group Co., Ltd. and its related parties 3,582 687
Zhejiang Energy Group Co., Ltd. and its related parties 1,024 -
Longyan Huijin Development Group Co., Ltd. and its related parties 541 29
Xiamen Air 21 1
Others 1,051 355
Total 104,519 66,516
3.11 Interest payable
UNIT: RMB Million
Related party 31/12/2018 31/12/2017
The Finance Bureau of Fujian Province and its subsidiaries 465 201
The People's Insurance Company (Group) of China Limited and its related parties 311 470
China Tobacco and its related parties 1,830 589
Fujian Yango Holdings Group and its related parties 7 18
Fujian I&D Group Co., Ltd. and its related parties 1 -
Zhejiang Energy Group Co., Ltd. and its related parties 1 -
Longyan Huijin Development Group Co., Ltd.and its related parties 8 -
Others 1 3
Total 2,624 1,281

INDUSTRIAL BANK
236
3.12 Credit line
UNIT: RMB Million
Related party 31/12/2018 31/12/2017
The People's Insurance Company (Group) of China Limited and its related parties 54,000 54,000
China Tobacco and its related parties 15,000 15,000
Fujian Yango Holdings Group and its related parties 18,000 12,500
Fujian I&D Group Co., Ltd. and its related parties 10,000 5,000
Zhejiang Energy Group Co., Ltd. and its related parties 8,000 -
Longyan Huijin Development Group Co., Ltd. and its related parties 1,000 -
Xiamen International Bank Co., Ltd. 12,300 12,000
Xiamen Air 4,000 -
Total 122,300 98,500
3.13 Off-balance sheet items
At the end of the year, the amount of letter of credit and Bank acceptance held by the subsidiaries of China National Tobacco Corporation is nil and RMB101 million (2017: RMB2,501 million and RMB500 million) respectively; the balance of bank acceptances and letters of guarantee held by Fujian Yango Holdings Group and its related parties is RMB441 million and RMB197 million respectively (2017: RMB270 million and RMB725 million); the balance of bank acceptances and letters of guarantee held by Fujian I&D Group Co., Ltd. and its related parties is RMB10 million and RMB35 million respectively (2017: Nil for both).
4. Key management personnel remuneration
UNIT: RMB Million
2018 2017
Salary and welfare 18 17

2018 ANNUAL REPORT
237
XI. CONTINGENCIES AND COMMITMENTS
1. Pending Litigations
As of the balance sheet date, the Group's management considers that there is no pending litigation which has a significant impact on the financial statements that needs to be disclosed.
2. Off-balance sheet items
UNIT: RMB Million
The Group and the Bank
Contractual amount
31/12/2018 31/12/2017
Credit card commitments 284,430 208,127
Letter of credit 112,002 85,144
Letters of guarantee 123,668 120,259
Bank acceptances 532,919 384,247
Loan commitments non-cancellable 38,545 41,500
Total 1,091,564 839,277
In addition, the Group also provides credit facilities to specific customers. According to the management's opinion, since such credit facilities are conditional and can be canceled, the Group is not committed to these customers for the credit risk of the unused facilities.
3. Capital commitments
UNIT: RMB Million
Contractual amount of the Group Contractual amount of the Bank
31/12/2018 31/12/2017 31/12/2018 31/12/2017
Authorized but not contracted for 187 1 187 1
Contracted but not paid for 353 258 349 243
Total 540 259 536 244
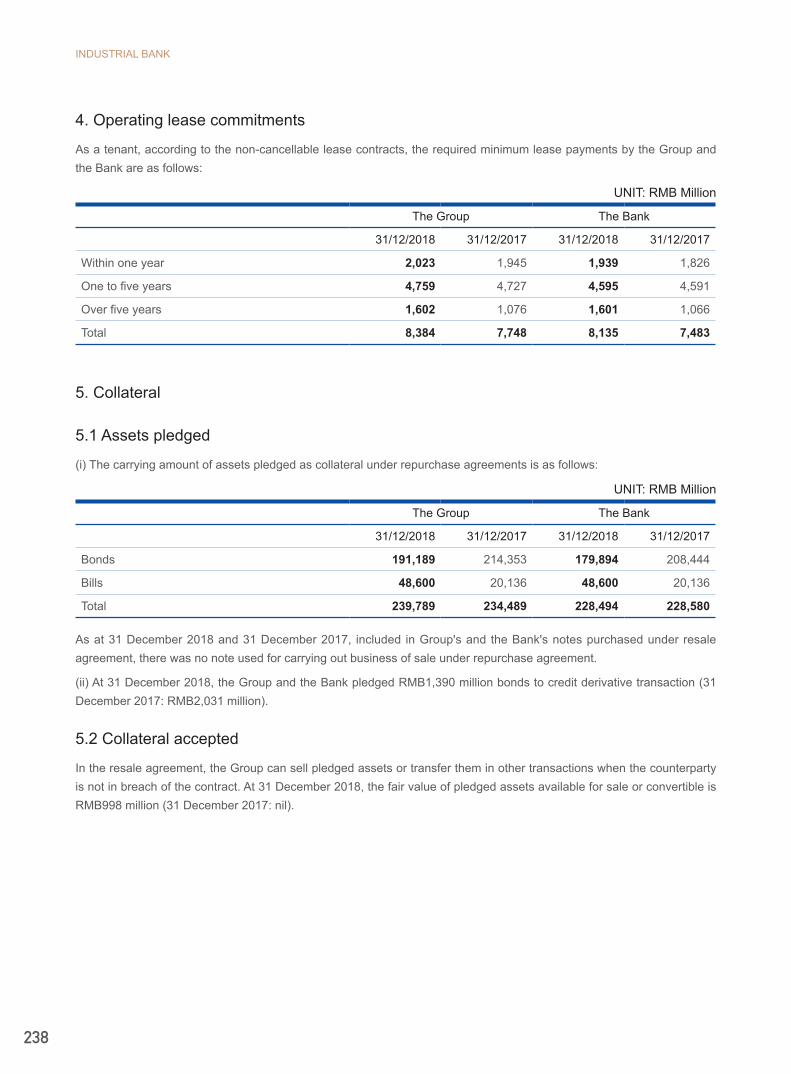
INDUSTRIAL BANK
238
4. Operating lease commitments
As a tenant, according to the non-cancellable lease contracts, the required minimum lease payments by the Group and the Bank are as follows:
UNIT: RMB Million
The Group The Bank
31/12/2018 31/12/2017 31/12/2018 31/12/2017
Within one year 2,023 1,945 1,939 1,826
One to five years 4,759 4,727 4,595 4,591
Over five years 1,602 1,076 1,601 1,066
Total 8,384 7,748 8,135 7,483
5. Collateral
5.1 Assets pledged
(i) The carrying amount of assets pledged as collateral under repurchase agreements is as follows:
UNIT: RMB Million
The Group The Bank
31/12/2018 31/12/2017 31/12/2018 31/12/2017
Bonds 191,189 214,353 179,894 208,444
Bills 48,600 20,136 48,600 20,136
Total 239,789 234,489 228,494 228,580
As at 31 December 2018 and 31 December 2017, included in Group's and the Bank's notes purchased under resale agreement, there was no note used for carrying out business of sale under repurchase agreement.
(ii) At 31 December 2018, the Group and the Bank pledged RMB1,390 million bonds to credit derivative transaction (31 December 2017: RMB2,031 million).
5.2 Collateral accepted
In the resale agreement, the Group can sell pledged assets or transfer them in other transactions when the counterparty is not in breach of the contract. At 31 December 2018, the fair value of pledged assets available for sale or convertible is RMB998 million (31 December 2017: nil).

2018 ANNUAL REPORT
239
6. Redemption commitment of certificate treasury bonds and saving treasury bonds
(1) The Group entrusted by the MOF as its agent issues certificate treasury bonds and saving treasury bonds. Holders of certificate treasury bonds and saving treasury bonds can require advance redemption, and the Group has the obligation to execute the redemption responsibility. Redemption amount for the certificate treasury bonds and saving treasury bonds includes principal and interest payable till redemption date.
As of 31 December 2018 and 31 December 2017, the cumulative principal balances of the certificate treasury bonds and saving treasury bonds which are issued by the Group under trust prior to maturity and not been paid are as follows:
UNIT: RMB Million
The Group and the Bank
Contractual amount
31/12/2018 31/12/2017
Certificate treasury bonds and saving treasury bonds 2,884 3,180
The Group believes the Group’s redemption amount of these certificate treasury bonds and saving treasury bonds is not significant before their maturity.
(2) At 31 December 2018, The Group has announced but unissued bonds underwriting amount of RMB2,658 million (31 December 2017: RMB500 million).
7. Fiduciary Business
UNIT: RMB Million
The Group and the Bank
12/31/2018 12/31/2017
Fiduciary deposits and loans 420,046 564,990
Fiduciary wealth management products 1,215,684 1,152,282
Fiduciary investments 10,131 4,123
Fiduciary deposits and loans are deposits and loans that depositor designated specific third party as the loan party, and related credit risk of the loan is borne by depositors who designated borrowers.
Fiduciary wealth management products refer to a kind of service that the entrusted Group is responsible for the operation and management of customer assets. The investment risk of fiduciary wealth management products is borne by the trustee.
Fiduciary investments refers to a kind of service that the entrusted Group engaged in capital operation, investment management, investment advisory and other investment services based on the principal-agent relationship. The investment risk of fiduciary investment is borne by the trustee.
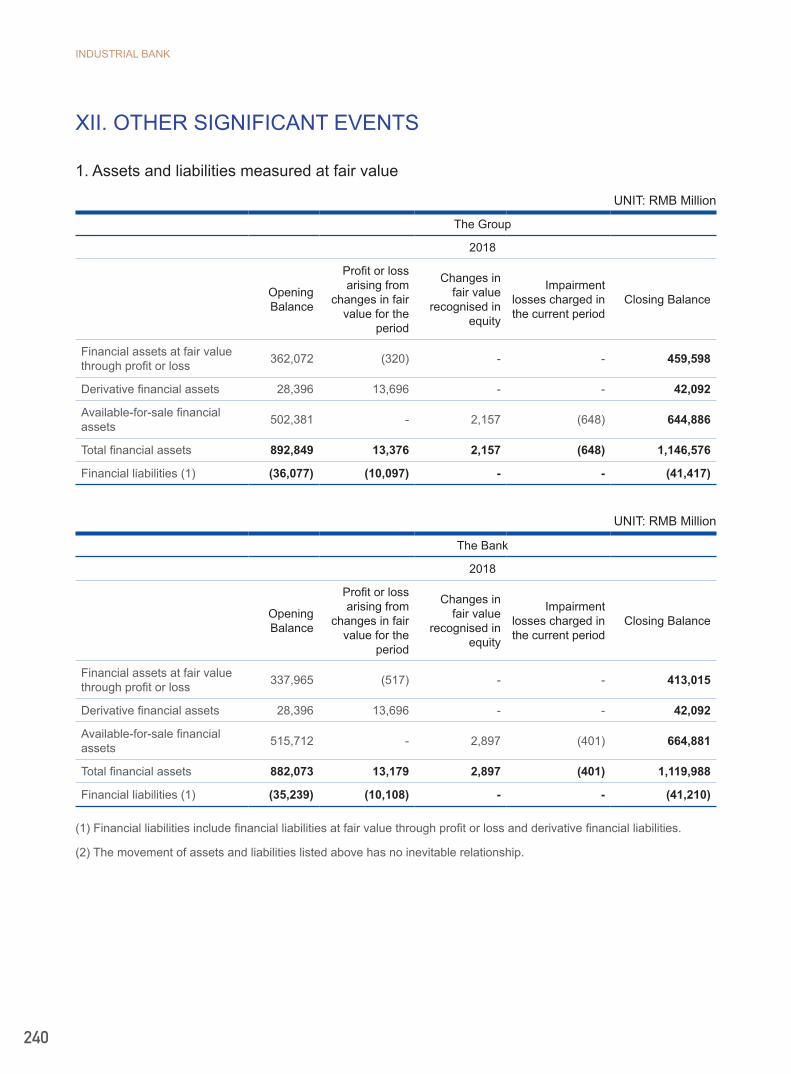
INDUSTRIAL BANK
240
XII. OTHER SIGNIFICANT EVENTS
1. Assets and liabilities measured at fair value
UNIT: RMB Million
The Group
2018
Opening Balance
Profit or loss arising from
changes in fair value for the
period
Changes in fair value
recognised in equity
Impairment losses charged in the current period
Closing Balance
Financial assets at fair value through profit or loss 362,072 (320) - - 459,598
Derivative financial assets 28,396 13,696 - - 42,092
Available-for-sale financial assets 502,381 - 2,157 (648) 644,886
Total financial assets 892,849 13,376 2,157 (648) 1,146,576
Financial liabilities (1) (36,077) (10,097) - - (41,417)
UNIT: RMB Million
The Bank
2018
Opening Balance
Profit or loss arising from
changes in fair value for the
period
Changes in fair value
recognised in equity
Impairment losses charged in the current period
Closing Balance
Financial assets at fair value through profit or loss 337,965 (517) - - 413,015
Derivative financial assets 28,396 13,696 - - 42,092
Available-for-sale financial assets 515,712 - 2,897 (401) 664,881
Total financial assets 882,073 13,179 2,897 (401) 1,119,988
Financial liabilities (1) (35,239) (10,108) - - (41,210)
(1) Financial liabilities include financial liabilities at fair value through profit or loss and derivative financial liabilities.
(2) The movement of assets and liabilities listed above has no inevitable relationship.

2018 ANNUAL REPORT
241
2. Financial assets and financial liabilities denominated in foreign currencies
UNIT: RMB Million
The Group
2018
Opening balance
Profit or loss arising from
changes in fair value for the
period
Changes in fair value
recognised in equity
Impairment losses charged
in the current period
Closing balance
Cash and balances with Central Bank 17,104 - - - 12,608
Deposits with banks and other financial institutions 15,632 - - - 24,217
Placements with banks and other financial institutions 13,789 - - - 36,549
Financial assets at fair value through profit or loss 41,418 (2,027) - - 24,582
Derivative financial assets 1,502 2,468 - - 3,970
Financial assets purchased under resale agreement - - - - 13
Loans and advances to customers 145,478 - - (308) 161,836
Available-for-sale financial assets 105,884 - (1,782) (62) 111,726
Investments classified as receivables 23,708 - - 2 23,807
Held-to-maturity investments 12,047 - - - 14,041
Finance lease receivable 1,227 - - - 1,109
Other financial assets 2,295 - - - 4,688
Total of financial assets 380,084 441 (1,782) (368) 419,146
Financial liabilities (1) 463,562 3,405 - - 523,566

INDUSTRIAL BANK
242
UNIT: RMB Million
The Bank
2018
Opening balance
Profit or loss arising from
changes in fair value for the
period
Changes in fair value
recognised in equity
Impairment losses charged
in the current period
Closing balance
Cash and balances with Central Bank 17,104 - - - 12,608
Deposits with banks and other financial institutions 15,632 - - - 24,217
Placements with banks and other financial institutions 14,351 - - - 37,235
Financial assets at fair value through profit or loss 41,418 (2,027) - - 24,582
Derivative financial assets 1,502 2,468 - - 3,970
Financial assets purchased under resale agreement - - - - 13
Loans and advances to customers 145,478 - - (308) 161,836
Available-for-sale financial assets 105,884 - (1,782) (62) 111,726
Investments classified as receivables 23,708 - - 2 23,807
Held-to-maturity investments 12,047 - - - 14,041
Other financial assets 2,295 - - - 4,688
Total of financial assets 379,419 441 (1,782) (368) 418,723
Financial liabilities (1) 463,562 3,405 - - 523,566
(1) Financial liabilities include borrowing from Central Bank, deposits from banks and other financial institutions, placement from banks and other financial institutions, financial liabilities at fair value through profit or loss, financial assets sold under repurchase agreements, derivative financial liabilities, due to customers and debt securities issued, etc.
(2) The movement of assets and liabilities listed above has no inevitable relationship.
2018 ANNUAL REPORT
243
3. Transfer of Financial Assets
3.1 Assets securitization
The Group conducts asset-backed securities transactions during normal operations. The Group sells part of its financial assets to the special purpose trusts established by the Group as an originating institution and then the special purpose trusts issues asset-backed securities to investors. The Group determines whether it combines the special purpose trusts based on whether it has power over such special purpose trusts and whether it is involved in related activities of the special purpose trusts to enjoy variable returns, and whether the Group has the ability to use its power over the special purpose trust to affect its returns.
Once a special purpose trust is established, it shall be distinguished from other property for which the Group has not set up a trust. According to the relevant transaction documents, the trust property is not a liquidation property when the Group dissolves or is liquidated according to law, or is declared bankrupt.
In the course of the transfer of the aforesaid financial assets, the Group has not recognized the gains or losses since the consideration of transfer is same as the carrying value of the transferred financial assets. Subsequently, the Group as a financial asset service institution will charge a certain service fee.
The Group analyzes and judges whether to derecognize the financial assets that have been transferred based on the extent of transferring risk and rewards:
In the process of transferring relevant financial assets, the Group transfers substantially all the risks (mainly include the credit risk, early repayment risk and interest rate risk of the transferred assets) and rewards of the ownership of financial assets to other investors, and derecognizes such transferred financial assets. In 2018, the book value of the Group's financial assets that have been securitized is RMB15,179 million (2017: RMB32,903 million). Meanwhile, the Group subscribes certain proportion of asset-backed securities. At 31 December 2018, the Group holds the aforesaid asset-backed securities of RMB7,817 million (31 December 2017: RMB17,565 million).
In the process of transferring relevant financial assets, the Group does not transfer substantially all the risks (mainly include the credit risk, early repayment risk and interest rate risk of the transferred assets) and rewards of the ownership of financial assets to other investors, and does not derecognize such transferred financial assets. In 2018, the Group has no the aforesaid financial assets that have not been derecognized (2017: RMB4,721 million). At 31 December 2018, the Group holds the aforesaid finance lease receivable and investment in receivables that are not derecognized of RMB1,420 million (31 December 2017: RMB2,939 million) and RMB400 million (31 December 2017: RMB924 million) respectively. The consideration received by transferring financial assets of RMB598 million (31 December 2017: RMB1,867 million) is presented as "bonds payable".
In 2018, the Group's transferred assets include financial assets with carrying amount of RMB46,320 million (31 December 2017: RMB14,600 million), where the Group neither transferred nor retained substantially all the risks (mainly include the credit risk, early repayment risk and interest rate risk of the transferred assets) and rewards of the ownership, and retained the control and has continuing involvement in these financial assets. At 31 December 2018, the Group continued to recognize the financial assets with carrying amount of RMB7,641 million (31 December 2017: RMB2,101 million) based on its extent of continuing involvement in the assets, and recognized assets and liabilities with continuing involvement as other assets and other liabilities.
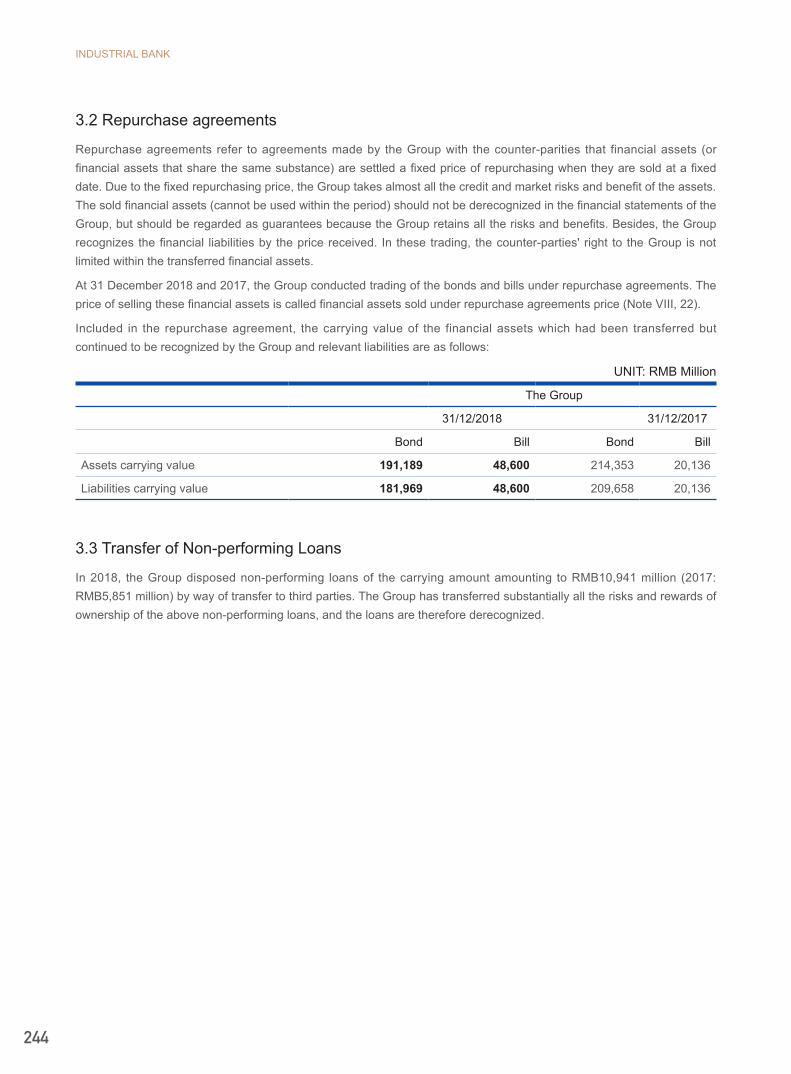
INDUSTRIAL BANK
244
3.2 Repurchase agreements
Repurchase agreements refer to agreements made by the Group with the counter-parities that financial assets (or financial assets that share the same substance) are settled a fixed price of repurchasing when they are sold at a fixed date. Due to the fixed repurchasing price, the Group takes almost all the credit and market risks and benefit of the assets. The sold financial assets (cannot be used within the period) should not be derecognized in the financial statements of the Group, but should be regarded as guarantees because the Group retains all the risks and benefits. Besides, the Group recognizes the financial liabilities by the price received. In these trading, the counter-parties' right to the Group is not limited within the transferred financial assets.
At 31 December 2018 and 2017, the Group conducted trading of the bonds and bills under repurchase agreements. The price of selling these financial assets is called financial assets sold under repurchase agreements price (Note VIII, 22).
Included in the repurchase agreement, the carrying value of the financial assets which had been transferred but continued to be recognized by the Group and relevant liabilities are as follows:
UNIT: RMB Million
The Group
31/12/2018 31/12/2017
Bond Bill Bond Bill
Assets carrying value 191,189 48,600 214,353 20,136
Liabilities carrying value 181,969 48,600 209,658 20,136
3.3 Transfer of Non-performing Loans
In 2018, the Group disposed non-performing loans of the carrying amount amounting to RMB10,941 million (2017: RMB5,851 million) by way of transfer to third parties. The Group has transferred substantially all the risks and rewards of ownership of the above non-performing loans, and the loans are therefore derecognized.

2018 ANNUAL REPORT
245
XIII. FINANCIAL RISK MANAGEMENT
1. Overview
The Group is exposed to various types of risks due to its financing businesses including banking business. The Group identifies, assesses and monitors various risks on an on-going basis. The most significant types of risk to which the Group is exposed are credit risk, market risk, liquidity risk and operation risk. Market risk includes interest rate risk, foreign currency risk and other price risk.
The Group's risk management objectives are to achieve a proper balance between risks and benefits and run business safely and prudently under reasonable level of risk.
2. Risk management framework
Risk management is the basic safeguard of survival and development of commercial banks. The Group has taken risk management as one of its core competitiveness, formulated development strategy focusing on business operation as well as risk management, established pre-during-post events risk control system with a core of risk asset management, and improved the risk management and operation instructions for various businesses; completed the mechanism of risk responsibilities and punishment, implemented credit business operation responsibilities, established risk fund for credit post personnel, enhanced risk constraints; taking credit risk, market risk, liquidity risk, operational risk and other risks undertaken in or by various business and customers into the scope of risk management and continuously improve the risk management mechanism to wholly-owned and holding subsidiaries; further defined the specific responsibilities of board of directors, board of supervisors, senior management and operation executives in respect of risk management, formed a defined, clear and effective overall risk management system. In daily risk management work, the Group’s business sector, risk management department and internal audit department build up the “three defences”; they perform their respective functions and work together to achieve the objective of risk management. Among them, operation institutions and business line management sector form the first line of defences to conduct risk management. Operation institutions take precautions against all the business and operating risk, while business line management sector is in charge of making its risk management policy, evaluating the effectiveness of risk management regularly and taking corrective actions if necessary. The risk management department is the second line of defences, which is responsible for constituting the Group’s risk management regulation and policy, analysing overall risk management situation, inspecting, evaluating and supervising the compliance and effectiveness of risk management conducted by all the sectors and departments, conducting overall risk reporting, continuously improving risk management modules and instruments and strengthening independency. The internal audit department is the third line of defences. It is responsible for all process audits, continuously providing independent and prospective audit and supervision with emphasis.
3. Credit risk
Credit risk represents the potential loss that may arise from a customer or counterparty’s failure to meet its obligation. Credit risk can also arise from operational failures that result in an unauthorised or inappropriate advance, commitment or investment of funds. The Group’s major credit risks come from loans and receivables (enterprises and personal credit loans), treasury operations (including creditors’ investment) and off-balance sheet related credit risk exposures. The Group manages and controls credit risk according to the following processes: customer investigation before granting of credit limits, credit review and approval and post- lending loan monitoring and collection.
The Group establish the risk management department, which is responsible for organizing, implementing the credit risk management strategies and policies of the Group, it is also responsible for making basic rules for the Group risk management affairs, in addition, it is also professionally managing, evaluating, guiding the general operation of the Group risk management together with inspecting and supervising the activities mentioned above. As the leading party,

INDUSTRIAL BANK
246
the risk management department formulates unified standards, responsible for the credit management on the whole. All the actions taken are to ensure the overall credit risk under control. The Group set up risk management departments for finance, retail, and investment bank and financial markets. Each of the risk departments is responsible for the credit management in its own line, and it is also responsible for making detailed regulation and operating rules and approving projects within the approving authority. The Group also sets up several specialized committees such as Credit Approval Committee and Credit Accountability Committee. The first one is responsible for the examination and approval of the loans within the authority. The other one is responsible for determining the responsibility of related loans.
The Group has formulated a whole set of credit policies on approval process and management procedure, and implemented throughout the Group. The credit management procedure for corporate and personal loans can be classified as credit investigation, credit examination, credit approval, credit disbursement, and post lending monitoring and recovery process. In addition, the Group issued Due Diligence of Credit approval to clarify the duties of different positions, to effectively control the credit risk, and to strengthen compliance of credit business.
The Group set up credit granting policy under the principle of “controllable risks, aggregated resources and sustainable development” to promote reasonable layout and balanced development in respect of credit resources in industries, regions, clients and products etc. In line with the access conditions and effective control of risks, the Group has intensified its support to green financial business and accelerate the pace of development of small and medium-sized enterprises and small and medium-sized industries; and to support credit financing demands from entities within advanced manufacturing, domestic consumption and livelihood sectors and national strategic emerging industries of the state. Meanwhile, the Group cut down and exit projects with outdated production capacity so as to further promote structure optimization and adjustment of credit asset.
The Group has established a customer credit rating system which comprehensively and systematically investigated various factors and variation trends that influence customer solvency in future; disclosed and evaluated customers’ credit risks and capabilities based on qualitative and quantitative analysis. Credit rating results become an important foundation to draw up credit service polices, adjust and optimize client structure, as well as identify credit service of individual customer. According to new Basel Capital Accord and relevant guides of the CBIRC, the Group developed and established customer internal rating system, and continued to implement the comprehensive verification of internal rating. In 2018, in connection with the economic environment and the Company's actual demand of application etc., the Group optimized comprehensively the non-retail rating model, established a stereoscopic rating structure for different clients and multi-dimension indexes, and promoted the ability to identify risks comprehensively. Since January 2014 when the credit risk weighted assets ("CRWA") measurement system was completed and launched, the Group had the capacity to measure CRWA using internal rating junior method. The related results of internal rating continuously entered into various risk management areas including clients entrance, authority management, limit management, credit approval, economic capital measurement, provision for impairment on assets and performance assessment, etc. As the new capital accords related projects were completed successively, the Group got promotion in capacity of identification, measurement and control of credit risk.
The Group developed risk warning system, applying big data technology to fully integrate both internal and external risk information and analysing as per certain rules so as to form a warning indicator. With customers' potential risks disclosed in time by monitoring the indicator, the active push, tracking, feedback and report generating by level of warning indicator can be achieved and the timeliness and accuracy of risk warning can be improved effectively. The risk warning system realized the online posting of warning information and carried out system hard control over processes including warning adjustment, cancellation etc. and provided basic guarantee for credit management.
The Group accurately identified risks conditions of credit asset, reasonably reflected the income after risk adjustment to guide capital allocation optimization in operation institutions and allocation of credit resources to strengthen risk awareness in operation institutions. Therefore, Credit Asset Risks Classification Implementation Method and Credit Asset Risks Classification Implementation Standards and others have been established to make sure branches adjust credit asset risks classification according to real conditions of projects. Based on 5 levels classified by the CBIRC, the
2018 ANNUAL REPORT
247
Group has classified its credit asset risks into nine levels as level one (normal), level 2 (normal), level 3 (normal), level 4 (attention), level 5 (attention), level 6 (attention), sublevel, doubtful and loss. The Group has various management policies to each level.
Risks arising from credit commitments are similar to risks of loans and advances to customers in substance. Therefore, requirements for application, post-lending management and pledge and guarantees are the same with those in loans and advances to customers. According to substance-over-form principle, the Group includes the non-standard credit loans in the comprehensive risk management system and manages them by comparing to traditional loans. The Group provides uniform credit, carries out general control on risks, executes uniform credit policy in nationwide, carries out whole-process responsibilities management by comparing to traditional loans, implements risk classification and provides risk reserves.
3.1 Concentration of credit risk
Concentration of credit risk exists when changes in geographic, economic or industry factors similarly affect groups of counterparties whose aggregate credit exposure is material in relation to the Group's total exposures. The Group's portfolio of financial instrument is diversified along geographic, industry and product sectors.
The Group mainly operates the lending and guarantee business in the PRC mainland. Since there are different economic development characteristics in the different regions in China, the characteristics of credit risks are also different.
For the geographical and industrial concentration of the loans and advances to customers please refer to Note VIII, 7.
3.2 Maximum exposure to credit risk
Without considering any usable collaterals, and other credit enhancement measures, the max credit risk exposure of the Group and the Bank at balance sheet date is the sum of the carrying amounts of related financial assets (including derivative instrument and deducted equity instrument) in the balance sheet and the off-balance sheet items in Note XI, 2. As at 31 December 2018, the max credit risk exposures of the Group and the Bank are RMB7,265,112 million (31 December 2017: RMB6,815,370 million) and RMB7,066,978 million (31 December 2017: RMB6,609,727 million) respectively.

INDUSTRIAL BANK
248
3.3 Analysis of exposure to credit risk of the Group and the Bank about loans and advances to customers, inter-bank placements, investments and finance lease receivables
UNIT: RMB Million
The Group
31/12/2018
Loans and advances to
customers
Inter-bank placements(1) Investments(2) Finance lease
receivables Total
Impaired:
Individual assessment
Total assets 38,648 409 16,085 2,300 57,442
Allowance for impairment losses (20,798) (409) (8,248) (1,476) (30,931)
Net value of assets 17,850 - 7,837 824 26,511
Collective assessment
Total assets 7,492 - - - 7,492
Allowance for impairment losses (5,310) - - - (5,310)
Net value of assets 2,182 - - - 2,182
Past due but not impaired:
Total assets 20,022 - 4,838 2,104 26,964
Including:
Within 90 days 20,022 - 4,768 829 25,619
90 to 360 days - - 70 - 70
360 days to 3 years - - - 1,275 1,275
Collectively assessed allowance for impairment losses (4,533) - (196) (764) (5,493)
Net value of assets 15,489 - 4,642 1,340 21,471
Neither past due nor impaired:
Total assets 2,867,920 228,735 2,462,224 104,399 5,663,278
Collectively assessed allowance for impairment losses (64,996) - (11,288) (2,310) (78,594)
Net value of assets 2,802,924 228,735 2,450,936 102,089 5,584,684
Total of net value of assets 2,838,445 228,735 2,463,415 104,253 5,634,848
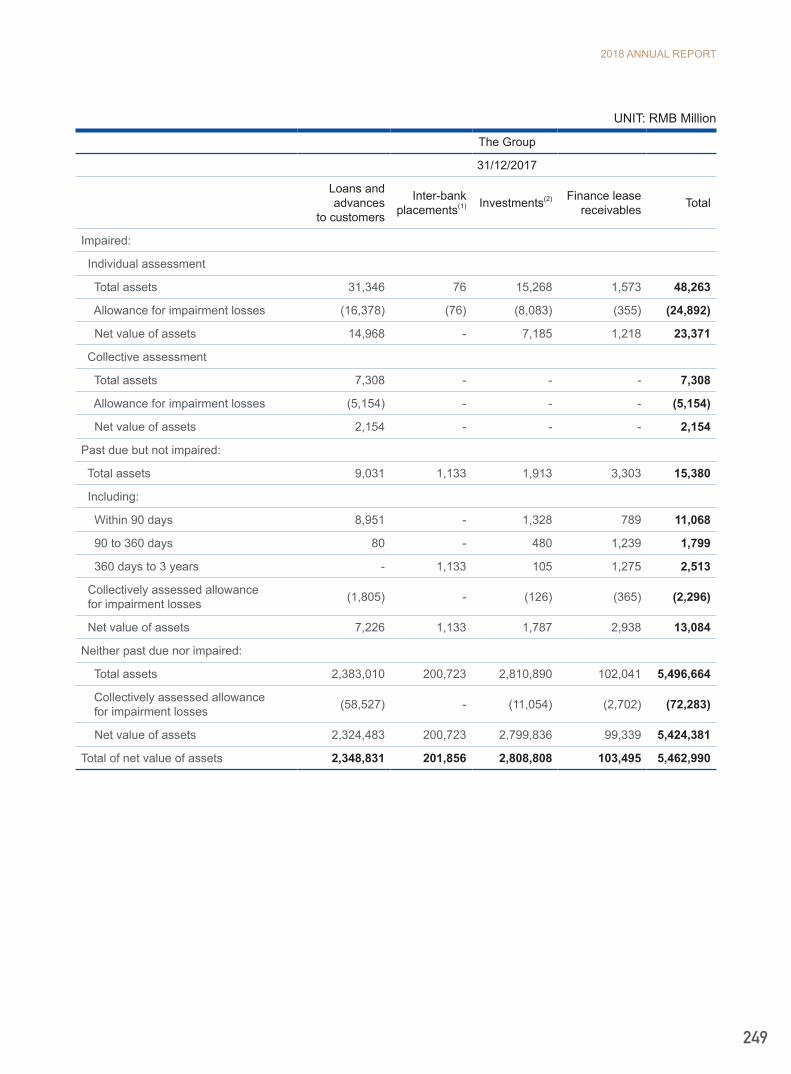
2018 ANNUAL REPORT
249
UNIT: RMB Million
The Group
31/12/2017
Loans and advances
to customers
Inter-bankplacements(1) Investments(2) Finance lease
receivables Total
Impaired:
Individual assessment
Total assets 31,346 76 15,268 1,573 48,263
Allowance for impairment losses (16,378) (76) (8,083) (355) (24,892)
Net value of assets 14,968 - 7,185 1,218 23,371
Collective assessment
Total assets 7,308 - - - 7,308
Allowance for impairment losses (5,154) - - - (5,154)
Net value of assets 2,154 - - - 2,154
Past due but not impaired:
Total assets 9,031 1,133 1,913 3,303 15,380
Including:
Within 90 days 8,951 - 1,328 789 11,068
90 to 360 days 80 - 480 1,239 1,799
360 days to 3 years - 1,133 105 1,275 2,513
Collectively assessed allowance for impairment losses (1,805) - (126) (365) (2,296)
Net value of assets 7,226 1,133 1,787 2,938 13,084
Neither past due nor impaired:
Total assets 2,383,010 200,723 2,810,890 102,041 5,496,664
Collectively assessed allowance for impairment losses (58,527) - (11,054) (2,702) (72,283)
Net value of assets 2,324,483 200,723 2,799,836 99,339 5,424,381
Total of net value of assets 2,348,831 201,856 2,808,808 103,495 5,462,990
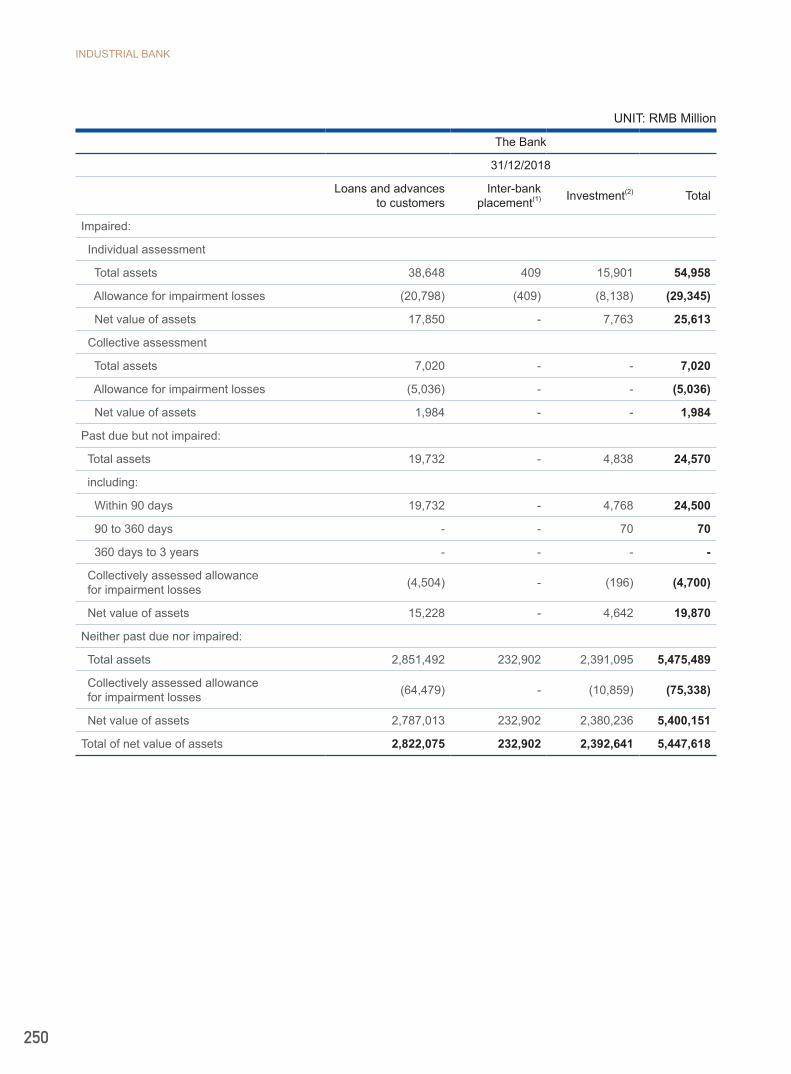
INDUSTRIAL BANK
250
UNIT: RMB Million
The Bank
31/12/2018
Loans and advancesto customers
Inter-bankplacement(1) Investment(2) Total
Impaired:
Individual assessment
Total assets 38,648 409 15,901 54,958
Allowance for impairment losses (20,798) (409) (8,138) (29,345)
Net value of assets 17,850 - 7,763 25,613
Collective assessment
Total assets 7,020 - - 7,020
Allowance for impairment losses (5,036) - - (5,036)
Net value of assets 1,984 - - 1,984
Past due but not impaired:
Total assets 19,732 - 4,838 24,570
including:
Within 90 days 19,732 - 4,768 24,500
90 to 360 days - - 70 70
360 days to 3 years - - - -
Collectively assessed allowance for impairment losses (4,504) - (196) (4,700)
Net value of assets 15,228 - 4,642 19,870
Neither past due nor impaired:
Total assets 2,851,492 232,902 2,391,095 5,475,489
Collectively assessed allowance for impairment losses (64,479) - (10,859) (75,338)
Net value of assets 2,787,013 232,902 2,380,236 5,400,151
Total of net value of assets 2,822,075 232,902 2,392,641 5,447,618
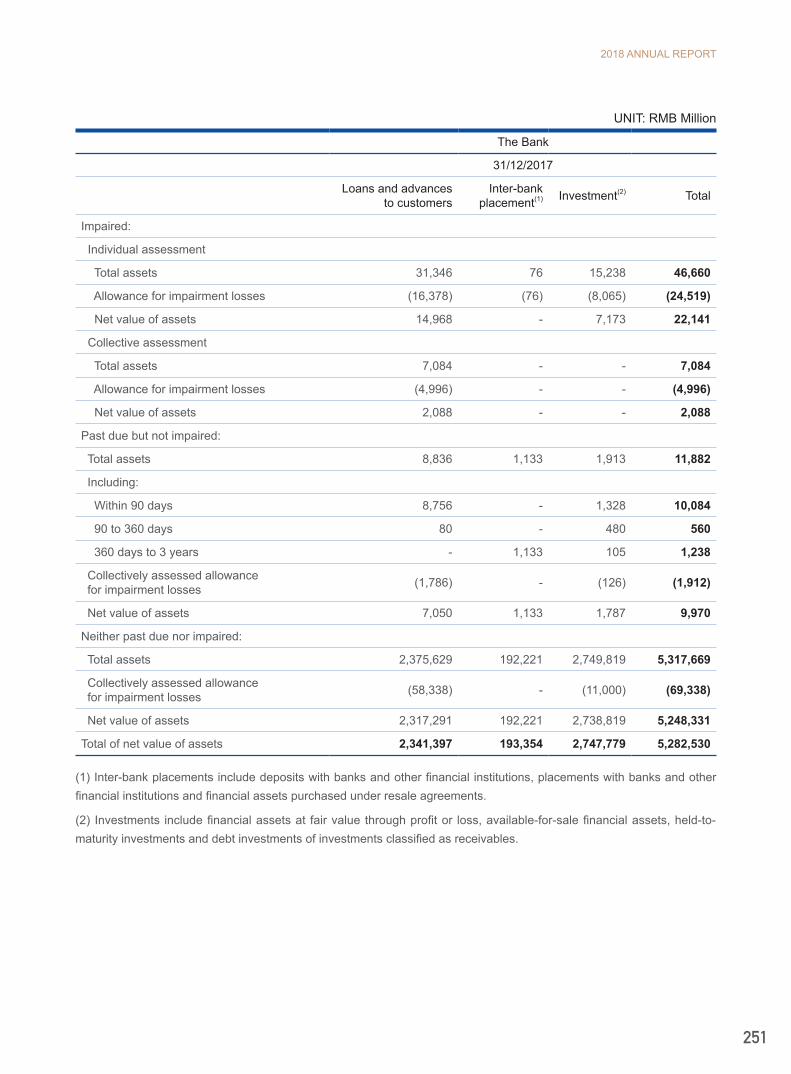
2018 ANNUAL REPORT
251
UNIT: RMB Million
The Bank
31/12/2017
Loans and advancesto customers
Inter-bankplacement(1) Investment(2) Total
Impaired:
Individual assessment
Total assets 31,346 76 15,238 46,660
Allowance for impairment losses (16,378) (76) (8,065) (24,519)
Net value of assets 14,968 - 7,173 22,141
Collective assessment
Total assets 7,084 - - 7,084
Allowance for impairment losses (4,996) - - (4,996)
Net value of assets 2,088 - - 2,088
Past due but not impaired:
Total assets 8,836 1,133 1,913 11,882
Including:
Within 90 days 8,756 - 1,328 10,084
90 to 360 days 80 - 480 560
360 days to 3 years - 1,133 105 1,238
Collectively assessed allowance for impairment losses (1,786) - (126) (1,912)
Net value of assets 7,050 1,133 1,787 9,970
Neither past due nor impaired:
Total assets 2,375,629 192,221 2,749,819 5,317,669
Collectively assessed allowance for impairment losses (58,338) - (11,000) (69,338)
Net value of assets 2,317,291 192,221 2,738,819 5,248,331
Total of net value of assets 2,341,397 193,354 2,747,779 5,282,530
(1) Inter-bank placements include deposits with banks and other financial institutions, placements with banks and other financial institutions and financial assets purchased under resale agreements.
(2) Investments include financial assets at fair value through profit or loss, available-for-sale financial assets, held-to-maturity investments and debt investments of investments classified as receivables.
INDUSTRIAL BANK
252
3.4 Collateral and other credit enhancements
The amount and type of collateral required depend on the assessment of the credit risk of the counterparty. The pledge rate depends on the credit information, operation and management, and financial position of pledgers, the condition of collateral, the market price, the pledged periods, and the convertibility of collateral. In addition, the Collateral Guideline of the Group set an upper limit of the pledged rate. Furthermore, the Group classifies and manages collateral by the difficulty of appraisal and management, the stability of market price and the convertibility of collateral. Following are the main types of collateral:
• For reverse repurchase agreements, collateral mainly includes bills or securities
• For commercial loans, collateral mainly includes land, properties, equipment and shares, etc.
• For retail loans, collateral mainly includes properties
The management will monitor the market value of the collateral, ask the borrowers to increase collateral if necessary according to the agreements and monitor the change in the market value of the collateral when reviewing the adequacy of impairment.
3.5 Analysis of collateral value
3.5.1 The Group evaluates the fair value of collateral periodically
As at 31 December 2018, the fair value of collateral that related to loans past due but not impaired amounted to RMB27,026 million (31 December 2017: RMB12,139 million). The collateral includes land, properties, equipment and shares assets etc.
As at 31 December 2018, the fair value of collateral that related to loans individually assessed to be impaired amounted to RMB31,440 million (31 December 2017: RMB26,517 million). The collateral includes land, properties, equipment and shares assets.
3.5.2 The carrying value of foreclosed assets the Group obtained during 2018 amounted to RMB656 million (2017: RMB115 million).
3.6 Rescheduled loans
Rescheduled loans refer to the loans rescheduled by the Group for the borrower who fails to repay the loans on schedule due to the terrible situation in finance. If it is possible, the Group will seek to reschedule the loans rather than to acquire the ownership of the collateral. Upon the time of being rescheduled, the loans are assessed as the loans that have been impaired on an individual basis by the Group. On 31 December 2018, the book value of the Group's rescheduled loans is RMB5,851 million.
2018 ANNUAL REPORT
253
4. Market risk
Market risk is the risk of loss, in respect of the Group’s on and off-balance sheet activities, arising from movements in market rates including interest rates, foreign exchange rates, commodity prices and stock prices. Market risk arises from both the Group’s proprietary and customer driven business. The Group’s market risk management objective is to control the market risk within a reasonable scope in order to achieve the optimal risk adjusted benefit.
According to the Group’s market risk management structure, market risk management is critical for the risk management of the Group. Any major events should be reported to the Asset and Liability Management Committee for review and then authorized by President of the Bank. The planning and financial department is responsible for implementing the Group’s asset and liability and interest rate management policy, analyzing and monitoring the implementation status of each type of indicators.
For daily control and management of treasury business, the risk management department of the treasure center built up mid-stage risk control system to carry out an implanting risk management and report to the risk management department of the Group.
4.1 Interest rate risk
The interest rate risk of the Group includes gap risk, benchmark risk and optional risk, among which gap risk is the main risk, i.e., the risk due to different repricing periods for different financial instruments. Currently, the Group has fully carried out the internal capital transfer pricing. The Group determined the transfer pricing by different products and terms, and gradually centralized the interest rate risk to the Head Office, so as to improve the efficiency of management and control the interest rate risk.
For the interest risk management of bank accounts, the Group mainly evaluates the interest rate risk of the statement of financial position through repricing gap structure for assets and liabilities and duration structure. The Group dynamically monitors and controls the interest rate sensitive gap of the statement of financial position through information systems like assets-liabilities management system together with client models, and calculates the interest rate sensitivity affected by revenue and economic value on the basis of gap analysis. The revenue analysis emphasizes on the effect of the interest rate fluctuation on short-term income, while the economic value analysis emphasizes on the effect of the interest rate fluctuation on present value of net cash flow.
For the interest risk management of transaction accounts, the Group mainly achieves the real-time monitoring of the interest rate risk of the trading accounts through the quota system, the use of financial transactions and analysis system and the scientific exposure measurement models. According to regulatory requirement, the Group has strengthened the management of market risk measurement models, standardized the developing, testing and commissioning process, and built on regular evaluation mechanisms to ensure the accuracy of measurement models. The Group applies the on-line trading and analysis system to timely measure and control the interest rate risk exposure of transaction accounts, which provides effective technical support to control the interest rate risk of transaction accounts.
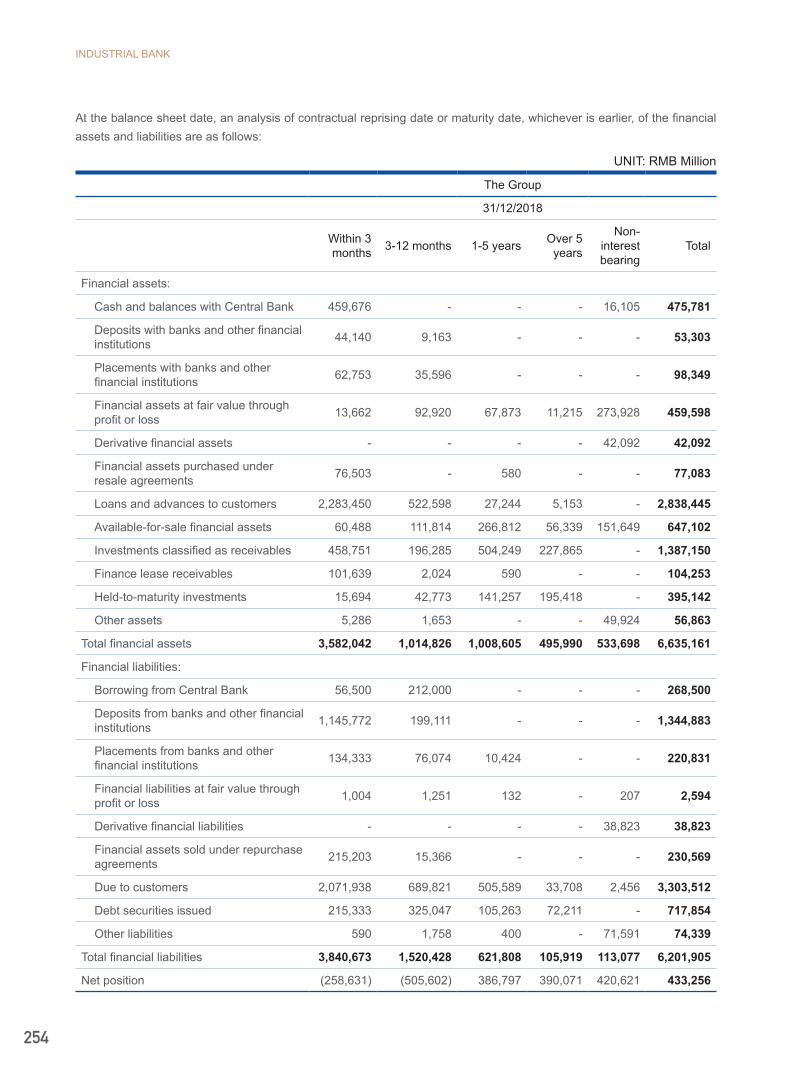
INDUSTRIAL BANK
254
At the balance sheet date, an analysis of contractual reprising date or maturity date, whichever is earlier, of the financial assets and liabilities are as follows:
UNIT: RMB Million
The Group
31/12/2018
Within 3 months 3-12 months 1-5 years Over 5
years
Non-interest bearing
Total
Financial assets:
Cash and balances with Central Bank 459,676 - - - 16,105 475,781
Deposits with banks and other financial institutions 44,140 9,163 - - - 53,303
Placements with banks and other financial institutions 62,753 35,596 - - - 98,349
Financial assets at fair value through profit or loss 13,662 92,920 67,873 11,215 273,928 459,598
Derivative financial assets - - - - 42,092 42,092
Financial assets purchased under resale agreements 76,503 - 580 - - 77,083
Loans and advances to customers 2,283,450 522,598 27,244 5,153 - 2,838,445
Available-for-sale financial assets 60,488 111,814 266,812 56,339 151,649 647,102
Investments classified as receivables 458,751 196,285 504,249 227,865 - 1,387,150
Finance lease receivables 101,639 2,024 590 - - 104,253
Held-to-maturity investments 15,694 42,773 141,257 195,418 - 395,142
Other assets 5,286 1,653 - - 49,924 56,863
Total financial assets 3,582,042 1,014,826 1,008,605 495,990 533,698 6,635,161
Financial liabilities:
Borrowing from Central Bank 56,500 212,000 - - - 268,500
Deposits from banks and other financial institutions 1,145,772 199,111 - - - 1,344,883
Placements from banks and other financial institutions 134,333 76,074 10,424 - - 220,831
Financial liabilities at fair value through profit or loss 1,004 1,251 132 - 207 2,594
Derivative financial liabilities - - - - 38,823 38,823
Financial assets sold under repurchase agreements 215,203 15,366 - - - 230,569
Due to customers 2,071,938 689,821 505,589 33,708 2,456 3,303,512
Debt securities issued 215,333 325,047 105,263 72,211 - 717,854
Other liabilities 590 1,758 400 - 71,591 74,339
Total financial liabilities 3,840,673 1,520,428 621,808 105,919 113,077 6,201,905
Net position (258,631) (505,602) 386,797 390,071 420,621 433,256

2018 ANNUAL REPORT
255
UNIT: RMB Million
The Group
31/12/2017
Within 3 months 3-12 months 1-5 years Over 5
years
Non-interest bearing
Total
Financial assets:
Cash and balances with Central Bank 444,872 - - - 21,531 466,403
Deposits with banks and other financial institutions 71,995 5,564 - - - 77,559
Placements with banks and other financial institutions 24,238 6,940 - - - 31,178
Financial assets at fair value through profit or loss 34,292 36,186 64,385 10,170 217,039 362,072
Derivative financial assets - - - - 28,396 28,396
Financial assets purchased under resale agreements 89,817 3,302 - - - 93,119
Loans and advances to customers 1,809,718 488,679 43,072 7,362 - 2,348,831
Available-for-sale financial assets 56,731 120,365 190,414 45,400 91,311 504,221
Investments classifiedas receivables 459,926 581,934 602,819 268,703 - 1,913,382
Finance lease receivables 100,370 2,395 593 137 - 103,495
Held-to-maturity investments 10,681 27,181 161,432 138,189 - 337,483
Other assets 17,540 1,890 166 321 43,320 63,237
Total financial assets 3,120,180 1,274,436 1,062,881 470,282 401,597 6,329,376
Financial liabilities:
Borrowing from Central Bank 35,500 209,500 - - - 245,000
Deposits from banks and other financial institutions 1,140,642 305,417 - - - 1,446,059
Placements from banks and other financial institutions 171,287 16,642 - - - 187,929
Financial liabilities at fair value through profit or loss 3,685 2,040 - - 838 6,563
Derivative financial liabilities - - - - 29,514 29,514
Financial assets sold under repurchase agreements 220,845 8,949 - - - 229,794
Due to customers 2,168,179 560,115 356,148 6 2,445 3,086,893
Debt securities issued 316,718 209,369 63,988 72,883 - 662,958
Other liabilities - - - - 71,626 71,626
Total financial liabilities 4,056,856 1,312,032 420,136 72,889 104,423 5,966,336
Net position (936,676) (37,596) 642,745 397,393 297,174 363,040
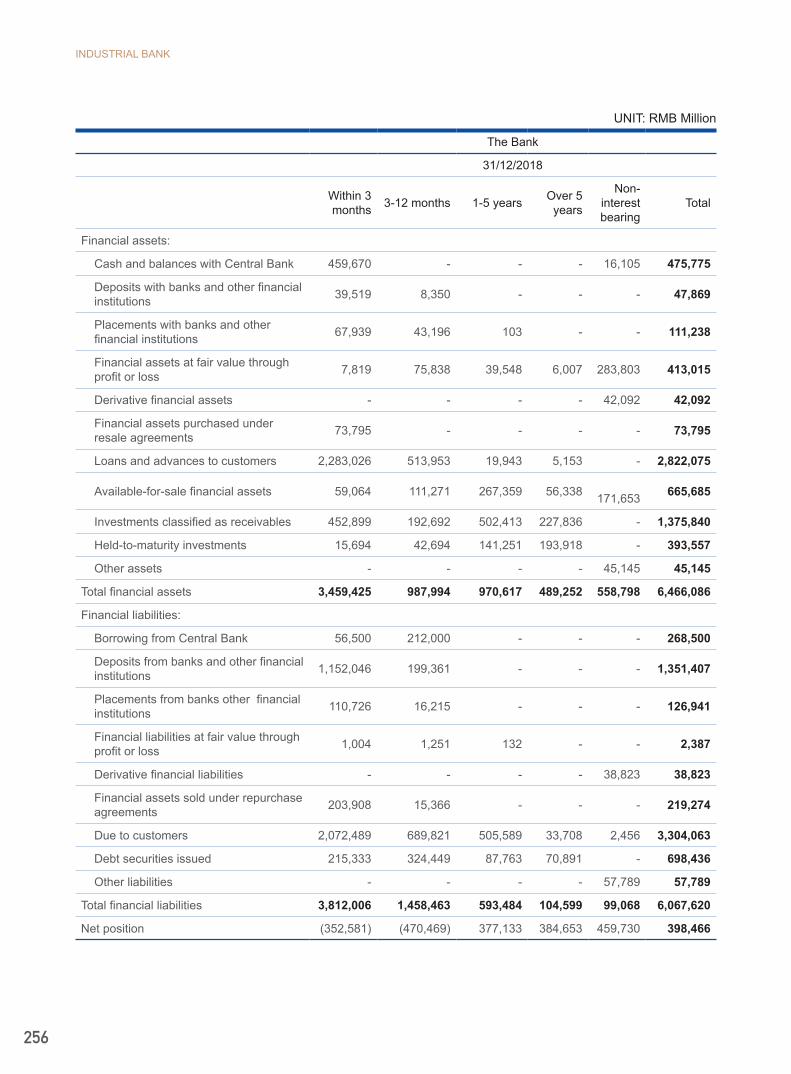
INDUSTRIAL BANK
256
UNIT: RMB Million
The Bank
31/12/2018
Within 3 months 3-12 months 1-5 years Over 5
years
Non-interestbearing
Total
Financial assets:
Cash and balances with Central Bank 459,670 - - - 16,105 475,775
Deposits with banks and other financial institutions 39,519 8,350 - - - 47,869
Placements with banks and other financial institutions 67,939 43,196 103 - - 111,238
Financial assets at fair value through profit or loss 7,819 75,838 39,548 6,007 283,803 413,015
Derivative financial assets - - - - 42,092 42,092
Financial assets purchased under resale agreements 73,795 - - - - 73,795
Loans and advances to customers 2,283,026 513,953 19,943 5,153 - 2,822,075
Available-for-sale financial assets 59,064 111,271 267,359 56,338 171,653 665,685
Investments classified as receivables 452,899 192,692 502,413 227,836 - 1,375,840
Held-to-maturity investments 15,694 42,694 141,251 193,918 - 393,557
Other assets - - - - 45,145 45,145
Total financial assets 3,459,425 987,994 970,617 489,252 558,798 6,466,086
Financial liabilities:
Borrowing from Central Bank 56,500 212,000 - - - 268,500
Deposits from banks and other financial institutions 1,152,046 199,361 - - - 1,351,407
Placements from banks other financial institutions 110,726 16,215 - - - 126,941
Financial liabilities at fair value through profit or loss 1,004 1,251 132 - - 2,387
Derivative financial liabilities - - - - 38,823 38,823
Financial assets sold under repurchase agreements 203,908 15,366 - - - 219,274
Due to customers 2,072,489 689,821 505,589 33,708 2,456 3,304,063
Debt securities issued 215,333 324,449 87,763 70,891 - 698,436
Other liabilities - - - - 57,789 57,789
Total financial liabilities 3,812,006 1,458,463 593,484 104,599 99,068 6,067,620
Net position (352,581) (470,469) 377,133 384,653 459,730 398,466
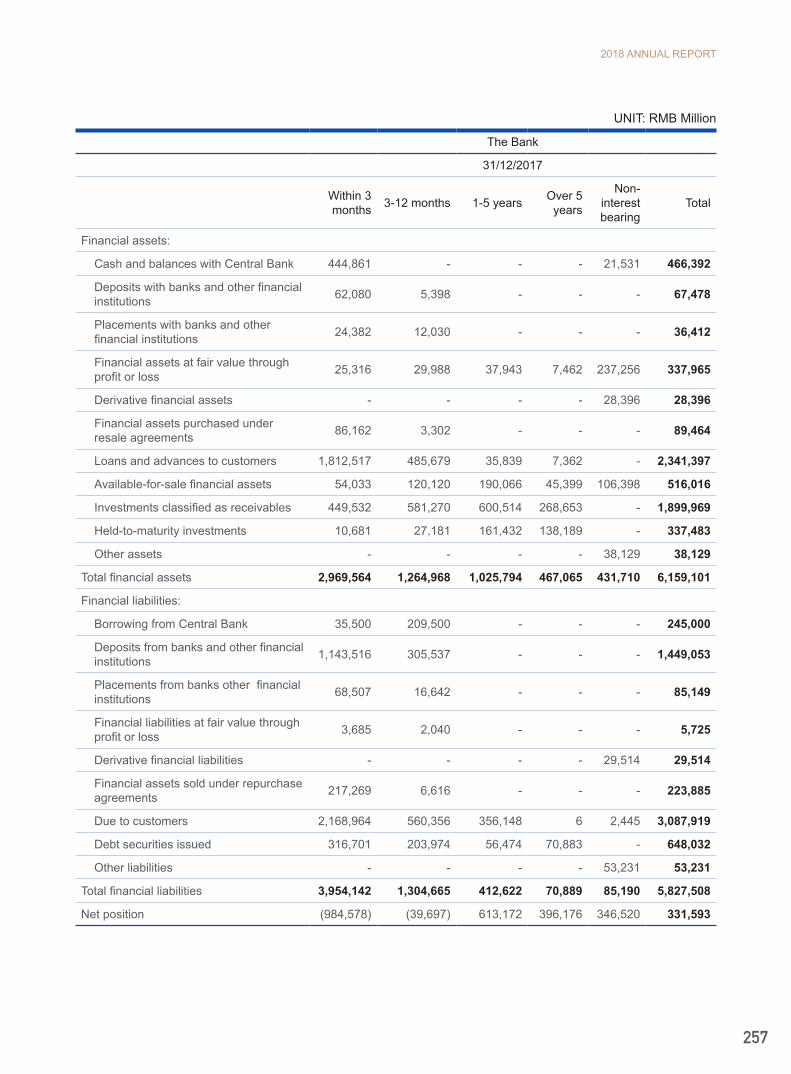
2018 ANNUAL REPORT
257
UNIT: RMB Million
The Bank
31/12/2017
Within 3 months 3-12 months 1-5 years Over 5
years
Non-interestbearing
Total
Financial assets:
Cash and balances with Central Bank 444,861 - - - 21,531 466,392
Deposits with banks and other financial institutions 62,080 5,398 - - - 67,478
Placements with banks and other financial institutions 24,382 12,030 - - - 36,412
Financial assets at fair value through profit or loss 25,316 29,988 37,943 7,462 237,256 337,965
Derivative financial assets - - - - 28,396 28,396
Financial assets purchased under resale agreements 86,162 3,302 - - - 89,464
Loans and advances to customers 1,812,517 485,679 35,839 7,362 - 2,341,397
Available-for-sale financial assets 54,033 120,120 190,066 45,399 106,398 516,016
Investments classified as receivables 449,532 581,270 600,514 268,653 - 1,899,969
Held-to-maturity investments 10,681 27,181 161,432 138,189 - 337,483
Other assets - - - - 38,129 38,129
Total financial assets 2,969,564 1,264,968 1,025,794 467,065 431,710 6,159,101
Financial liabilities:
Borrowing from Central Bank 35,500 209,500 - - - 245,000
Deposits from banks and other financial institutions 1,143,516 305,537 - - - 1,449,053
Placements from banks other financial institutions 68,507 16,642 - - - 85,149
Financial liabilities at fair value through profit or loss 3,685 2,040 - - - 5,725
Derivative financial liabilities - - - - 29,514 29,514
Financial assets sold under repurchase agreements 217,269 6,616 - - - 223,885
Due to customers 2,168,964 560,356 356,148 6 2,445 3,087,919
Debt securities issued 316,701 203,974 56,474 70,883 - 648,032
Other liabilities - - - - 53,231 53,231
Total financial liabilities 3,954,142 1,304,665 412,622 70,889 85,190 5,827,508
Net position (984,578) (39,697) 613,172 396,176 346,520 331,593

INDUSTRIAL BANK
258
The following tables illustrate the potential impact of a parallel upward or downward shift of 100 basis points in all currencies’ yield curves on the net interest income and other comprehensive income, based on the positions of financial assets and liabilities at the balance sheet date.
UNIT: RMB Million
The Group
31/12/2018 31/12/2017
Net interestincome
increase (decrease)
Other comprehensiveincome increase
(decrease)
Net interest income
increase (decrease)
Other comprehensive income increase
(decrease)
+100 basis points 6,821 (18,228) 2,446 (5,244)
- 100 basis points (6,821) 19,281 (2,446) 5,522
UNIT: RMB Million
The Bank
31/12/2018 31/12/2017
Net interest income
increase (decrease)
Other comprehensive income increase
(decrease)
Net interestincome
increase (decrease)
Other comprehensive income increase
(decrease)
+100 basis points 6,136 (18,227) 2,711 (5,239)
- 100 basis points (6,136) 19,280 (2,711) 5,517
The sensitivity analysis on net interest income is based on reasonably possible changes in interest rates with the assumption that the structure of financial assets and financial liabilities held at the period end remains unchanged.
The sensitivity analysis on other comprehensive income is the effect on changes of fixed rate available-for-sale financial assets at the period end after adjusting in accordance with the reasonably possible changes in interest rates.
The above prediction assumes that all yield curves of assets and liabilities, except demand deposit, shift upward or downward parallel. Therefore it does not reflect the potential impact of non-parallel shift in yield curves. The prediction also assumes that all positions are held to maturity. The Group anticipates that the amount of sensitivity analysis is insignificant if a position is not held to maturity.
The assumption does not represent the group’s capital and interest rate risk management policy. Therefore the above analysis may differ from the actual situation.
In addition, the impact of interest rate fluctuation is only for illustrating purpose, showing the anticipated net interest income and other comprehensive income of the Group under the current interest rate risk situation. And such impact has not taken into account the potential interest rate risk control activities carried out by the management.

2018 ANNUAL REPORT
259
4.2 Foreign currency risk
The Group conducts its businesses mainly in RMB, with certain businesses denominated in USD and other currencies. RMB is the functional currency. The foreign exchange rate is regulated by the PBOC.
The Group is mainly exposed to currency risk resulting from currency mismatches of assets and liabilities, foreign currency transactions and foreign currency capital, etc.
The capital operation department of the Bank centrally manages the currency risk. The currency risk that arises from all types of foreign exchange transactions at the branch level should be centralized to head office to manage the risk exposure and squares positions through the core business system.
The currency risk exposure between foreign currencies is managed on the basis of “overnight position limit” and “day time self-trading positions”. The positions are centralized to the capital operation department in a timely way and managed centrally. This kind of position is relatively small compared to the Group’s asset scale and is controllable.
Regarding the currency risk exposure between RMB and foreign currencies, the Group is mainly exposed to currency risk resulting from the comprehensive positions of the RMB market maker and the position of the foreign currency capital. As an active RMB market maker, the Group controls the position limit properly. The comprehensive positions of the market maker are managed close to zero and the overnight positions are kept at low level.
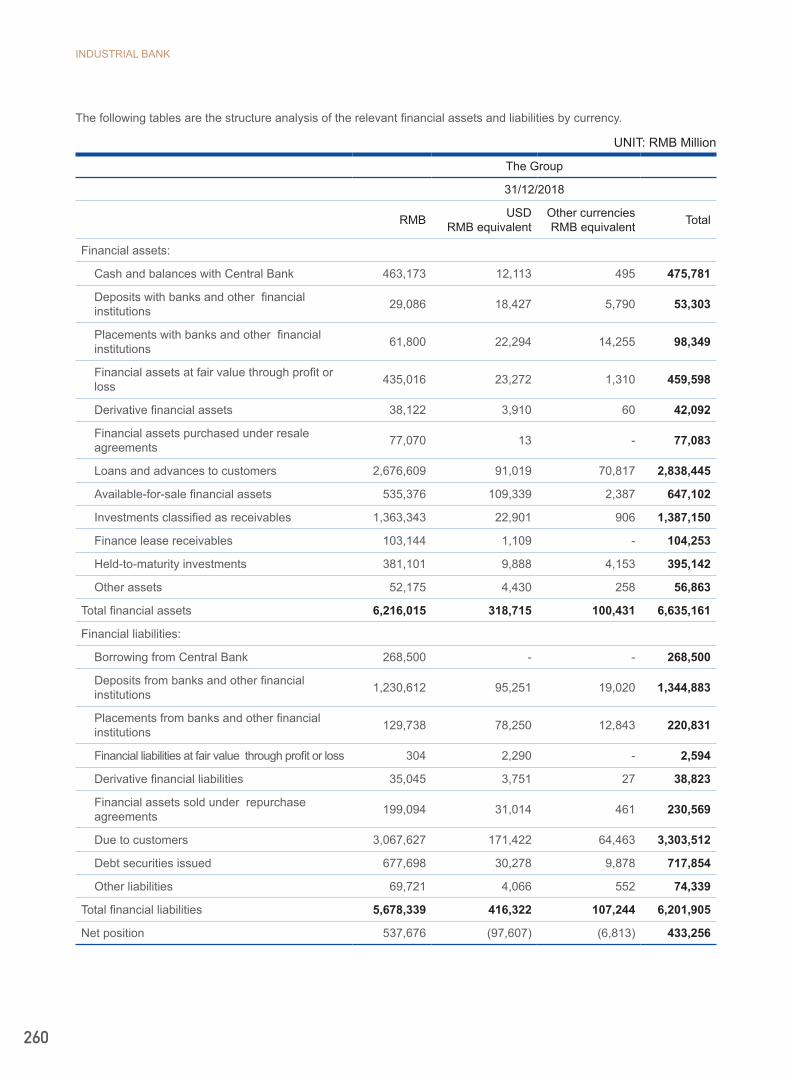
INDUSTRIAL BANK
260
The following tables are the structure analysis of the relevant financial assets and liabilities by currency.
UNIT: RMB Million
The Group
31/12/2018
RMB USD RMB equivalent
Other currenciesRMB equivalent Total
Financial assets:
Cash and balances with Central Bank 463,173 12,113 495 475,781
Deposits with banks and other financial institutions 29,086 18,427 5,790 53,303
Placements with banks and other financial institutions 61,800 22,294 14,255 98,349
Financial assets at fair value through profit or loss 435,016 23,272 1,310 459,598
Derivative financial assets 38,122 3,910 60 42,092
Financial assets purchased under resale agreements 77,070 13 - 77,083
Loans and advances to customers 2,676,609 91,019 70,817 2,838,445
Available-for-sale financial assets 535,376 109,339 2,387 647,102
Investments classified as receivables 1,363,343 22,901 906 1,387,150
Finance lease receivables 103,144 1,109 - 104,253
Held-to-maturity investments 381,101 9,888 4,153 395,142
Other assets 52,175 4,430 258 56,863
Total financial assets 6,216,015 318,715 100,431 6,635,161
Financial liabilities:
Borrowing from Central Bank 268,500 - - 268,500
Deposits from banks and other financial institutions 1,230,612 95,251 19,020 1,344,883
Placements from banks and other financial institutions 129,738 78,250 12,843 220,831
Financial liabilities at fair value through profit or loss 304 2,290 - 2,594
Derivative financial liabilities 35,045 3,751 27 38,823
Financial assets sold under repurchase agreements 199,094 31,014 461 230,569
Due to customers 3,067,627 171,422 64,463 3,303,512
Debt securities issued 677,698 30,278 9,878 717,854
Other liabilities 69,721 4,066 552 74,339
Total financial liabilities 5,678,339 416,322 107,244 6,201,905
Net position 537,676 (97,607) (6,813) 433,256
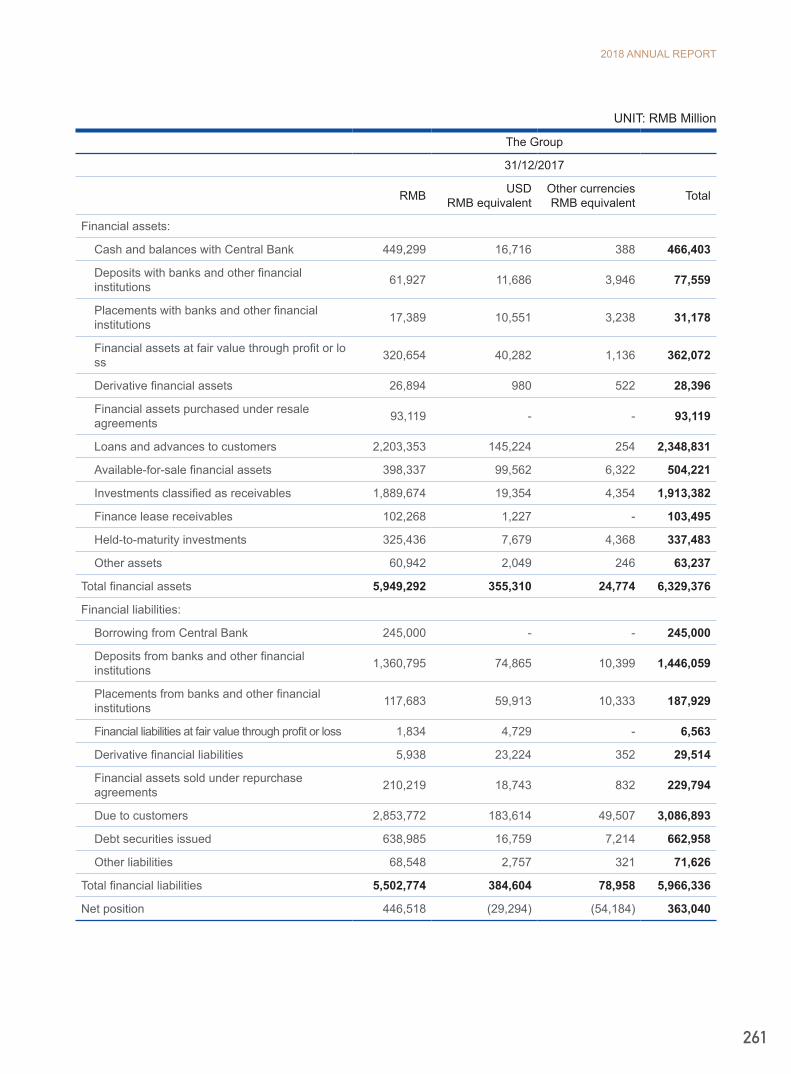
2018 ANNUAL REPORT
261
UNIT: RMB Million
The Group
31/12/2017
RMB USD RMB equivalent
Other currenciesRMB equivalent Total
Financial assets:
Cash and balances with Central Bank 449,299 16,716 388 466,403
Deposits with banks and other financial institutions 61,927 11,686 3,946 77,559
Placements with banks and other financial institutions 17,389 10,551 3,238 31,178
Financial assets at fair value through profit or loss 320,654 40,282 1,136 362,072
Derivative financial assets 26,894 980 522 28,396
Financial assets purchased under resale agreements 93,119 - - 93,119
Loans and advances to customers 2,203,353 145,224 254 2,348,831
Available-for-sale financial assets 398,337 99,562 6,322 504,221
Investments classified as receivables 1,889,674 19,354 4,354 1,913,382
Finance lease receivables 102,268 1,227 - 103,495
Held-to-maturity investments 325,436 7,679 4,368 337,483
Other assets 60,942 2,049 246 63,237
Total financial assets 5,949,292 355,310 24,774 6,329,376
Financial liabilities:
Borrowing from Central Bank 245,000 - - 245,000
Deposits from banks and other financial institutions 1,360,795 74,865 10,399 1,446,059
Placements from banks and other financial institutions 117,683 59,913 10,333 187,929
Financial liabilities at fair value through profit or loss 1,834 4,729 - 6,563
Derivative financial liabilities 5,938 23,224 352 29,514
Financial assets sold under repurchase agreements 210,219 18,743 832 229,794
Due to customers 2,853,772 183,614 49,507 3,086,893
Debt securities issued 638,985 16,759 7,214 662,958
Other liabilities 68,548 2,757 321 71,626
Total financial liabilities 5,502,774 384,604 78,958 5,966,336
Net position 446,518 (29,294) (54,184) 363,040
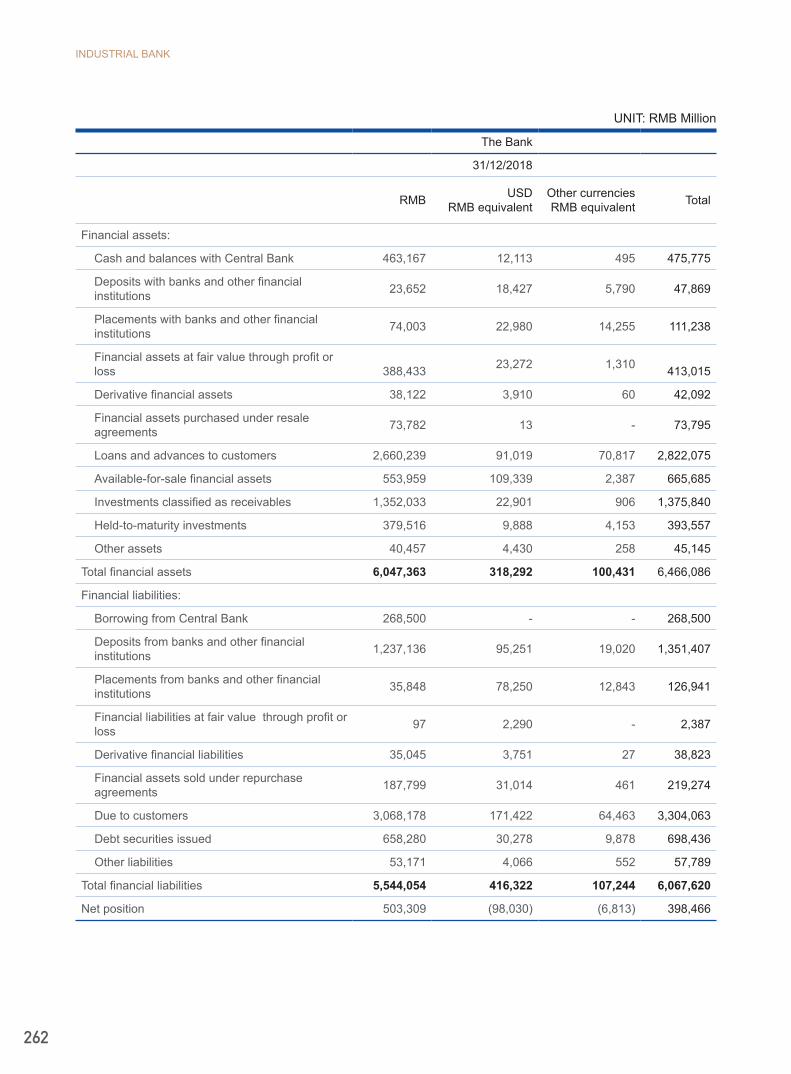
INDUSTRIAL BANK
262
UNIT: RMB Million
The Bank
31/12/2018
RMB USD RMB equivalent
Other currenciesRMB equivalent Total
Financial assets:
Cash and balances with Central Bank 463,167 12,113 495 475,775
Deposits with banks and other financial institutions 23,652 18,427 5,790 47,869
Placements with banks and other financial institutions 74,003 22,980 14,255 111,238
Financial assets at fair value through profit or loss
388,433 23,272 1,310
413,015
Derivative financial assets 38,122 3,910 60 42,092
Financial assets purchased under resale agreements 73,782 13 - 73,795
Loans and advances to customers 2,660,239 91,019 70,817 2,822,075
Available-for-sale financial assets 553,959 109,339 2,387 665,685
Investments classified as receivables 1,352,033 22,901 906 1,375,840
Held-to-maturity investments 379,516 9,888 4,153 393,557
Other assets 40,457 4,430 258 45,145
Total financial assets 6,047,363 318,292 100,431 6,466,086
Financial liabilities:
Borrowing from Central Bank 268,500 - - 268,500
Deposits from banks and other financial institutions 1,237,136 95,251 19,020 1,351,407
Placements from banks and other financial institutions 35,848 78,250 12,843 126,941
Financial liabilities at fair value through profit or loss 97 2,290 - 2,387
Derivative financial liabilities 35,045 3,751 27 38,823
Financial assets sold under repurchase agreements 187,799 31,014 461 219,274
Due to customers 3,068,178 171,422 64,463 3,304,063
Debt securities issued 658,280 30,278 9,878 698,436
Other liabilities 53,171 4,066 552 57,789
Total financial liabilities 5,544,054 416,322 107,244 6,067,620
Net position 503,309 (98,030) (6,813) 398,466

2018 ANNUAL REPORT
263
UNIT: RMB Million
The Bank
31/12/2017
RMB USD RMB equivalent
Other currenciesRMB equivalent Total
Financial assets:
Cash and balances with Central Bank 449,288 16,716 388 466,392
Deposits with banks and other financial institutions 51,846 11,686 3,946 67,478
Placements with banks and other financial institutions 22,061 11,113 3,238 36,412
Financial assets at fair value through profit or loss 296,547 40,282 1,136 337,965
Derivative financial assets 26,894 980 522 28,396
Financial assets purchased under resale agreements 89,464 - - 89,464
Loans and advances to customers 2,195,919 145,224 254 2,341,397
Available-for-sale financial assets 410,132 99,562 6,322 516,016
Investments classified as receivables 1,876,261 19,354 4,354 1,899,969
Held-to-maturity investments 325,436 7,679 4,368 337,483
Other assets 35,834 2,049 246 38,129
Total financial assets 5,779,682 354,645 24,774 6,159,101
Financial liabilities:
Borrowing from Central Bank 245,000 - - 245,000
Deposits from banks and other financial institutions 1,363,789 74,865 10,399 1,449,053
Placements from banks and other financial institutions 14,903 59,913 10,333 85,149
Financial liabilities at fair value through profit or loss 996 4,729 - 5,725
Derivative financial liabilities 5,938 23,224 352 29,514
Financial assets sold under repurchase agreements 204,310 18,743 832 223,885
Due to customers 2,854,798 183,614 49,507 3,087,919
Debt securities issued 624,059 16,759 7,214 648,032
Other liabilities 50,153 2,757 321 53,231
Total financial liabilities 5,363,946 384,604 78,958 5,827,508
Net position 415,736 (29,959) (54,184) 331,593
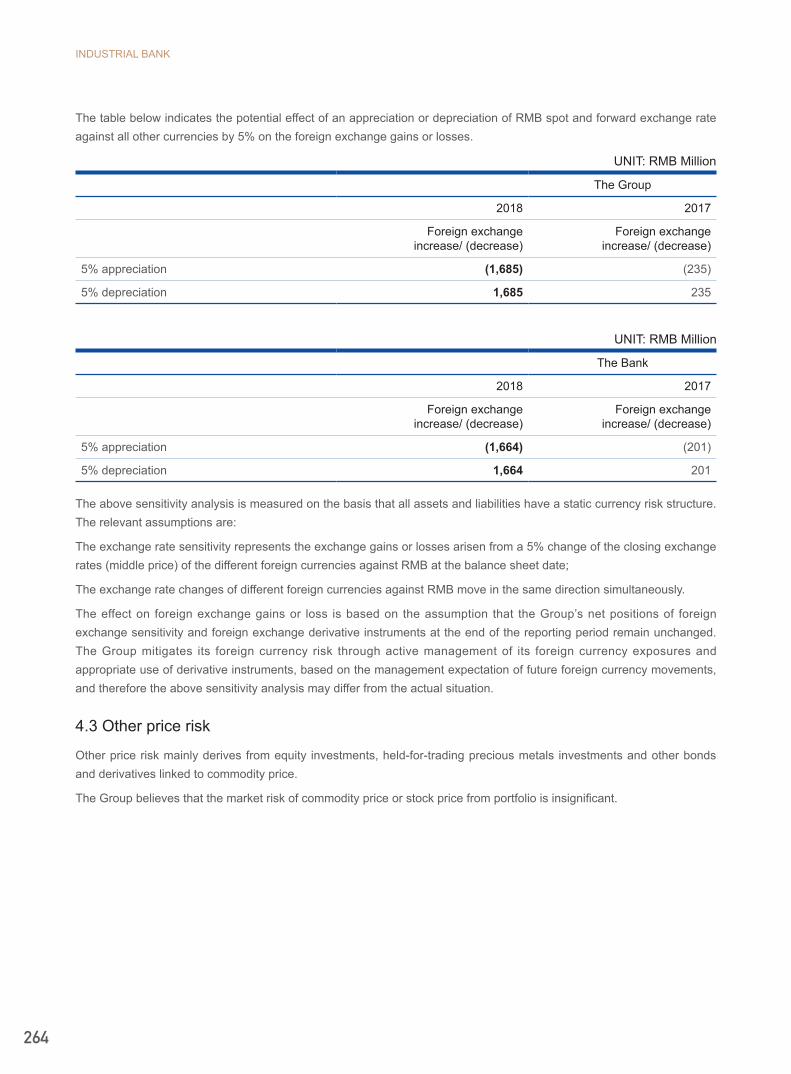
INDUSTRIAL BANK
264
The table below indicates the potential effect of an appreciation or depreciation of RMB spot and forward exchange rate against all other currencies by 5% on the foreign exchange gains or losses.
UNIT: RMB Million
The Group
2018 2017
Foreign exchangeincrease/ (decrease)
Foreign exchangeincrease/ (decrease)
5% appreciation (1,685) (235)
5% depreciation 1,685 235
UNIT: RMB Million
The Bank
2018 2017
Foreign exchangeincrease/ (decrease)
Foreign exchangeincrease/ (decrease)
5% appreciation (1,664) (201)
5% depreciation 1,664 201
The above sensitivity analysis is measured on the basis that all assets and liabilities have a static currency risk structure. The relevant assumptions are:
The exchange rate sensitivity represents the exchange gains or losses arisen from a 5% change of the closing exchange rates (middle price) of the different foreign currencies against RMB at the balance sheet date;
The exchange rate changes of different foreign currencies against RMB move in the same direction simultaneously.
The effect on foreign exchange gains or loss is based on the assumption that the Group’s net positions of foreign exchange sensitivity and foreign exchange derivative instruments at the end of the reporting period remain unchanged. The Group mitigates its foreign currency risk through active management of its foreign currency exposures and appropriate use of derivative instruments, based on the management expectation of future foreign currency movements, and therefore the above sensitivity analysis may differ from the actual situation.
4.3 Other price risk
Other price risk mainly derives from equity investments, held-for-trading precious metals investments and other bonds and derivatives linked to commodity price.
The Group believes that the market risk of commodity price or stock price from portfolio is insignificant.
2018 ANNUAL REPORT
265
5. Liquidity risk
Liquidity risk refers to the risk of being unable to acquire sufficient funds in time or failing to acquire sufficient funds at a reasonable cost to meet repayment obligations for asset growth or other business. The Group's liquidity risk mainly derives from advanced or concentrated withdrawal, principal-guaranteed wealth management products redemption, deferred loan repayment and mismatches of assets and liabilities.
The assets and liabilities management committee of the Group monitors and manages the liquidity risk of the Group. The committee will determine the liquidity risk regularity and management strategy, the monitoring indicators and the alarming index, regularly analyse and discuss the liquidity risk assessment report submitted, and determine the liquidity risk management measures.
The planning and financial department is responsible for: (1) drafting liquidity risk management policies and measures; (2) monitoring different types of liquidity ratios and exposure indicators. The planning and financial department monitors the liquidity risk ratios monthly by reviewing the assets’ and liabilities’ structure. If there are any ratios close to or over the alarming limits, the department has to investigate the reasons and make recommendations to adjust the assets’ and liabilities’ structure accordingly; (3) analysing the liquidity risk and reporting to the assets and liability management committee regularly; and (4) daily operation of liquidity management, establishment of a cash position forecast system at the Group level in order to meet the cash payment needs and assure the liquidity for the business development requirements.
The Group regularly monitors the surplus reserve ratio, liquidity ratio, liquidity coverage ratio and net stable funding ratio, and sets alarming and security limits for each ratio. The Group also prepares general and comprehensive liquidity analysis report based on liquidity indicators recorded and net cash flow position of assets and liabilities, incorporating the consideration of macro economy and interbank liquidity status. The report is submitted to the assets and liabilities management committee for assessment. The assessment report will be submitted together with credit risk, interest rate risk and operation risk to the risk management committee of the Board of Directors for the analysis of the Group’s overall risk assessment to determine the management strategy accordingly.
5.1 A maturity analysis of financial assets and liabilities of the Group as follows
The following tables are the structure analysis of non-derivative financial assets and liabilities by contractual maturities at the balance sheet date. The amounts disclosed in each term are the undiscounted contractual cash flows.

INDUSTRIAL BANK
266
UNIT: RMB Million
The Group
31/12/2018
On demand Less than 1 month
1 to 3 months
3 months to 1 year
1 to 5 years
Over 5 years
Past due/
undatedTotal
Non-derivative financial assets:
Cash and balances with Central Bank 84,644 - - - - - 391,341 475,985
Deposits with banks and other financial institutions 35,119 6,366 2,853 9,452 - - 16 53,806
Placements with banks and other financial institutions - 50,367 13,034 36,296 - - 60 99,757
Financial assets at fair value through profit or loss 211,114 66,959 8,821 101,584 77,468 18,751 865 485,562
Financial assets purchased under resale agreements - 76,517 - - 660 - 333 77,510
Loans and advances to customers - 390,197 199,339 901,223 787,204 1,394,579 59,779 3,732,321
Available-for-sale financial assets 45,118 8,936 39,910 217,684 313,201 87,927 7,420 720,196
Investments classified as receivables - 52,473 112,331 275,828 816,809 503,973 17,968 1,779,382
Financial lease receivables - 2,712 6,506 26,875 70,947 11,742 3,373 122,155
Held-to-maturity investments - 3,303 14,177 54,645 186,241 236,972 137 495,475
Other non-derivative financial assets 7,431 4,506 3,735 2,515 3,547 175 491 22,400
Total non-derivative financial assets 383,426 662,336 400,706 1,626,102 2,256,077 2,254,119 481,783 8,064,549
Non-derivative financial liabilities:
Borrowing from Central Bank - 12,395 45,969 219,103 - - - 277,467
Deposits from banks and other financial institutions 541,782 352,397 258,691 205,016 - - - 1,357,886
Placements from banks and other financial institutions - 91,367 46,835 77,090 10,954 - - 226,246
Financial liabilities at fair value through profit or loss 171 527 501 1,289 173 - - 2,661
Financial assets sold under repurchase agreements - 196,640 19,162 15,535 - - - 231,337
Due to customers 1,366,645 359,331 293,036 768,361 592,053 33,846 - 3,413,272
Debt securities issued - 62,845 119,967 360,875 143,339 80,458 - 767,484
Other non-derivative financial liabilities 16,124 1,775 779 2,886 4,886 507 611 27,568
Total non-derivative financial liabilities 1,924,722 1,077,277 784,940 1,650,155 751,405 114,811 611 6,303,921
Net position (1,541,296) (414,941) (384,234) (24,053) 1,504,672 2,139,308 481,172 1,760,628
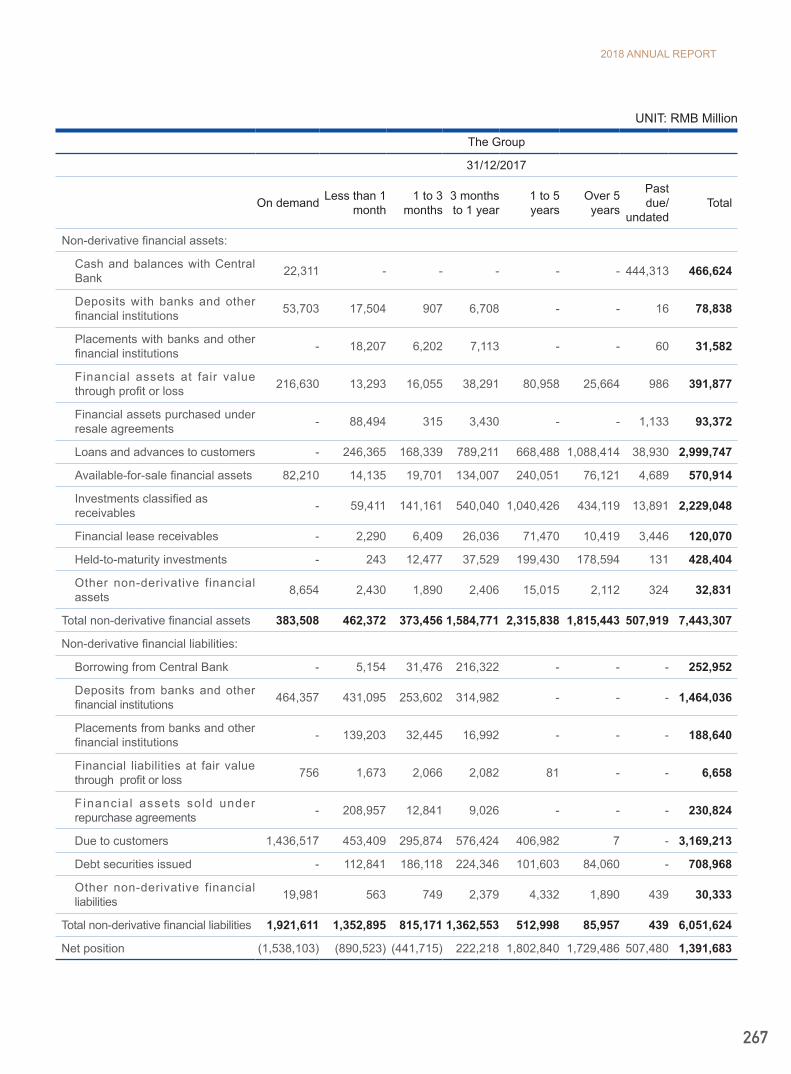
2018 ANNUAL REPORT
267
UNIT: RMB Million
The Group
31/12/2017
On demand Less than 1 month
1 to 3 months
3 months to 1 year
1 to 5 years
Over 5 years
Past due/
undatedTotal
Non-derivative financial assets:
Cash and balances with Central Bank 22,311 - - - - - 444,313 466,624
Deposits with banks and other financial institutions 53,703 17,504 907 6,708 - - 16 78,838
Placements with banks and other financial institutions - 18,207 6,202 7,113 - - 60 31,582
Financial assets at fair value through profit or loss 216,630 13,293 16,055 38,291 80,958 25,664 986 391,877
Financial assets purchased under resale agreements - 88,494 315 3,430 - - 1,133 93,372
Loans and advances to customers - 246,365 168,339 789,211 668,488 1,088,414 38,930 2,999,747
Available-for-sale financial assets 82,210 14,135 19,701 134,007 240,051 76,121 4,689 570,914
Investments classified as receivables - 59,411 141,161 540,040 1,040,426 434,119 13,891 2,229,048
Financial lease receivables - 2,290 6,409 26,036 71,470 10,419 3,446 120,070
Held-to-maturity investments - 243 12,477 37,529 199,430 178,594 131 428,404
Other non-derivative financial assets 8,654 2,430 1,890 2,406 15,015 2,112 324 32,831
Total non-derivative financial assets 383,508 462,372 373,456 1,584,771 2,315,838 1,815,443 507,919 7,443,307
Non-derivative financial liabilities:
Borrowing from Central Bank - 5,154 31,476 216,322 - - - 252,952
Deposits from banks and other financial institutions 464,357 431,095 253,602 314,982 - - - 1,464,036
Placements from banks and other financial institutions - 139,203 32,445 16,992 - - - 188,640
Financial liabilities at fair value through profit or loss 756 1,673 2,066 2,082 81 - - 6,658
Financia l assets sold under repurchase agreements - 208,957 12,841 9,026 - - - 230,824
Due to customers 1,436,517 453,409 295,874 576,424 406,982 7 - 3,169,213
Debt securities issued - 112,841 186,118 224,346 101,603 84,060 - 708,968
Other non-derivative financial liabilities 19,981 563 749 2,379 4,332 1,890 439 30,333
Total non-derivative financial liabilities 1,921,611 1,352,895 815,171 1,362,553 512,998 85,957 439 6,051,624
Net position (1,538,103) (890,523) (441,715) 222,218 1,802,840 1,729,486 507,480 1,391,683
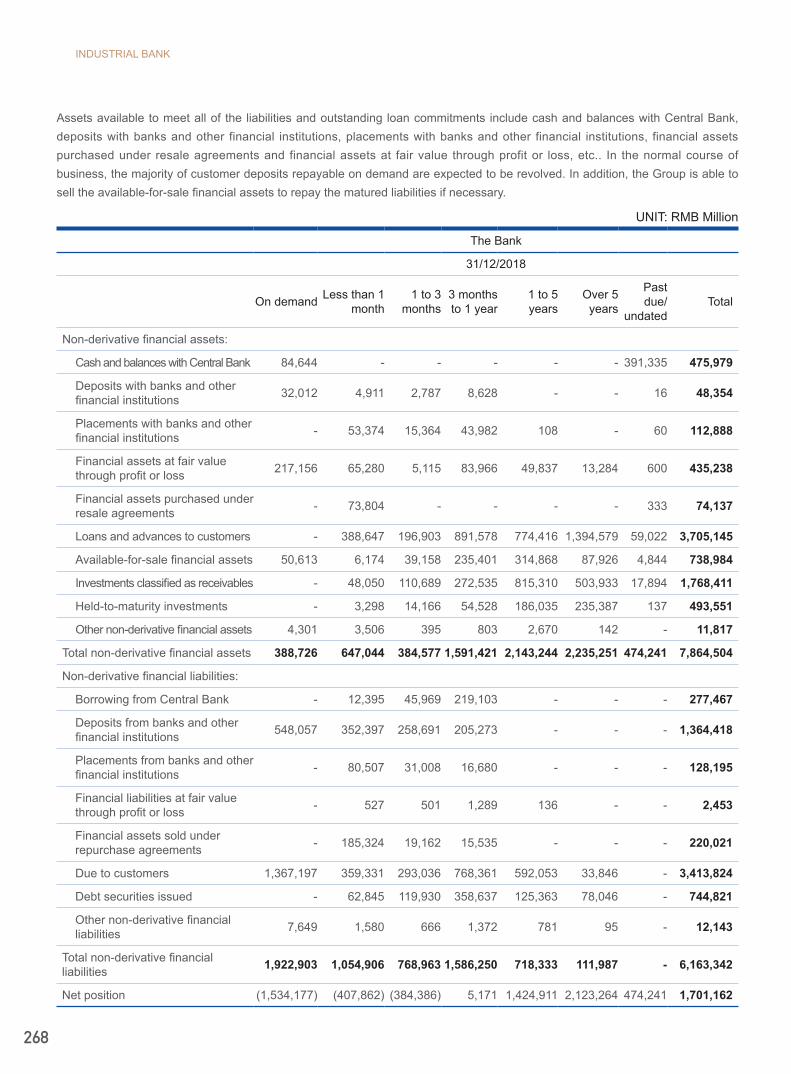
INDUSTRIAL BANK
268
Assets available to meet all of the liabilities and outstanding loan commitments include cash and balances with Central Bank, deposits with banks and other financial institutions, placements with banks and other financial institutions, financial assets purchased under resale agreements and financial assets at fair value through profit or loss, etc.. In the normal course of business, the majority of customer deposits repayable on demand are expected to be revolved. In addition, the Group is able to sell the available-for-sale financial assets to repay the matured liabilities if necessary.
UNIT: RMB Million
The Bank
31/12/2018
On demand Less than 1 month
1 to 3 months
3 months to 1 year
1 to 5 years
Over 5 years
Past due/
undatedTotal
Non-derivative financial assets:
Cash and balances with Central Bank 84,644 - - - - - 391,335 475,979
Deposits with banks and other financial institutions 32,012 4,911 2,787 8,628 - - 16 48,354
Placements with banks and other financial institutions - 53,374 15,364 43,982 108 - 60 112,888
Financial assets at fair value through profit or loss 217,156 65,280 5,115 83,966 49,837 13,284 600 435,238
Financial assets purchased under resale agreements - 73,804 - - - - 333 74,137
Loans and advances to customers - 388,647 196,903 891,578 774,416 1,394,579 59,022 3,705,145
Available-for-sale financial assets 50,613 6,174 39,158 235,401 314,868 87,926 4,844 738,984
Investments classified as receivables - 48,050 110,689 272,535 815,310 503,933 17,894 1,768,411
Held-to-maturity investments - 3,298 14,166 54,528 186,035 235,387 137 493,551
Other non-derivative financial assets 4,301 3,506 395 803 2,670 142 - 11,817
Total non-derivative financial assets 388,726 647,044 384,577 1,591,421 2,143,244 2,235,251 474,241 7,864,504
Non-derivative financial liabilities:
Borrowing from Central Bank - 12,395 45,969 219,103 - - - 277,467
Deposits from banks and other financial institutions 548,057 352,397 258,691 205,273 - - - 1,364,418
Placements from banks and other financial institutions - 80,507 31,008 16,680 - - - 128,195
Financial liabilities at fair value through profit or loss - 527 501 1,289 136 - - 2,453
Financial assets sold under repurchase agreements - 185,324 19,162 15,535 - - - 220,021
Due to customers 1,367,197 359,331 293,036 768,361 592,053 33,846 - 3,413,824
Debt securities issued - 62,845 119,930 358,637 125,363 78,046 - 744,821
Other non-derivative financial liabilities 7,649 1,580 666 1,372 781 95 - 12,143
Total non-derivative financial liabilities 1,922,903 1,054,906 768,963 1,586,250 718,333 111,987 - 6,163,342
Net position (1,534,177) (407,862) (384,386) 5,171 1,424,911 2,123,264 474,241 1,701,162
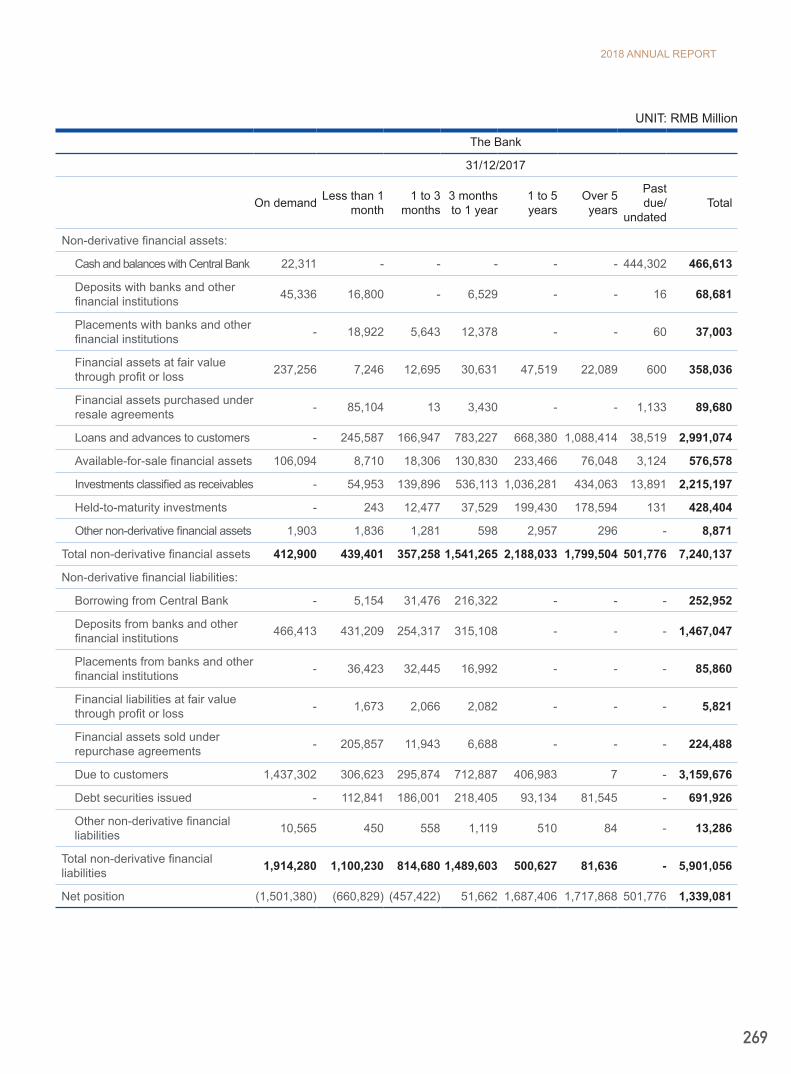
2018 ANNUAL REPORT
269
UNIT: RMB Million
The Bank
31/12/2017
On demand Less than 1 month
1 to 3 months
3 months to 1 year
1 to 5 years
Over 5 years
Past due/
undatedTotal
Non-derivative financial assets:
Cash and balances with Central Bank 22,311 - - - - - 444,302 466,613
Deposits with banks and other financial institutions 45,336 16,800 - 6,529 - - 16 68,681
Placements with banks and other financial institutions - 18,922 5,643 12,378 - - 60 37,003
Financial assets at fair value through profit or loss 237,256 7,246 12,695 30,631 47,519 22,089 600 358,036
Financial assets purchased under resale agreements - 85,104 13 3,430 - - 1,133 89,680
Loans and advances to customers - 245,587 166,947 783,227 668,380 1,088,414 38,519 2,991,074
Available-for-sale financial assets 106,094 8,710 18,306 130,830 233,466 76,048 3,124 576,578
Investments classified as receivables - 54,953 139,896 536,113 1,036,281 434,063 13,891 2,215,197
Held-to-maturity investments - 243 12,477 37,529 199,430 178,594 131 428,404
Other non-derivative financial assets 1,903 1,836 1,281 598 2,957 296 - 8,871
Total non-derivative financial assets 412,900 439,401 357,258 1,541,265 2,188,033 1,799,504 501,776 7,240,137
Non-derivative financial liabilities:
Borrowing from Central Bank - 5,154 31,476 216,322 - - - 252,952
Deposits from banks and other financial institutions 466,413 431,209 254,317 315,108 - - - 1,467,047
Placements from banks and other financial institutions - 36,423 32,445 16,992 - - - 85,860
Financial liabilities at fair value through profit or loss - 1,673 2,066 2,082 - - - 5,821
Financial assets sold under repurchase agreements - 205,857 11,943 6,688 - - - 224,488
Due to customers 1,437,302 306,623 295,874 712,887 406,983 7 - 3,159,676
Debt securities issued - 112,841 186,001 218,405 93,134 81,545 - 691,926
Other non-derivative financial liabilities 10,565 450 558 1,119 510 84 - 13,286
Total non-derivative financial liabilities 1,914,280 1,100,230 814,680 1,489,603 500,627 81,636 - 5,901,056
Net position (1,501,380) (660,829) (457,422) 51,662 1,687,406 1,717,868 501,776 1,339,081
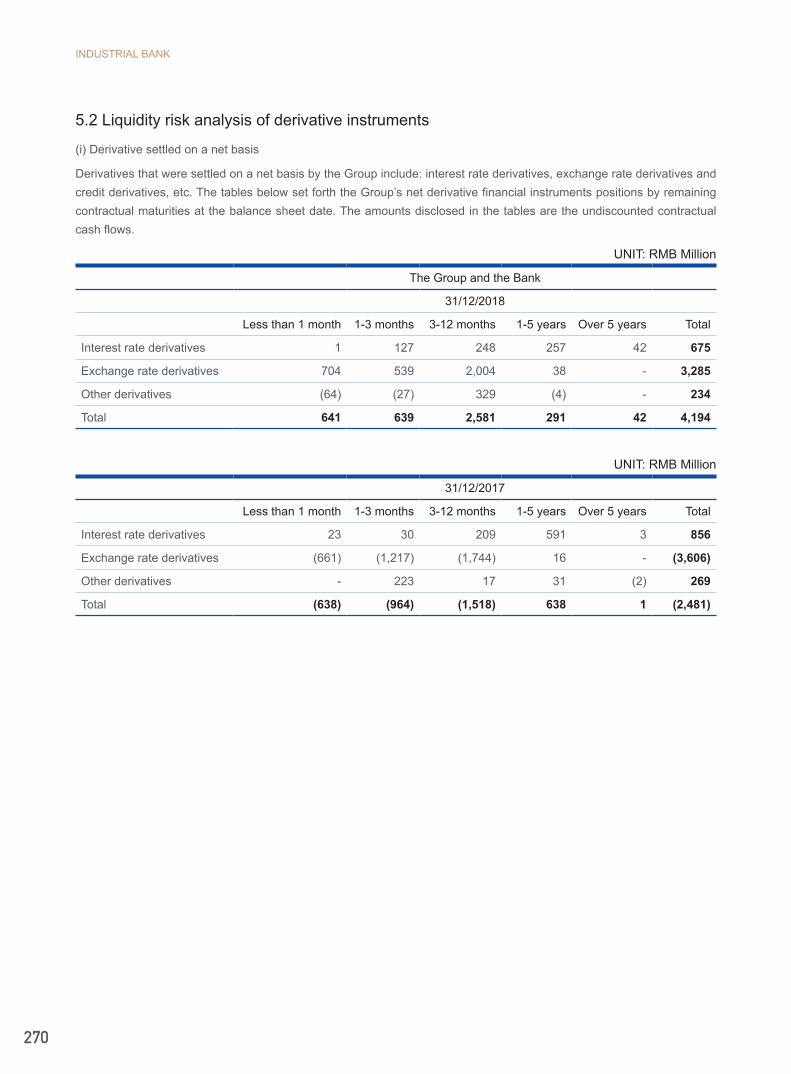
INDUSTRIAL BANK
270
5.2 Liquidity risk analysis of derivative instruments
(i) Derivative settled on a net basis
Derivatives that were settled on a net basis by the Group include: interest rate derivatives, exchange rate derivatives and credit derivatives, etc. The tables below set forth the Group’s net derivative financial instruments positions by remaining contractual maturities at the balance sheet date. The amounts disclosed in the tables are the undiscounted contractual cash flows.
UNIT: RMB Million
The Group and the Bank
31/12/2018
Less than 1 month 1-3 months 3-12 months 1-5 years Over 5 years Total
Interest rate derivatives 1 127 248 257 42 675
Exchange rate derivatives 704 539 2,004 38 - 3,285
Other derivatives (64) (27) 329 (4) - 234
Total 641 639 2,581 291 42 4,194
UNIT: RMB Million
31/12/2017
Less than 1 month 1-3 months 3-12 months 1-5 years Over 5 years Total
Interest rate derivatives 23 30 209 591 3 856
Exchange rate derivatives (661) (1,217) (1,744) 16 - (3,606)
Other derivatives - 223 17 31 (2) 269
Total (638) (964) (1,518) 638 1 (2,481)
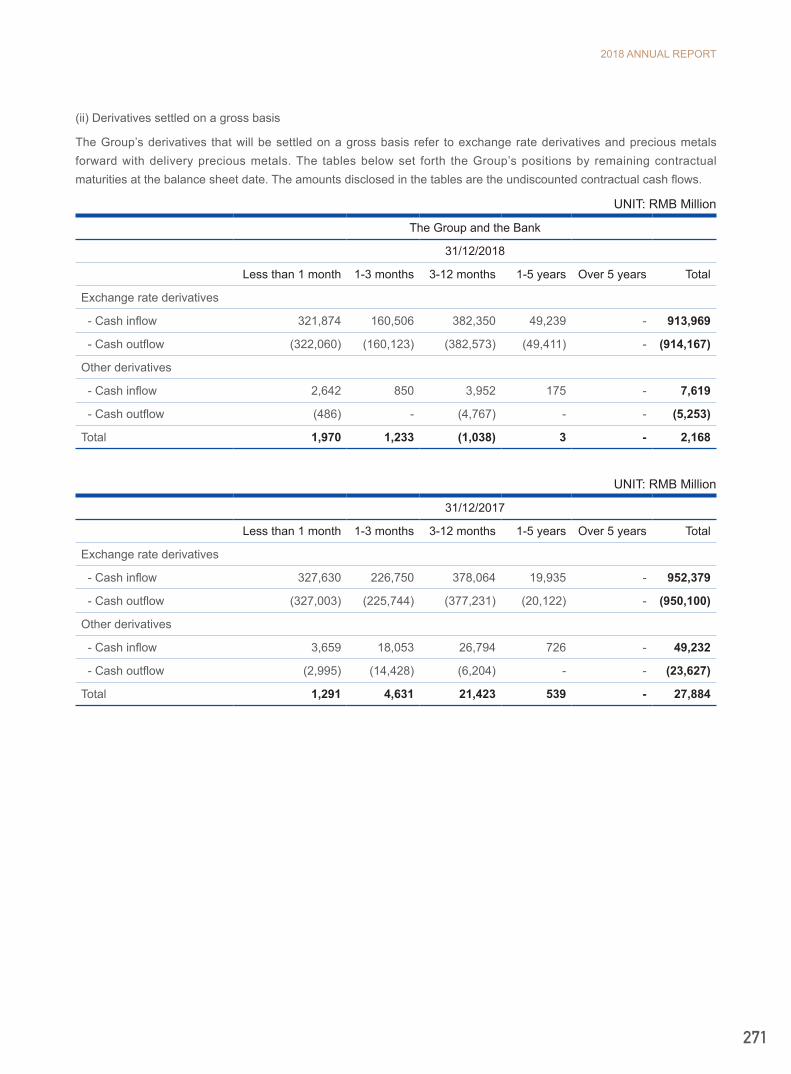
2018 ANNUAL REPORT
271
(ii) Derivatives settled on a gross basis
The Group’s derivatives that will be settled on a gross basis refer to exchange rate derivatives and precious metals forward with delivery precious metals. The tables below set forth the Group’s positions by remaining contractual maturities at the balance sheet date. The amounts disclosed in the tables are the undiscounted contractual cash flows.
UNIT: RMB Million
The Group and the Bank
31/12/2018
Less than 1 month 1-3 months 3-12 months 1-5 years Over 5 years Total
Exchange rate derivatives
- Cash inflow 321,874 160,506 382,350 49,239 - 913,969
- Cash outflow (322,060) (160,123) (382,573) (49,411) - (914,167)
Other derivatives
- Cash inflow 2,642 850 3,952 175 - 7,619
- Cash outflow (486) - (4,767) - - (5,253)
Total 1,970 1,233 (1,038) 3 - 2,168
UNIT: RMB Million
31/12/2017
Less than 1 month 1-3 months 3-12 months 1-5 years Over 5 years Total
Exchange rate derivatives
- Cash inflow 327,630 226,750 378,064 19,935 - 952,379
- Cash outflow (327,003) (225,744) (377,231) (20,122) - (950,100)
Other derivatives
- Cash inflow 3,659 18,053 26,794 726 - 49,232
- Cash outflow (2,995) (14,428) (6,204) - - (23,627)
Total 1,291 4,631 21,423 539 - 27,884

INDUSTRIAL BANK
272
5.3 Off-balance sheet items
The Group’s off-balance sheet items mainly include credit card commitment, letters of credit, letters of guarantee and bank acceptances. The tables below set forth the amounts of the off-balance sheet items by remaining maturity.
UNIT: RMB Million
The Group and the Bank
31/12/2018 31/12/2017
Less than 1 year
1-5 years
Over 5 years Total Less than
1 year1-5
yearsOver 5 years Total
Credit card commitments 284,430 - - 284,430 208,127 - - 208,127
Letter of credit 111,867 135 - 112,002 85,048 96 - 85,144
Letter of guarantee 51,365 46,477 25,826 123,668 42,822 44,408 33,029 120,259
Bank acceptances 532,919 - - 532,919 384,247 - - 384,247
Loan commitments non-cancellable 32 4,721 33,792 38,545 2,193 3,941 35,366 41,500
Total 980,613 51,333 59,618 1,091,564 722,437 48,445 68,395 839,277
6. Capital Management
During the year, the Group had conscientiously implemented the capital management policy according to the regulations of CBIRC Administrative Measures for the Capital of Commercial Banks (for Trial Implementation). As per "2016-2020 Group Development Strategy Plan" and "2018-2020 Capital Adequacy Standards Planning of Transition Period", the Group will achieve healthy and sustainable development as well as make sure capital adequacy ratio meet requirements by well performing capital management policies.
In 2018, the Group has realized the endogenous balanced development in capital entirely without external capital support. The Group fully demonstrated the necessity and feasibility of external capital from the aspect of satisfying the Group's actual demand for future business development in accordance with the regulatory policies for external capital. Meanwhile, the annual general meeting and the board of directors approved the plan to issue the preferred shares of RMB30 billion and the secondary capital debt of RMB50 billion, and the issuance of preferred shares of RMB30 billion has been approved by supervision department. If the aforesaid plan of capital support is implemented on schedule, the Group's capital strength will be further enhanced, and its ability to resist risks and serve the real economy will be further improved.
In 2018, the Group implements capital intensive operation and management, and properly arrange and control the size of the total risk weighted assets of the whole bank, and on the basis of the annual business operation plan, capital retention capacity and assets and liabilities management strategies. Optimize risk-weighted asset amount allocation and governing system on a continuous basis, and improve the evaluation on economic capital yield of each branch and subsidiary, and reasonably adjust the asset business structure, and promote harmonious development of in and off balance sheet activities. More emphasis is placed on the effective use of capital and the value creation of unit risk-weighted asset inputs to promote a stable return on capital.
According to related guidelines of the CBIRC, "Administrative Measures for the Capital of Commercial Banks (for Trial Implementation)" and other regulations, the Group promotes the implementation of new capital agreement, establishes the nearly completed first support work system and seriously implements various works, and monitors the capital adequacy of the Group and its legal person and capital application in real time. As at 31 December 2018, the net book value of the Group's core tier one capital, tier one capital and capital are RMB440,365 million, RMB466,335 million and RMB577,582 million respectively.
2018 ANNUAL REPORT
273
7. Fair value of financial instruments
7.1 Method of fair value recognition
Part of the financial assets and financial liabilities of the Group is measured at fair value. Fair value are measured through appropriate method and parameters, and regularly reviewed by the board of directors to keep its applicability.
When recognizing the fair value of the financial instrument, to those financial instruments which can obtain unadjusted price of same assets and liabilities in the active market, the Group regards the unadjusted price in the active market as the best evidence of fair value. And then the Group recognizes the fair value and classifies it to level 1.
If the parameters of the estimation are observable and acquirable in the active market, such financial instruments (including equity instrument and derivative financial instrument) should be classified to level 2. The Group uses internal or external professionals to estimate the value with techniques including Black-Scholes option pricing model for option derivative financial instrument and discounted cash flow model for non-derivative financial instrument and part of the derivative financial instrument (including interest swaps, forward foreign exchange etc.) which cannot obtain prices in the active market. The main parameters used in the discounted cash flow model include the recent trading price, the relevant yield curve, and exchange rates, etc. The main parameters of Black-Scholes option pricing model used include relevant yield curve, exchange rates and fluctuations level, etc.
To loans and advances to customers and part of investments classified as receivables, their fair value is based on discounted cash flow model, and confirmed by unobservable discount rate which reflects credit risk. Such financial instruments are classified to level 3.
To unlisted equity (private equity) owned by the Group, the measure of fair value may adopt the unobservable input parameters which have significant influence over the estimation. Therefore, such financial instruments are classified to level 3. The management estimates the fair value of level 3 financial instruments by a series of method, including unobservable parameters such as net value of assets and discount rate which lacks market liquidity. If one or more unobservable parameters change based on reasonably possible alternative hypothesis, the fair value of such financial instruments will changed accordingly. The Group has established related internal control process in order to supervise the exposure of the financial instrument.
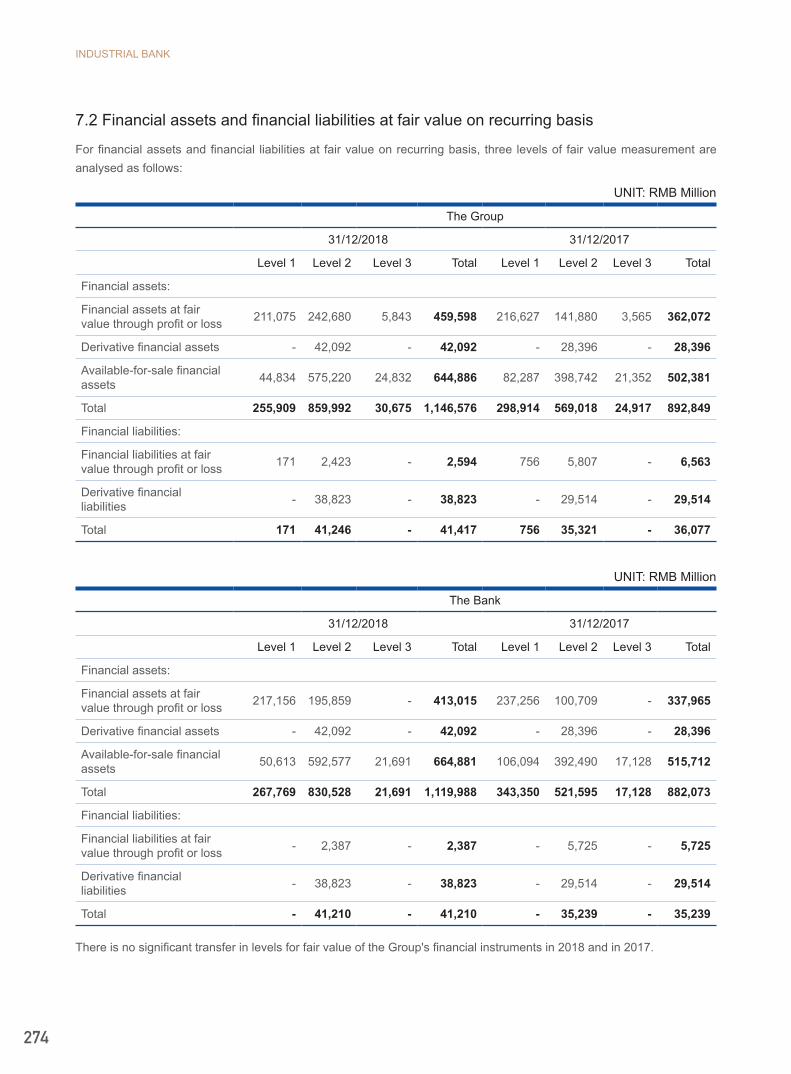
INDUSTRIAL BANK
274
7.2 Financial assets and financial liabilities at fair value on recurring basis
For financial assets and financial liabilities at fair value on recurring basis, three levels of fair value measurement are analysed as follows:
UNIT: RMB Million
The Group
31/12/2018 31/12/2017
Level 1 Level 2 Level 3 Total Level 1 Level 2 Level 3 Total
Financial assets:
Financial assets at fair value through profit or loss 211,075 242,680 5,843 459,598 216,627 141,880 3,565 362,072
Derivative financial assets - 42,092 - 42,092 - 28,396 - 28,396
Available-for-sale financial assets 44,834 575,220 24,832 644,886 82,287 398,742 21,352 502,381
Total 255,909 859,992 30,675 1,146,576 298,914 569,018 24,917 892,849
Financial liabilities:
Financial liabilities at fair value through profit or loss 171 2,423 - 2,594 756 5,807 - 6,563
Derivative financial liabilities - 38,823 - 38,823 - 29,514 - 29,514
Total 171 41,246 - 41,417 756 35,321 - 36,077
UNIT: RMB Million
The Bank
31/12/2018 31/12/2017
Level 1 Level 2 Level 3 Total Level 1 Level 2 Level 3 Total
Financial assets:
Financial assets at fair value through profit or loss 217,156 195,859 - 413,015 237,256 100,709 - 337,965
Derivative financial assets - 42,092 - 42,092 - 28,396 - 28,396
Available-for-sale financial assets 50,613 592,577 21,691 664,881 106,094 392,490 17,128 515,712
Total 267,769 830,528 21,691 1,119,988 343,350 521,595 17,128 882,073
Financial liabilities:
Financial liabilities at fair value through profit or loss - 2,387 - 2,387 - 5,725 - 5,725
Derivative financial liabilities - 38,823 - 38,823 - 29,514 - 29,514
Total - 41,210 - 41,210 - 35,239 - 35,239
There is no significant transfer in levels for fair value of the Group's financial instruments in 2018 and in 2017.
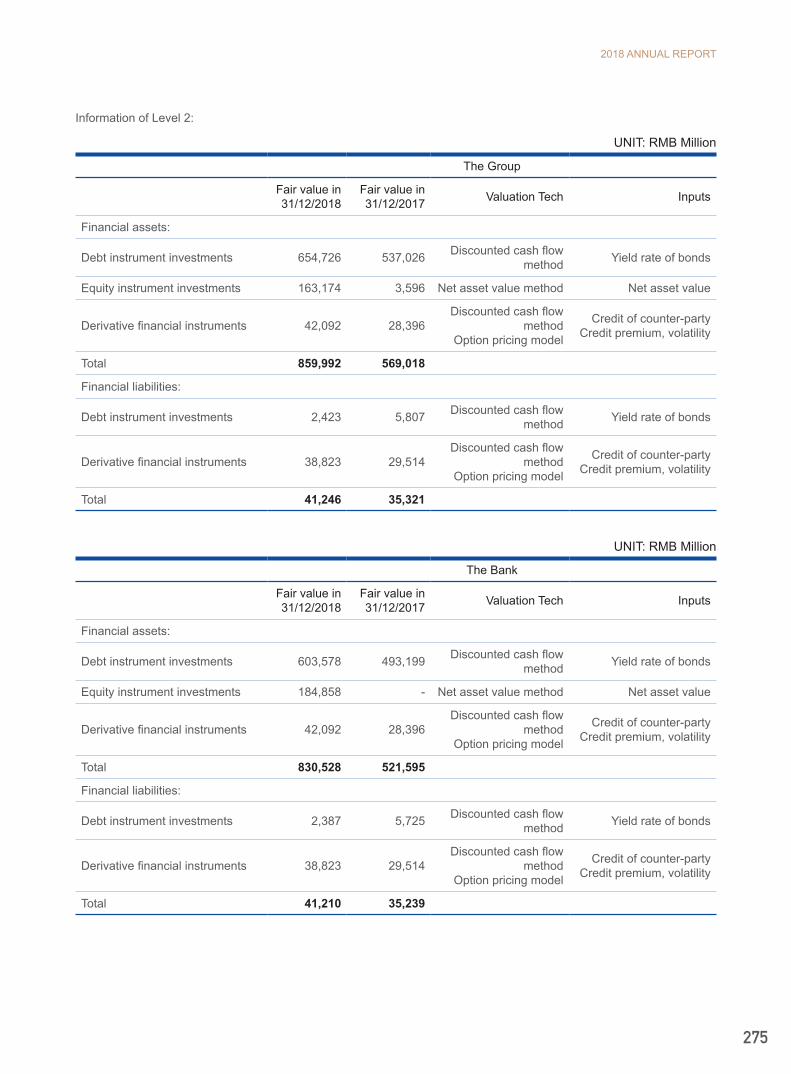
2018 ANNUAL REPORT
275
Information of Level 2:
UNIT: RMB Million
The Group
Fair value in31/12/2018
Fair value in31/12/2017 Valuation Tech Inputs
Financial assets:
Debt instrument investments 654,726 537,026 Discounted cash flow method Yield rate of bonds
Equity instrument investments 163,174 3,596 Net asset value method Net asset value
Derivative financial instruments 42,092 28,396Discounted cash flow
methodOption pricing model
Credit of counter-partyCredit premium, volatility
Total 859,992 569,018
Financial liabilities:
Debt instrument investments 2,423 5,807 Discounted cash flow method Yield rate of bonds
Derivative financial instruments 38,823 29,514Discounted cash flow
methodOption pricing model
Credit of counter-partyCredit premium, volatility
Total 41,246 35,321
UNIT: RMB Million
The Bank
Fair value in31/12/2018
Fair value in31/12/2017 Valuation Tech Inputs
Financial assets:
Debt instrument investments 603,578 493,199 Discounted cash flow method Yield rate of bonds
Equity instrument investments 184,858 - Net asset value method Net asset value
Derivative financial instruments 42,092 28,396Discounted cash flow
methodOption pricing model
Credit of counter-partyCredit premium, volatility
Total 830,528 521,595
Financial liabilities:
Debt instrument investments 2,387 5,725 Discounted cash flow method Yield rate of bonds
Derivative financial instruments 38,823 29,514Discounted cash flow
methodOption pricing model
Credit of counter-partyCredit premium, volatility
Total 41,210 35,239

INDUSTRIAL BANK
276
Information of Level 3:
UNIT: RMB Million
The Group
Fair value in31/12/2018
Fair value in31/12/2017 Value Tech
Debt instrument investment 26,397 20,917 Discounted cash flow method
Equity instrument investments 4,278 4,000 Net asset value method
Total 30,675 24,917
UNIT: RMB Million
The Bank
Fair value in Fair value in
31/12/2018 31/12/2017 Value Tech
Debt instrument investment 19,666 17,128 Discounted cash flow method
Equity instrument investments 2,025 - Net asset value method
Total 21,691 17,128
As for these debt instruments, using the discounted cash flow model for evaluating, the main significant unobservable inputs is the discount rate, the weighted average of 4.60%, and the significant unobservable inputs are inversely proportional to the fair value.
The fair value of aforesaid equity instruments investment is recognized by net asset value method. The main significant unobservable inputs are net asset value. On 31 December 2018, the asset-weighted average unit net value is 0.96, and the significant unobservable inputs are positively related to the fair value.
Adjustment of financial assets and liabilities in level 3 at fair value:
UNIT: RMB Million
The Group
Financial assets at fair value through profit or loss Available-for-sale financial assets
12/31/2018 12/31/2017 12/31/2018 12/31/2017
Opening 3,565 599 21,352 157,458
Profit or loss
-Recognized in other comprehensive income - - 1,507 -
Bought/(Sold) 2,278 2,966 5,864 (36,802)
Settle - - (3,891) (99,304)
Closing 5,843 3,565 24,832 21,352
Unrealized gains or losses for the period included in profit or loss for assets held at the end of the reporting period
(68) - - -
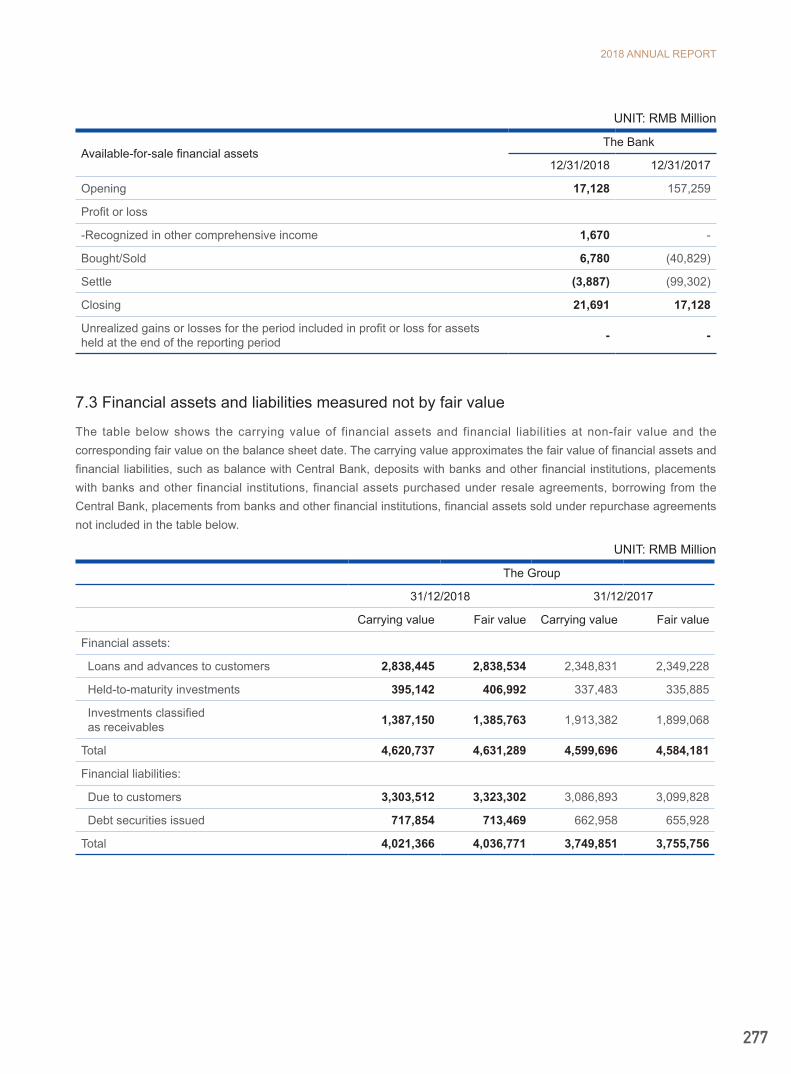
2018 ANNUAL REPORT
277
UNIT: RMB Million
Available-for-sale financial assets The Bank
12/31/2018 12/31/2017
Opening 17,128 157,259
Profit or loss
-Recognized in other comprehensive income 1,670 -
Bought/Sold 6,780 (40,829)
Settle (3,887) (99,302)
Closing 21,691 17,128
Unrealized gains or losses for the period included in profit or loss for assets held at the end of the reporting period - -
7.3 Financial assets and liabilities measured not by fair value
The table below shows the carrying value of financial assets and financial liabilities at non-fair value and the corresponding fair value on the balance sheet date. The carrying value approximates the fair value of financial assets and financial liabilities, such as balance with Central Bank, deposits with banks and other financial institutions, placements with banks and other financial institutions, financial assets purchased under resale agreements, borrowing from the Central Bank, placements from banks and other financial institutions, financial assets sold under repurchase agreements not included in the table below.
UNIT: RMB Million
The Group
31/12/2018 31/12/2017
Carrying value Fair value Carrying value Fair value
Financial assets:
Loans and advances to customers 2,838,445 2,838,534 2,348,831 2,349,228
Held-to-maturity investments 395,142 406,992 337,483 335,885
Investments classified as receivables 1,387,150 1,385,763 1,913,382 1,899,068
Total 4,620,737 4,631,289 4,599,696 4,584,181
Financial liabilities:
Due to customers 3,303,512 3,323,302 3,086,893 3,099,828
Debt securities issued 717,854 713,469 662,958 655,928
Total 4,021,366 4,036,771 3,749,851 3,755,756

INDUSTRIAL BANK
278
UNIT: RMB Million
The Bank
31/12/2018 31/12/2017
Carrying value Fair value Carrying value Fair value
Financial assets:
Loans and advances to customers 2,822,075 2,822,166 2,341,397 2,341,794
Held-to-maturity investments 393,557 405,408 337,483 335,885
Investments classified as receivables 1,375,840 1,374,453 1,899,969 1,885,655
Total 4,591,472 4,602,027 4,578,849 4,563,334
Financial liabilities:
Due to customers 3,304,063 3,323,853 3,087,919 3,100,854
Debt securities issued 698,436 694,725 648,032 641,002
Total 4,002,499 4,018,578 3,735,951 3,741,856
Level of financial assets and liabilities measured not by fair value on balance sheet date:
UNIT: RMB Million
The Group
31/12/2018
Level 1 Level 2 Level 3 Total
Financial assets:
Loans and advances to customers - - 2,838,534 2,838,534
Held-to-maturity investments - 406,992 - 406,992
Investments classified as receivables - 416,236 969,527 1,385,763
Total - 823,228 3,808,061 4,631,289
Financial liabilities:
Due to customers - 3,323,302 - 3,323,302
Debt securities issued - 713,469 - 713,469
Total - 4,036,771 - 4,036,771
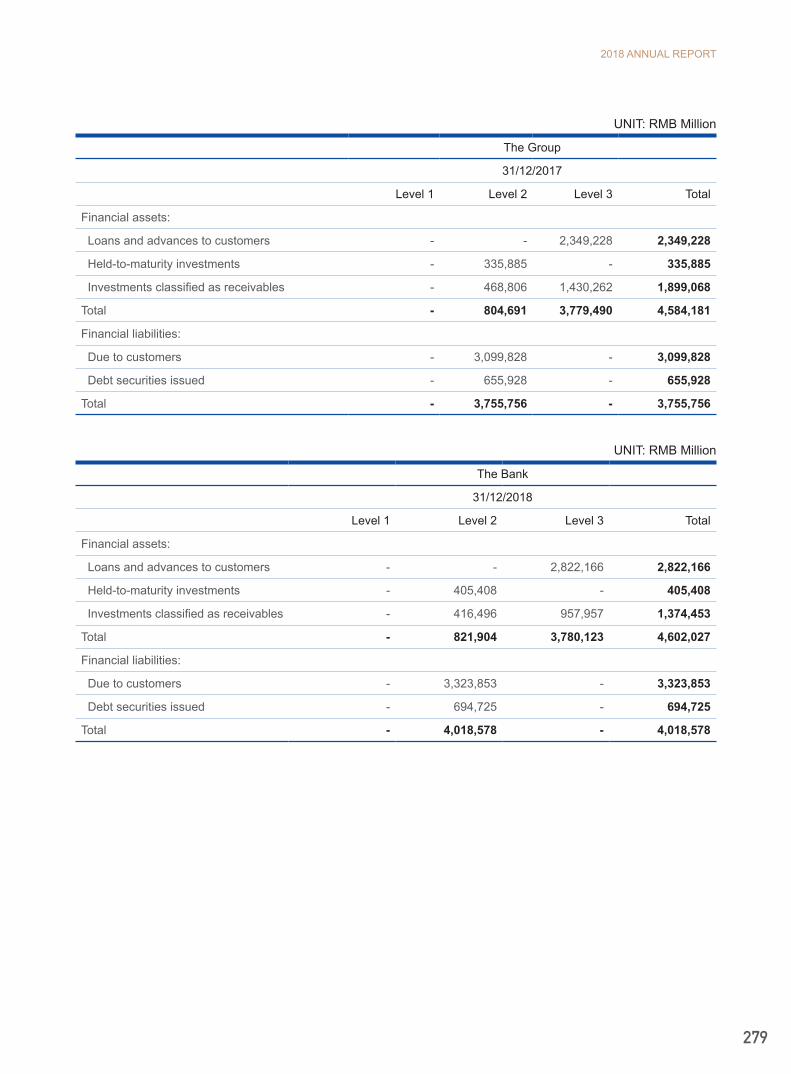
2018 ANNUAL REPORT
279
UNIT: RMB Million
The Group
31/12/2017
Level 1 Level 2 Level 3 Total
Financial assets:
Loans and advances to customers - - 2,349,228 2,349,228
Held-to-maturity investments - 335,885 - 335,885
Investments classified as receivables - 468,806 1,430,262 1,899,068
Total - 804,691 3,779,490 4,584,181
Financial liabilities:
Due to customers - 3,099,828 - 3,099,828
Debt securities issued - 655,928 - 655,928
Total - 3,755,756 - 3,755,756
UNIT: RMB Million
The Bank
31/12/2018
Level 1 Level 2 Level 3 Total
Financial assets:
Loans and advances to customers - - 2,822,166 2,822,166
Held-to-maturity investments - 405,408 - 405,408
Investments classified as receivables - 416,496 957,957 1,374,453
Total - 821,904 3,780,123 4,602,027
Financial liabilities:
Due to customers - 3,323,853 - 3,323,853
Debt securities issued - 694,725 - 694,725
Total - 4,018,578 - 4,018,578

INDUSTRIAL BANK
280
UNIT: RMB Million
The Bank
31/12/2017
Level 1 Level 2 Level 3 Total
Financial assets:
Loans and advances to customers - - 2,341,794 2,341,794
Held-to-maturity investments - 335,885 - 335,885
Investments classified as receivables - 469,316 1,416,339 1,885,655
Total - 805,201 3,758,133 4,563,334
Financial liabilities:
Due to customers - 3,100,854 - 3,100,854
Debt securities issued - 641,002 - 641,002
Total - 3,741,856 - 3,741,856
Quantitative information of level 2, 3 at fair value:
UNIT: RMB Million
The Group
Fair value at31/12/2018
Fair value at31/12/2017 Valuation Technique Inputs
Loans and advances to customers 2,838,534 2,349,228 Discounted cash flow
method
Default rate, loss given default, discount rate
Held-to-maturity investments 406,992 335,885 Discounted cash flow method Yield rate of bonds
Investments classified as receivables 1,385,763 1,899,068 Discounted cash flow
method
Default rate, loss given default, discount rate
Due to customers 3,323,302 3,099,828 Discounted cash flow method Market deposit rate
Debt securities issued 713,469 655,928 Discounted cash flow method Yield rate of bonds
Total 8,668,060 8,339,937

2018 ANNUAL REPORT
281
UNIT: RMB Million
The Bank
Fair value at31/12/2018
Fair value at31/12/2017 Valuation Technique Inputs
Loans and advances to customers 2,822,166 2,341,794 Discounted cash flow
method
Default rate, loss given default, discount rate
Held-to-maturity investments 405,408 335,885 Discounted cash flow method Yield rate of bonds
Investments classified as receivables 1,374,453 1,885,655 Discounted cash flow
method
Default rate, loss given default, discount rate
Due to customers 3,323,853 3,100,854 Discounted cash flow method Market deposit rate
Debt securities issued 694,725 641,002 Discounted cash flow method Yield rate of bonds
Total 8,620,605 8,305,190
All of the above-mentioned assumptions and methods provide a consistent basis for the calculation of the fair values of the Group’s assets and liabilities. However, other institutions may use different assumptions and methods. Therefore, the fair values disclosed by different financial institutions may not be entirely comparable.
XIV. Comparative figuresIn order to comply with the presentation of the financial statements for the year, the Group re-presented certain comparative figures.
XV. NON-ADJUSTING EVENTS AFTER BALANCE SHEET DATEAs approved by the CBIRC and the China Securities Regulatory Commission, the Bank issued non-cumulative preferred stocks in a non-public manner domestically in April 2019, with a total issued amount of 300 million shares and a par value of RMB100 per share amounting to RMB30 ,000 million. The dividend rate of the first interest cycle is 4.90%.
In January 2019, the Bank increased its capital by RMB198 million to its holding subsidiary, Industrial Consumer Finance Co., Ltd., and the registered capital of Industrial Consumer Finance Co., Ltd. was RMB1,500 million after the capital increase.
XVI. FINANCIAL STATEMENTS APPROVEDThe financial statements were approved by the Board of Directors of the Bank on 29 April 2019.

INDUSTRIAL BANK
282
SUPPLEMENTARY INFORMATIONYEAR 2018
1. Breakdown of non-recurring profit or loss
The following table is in accordance with the requirement of Information Disclosure and Presentation Rules for Companies Making Public Offering of Securities No. 1 - Non-recurring Profit or Loss (2008) (ZJHGG [2008] No.43) issued by China Securities Regulatory Commission.
UNIT: RMB Million
The Group
2018 2017
Gains and losses on the disposal of non-current assets 20 70
Government grants recognised in profit or loss 655 362
Recovery of assets written-off in previous years 5,342 3,544
Net non-operating income and expenses in addition to the above 144 (166)
Subtotal 6,161 3,810
Impact on income tax expenses (1,566) (1,053)
Total 4,595 2,757
Total non-recurring profit or loss attributable to ordinary shareholders of the Bank 4,579 2,736
Total non-recurring profit or loss attributable to non-controlling interests 16 21
Net profit attributable to ordinary shareholders of the Bank,after deduction of non-recurring profit or loss 54,559 52,982
Non-recurring profit or loss refers to the profit or loss not related to normal business or the profit or loss which is related to normal business but affects the user of financial statements to make correct judgement for the Bank’s financial position and financial performance because of its distinctiveness and non-recurring. Considering the nature of its normal business, Industrial Bank Co., Ltd. (hereinafter referred to as “the Bank”) does not include “investment income from financial assets at fair value through profit or loss, financial liabilities at fair value through profit or loss and available-for-sale financial assets” in non-recurring profit or loss.
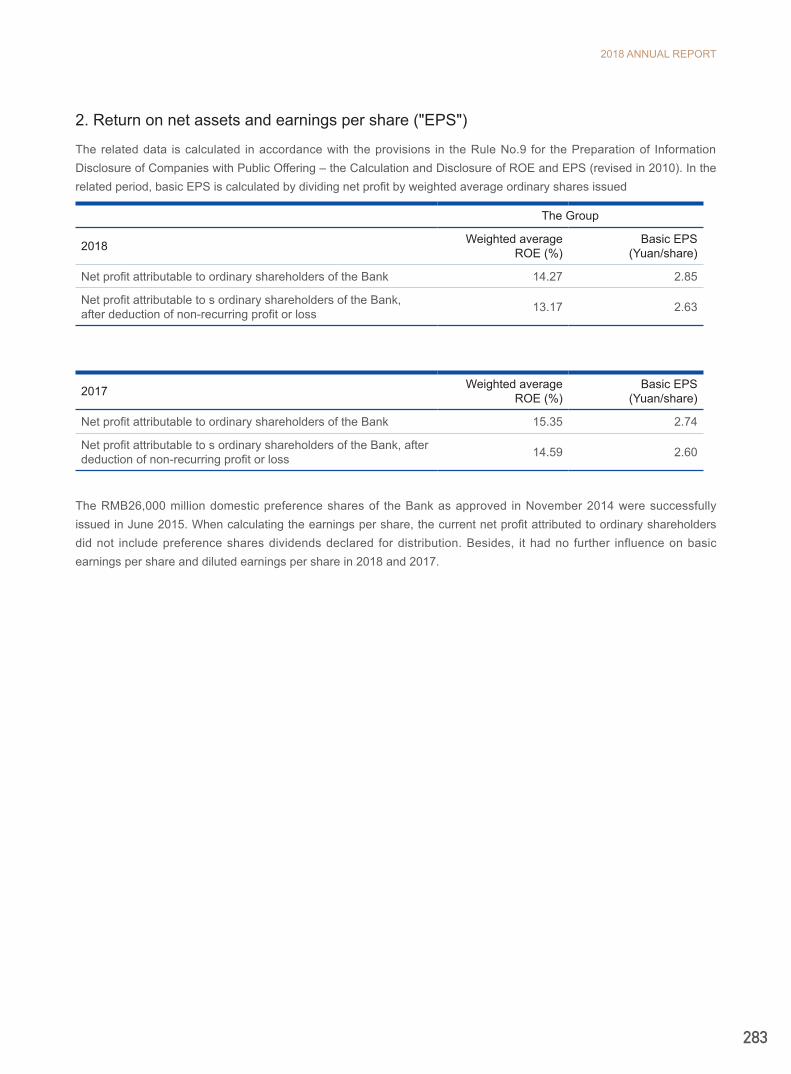
2018 ANNUAL REPORT
283
2. Return on net assets and earnings per share ("EPS")
The related data is calculated in accordance with the provisions in the Rule No.9 for the Preparation of Information Disclosure of Companies with Public Offering – the Calculation and Disclosure of ROE and EPS (revised in 2010). In the related period, basic EPS is calculated by dividing net profit by weighted average ordinary shares issued
The Group
2018 Weighted average ROE (%)
Basic EPS(Yuan/share)
Net profit attributable to ordinary shareholders of the Bank 14.27 2.85
Net profit attributable to s ordinary shareholders of the Bank,after deduction of non-recurring profit or loss 13.17 2.63
2017 Weighted average ROE (%)
Basic EPS(Yuan/share)
Net profit attributable to ordinary shareholders of the Bank 15.35 2.74
Net profit attributable to s ordinary shareholders of the Bank, after deduction of non-recurring profit or loss 14.59 2.60
The RMB26,000 million domestic preference shares of the Bank as approved in November 2014 were successfully issued in June 2015. When calculating the earnings per share, the current net profit attributed to ordinary shareholders did not include preference shares dividends declared for distribution. Besides, it had no further influence on basic earnings per share and diluted earnings per share in 2018 and 2017.

General Shareholders’ Meeting
Board of Directors
Office of the Board of Directors
Office of the Board of Supervisors
Board of Supervisors
Nomination, Remuneration & Evaluation Committee
Supervision Committee
President
Strategy Committee
Nomination Committee
Remuneration & Evaluation Committee
Audit & Related Party Transaction Control Committee
Audit Dept
Beijing Audit Division
Shanghai Audit Division
Guangzhou Audit Division
Chengdu Audit Division
Xi’an Audit Division
Shenyang Audit Division
Business Operation Management Committee
Asset & Liability Management Committee
Risk Management Committee
Investment Decision Committee
Credit Approval Committee
Internal Control Committee
Major Purchases Committee
Business Continuity Management Committee
Internal Accountability Committee
The Company’s Organizational Structure
Risk Management & Consumer Protection Committee
Green Finance Business Committee
Financial Technology Committee

Special Asset Management Dept
Retail Banking Segment
Interbank Finance Segment
IB & Financial Market
Segment
Retail Asset & Liability Management Dept
Retail Risk Management Dept
Interbank Business Dept (Futures Finance Dept)
Bank Cooperation Center
Investment Banking Dept
Assets Management Dept
Financial Markets
Assets Custody Dept
IB & Financial Market Risk Management Dept
Operation Management Dept
Information & Technology Dept
E-finance Dept
Discipline Inspection & Supervision Dept
Party & Populace Pidgin Dept
Labor Union Committee
Administrative & Security Dept
Shanghai Administrative Service Center
Beijing Representative Office (Beijing Administrative Service Center)
Branches & Sub-branches
Direct Holding Subsidiaries
General Office
Planning & Finance Dept
Development & Planning Dept
Human Resources Dept
Risk Management Dept
Legal & Compliance Dept
Corporate Finance Segment
Large Customer Dept
SME Dept
Corporate Finance Business Management Dept
Transaction Banking Dept
Green Finance Dept
Corporate Finance Risk Management Dept
Asset & Liability Management Center
Institutional Business Center
Automobile Financial Business Center
International Business Center
Inclusive Finance Dept
Private Banking Dept
Bank Card & Channel Dept
Pension Finance Center
Credit Card Center
Retail Internet Finance Center
Wealth Business Center
Interbank Assets Business Dept (Notes Center)
Fuzhou Operation Center
Chengdu Operation Center
Customer Service Center
Shanghai Customer Service Center
Chengdu Customer Service Center
Technology & Quality Management Center
Digital Center
Shanghai R&D Center
Fuzhou R&D Center
Chengdu R&D Center
Data Center
Information Center
Industrial Bank Financial Leasing Co., Ltd.
China Industrial International Trust Limited.
CIB Fund Management Co., Ltd.
Industrial Consumer Finance Co., Ltd.

This annual report is printed on PEFC certified paper.