2017 FULL YEAR RESULTS PRESENTATION - … · 2017 FULL YEAR RESULTS PRESENTATION MEDICLINIC RESULTS...
44
2017 FULL YEAR RESULTS PRESENTATION
Transcript of 2017 FULL YEAR RESULTS PRESENTATION - … · 2017 FULL YEAR RESULTS PRESENTATION MEDICLINIC RESULTS...
2017 FULL YEAR RESULTS
PRESENTATION
2017 FULL YEAR RESULTS PRESENTATION 2
MEDICLINIC RESULTS
DISCLAIMER
This presentation contains certain forward-looking statements relating to the financial condition, theregulatory environment in which we operate, results of operations and businesses of Mediclinic and theGroup, including certain plans and objectives of the Group.
All statements other than statements of historical fact are, or may be deemed to be, forward-lookingstatements. Forward-looking statements are statements of future expectations that are based onmanagement’s current expectations and assumptions and involve known and unknown risks anduncertainties that could cause actual results, performance or events to differ materially from thoseexpressed or implied in these statements.
Forward-looking statements include, among other things, statements concerning the potential exposureof Mediclinic to market risks and statements expressing management’s expectations, beliefs, estimates,forecasts, projections and assumptions, including as to future potential cost savings, synergies, earnings,cash flow, production and prospects. These forward-looking statements are identified by their use ofterms and phrases such as “anticipate”, “believe”, “could”, “estimate”, “expect”, “goals”, “intend”, “may”,“objectives”, “outlook”, “plan”, “probably”, “project”, “risks”, “seek”, “should”, “target”, “will” and similarterms and phrases.

2017 FULL YEAR RESULTS PRESENTATION
MEDICLINIC RESULTS
AGENDA
INTRODUCTION Page 4
FINANCIAL REVIEW Page 6
OPERATIONAL REVIEW Page 19
STRATEGY Page 24
QUESTIONS AND ANSWERS Page 30
APPENDIX Page 31
INTRODUCTION
DANIE MEINTJES
CEO MEDICLINIC INTERNATIONAL
2017 FULL YEAR RESULTS PRESENTATION
MEDICLINIC RESULTS
HIGHLIGHTS
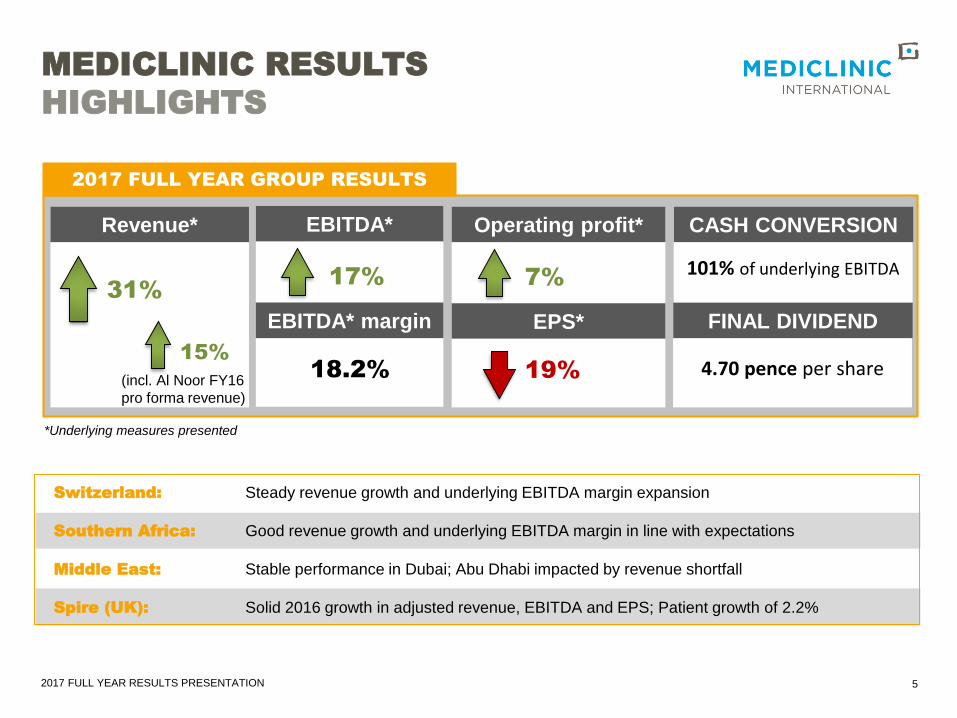
2017 FULL YEAR GROUP RESULTS
Revenue*
31%
(incl. Al Noor FY16
pro forma revenue)
15%
Operating profit*
101% of underlying EBITDA7%
19%
EPS*
5
*Underlying measures presented
CASH CONVERSION
Switzerland: Steady revenue growth and underlying EBITDA margin expansion
Southern Africa: Good revenue growth and underlying EBITDA margin in line with expectations
Middle East: Stable performance in Dubai; Abu Dhabi impacted by revenue shortfall
Spire (UK): Solid 2016 growth in adjusted revenue, EBITDA and EPS; Patient growth of 2.2%
EBITDA*
17%
18.2%
EBITDA* margin
4.70 pence per share
FINAL DIVIDEND

2017 FULL YEAR RESULTS PRESENTATION
FINANCIAL
REVIEW
JURGENS MYBURGH
CFO MEDICLINIC INTERNATIONAL
2017 FULL YEAR RESULTS PRESENTATION
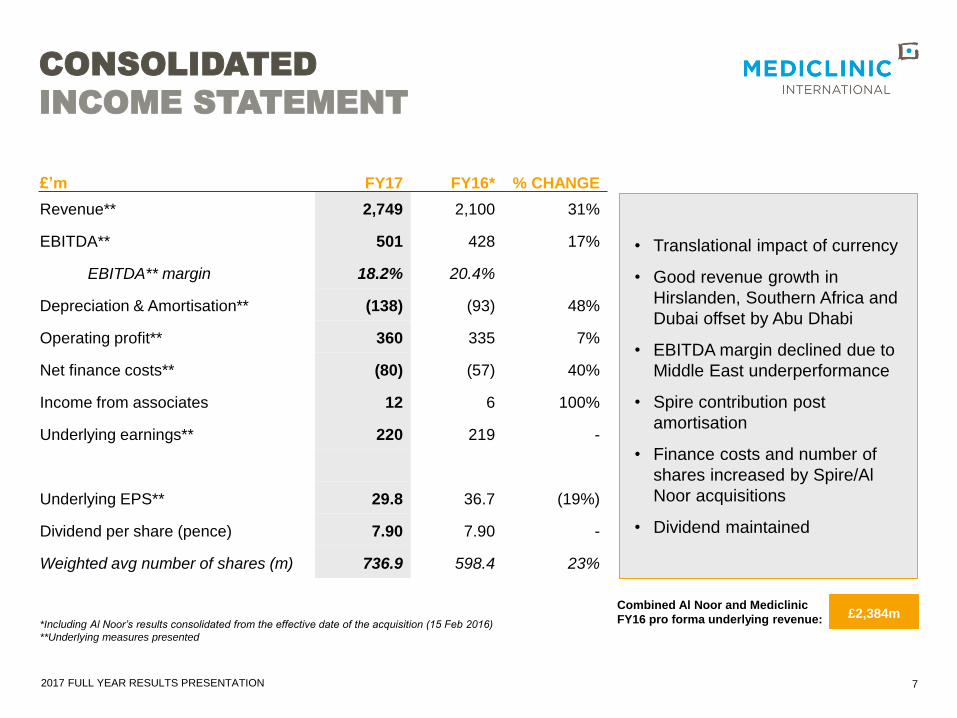
£’m FY17 FY16* % CHANGE
Revenue** 2,749 2,100 31%
EBITDA** 501 428 17%
EBITDA** margin 18.2% 20.4%
Depreciation & Amortisation** (138) (93) 48%
Operating profit** 360 335 7%
Net finance costs** (80) (57) 40%
Income from associates 12 6 100%
Underlying earnings** 220 219 -
Underlying EPS** 29.8 36.7 (19%)
Dividend per share (pence) 7.90 7.90 -
Weighted avg number of shares (m) 736.9 598.4 23%
*Including Al Noor’s results consolidated from the effective date of the acquisition (15 Feb 2016)
**Underlying measures presented
CONSOLIDATED
INCOME STATEMENT
7
£2,384mCombined Al Noor and Mediclinic
FY16 pro forma underlying revenue:
• Translational impact of currency
• Good revenue growth in
Hirslanden, Southern Africa and
Dubai offset by Abu Dhabi
• EBITDA margin declined due to
Middle East underperformance
• Spire contribution post
amortisation
• Finance costs and number of
shares increased by Spire/Al
Noor acquisitions
• Dividend maintained
2017 FULL YEAR RESULTS PRESENTATION
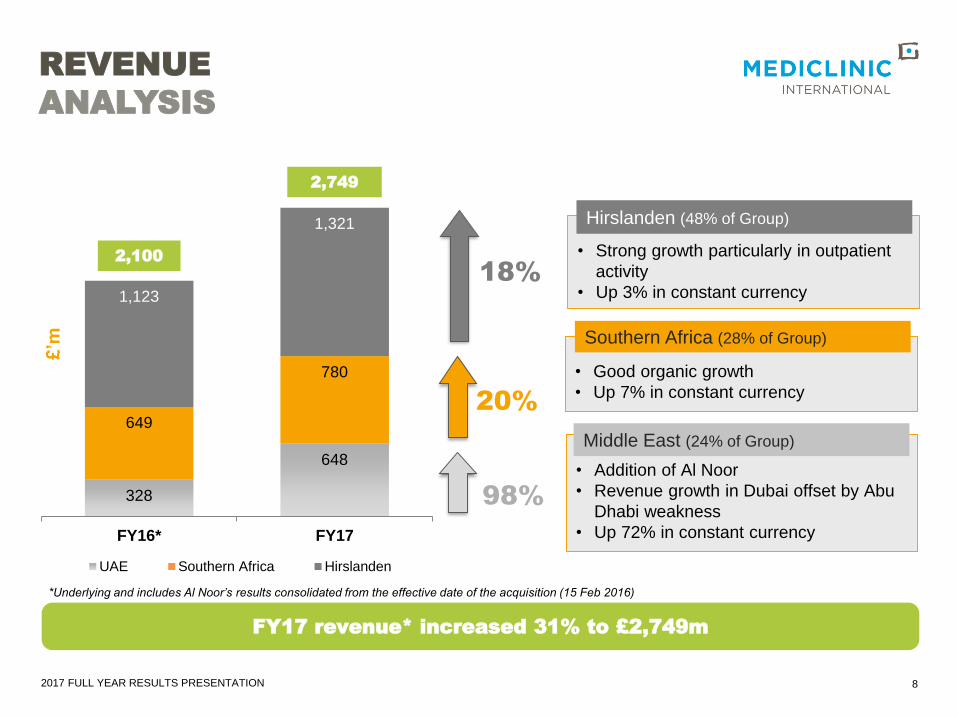
328
648
649
780
1,123
1,321
FY16* FY17
UAE Southern Africa Hirslanden
REVENUE
ANALYSIS
8
2,100
20%
18%
98%
• Good organic growth
• Up 7% in constant currency
• Strong growth particularly in outpatient
activity
• Up 3% in constant currency
• Addition of Al Noor
• Revenue growth in Dubai offset by Abu
Dhabi weakness
• Up 72% in constant currency
2,749
Southern Africa (28% of Group)
Hirslanden (48% of Group)
Middle East (24% of Group)
FY17 revenue* increased 31% to £2,749m
£’m
*Underlying and includes Al Noor’s results consolidated from the effective date of the acquisition (15 Feb 2016)

2017 FULL YEAR RESULTS PRESENTATION
FY16 Hirslandenconstantcurrency
SouthernAfrican
constantcurrency
Dubai contantcurrency
Abu Dhabiconstantcurrency
Effect ofreportingcurrency
FY17
9
REVENUE BRIDGE
• Good revenue growth in constant
currency
• Driven by Switzerland and
Southern Africa
• Middle East revenue shortfall:
- Thiqa co-payments
- Doctor vacancies
- Business and operational
alignment
- Increased competition
£’m
MCME
Abu Dhabi
Pro-forma
adjustment
2,100
2,749
284 3944 12
334
-64
2,749

2017 FULL YEAR RESULTS PRESENTATION
UNDERLYING EBITDA
ANALYSIS
10
-4
70 76
139165
221
264
FY16 FY17
Corporate Cost Middle East Southern Africa Hirslanden
FY17 underlying EBITDA increased 17% to £501m
428
19%
19%
9%
• Pharmacy inflation and ongoing investment
in clinical personnel
• Ongoing change in patient mix
• Up 6% in constant currency
• Operating leverage
• Specific cost management measures
• Continued insurance mix change
• Up 5% in constant currency
• Addition of Al Noor
• Affected by revenue shortfall
• Down 5% in constant currency
501
£’m
-2
Southern Africa (33% of Group)
Hirslanden (53% of Group)
Middle East (15% of Group)
2017 FULL YEAR RESULTS PRESENTATION
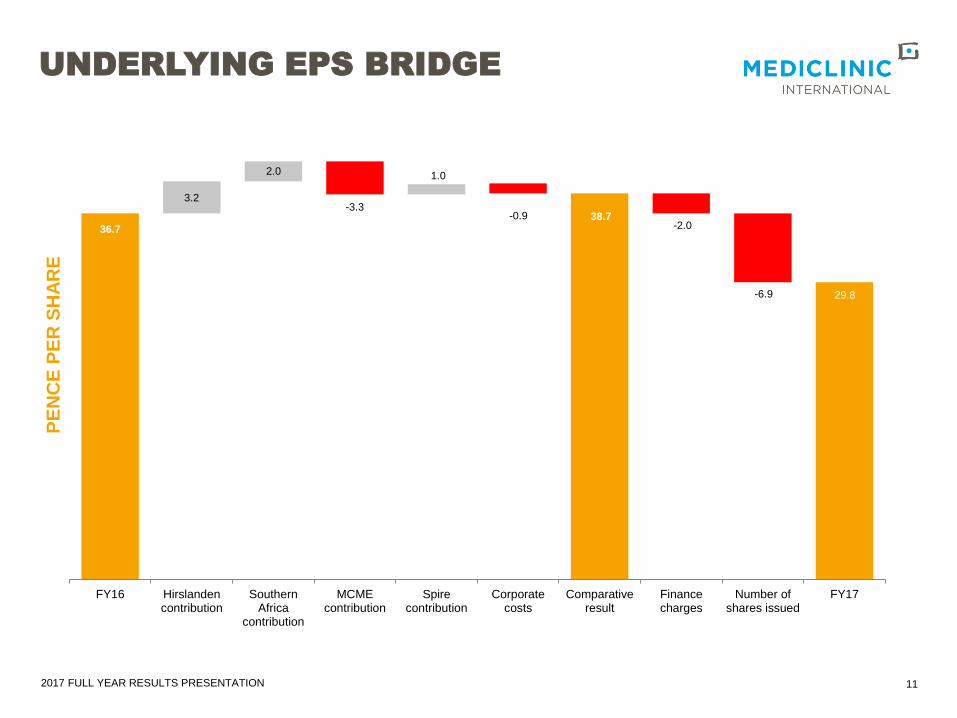
UNDERLYING EPS BRIDGE
FY16 Hirslandencontribution
SouthernAfrica
contribution
MCMEcontribution
Spirecontribution
Corporatecosts
Comparativeresult
Financecharges
Number ofshares issued
FY17
11
PE
NC
E P
ER
SH
AR
E
36.7
29.8
38.7
3.2
2.0
-3.3
1.0
-0.9-2.0
-6.9

2017 FULL YEAR RESULTS PRESENTATION
GROUP
BALANCE SHEET SUMMARY
12
£’m 31 Mar 17 31 Mar 16
Assets 7,422 6,549
Non-current assets:
Property, equipment and vehicles 3,703 3,199
Intangible assets 2,156 1,941
Other non-current assets 494 478
Current assets 1,069 931
Equity and liabilities 7,422 6,549
Shareholders’ funds 4,086 3,509
Non-controlling interests 78 61
Interest-bearing debt 2,030 1,841
Other long-term liabilities 707 668
Current liabilities 521 470
• Borrowings down in constant
currency
• Continued investment in
buildings and equipment
• Strong working capital
management
2017 FULL YEAR RESULTS PRESENTATION
GROUP
CASH FLOW SUMMARY
13
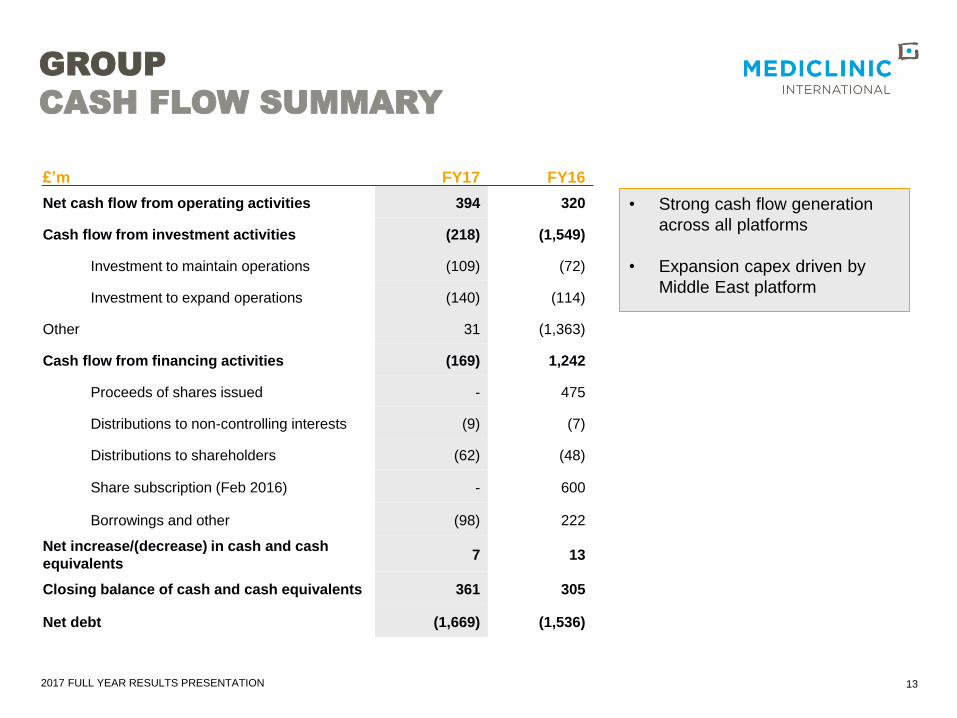
£’m FY17 FY16
Net cash flow from operating activities 394 320
Cash flow from investment activities (218) (1,549)
Investment to maintain operations (109) (72)
Investment to expand operations (140) (114)
Other 31 (1,363)
Cash flow from financing activities (169) 1,242
Proceeds of shares issued - 475
Distributions to non-controlling interests (9) (7)
Distributions to shareholders (62) (48)
Share subscription (Feb 2016) - 600
Borrowings and other (98) 222
Net increase/(decrease) in cash and cash
equivalents7 13
Closing balance of cash and cash equivalents 361 305
Net debt (1,669) (1,536)
• Strong cash flow generation
across all platforms
• Expansion capex driven by
Middle East platform
2017 FULL YEAR RESULTS PRESENTATION
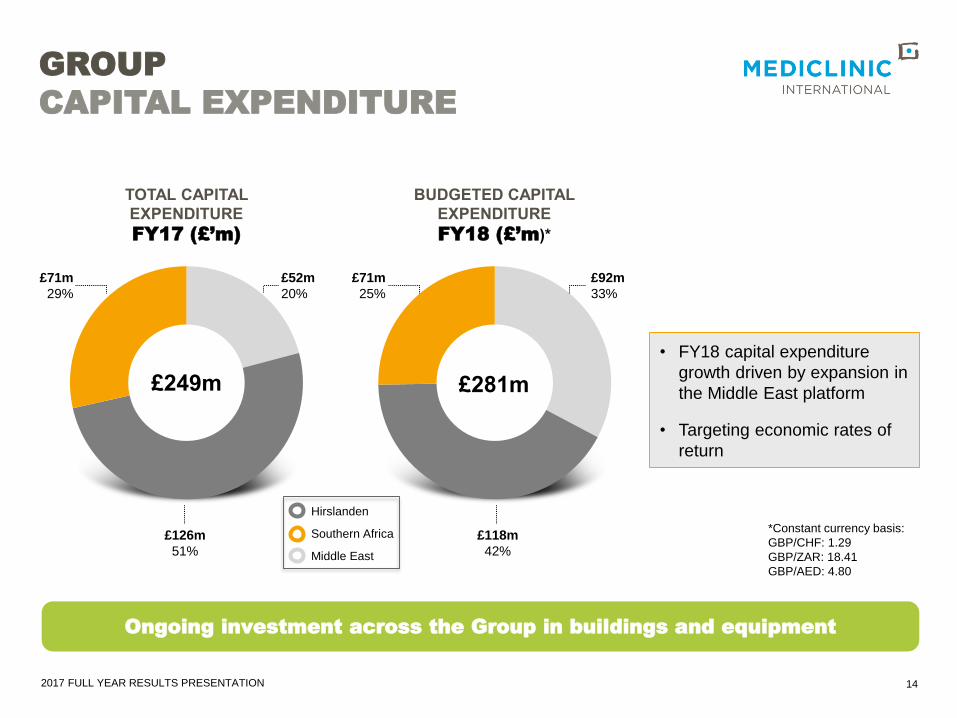
£281m£249m
GROUP
CAPITAL EXPENDITURE
TOTAL CAPITAL
EXPENDITURE
FY17 (£’m)
BUDGETED CAPITAL
EXPENDITURE
FY18 (£’m)*
14
Ongoing investment across the Group in buildings and equipment
• FY18 capital expenditure
growth driven by expansion in
the Middle East platform
• Targeting economic rates of
return
£71m
29%
£126m
51%
£118m
42%
£71m
25%
£92m
33%
£52m
20%
*Constant currency basis:
GBP/CHF: 1.29
GBP/ZAR: 18.41
GBP/AED: 4.80
Hirslanden
Southern Africa
Middle East
2017 FULL YEAR RESULTS PRESENTATION
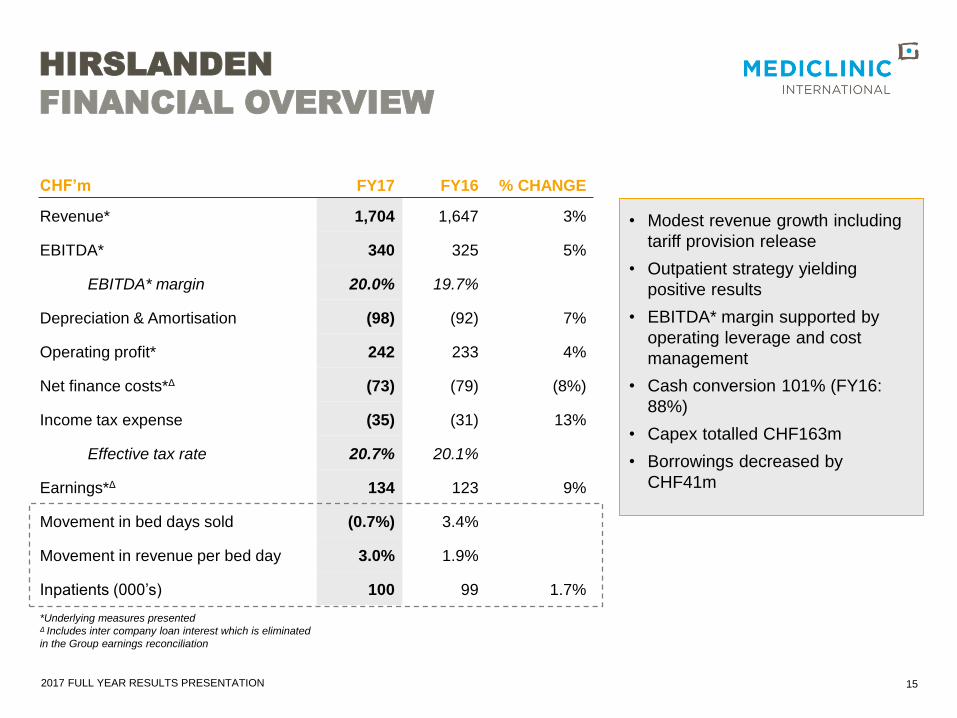
HIRSLANDEN
FINANCIAL OVERVIEW
15
• Modest revenue growth including
tariff provision release
• Outpatient strategy yielding
positive results
• EBITDA* margin supported by
operating leverage and cost
management
• Cash conversion 101% (FY16:
88%)
• Capex totalled CHF163m
• Borrowings decreased by
CHF41m
CHF’m FY17 FY16 % CHANGE
Revenue* 1,704 1,647 3%
EBITDA* 340 325 5%
EBITDA* margin 20.0% 19.7%
Depreciation & Amortisation (98) (92) 7%
Operating profit* 242 233 4%
Net finance costs*Δ (73) (79) (8%)
Income tax expense (35) (31) 13%
Effective tax rate 20.7% 20.1%
Earnings*Δ 134 123 9%
Movement in bed days sold (0.7%) 3.4%
Movement in revenue per bed day 3.0% 1.9%
Inpatients (000’s) 100 99 1.7%
*Underlying measures presentedΔ Includes inter company loan interest which is eliminated
in the Group earnings reconciliation

2017 FULL YEAR RESULTS PRESENTATION
MEDICLINIC SOUTHERN AFRICA
FINANCIAL OVERVIEW
16
• Revenue growth in line with
expectations
• Bed day growth impacted by
weaker macro economic
environment and increased
competition
• EBITDA* margin impacted by
pharmacy inflation, clinical
positions and a continued
change in patient mix
• Cash conversion 104%
(2016: 109%)
• Capex totalled ZAR1,305m
• Borrowings increased by
ZAR2,791m
ZAR’m FY17 FY16 % CHANGE
Revenue 14,367 13,450 7%
EBITDA* 3,049 2,877 6%
EBITDA* margin 21.2% 21.4%
Depreciation & Amortisation (466) (414) 13%
Operating profit* 2,583 2,463 5%
Net finance costs (496) (270) 84%
Income tax expense (582) (637) (9%)
Effective tax rate 27.6% 28.8%
Earnings* 1,239 1,305 (5%)
Movement in bed days sold 0.8% 2.9%
Movement in revenue per bed day 5.8% 6.3%
Admissions (000’s) 579 575 0.6%
*Underlying measures presented
2017 FULL YEAR RESULTS PRESENTATION
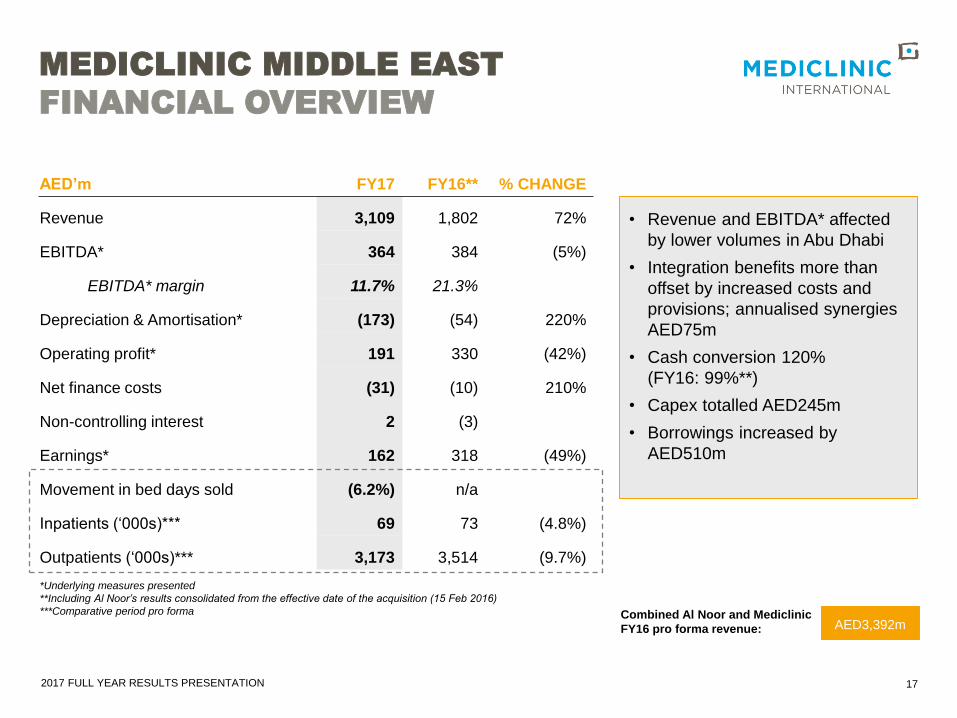
AED’m FY17 FY16** % CHANGE
Revenue 3,109 1,802 72%
EBITDA* 364 384 (5%)
EBITDA* margin 11.7% 21.3%
Depreciation & Amortisation* (173) (54) 220%
Operating profit* 191 330 (42%)
Net finance costs (31) (10) 210%
Non-controlling interest 2 (3)
Earnings* 162 318 (49%)
Movement in bed days sold (6.2%) n/a
Inpatients (‘000s)*** 69 73 (4.8%)
Outpatients (‘000s)*** 3,173 3,514 (9.7%)
*Underlying measures presented
**Including Al Noor’s results consolidated from the effective date of the acquisition (15 Feb 2016)
***Comparative period pro forma
MEDICLINIC MIDDLE EAST
FINANCIAL OVERVIEW
17
• Revenue and EBITDA* affected
by lower volumes in Abu Dhabi
• Integration benefits more than
offset by increased costs and
provisions; annualised synergies
AED75m
• Cash conversion 120%
(FY16: 99%**)
• Capex totalled AED245m
• Borrowings increased by
AED510m
AED3,392mCombined Al Noor and Mediclinic
FY16 pro forma revenue:

2017 FULL YEAR RESULTS PRESENTATION
MEDICLINIC INTERNATIONAL
FY18 OUTLOOK
18
HIRSLANDEN
MEDICLINIC
SOUTHERN
AFRICA
MEDICLINIC
MIDDLE
EAST
• Modest revenue growth given already high occupancy rates, stable beds and Easter
impact
• Lower underlying EBITDA margin due to tariff and regulatory environment, increasing
costs and assuming no further net tariff provision benefits; partly offset by ongoing
efficiency gains
• Revenue growth in line with inflation due to challenging macro-economic environment,
greater competition, funder constraints and Easter impact
• Broadly stable underlying EBITDA margin despite cost inflation running above tariff
increases
• Dubai: Performance expected to remain stable despite the competitive landscape
• Abu Dhabi: Gradual improvement over the next couple of years
• MCME: Modest improvement in revenue for the full year
• MCME: Gradual improvement in underlying EBITDA margins over time, including the
impact associated with the opening of new facilities
• MCME: 1H FY18 performance down versus 1H FY17 due to lower patient volumes
and revenues in Abu Dhabi following the Thiqa co-payment introduction, asset sales
and business and operational alignment initiatives
2017 FULL YEAR RESULTS PRESENTATION
OPERATIONAL
REVIEW
DANIE MEINTJES
CEO MEDICLINIC INTERNATIONAL

2017 FULL YEAR RESULTS PRESENTATION
OPERATIONS
HIRSLANDEN
20
Competitive, mature healthcare market
Further increase in productivity through
continued cost focus
High occupancy rates, particularly in
second half of the year
Ongoing investment including outpatient
service development and Hirslanden 2020
Continued change in insurance mix
Ongoing review of regulations at a Federal
and Cantonal level including TARMED and
outmigration
OPERATIONS OPERATIONAL OVERVIEW
HOSPITALS
16
BEDS
1,677
CLINICS
4
EMPLOYEES
9,402
BED NUMBERS AND OCCUPANCY
1,487
1,567
1,655 1,677 1,677
73.3%
75.3%76.2% 76.3% 76.2%
70%
75%
80%
85%
1,000
1,200
1,400
1,600
1,800
FY13 FY14 FY15 FY16 FY17
Operational beds Bed occupancy rate
NU
MB
ER
OF
BE
DS
BE
D O
CC
UP
AN
CY
RA
TE
2017 FULL YEAR RESULTS PRESENTATION
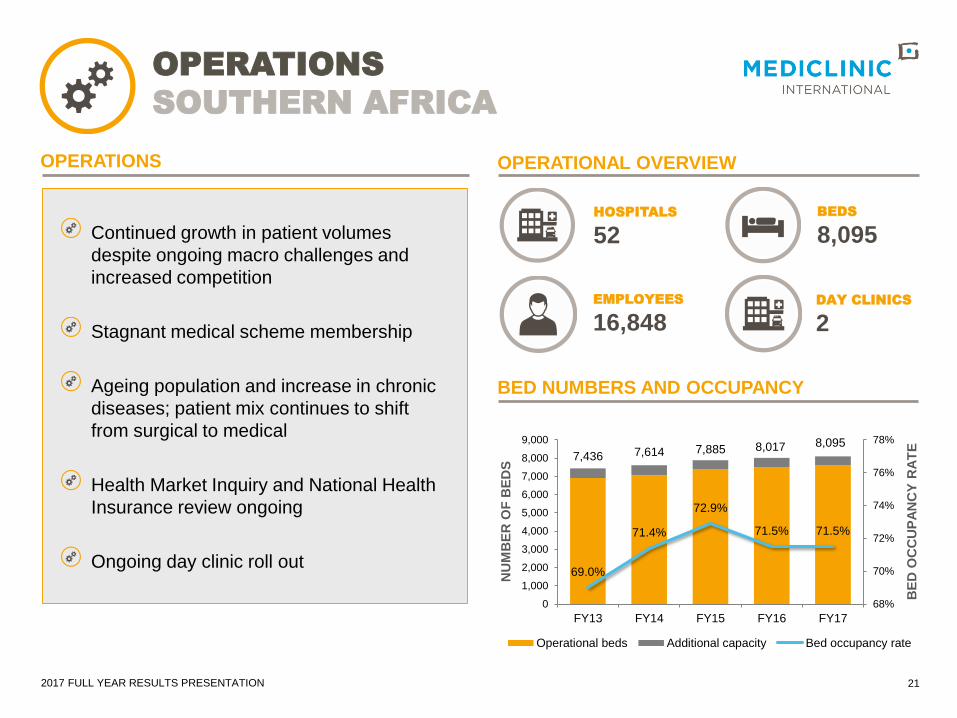
OPERATIONS
SOUTHERN AFRICA
OPERATIONS
Continued growth in patient volumes
despite ongoing macro challenges and
increased competition
Stagnant medical scheme membership
Ageing population and increase in chronic
diseases; patient mix continues to shift
from surgical to medical
Health Market Inquiry and National Health
Insurance review ongoing
Ongoing day clinic roll out
OPERATIONAL OVERVIEW
HOSPITALS
52
EMPLOYEES
16,848
BEDS
8,095
BED NUMBERS AND OCCUPANCY
DAY CLINICS
2
7,436 7,614 7,885 8,017 8,095
69.0%
71.4%
72.9%
71.5% 71.5%
68%
70%
72%
74%
76%
78%
0
1,000
2,000
3,000
4,000
5,000
6,000
7,000
8,000
9,000
FY13 FY14 FY15 FY16 FY17
Operational beds Additional capacity Bed occupancy rate
NU
MB
ER
OF
BE
DS
BE
D O
CC
UP
AN
CY
RA
TE
21

2017 FULL YEAR RESULTS PRESENTATION
OPERATIONS
MIDDLE EAST
Long term opportunities in UAE remain
strong; supports expansion strategy
Thiqa co-payments significantly impacted
Abu Dhabi volumes in addition to business
and operational alignment initiatives,
increased competition, doctor vacancies
and the sale of several non-core assets
Focused on doctor recruitment and new
insurance mix and tariff strategy
Encouraging patient activity since opening
the new Mediclinic City Hospital North Wing
and Mediclinic Al Jowhara Hospital
Mediclinic Parkview Hospital project
progressing in Dubai
INPATIENT VOLUMES IN ABU DHABI
OPERATIONS OPERATIONAL OVERVIEW
HOSPITALS
6
BEDS
714
CLINICS
31
EMPLOYEES
6,375
OUTPATIENT VOLUMES* (‘000) IN ABU DHABI
FY16 FY17 Movement
Daman - Basic Plan 15,937 15,823 -1%
Daman - Enhanced 7,671 6,885 -10%
Daman - Thiqa 8,055 5,416 -33%
Others 8,184 6,940 -15%
Total 39,847 35,064 -12%
’000s FY16 FY17 Movement
Daman - Basic Plan 841 772 -8%
Daman - Enhanced 425 356 -16%
Daman - Thiqa 519 360 -31%
Others 568 488 -14%
Total 2,353 1,976 -16%
22
*Outpatient volumes by insurance mix show paid attendances, excluding follow up
visits. Abu Dhabi outpatient attendance including follow up visits declined by 14%.

2017 FULL YEAR RESULTS PRESENTATION
SPIRE HEALTHCARE GROUP PLC
UNITED KINGDOM
23
• Mediclinic’s 29.9% investment in Spire
remained stable and gives the Group
exposure to UK private healthcare market
• Full Year 2016 performance was in line with
expectations, after adjusting for St Anthony’s
• Strong growth in Self-pay and NHS business;
increased market share in the PMI sector
• Investment continued at the new Spire
Manchester and Spire Nottingham hospitals
• Management expects growth in all payor
groups (including the PMI business) over the
medium to long term as a result of an under
funded NHS plus favourable healthcare
demographics
• Spire is ideally positioned to be a leading
player in the independent hospital sector
given its scale, reach and quality of care
STRATEGY
DANIE MEINTJES
CEO MEDICLINIC INTERNATIONAL

2017 FULL YEAR RESULTS PRESENTATION
MEDICLINIC INTERNATIONAL
EVOLVING HEALTHCARE INDUSTRY
25
GLOBAL DEMAND FOR HIGH-
QUALITY HEALTHCARE SERVICES
REMAINS ROBUST
• Underpinned by an ageing population, growing
disease burden and new technology
Mediclinic focusses on high-quality care and optimal patient experience
• Increases the pressure on patients and funders LOWER ECONOMIC GROWTH
• Resulting in changing care delivery models and
greater regulatory oversight
INCREASED FOCUS ON
AFFORDABILITY OF DELIVERING
HEALTHCARE
• Impacts patient choice and service offerings GREATER COMPETITION
2017 FULL YEAR RESULTS PRESENTATION
81.80% 82.90%81.90% 82.10%
April - Sept 2016 October 2016 - March 2017
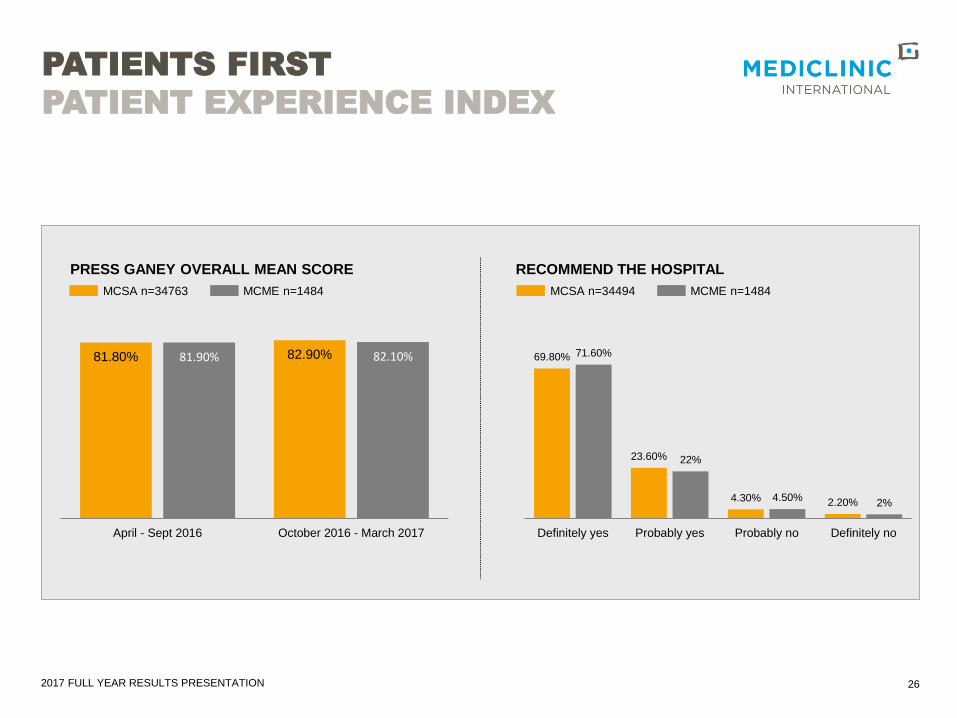
PATIENTS FIRST
PATIENT EXPERIENCE INDEX
PRESS GANEY OVERALL MEAN SCORE RECOMMEND THE HOSPITAL
MCSA n=34763 MCME n=1484
26
69.80%
23.60%
4.30% 2.20%
71.60%
22%
4.50%2%
Definitely yes Probably yes Probably no Definitely no
MCSA n=34494 MCME n=1484
2017 FULL YEAR RESULTS PRESENTATION
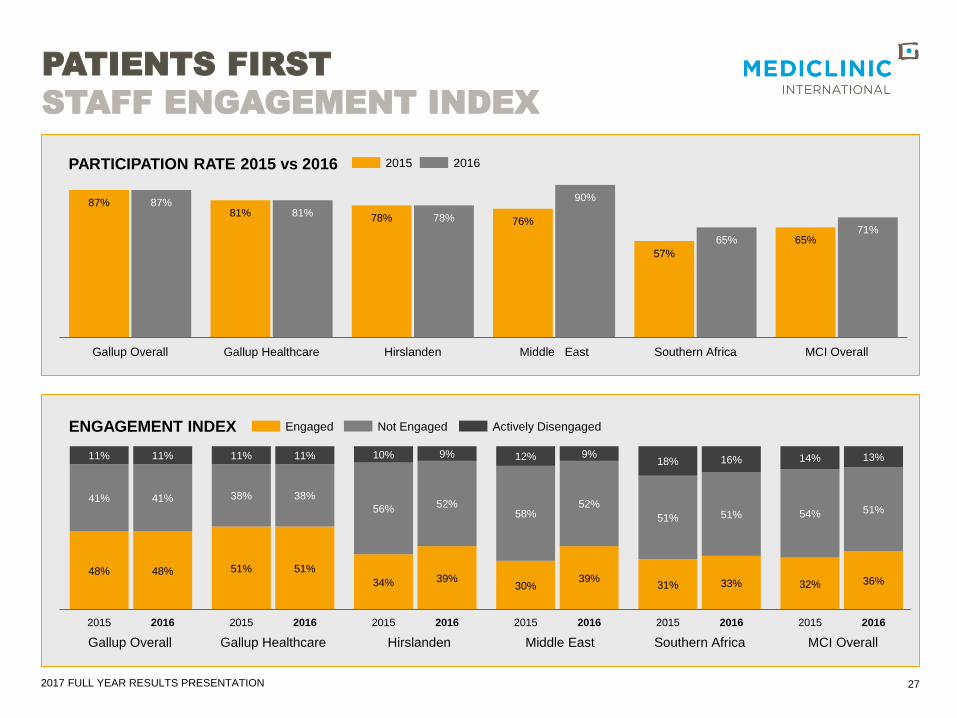
48% 51%
34% 30% 31% 32%
41% 38%
56% 58% 51% 54%
11% 11% 10% 12% 18% 14%
2015 2015 2015 2015 2015 2015
48% 51%39% 39% 33% 36%
41% 38%52% 52%
51% 51%
11% 11% 9% 9%16% 13%
2016 2016 2016 2016 2016 2016
PATIENTS FIRST
STAFF ENGAGEMENT INDEX
87%81%
78% 76%
57%
65%
87%81%
78%
90%
65%71%
Gallup Overall Gallup Healthcare Hirslanden Middle East Southern Africa MCI Overall
27
PARTICIPATION RATE 2015 vs 2016 2015 2016
Engaged Not EngagedENGAGEMENT INDEX Actively Disengaged
Gallup Overall Gallup Healthcare Hirslanden Middle East Southern Africa MCI Overall
2017 FULL YEAR RESULTS PRESENTATION
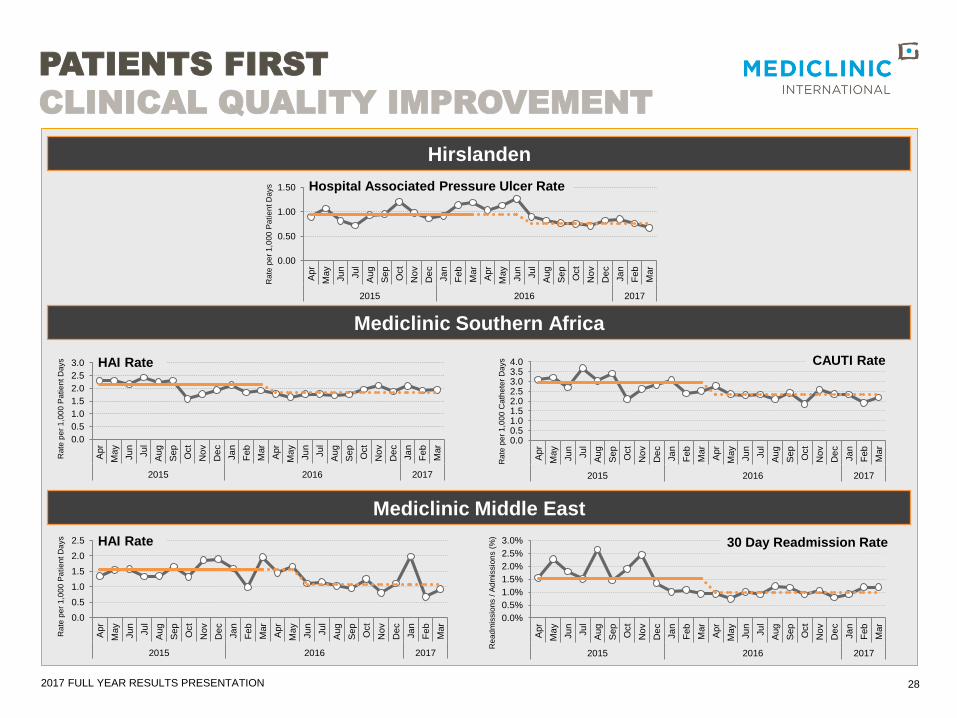
PATIENTS FIRST
CLINICAL QUALITY IMPROVEMENT
28
Mediclinic Southern Africa
Mediclinic Middle East
Hirslanden
0.00
0.50
1.00
1.50
Apr
May
Ju
n
Ju
l
Aug
Sep
Oct
No
v
De
c
Ja
n
Feb
Mar
Apr
May
Ju
n
Ju
l
Aug
Sep
Oct
No
v
De
c
Ja
n
Feb
Mar
2015 2016 2017
0.0
0.5
1.0
1.5
2.0
2.5
3.0
Apr
May
Ju
n
Ju
l
Aug
Sep
Oct
No
v
De
c
Ja
n
Feb
Mar
Apr
May
Ju
n
Ju
l
Aug
Sep
Oct
No
v
De
c
Ja
n
Feb
Mar
2015 2016 2017
0.00.51.01.52.02.53.03.54.0
Apr
May
Ju
n
Ju
l
Aug
Sep
Oct
No
v
De
c
Ja
n
Feb
Mar
Apr
May
Ju
n
Ju
l
Aug
Sep
Oct
No
v
De
c
Ja
n
Feb
Mar
2015 2016 2017
0.0
0.5
1.0
1.5
2.0
2.5
Apr
May
Ju
n
Ju
l
Aug
Sep
Oct
No
v
De
c
Ja
n
Feb
Mar
Apr
May
Ju
n
Ju
l
Aug
Sep
Oct
No
v
De
c
Ja
n
Feb
Mar
2015 2016 2017
HAI Rate CAUTI Rate
Hospital Associated Pressure Ulcer Rate
0.0%
0.5%
1.0%
1.5%
2.0%
2.5%
3.0%A
pr
May
Ju
n
Ju
l
Aug
Sep
Oct
No
v
De
c
Ja
n
Feb
Mar
Apr
May
Ju
n
Ju
l
Aug
Sep
Oct
No
v
De
c
Ja
n
Feb
Mar
2015 2016 2017
30 Day Readmission Rate
Rea
dm
issio
ns /
Ad
mis
sio
ns (
%)
Rate
pe
r 1
,00
0 C
ath
ete
r D
ays
Rate
pe
r 1
,00
0 P
atie
nt D
ays
Rate
pe
r 1
,00
0 P
atie
nt D
ays
Rate
pe
r 1
,00
0 P
atie
nt D
ays
HAI Rate

2017 FULL YEAR RESULTS PRESENTATION
MEDICLINIC INTERNATIONAL
STRATEGY
29
29
CONTINUING TO GROW
IMPROVING EFFICIENCIES
PUTTING
“PATIENTS FIRST”
• Increased capacity at existing infrastructure
• Acquisitive or organic growth in existing platforms
• Further international acquisitions
• Superior clinical performance in a safe clinical environment
• Improved patient experience
• Integrated and coordinated care
29INVESTING IN EMPLOYEES
• Identifying, attract and retain leading specialists and talented
healthcare professionals
• Improve employee engagement
• Improved operational effectiveness
- Leverage combined international capacity through collaboration and
shared resources
- Pursue initiatives in operating platforms to improve operational efficiency
• Leveraged international group benefits
- Use central resources to achieve Group wide procurement efficiencies
Create long-term shareholder value

QUESTIONS
AND ANSWERS
James Arnold
Head of Investor Relations
MEDICLINIC INTERNATIONAL PLC
14 Curzon Street
London
W1J 5HN
United Kingdom
Tel: +44 (0) 20 3786 8181
www.mediclinic.com

APPENDIX
2017 FULL YEAR RESULTS PRESENTATION
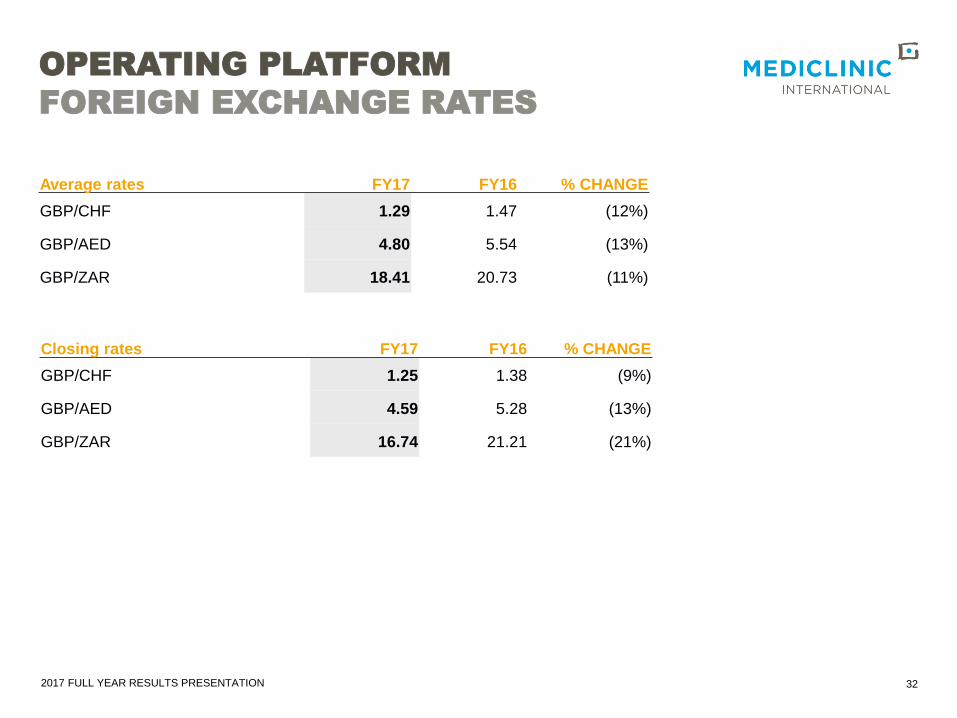
OPERATING PLATFORM
FOREIGN EXCHANGE RATES
32
Average rates FY17 FY16 % CHANGE
GBP/CHF 1.29 1.47 (12%)
GBP/AED 4.80 5.54 (13%)
GBP/ZAR 18.41 20.73 (11%)
Closing rates FY17 FY16 % CHANGE
GBP/CHF 1.25 1.38 (9%)
GBP/AED 4.59 5.28 (13%)
GBP/ZAR 16.74 21.21 (21%)
2017 FULL YEAR RESULTS PRESENTATION
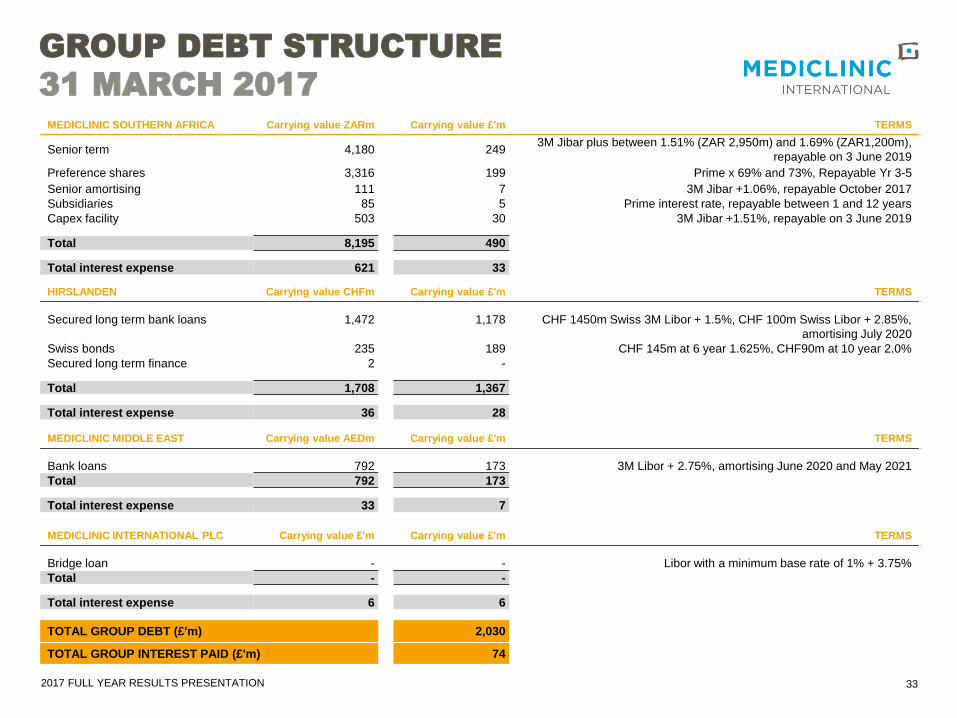
GROUP DEBT STRUCTURE
31 MARCH 2017
MEDICLINIC SOUTHERN AFRICA Carrying value ZARm Carrying value £'m TERMS
Senior term 4,180 249 3M Jibar plus between 1.51% (ZAR 2,950m) and 1.69% (ZAR1,200m),
repayable on 3 June 2019
Preference shares 3,316 199 Prime x 69% and 73%, Repayable Yr 3-5
Senior amortising 111 7 3M Jibar +1.06%, repayable October 2017
Subsidiaries 85 5 Prime interest rate, repayable between 1 and 12 years
Capex facility 503 30 3M Jibar +1.51%, repayable on 3 June 2019
Total 8,195 490
Total interest expense 621 33
HIRSLANDEN Carrying value CHFm Carrying value £'m TERMS
Secured long term bank loans 1,472 1,178 CHF 1450m Swiss 3M Libor + 1.5%, CHF 100m Swiss Libor + 2.85%,
amortising July 2020
Swiss bonds 235 189 CHF 145m at 6 year 1.625%, CHF90m at 10 year 2.0%
Secured long term finance 2 -
Total 1,708 1,367
Total interest expense 36 28
MEDICLINIC MIDDLE EAST Carrying value AEDm Carrying value £'m TERMS
Bank loans 792 173 3M Libor + 2.75%, amortising June 2020 and May 2021
Total 792 173
Total interest expense 33 7
MEDICLINIC INTERNATIONAL PLC Carrying value £'m Carrying value £'m TERMS
Bridge loan - - Libor with a minimum base rate of 1% + 3.75%
Total - -
Total interest expense 6 6
TOTAL GROUP DEBT (£'m) 2,030
TOTAL GROUP INTEREST PAID (£'m) 74
33

2017 FULL YEAR RESULTS PRESENTATION
GROUP
CAPITAL EXPENDITURE
34
FY17 Actual capex (£’m) Hirslanden Southern Africa Middle East Total
To maintain operations 69 28 12 109
To expand operations 57 43 40 140
Total capital expenditure 126 71 52 249
FY18 Budgeted capex (£’m)* Hirslanden Southern Africa Middle East Total
To maintain operations 65 19 16 100
To expand operations 53 52 76 181
Total capital expenditure 118 71 92 281
• Hirslanden: Hirslanden 2020 and HQ relocation. Expansion includes acquisition of building in Bern
• MCSA: Maintaining 52 hospitals. Expansion increased beds by 78 during the year
• MCME: Mediclinic City Hospital North Wing and Parkview Hospitals
• Hirslanden: Ongoing investment projects
• MCSA: Gradual expansion programme continues; excludes Klerksdorp investment awaiting CC approval
• MCME: Mediclinic Parkview Hospital and other expansion
*Constant currency basis: GBP/CHF: 1.29, GBP/ZAR: 4.80, GBP/AED: 18.41

2017 FULL YEAR RESULTS PRESENTATION
2.1%
5.6%
8.4%
3.4%
-0.7%2.5%
4.4%1.2%
1.9%
3.0%
-1%
1%
3%
5%
7%
9%
FY13 FY14 FY15 FY16 FY17
Bed Days Sold Revenue Per Bed Day
35
HIRSLANDEN
FIVE YEAR PERFORMANCE
1,330 1,436
1,563 1,647 1,704
286 298 303325 340
21.5%
20.8%
19.4%19.7%
20.0%
18%
19%
20%
21%
22%
0
200
400
600
800
1,000
1,200
1,400
1,600
1,800
FY13 FY14 FY15 FY16 FY17
Revenue Underlying EBITDA EBITDA margin %
CH
F’m
Un
de
rlyin
g E
BIT
DA
ma
rgin
%
6.4%
4.4%
FINANCIAL PERFORMANCE CAGR
FY13-FY17:
Mo
ve
me
nts
OPERATIONAL PERFORMANCE
39.6%41.4%
42.7% 43.5%44.8%
34.0% 33.0% 32.3% 31.9% 31.2%
26.4%25.6% 25.0% 24.6% 24.0%
20%
25%
30%
35%
40%
45%
FY13 FY14 FY15 FY16 FY17
Basic Semiprivate Private
PATIENT MIX

2017 FULL YEAR RESULTS PRESENTATION
CAPITAL PROJECTS
HIRSLANDEN
36
Hospital Project Completion
Clinique Cecil Hybrid operating theatre 1H17
Clinique La Colline Doctor’s consulting rooms 1H17
Klinik Stephanshorn Restructuring of radiology 1H17
Klinik Aarau Third cardiac catheterisation laboratory 1H17
Klinik Permanence Restructuring of sterilisation unit 2H17
Klinik St. Anna Modular operating theatres 2H17
Klinik Stephanshorn Modular operating theatres 2H17
Klinik Hirslanden Restructuring of emergency department 2H17
Hospital Project
Expected
Completion
Klinik St. Anna MRI 3 Tesla 1H18
Klinik Stephanshorn Restructuring of entrance 1H18
Klinik Birshof O-arm® Surgical Imaging system 1H18
Klinik St. Anna O-arm® Surgical Imaging system 1H18
Klinik Stephanshorn Operating roboter DaVinci 1H18
Klinik Im Park Outpatient surgery unit “Bellaria” 1H18
Klinik Hirslanden Capacity expansion; MRI, gastroenterology & stroke unit FY18
AndreasKlinik (Cham) Medical centre/physicians house FY18
Klinik Permanence Radiology institute “Cosmos” FY18
Klinik Birshof Medical centre/physicians house FY19
Clinique La Colline Sport medicine centre FY19
Klinik Stephanshorn (Schuppis) Medical centre FY19
Klinik Hirslanden (Seefeldstrasse) Medical centre FY19
CAPITAL PROJECTS DURING 2017
FUTURE PROJECTS
2017 FULL YEAR RESULTS PRESENTATION
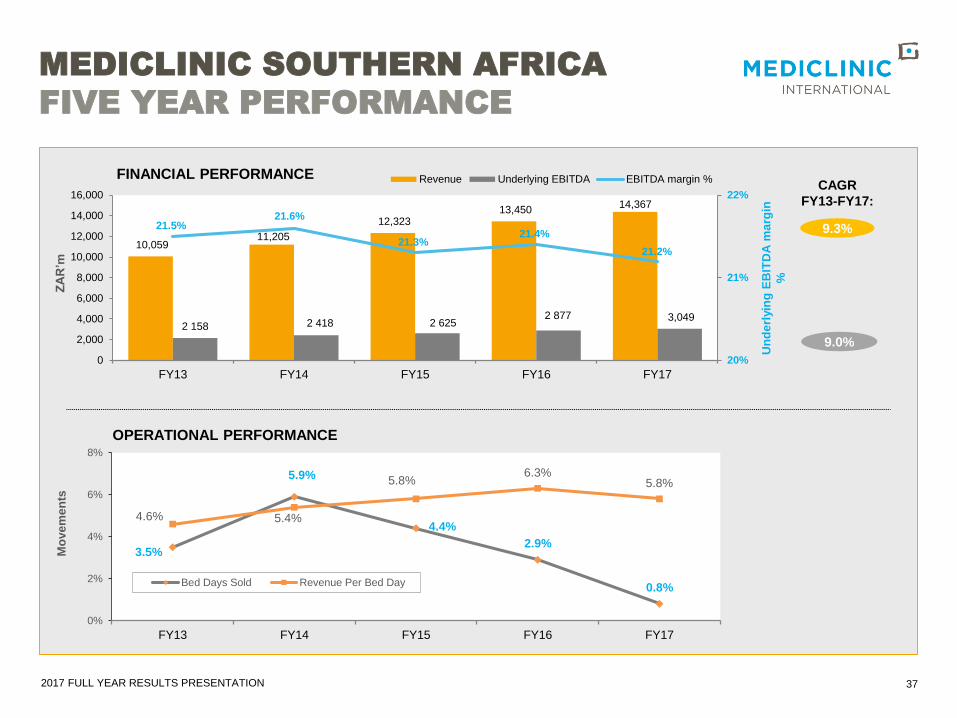
3.5%
5.9%
4.4%
2.9%
0.8%
4.6% 5.4%
5.8%6.3%
5.8%
0%
2%
4%
6%
8%
FY13 FY14 FY15 FY16 FY17
Bed Days Sold Revenue Per Bed Day
37
MEDICLINIC SOUTHERN AFRICA
FIVE YEAR PERFORMANCE
10,059 11,205
12,323 13,450
14,367
2 158 2 418 2 6252 877 3,049
21.5%21.6%
21.3%21.4%
21.2%
20%
21%
22%
0
2,000
4,000
6,000
8,000
10,000
12,000
14,000
16,000
FY13 FY14 FY15 FY16 FY17
Revenue Underlying EBITDA EBITDA margin %
ZA
R’m
Un
de
rlyin
g E
BIT
DA
ma
rgin
%
9.3%
9.0%
FINANCIAL PERFORMANCECAGR
FY13-FY17:
Mo
ve
me
nts
OPERATIONAL PERFORMANCE

2017 FULL YEAR RESULTS PRESENTATION 38
CAPITAL PROJECTS
SOUTHERN AFRICA
Hospital Completion Beds
Growth into existing license
Mediclinic Upington 1H17 26
Mediclinic Emfuleni 2H17 17
Mediclinic Worcester 2H17 20
Mediclinic Bloemfontein 2H17 4
Mediclinic Windhoek 2H17 11
Total licenced beds Year end 2017 8,095
Hospital Expected Completion Beds
Existing licenses
Mediclinic Bloemfontein 1H18 12
Mediclinic Thabazimbi 2H18 12
Mediclinic Newcastle 2H18 30
Mediclinic Midstream 1H19 11
Mediclinic Legae 2H19 23
Mediclinic Vergelegen 2H19 28
Mediclinic Cape Gate 1H20 13
Mediclinic Potchefstroom 1H20 70
Mediclinic Stellenbosch 1H20 70
Mediclinic Medforum 2H20 81
Day clinicsMediclinic Nelspruit Day Clinic 1H20 16
Mediclinic Bloemfontein Day Clinic 2H20 22
Mediclinic Cape Gate Day Clinic 2H20 16
Additional/new facilities
Klerksdorp Awaiting CC approval 256
Life Path Health Completing DD – then requires CC approval 308
*Subject to DOH Approval
CAPITAL PROJECTS DURING 2017
FUTURE PROJECTS*
2017 FULL YEAR RESULTS PRESENTATION 39
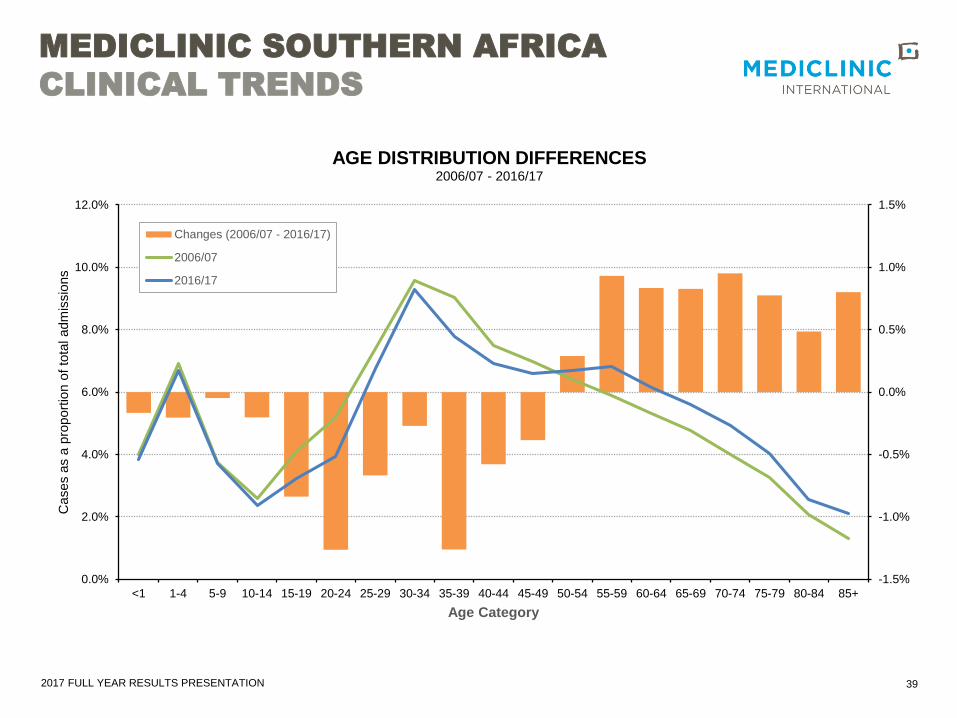
MEDICLINIC SOUTHERN AFRICA
CLINICAL TRENDS
-1.5%
-1.0%
-0.5%
0.0%
0.5%
1.0%
1.5%
0.0%
2.0%
4.0%
6.0%
8.0%
10.0%
12.0%
<1 1-4 5-9 10-14 15-19 20-24 25-29 30-34 35-39 40-44 45-49 50-54 55-59 60-64 65-69 70-74 75-79 80-84 85+
Cases a
s a
pro
port
ion o
f to
tal adm
issio
ns
Age Category
AGE DISTRIBUTION DIFFERENCES2006/07 - 2016/17
Changes (2006/07 - 2016/17)
2006/07
2016/17

2017 FULL YEAR RESULTS PRESENTATION 40
MEDICLINIC SOUTHERN AFRICA
CLINICAL TRENDS
6.4%
11.1%
14.4%
15.9%16.8%
16.2%
14.8%15.5%
17.1%
19.0%
24.2%
29.6% 29.7% 29.9%30.6% 30.8%
32.6%
0.0%
5.0%
10.0%
15.0%
20.0%
25.0%
30.0%
35.0%
2000/01 2001/02 2002/03 2003/04 2004/05 2005/06 2006/07 2007/08 2008/09 2009/10 2010/11 2011/12 2012/13 2013/14 2014/15 2015/16 2016/17
Pro
port
ion o
f C
ases w
ith a
Chro
nic
Dis
ease C
ode
Financial Year
CHRONIC DISEASE CODED
Note: Pre 2011/12 data not
comparable with subsequent years
2017 FULL YEAR RESULTS PRESENTATION 41
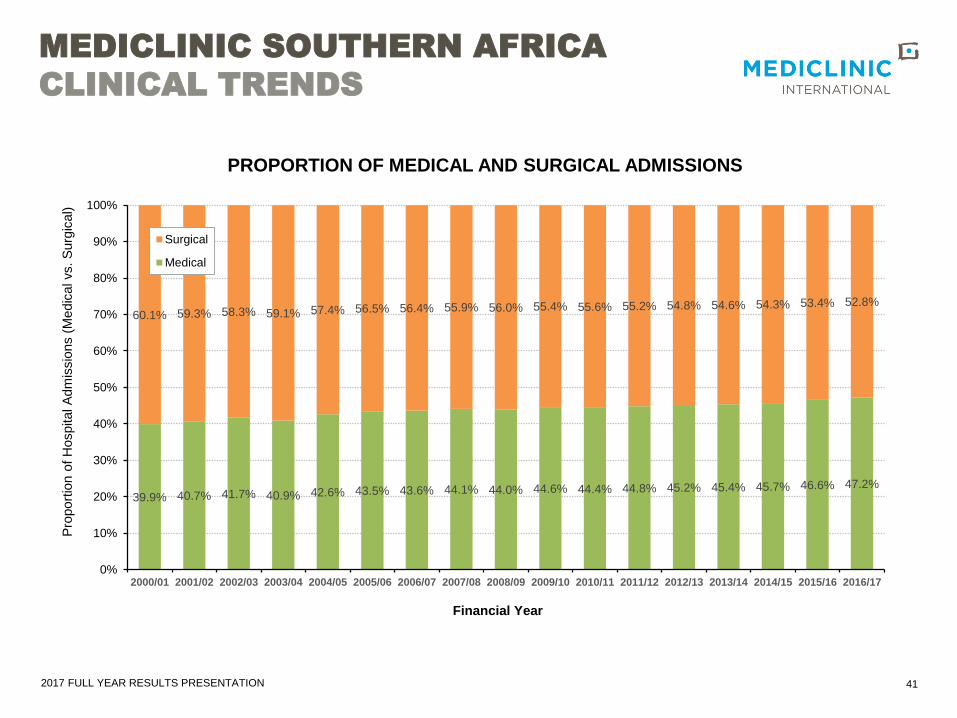
MEDICLINIC SOUTHERN AFRICA
CLINICAL TRENDS
39.9% 40.7% 41.7% 40.9% 42.6% 43.5% 43.6% 44.1% 44.0% 44.6% 44.4% 44.8% 45.2% 45.4% 45.7% 46.6% 47.2%
60.1% 59.3% 58.3% 59.1% 57.4% 56.5% 56.4% 55.9% 56.0% 55.4% 55.6% 55.2% 54.8% 54.6% 54.3% 53.4% 52.8%
0%
10%
20%
30%
40%
50%
60%
70%
80%
90%
100%
2000/01 2001/02 2002/03 2003/04 2004/05 2005/06 2006/07 2007/08 2008/09 2009/10 2010/11 2011/12 2012/13 2013/14 2014/15 2015/16 2016/17
Pro
port
ion o
f H
ospital A
dm
issio
ns (
Medic
al vs. S
urg
ical)
Financial Year
PROPORTION OF MEDICAL AND SURGICAL ADMISSIONS
Surgical
Medical

2017 FULL YEAR RESULTS PRESENTATION 42
68.9% 67.9% 69.1% 70.0% 70.9% 71.0% 70.8% 71.2% 71.6% 71.7% 71.8% 72.5% 73.1% 73.7% 74.2% 75.0% 75.5%
31.1% 32.1% 30.9% 30.0% 29.1% 29.0% 29.2% 28.8% 28.4% 28.3% 28.2% 27.5% 26.9% 26.3% 25.8% 25.0% 24.5%
0%
10%
20%
30%
40%
50%
60%
70%
80%
90%
100%
2000/01 2001/02 2002/03 2003/04 2004/05 2005/06 2006/07 2007/08 2008/09 2009/10 2010/11 2011/12 2012/13 2013/14 2014/15 2015/16 2016/17
Pro
po
rtio
n o
f H
osp
ita
l A
dm
issio
ns (
Day C
ase
s v
s.
Inp
atie
nts
)
Financial Year
PROPORTION OF DAY CASES AND INPATIENT ADMISSIONS
Daycase
Inpatient
MEDICLINIC SOUTHERN AFRICA
CLINICAL TRENDS
2017 FULL YEAR RESULTS PRESENTATION
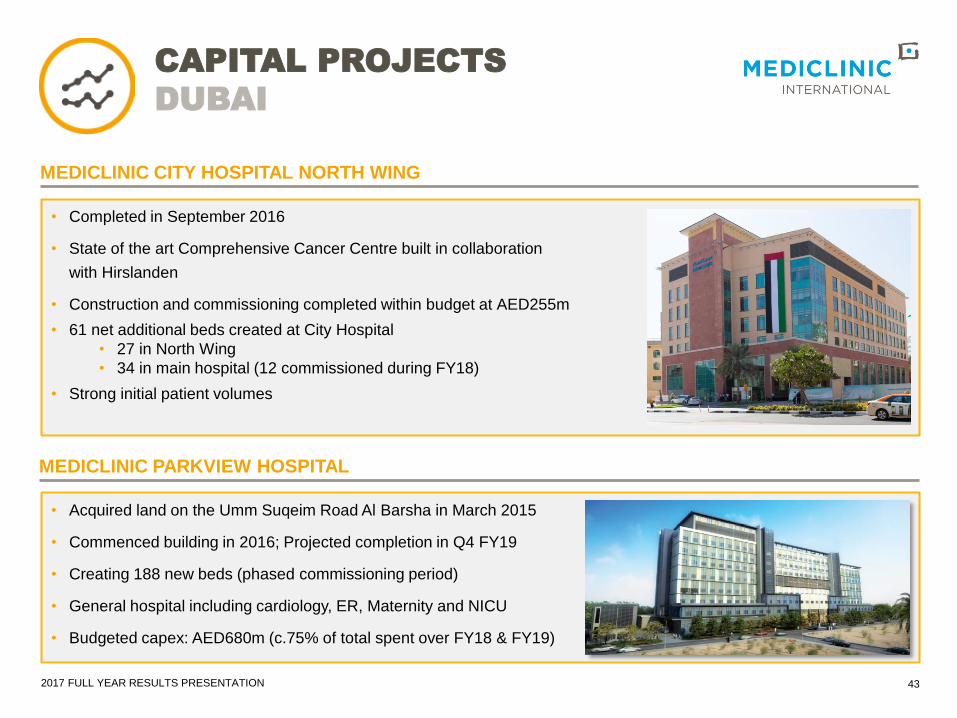
• Acquired land on the Umm Suqeim Road Al Barsha in March 2015
• Commenced building in 2016; Projected completion in Q4 FY19
• Creating 188 new beds (phased commissioning period)
• General hospital including cardiology, ER, Maternity and NICU
• Budgeted capex: AED680m (c.75% of total spent over FY18 & FY19)
ARTIST’S IMPRESSION CURRENT PROGRESS• Completed in September 2016
• State of the art Comprehensive Cancer Centre built in collaboration
with Hirslanden
• Construction and commissioning completed within budget at AED255m
• 61 net additional beds created at City Hospital
• 27 in North Wing
• 34 in main hospital (12 commissioned during FY18)
• Strong initial patient volumes
MEDICLINIC CITY HOSPITAL NORTH WING
MEDICLINIC PARKVIEW HOSPITAL
43
CAPITAL PROJECTS
DUBAI

2017 FULL YEAR RESULTS PRESENTATION
• Campus expansion
• Comprehensive Cancer Centre
• Completion expected Q4 FY19
MEDICLINIC AIRPORT ROAD HOSPITAL
MEDICLINIC AL NOOR HOSPITAL (KHALIFA STREET)
• Currently reviewing all expansion and upgrade plans for the hospital
• Finalise plans during 1H FY18
44
• 51 bed hospital (43 beds opened FY17)
• General hospital with a focus on maternity
• Opened Q3 FY17
• Well located to serve Thiqa patients
MEDICLINIC AL JOWHARA HOSPITAL
• Al Yaher Clinic:
Opened in Q2 FY17
• Ghayathi Clinic:
Opened in Q3 FY17
• Aspetar Clinic:
Opened in Q3 FY17
• Khalifa City A Clinic:
Recently opened in Q1 FY18
EXPANDING MEDICAL NETWORKS
CAPITAL PROJECTS
ABU DHABI