Full Year Results Presentation
31
Full Year Results Presentation Year Ended 31 December 2018 7 MARCH 2019 ASX:WND
Transcript of Full Year Results Presentation
Full Year Results PresentationYear Ended 31 December 2018
7 MARCH 2019
ASX:WND

WINDLAB LIMITED 2
Summary Information
This Presentation contains a summary of information about Windlab Limited ACN 104 461 958 (Windlab), its subsidiaries, and its activities which are current as at the date of this Presentation.
No representation or warranty, express or implied, is provided in relation to the accuracy, reliability or completeness of any statements, estimates or opinions, conclusions or other information provided in this Presentation. Statements in this Presentation are made only as of the date of this Presentation unless otherwise stated and the information in this Presentation remains subject to change without notice. Subject to its obligations under applicable law, Windlab is not responsible for updating, nor undertakes to update, this Presentation.
Not an Offer
The information contained in this Presentation has been prepared solely for informational purposes. This Presentation does not constitute an offer to sell, or the solicitation of an offer to buy, any securities in Windlab.
Forward looking statements
This Presentation may contain forward looking statements including statements regarding Windlab’s intent, belief or current expectations with respect to its businesses and operations, market conditions, results of operation and financial condition, capital adequacy, specific provisions and risk management practices. Windlab has no obligation to publicly release the result of any revisions to these forward looking statements to reflect events or circumstances or the occurrence of unanticipated events.
Disclaimer
No representation or warranty is or will be made by any person (including Windlab and its related bodies corporate and affiliates and their officers, employees, associates, advisers and agents) in relation to the accuracy or completeness of all or part of this document, or any constituent or associated Presentation, information or material.
Disclaimer

WINDLAB LIMITED 3
Australian based, ASX listed, international renewable energy development company
WindScapeTM provides distinct, technology based competitive advantage
Operate across the whole wind farm development value chain
Track record of project success and strong growth
Growing portfolio of operating interests and asset management revenues
About Windlab
Completed19 projects1093 MW
Total development
pipeline
50 projects>7,500 MW
Near term development
pipeline(permitted)
12 projects~1,500 MW
Capacity under management 350 MW
Note 1: Includes projects which have reached financial close and are either under construction or operating.
Global Offices
Brisbane
Nairobi

WINDLAB LIMITED 4
What we do
Apply science to develop, construct and operate better wind farms internationally
WIND FARM PROJECT LIFECYCLE
~3 – 7 Years ~1 – 2 Years 25+ Years
Costs: ~A$2 – 5Million/project ~A$2M/MW
WIND FARM VALUE CREATION
Development Returns Infrastructure Returns
5 to 10X IRRs 8% to 15%

1. Development Portfolio
55WINDLAB LIMITED

WINDLAB LIMITED 6
Maturing the Portfolio
The actual capacity in each stage is subject to the development process, project refinement, optimization and market dynamics
1. Capacity under Asset Management Contracts
Capacity in MWs
Australia 2338 1200 332 62 3501
North America 330 80 262
South Africa 100 551 40 642
Sub-Saharan Africa
1090 360 300
1160 3579 1320 1536
➢ 700 MW of new capacity in 2018
➢ Over 1,100MW new capacity in Australia since IPO
➢ Further 540MW received DA/Permit in 2018
➢ Moving towards at least 2 approved projects in all major markets.
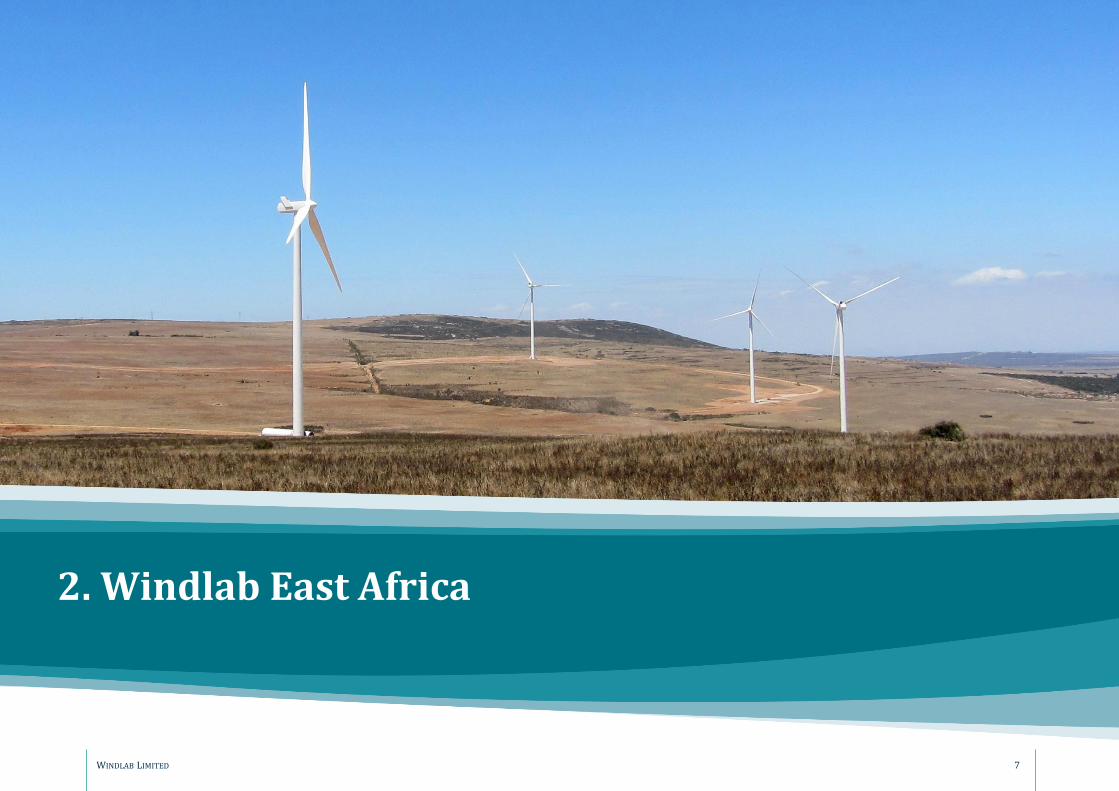
2. Windlab East Africa
77WINDLAB LIMITED
WINDLAB LIMITED 8
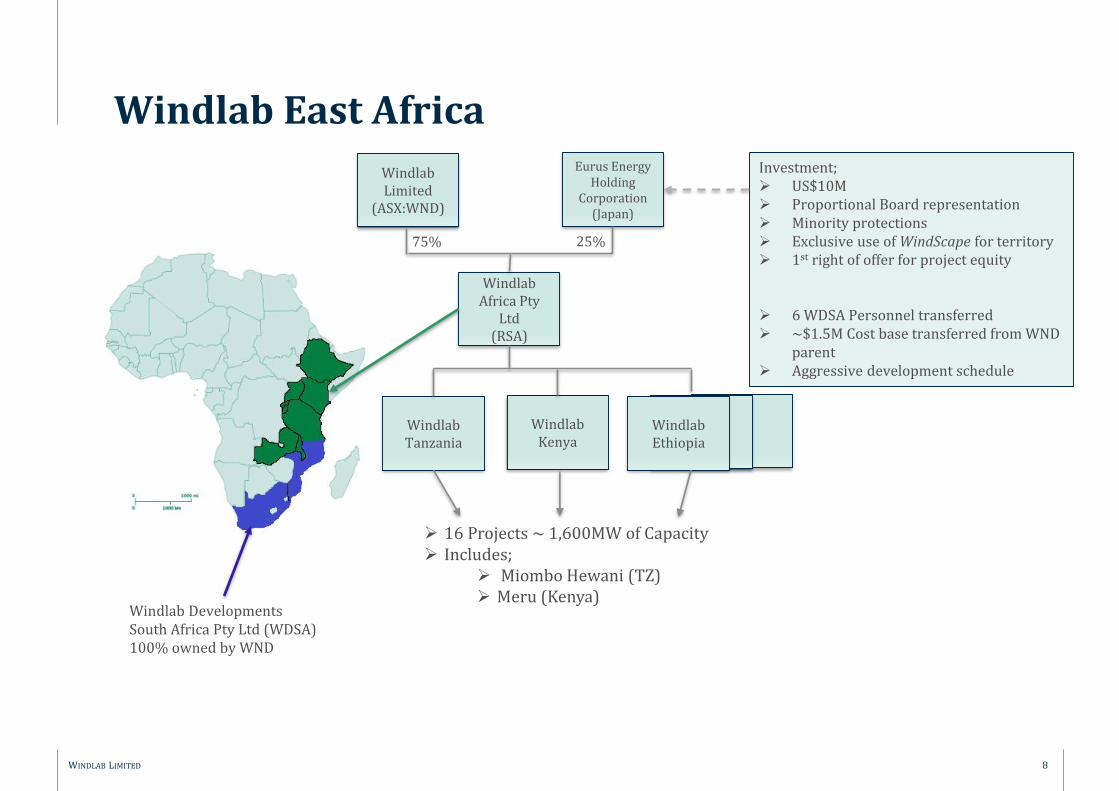
Windlab East Africa
Windlab Developments South Africa Pty Ltd (WDSA)100% owned by WND
Windlab Africa Pty
Ltd(RSA)
Windlab Tanzania
Windlab Kenya
Windlab Ethiopia
Windlab Limited
(ASX:WND)
Eurus Energy Holding
Corporation (Japan)
25%75%
Investment;➢ US$10M➢ Proportional Board representation➢ Minority protections➢ Exclusive use of WindScape for territory➢ 1st right of offer for project equity
➢ 6 WDSA Personnel transferred ➢ ~$1.5M Cost base transferred from WND
parent➢ Aggressive development schedule
➢ 16 Projects ~ 1,600MW of Capacity➢ Includes;
➢ Miombo Hewani (TZ)➢ Meru (Kenya)

3. Key Projects
99WINDLAB LIMITED

WINDLAB LIMITED 10
Developments
▪ Wind Turbines, Solar and infrastructure complete in 2018.
▪ Grid connection completion underway; Testing and commissioning remains, with energisation scheduled for April 2019.
▪ Impact of project delays mitigated by EPC contract.
▪ Frustrating delays in the equity process in late 2018 have driven the project into new connection rules in 2019.
▪ Significant addition grid complexity and cost. (market wide implications)
▪ Opportunity to re-tender major equipment and equity, taking advantage of larger and more efficient new wind turbines.
▪ Financial close 2019.
▪ Sold to Swift Current August 2018.
▪ Disclosed in the P&L as a single line “Loss on loss of control” – effectively ~$300k of revenue offset by $4.1m in inventory costs. No further costs will be recognised against the financial close success fee of US$4m expected in mid 2019.

WINDLAB LIMITED 11
Developments
Windlab East Africa
▪ Miombo Hewani, approved during 2018; 300MW
▪ First 100MW stage shortlisted for a Tanesco PPA in early 2019.
▪ Meru in Kenya is continent’s first Wind/Solar hybrid project
Queensland Portfolio
▪ Lack of direction by the Qld government in relation to the Clean Energy Hub required WND to undertake its own grid analysis for North Qld. This concluded that Big Kennedy is most optimal with either the Clean Energy Hub or Copperstring 2. Timing uncertain.
▪ Re-prioritization of the Queensland portfolio to accelerate a site located directly on the main transmission line. Much lower cost to connection; will be more cost competitive and a quicker path to market.
▪ Big K DA submission ongoing, submission this year. Copperstring 2 received $5m in federal grant to advance its feasibility work in December. Strongly supported by Mt Isa miners and the big picture view that large scale wind is essential to the future Qld energy mix.

4. Recurring Revenue
1212WINDLAB LIMITED

WINDLAB LIMITED 13
Recurring Revenue Grew 65%
$0
$1,000
$2,000
$3,000
$4,000
$5,000
$6,000
2014 2015 2016 2017 2018
Asset Management Fees Equity Accounted Share of Profits From Associates Royalties
A$
'00
0

WINDLAB LIMITED 14
Operating Portfolio Growth
Operating Projects
Notes: 1. Assumes 20% carried interest retained in Lakeland in 2019. 2. Windlab has a royalty interest in West Coast 1 Wind Farm, approximating the equivalent of 4MW of operating capacity
1
0
10
20
30
40
50
60
70
2015 2016 2017 2018 2019
Windlab Generating Capacity
Owned Operating
West Coast 12

WINDLAB LIMITED 15
Asset Management Growth
Notes: 1. Capacity included from start of contract2. Lakeland 100MW assumed in 2019
0
50
100
150
200
250
300
350
400
450
500
2015 2016 2017 2018 2019
Capacity Under Management
MW Under Management

WINDLAB LIMITED 16
Growing Recurring Revenue
1. Revenues reflect estimated annualised amounts, which may not coincide with financial periods
2. Asset management fees often commence 12 to 24 months before operating project distributions
3. Operating projects are equity accounted; Share of net profit shows on WND P&L; Distributions shown on Cash Flow Statement. Amounts shown estimates only, not forecasts
4. Assumes successful completion of Kennedy Energy Park and financial close of Lakeland only.
$0
$2
$4
$6
$8
$10
$12
$14
2017 2018 2019 2020
A$
'M
Forward Looking Annualised Recurring Revenue
Existing AM Lakeland AM WC Royalty CBWF Div KIATA Div KEP Div Lakeland Div
5. Financials
1717WINDLAB LIMITED

WINDLAB LIMITED 18
Statutory P&L
2018 2017 Variance
$ $ $
Revenue from contracts with customers 3,488,576 23,136,394 -19,647,818
Other income 513,785 1,079,615 -565,830
Share of profit from associate and joint venture 1,915,807 299,370 +1,616,437
Project expenses (784,254) (906,009) -121,755
Loss on loss of control of subsidiary (3,837,533) - +3,837,533
Employee expenses (5,465,906) (5,208,059) +257,847
Administration expenses (2,505,421) (2,876,359) -370,938
EBITDA (6,674,946) 15,524,952 -22,199,898
Depreciation and amortisation expenses (136,445) (148,645) -12,200
Finance costs (55,013) (959,300) -904,287
(Loss)/profit before tax (6,866,404) 14,417,007 -21,283,411
Tax benefit/(expense) 3,038,426 (4,912,534) +7,950,960
(Loss)/profit after tax (3,827,978) 9,504,473 -13,332,451

WINDLAB LIMITED 19
Balance Sheet 31 December 20182018
$CURRENT ASSETSCash and cash equivalents 4,682,414Trade and other receivables 1,475,307Inventory (Development Projects) 5,022,779Prepayments 736,251TOTAL CURRENT ASSETS 11,916,751
NON-CURRENT ASSETSProperty, plant and equipment 592,192Investments accounted for using the equity method 43,297,177Investments at fair value 522,372Inventory (Development Projects) 4,665,931Prepayments 143,049TOTAL NON-CURRENT ASSETS 49,220,721TOTAL ASSETS 61,137,472
CURRENT LIABILITIESTrade and other payables 2,415,632Interest bearing liabilities 607Income tax payable 577,349Contract liabilities -Employee benefit liabilities 822,794TOTAL CURRENT LIABILITIES 3,816,382
NON-CURRENT LIABILITIESInterest bearing liabilities 3,030,689Deferred tax liability 3,735,441Employee benefit liabilities 172,618TOTAL NON-CURRENT LIABILITIES 6,938,748TOTAL LIABILITIES 10,755,130
NET ASSETS 50,382,342

WINDLAB LIMITED 20
Cashflow
• 31 December Cash Balance $4.6m
• Sufficient for current needs, assuming Lakeland and/or Greenwich closes as expected.
• Cash run rate without any development within the range of discretionary development spending.
• To manage timing risk, management is seeking to expanding working capital facility to $10m.

WINDLAB LIMITED 21
Cashflow
Control of discretionary development costs if required.

6. Outlook
2222WINDLAB LIMITED

WINDLAB LIMITED 23
Strong Market Despite Policy Uncertainty
▪ Significant renewable capacity under construction – end of RET boom.
▪ Strong wholesale electricity prices supporting new investment in wind, not solar.
▪ Developing Corporate PPA Market
▪ Significant long term demand and opportunity for new high hub height WTGs
▪ Grid access is key
Australia
State Based Targets Match WND Project Pipeline
▪ PTC wind down creating opportunity for traditional project finance deals post 2020
▪ Colorado state renewable standard underpins our existing US development projects
▪ New prospecting opportunities in specific (low wind penetration) states
North America
Fundamentals remain strong; Country risk varies
▪ New South African Integrated Resource Plan due soon – likely to trigger new auctions.
▪ Windlab has multiple projects approved and ready to respond to a revived REIPPPP
▪ Electricity demand remains strong and largely unmet throughout Sub-Saharan Africa
▪ Access to low cost, risk capital
Africa
Market Outlooks
BNEF NEO 2018
IEA 2018
Global

Contacts:Rob Fisher
Chief Financial and Operating Officer
0437799172
2424WINDLAB LIMITED
Roger Price
Executive Chairman
0411222044

Appendix: About Windlab
2525WINDLAB LIMITED

WINDLAB LIMITED 26
What we do
Apply science to develop, construct and operate better wind farms internationally
WIND FARM PROJECT LIFECYCLE
Prospecting
Prospecting
Prospecting
FINDING THE COONOOER BRIDGE WIND FARM. A DIAGRAMMATICAL REPRESENTATION OF WINDSCAPETM IN ACTION
3Kms Resolution 1Km Resolution Looking closer!
100metre Resolution Land use overlay Virtual Wind Farm

WINDLAB LIMITED 27
Revenue model
HOW DOES WINDLAB GENERATE REVENUE? DEVELOPMENT MARGIN EXTRACTION:
Development margins from the sale or part sale of projects at or near financial close
1
Success fees from previously sold or partnered projects. Success fees are typically received on completion of certain development milestones and / or when a project reaches financial close
2
Asset management fees for wind farm management of both Windlab developed and third party owned projects
3
Equity or other commercial interests in operating projects retained beyond financial close
4
Development margin
Target: $250,000 / MW, which typically
equates to 8% – 12% of total capex
Received through a combination of cash and
carried interests
Windfarm capex
Wind turbines, including the cost of transport
to the site
Civil works
Site preparation
Concrete foundations for wind turbines
On-site electrical works
Dev
elo
pm
ent
mar
gin
Win
d f
arm
cap
ex
NP
V o
f fu
ture
pro
ject
cash
flo
ws
at f
inan
cial
clo
se

WINDLAB LIMITED
Investment Thesis
Strong industry fundamentals
Management team with proven track record, extensive technical and commercial experience
WindScapeTM provides a distinct technological competitive advantage in wind farm site prospecting, design and optimisation resulting in less risk, higher certainty and repeatability
Extracting value from existing development pipeline
Diversified portfolio and project pipeline across multiple jurisdictions
History of strong profitability and growth, with earnings increasingly from recurring revenues (asset management and ownership / commercial interests in operating wind farms)
Large rapidly growing global market
28

WINDLAB LIMITED 29
Management team
ROGER PRICE
EXECUTIVE CHAIRMAN AND
CHIEF EXECUTIVE OFFICER
30 years’ of executive, technology, sales and extensive investment experience across
multiple industries internationally
Roger has been Chairman of Windlab since 2007, and CEO since 2011
Previously Chief Executive Officer of Reino International
Currently a director of Audinate Group Limited and a Partner and Director of
Innovation Capital
ROB FISHER
CHIEF OPERATING AND
FINANCIAL OFFICER
Rob has been Windlab’s CFO for the past five years, and now leads the finance,
technical, and asset management functions
Chartered Accountant with 15 years experience in senior finance roles with fast
growing companies in Australia and internationally including Project Financial
Controller with an ASX listed property developer
DR NATHAN STEGGEL
CO-FOUNDER AND TECHNICAL
DIRECTOR, BSC. MSC. PHD.
Nathan has over 15 years of wind industry experience
Previously post-doctoral fellow at leasing research institutes in the UK (EnFlo) and
Australia (CSIRO’s Wind Energy Research Unit). Nathan was the lead developer of
WindScape
DR KEITH AYOTTE
CO-FOUNDER AND CHIEF
SCIENTIST, BSC, MSC. PHD.
Over 30 years’ of experience in the fields of meteorology, wind flow in complex
terrain, and computational fluid dynamics
Previously employed at Environment Canada, NCAR and CSIRO, three of the world's
most prestigious institutes for atmospheric research
PETER VENN
MANAGING DIRECTOR,
AFRICA
Peter has 15 years’ of technology sales and commercial management experience
Prior to joining Windlab he was in charge of SAS Institute’s energy sector in the
Middle East, Africa & Asia Pacific

WINDLAB LIMITED 30
Board
ROGER PRICE
EXECUTIVE CHAIRMAN AND
CHIEF EXECUTIVE OFFICER
See previous page
JOSEPH O’BRIEN
INDEPENDENT NON-EXECUTIVE DIRECTOR
20 years’ experience within the energy-supply industry, spanning electricity supply
across infrastructure and trading markets
Previously CEO of Hill Michael
Currently serves as the Executive Chairman of VisIR, a specialist private-equity
investor
PIPPA DOWNES
INDEPENDENT NON-EXECUTIVE DIRECTOR
Over 25 years of experience in global financial services organisations
Previously Managing Director and Equity Partner at Goldman Sachs in Australia
Currently serves on the boards of the Infotrack Group, Sydney Olympic Park Authority
and ALE Property Group
CHARLES MACEK
INDEPENDENT NON-EXECUTIVE DIRECTOR
Over 15 years’ experience on the boards of companies in diverse industries
Previously on the boards of both Wesfarmers and Telstra
Currently the chair of the boards of Vivid Technology Limited, chair of the
Remuneration and HR Committee of Vicinity Ltd., consultant to the Investment
Committee of Unisuper Ltd., and a Senior Corporate Advisor to the MMC group
JOHN COOPER
INDEPENDENT NON-EXECUTIVE DIRECTOR
Over 10 years’ experience on the boards of companies in both executive and non-
executive roles in the engineering, mining and construction industries
Previously CEO and managing director of CMPS&F and non-executive director of
Murray & Roberts International
Currently a member of the board of Aurizon Holdings and Sydney Motorway
Corporation. Formerly a non-executive director of UGL Group

WINDLAB LIMITED 31
Highlights
Projects
▪ Kiata wind farm completed its first year of commercial operation as the second best performing wind farm in Australia after Coonooer Bridge. It contributed $2m in cash to Windlab during 2018.
▪ Greenwich Wind Park in Ohio, USA, was sold mid year for total consideration of around US$4m. This amount will be recognised on financial close around August 2019, but all costs relating to the project were expensed in 2018, a $4.1m P&L impact.
▪ Miombo Hewani became the first approved wind farm in Tanzania
▪ Kennedy Energy Park construction is largely complete, with commissioning works ongoing and first generation expected in April. Delays have been caused by the project’s contractor and contractual arrangements entitle the project to delay liquidated damages.
▪ Lakeland Wind Farm financial close has been delayed to mid 2019 due to the complexity of new grid access rules.
Financials
▪ Total Revenue from all sources totalled $6.25m(including $338k from Greenwich).
▪ Recurring Revenues up 65% on the prior year
▪ Asset management revenue was $3.0m, and share of profit from Kiata and Kennedy $1.915m
▪ $4.6 million cash in the bank and a modest level of gearing with $3 million of debt.
▪ Operating cash inflows of $3.94m, plus a $2m distribution from Kiata.
▪ Cash expenditure was flat and included significant investment in the pipeline.
Outlook
▪ 2019 priorities are Lakeland and Greenwich financial close, KEP commercial operations.
▪ Complete Eurus US$10m investment into Windlab East Africa and prosecute our strategy in those markets
▪ No immediate need to rise capital, but a prudent strategy of increasing working capital headroom to ~$10m is underway
▪ Ongoing cash burn to reduce significantly as KEP comes online, new AM contracts added, and WEA removes ~$1.5m pa in cash outflows.
▪ Grid connection environment is changing fast, and creating industry wide challenges.