
Full year results Analyst & Investor presentation -...
51
Full year results Analyst & Investor presentation Tuesday 20 November 2012 1 1
Transcript of Full year results Analyst & Investor presentation -...

Full year results Analyst & Investor
presentation Tuesday 20 November 2012
1 1

2 2
Agenda
1. Review of F’12
2. Financial review
3. Business review
3
Introduction
Carolyn McCall
Chief Executive Officer

4 4
0 .83
3 .36
3 .97
4.81
1.6%
6.3%
7.2%
8.2%
0%
1%
2%
3%
4%
5%
6%
7%
8%
9%
0
1
2
3
4
5
6
2009 2010 2011 2012
PB
T m
arg
in
PB
T /
se
at
PBT / seat PBT Margin
85%
87%
76%
83%
77%
80%
77% 76%
82%
87%
80%
89%
FY'11 FY'12
KLM Lufthansa Air France British Airways Ryanair easyJet
Review of F’12
Excellent customer satisfaction(2) Industry leading on-time performance(1)
Improving returns(3)
(1) On-time performance figures from flight stat.com & reflect average number of arrivals within 15 minutes for period Oct 11 to Sept 12 (2) GfK Customer Satisfaction Tracker. Data updated October 2012 reflecting 12m to end Sept 2012 (3) See appendix for details of calculation; also shows ROCE with leases capitalised on an NPV basis.
FY'11 FY'12 FY'11 FY'12 FY'11 FY'12
Overall
Satisfaction
Satisfaction
with Punctuality
Likelihood to
recommend
79% 80% 82%82%87%
84%
Profit per seat growth
3.6%
8.8%
12.7%
14.5%
3.6%
6.9%
9.8%
11.3%
2009 2010 2011 2012
ROCE excl. operating lease adjustment ROCE incl. operating lease adjustment

5
Financial review
Chris Kennedy
Chief Financial Officer

6 6
4.810.22
4.14
0.123.97
Summary
PBT £ per seat • Returns improved due to:
• management action;
• benign operating environment
• easyJet lean continuing to deliver cost savings
• Tough decisions taken on asset allocation
• Debt levels reduced
• Ordinary and special dividends paid
• Cash generated from operating activities of £457 million exceeds capital expenditure and ordinary dividend
FY 12 Other costs
ex Fuel
(0.69)
Disruption Crew
(0.18)
Fuel (inc FX)
(2.77)
Revenue FX (ex fuel)
FY 11
Increasing level of dividend Level of cover changed from 5x to 3x

7 7
Financial results
£m F ’12 F ’11 Change
Total revenue 3,854 3,452 11.6%
Fuel (1,149) (917) (25.3)%
Operating costs excluding fuel (2,174) (2,067) (5.1)%
EBITDAR 531 468 13.5%
Ownership costs (214) (220) 2.7%
Profit before tax 317 248 27.9%
PBT margin 8.2% 7.2% 1.0 ppt
8 8
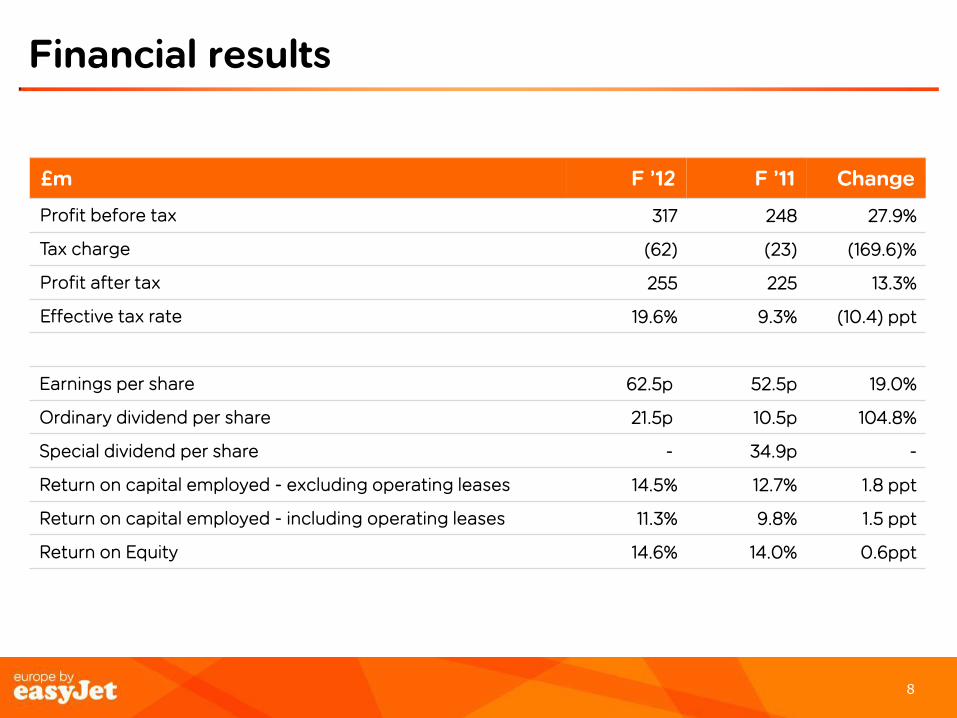
Financial results
£m F ’12 F ’11 Change
Profit before tax 317 248 27.9%
Tax charge (62) (23) (169.6)%
Profit after tax 255 225 13.3%
Effective tax rate 19.6% 9.3% (10.4) ppt
Earnings per share 62.5p 52.5p 19.0%
Ordinary dividend per share 21.5p 10.5p 104.8%
Special dividend per share - 34.9p -
Return on capital employed - excluding operating leases 14.5% 12.7% 1.8 ppt
Return on capital employed - including operating leases 11.3% 9.8% 1.5 ppt
Return on Equity 14.6% 14.0% 0.6ppt
9 9
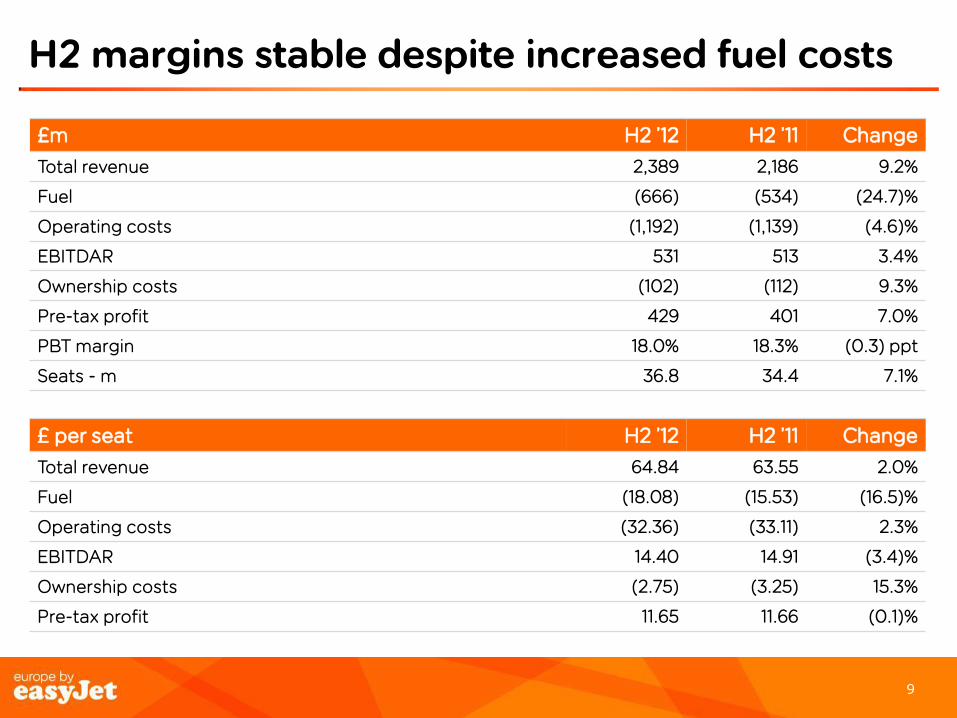
H2 margins stable despite increased fuel costs
£m H2 ’12 H2 ’11 Change
Total revenue 2,389 2,186 9.2%
Fuel (666) (534) (24.7)%
Operating costs (1,192) (1,139) (4.6)%
EBITDAR 531 513 3.4%
Ownership costs (102) (112) 9.3%
Pre-tax profit 429 401 7.0%
PBT margin 18.0% 18.3% (0.3) ppt
Seats - m 36.8 34.4 7.1%
£ per seat H2 ’12 H2 ’11 Change
Total revenue 64.84 63.55 2.0%
Fuel (18.08) (15.53) (16.5)%
Operating costs (32.36) (33.11) 2.3%
EBITDAR 14.40 14.91 (3.4)%
Ownership costs (2.75) (3.25) 15.3%
Pre-tax profit 11.65 11.66 (0.1)%
10 10
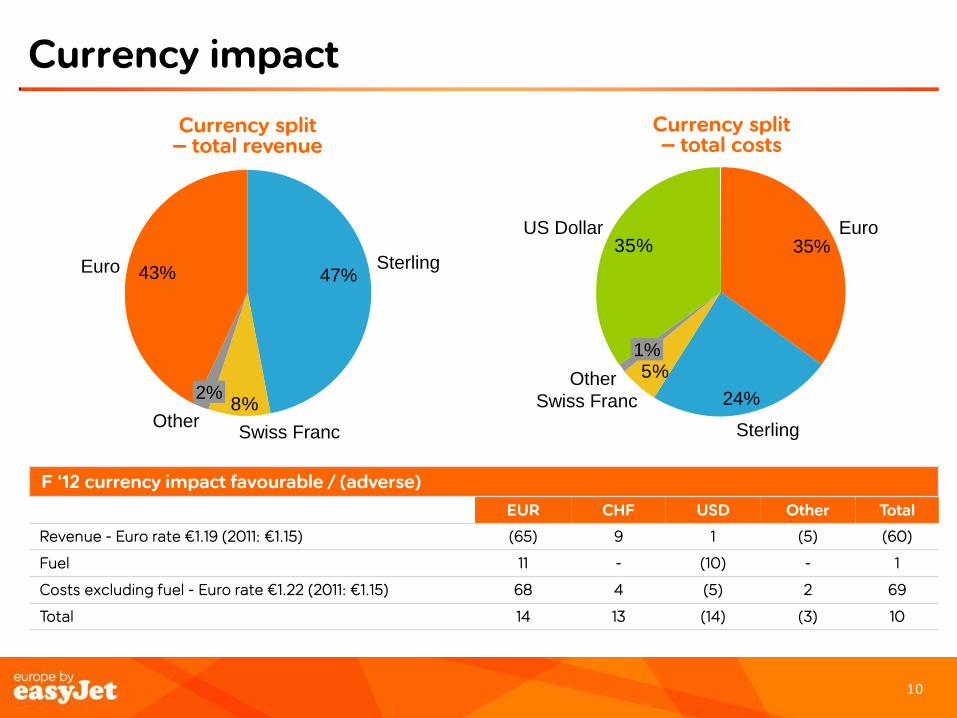
Currency impact
Currency split – total costs
Currency split – total revenue
8%
47% Sterling
Swiss Franc
Euro
2%
Other
43%
35%
5%
Sterling
1%
24%
35%
Other
Euro
Swiss Franc
US Dollar
F ‘12 currency impact favourable / (adverse)
EUR CHF USD Other Total
Revenue - Euro rate €1.19 (2011: €1.15) (65) 9 1 (5) (60)
Fuel 11 - (10) - 1
Costs excluding fuel - Euro rate €1.22 (2011: €1.15) 68 4 (5) 2 69
Total 14 13 (14) (3) 10
11 11
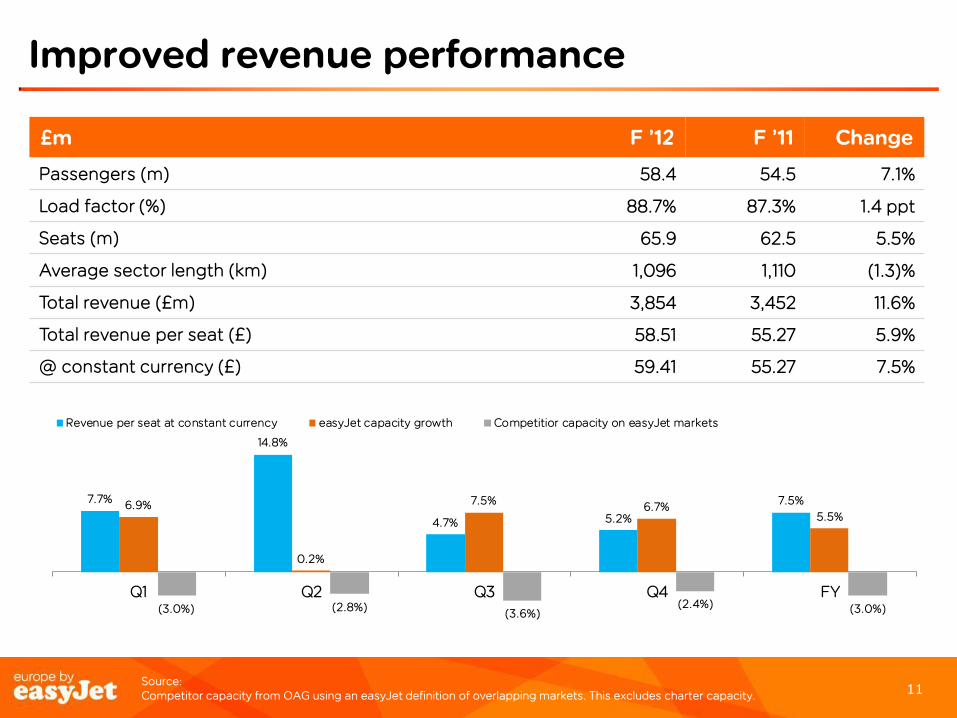
Improved revenue performance
£m F ’12 F ’11 Change
Passengers (m) 58.4 54.5 7.1%
Load factor (%) 88.7% 87.3% 1.4 ppt
Seats (m) 65.9 62.5 5.5%
Average sector length (km) 1,096 1,110 (1.3)%
Total revenue (£m) 3,854 3,452 11.6%
Total revenue per seat (£) 58.51 55.27 5.9%
@ constant currency (£) 59.41 55.27 7.5%
Source: Competitor capacity from OAG using an easyJet definition of overlapping markets. This excludes charter capacity.
7.7%
14.8%
4.7% 5.2%
7.5%6.9%
0.2%
7.5%6.7%
5.5%
(3.0%) (2.8%)(3.6%)
(2.4%) (3.0%)
Q1 Q2 Q3 Q4 FY
Revenue per seat at constant currency easyJet capacity growth Competitior capacity on easyJet markets

12 12
Significant increase in taxes absorbed
£ per seat F ’12 F ’11 Change Change @ CC
Gross seat revenue 64.37 60.51 6.4% 8.1%
Passenger taxes (6.76) (6.26) (8.0)% (10.7)%
Net seat revenue 57.61 54.25 6.2% 7.8%
Non-seat revenue 0.90 1.02 (10.8)% (8.4)%
Total revenue 58.51 55.27 5.9% 7.5%
FY’12
5.5% 6.2%
Q4’12
4.9% 5.4%
Q3’12
2.5% 3.4%
Q2’12
10.6% 10.6%
Q1’12
4.8%
6.0%
Net ticket per seat growth at constant currency
Gross ticket per seat growth at constant currency
13 13
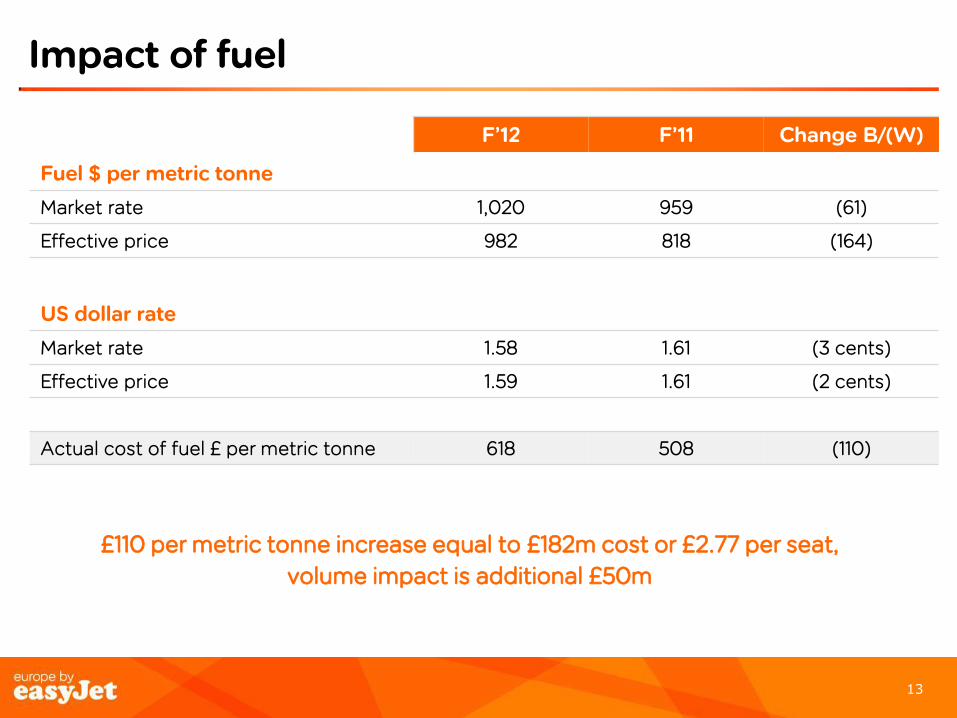
Impact of fuel
F’12 F’11 Change B/(W)
Fuel $ per metric tonne
Market rate 1,020 959 (61)
Effective price 982 818 (164)
US dollar rate
Market rate 1.58 1.61 (3 cents)
Effective price 1.59 1.61 (2 cents)
Actual cost of fuel £ per metric tonne 618 508 (110)
£110 per metric tonne increase equal to £182m cost or £2.77 per seat,
volume impact is additional £50m

14 14
Management action taken to offset headwinds
Profit per seat bridge
£ per seat
3 .97
-0 .19
4.81
-2.77
-1.51
0.12
4.14
0.600.21 0.05
2011 PBT perseat
Fuel Inflation FX (excl fuel) Beforemanagement
action
Revenue IncrementaleasyJet Lean
IncrementalA320 mix
Other 2012 PBT perseat
15 15
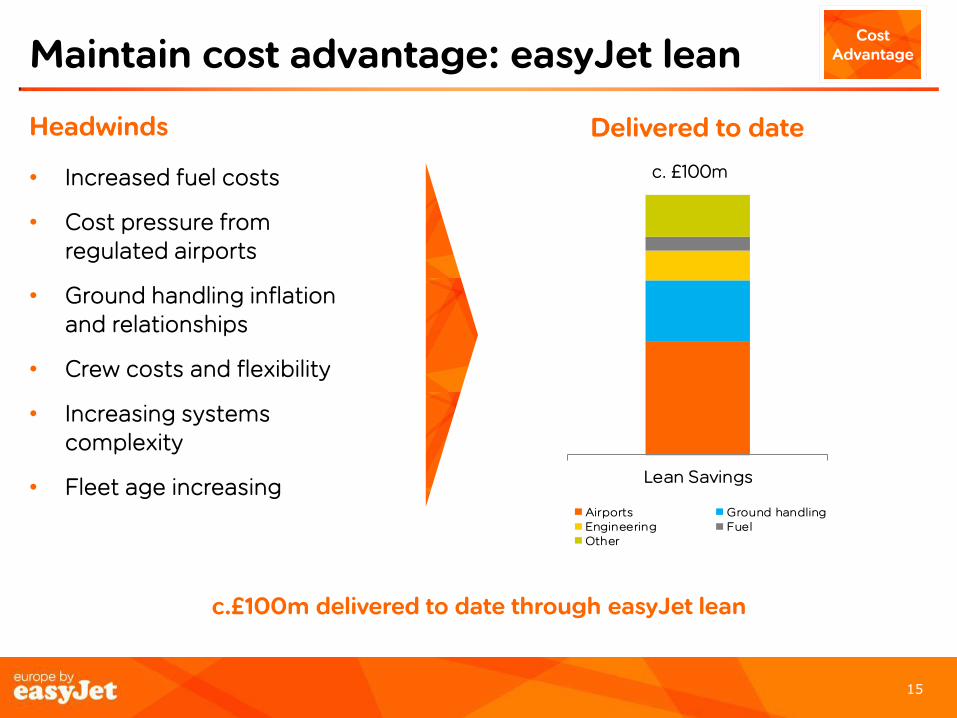
Lean Savings
Airports Ground handlingEngineering FuelOther
Maintain cost advantage: easyJet lean
Delivered to date Headwinds
• Increased fuel costs
• Cost pressure from regulated airports
• Ground handling inflation and relationships
• Crew costs and flexibility
• Increasing systems complexity
• Fleet age increasing
c.£100m delivered to date through easyJet lean
Cost Advantage
c. £100m

16 16
Cost per seat excluding fuel - key drivers
Movement versus F‘11 Cost per seat (£)
Reported Constant currency
Drivers
Ground Operations 14.49 -2.1% +1.6% • Significant increases in charges in Spain and Italy partially offset by relatively benign winter.
Crew 6.55 +0.6% +2.8% • Average 2% increase in salaries and disciplined winter capacity thinning.
Navigation 4.25 -6.7% -1.2% • Regulated increases of 2% more than offset by higher proportion of A320s and slightly shorter sector length.
Maintenance 3.08 +7.7% +8.1% • Driven by one-offs. Investment in process improvements will partially mitigate increases from the planned aging of the fleet.
Overhead 4.55 +5.9% +7.1% • Investment in IT infrastructure, and performance related employee costs resulting from significantly improved profitability.
Brand licence 0.08 +20.4% +20.4% • Increase in fixed royalty from £3.95m to £4.95m.
Ownership 3.25 -7.8% -7.4% • Leasing costs lower due to the higher proportion of owned aircraft.
Total CPS excluding fuel 36.25 -1.0% +1.8%

17 17
Increasing proportion of A320’s
Sep ‘12 Sep ‘11 Change
A319 (operating lease) 49 56 (7)
A319 (owned / finance lease) 111 111 -
A319 Total 160 167 (7)
A320 (operating lease) 6 6 -
A320 (owned / finance lease) 48 29 19
A320 Total 54 35 19
Main fleet 214 202 12
Sub-fleet (Boeing 737) - 2 (2)
Total fleet 214 204 10
Operating lease 26% 31% (5)ppt
Percentage unencumbered 32% 19% 13ppt
Percentage of A320s in fleet 25% 17% 8ppt

18 18
Flexibility in fleet planning
Maximum fleet - Lease extensions; options exercised
Minimum fleet - Early termination of leases; deferrals of existing orders
Fleet count
210
217220
228
236
244
254 252
213
209
201 199196 194
225223
231 232
241
180
190
200
210
220
230
240
250
260
FY13 H1 FY13 H2 FY14 H1 FY14 H2 FY15 H1 FY15 H2 FY16 H1 FY16 H2
Max fleet
Min fleet
Growth of. c.3% to 5% p.a.

19 19
Strong balance sheet
£m Sep ‘12 Sep ‘11
Property, plant and equipment 2,395 2,149
Goodwill and other intangible assets 456 451
Other assets 561 469
Liabilities (excluding debt) (1,544) (1,464)
1,868 1,605
Debt 957 1,300
Cash and money market deposits (883) (1,400)
Net debt / (cash) 74 (100)
Shareholders’ equity 1,794 1,705
Capital employed 1,868 1,605
Gearing* 29% 28%
*Gearing defined as (debt + 7 x annual lease payments – cash) divided by (shareholders’ equity + debt +7 x
annual lease payments – cash)

20 20
Aircraft cashflows including overhauls
Figures based on contracted fleet commitments
Aircraft 2012 2013
Number of aircraft deliveries 19 10
Capital expenditure (USD) 2012
$m 2013
$m
Final delivery payments 479 268
Pre delivery payments 35 5
Heavy maintenance - owned fleet 14 39
Total $528m $312m
Heavy maintenance - leased fleet 120 93
Total cash flows $648m $405m
Total cash flows (GBP) £410m £257m

21 21
25
150
364
38946
2845109
331
Cashflow
Sep 2012 *
883
Financing CAPEX Ordinary dividend
paid
Tax, net int & other
Net Working Capital
Depn & amort
Special dividend
paid
Operating Profit
FX Sep 2011 *
1,400
* Includes money market deposits but excludes restricted cash
£m
22 22
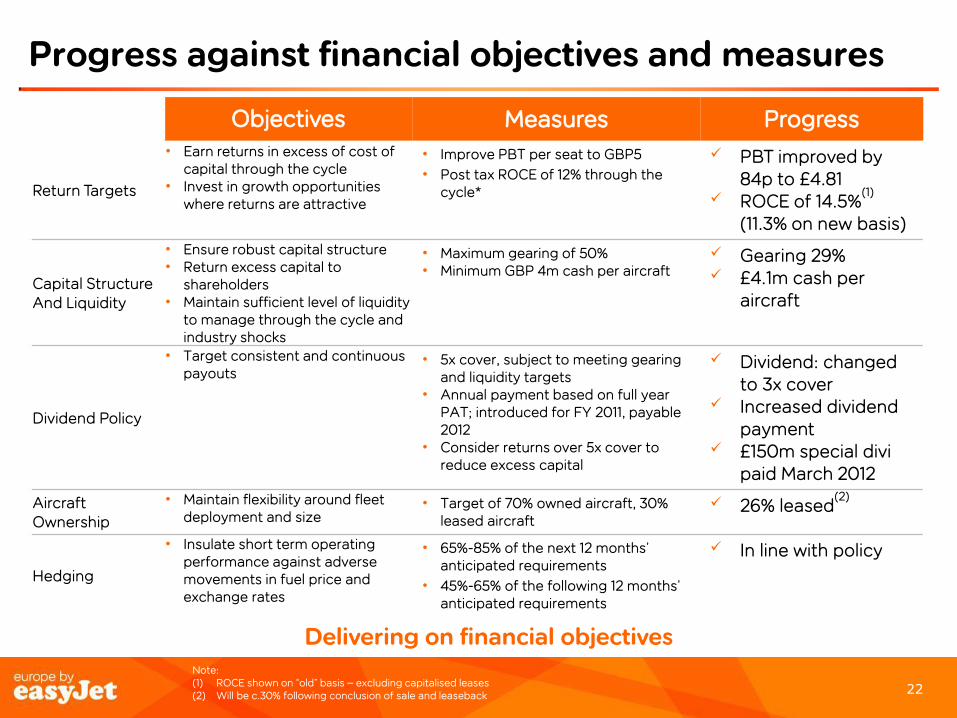
Progress against financial objectives and measures
Objectives Measures Progress
Return Targets
• Earn returns in excess of cost of capital through the cycle
• Invest in growth opportunities where returns are attractive
• Improve PBT per seat to GBP5
• Post tax ROCE of 12% through the cycle*
PBT improved by 84p to £4.81
ROCE of 14.5%(1)
(11.3% on new basis)
Capital Structure And Liquidity
• Ensure robust capital structure • Return excess capital to
shareholders • Maintain sufficient level of liquidity
to manage through the cycle and industry shocks
• Maximum gearing of 50% • Minimum GBP 4m cash per aircraft
Gearing 29% £4.1m cash per
aircraft
Dividend Policy
• Target consistent and continuous payouts
• 5x cover, subject to meeting gearing and liquidity targets
• Annual payment based on full year PAT; introduced for FY 2011, payable 2012
• Consider returns over 5x cover to reduce excess capital
Dividend: changed to 3x cover
Increased dividend payment
£150m special divi paid March 2012
Aircraft Ownership
• Maintain flexibility around fleet deployment and size
• Target of 70% owned aircraft, 30% leased aircraft
26% leased(2)
Hedging
• Insulate short term operating performance against adverse movements in fuel price and exchange rates
• 65%-85% of the next 12 months’ anticipated requirements
• 45%-65% of the following 12 months’ anticipated requirements
In line with policy
Delivering on financial objectives Note: (1) ROCE shown on “old” basis – excluding capitalised leases (2) Will be c.30% following conclusion of sale and leaseback

23 23
Fuel and foreign exchange hedging
Sensitivities
• $10 movement per metric tonne impacts F’13 PBT by $4m
• One cent movement in £/$ impacts F’13 PBT by £1.6m
• One cent movement in £/€ impacts F’13 PBT by £1.2m
Fuel requirement
US dollar requirement
Euro surplus
Half year ending 31 March 2013 86% at $986/tonne 86% at $1.61/£ 76% at €1.18/£
Full year ending 30 September 2013 78% at $985/tonne 81% at $1.60/£ 68% at €1.18/£
Full year ending 30 September 2014 55% at $993/tonne 62% at $1.58/£ 48% at €1.22/£
Table data as of 23rd October
24 24
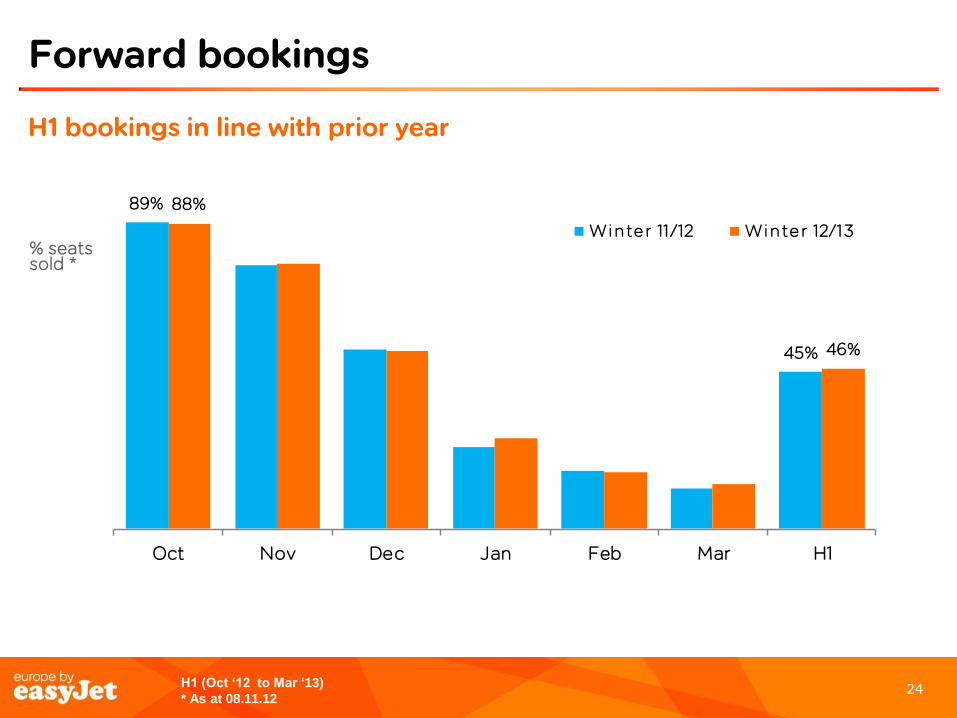
Forward bookings
% seats sold *
H1 (Oct ‘12 to Mar ‘13)
* As at 08.11.12
H1 bookings in line with prior year
89%
45%
88%
46%
Oct Nov Dec Jan Feb Mar H1
Winter 11 /12 Winter 12/13

25 25
Outlook
Capacity (seats flown)
• FY c.+3.5% (before disruption)
• H1 c.+3.5% (before disruption)
Revenue per seat (constant currency)
• H1 up low to mid single digits
Cost per seat ex fuel (constant currency)
• FY c.+3 to 4% (assuming normal disruption levels and constant load factors)
• H1 c.+4 to 5% (assuming normal disruption levels and constant load factors)
• Includes £70m increase in airport costs
Headwinds
• c.£50 million adverse movement from foreign exchange rates
• With fuel remaining within its recent $1,000/MT to $1,100/MT trading range, easyJet’s unit fuel bill for the 2013 financial year would be up to £30m higher
“Whilst there is always the potential for unexpected events to temporarily impact financial results the Board of easyJet is confident that its business model, strategy and people will consistently continue to generate
superior returns and growth for shareholders.”

26
Business review
Carolyn McCall
Chief Executive Officer
26

27 27
7.0
7.5
8.0
8.5
9.0
07 08 09 10 11 12 13 14 15 16 17 18
High
Low
Base
Headwinds for European aviation – but growth expected
Headwinds
• Austerity measures
• Slowing economic growth
• Industrial unrest
• High fuel costs
• Increased taxation on aviation
• Rising costs at regulated airports
Intra-European flying volume(1)
Source: (1) Eurocontrol traffic flow forecast for Europe – ESRA 8 definition (EU + Scandinavia + Turkey + Eastern Europe) Sept’12
Yet
Opportunities for strong airlines such as easyJet to deliver returns and growth
Year
Annual number of flights (m)

28 28
-1%
4%
-1%
-8%
-6%
-2%
3%
9%
11%
6%
-6%
4%
UK France Swiss Italy Spain Market
Competitors - on EZJ routes
easyJet change
Unique structural opportunity for easyJet
Capacity growth H1 ‘ F’13 (OAG)
Key themes
• Legacy carriers incurring significant short haul losses
• Weaker carriers retreating or exiting
• Consolidation
• Capacity discipline in the market
H1 capacity YOY Chg
Competitors on EZJ routes
-1.8%
Competitors in total market
-3.6%
easyJet +3.6%
Source: OAG 6 months to March ’12; based on easyJet city pairs

29 29
Continued structural advantage against legacies
Source:
OAG intra-European travel 2005 vs. .2012
On-going cost advantage against legacies and charter airlines
• Seat density
• Load factors
• Point to point vs. feeder
• Fleet
• Pensions / crew costs
• Overheads
Market share – EZJ vs legacy carriers '05 vs'12
Cost advantage and ability to offer affordable fares allows easyJet to continue to grow profitably and to take share from legacies
UK France Switzerland Italy
vs. BA vs. AF vs. Swiss vs. Alitalia
-3% +6% -13% +8% -1% +8% -5% +8%
21%
15%
61%
5%
35%
12%
34%
2%
18%21%
48%
13%
34%
20%
29%
10%
BA EZJ AF EZJ Swiss EZJ Alitalia EZJ
Market share - EZJvs legacy carriers '05 vs'12

30 30
Winning against low-cost competition
• Strength of network
• Pan-European network and market presence
• No. 1 or 2 positions at primary airports
• Peak slots
• Strong balance sheet
• Scale and purchasing power
• Pan-European brand
• easyJet.com
• Friendly service
Base 36%
Brand 38%
Price 4%
Media 22%
Estimated Seat sale contribution
38% of sales due to the power of the brand
46
24
34 26 23
19 18 17 14 13
3
3
14 2
2
-
10
20
30
40
50
60
Presence in top 100 market pairs
Non primary airports
Primary airports
Source: Market data from OAG: intra-European travel 2005 vs. .2012 Seat sale contribution from Brand Science Big 6 Market Econometrics study, Feb 2012 data

31 31
Strategy to drive growth and returns
1. Build strong number 1 and 2 network positions
2. Maintain cost advantage
3. Drive demand, conversion and yield across Europe
4. Disciplined use of capital
• Sustainable growth • (slightly in excess of market c.
3% to 5% per annum)
• Improved returns
• Tangible and regular cash returns via 3 x cover dividend
Leverage easyJet’s cost advantage, leading market positions and brand to deliver point-to-point low fares with operational efficiency and friendly service for our customers

32 32 (1) Market shares based on OAG capacity shares for 12 months to end September 2012
1. Network positions
Building strong number 1 or 2 positions at major airports(1)
Airport Share Position
London Gatwick 46% No.1
Geneva 38% No.1
Milan Malpensa 37% No.1
Paris Orly 13% No.2
Lisbon 13% No.2
Paris CDG 11% No.2
Amsterdam 10% No.2
Build strong number 1 & 2 network positions
• Highest returns where we have a strong relative market share and cost advantage
• Economies of scale and market presence

33 33
3 to 4%1 to 2%
c.1%
F'13 Cost headwinds Incremental Lean Incremental A320 F'13 cost per seat (excl. fuel)
Cost per seat excluding fuel - at constant currency
Other(Disruption, Crew, Brand
Royalty)c.3%
5 to 6%
Airportsc.3%
Actions planned to offset cost headwinds 2.
Cost Advantage
Actions planned to offset headwinds and increase returns
34 34
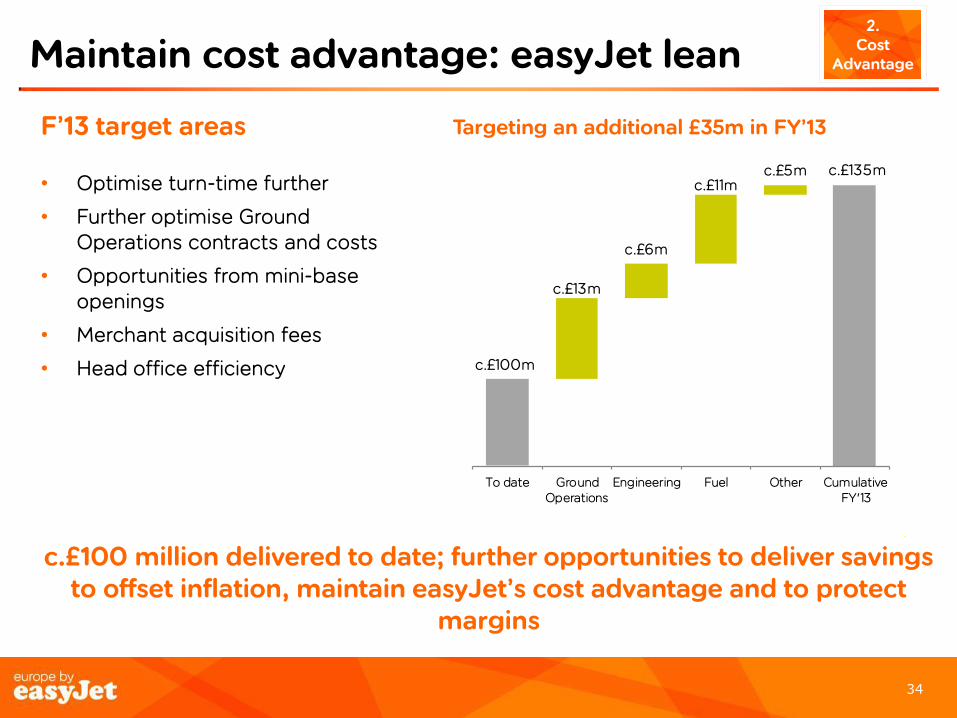
Maintain cost advantage: easyJet lean 2.
Cost Advantage
c.£100m
c.£135m
c.£13m
c.£6m
c.£11mc.£5m
To date GroundOperations
Engineering Fuel Other CumulativeFY'13
F’13 target areas
• Optimise turn-time further
• Further optimise Ground Operations contracts and costs
• Opportunities from mini-base openings
• Merchant acquisition fees
• Head office efficiency
c.£100 million delivered to date; further opportunities to deliver savings to offset inflation, maintain easyJet’s cost advantage and to protect
margins
Targeting an additional £35m in FY’13
35 35
3. Drive
Demand Driving demand, conversion & yield across Europe
• Network optimisation
• Progressing the business initiative
• Allocated seats
• Driving leisure
• Brand
• Digital / Web
• Revenue management

36 36
Network optimisation
United Kingdom 2.7%
France 8.8%
Italy
5.9%
Spain
-5.8%
Switzerland 11.5%
Germany flat
Netherlands flat
Overall 3.6% capacity growth in H1 (adjusting for disruption(1))
Portugal
5.0%
Source : OAG for 6 months to end March 2013
3. Drive
demand

37 37
Progressing Business initiative
Building blocks being put in place
• Business routes added to network
• Partnerships with Global Distribution System providers (GDS)
• Agreements with Travel Management Companies (TMC)
• Large scale customers signed
• In-country Sales teams delivering
Improving functionality & accessibility
• Work with GDS & TMCs to improve technology & functionality (mid-2013)
Drive Demand
3. Drive
Demand

38 38
Allocated seating roll-out is on plan
A320 • ‘Extra Legroom’ = 18
seats • ‘Up front’ = 30 seats • Remaining = 132 seats
A319 • ‘Extra Legroom’ = 18
seats • ‘Up front’ = 24 seats • Remaining = 114 seats
‘Up front’ seats
‘Up front’ seats
to Oct 11th Oct 11th Oct 16th Nov 13th Nov 20th Nov 27th
Route / base description
Existing trial routes
Rolled out to all London airports, and all flights touching Bristol, Glasgow, Edinburgh, Rome, Paris
Rest of Network
Allocating seating roll-out is on track
‘Extra Legroom’ seats
Drive Demand
3. Drive
Demand
39 39
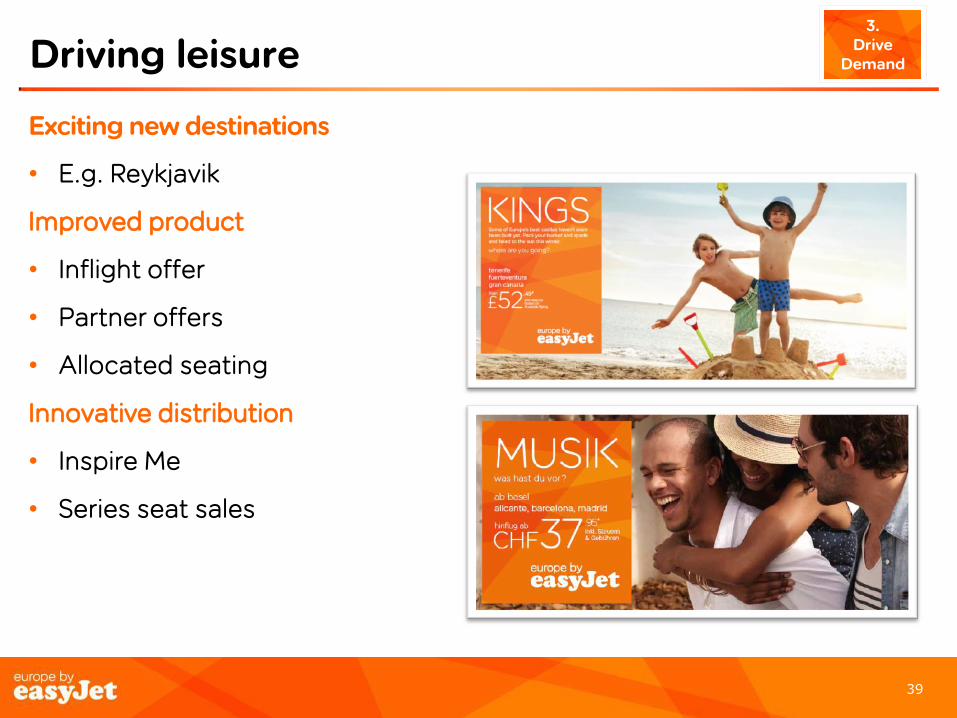
Driving leisure Drive
Demand
3. Drive
Demand
Exciting new destinations
• E.g. Reykjavik
Improved product
• Inflight offer
• Partner offers
• Allocated seating
Innovative distribution
• Inspire Me
• Series seat sales

40 40
Brand: europe by easyJet
Increasingly stronger awareness in our newer markets: 86% Italy, 92% France
Significant growth in consideration, both among business and leisure fliers
New advertising taking effect – high ad recall and recognition
Brand messaging getting stronger
Pan-European campaign
Drive Demand
3. Drive
Demand

41 41
Conversion drivers
US homepage
Swiss homepages
Abandon Basket Email Step 5 Destination Guides
Inspire Me
Drive Demand
3. Drive
Demand

42 42
Revenue management system
• Cutting edge, bespoke revenue management system
• Further benefit from yield managing ancillaries
• Improved effectiveness using latest artificial intelligence techniques
Drive Demand
3. Drive
Demand
Prices as at per 19 November 2012

43 43
Disciplined use of capital 4.
Capital Discipline
Key principles
• Strong balance sheet is a source of competitive advantage
• easyJet committed to covering cost of capital
• easyJet will self fund dividend, fleet replacement and growth
• Rigorous approach to capital allocation embedded throughout easyJet
FY11 FY12 12% ROCE
Improved returns year on year Returns
Routes

44 44
Fleet order framework
• Commercial and technical evaluation progressing well
• New gen offer significant cost saving opportunities
• RFP to five suppliers:
• Engines: Pratt & Whitney, CFMi (GE & Snecma)
• Aircraft: Airbus, Boeing, Bombardier
• No further update expected before the second quarter
• Plan will include details on ‘bridge’ period to next generation
Contracted aircraft @ end Sept'12 @ end Sept'13
A320 family 214 217
% of A320s 25% 29%
4. Capital
Discipline
45 45
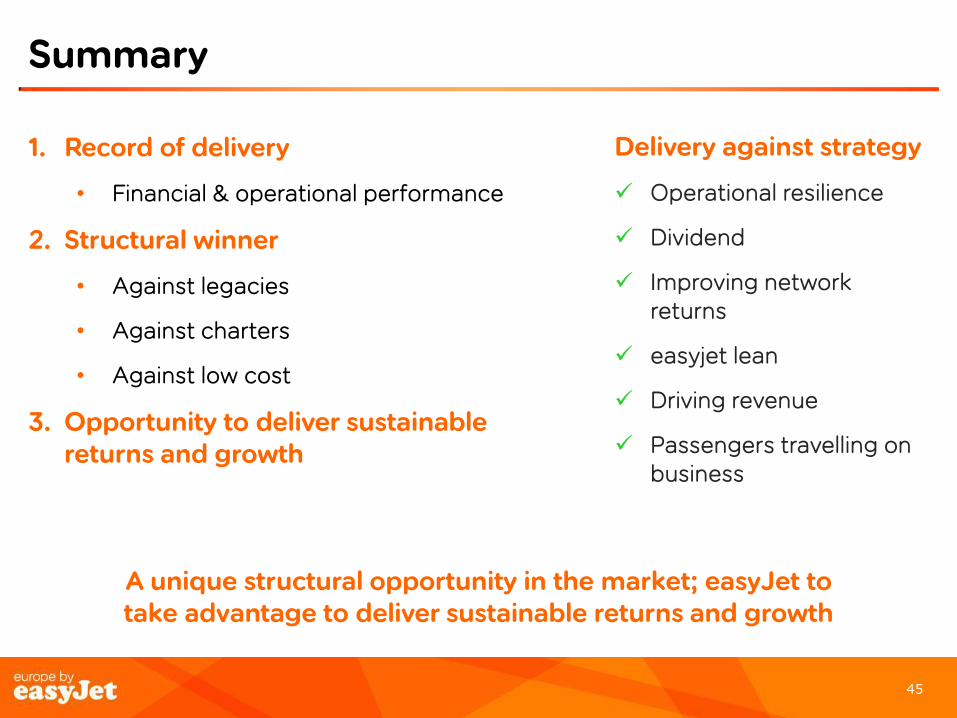
Summary
A unique structural opportunity in the market; easyJet to take advantage to deliver sustainable returns and growth
1. Record of delivery
• Financial & operational performance
2. Structural winner
• Against legacies
• Against charters
• Against low cost
3. Opportunity to deliver sustainable returns and growth
Delivery against strategy
Operational resilience
Dividend
Improving network returns
easyjet lean
Driving revenue
Passengers travelling on business

Q & A
46

APPENDIX
47

48 48
ROCE Calculation – including 7x lease adjustment
Reported £m Sep ‘12 Sep ’11
Earnings before interest and tax – reported 331 269
Interest element of operating lease payments 32 36
Earnings before interest and tax - adjusted 363 305
Tax 24% 26%
Normalised operating profit after tax (NOPAT) 276 226
Average shareholders’ equity – reported 1,750 1,603
Average net cash – reported (13) (30)
Opening capitalised leases 763 714
Closing capitalised leases 665 763
Average capitalised leases 714 739
Average capital employed 2,451 2,312
Return on capital employed – 7x basis 11.3% 9.8%

49 49
ROCE Calculation – NPV and Target liquidity
Proforma £m Sep ‘12 Sep ’11
Earnings before interest and tax – reported 331 269
Interest element of operating lease payments 25 27
Earnings before interest and tax – adjusted 356 296
Tax 24% 26%
Normalised operating profit after tax (NOPAT) 270 219
Average shareholders’ equity – reported 1,750 1,603
Adjustment to shareholders’ equity (35) (40)
Average shareholder’s equity – adjusted 1,715 1,563
Average net cash – reported (13) (30)
Increase in debt associated with capitalising leases 355 362
Target liquidity adjustment 836 800
Average net debt – adjusted 1,178 1,132
Average capital employed 2,893 2,695
Return on capital employed – NPV basis 9.3% 8.1%
50 50
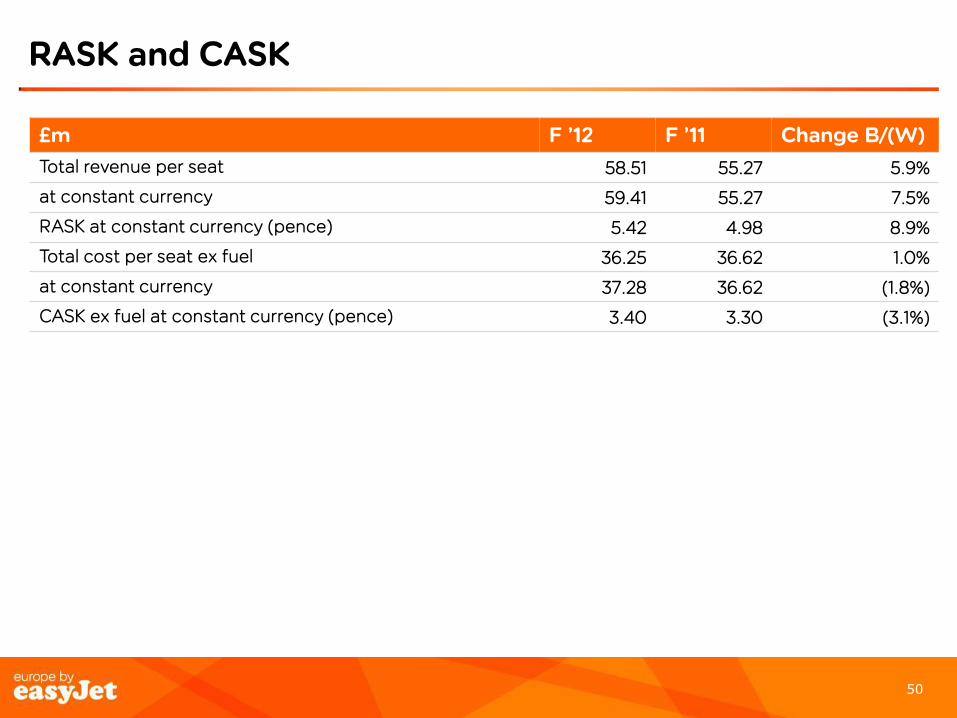
RASK and CASK
£m F ’12 F ’11 Change B/(W)
Total revenue per seat 58.51 55.27 5.9%
at constant currency 59.41 55.27 7.5%
RASK at constant currency (pence) 5.42 4.98 8.9%
Total cost per seat ex fuel 36.25 36.62 1.0%
at constant currency 37.28 36.62 (1.8%)
CASK ex fuel at constant currency (pence) 3.40 3.30 (3.1%)

51 51
This communication is directed only at (i) persons having professional experience in matters relating to investments who fall within the definition of “investment professionals” in Article 19(5) of the Financial Services and Markets Act 2000 (Financial Promotion) Order 2001; or (ii) high net worth bodies corporate, unincorporated associations and partnerships and trustees of high value trusts as described in Article 49(2) of the Financial Services and Markets Act 2000 (Financial Promotion) Order 2001. Persons within the United Kingdom who receive this communication (other than those falling within (i) and (ii) above) should not rely on or act upon the contents of this communication. Nothing in this presentation is intended to constitute an invitation or inducement to engage in investment activity for the purposes of the prohibition on financial promotion contained in the Financial Services and Markets Act 2000. This presentation has been furnished to you solely for information and may not be reproduced, redistributed or passed on to any other person, nor may it be published in whole or in part, for any other purpose. This presentation does not constitute or form part of, and should not be construed as, an offer for sale or subscription of, or solicitation of any offer to buy or subscribe for, any securities of easyJet plc (“easyJet”) in any jurisdiction nor should it or any part of it form the basis of, or be relied on in connection with, any contract or commitment whatsoever. This presentation does not constitute a recommendation regarding the securities of easyJet. Without limitation to the foregoing, these materials do not constitute an offer of securities for sale in the United States. Securities may not be offered or sold into the United States absent registration under the US Securities Act of 1933 or an exemption there from. easyJet has not verified any of the information set out in this presentation. Without prejudice to the foregoing, neither easyJet nor its associates nor any officer, director, employee or representative of any of them accepts any liability whatsoever for any loss however arising, directly or indirectly, from any reliance on this presentation or its contents. This presentation is not being issued, and is not for distribution in, the United States (with certain limited exceptions in accordance with the US Securities Act of 1933) or in any jurisdiction where such distribution is unlawful and is not for distribution to publications with a general circulation in the United States. By attending or reading this presentation you agree to be bound by the foregoing limitations.
Disclaimer


![3Q21 [ENG] Results Presentation-Analyst](https://static.fdocuments.in/doc/165x107/62059ee21708c43c2d4570d9/3q21-eng-results-presentation-analyst.jpg)
