Full Year Results
44
© SBM Offshore 2013. All rights reserved. www.sbmoffshore.com FY2013 Presentation, February 2014 IR – 06/02/2014
-
Upload
company-spotlight -
Category
Investor Relations
-
view
344 -
download
0
Transcript of Full Year Results
© SBM Offshore 2013. All rights reserved. www.sbmoffshore.com
FY2013 Presentation, February 2014
IR – 06/02/2014

IR- 06/02/2014
Disclaimer
Some of the statements contained in
this presentation that are not historical
facts are statements of future
expectations and other forward-
looking statements based on
management‟s current views and
assumptions and involve known and
unknown risks and uncertainties that
could cause actual results,
performance, or events to differ
materially from those in such
statements. Such forward-looking
statements are subject to various risks
and uncertainties, which may cause
actual results and performance of the
Company‟s business to differ
materially and adversely from the
forward-looking statements.
Should one or more of these risks or
uncertainties materialize, or should
underlying assumptions prove
incorrect, actual results may vary
materially from those described in this
presentation as anticipated, believed,
or expected. SBM Offshore NV does
not intend, and does not assume any
obligation, to update any industry
information or forward-looking
statements set forth in this
presentation to reflect subsequent
events or circumstances.
2

IR- 06/02/2014
2013 in Context
¹ Directional view is a non-IFRS disclosure, which corrects the non-cash effects on revenue and earnings introduced by IFRS finance lease accounting
99%
Fleet
Uptime
0.4
TRIFR
Deep
Panuke
on hire
US$1.2 bn
financing
IFRS
Revenue
Up 32%
FPSO³ 3 FPSOs
1st
oil
Cidade
de
Paraty
YME
settlement
OSX-2
delivered
US$23 bn
Directional¹
Backlog
Directional¹
Revenue
Up 13%
Directional
introduced
9,936
Employees
as of year
end
Rights
Issue
US$274
mln
3

Agenda
Macro view 2013 Review
2013 Financials Outlook
4

IR- 06/02/2014
Total Overview (in millions of US$)
*Restated for comparison purposes 5
Turnover
Net Income
attributable to shareholders
EBIT
Order Portfolio
(in billions of US$)
Directional1
IFRS
-175
-79 -58
111
2012* 2013 2012* 2013
Directional1
IFRS
2,082
2,706 2,367
3,784
2012* 2013 2012* 2013
977 932 1,078 1,018
3,059
3,445 3,639
4,803
Directional1
IFRS
13.6 10.6
20.1
5.8
2012* 2013 2012* 2013
Directional1
IFRS
311
414 296
-164
2012* 2013 2012* 2013
-341
-49
-21 -21
-79
98
38
293
-49
-177
478
-327
2.9
2.9
3.9
13.9
14.5
19.7
23.0
16.5
¹ Directional view is a non-IFRS disclosure, which corrects the non-cash effects on revenue and earnings introduced by IFRS finance lease accounting

IR- 06/02/2014
HSSE Results
• Total Recordable Incidents
Frequency in line with 2012
• Frequency of potentially
severe incidents halved
compared to 2012
• However, Lost Time Incidents
frequency deteriorated due to
a number of challenges in
safe working practices on one
specific project
• Best practices adopted for
Environmental performance
reporting
Total Recordable Injury Frequency =
number of lost time injuries, restricted work and medical treatment cases per 200,000 exposure hours 6

IR- 06/02/2014
0
100
200
300
400
500
600
Index
E&P Spending (volume) E&P Spending (nominal) Oil & Gas production
CAGR
6.8%
14.1%
1.8%
Market Dynamics
Production vs. E&P Spending
Sources: Pareto, Companies 7
2000 2002 2004 2006 2008 2012 2010
• Cash Flows
constrained
• Development costs
rising
• NOCs of growing
importance

IR- 06/02/2014
Source: Goldman Sachs; ExxonMobil; Douglas Westwood FPS report 2013-2017
The Award Cycle
8
Last six years 50% of elephant
discoveries have been in deep/ultra
deepwater…
Project sanction delays increasing
along with water depth/complexity
Recent deepwater elephant discoveries likely to experience
increased lead time for project sanctioning

IR- 06/02/2014
Ticking all the Boxes
9
We provide great TECHNICAL solutions
We provide LOCAL solutions
We provide FINANCIAL solutions

IR- 06/02/2014
E&P Spending
Source: Morgan Stanley January 2014 10
Deepwater trends remain intact

IR- 06/02/2014
FPSO Awards
11

IR- 06/02/2014
20.1 bn
2.9 bn
Directional1 Backlog (in billions of US$)
12
Lease & Operate
US$ 23.0 bn
(as of December 31, 2013)
0.0
2.0
4.0
6.0
2014 2015 2016
Turnkey Backlog: Directional¹ vs. IFRS
Directional
IFRS
Turnkey
¹ Directional view is a non-IFRS disclosure, which corrects the non-cash effects on revenue and earnings introduced by IFRS finance lease accounting
0.0
0.5
1.0
1.5
2.0
20
14
20
15
20
16
20
17
20
18
20
19
20
20
20
21
20
22
20
23
20
24
20
25
20
26
20
27
20
28
20
29
20
30
20
31
20
32
20
33
20
34
20
35
Lease & Operate Backlog: Directional¹ vs IFRS
Directional
IFRS
2016
L&O Average Portfolio Duration: 14.5 years

Agenda
Macro view
2013 Review
2013 Financials Outlook
13

IR- 06/02/2014
Deep Panuke
• Production Acceptance Notice
received
• Platform formally on hire
In production H2 2013
December 2013 IR – 06/02/2014
Source: Encana Corporation
14

IR- 06/02/2014
• Only remaining legacy issue
• Results of internal investigation handed over to relevant
authorities:
Openbaar Ministerie - Dutch public prosecutor
U.S. Department of Justice
• Remain in active dialogue; the timing is not in our control
• As investigation still in progress it is not possible to provide
further information or an estimate of the outcome, financial
or otherwise.
Compliance
15

IR- 06/02/2014
Team Energy
Seamless handover of Paraty
between project and operations.
Process 30% faster than before
Success
OSX-2 & Paraty delivered on time,
on budget
Ambition
More than 65% Brazilian local
content for FPSO Paraty; built in 34
months
Cdde Paraty (20 year L&O contract)
July 2013 IR – 14/11/2013 OSX-2 (Turnkey sale)
Higher Standards
16

IR- 06/02/2014 July 2013
• Two Generation 3 (3G) FPSOs
awarded in one bid
• Accelerated award process
• Delivery end 2015 and early
2016
• World‟s deepest disconnectable
FPSO; 2,900 meters in GoM
• Cutting edge technology
Prestigious Awards
17
Cdde Maricá & Cdde Saquarema
IR – 14/11/2013 FPSO Stones

IR- 06/02/2014
Core Projects on Track
(ol) operating lease (fl) finance lease (t) turnkey
18
Completed/On Hire In Progress/On Schedule

Agenda
Macro view 2013 Review
2013 Financials
Outlook
19

IR- 06/02/2014
IFRS Directional¹ Difference IFRS Comments
Revenue 4,803 3,445 1,358 ~US$1.4bn reported as revenue,
but not invoiced
EBIT 293 98 195 Inflated by factor of three
Net Profit to
shareholders 111 (58) 169 Loss turned into profit
Backlog
(in billions of
US$)
19.8 23.0 3.2 US$3.2bn taken through revenue,
but yet to be invoiced
The Case for Directional1 Reporting (in millions of US$)
20
2013
¹ Directional view is a non-IFRS disclosure, which corrects the non-cash effects on revenue and earnings introduced by IFRS finance lease accounting
An unusual challenge, signing off on ‘true and fair’!

IR- 06/02/2014
*Restated for comparison purposes
Turnkey P&L (in millions of US$)
21 ¹ Directional view is a non-IFRS disclosure, which corrects the non-cash effects on revenue and earnings introduced by IFRS finance lease accounting
Directional¹ IFRS
FY2013 FY2012* FY2013 FY2012*
Revenue 2,367 2,082 3,784 2,706
Gross Margin 443 307 624 410
Other operating income 28 130 28 130
EBIT 296 311 478 414
Depreciation, amortisation and impairment (15) (23) (15) (23)
EBITDA 311 334 493 437
Directional¹
Revenue up US$285 mln + Ilhabela, Maricá and Saquarema, Turrets
- Gusto, OSX-2 and Paraty
Gross margin up US$136 mln + OSX-2, Paraty, Skarv, Fram
- Gusto
EBIT down US$15 mln US$100mln less divestment profit
Underlying EBIT margin 12.7% (8.8% in 2012)

IR- 06/02/2014
Lease & Operate P&L (in millions of US$)
22 ¹ Directional view is a non-IFRS disclosure, which corrects the non-cash effects on revenue and earnings introduced by IFRS finance lease accounting
Directional¹ IFRS
FY2013 FY2012* FY2013 FY2012*
Revenue 1,078 977 1018 932
Gross Margin (154) (313) (141) (299)
EBIT (177) (341) (164) (327)
One-off effects (464) (627) (465) (499)
Depreciation, amortisation and impairment (463) (678) (390) (619)
EBITDA 285 337 226 292
*Restated for comparison purposes
Directional¹
Revenue up US$101 mln + Anchieta, Paraty, Deep Panuke
- Sanha
Gross margin up US$159 mln Higher one-off charges in 2012
Underlying EBIT margin 26.6% vs 29.2% in 2012, reflecting start-up costs for new vessels

IR- 06/02/2014
Group P&L (in millions of US$)
23 ¹ Directional view is a non-IFRS disclosure, which corrects the non-cash effects on revenue and earnings introduced by IFRS finance lease accounting
Directional¹ IFRS
FY2013 FY2012* FY2013 FY2012*
Revenue 3,445 3,059 4,803 3,639
Gross Margin 289 (6) 484 111
EBIT 98 (79) 293 38
Depreciation, amortisation and impairment (479) (702) (406) (643)
EBITDA 577 623 700 681
Net financing costs (100) (79) (100) (78)
Income from associated companies 1 4 1 4
Income tax expense (54) (22) (80) (38)
Net Income attributable to
shareholders (58) (175) 111 (79)
*Restated for comparison purposes
Directional¹
Net financing cost increase: Anchieta (USPP) and Paraty. Average cost of debt stable at 5.3%
Underlying effective tax rate stable at 14%
IR- 06/02/2014
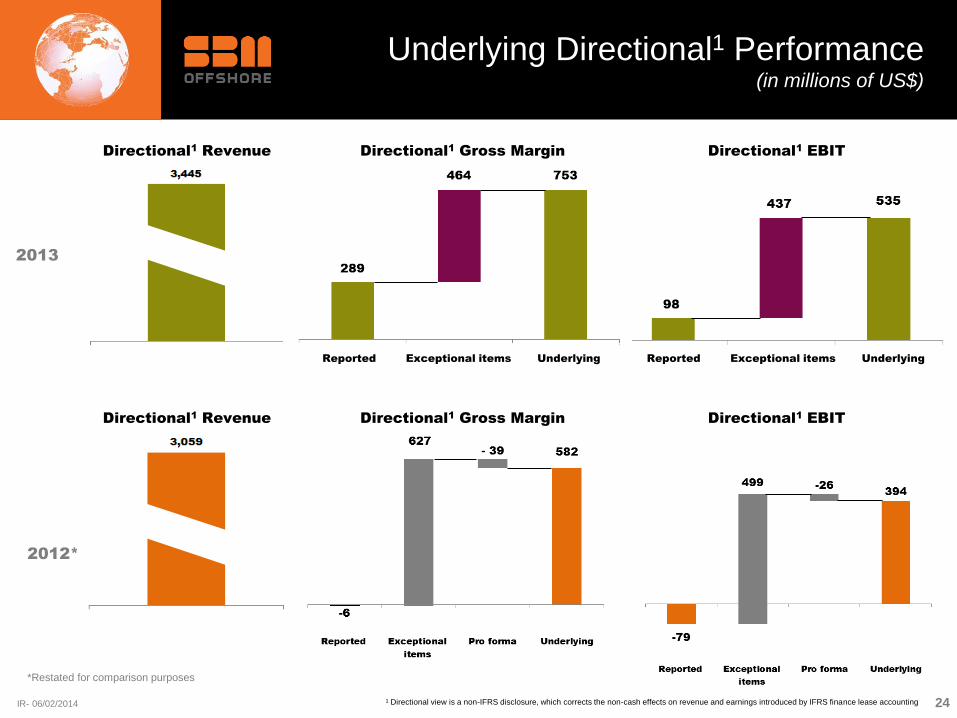
Underlying Directional1 Performance (in millions of US$)
2013
2012*
*Restated for comparison purposes
24
Directional1 Revenue Directional
1 Gross Margin Directional
1 EBIT
Directional1 Revenue Directional
1 Gross Margin Directional
1 EBIT
¹ Directional view is a non-IFRS disclosure, which corrects the non-cash effects on revenue and earnings introduced by IFRS finance lease accounting
Reported Exceptional items Underlying Reported Exceptional items Underlying

IR- 06/02/2014
Divestment Update
July 2013
• Partial sale and lease back of Monaco office
• COOL™ hose technology sold
• SBM Installer , FPSO Falcon and VLCC Alba held for sale
IR- 06/02/2014 25

IR- 06/02/2014
Funding
• Undrawn Credit Facilities + cash = US$1,434 mln
• Rights Issue: US$273 mln
• N’Goma project finance + CdM/CdS bridge loans
• Average cost of debt: 5.3%
IR- 06/02/2014 August 2013 26
IR- 06/02/2014
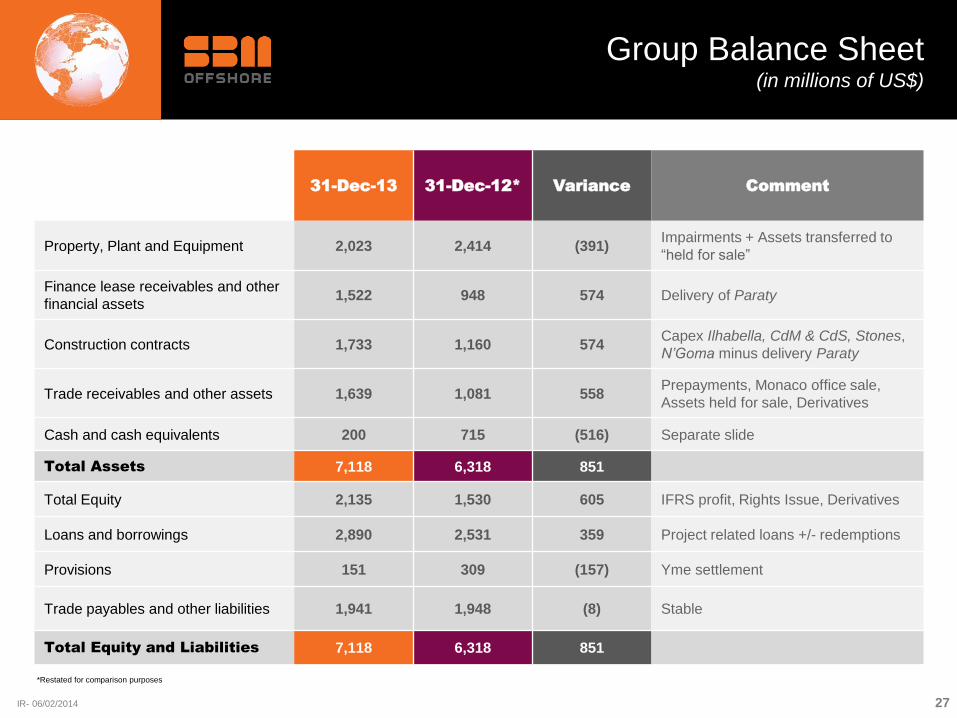
Group Balance Sheet (in millions of US$)
27
31-Dec-13 31-Dec-12* Variance Comment
Property, Plant and Equipment 2,023 2,414 (391) Impairments + Assets transferred to
“held for sale”
Finance lease receivables and other
financial assets 1,522 948 574 Delivery of Paraty
Construction contracts 1,733 1,160 574 Capex Ilhabella, CdM & CdS, Stones,
N’Goma minus delivery Paraty
Trade receivables and other assets 1,639 1,081 558 Prepayments, Monaco office sale,
Assets held for sale, Derivatives
Cash and cash equivalents 200 715 (516) Separate slide
Total Assets 7,118 6,318 851
Total Equity 2,135 1,530 605 IFRS profit, Rights Issue, Derivatives
Loans and borrowings 2,890 2,531 359 Project related loans +/- redemptions
Provisions 151 309 (157) Yme settlement
Trade payables and other liabilities 1,941 1,948 (8) Stable
Total Equity and Liabilities 7,118 6,318 851
*Restated for comparison purposes

IR- 06/02/2014
Development of Group Cash Position (in millions of US$)
28
-400
-200
0
200
400
600
800
1000
1200
1400
Cash
31-Dec-12
Yme
Settlement
Cash from
operations
Investments
OL and FL
New loans Loan
redemptiom
Interest paid New equity Investments
funding loans
and others
Cash
31-Dec-13
715 -470
-1,384
-612
-122
-86
941
945
273
200
IR- 06/02/2014
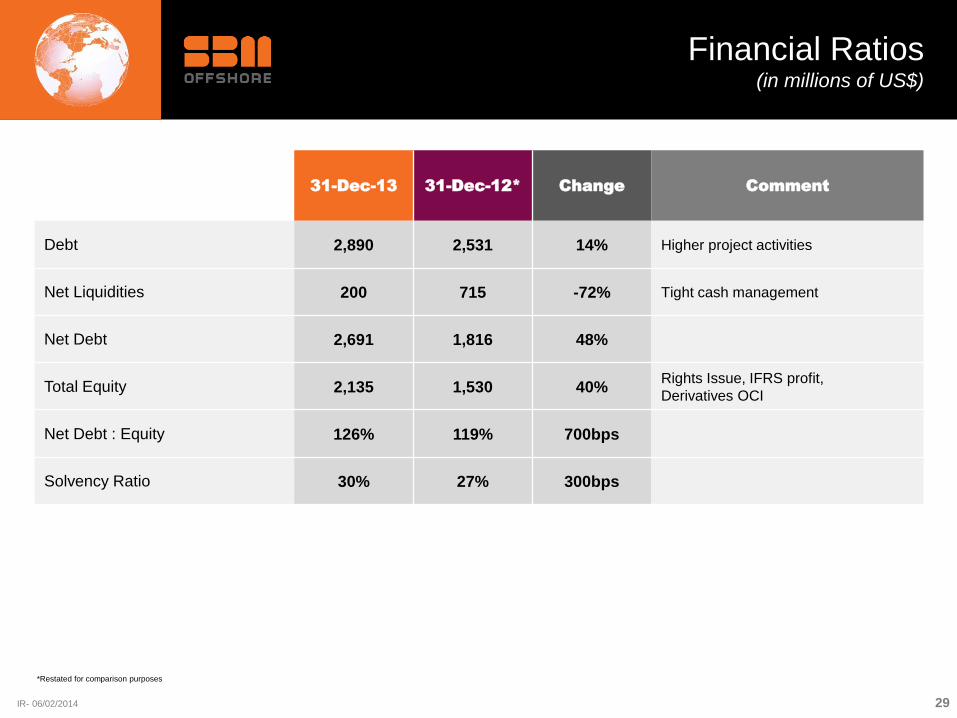
Financial Ratios (in millions of US$)
29
*Restated for comparison purposes
31-Dec-13 31-Dec-12* Change Comment
Debt 2,890 2,531 14% Higher project activities
Net Liquidities 200 715 -72% Tight cash management
Net Debt 2,691 1,816 48%
Total Equity 2,135 1,530 40% Rights Issue, IFRS profit,
Derivatives OCI
Net Debt : Equity 126% 119% 700bps
Solvency Ratio 30% 27% 300bps

IR- 06/02/2014
• IFRS 10 & 11 Joint Venture Accounting standards to be introduced in 2014
• Ends proportional accounting of JVs
full consolidation of controlled JVs (mostly Brazilian FPSOs)
equity accounting of jointly controlled JVs, (mostly African FPSOs)
• IFRS Balance Sheet impacts:
Inclusion of JVs partner‟s share in relatively young Brazilian fleet
Disappearance of most of the African assets and loans
On balance the Balance sheet is expected to grow significantly
• IFRS Revenue and Margin impacts:
Net-Net no material impact expected as additions/substractions offset
• Detailed 2013 impacts to be provided with Q1 2014 trading update & H1
2014 results
IFRS 10 & 11 - JV Accounting
30

IR- 06/02/2014
• As announced in December 2012, no dividend paid over 2013
2013 Directional1 loss
Further strengthening of balance sheet required
Targeting investment grade credit rating in the medium term
• Negative FCF in 2014/2015 due to investments in 3G projects, which
begin to fully contribute to income in 2016
• Management Board intends to propose new dividend policy:
Based on FCF positive in the payment year
Derived from Directional1 net income
Payout ratio target of 25% - 35%
To be discussed at a future AGM
Dividend Policy
31 ¹ Directional view is a non-IFRS disclosure, which corrects the non-cash effects on revenue and earnings introduced by IFRS finance lease accounting

Agenda
Macro view 2013 Review
2013 Financials
Outlook
32

IR- 06/02/2014
2014 Message
The Company has focused its
product line on core FPSO
products and associated
services:
• FPSO full life cycle
• Mooring technology:
Turret
Mooring Systems
Offshore installation
• New products:
FLNG
Semis
Heavy to Light
Gas to Liquids (GTL)
FPSO
FPSO
FPSO
33
IR- 06/02/2014
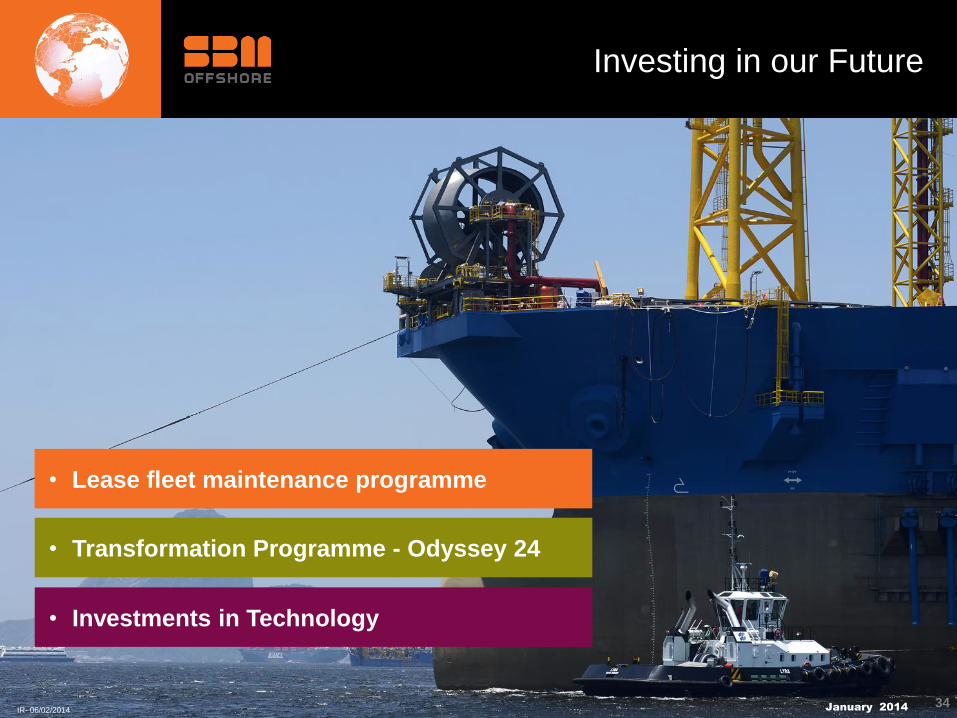
Investing in our Future
January 2014 IR- 06/02/2014
• Lease fleet maintenance programme
• Transformation Programme - Odyssey 24
• Investments in Technology
34

IR- 06/02/2014
Technology - Focus Areas
35
Simpler FPSOs Large Turret
Moorings FLNG
Semi, TLP and
Risers
• Process
intensification
• Equipment
standardisation
• Optimised
manning
• Reduced cost &
schedule
• Hull optimisation
& life extension
• High capacity
small diameter
internal turret
• Larger external
turret
• Swivel advances
• Diverless
connectors
• Twin Hull
development
• LNG topsides
advances
• Simpler gas
processing
• Enabling wider
use of SCR &
Composite Risers
• Dry Tree Semi
development
• MoorSpar
development
IR- 06/02/2014
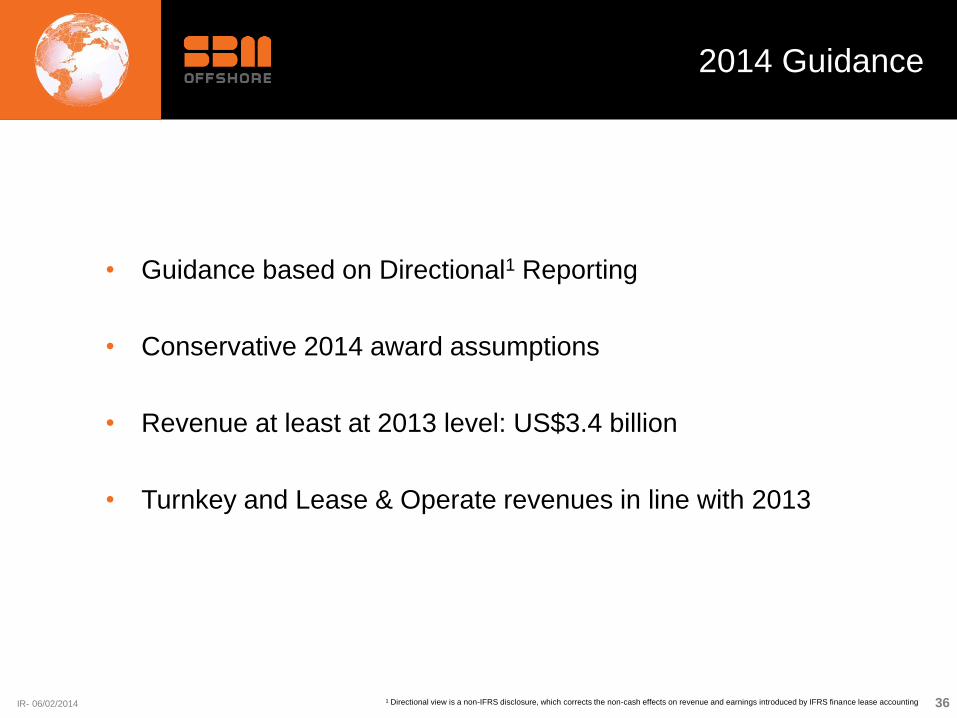
• Guidance based on Directional1 Reporting
• Conservative 2014 award assumptions
• Revenue at least at 2013 level: US$3.4 billion
• Turnkey and Lease & Operate revenues in line with 2013
2014 Guidance
36 ¹ Directional view is a non-IFRS disclosure, which corrects the non-cash effects on revenue and earnings introduced by IFRS finance lease accounting

© SBM Offshore 2013. All rights reserved. www.sbmoffshore.com
Appendix

IR- 06/02/2014
• SBM Offshore seeking to provide analysts and investors with clarity on
business performance above and beyond statutory IFRS disclosure
• SBM Offshore‟s business model combines turnkey sales, construction and
lease and operate projects, making it a challenge to model
• IFRS finance lease accounting adds complexity by separating revenue
recognition from cash flows
• IFRS accelerates recognition of revenues, profit and equity well before any
rents are paid by client
• Increasing number of contracts classified as finance leases, with IASB
intention to make all leases finance leases
• In this context, SBM Offshore is extending its reporting to a non-GAAP
operating lease presentation in line with operating cash flows…
• …leading to increased transparency and understanding of SBM Offshore‟s
performance…
• …through disclosure of Directional¹ Backlog and a Directional¹ Income
Statement as part of the Financial Review
Project Direction - Context
38 ¹ Directional view is a non-IFRS disclosure, which corrects the non-cash effects on revenue and earnings introduced by IFRS finance lease accounting
IR- 06/02/2014
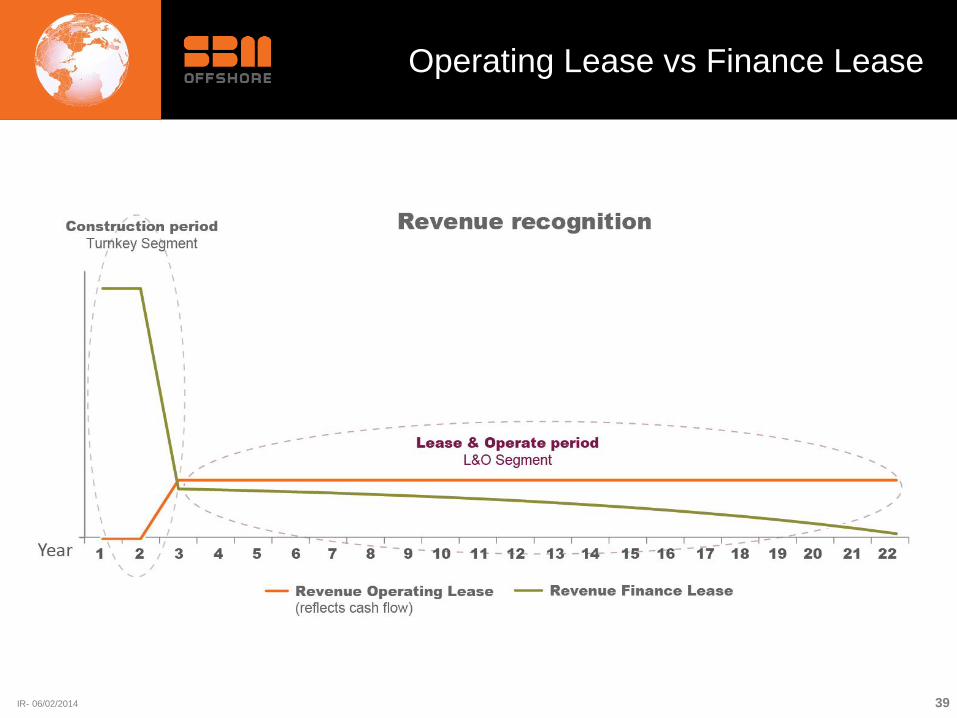
Operating Lease vs Finance Lease
39

IR- 06/02/2014
Operating Lease vs Finance Lease
40

IR- 06/02/2014
• Turnkey segment becomes a pure construction business.
Revenue and Gross Margin consist of:
Direct sales contracts (FPSO OSX 2, Turrets for Prelude, Quad 204
and Ichthys)
Sales to JV partners (FPSO Cdde de Ilhabela, FPSO N’Goma,
FPSO Cdde de Maricá and Saquarema)
• Lease and Operate segment becomes a pure long term cash
business. Revenue and Gross Margin consist of SBM‟s share of
Lease and Operate contracts (Bareboat + OPEX)
• 2013 transition period to promote Directional¹ Reporting as the
main indicator for company performance and variance analysis
• 2014 guidance to be based on Directional¹ results
Directional1 - The Way Forward
41 ¹ Directional view is a non-IFRS disclosure, which corrects the non-cash effects on revenue and earnings introduced by IFRS finance lease accounting

IR- 06/02/2014
• New IFRS 10 & 11 eliminates the revenue SBM generates in the project
phase from its JV partners in investees fully consolidated (Brazil)
• This grossly understates the operating cash flow during construction, and
invalidates the „close to cash‟ principles of Directional1 reporting
• Consequently, Directional1 reporting from 2014 onwards will:
not only classify all leases as operating leases
but also treat all JVs on a proportional accounting basis
• The impact on Directional1 Revenue and results will be very limited:
only two significant production facilities (Aseng and Capixaba) have
been fully consolidated under Directional1 reporting in the past, and
will now be proportionally (60% and 80%) reported.
The Directional1 revenue impacts will be quantified with the Q1 2014
trading update
IFRS 10 & 11 - Directional1 Impact
42 ¹ Directional view is a non-IFRS disclosure, which corrects the non-cash effects on revenue and earnings introduced by IFRS finance lease accounting

IR- 06/02/2014
Asset
Lease
Contract
Type
SBM share
%
Old
Directional Old IFRS
New
Directional New IFRS
FPSO N’Goma FL 50% Proportional Proportional Proportional Equity
FPSO Stones FL 100% Full consolidation Full consolidation Full consolidation Full consolidation
FPSO Saxi FL 50% Proportional Proportional Proportional Equity
FPSO Mondo FL 50% Proportional Proportional Proportional Equity
FPSO Cdde de Ilhabela FL 62% Proportional Proportional Proportional Full consolidation
FPSO Cdde de Maricá FL 56% Proportional Proportional Proportional Full consolidation
FPSO Aseng FL 60% Full consolidation Full consolidation Proportional Full consolidation
FPSO Cdde de Paraty FL 51% Proportional Proportional Proportional Full consolidation
FPSO Cdde de Saquarema FL 56% Proportional Proportional Proportional Full consolidation
FPSO Kikeh OL 49% Proportional Proportional Proportional Equity
FPSO Cdde de Anchieta OL 100% Full consolidation Full consolidation Full consolidation Full consolidation
FPSO Capixaba OL 80% Full consolidation Full consolidation Proportional Full consolidation
FPSO Espirito Santo OL 50% Proportional Proportional Proportional Full consolidation
FPSO Brasil OL 51% Proportional Proportional Proportional Full consolidation
FPSO Marlim Sul OL 100% Full consolidation Full consolidation Full consolidation Full consolidation
Deep Panuke OL 100% Full consolidation Full consolidation Full consolidation Full consolidation
Thunderhawk OL 100% Full consolidation Full consolidation Full consolidation Full consolidation
Yetagun OL 75% Proportional Proportional Proportional Full consolidation
Nkossa II OL 50% Proportional Proportional Proportional Equity
IFRS 10 & 11
43 ¹ Directional view is a non-IFRS disclosure, which corrects the non-cash effects on revenue and earnings introduced by IFRS finance lease accounting
IR- 06/02/2014
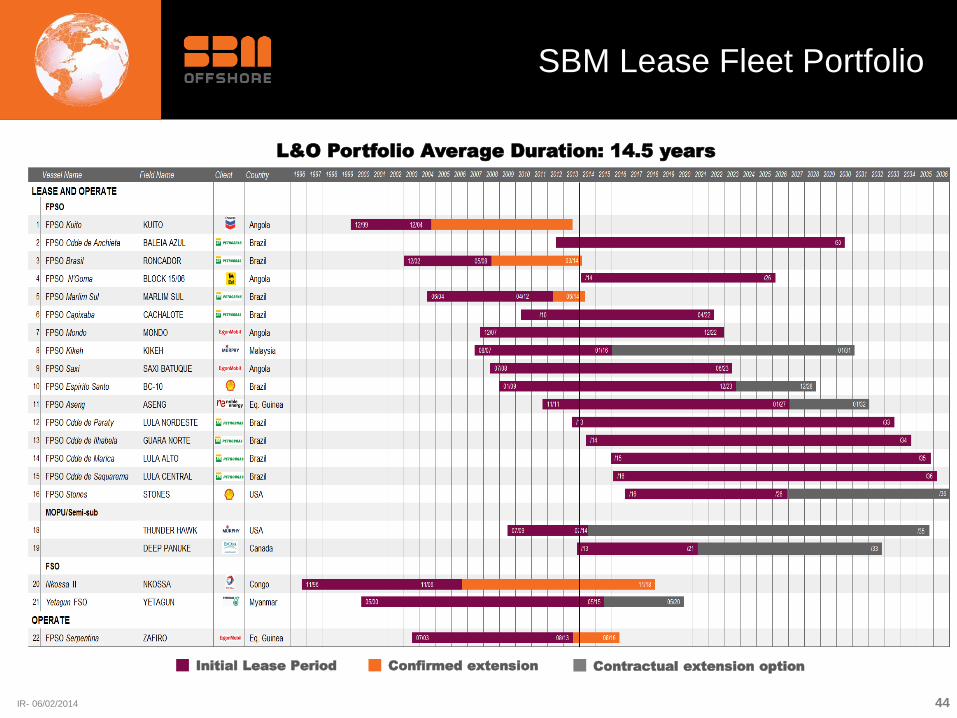
SBM Lease Fleet Portfolio
44
L&O Portfolio Average Duration: 14.5 years
Initial Lease Period Confirmed extension Contractual extension option