2015 Full Year Results Presentation - Zonebourse.com · 2015 Full Year Results Presentation. Milan,...
32
2015 Full Year Results Presentation Milan, 22nd March 2016
Transcript of 2015 Full Year Results Presentation - Zonebourse.com · 2015 Full Year Results Presentation. Milan,...

2015 Full Year Results Presentation
Milan, 22nd March 2016
Broadcasting & Advertising
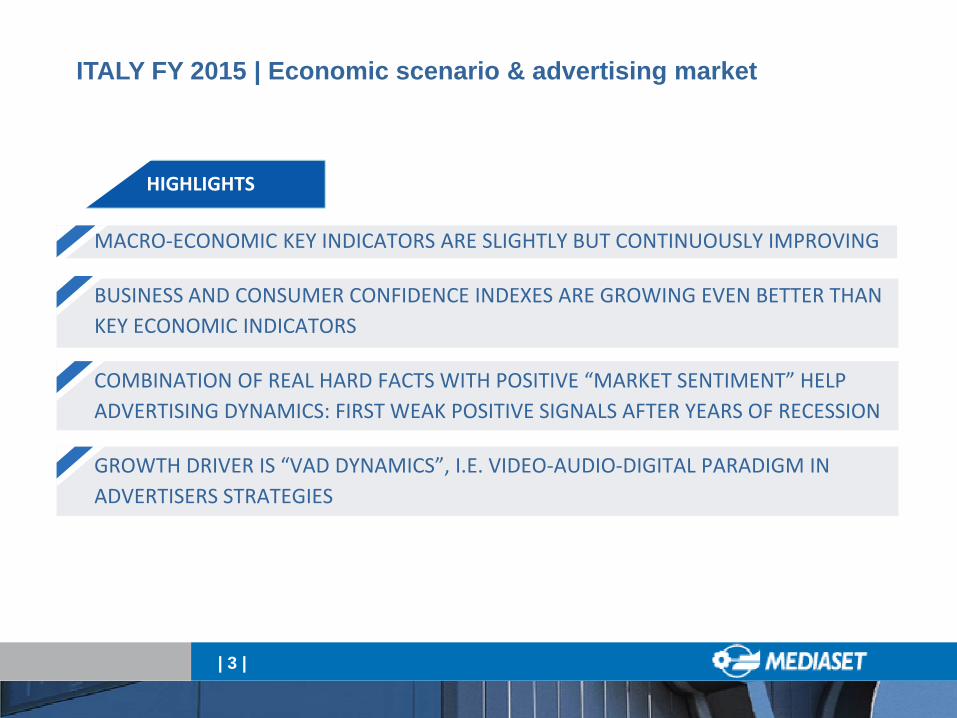
ITALY FY 2015 | Economic scenario & advertising market
| 3 |
HIGHLIGHTS
MACRO‐ECONOMIC KEY INDICATORS ARE SLIGHTLY BUT CONTINUOUSLY IMPROVING
BUSINESS AND CONSUMER CONFIDENCE INDEXES ARE GROWING EVEN BETTER THAN KEY ECONOMIC INDICATORS
COMBINATION OF REAL HARD FACTS WITH POSITIVE “MARKET SENTIMENT” HELP ADVERTISING DYNAMICS: FIRST WEAK POSITIVE SIGNALS AFTER YEARS OF RECESSION
GROWTH DRIVER IS “VAD DYNAMICS”, I.E. VIDEO‐AUDIO‐DIGITAL PARADIGM IN ADVERTISERS STRATEGIES
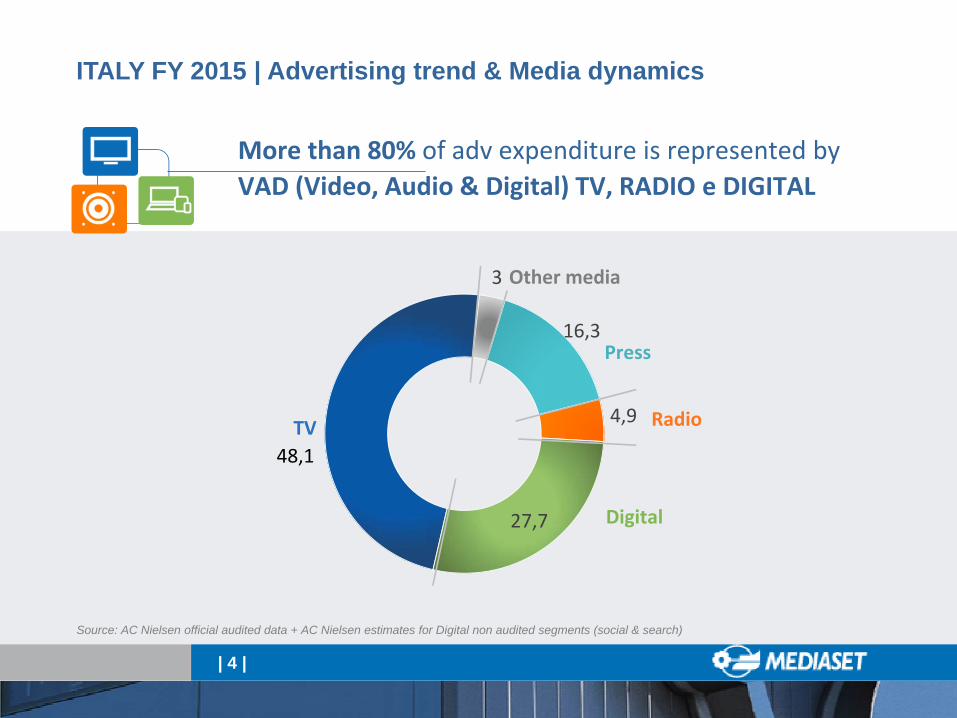
ITALY FY 2015 | Advertising trend & Media dynamics
| 4 |
Source: AC Nielsen official audited data + AC Nielsen estimates for Digital non audited segments (social & search)
48,1
3
16,3
4,9
27,7
More than 80% of adv expenditure is represented byVAD (Video, Audio & Digital) TV, RADIO e DIGITAL
TV
Other media
Press
Radio
Digital
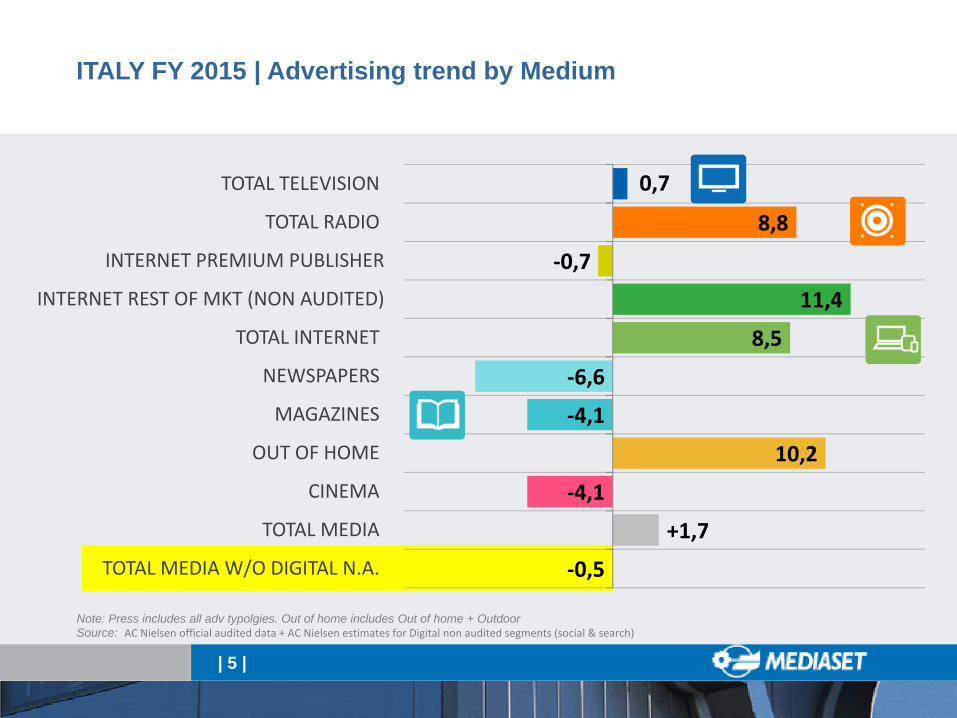
ITALY FY 2015 | Advertising trend by Medium
| 5 |
Note: Press includes all adv typolgies. Out of home includes Out of home + OutdoorSource: AC Nielsen official audited data + AC Nielsen estimates for Digital non audited segments (social & search)
‐0,5
+1,7
‐4,1
10,2
‐4,1
‐6,6
8,5
11,4
‐0,7
8,8
0,7
TOTAL MEDIA W/O DIGITAL N.A.
TOTAL MEDIA
CINEMA
OUT OF HOME
MAGAZINES
NEWSPAPERS
TOTAL INTERNET
INTERNET REST OF MKT (NON AUDITED)
INTERNET PREMIUM PUBLISHER
TOTAL RADIO
TOTAL TELEVISION
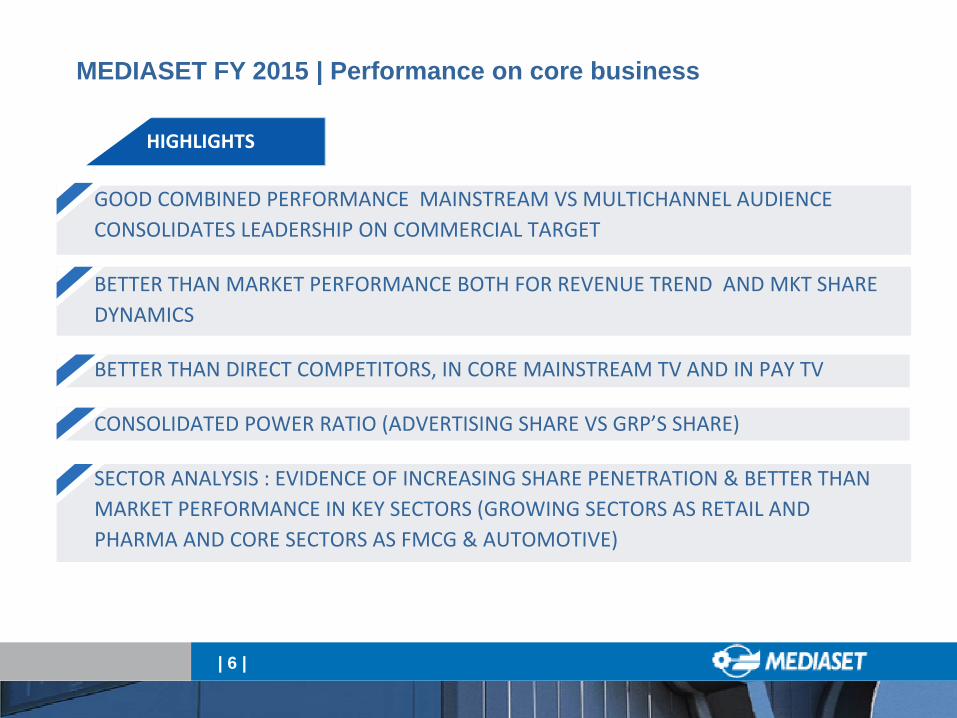
MEDIASET FY 2015 | Performance on core business
| 6 |
GOOD COMBINED PERFORMANCE MAINSTREAM VS MULTICHANNEL AUDIENCE CONSOLIDATES LEADERSHIP ON COMMERCIAL TARGET
BETTER THAN MARKET PERFORMANCE BOTH FOR REVENUE TREND AND MKT SHARE DYNAMICS
BETTER THAN DIRECT COMPETITORS, IN CORE MAINSTREAM TV AND IN PAY TV
CONSOLIDATED POWER RATIO (ADVERTISING SHARE VS GRP’S SHARE)
SECTOR ANALYSIS : EVIDENCE OF INCREASING SHARE PENETRATION & BETTER THAN MARKET PERFORMANCE IN KEY SECTORS (GROWING SECTORS AS RETAIL AND PHARMA AND CORE SECTORS AS FMCG & AUTOMOTIVE)
HIGHLIGHTS
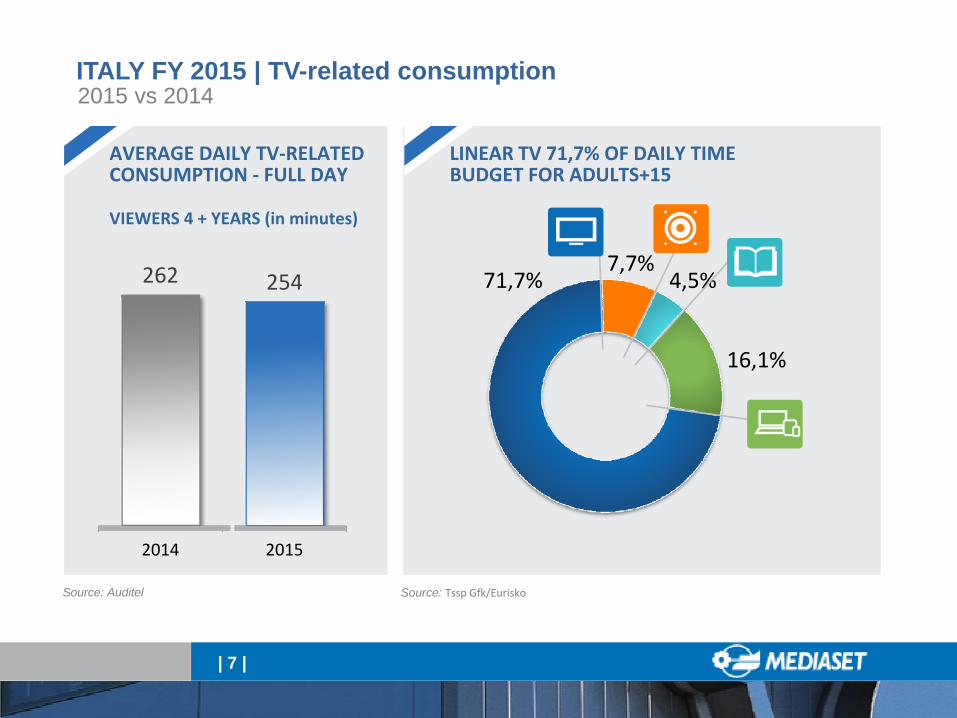
ITALY FY 2015 | TV-related consumption
| 7 |
Source: Auditel
71,7%7,7%
4,5%
16,1%
262 254
2014 2015
AVERAGE DAILY TV‐RELATED CONSUMPTION ‐ FULL DAY
VIEWERS 4 + YEARS (in minutes)
LINEAR TV 71,7% OF DAILY TIME BUDGET FOR ADULTS+15
Source: Tssp Gfk/Eurisko
2015 vs 2014
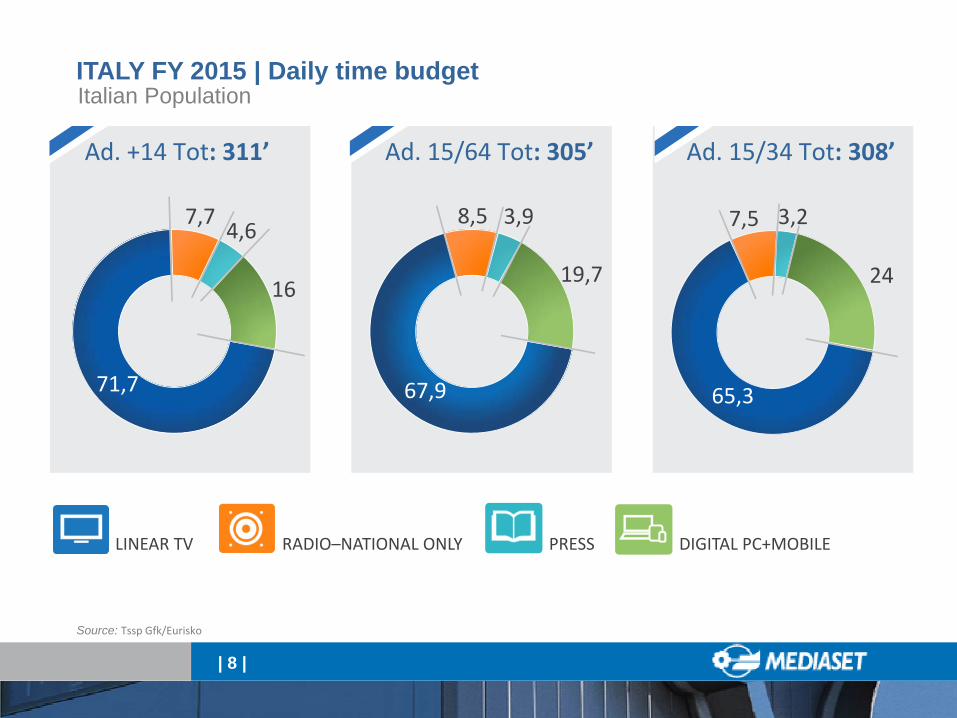
ITALY FY 2015 | Daily time budget
| 8 |
Source: Tssp Gfk/Eurisko
67,9
8,5 3,9
19,7
65,3
7,5 3,2
24
71,7
7,7 4,6
16
LINEAR TV RADIO–NATIONAL ONLY PRESS DIGITAL PC+MOBILE
Ad. +14 Tot: 311’ Ad. 15/64 Tot: 305’ Ad. 15/34 Tot: 308’
Italian Population
| 9 |
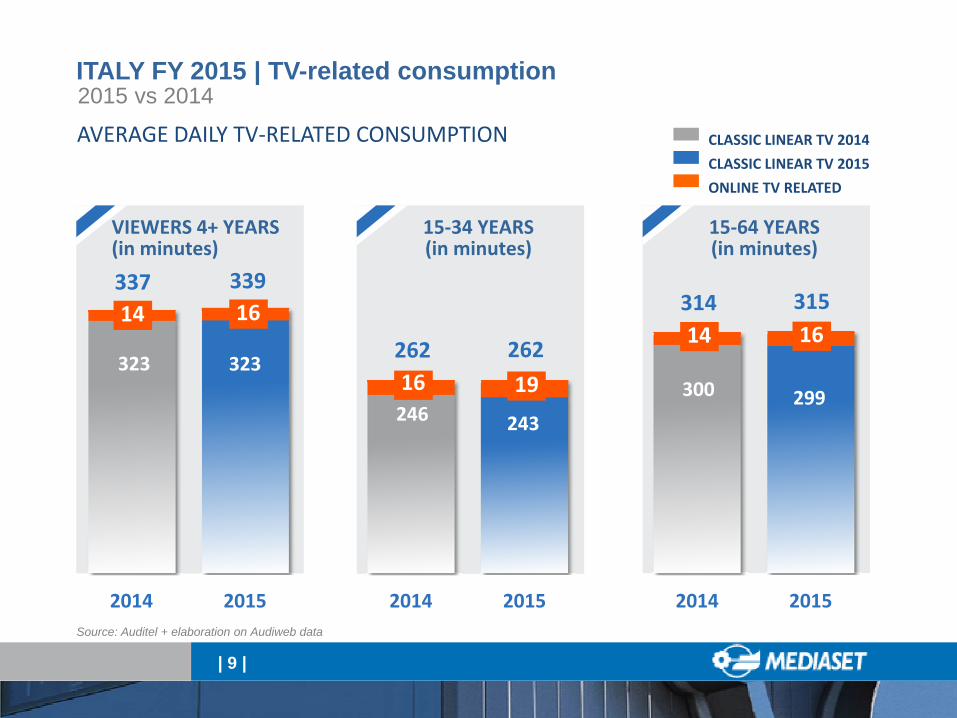
Source: Auditel + elaboration on Audiweb data
300 299
2014 2015
246 243
2014 2015
323 323
2014 2015
337
VIEWERS 4+ YEARS(in minutes)
15‐34 YEARS(in minutes)
15‐64 YEARS(in minutes)
339
262 2621916
161431531414 16
CLASSIC LINEAR TV 2014CLASSIC LINEAR TV 2015ONLINE TV RELATED
AVERAGE DAILY TV‐RELATED CONSUMPTION
ITALY FY 2015 | TV-related consumption2015 vs 2014
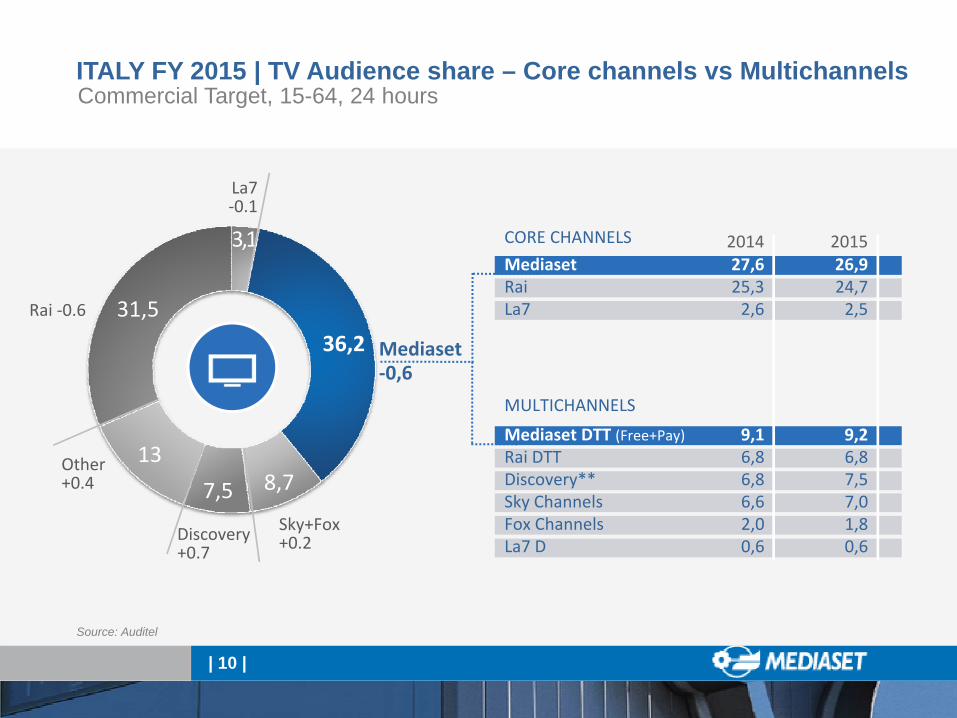
ITALY FY 2015 | TV Audience share – Core channels vs Multichannels
| 10 |
Source: Auditel
3,1
36,2
8,77,513
31,5
MediasetRaiLa7
27,625,32,6
26,924,72,5
Mediaset DTT (Free+Pay)Rai DTTDiscovery**Sky ChannelsFox ChannelsLa7 D
9,16,86,86,62,00,6
9,26,87,57,01,80,6
Sky+Fox+0.2
Mediaset ‐0,6
La7‐0.1
Rai ‐0.6
Other+0.4
Discovery+0.7
CORE CHANNELS
MULTICHANNELS
2014 2015
Commercial Target, 15-64, 24 hours
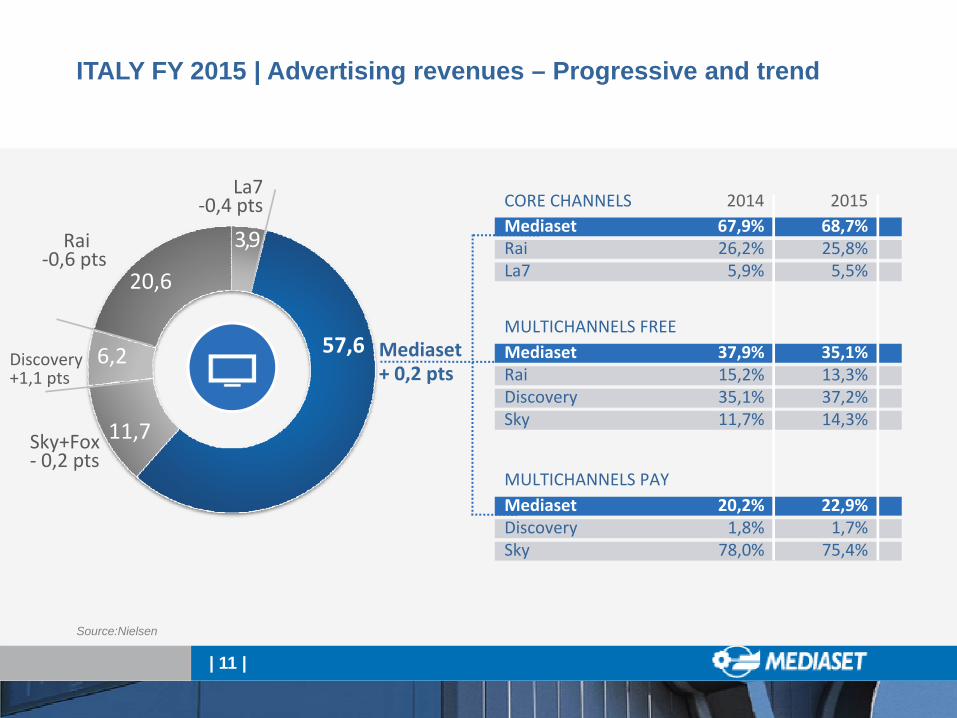
ITALY FY 2015 | Advertising revenues – Progressive and trend
| 11 |
Source:Nielsen
3,9
57,6
11,7
6,2
20,6
Sky+Fox‐ 0,2 pts
Mediaset+ 0,2 pts
La7‐0,4 pts
Rai‐0,6 pts
Discovery+1,1 pts
CORE CHANNELSMediasetRaiLa7
67,9%26,2%5,9%
68,7%25,8%5,5%
MediasetRai DiscoverySky
37,9%15,2%35,1%11,7%
35,1%13,3%37,2%14,3%
MULTICHANNELS FREE
MediasetDiscoverySky
20,2%1,8%78,0%
MULTICHANNELS PAY22,9%1,7%75,4%
2014 2015
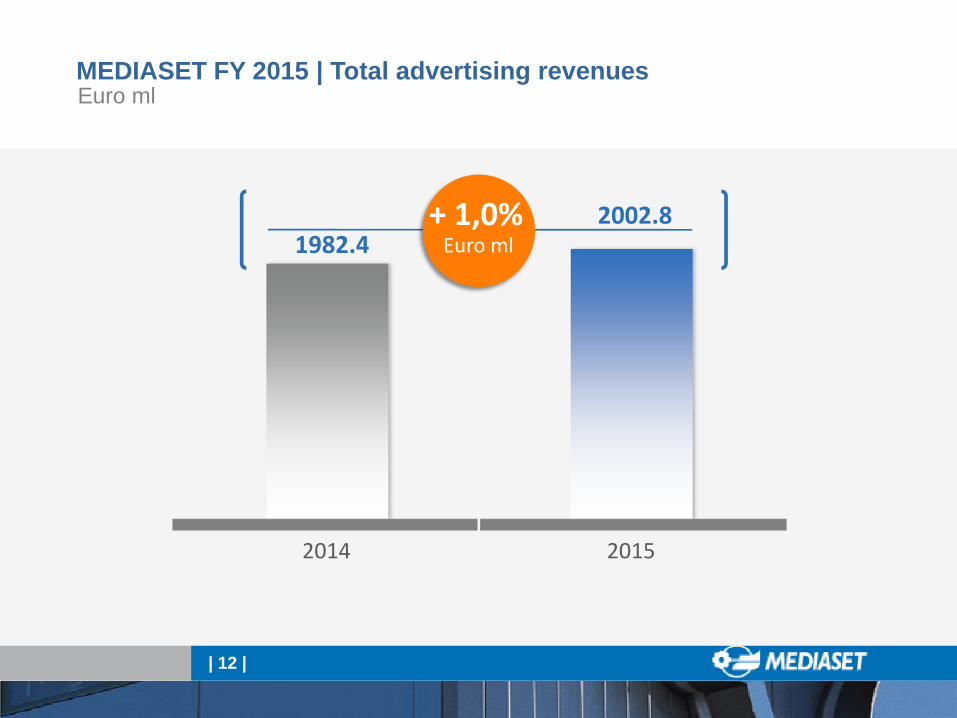
MEDIASET FY 2015 | Total advertising revenues
| 12 |
2014 2015
1982.42002.8+ 1,0%
Euro ml
Euro ml
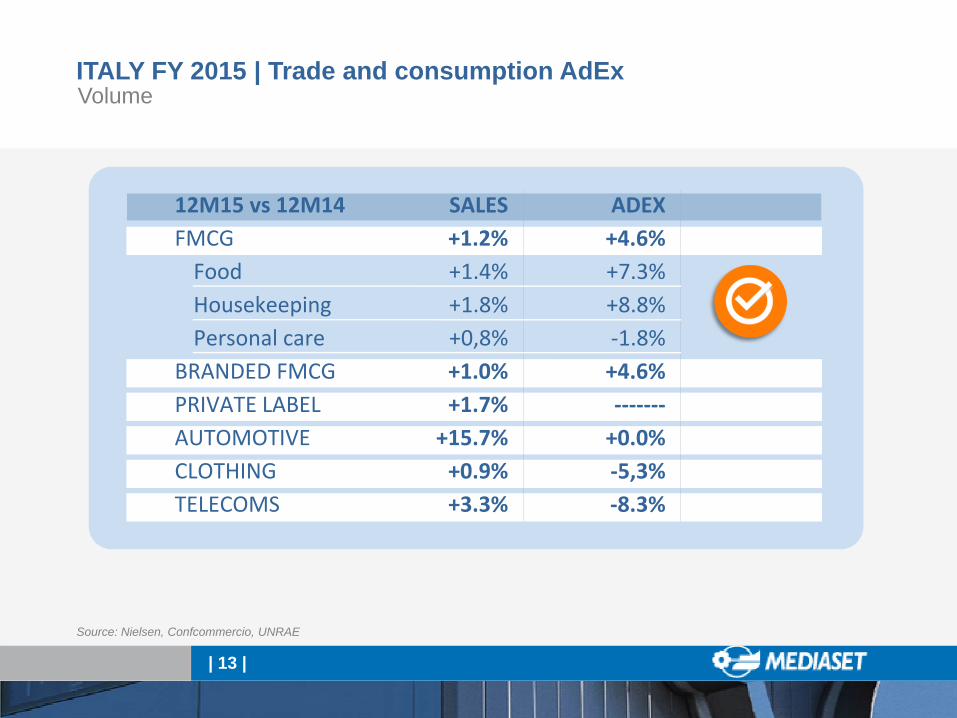
ITALY FY 2015 | Trade and consumption AdEx
| 13 |
Source: Nielsen, Confcommercio, UNRAE
12M15 vs 12M14FMCGFoodHousekeepingPersonal care
BRANDED FMCGPRIVATE LABELAUTOMOTIVECLOTHINGTELECOMS
SALES+1.2%+1.4%+1.8%+0,8%+1.0%+1.7%
+15.7%+0.9%+3.3%
ADEX+4.6%+7.3%+8.8%‐1.8%+4.6%‐‐‐‐‐‐‐+0.0%‐5,3%‐8.3%
Volume
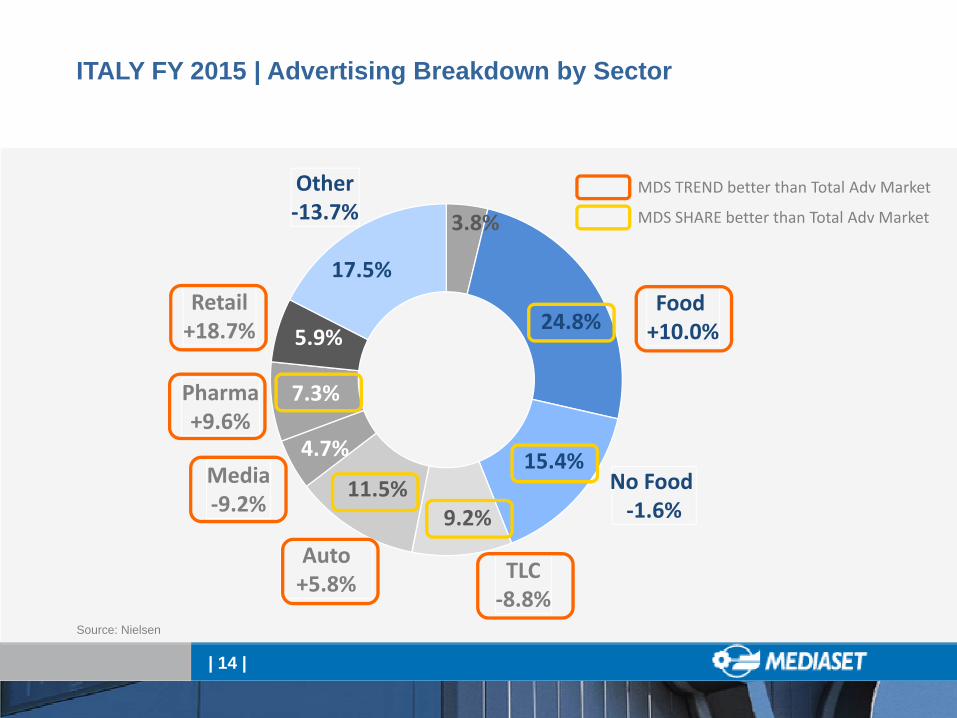
ITALY FY 2015 | Advertising Breakdown by Sector
| 14 |
Source: Nielsen
Food+10.0%
No Food‐1.6%
TLC‐8.8%
Auto+5.8%
Media‐9.2%
Pharma+9.6%
Retail+18.7%
Other‐13.7%
24.8%
11.5%9.2%
15.4%
3.8%
17.5%
5.9%
7.3%
4.7%
MDS TREND better than Total Adv Market
MDS SHARE better than Total Adv Market
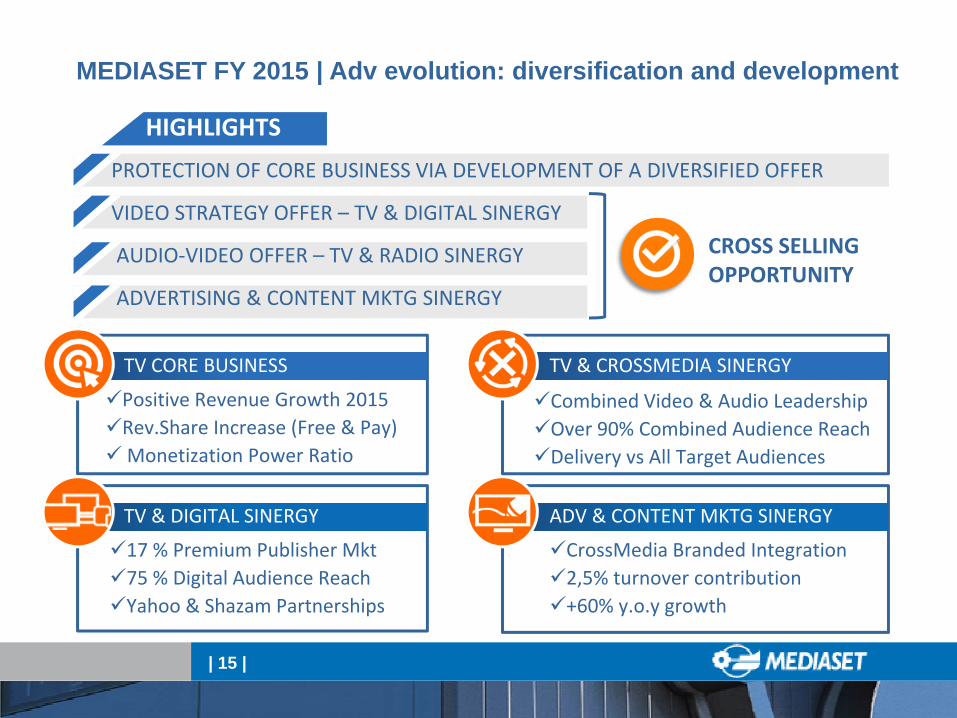
MEDIASET FY 2015 | Adv evolution: diversification and development
| 15 |
PROTECTION OF CORE BUSINESS VIA DEVELOPMENT OF A DIVERSIFIED OFFER
VIDEO STRATEGY OFFER – TV & DIGITAL SINERGY
AUDIO‐VIDEO OFFER – TV & RADIO SINERGY
ADVERTISING & CONTENT MKTG SINERGY
| 15 |
TV & CROSSMEDIA SINERGY
Combined Video & Audio LeadershipOver 90% Combined Audience ReachDelivery vs All Target Audiences
ADV & CONTENT MKTG SINERGY
CrossMedia Branded Integration2,5% turnover contribution+60% y.o.y growth
TV CORE BUSINESS
Positive Revenue Growth 2015Rev.Share Increase (Free & Pay)Monetization Power Ratio
TV & DIGITAL SINERGY
17 % Premium Publisher Mkt75 % Digital Audience ReachYahoo & Shazam Partnerships
HIGHLIGHTS
CROSS SELLING OPPORTUNITY

Financials
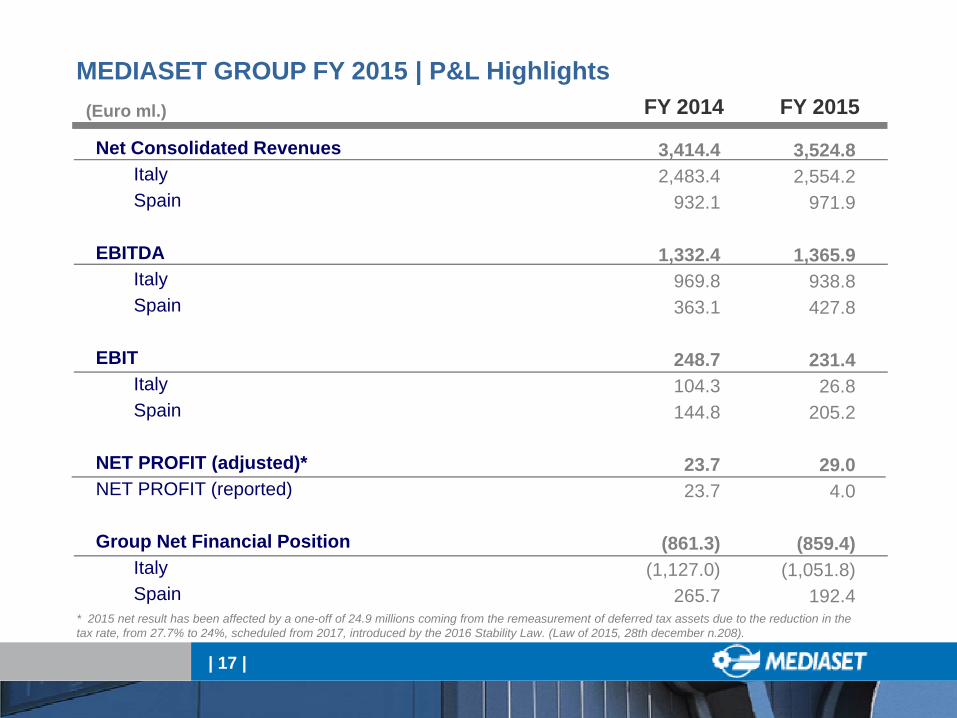
MEDIASET GROUP FY 2015 | P&L Highlights
Net Consolidated RevenuesItalySpain
EBITDAItalySpain
EBITItalySpain
NET PROFIT (adjusted)*NET PROFIT (reported)
Group Net Financial PositionItalySpain
(Euro ml.)
| 17 |
FY 2014
3,524.82,554.2
971.9
1,365.9938.8427.8
231.426.8
205.2
29.04.0
(859.4)(1,051.8)
192.4
FY 2015
3,414.42,483.4
932.1
1,332.4969.8363.1
248.7104.3144.8
23.723.7
(861.3)(1,127.0)
265.7* 2015 net result has been affected by a one-off of 24.9 millions coming from the remeasurement of deferred tax assets due to the reduction in the tax rate, from 27.7% to 24%, scheduled from 2017, introduced by the 2016 Stability Law. (Law of 2015, 28th december n.208).
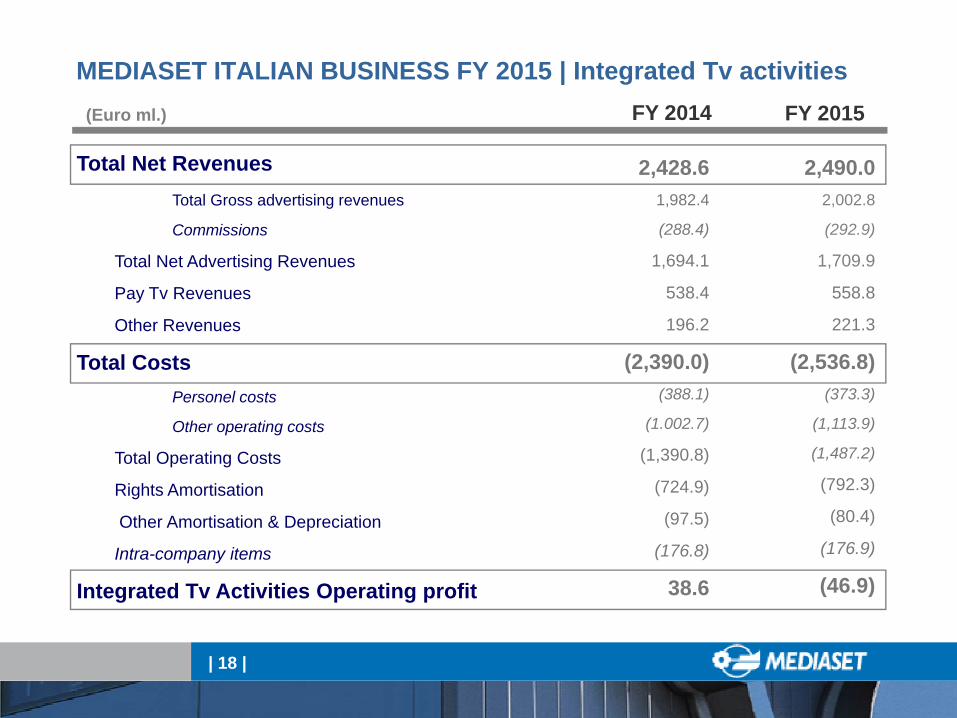
Total Net RevenuesTotal Gross advertising revenues
Commissions
Total Net Advertising Revenues
Pay Tv Revenues
Other Revenues
Total CostsPersonel costs
Other operating costs
Total Operating Costs
Rights Amortisation
Other Amortisation & Depreciation
Intra-company items
Integrated Tv Activities Operating profit
MEDIASET ITALIAN BUSINESS FY 2015 | Integrated Tv activities
| 18 |
FY 2015FY 2014(Euro ml.)
2,428.61,982.4
(288.4)
1,694.1
538.4
196.2
(2,390.0)(388.1)
(1.002.7)
(1,390.8)
(724.9)
(97.5)
(176.8)
38.6
2,490.02,002.8
(292.9)
1,709.9
558.8
221.3
(2,536.8)(373.3)
(1,113.9)
(1,487.2)
(792.3)
(80.4)
(176.9)
(46.9)
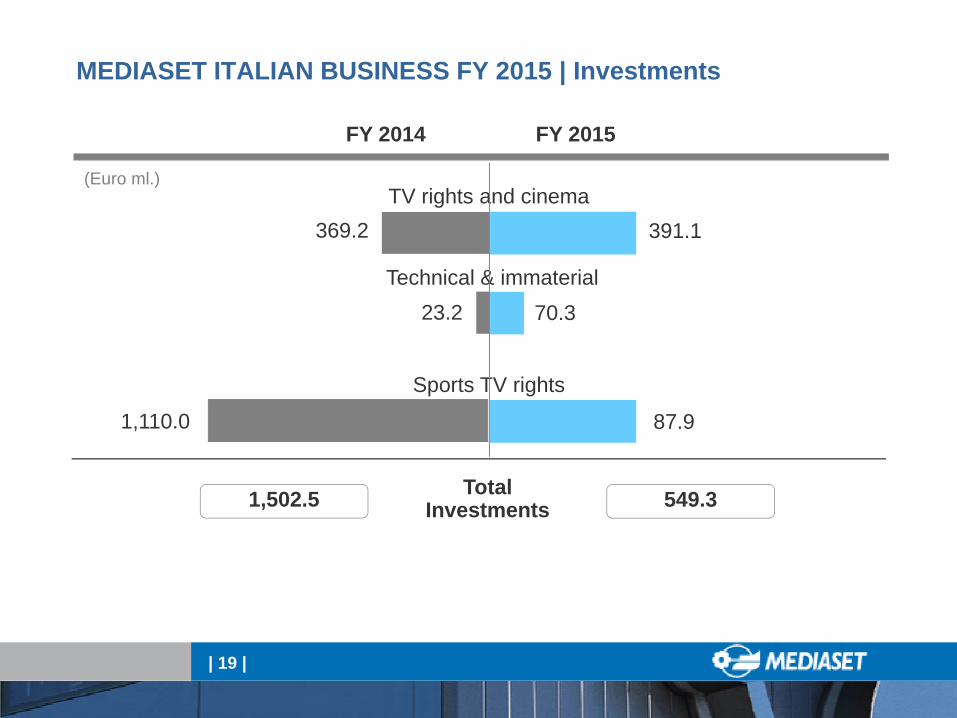
MEDIASET ITALIAN BUSINESS FY 2015 | Investments
| 19 |
369.2
23.2
(Euro ml.) TV rights and cinema
Technical & immaterial
FY 2015FY 2014
391.1
70.3
Total Investments 549.31,502.5
Sports TV rights
1,110.0 87.9
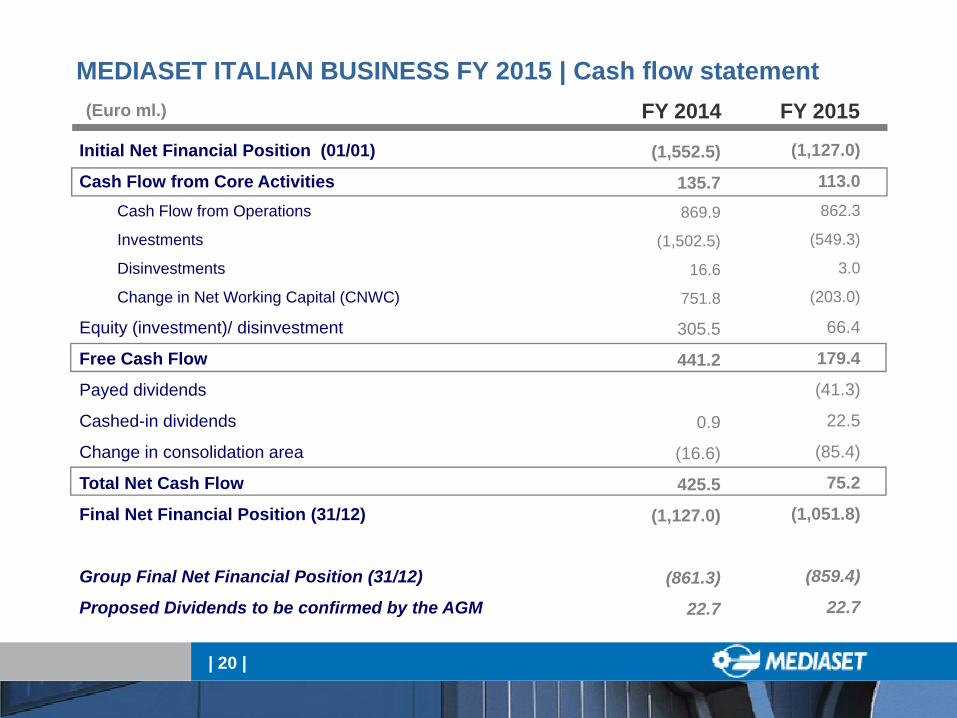
MEDIASET ITALIAN BUSINESS FY 2015 | Cash flow statement
| 20 |
Initial Net Financial Position (01/01)
Cash Flow from Core ActivitiesCash Flow from Operations
Investments
Disinvestments
Change in Net Working Capital (CNWC)
Equity (investment)/ disinvestment
Free Cash Flow
Payed dividends
Cashed-in dividends
Change in consolidation area
Total Net Cash Flow
Final Net Financial Position (31/12)
Group Final Net Financial Position (31/12)
Proposed Dividends to be confirmed by the AGM
(Euro ml.)
(1,127.0)
113.0862.3
(549.3)
3.0
(203.0)
66.4
179.4
(41.3)
22.5
(85.4)
75.2
(1,051.8)
(859.4)
22.7
FY 2014 FY 2015
(1,552.5)
135.7869.9
(1,502.5)
16.6
751.8
305.5
441.2
0.9
(16.6)
425.5
(1,127.0)
(861.3)
22.7

Back up
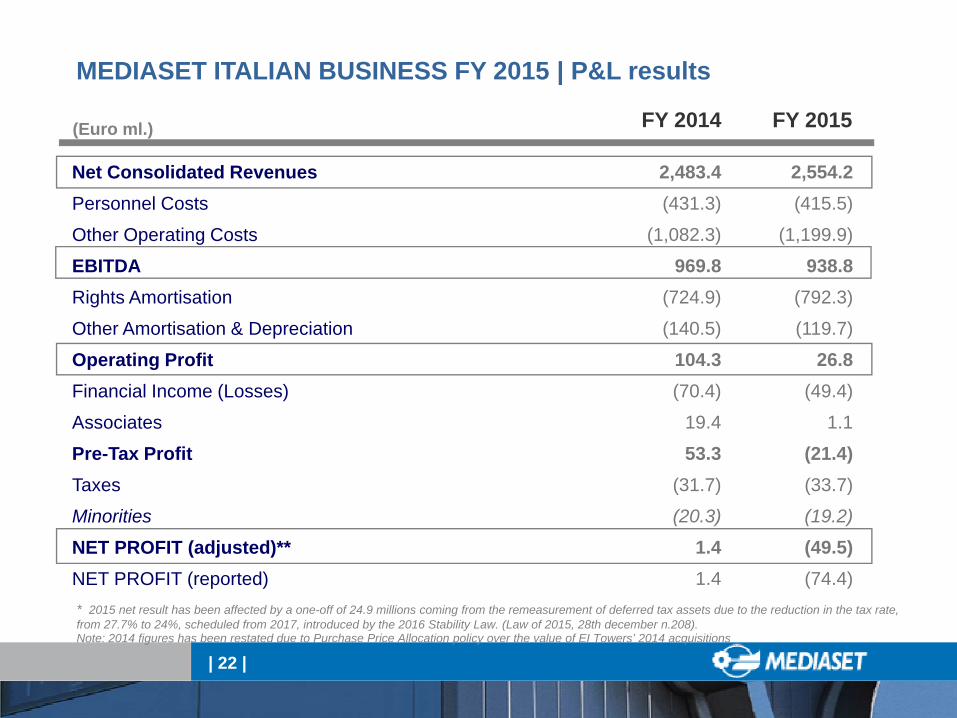
MEDIASET ITALIAN BUSINESS FY 2015 | P&L results
Net Consolidated RevenuesPersonnel Costs
Other Operating Costs
EBITDARights Amortisation
Other Amortisation & Depreciation
Operating ProfitFinancial Income (Losses)
Associates
Pre-Tax ProfitTaxes
Minorities
NET PROFIT (adjusted)**NET PROFIT (reported)
| 22 |
(Euro ml.)
2,554.2(415.5)
(1,199.9)
938.8(792.3)
(119.7)
26.8(49.4)
1.1
(21.4)(33.7)
(19.2)
(49.5)(74.4)
FY 2014 FY 2015
2,483.4(431.3)
(1,082.3)
969.8(724.9)
(140.5)
104.3(70.4)
19.4
53.3(31.7)
(20.3)
1.41.4
Note: 2014 figures has been restated due to Purchase Price Allocation policy over the value of EI Towers’ 2014 acquisitions
* 2015 net result has been affected by a one-off of 24.9 millions coming from the remeasurement of deferred tax assets due to the reduction in the tax rate, from 27.7% to 24%, scheduled from 2017, introduced by the 2016 Stability Law. (Law of 2015, 28th december n.208).
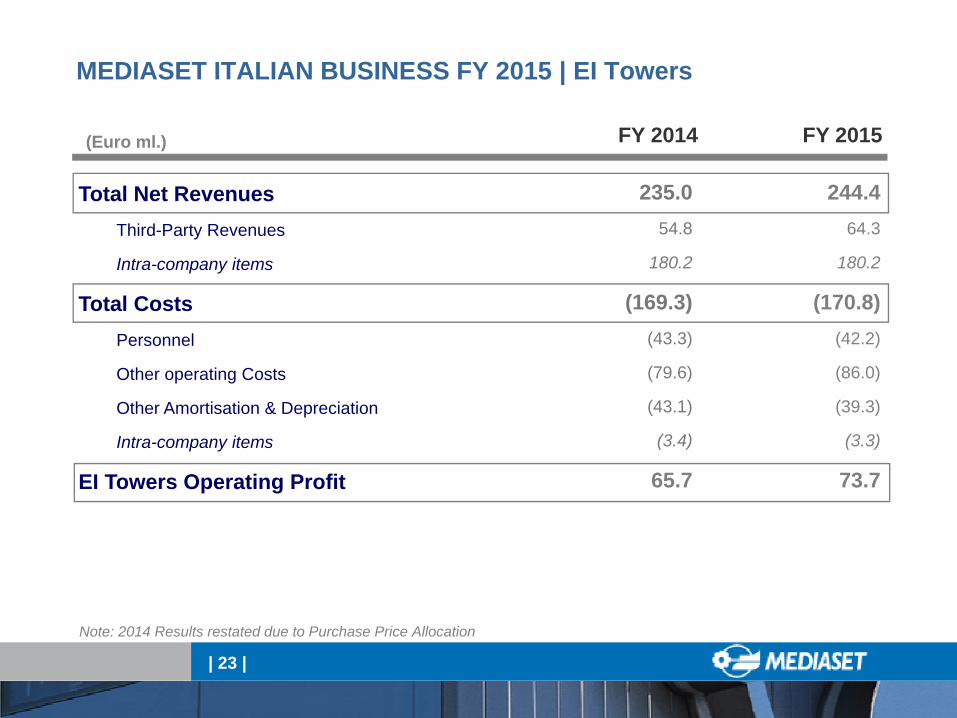
Total Net RevenuesThird-Party Revenues
Intra-company items
Total CostsPersonnel
Other operating Costs
Other Amortisation & Depreciation
Intra-company items
EI Towers Operating Profit
(Euro ml.)
MEDIASET ITALIAN BUSINESS FY 2015 | EI Towers
| 23 |
244.464.3
180.2
(170.8)(42.2)
(86.0)
(39.3)
(3.3)
73.7
FY 2014 FY 2015
235.054.8
180.2
(169.3)(43.3)
(79.6)
(43.1)
(3.4)
65.7
Note: 2014 Results restated due to Purchase Price Allocation
| 24 |
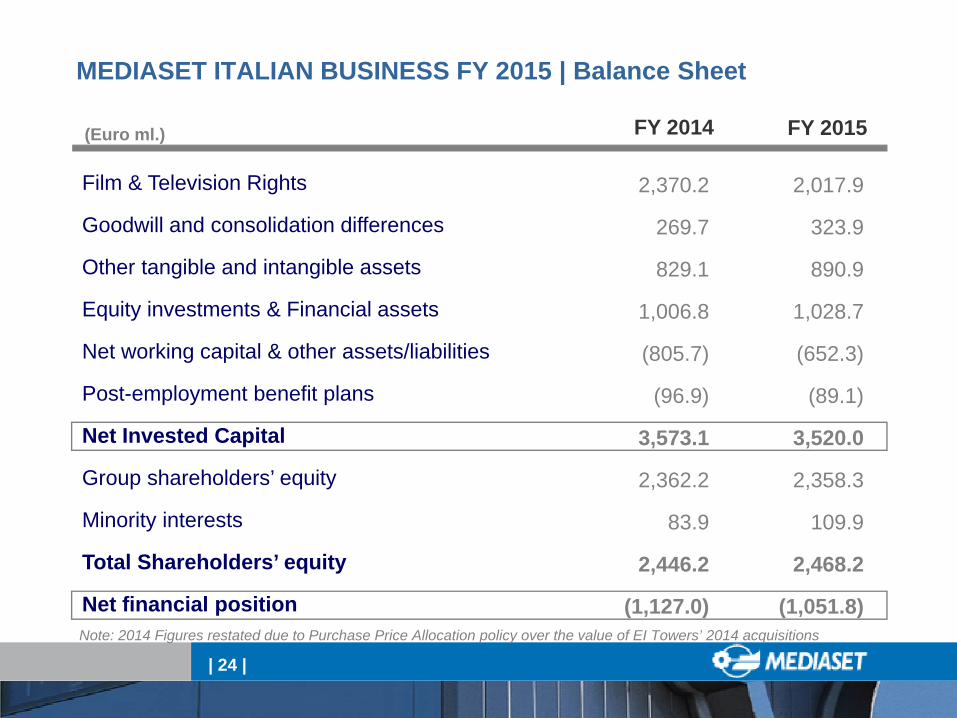
MEDIASET ITALIAN BUSINESS FY 2015 | Balance Sheet
2,370.2
269.7
829.1
1,006.8
(805.7)
(96.9)
3,573.1
2,362.2
83.9
2,446.2
(1,127.0)
FY 2014(Euro ml.)
2,017.9
323.9
890.9
1,028.7
(652.3)
(89.1)
3,520.0
2,358.3
109.9
2,468.2
(1,051.8)
FY 2015
Film & Television Rights
Goodwill and consolidation differences
Other tangible and intangible assets
Equity investments & Financial assets
Net working capital & other assets/liabilities
Post-employment benefit plans
Net Invested Capital
Group shareholders’ equity
Minority interests
Total Shareholders’ equity
Net financial positionNote: 2014 Figures restated due to Purchase Price Allocation policy over the value of EI Towers’ 2014 acquisitions

MEDIASET SPANISH BUSINESS | Back up Slides
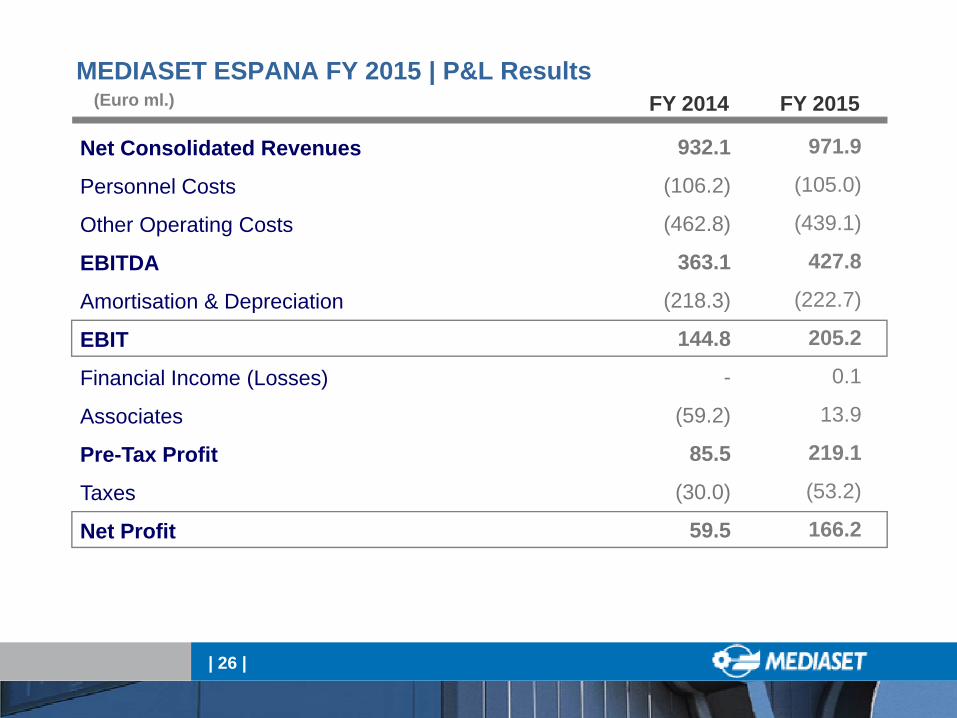
MEDIASET ESPANA FY 2015 | P&L Results
| 26 |
Net Consolidated Revenues
Personnel Costs
Other Operating Costs
EBITDA
Amortisation & Depreciation
EBIT
Financial Income (Losses)
Associates
Pre-Tax Profit
Taxes
Net Profit
(Euro ml.)
971.9
(105.0)
(439.1)
427.8
(222.7)
205.2
0.1
13.9
219.1
(53.2)
166.2
FY 2014 FY 2015
932.1
(106.2)
(462.8)
363.1
(218.3)
144.8
-
(59.2)
85.5
(30.0)
59.5
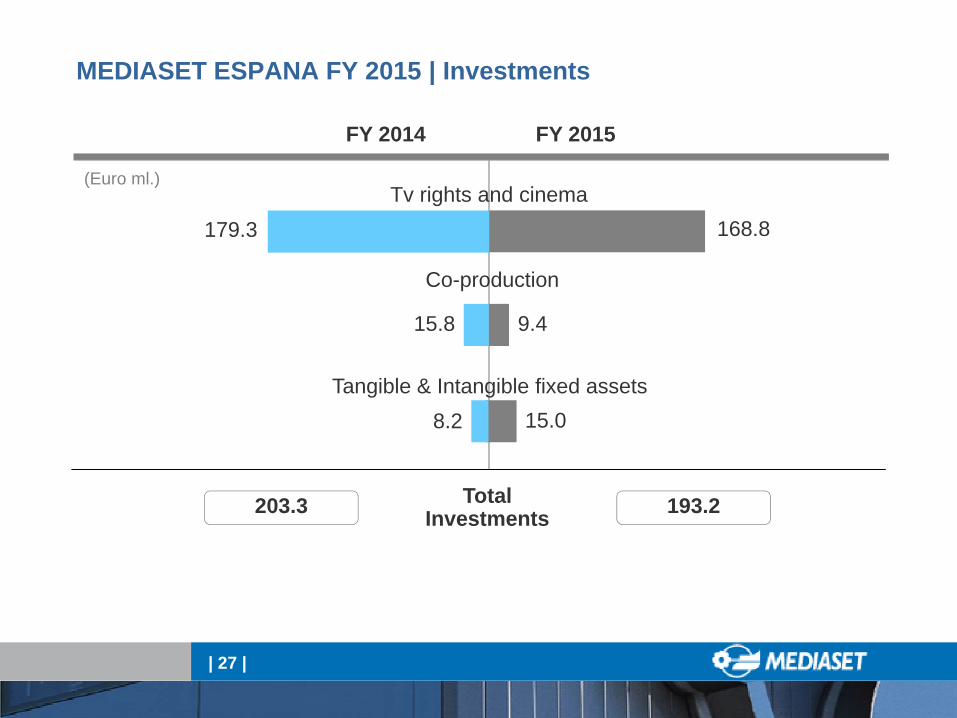
MEDIASET ESPANA FY 2015 | Investments
| 27 |
179.3 168.8
9.4
(Euro ml.) Tv rights and cinema
Co-production
Total Investments203.3 193.2
FY 2015FY 2014
15.08.2Tangible & Intangible fixed assets
15.8
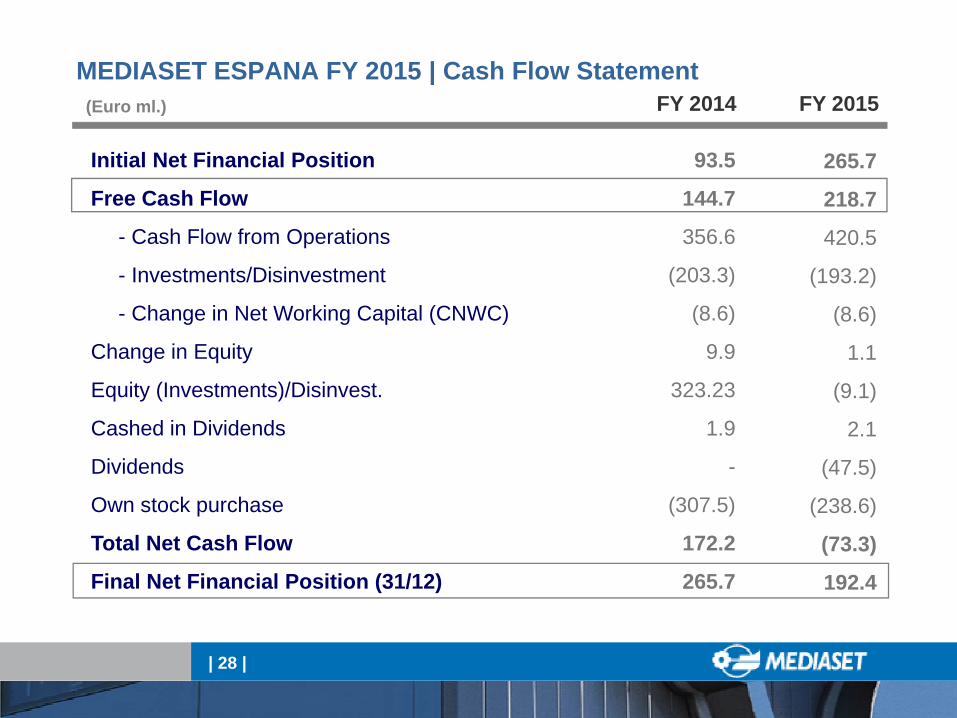
MEDIASET ESPANA FY 2015 | Cash Flow Statement
| 28 |
Initial Net Financial Position
Free Cash Flow
- Cash Flow from Operations
- Investments/Disinvestment
- Change in Net Working Capital (CNWC)
Change in Equity
Equity (Investments)/Disinvest.
Cashed in Dividends
Dividends
Own stock purchase
Total Net Cash Flow
Final Net Financial Position (31/12)
(Euro ml.)
265.7
218.7
420.5
(193.2)
(8.6)
1.1
(9.1)
2.1
(47.5)
(238.6)
(73.3)
192.4
FY 2014 FY 2015
93.5
144.7
356.6
(203.3)
(8.6)
9.9
323.23
1.9
-
(307.5)
172.2
265.7
| 29 |
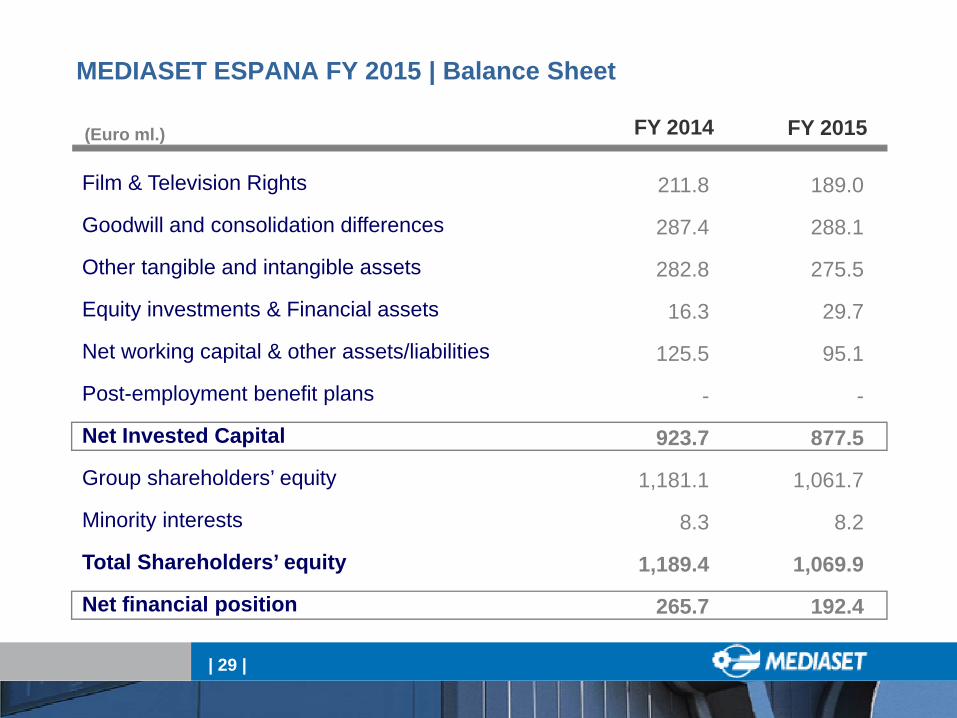
MEDIASET ESPANA FY 2015 | Balance Sheet
211.8
287.4
282.8
16.3
125.5
-
923.7
1,181.1
8.3
1,189.4
265.7
FY 2014(Euro ml.)
189.0
288.1
275.5
29.7
95.1
-
877.5
1,061.7
8.2
1,069.9
192.4
FY 2015
Film & Television Rights
Goodwill and consolidation differences
Other tangible and intangible assets
Equity investments & Financial assets
Net working capital & other assets/liabilities
Post-employment benefit plans
Net Invested Capital
Group shareholders’ equity
Minority interests
Total Shareholders’ equity
Net financial position
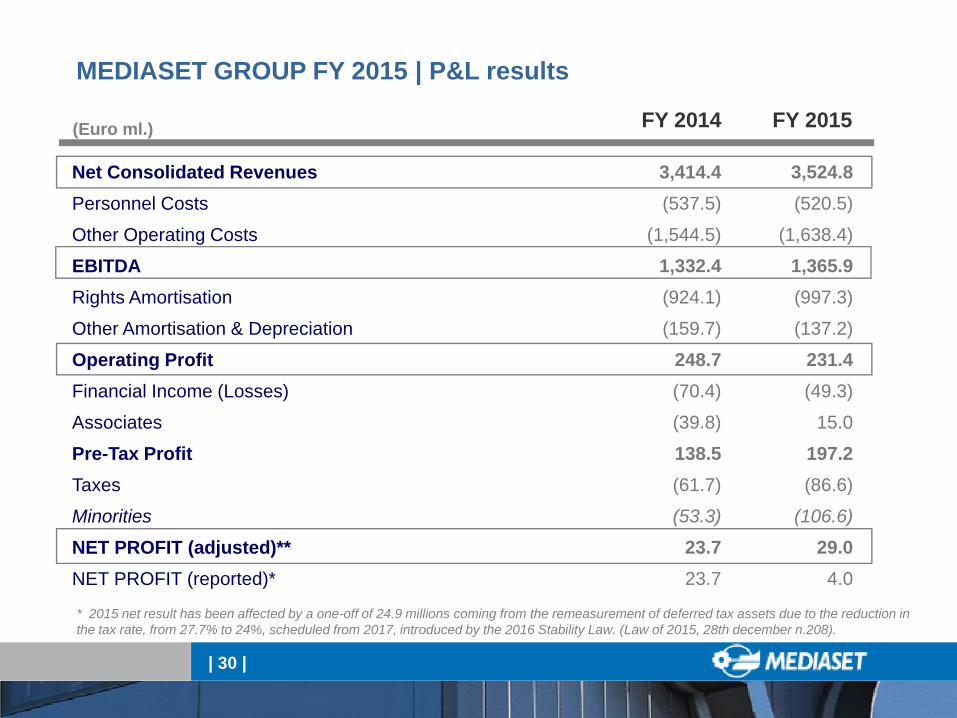
MEDIASET GROUP FY 2015 | P&L results
Net Consolidated RevenuesPersonnel Costs
Other Operating Costs
EBITDARights Amortisation
Other Amortisation & Depreciation
Operating ProfitFinancial Income (Losses)
Associates
Pre-Tax ProfitTaxes
Minorities
NET PROFIT (adjusted)**NET PROFIT (reported)*
| 30 |
(Euro ml.)
3,524.8(520.5)
(1,638.4)
1,365.9(997.3)
(137.2)
231.4(49.3)
15.0
197.2(86.6)
(106.6)
29.04.0
FY 2014 FY 2015
3,414.4(537.5)
(1,544.5)
1,332.4(924.1)
(159.7)
248.7(70.4)
(39.8)
138.5(61.7)
(53.3)
23.723.7
* 2015 net result has been affected by a one-off of 24.9 millions coming from the remeasurement of deferred tax assets due to the reduction in the tax rate, from 27.7% to 24%, scheduled from 2017, introduced by the 2016 Stability Law. (Law of 2015, 28th december n.208).
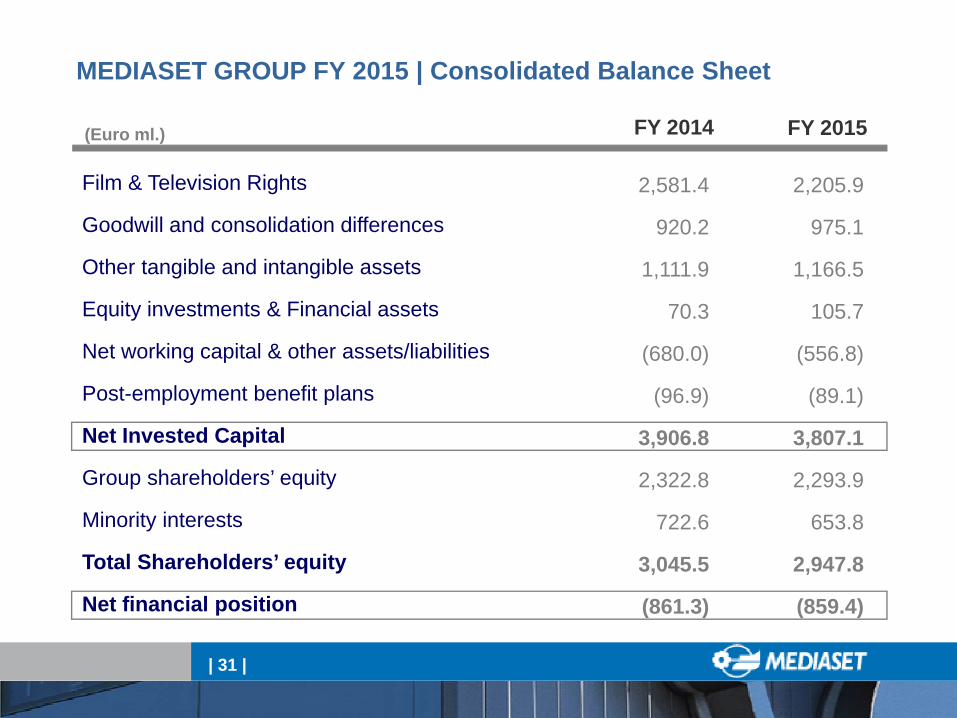
| 31 |
2,581.4
920.2
1,111.9
70.3
(680.0)
(96.9)
3,906.8
2,322.8
722.6
3,045.5
(861.3)
Film & Television Rights
Goodwill and consolidation differences
Other tangible and intangible assets
Equity investments & Financial assets
Net working capital & other assets/liabilities
Post-employment benefit plans
Net Invested Capital
Group shareholders’ equity
Minority interests
Total Shareholders’ equity
Net financial position
FY 2014(Euro ml.)
MEDIASET GROUP FY 2015 | Consolidated Balance Sheet
2,205.9
975.1
1,166.5
105.7
(556.8)
(89.1)
3,807.1
2,293.9
653.8
2,947.8
(859.4)
FY 2015
Forward-looking StatementsStatements contained in this document, particularly the ones regarding any Mediaset Grouppossible or assumed future performance, are or may be forward looking statements and inthis respect they involve some risks and uncertainties.
Mediaset Group actual results and developments may differ materially from the onesexpressed or implied by the above statements depending on a variety of factors.
Any reference to past performance of Mediaset Group shall not be taken as an indication offuture performance.
This announcement does not constitute an offer to sell or the solicitation of an offer to buythe securities discussed herein.
The executive responsible for the preparation of the Mediaset S.p.A. accounts, LucaMarconcini, declares that, as per para. 2 art. 154-bis, of the “Testo Unico della Finanza”, thatthe accounting information contained in this document corresponds to that contained in thecompany’s books.
Investor Relations Department:
Tel: +39 02 2514.7008Fax: +39 02 2514.6719Email: [email protected]: www.mediaset.it/investor