2012年3月期 第1四半期決算説明会資料Title...
16
2011年8月1日 2012年3月期 2012年3月期 第1四半期決算説明会資料 四半期決算説明会資料 第1四半期決算説明会資料 四半期決算説明会資料 Presentation on Financial Results Presentation on Financial Results Presentation on Financial Results Presentation on Financial Results for for the the First First Three Three Months of Months of the Fiscal the Fiscal Year Ending March 31, 2012 Year Ending March 31, 2012 the Fiscal the Fiscal Year Ending March 31, 2012 Year Ending March 31, 2012 Copyright 2011 NSD CO., LTD. V1.0
Transcript of 2012年3月期 第1四半期決算説明会資料Title...
2011年8月1日
2012年3月期2012年3月期
第第11四半期決算説明会資料四半期決算説明会資料第第11四半期決算説明会資料四半期決算説明会資料Presentation on Financial ResultsPresentation on Financial ResultsPresentation on Financial Results Presentation on Financial Results
for for the the First First Three Three Months of Months of the Fiscalthe Fiscal Year Ending March 31, 2012Year Ending March 31, 2012the Fiscal the Fiscal Year Ending March 31, 2012Year Ending March 31, 2012
Copyright 2011 NSD CO., LTD.V1.0

目次目次
ページ
2012年3月期第1四半期連結累計期間 決算の概況 3
連結 業績の概要 第1四半期(4~6月) 5
連結 セグメント別売上高と売上総利益 第1四半期(4~6月) 6
連結 (参考)業績の実績と予想 7
単独 業績の概要 第1四半期(4~6月) 8
単独 セグメント別売上高と売上総利益 第1四半期(4~6月) 9
単独 (参考)業績の実績と予想 10単独 (参考)業績の実績と予想 10
単独 業種別売上高 (ソフトウエア開発・コンピュータ室運営管理) 第1四半期(4~6月) 11
単独 金融業業態別売上高 (ソフトウエア開発・コンピュータ室運営管理) 第1四半期(4~6月) 12
単独 ソフトウエア開発受注動向 13
単独 製造費用とセグメント別外注費比率 14
会社概要 15会社概要
※ この資料において、表示単位未満の金額は全て切り捨てて処理しております。
また、パーセントで表示してある数値は全て四捨五入しております。
Copyright 2011 1
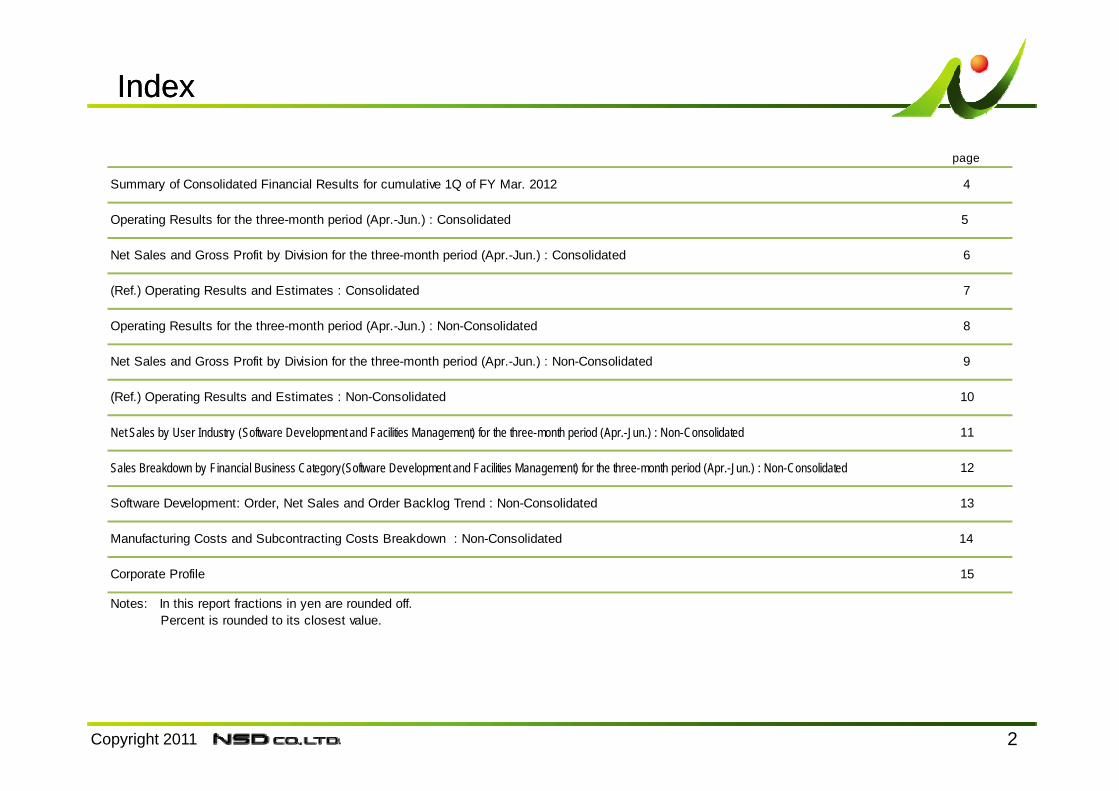
IndexIndex
page
Summary of Consolidated Financial Results for cumulative 1Q of FY Mar. 2012 4
Operating Results for the three-month period (Apr.-Jun.) : Consolidated 5
Net Sales and Gross Profit by Division for the three-month period (Apr.-Jun.) : Consolidated 6
(Ref.) Operating Results and Estimates : Consolidated 7
Operating Results for the three-month period (Apr.-Jun.) : Non-Consolidated 8
Net Sales and Gross Profit by Division for the three-month period (Apr.-Jun.) : Non-Consolidated 9
(Ref ) Operating Results and Estimates : Non Consolidated 10(Ref.) Operating Results and Estimates : Non-Consolidated 10
Net Sales by User Industry (Software Development and Facilities Management) for the three-month period (Apr.-Jun.) : Non-Consolidated 11
Sales Breakdown by Financial Business Category(Software Development and Facilities Management) for the three-month period (Apr.-Jun.) : Non-Consolidated 12
Software Development: Order, Net Sales and Order Backlog Trend : Non-Consolidated 13
Manufacturing Costs and Subcontracting Costs Breakdown : Non-Consolidated 14
Corporate Profile 15p
Notes: In this report fractions in yen are rounded off. Percent is rounded to its closest value.
Copyright 2011 2

20122012年年33月期月期 第第11四半期連結累計期間四半期連結累計期間 決算の概況決算の概況
当第1四半期におけるわが国経済は、東日本大震災により多大な影響を受けた生産活動については当初の予想を上回る回復が見られたものの、
電力供給の不安や収束時期がみえない原発問題等により、依然として先行き不透明な状況にあります。
情報サービス産業では、ハードやデータセンター等一部の分野では需要が出てきたものの、企業のIT投資全般では依然として慎重姿勢が続いてお
り、厳しい経営環境が続きました。
このような状況のもと、当社グループは積極的な受注活動と新規事業の推進、プロジェクトマネジメントの徹底及びコストの削減等により、収益性の
確保に努めてまいりました。
その結果 売上高に きましては 取扱い製品の見直しによるソフトウ アプロダクト事業の減収要因はあ たものの 情報サ ビス事業の売上がその結果、売上高につきましては、取扱い製品の見直しによるソフトウエアプロダクト事業の減収要因はあったものの、情報サービス事業の売上が
順調に推移したことから、若干の増収となりました。利益面につきましては、一部のプロジェクトで採算が悪化した影響等により減益となりました。
当社グループの業績の概要、またセグメント別の業績は下の表1、表2のとおりとなりました。
なお、連結子会社の株式会社FSK及び株式会社ディ・アクセスにつきましては、東日本大震災の影響により減収減益となりました。また2011年3月
表1. 連結決算 表2. セグメント別連結売上高
期では、震災の影響による特別損失を計上しましたが、当第1四半期では前期に検収を受けることが出来なかった売上及び利益を計上しております。
百万円百万円(構成比) (構成比の変化)
売上高実績 前年同期比
93.8% 0.0%7,869 0.7%
90.5% 2.5%7 593 3 6%
―
金融業のシステム統合案件が概ね順調に推移情報サービス
システムソリュー
ションサービス
概要(利益率)
1Q実績 前年同期比
売上高 % of sales % of sales8,386 +0.7% 36,000
営業利益 8 2% 10 3%
2012/3
通期予想
7,593 3.6%3.3% 2.5%
275 42.6%4.9% 0.2%
407 2.5%1.3% 0.1%
108 13 8%不動産賃貸 元社員寮などの自社所有物件の戸数増と入居率向上
取扱い製品の見直しに伴う影響により減収
企業の雇用過剰感が続いていることにより人材派遣に
対するニーズは回復せず
ソフトウエア
プロダクト
人材派遣
営業利益 8.2% 10.3%689 22.4% 3,700
経常利益 10.4% 10.8%868 12.4% 3,900
純利益 4.3% 6.1%359 32 8% 2 200
Copyright 2011 3
108 13.8%不動産賃貸 元社員寮などの自社所有物件の戸数増と入居率向上359 32.8% 2,200

Summary of Consolidated Financial Results for cumulative 1Q of FY Mar. 2012Summary of Consolidated Financial Results for cumulative 1Q of FY Mar. 2012
During the first quarter of the Fiscal Year ending March 2012(from April 1, 2011 through June 30, 2011), although the Japanese economy has recovered faster than initially expected in terms of production activities which were devastated by the Great East Japan Earthquake, the business outlook has still remained unpredictable due to the apprehension of power supply shortage, the lingering nuclear complication for which no immediate settlement is in sight, and so on.
I th i f ti i i d t i lth h d d i d i t i t h h d d d t tIn the information services industries, although some demand increased in a certain segment such as hardware and data centers, many companies have still kept very cautious attitude toward IT investment in general , and the harsh business environment has persisted.
Under these circumstances, NSD group, has exerted every effort to maximize profit by engaging in positive sales activities, developing new business, implementing thorough project management, and reducing costs.
As a result, the net sales have increased slightly thanks to steady sales in information services division despite some decrease inAs a result, the net sales have increased slightly thanks to steady sales in information services division despite some decrease in software product division due to rearrangement of the product line. However the net profit has decreased year-on-year due to the impact of deteriorated profitability of some projects.
Operating results of NSD group and by division are shown in the Table-1 and Table-2 below.
Please also note that FSK CO., LTD., and D. Access, our consolidated subsidiaries, have sustained decreased net sales and profits d t th i t f th G t E t J E th k Whil th l d b th th k l d i l d d t di
Table-1. Consolidated Financial Results Table-2. Consolidated Net Sales by Division
due to the impact of the Great East Japan Earthquake. While the loss caused by the earthquake was already included as an extraordinary loss in the FY March 2011 results, the sales and the profits of orders of which acceptance inspection had not been conducted are included in the first quarter results of FY March 2012.
millions of yen(Margin) forecast of
millions of yen(% of total) YoY (%)
R f i d(Margin)Results
% of sales % of sales8,386 0.7% 36,000
8.2% 10.3%
YoY (%)forecast of
FY Mar. 2012
Operating
Net Sales
Sales Results93.8% 0.0%
7,869 0.7%90.5% 2.5%
7,593 3.6%Information
ServicesIn general, improved by order from some integrating projects inthe finance sector.
of total of Net Sales
Reasons for increase or decrease
System SolutionServices ―
8.2% 10.3%689 22.4% 3,700
10.4% 10.8%868 12.4% 3,900
4.3% 6.1%
OperatingIncome
Ordinary Income
Net Income
3.3% 2.5%275 42.6%
4.9% 0.2%407 2.5%
1.3% 0.1%
Staffing ServicesDecreased because the needs for staffing services have notrecovered due to the corporate sentiments of excessive
l tReal Estate
Increased thanks to the improved occupancy rate and theincrease of own-possessed houses to rent such as former
SoftwareProducts
Decreased by the impact from rearrangement of our product line
Copyright 2011 4
359 32.8% 2,200Net Income
108 13.8%Servicesincrease of own-possessed houses to rent such as formeremployee-dormitories

連結連結 業績の概要業績の概要 第第11四半期(四半期(44~~66月)月)Operating Results for the ThreeOperating Results for the Three--month Period (Apr.month Period (Apr.--Jun.) : ConsolidatedJun.) : Consolidated
百万円 illi f百万円 millions of yen
ResultsIncrease orDecrease YoY (%)
% of sales % of sales % of sales
2010/62011/6
売上高N S l
2009/6
8,000
12,000売上高 Net Sales
9,153 8,325 8,386 60 0.7%
79.1% 80.5% 83.2%
7,237 6,702 6,981 278 4.2%
20.9% 19.5% 16.8%
Net Sales
売上原価Cost of Sales
売上総利益
0
4,000
2009/6 2010/6 2011/6
1,915 1,623 1,404 218 13.5%
9.1% 8.8% 8.5%
836 734 715 19 2.6%
売上総利益Gross Profit
販売費及び一般管理費
SG & A Expenses
2009/6 2010/6 2011/6
20%
30%
2 000
3,000
売上総利益
Gross Profit
売上総利益率Gross Profit Margin
20%
30%
2 000
3,000
営業利益
Operating Income
11.8% 10.7% 8.2%
1,078 888 689 199 22.4%
12.4% 11.9% 10.4%
1 135 992 868 123 12 4%経常利益
Ordinary Income
営業利益Operating Income
0%
10%
20%
0
1,000
2,000
10%
20%
1,000
2,000
営業利益率Operating Income Margin
1,135 992 868 123 12.4%
0.4% 0.2% 0.0%
35 19 0 19 99.7%
0.2% 0.1% 0.6%
y
特別利益Extraordinary Gains
特別損失Extraordinary
0%0
2009/6 2010/6 2011/6
0%0
2009/6 2010/6 2011/6
30%3,000
経常利益
Ordinary Income30%3,000
四半期純利益
Quarterly Net Income
13 10 47 36 353.9%
12.6% 12.0% 9.8%
1,157 1,001 821 179 18.0%
7 1% 6 4% 4 3%
ExtraordinaryLosses
税金等調整前
四半期純利益Quarterly Income
before Tax
四半期純利益
10%
20%
1,000
2,000
経常利益率Ordinary Income Margin
10%
20%
1,000
2,000
四半期純利益率Quarterly Net Income Margin
Copyright 2011 5
7.1% 6.4% 4.3%
648 535 359 175 32.8%
四半期純利益Quarterly Net
Income0%0
2009/6 2010/6 2011/6
0%0
2009/6 2010/6 2011/6
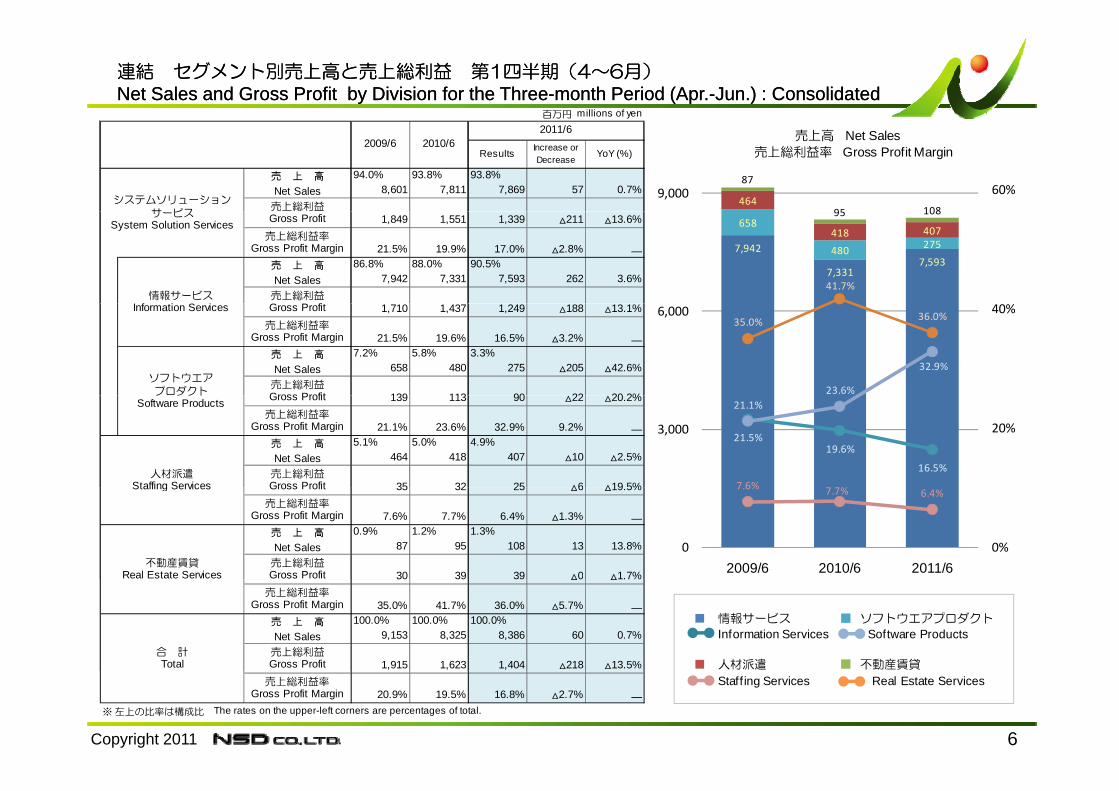
連結連結 セグメント別売上高と売上総利益セグメント別売上高と売上総利益 第第11四半期(四半期(44~~66月)月)Net Sales and Gross Profit by Division for the ThreeNet Sales and Gross Profit by Division for the Three--month Period (Apr.month Period (Apr.--Jun.) : ConsolidatedJun.) : Consolidated
百万円 millions of yen
Results Increase orDecrease YoY (%)
94.0% 93.8% 93.8%8,601 7,811 7,869 57 0.7%
2011/6
システムソリューションサ ビス
売 上 高Net Sales売上総利益
2010/62009/6
464
87
95 108
60%9,000
売上高 Net Sales売上総利益率 Gross Profit Margin
1,849 1,551 1,339 211 13.6%
21.5% 19.9% 17.0% 2.8% ―86.8% 88.0% 90.5%
7,942 7,331 7,593 262 3.6%
サービスSystem Solution Services Gross Profit
売上総利益率Gross Profit Margin
情報サービスI f i S i
売 上 高Net Sales売上総利益G P fi
7,942
7,3317,593
658
480 275418 407
95 108
41.7%
1,710 1,437 1,249 188 13.1%
21.5% 19.6% 16.5% 3.2% ―7.2% 5.8% 3.3%
658 480 275 205 42.6%
139 113 90 22 20 2%
ソフトウエアプロダクト
売 上 高Net Sales売上総利益Gross Profit
Information Services Gross Profit
売上総利益率Gross Profit Margin
23.6%
32.9%
35.0% 36.0%40%6,000
139 113 90 22 20.2%
21.1% 23.6% 32.9% 9.2% ―5.1% 5.0% 4.9%
464 418 407 10 2.5%
35 32 25 6 19 5%
プ ダクトSoftware Products Gross Profit
売上総利益率Gross Profit Margin
人材派遣Staffing Services
売 上 高Net Sales売上総利益Gross Profit
21.5%19.6%
16.5%
21.1%
7 6%
20%3,000
35 32 25 6 19.5%
7.6% 7.7% 6.4% 1.3% ―0.9% 1.2% 1.3%
87 95 108 13 13.8%
30 39 39 0 1.7%不動産賃貸
Real Estate Services
売 上 高Net Sales売上総利益Gross Profit
Staffing Services Gross Profit
売上総利益率Gross Profit Margin
7.6% 7.7% 6.4%
0%0
2009/6 2010/6 2011/630 39 39 0 1.7%
35.0% 41.7% 36.0% 5.7% ―100.0% 100.0% 100.0%
9,153 8,325 8,386 60 0.7%
1,915 1,623 1,404 218 13.5%
売上総利益率Gross Profit Margin
合 計Total
売 上 高Net Sales売上総利益Gross Profit
■ 情報サービス ■ ソフトウエアプロダクト
Information Services Software Products
■ 人材派遣 ■ 不動産賃貸
Copyright 2011 6
20.9% 19.5% 16.8% 2.7% ―
※ 左上の比率は構成比 The rates on the upper-left corners are percentages of total.
売上総利益率Gross Profit Margin
Staff ing Services Real Estate Services
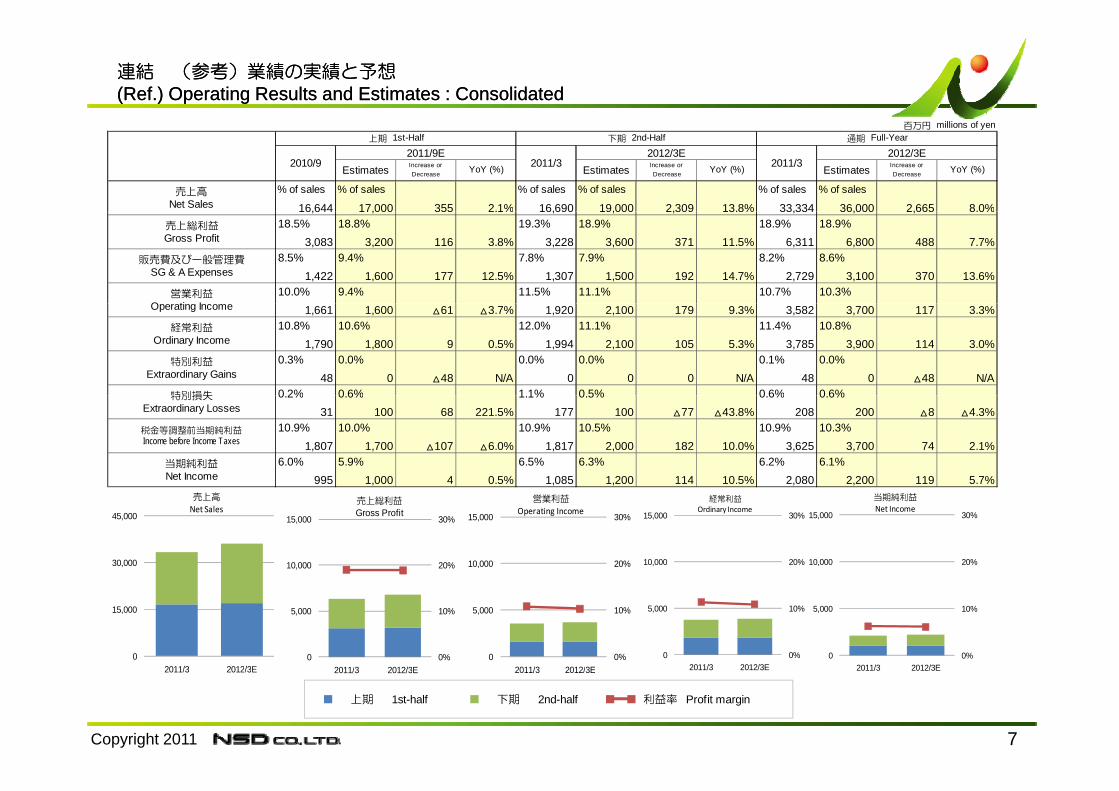
連結連結 (参考)業績の実績と予想(参考)業績の実績と予想(Ref.) Operating Results and Estimates : Consolidated(Ref.) Operating Results and Estimates : Consolidated
百万円 millions of yen
Estimates Increase orDecrease YoY (%) Estimates Increase or
Decrease YoY (%) Estimates Increase orDecrease YoY (%)
% of sales % of sales % of sales % of sales % of sales % of sales
16,644 17,000 355 2.1% 16,690 19,000 2,309 13.8% 33,334 36,000 2,665 8.0%売上高
Net Sales
上期 1st-Half 下期 2nd-Half 通期 Full-Year
2010/92011/9E
2011/32012/3E
2011/32012/3E
16,644 17,000 355 2.1% 16,690 19,000 2,309 13.8% 33,334 36,000 2,665 8.0%18.5% 18.8% 19.3% 18.9% 18.9% 18.9%
3,083 3,200 116 3.8% 3,228 3,600 371 11.5% 6,311 6,800 488 7.7%8.5% 9.4% 7.8% 7.9% 8.2% 8.6%
1,422 1,600 177 12.5% 1,307 1,500 192 14.7% 2,729 3,100 370 13.6%10.0% 9.4% 11.5% 11.1% 10.7% 10.3%
売上総利益Gross Profit
販売費及び一般管理費SG & A Expenses
営業利益O ti I 1,661 1,600 61 3.7% 1,920 2,100 179 9.3% 3,582 3,700 117 3.3%
10.8% 10.6% 12.0% 11.1% 11.4% 10.8%1,790 1,800 9 0.5% 1,994 2,100 105 5.3% 3,785 3,900 114 3.0%
0.3% 0.0% 0.0% 0.0% 0.1% 0.0%48 0 48 N/A 0 0 0 N/A 48 0 48 N/A
0 2% 0 6% 1 1% 0 5% 0 6% 0 6%
Operating Income
経常利益Ordinary Income
特別利益Extraordinary Gains
特別損失 0.2% 0.6% 1.1% 0.5% 0.6% 0.6%31 100 68 221.5% 177 100 77 43.8% 208 200 8 4.3%
10.9% 10.0% 10.9% 10.5% 10.9% 10.3%1,807 1,700 107 6.0% 1,817 2,000 182 10.0% 3,625 3,700 74 2.1%
6.0% 5.9% 6.5% 6.3% 6.2% 6.1%995 1,000 4 0.5% 1,085 1,200 114 10.5% 2,080 2,200 119 5.7%
特別損失Extraordinary Losses
税金等調整前当期純利益Income before Income Taxes
当期純利益Net Income
30,000
45,000
売上高
Net Sales
20%
30%
10,000
15,000
売上総利益
Gross Profit
20%
30%
10,000
15,000
営業利益
Operating Income
20%
30%
10,000
15,000
経常利益Ordinary Income
20%
30%
10,000
15,000
当期純利益Net Income
0
15,000
2011/3 2012/3E0%
10%
0
5,000
2011/3 2012/3E0%
10%
0
5,000
2011/3 2012/3E0%
10%
0
5,000
2011/3 2012/3E0%
10%
0
5,000
2011/3 2012/3E
Copyright 2011 7
2011/3 2012/3E 2011/3 2012/3E 2011/3 2012/3E
■ 上期 1st-half ■ 下期 2nd-half ■ ■ 利益率 Profit margin

単独単独 業績の概要業績の概要 第第11四半期(四半期(44~~66月)月)Operating Results for the ThreeOperating Results for the Three--month Period (Apr.month Period (Apr.--Jun.) : NonJun.) : Non--ConsolidatedConsolidated
百万円 millions of yen
Results Increase orDecrease
YoY (%)
% of sales % of sales % of sales
2011/6
売上高
2010/62009/6
6 000
9,000
売上高
Net Sales
8,184 7,328 7,294 33 0.5%78.3% 80.2% 83.3%
6,409 5,879 6,074 194 3.3%21 7% 19 8% 16 7%
売上高Net Sales
売上原価Cost of Sales
0
3,000
6,000
21.7% 19.8% 16.7%
1,775 1,448 1,220 228 15.8%9.7% 9.0% 8.7%
791 657 635 22 3.4%
売上総利益Gross Profit
販売費及び
一般管理費SG & A Expenses
2009/6 2010/6 2011/6
20%
30%
2 000
3,000
売上総利益
Gross Profit
売上総利益率Gross Profit Margin
20%
30%
2 000
3,000
営業利益
Operating Income
12.0% 10.8% 8.0%
983 790 584 205 26.0%13.2% 13.3% 13.8%
1 078 972 1 006 33 3 4%
営業利益Operating Income
経常利益Ordinary Income 0%
10%
20%
0
1,000
2,000
0%
10%
20%
0
1,000
2,000
営業利益率Operating Income
Margin
1,078 972 1,006 33 3.4%0.0% 0.2% 0.0%
2 17 0 17 100.0%0.2% 0.1% 0.0%
特別損失
特別利益Extraordinary Gains
y
30%3,000
四半期純利益
Quarterly Net Income
0%0
2009/6 2010/6 2011/6
0%0
2009/6 2010/6 2011/6
30%3,000
経常利益
Ordinary Income
13 10 3 7 69.6%13.0% 13.4% 13.7%
1,067 980 1,002 22 2.3%7.6% 7.8% 8.2%
Extraordinary Losses
四半期純利益
税引前四半期純利益Quarterly Income
before Tax 10%
20%
1,000
2,000
四半期純利益率Quarterly net Income
Margin10%
20%
1,000
2,000経常利益率
Ordinary Income Margin
Copyright 2011 8
626 573 597 23 4.2%四半期純利益
Quarterly Net Income 0%0
2009/6 2010/6 2011/6
0%0
2009/6 2010/6 2011/6
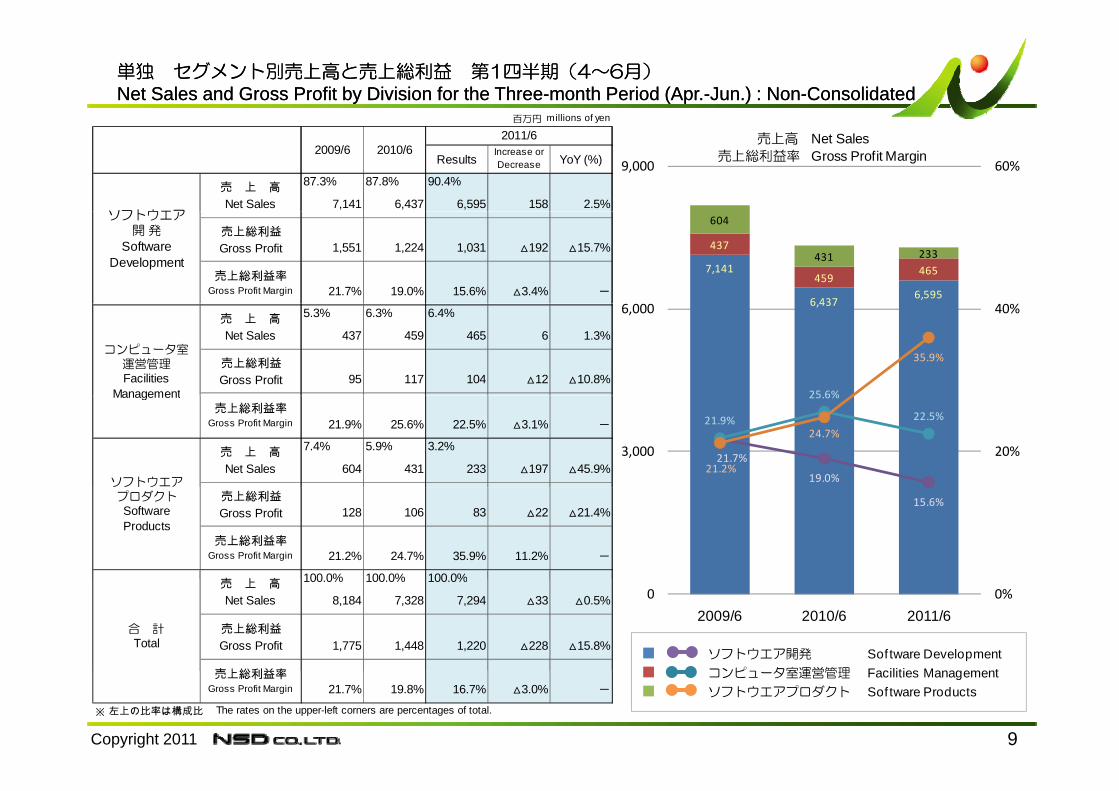
単独単独 セグメント別売上高と売上総利益セグメント別売上高と売上総利益 第第11四半期(四半期(44~~66月)月)Net Sales and Gross Profit by Division for the ThreeNet Sales and Gross Profit by Division for the Three--month Period (Apr.month Period (Apr.--Jun.) : NonJun.) : Non--ConsolidatedConsolidated
百万円 millions of yen百万円 millions of yen
ResultsIncrease orDecrease YoY (%)
87.3% 87.8% 90.4%
7,141 6,437 6,595 158 2.5%
2010/62011/6
2009/6
ソフトウエア
売 上 高Net Sales
60%9,000
売上高 Net Sales売上総利益率 Gross Profit Margin
1,551 1,224 1,031 192 15.7%
21.7% 19.0% 15.6% 3.4% -
ソフトウエア開 発
SoftwareDevelopment
売上総利益Gross Profit
売上総利益率Gross Profit Margin
7,141
6 4376,595
437
459465
604
431 233
5.3% 6.3% 6.4%
437 459 465 6 1.3%
95 117 104 12 10.8%
コンピュータ室運営管理Facilities
Management
売 上 高Net Sales
売上総利益Gross Profit
6,437
25 6%
35.9%
40%6,000
21.9% 25.6% 22.5% 3.1% -
7.4% 5.9% 3.2%
604 431 233 197 45.9%
Management売上総利益率
Gross Profit Margin
ソフトウエア
売 上 高Net Sales
21.7%
19.0%
21.9%
25.6%
22.5%
21.2%
24.7%
20%3,000
128 106 83 22 21.4%
21.2% 24.7% 35.9% 11.2% -
100 0% 100 0% 100 0%
売上総利益Gross Profit
売上総利益率Gross Profit Margin
売 上 高
プロダクトSoftwareProducts
15.6%
■ ソフトウエア開発 Software Development■ コンピュ タ室運営管理 Facilities Management
100.0% 100.0% 100.0%
8,184 7,328 7,294 33 0.5%
1,775 1,448 1,220 228 15.8%
売 上 高Net Sales
売上総利益Gross Profit
売上総利益率
合 計Total
0%0
2009/6 2010/6 2011/6
Copyright 2011 9
■ コンピュータ室運営管理 Facilities Management■ ソフトウエアプロダクト Software Products21.7% 19.8% 16.7% 3.0% -
※ 左上の比率は構成比 The rates on the upper-left corners are percentages of total.
売上総利益率Gross Profit Margin

単独単独 (参考)業績の実績と予想(参考)業績の実績と予想(Ref.) Operating Results and Estimates : Non(Ref.) Operating Results and Estimates : Non--ConsolidatedConsolidated
百万円 millions of yen
Estimates Increaseor Decrease
YoY (%) Estimates Increaseor Decrease
YoY (%) Estimates Increaseor Decrease
YoY (%)
% of sales % of sales % of sales % of sales % of sales % of sales14 643 15 200 556 3 8% 14 887 16 800 1 912 12 8% 29 530 32 000 2 469 8 4%
売上高Net Sales
上期 1st-Half 下期 2nd-Half 通期 Full-Year
2010/92011/9E
2011/32012/3E
2011/32012/3E
14,643 15,200 556 3.8% 14,887 16,800 1,912 12.8% 29,530 32,000 2,469 8.4%18.8% 19.7% 19.7% 20.8% 19.3% 20.3%
2,757 3,000 242 8.8% 2,932 3,500 567 19.3% 5,690 6,500 809 14.2%8.7% 9.2% 7.8% 8.3% 8.2% 8.8%
1,267 1,400 132 10.4% 1,163 1,400 236 20.4% 2,430 2,800 369 15.2%10.2% 10.5% 11.9% 12.5% 11.0% 11.6%
Net Sales
売上総利益Gross Profit
販売費及び一般管理費SG & A Expenses
営業利益
1,489 1,600 110 7.4% 1,769 2,100 330 18.7% 3,259 3,700 440 13.5%11.7% 13.2% 12.8% 12.5% 12.3% 12.8%
1,709 2,000 290 17.0% 1,910 2,100 189 9.9% 3,619 4,100 480 13.3%0.3% 0.0% 0.0% 0.0% 0.2% 0.0%
46 0 46 N/A 0 0 0 N/A 46 0 46 N/A
営業利益Operating Income
経常利益Ordinary Income
特別利益Extraordinary Gains
0.2% 0.7% 1.0% 0.6% 0.6% 0.6%31 100 68 221.5% 145 100 45 31.0% 176 200 23 13.6%
11.8% 12.5% 11.9% 11.9% 11.8% 12.2%1,725 1,900 174 10.1% 1,765 2,000 234 13.3% 3,490 3,900 409 11.7%
6.9% 7.2% 7.1% 7.1% 7.0% 7.2%
特別損失Extraordinary Losses
税引前当期純利益Income before Income Taxes
当期純利益N t I 1,009 1,100 90 8.9% 1,054 1,200 145 13.8% 2,064 2,300 235 11.4%Net Income
20%
30%
10,000
15,000
売上総利益
Gross Profit
20%
30%
10,000
15,000
営業利益
Operating Income
30,000
40,000
売上高
Net Sales
20%
30%
10,000
15,000
経常利益
Ordinary Income
20%
30%
10,000
15,000
当期純利益Net Income
0%
10%
0
5,000
2011/3 2012/3E0%
10%
0
5,000
2011/3 2012/3E0
10,000
20,000
2011/3 2012/3E0%
10%
0
5,000
0%
10%
0
5,000
Copyright 2011 10
■ 上期 1st-half ■ 下期 2nd-half ■ ■ 利益率 Profit margin
2011/3 2012/3E 2011/3 2012/3E2011/3 2012/3E 2011/3 2012/3E 2011/3 2012/3E

単独単独 業種別売上高(ソフトウエア開発・コンピュータ室運営管理)業種別売上高(ソフトウエア開発・コンピュータ室運営管理) 第第11四半期(四半期(44~~66月)月)Net Sales by User Industry (SoftwareNet Sales by User Industry (Software DevelopmentDevelopment and Facilities Management) and Facilities Management) for the Threefor the Three--month Period (Apr.month Period (Apr.--Jun.) : NonJun.) : Non--ConsolidatedConsolidated
百万円 millions of yen
Results % of Total Results % of Total Results % of Total Increase or Decrease YoY (%)
金 融 業Finance 2,373 31.3% 2,262 32.8% 2,581 36.6% 319 14.1%
サ ー ビ ス 業Services 2,450 32.3% 2,323 33.7% 2,086 29.5% 236 10.2%
2011/62009/6 2010/6
製 造 業Manufacturing 1,826 24.1% 1,506 21.8% 1,602 22.7% 95 6.3%
商 業Commercial 217 2.9% 291 4.2% 346 4.9% 54 18.8%
運 輸 業Transportation 259 3.4% 177 2.6% 138 2.0% 39 22.3%
通 信 業170 2 2% 111 1 6% 115 1 6% 3 3 4%Telecommunication 170 2.2% 111 1.6% 115 1.6% 3 3.4%
建 設 業Construction 120 1.6% 133 1.9% 115 1.6% 17 13.3%
公 共 団 体Public 75 1.0% 65 1.0% 39 0.6% 26 40.0%
電 力 ・ ガ スElectricity & Gas 81 1.1% 18 0.3% 33 0.5% 14 78.7%
商業商業
そ の 他Others 5 0.1% 5 0.1% 2 0.0% 3 57.1%
合 計Total 7,579 100.0% 6,897 100.0% 7,061 100.0% 164 2.4%
■ 金融業 Finance■ サービス業 Services■ 製造業 Manufacturing ■ 商業 Commercial■ 運輸業 Transportation■ 通信業 T l i ti
金融業Finance 32.8%製造業
Manufacturing
商業
Commercial4.2%
金融業
Finance 36.6%製造業
Manufacturing
Commercial4.9%
2011/6■ 通信業 Telecommunication■ 建設業 Construction■ 公共団体 Public■ 電力・ガス Electricity & Gas■ その他 Others
サービス業
21.8% 2010/6
サービス業
22.7% 2011/6
Copyright 2011 11
Services33.7%
Services29.5%

単独単独 金融業業態別売上高(ソフトウエア開発・コンピュータ室運営管理)金融業業態別売上高(ソフトウエア開発・コンピュータ室運営管理) 第第11四半期(四半期(44~~66月)月)Sales Breakdown by Financial Business CategorySales Breakdown by Financial Business Category((Software Development and Facilities ManagementSoftware Development and Facilities Management))for the Threefor the Three--month Period (Apr.month Period (Apr.--Jun.) : NonJun.) : Non--Consolidated Consolidated
百万円 millions of yen百万円 millions of yen
Results % of Total Results % of Total Results % of Total Increase orDecrease YoY (%)
メ ガ バ ン クLargest Banks 737 31.1% 562 24.8% 610 23.7% 48 8.6%
2011/62009/6 2010/6
g 737 31.1% 562 24.8% 610 23.7% 48 8.6%信 託 銀 行
Trust Banks 337 14.2% 215 9.5% 276 10.7% 61 28.6%地 銀 ・ 信 金 他
Regional / Local / Other Banks 300 12.7% 406 18.0% 642 24.9% 236 58.1%生 保 ・ 損 保生 保 損 保
Insurance Companies 753 31.7% 698 30.9% 691 26.8% 6 1.0%証 券 会 社
Securities Companies 104 4.4% 98 4.4% 100 3.9% 1 1.2%ノ ン バ ン ク 他
Nonbanks and Others 141 5.9% 280 12.4% 259 10.0% 21 7.6%
メガバ ク
ノンバンク他
O h メガバンク証券会社
ノンバンク他
Others
141 5.9% 280 12.4% 259 10.0% 21 7.6%合 計
Total 2,373 100.0% 2,262 100.0% 2,581 100.0% 319 14.1%
■ メガバンク Largest Banks■ 信託銀行 Trust Banks■ 地銀・信金他 Regional / Local /Other Banks■ 生保・損保 Insurance Companies
メガバンク
Large / National Banks24.8%
証券会社
Securities Companies
4.4%
Others12.4%
2010/6
メガバンク
Large / National Banks23.7%
生保・損保
証券会社
Securities Companies
3.9%
Others10.0%
2011/6■ 生保・損保 Insurance Companies■ 証券会社 Securities Companies■ ノンバンク他 Nonbanks and Others
信託銀行
Trust Banks9.5%
地銀・信金他
Regional / Local
生保・損保
Insurances Companies30.9%
2010/6 信託銀行
Trust Banks10.7%
地銀・信金他
R i l / L l
生保 損保
Insurances Companies26.8%
2011/6
Copyright 2011 12
Regional / Local / Other Banks
18.0%
Regional / Local / Other Banks
24.9%

単独単独 ソフトウエア開発受注動向ソフトウエア開発受注動向Software Development : Order, Net Sales and Order Backlog Trend: NonSoftware Development : Order, Net Sales and Order Backlog Trend: Non--ConsolidatedConsolidated
百万円 millions of yen百万円 millions of yen受注高
Order Value前年同期比
YoY (%)売上高
Net Sales前年同期比
YoY (%)受注残高
Order Backlog前年同期比
YoY (%)
2009/3 第1四半期 1Q 6,977 △16.4% 7,598 7.2% 8,854 △9.8%
第2四半期 2Q 9,492 △2.5% 8,736 5.3% 9,610 △7.0%, , ,
上期 1st-Half 16,469 △8.9% 16,334 0.1% 9,610 △7.0%
第3四半期 3Q 6,275 0.2% 8,308 1.8% 7,577 △10.2%
第4四半期 4Q 8,033 △26.8% 8,775 △11.7% 6,835 △27.9%
通期 Full-Year 30,778 △12.9% 33,419 △2.9% 6,835 △27.9%2010/3 第1四半期 1Q 5,839 △16.3% 7,141 △6.0% 5,532 △37.5%
第2四半期 2Q 7,330 △22.8% 6,982 △20.1% 5,880 △38.8%上期 1st Half上期 1st-Half 13,170 △20.0% 14,124 △13.5% 5,880 △38.8%
第3四半期 3Q 5,298 △15.6% 6,586 △20.7% 4,593 △39.4%
第4四半期 4Q 7,634 △5.0% 6,416 △26.9% 5,811 △15.0%通期 Full-Year 26,103 △15.2% 27,127 △18.8% 5,811 △15.0%, , ,
2011/3 第1四半期 1Q 7,153 22.5% 6,437 △9.9% 6,527 18.0%
第2四半期 2Q 6,987 △4.7% 6,633 △5.0% 6,881 17.0%上期 1st-Half 14,141 7.4% 13,071 △7.5% 6,881 17.0%
第3四半期 3Q 5,165 △2.5% 6,779 2.9% 5,266 14.7%
第4四半期 4Q 7,854 2.9% 6,755 5.3% 6,365 9.5%通期 Full-Year 27,161 4.1% 26,606 △1.9% 6,365 9.5%
2012/3 第1四半期 1Q 7 247 1 3% 6 595 2 5% 7 017 7 5%
Copyright 2011 13
※ 受注額の基準: 期末時点で作業開始日が到来していない注文を含む、確定した受注の合計金額を使用。* We adopted Order backlog includes orders of which work has not yet started at the point of term-end.
2012/3 第1四半期 1Q 7,247 1.3% 6,595 2.5% 7,017 7.5%

単独単独 製造費用とセグメント別外注費比率製造費用とセグメント別外注費比率Manufacturing Costs and Subcontracting Costs Breakdown : NonManufacturing Costs and Subcontracting Costs Breakdown : Non--ConsolidatedConsolidated
製造費用の推移 Manufacturing Costs 百万円 illi f
75%
100%製造費用の推移 Manufacturing Costs 百万円 millions of yen
2009/6Q1(Apr-Jun)
2010/6Q1(Apr-Jun)
2011/6Q1(Apr-Jun)
(Ref.) 2012/3EFull-year
81.3% 84.5% 81.5% 82.4%4 696 4 703 4 909 20 300
労務費Personnel Costs
25%
50%4,696 4,703 4,909 20,300
15.1% 11.9% 14.3% 13.8%874 662 858 3,400
1.5% 1.7% 1.5% 1.6%87 94 89 400
外注費Subcontracting Costs
賃借料Rental Costs
0%
2009/6Q1(Apr‐Jun)
2010/6Q1(Apr‐Jun)
2011/6Q1(Apr‐Jun)
(Ref.) 2012/3EFull‐year
2.1% 1.9% 2.7% 2.2%118 104 163 550
100.0% 100.0% 100.0% 100.0%5,777 5,564 6,020 24,650
※ 左上の比率は構成比
合計Total
その他Others
■ 労務費 Personnel Costs ■ 賃借料 Rental Costs■ 外注費 Subcontracting Costs ■ その他 Others
※ 左上の比率は構成比 The rates on the upper-left corners are percentages of total.
セグメント別外注費と外注費比率Subcontracting Costs by Division 百万円 millions of yen
2009/6 2010/6 2011/6 (Ref )2012/3E 20%
30%
600
900
2009/6Q1(Apr-Jun)
2010/6Q1(Apr-Jun)
2011/6Q1(Apr-Jun)
(Ref.)2012/3EFull-year
ソフトウエア開発Software Development 745 542 728 3,000
外注費比率
10%
20%
300
600
■ ソフトウエア開発 Software Development外注費比率 % of sales
外注費比率Subcontracting Costs Ratio 10.4% 8.4% 11.0% 10.3%コンピュータ室運営管理
Facilities Management 129 119 130 400外注費比率
0%02009/6
Q1(Apr-Jun)2010/6
Q1(Apr-Jun)2011/6
Q1(Apr-Jun)
Copyright 2011 14
外注費比率 % of sales
■ コンピュータ室運営管理 Facilities Management外注費比率 % of sales
Subcontracting Costs Ratio 29.5% 26.1% 28.0% 23.5%

会社概要会社概要CorporateCorporate ProfileProfile
[ 2011年6月30日現在 ] [ As of June 30, 2011 ]
株式会社 N S D Name of Company : NSD CO., LTD.1969年4月8日 Foundation : April 8, 1969
7,205,864,914 円 Capital : 7,205,864,914 yen
会社名
設 立
資本金
200,000,000株 Number of Shares : Authorized : 200,000,000
51,172,160株 Outstanding : 51,172,160
自己株式の総数* 8,279,865株 Treasury stocks*: 8,279,865
*従業員持株ESOP信託口株数1,019,800株を含む * Including shares of ESOP(Employee stock ownership program) trust account 1,019,800
上場証券取引所 東京証券取引所 市場第 部 Stock Listing : Tokyo Stock Exchange 1st Section
資本金
株式数 発行可能株式総数
発行済株式の総数
上場証券取引所 東京証券取引所 市場第一部 Stock Listing : Tokyo Stock Exchange, 1st Section
[ 2011年3月31日現在 ] [ As of March 31, 2011 ]
大株主 ステートストリートバンクアンドトラストカンパニー 505223 Major Shareholders : State Street Bank and Trust Company 505223(*自己株式除く) 大同生命保険株式会社 Daido Life Insurance Company
IPC株式会社 IPC Co Ltd
* Treasury stocks are excluded
IPC株式会社 IPC Co., Ltd.
野村信託銀行株式会社(信託口) The Nomura Trust and Banking Co., Ltd. (Trust Account)
タイヨーパールファンドエルピー Taiyo Pearl Fund, L.P.
有限会社KDアソシエイツ KD Associates, Ltd.
株主数 9 377名 (2010年3月期末 8 966名) Number of Shareholders : 9 377 (As of March 31 2010 8 966)
免責事項Disclaimer
株主数 9,377名 (2010年3月期末 8,966名) Number of Shareholders : 9,377 (As of March 31, 2010 8,966)
従業員数 連結 3,734 名 (2010年3月期末 3,690名) Number of Employees : Consolidated 3,734 (As of March 31, 2010 3,690)
単独 2,873 名 (2010年3月期末 2,810名) Non-Consolidated 2,873 (As of March 31, 2010 2,810)
免責事項
本資料は、当社及び当グループ会社の業績・事業戦略に関する情報の提供を目的としたものであり、当社及び
当グループ会社の株式の購入や売却を勧誘するものではありません。本レポートの内容には、将来の業績に関す
る意見や予測等の情報を掲載することがありますが、これらの情報は、現時点の当社の判断に基づいて作成され
ております。よって、その実現・達成を約束するものではなく、また今後、予告なしに変更されることがありま
す。本レポート利用の結果生じたいかなる損害についても、当社は一切責任を負いません。また、本レポートの
無断での複製、転送等を行わないようにお願い致します。
This report is intended to provide information about the business performance and strategy of NSD CO., LTD.
(NSD) and the NSD Group. It is not intended and should not be construed as an inducement to purchase or sell
stock in NSD or NSD Group companies. Statements in this presentation that are not historical facts are
forward-looking statements, based on the current beliefs, estimates and expectations of management. As these
beliefs, estimates and expectations are subject to a number of risks, uncertainties, and assumptions, actual
results may be materially different. NSD undertakes no obligation to update any forward-looking statements, and
Copyright 2011 15
無断での複製、転送等を行わないようにお願い致します。
results may be materially different. NSD undertakes no obligation to update any forward looking statements, and
shall in no event be liable for any damages arising out of the use or interpretation of this material. Please refrain
from copying, disseminating or distributing this material without the prior consent of NSD.