2011 FINANCIAL STABILITY REPORT - BNR: Home · 1 Foreword The National Bank of Rwanda (BNR) proudly...
61
JUNE 2012 2011 FINANCIAL STABILITY REPORT National Bank of Rwanda
Transcript of 2011 FINANCIAL STABILITY REPORT - BNR: Home · 1 Foreword The National Bank of Rwanda (BNR) proudly...
JUNE 2012
2011 FINANCIAL STABILITY REPORT
National Bank of Rwanda
i
Contents
Figures ........................................................................................................................................................... ii
Tables ........................................................................................................................................................... iii
Appendices ................................................................................................................................................... iii
Acronyms ..................................................................................................................................................... iv
Foreword ....................................................................................................................................................... 1
Macroeconomic and financial environment in 2011 .................................................................................... 3
Global economic conditions ...................................................................................................................... 3
Sovereign debt and banking system problems in European countries .................................................... 5
Developments in the East Africa region .................................................................................................... 8
Rwanda’s macro financial environment ................................................................................................. 10
Financial stability developments and trends .............................................................................................. 11
Structure of the Rwanda’s financial system ........................................................................................... 11
Domestic macro prudential analysis ....................................................................................................... 15
Financial system resilience ...................................................................................................................... 30
Infrastructure and regulation ..................................................................................................................... 36
Developments in payment systems ........................................................................................................ 36
New laws and regulations ....................................................................................................................... 39
Observance of standards, principles and codes ..................................................................................... 40
The outlook for Rwandan financial stability ............................................................................................... 41
Appendices .................................................................................................................................................. 42
References .................................................................................................................................................. 54
ii
Figures
Figure 1 Global GDP Growth ........................................................................................................................ 3
Figure 2 Euro Area Government Bond Markets (In percent of total euro area government debt) ................. 6
Figure 3 U.S. Prime Money Market Exposures…………………………………………………………………….7
Figure 4 European Bank Capital Needs ....................................................................................................... 7
Figure 5 GDP growth in EAC countries (in percent) ..................................................................................... 8
Figure 6 Annual Inflation trend in EAC countries (in percent) ....................................................................... 9
Figure 7 Structure of the Rwandan financial sector as at December 2011 ................................................. 11
Figure 8 RSE transactions (in millions) ....................................................................................................... 14
Figure 9 Growth of assets and liabilities (share of total growth) .................................................................. 15
Figure 10 Banking capital adequacy as at 31 December 2011 .................................................................. 16
Figure 11 Trend of NPLs ratio (in percent) ................................................................................................. 17
Figure 12 Percentage of loans by sector of activities .................................................................................. 19
Figure 13 Large exposure to core capital as at 31 December 2011 ........................................................... 20
Figure 14 Selected indicators of profitability (in percent) ............................................................................ 21
Figure 15 Liquidity position as at 31 December 2011 ................................................................................. 22
Figure 16 Capital adequacy ratio for MFIs .................................................................................................. 23
Figure 17 NPL ratio for MFIs sector ............................................................................................................ 23
Figure 18 ROE & ROA for MFIs.................................................................................................................. 24
Figure 19 Liquidity ratio for MFIs ................................................................................................................ 25
Figure 20 Capital adequacy for Insurance sector ....................................................................................... 26
Figure 21 Asset quality ratios for Insurance sector ..................................................................................... 27
Figure 22 Retention ratio for insurance sector ............................................................................................ 28
Figure 23 Earnings and profitability for insurance sector ............................................................................ 29
Figure 24 Liquidity ratio for insurance sector .............................................................................................. 30

iii
Tables
Table 1 Global economic growth and projections (in percentage) ................................................................ 5
Table 2 Stage of development in domestic financial markets (Outstanding Amount in Millions of RWF) ... 14
Table 3 Non-Performing Loans by activities sector as at 31 December 2011 (in 000s of RWF) ................. 18
Table 5: Basic payment indicators as at end December 2011 ..................................................................... 36
Table 5 Transactions settled through RIPPS as at 31st December 2011 .................................................... 37
Table 6 Evolution of card based payments as at end December 2011 ....................................................... 38
Table 7 Cashless Payment Instruments: Number and Value of Transactions as at 31 December 2011 .... 38
Appendices
Appendix 1: Selected financial soundness indicators for EAC as at 31 December 2011 ........................................ 42
Appendix 2: Financial soundness indicators (FSIs) as at 31 December 2011 ...................................................... 44
Appendix 3: Balance sheets as at 31 December 2011 ....................................................................................... 47
Appendix 4: Income statements as at 31 December 2011 .................................................................................. 51

iv
Acronyms
ACH : Automated Clearing House
AFF : Access to Finance Forum
ASEAN : Association of Southeast Asian Nations
ATM : Automatic Teller Machine
ATS : Automated Transfer System
BCP : Basel Core Principles
BNR : National Bank of Rwanda
CAR : Capital Adequacy Ratio
CDS : Credit Default Swap
CRB : Credit Reference Bureau
CSD : Central Security Depository
CSR : Caisse Sociale du Rwanda
EAC : East African Community
EBA : European Banking Authority
ECB : European Central Bank
FSAP : Financial Sector Assessment Program
FX : Foreign Exchange
GDP : Gross Domestic Product
GFSR : Global Financial Stability Report
ICP : Insurance Core Principles
IMF : International Monetary Fund
NOP : Net Open Position
NPL : Non-Performing Loan
NSSF : National Social Security Fund
POS : Point of Sale
RAMA : La Rwandaise d’Assurance Maladie
RIPPS : Rwanda Integrated Payment Processing System
ROA : Return on Assets
ROE : Return on Equity
RSE : Rwanda Stock Exchange
RSSB : Rwanda Social Security Board
RSSP : Rural Sector Support Program
RTGS : Real Time Gross Settlement System
RWA : Risk Weighted Assets
SACCO : Savings And Credit Co-operative
SME : Small and Medium Enterprise
SMP : Security Market Program
STP : Straight-Through Processing
USA : United States of America
WEO : World Economic Outlook
1
Foreword
The National Bank of Rwanda (BNR) proudly introduces the first edition of the Financial Stability Report
(FSR). One of the mandates of BNR is to maintain financial system stability with a view to encouraging and
promoting the development of the productive resources of Rwanda. A stable financial system is one which
creates a favourable environment for savers and investors, encourages efficient financial intermediation
and the effective functioning of markets, and hence, promotes investment and economic growth. The
financial stability analysis carried out by BNR involves continuous assessment of potential systemic risks to
the Rwandan financial system and the development of policies to mitigate those risks.
This Financial Stability Report (FSR) is the first of its annual series to be released around June each year.
The report which focuses mainly on the three years period ending December 2011, analyses the
performance and condition of the Rwandan financial system comprising of banks, insurance and pension
companies, and Microfinance institutions including SACCOs. In so doing, the report presents a scan of the
environment, discusses sector achievements vis-à-vis keys indicators, and provides updates on financial
markets, payment system and regulatory frameworks. The data used for the analysis are companies’
audited financial statements for the year ended, which by law are released by 30th April of the following
year.
During the last three years, Rwanda has achieved high growth and macroeconomic stability despite a
challenging international and regional economic environment. The banking system registered continuous
growth in assets and was in a financially sound condition with a capital adequacy ratio of 25% percent as of
December 2011, far higher than the statutory minimum of 15 percent. Bank profitability improved with
returns on both assets and equity rising since 2009. Profitability was enhanced by an improvement in asset
quality manifested by the decline of non-performing loans ratio.
The microfinance industry recorded a positive performance during the last three years with an increase of
37.6% of assets in 2011 compared to 2010. The significant improvement in microfinance sector is mainly a
result of the introduction of UMURENGE SACCOs in 2009 which contributed to the expansion of the
industry’s balance sheet and financial inclusion.

3
Macroeconomic and financial environment in 2011
Despite various policy steps to contain the euro area debt crisis and banking problems, the global financial
stability was still threatened by intensifying strains in the euro area and fragilities elsewhere during the year
2011. In advanced economies, financial conditions have deteriorated, growth prospects have dimmed, and
downside risks have escalated. However, in sub-Saharan Africa, especially in East African region, the
economic growth remains relatively robust though risks to regional economic stability may arise from rapid
exchange rate depreciation, rising inflation and uncertainties surrounding the Euro sovereign debt.
Global economic conditions
The prospects for the global economic growth dimmed and risks sharply escalated during the year 2011, as
the euro area crisis entered an unsafe new phase. Global GDP growth stood at an annualized rate of 3.8
percent decelerating from 5.2 percent in 2010. According to the IMF World Economic Outlook (WEO),
global output is projected to further slow to Figure 1 Global GDP Growth
3.3 percent in 2012 (Table 1 and Figure 1).
This is largely because the euro area
economy is expected to go into a mild
recession in 2012 as a result of the rise in
sovereign yields and the impact of additional
fiscal consolidation.
According to the IMF (WEO Updates,
January 2012), the GDP growth in advanced
economies reduced from 3.2 percent in 2010 Source: IMF, WEO Updates, January 2012
to 1.6 percent in 2011 and it is expected to expand by 1.2 percent in 2012. In the USA, it fell to 1.8 percent
in 2011 from 3.0 percent in 2010 and is expected to remain unchanged at 1.8 percent in 2012. The Euro

4
zone economic growth slowed to 1.6 percent in 2011 against 1.9 percent in 2010 and is expected to
downgrade to -0.5 percent in 2012.
Growth in emerging and developing economies slowed more than forecast due to a greater-than-expected
effect of macroeconomic policy tightening or weaker underlying growth. The GDP growth declined to 6.2
percent in 2011 from 7.3 percent in 2010 and is expected to slow to 5.4 percent in 2012 because of the
worsening external environment and weakening of internal demand.
For the African continent, the economic growth was relatively robust in 2011 and the year 2012 looks set to
be another encouraging one especially for most Sub-Saharan African economies. The economic growth in
Sub-Saharan Africa was estimated at 4.9 percent in 2011 from 5.3 in 2010 reflecting mainly strong
domestic demand but also elevated commodity prices. The growth is projected to be higher for 2012 with
5.5 percent growth owing to one-off boosts to production in a number of countries, favorable commodities
prices, large scale infrastructure development, improvement in services and industries, and improved
economic policies. However, the increase in global food and fuel prices amplified by serious drought in
some parts and inflation rose in a number of countries. Beyond this, uncertainties in the global recovery
threaten to weaken export and growth prospects.
According to the IMF (WEO Updates, January 2012), the most immediate policy challenge for global
economic growth is to restore confidence and put an end to the crisis in the euro area by supporting
growth, while sustaining adjustment, containing deleveraging, and providing more liquidity and monetary
accommodation.

5
Table 1 Global economic growth and projections (in percentage)
Projections
2010 2011 2012 2013
World Output 5.2 3.8 3.3 3.9
Advanced Economies 3.2 1.6 1.2 1.9
United States 3 1.8 1.8 2.2
Euro Area 1.9 1.6 –0.5 0.8
Japan 4.4 –0.9 1.7 1.6
United Kingdom 2.1 0.9 0.6 2
Canada 3.2 2.3 1.7 2
Other Advanced economies 5.8 3.3 2.6 3.4
Emerging and Developing Economies 7.3 6.2 5.4 5.9
Central and Eastern Europe 4.5 5.1 1.1 2.4
Commonwealth of Independent States 4.6 4.5 3.7 3.8
Developing Asia 9.5 7.9 7.3 7.8
Latin America and the Caribbean 6.1 4.6 3.6 3.9
Middle East and North Africa (MENA) 4.3 3.1 3.2 3.6
Sub-Saharan Africa 5.3 4.9 5.5 5.3
Source: IMF, World Economic Outlook Update, January 2012
Sovereign debt and banking system problems in European countries
The euro area debt crisis has intensified further, requiring urgent action to prevent highly destabilizing
outcomes. Sovereign bond yields in the periphery rose sharply, especially at short to medium term
maturities, inverting yield curves in 2011 and signaling increased concerns about financing and default
risks. Policy packages have been insufficient to contain adverse feedback loops, thus tricking some
sovereigns in a “bad equilibrium” as long term foreign investors shed exposures. Domestic institutions were
unable to fill the gap, and the European Central Bank (ECB) became a critical support for peripheral
sovereign debt through its Securities Markets Program (SMP). As the crisis intensified, it spilled from the
periphery into the core with yields rising and spreads widening including the sovereign debt of Austria and
France. As of end-2011, more than two-thirds of euro area sovereign debt had credit default swap (CDS)
spreads of over 200 basis points (Figure 2). Since September 2011, ratings downgraded and negative

6
outlooks across a wide range of euro area sovereigns have also contributed to the rise in yields. Despite of
recent improvement in market conditions, fundamental challenges remain.
Figure 2 Euro Area Government Bond Markets (In percent of total euro area government debt)
Source: IMF, Global Financial Stability Report (GFSR) Update, January 2012
Sovereign strains also spilled into the euro zone banking system as some funding channels closed, and
interbank spreads widened. Banks’ access to term funding was sharply curtailed and even short-term
markets came under strain as lending tenors were reduced from months and weeks to days. The U.S.
money market funds dramatically scaled back credit to euro area banks (Figure 3). This prompted many of
those banks to sell U.S. dollar assets.
Pressures on European banks have escalated, reflecting the increase in sovereign stress and the closure
of many private funding channels. To protect banks from such negative shocks, global steps toward a safer
financial system are essential. In this regard, the European Banking Authority (EBA) has initiated a process
calling for banks to reach higher capital ratios. It judged €85 billion in additional capital to be necessary
(excluding €30 billion already programmed for Greece) to reach a 9 percent core Tier 1 ratio and provide an
adequate sovereign capital buffer ( Figure 4).

7

7
Figure 3 U.S. Prime Money Market Exposures Figure 4 European Bank Capital Needs to Banks (Percent of total assets) (In billions of euros)
Source: IMF, GFSR Updates, January 2012 Source: IMF, GFSR Updates, January 2012
The global economy uncertainty following fiscal deficit in the United States and debt crisis in some member
countries of the European Union could reduce economic growth in some countries, including Rwanda and
EAC region that depends on fuel imports and few commodity exports. However, despite the challenging
global and regional economic environment, Rwanda managed to sustain dynamic economic activities,
recording high performance in all sectors. Although the risks from an uncertain global economy and further
price shocks could bring lower growth and higher inflation, the Rwandan economy is again expected to
experience a positive growth during next year based on expected strong performance in the agriculture,
service, and industry sectors.
Furthermore, following the pre-crisis financial environment analysis, the group of twenty (G-20), through
Basel Committee on Banking Supervision and Financial Stability Board, recommended global financial
regulatory reforms to create a stronger international regulatory framework to safeguard financial stability.
Therefore, individual countries should respond to these recommendations by strengthening their respective
financial sector regulatory regimes to ensure a much safer financial system. However, the recommended
reforms need to be adapted to the respective national structures. For the part of Rwanda, the National

8
Bank of Rwanda continued to employ radical reforms to ensure that financial system is robust and strong,
keeping in mind the EAC regional harmonization process on regulation and supervision of the financial
sector as a whole. The reforms included the legal and regulatory framework, supervisory tools, modern
payment systems and the private credit reference bureau.
Developments in the East Africa region
The economic growth among the East African Community (EAC) members continued to improve during the
last three years (Figure 5). The average EAC GDP growth increased from 5.6 percent in 2010 to 6.3
percent at the end of 2011. The decline in 2009 was in part caused by the effects of the global financial
crisis, high fuel prices and draught among others.
Figure 5 GDP growth in EAC countries (in percent)
Source: IMF, WEO report April 2011; BNR, Monetary Policy Department

9
Inflation
Figure 6 Annual Inflation trend in EAC countries (in percent)
After the decline of inflation during 2009 and
2010 with average annual inflation of 8.9
percent and 4.0 percent respectively, EAC
region experienced a high inflation
throughout 2011 with an average annual
inflation of 17.8 percent at the end of 2011.
As shown by the Figure 6, all EAC countries,
except Rwanda, ended 2011 with double digit
inflation. The three largest economies in the
region, Kenya, Tanzania and Uganda,
experienced highest annual inflation at the
end of 2011 with 18.9%, 19.8% and 27% Source: EAC Central Banks’ websites
respectively. The primary cause of high inflation in EAC region had been the global commodity prices that
drove up food and fuel prices. Poor regional weather conditions (drought) and the after effects of the global
crisis (fiscal deficit in the United States and debt crisis in some member countries of the European Union)
also contributed to a jump in EAC inflation.
Cross border financial sector inter-linkages in EAC region
Financial sector linkages have risen in the EAC region during recent years dominated by the expansion of
Kenyan financial institutions in the region. During last three years, four Kenyan banks and three insurance
companies have opened up subsidiaries in Uganda (as reported by Bank of Uganda in its financial stability
report), and two Kenyan banks opened up subsidiaries in Rwanda during the same period. In addition,
major international banks have subsidiaries in various East African Community (EAC) countries. The
increase in cross-border financial services in East Africa is crucial for regional growth and financial system
development as it improves competition and facilitates trade and financial flows within the region. To
strengthen cooperation among bank regulators in the region, the EAC Central Banks signed memoranda of
understanding among them which will enhance the sharing of information and skills.

10
Performance of banks in the region
Banks in East Africa were well capitalized overall, with the average regulatory capital to risk-weighted
assets ratio at around 21.1 percent as of end December 2011. For all banks of EAC countries this ratio has
been increasing during the last three years. The Rwandan banking system has highest ratio as shown in
Appendix 1. Bank asset quality in East Africa improved during the last three years with the ratio of non-
performing loans (NPLs) to total gross loans below 10 percent for all the East African countries. Despite the
improvement experienced in 2011 with a decline in NPL ratio from 11.3 percent in 2010 to 8% in 2011,
Rwanda still recorded the highest NPL ratio in the EAC region due to the negative impact of 1994 genocide
on Rwandan financial sector. Banks’ profitability remained largely satisfactory in EAC countries throughout
the three years with an average return on equity and asset of 23.7 percent and 3.4 percent respectively.
Kenya’s banking sector was the most profitable with average return on equity and assets of 30.3 percent
and 3.4 percent respectively in December 2011. In Rwanda, these ratios were 14% and 2.9% respectively
as of end December 2011.
Rwanda’s macro financial environment
During the last three years, Rwanda achieved high growth and macroeconomic stability despite a
challenging international and regional economic environment. Rwanda’s economy continued to
demonstrate resilience to regional and global shocks due to the country’s stable macroeconomic framework
resulting from important economic reforms and more coordinated macroeconomic policy management.
The Rwandan economy experienced a continuous increase in GDP growth from 2009 to 2011 driven by
good performance in all economic sectors of which agriculture grew by 8.2 percent, services sector by 7.2
percent and industry sector by 15 percent.
Rwanda’s inflation during 2009 and 2010 was declining. Inflation stood at 5.7 percent in 2009 and at 0.2
percent in 2010. However, inflation in Rwanda increased over the year 2011 due to high oil and food prices
and the drought in the region. Rwanda has been able to contain inflation at one digit which stood at 8.3
percent at the end of the year 2011. This was made possible through monetary and fiscal policies shaped
to minimize risks and keep inflation under control despite global and regional high inflationary pressures.

11
Financial stability developments and trends
Structure of the Rwanda’s financial system
In 2011, Rwanda’s financial sector consisted of 14 banks, 497 microfinance institutions and SACCOs, and
49 non-bank financial institutions. As shown in Figure 7, banks comprise of commercial banks,
microfinance banks, development banks and cooperative banks (regulated under the Banking Law) and
microfinance institutions and SACCOs include taking deposits microfinance institutions and non-taking
deposits microfinance institutions (regulated under Microfinance Law), while non-bank financial institutions
consist of insurance companies and pension funds.
Figure 7 Structure of the Rwandan financial sector as at December 2011
National Bank of Rwanda (BNR)
Banks
Microfinance institutions and SACCOs
Commercial banks
Microfinance banks
Deposits taking microfinance institutions & SACCOs
Non‐deposits taking microfinance institutions
Cooperative banks
Development banks
Non‐bank financial institutions
Insurance companies
Pension funds (public and private)
Short‐term insurance companies
Long‐term insurance companies

12
Banking system
At the end of year 2011, the Rwandan banking system was comprised of nine commercial banks and six
specialized institutions (including 3 microfinance banks, 1 development bank, 1 cooperative bank and 1
discount house), accounting for 82.3 percent and 17.7 percent of the banking system respectively. Two
bank opened up subsidiary in Rwanda since 2009 and two microfinance institutions upgraded to
microfinance bank while one SACCO upgraded to cooperative bank status during the year 2011. However,
the Rwandan banking system remained small and concentrated with three largest banks together holding
over 50% of the total system assets. Rwandan banks are generally well capitalized with the overall
regulatory capital adequacy ratio (CAR) standing at 25 percent as of 31st December 2011 and still above
regulatory minimum required of 15%. This sound capitalization enables banks to mitigate the still slightly
higher proportion of nonperforming loans (NPL).
Microfinance institutions
At the end of year 2011, the Rwandan Microfinance sector was comprised of 497 Institutions including 486
SACCOs and 11 Private Limited Companies. The development in Microfinance industry during the period
under review was characterized by the growth of UMURENGE SACCOs that brought a significant
improvement with 37.6 percent increase of the total assets of the sector. However, the microfinance sector
faced the challenges of poor governance and weak management. Specifically, weak management
information system, insufficient security of funds when transporting cash to and from banks (most of MFIs
are located in rural areas), and low level of financial literacy of the population, are among problems faced
by MFIs. Some initiatives were taken aiming at promoting the financial inclusion, including “Access to
Finance Forum” which is a platform whereby stakeholders discuss barriers hindering the access to formal
financial services, both at demand and supply side. The consolidation of small SACCOs into viable
SACCOs was seen as a way of strengthening the sector; in this regard some SACCOs were merged either
with UMURENGE SACCOs or with other SACCOs within their respective networks. A sustainability study
was carried out to determine the best organizational structure and the supervisory approach which could fit
better the new microfinance institutions. In line with the recovery of non-performing loans, a committee in
charge of assisting MFIs in the recovery of debt arrears of microfinance institutions from defaulters was set
13
up at district level and Ministerial Instruction governing this organization was published in Official Gazette in
August 2011.
Insurance companies
As of 31st December 2011, the Rwandan insurance sector was comprised of six private insurers and two
public insurers, making a total of eight insurance companies, 5 brokers and 105 insurance agents and loss
adjusters. As at the end of year 2011 the private insurers registered a gross premium of Rwf 32.0 billion
which grew by 9 % compared to 2010 and recorded an underwriting loss of Rwf 440 million indicating a
deterioration of 70% compared to 2010. Similarly, profit before tax increased by 43% compared to 2010.
The Public insurers, providers of medical insurance, recorded gross premiums of Rwf 20.0 billion or 2%
decrease compared to 2010 with underwriting profit of Rwf 8.6 billion or 0.4 % increase compared to 2010.
Net profit also decreased by 3% during the same period.
Pension funds
The pension sector is comprised of the National Social Security Fund (NSSF/CSR), which merged with
RAMA to form Rwanda Social Security Board (RSSB) and about 40 private/occupational pension funds
managed by insurance companies as well as in-house pension schemes by some institutions. The National
Social Security Fund (NSSF) commonly known as CSR covers largely salaried workers representing 7% of
the working population in Rwanda. The pension coverage is still low compared to middle income
economies such as South Africa whose coverage rate is 25%. The pension sector assets (excluding private
pension funds) continued to grow with a positive trend reaching Frw211.57bn in 2011 from Frw166.78bn in
2010, resulting into a percentage increase of 27%
Financial Market
The Rwandan financial market is mainly composed of Money markets, Securities markets and Foreign
exchange markets (Table 2). The money markets dominate the Rwandan financial market with 92 percent
(of which 60% is from repurchase agreements) of total outstanding amount. The securities market in
Rwanda is dominated by Government bonds operations.

14
Table 2 Stage of development in domestic financial markets (Outstanding Amount in Millions of RWF)
Period 2009 2010 2011
Money markets 636,398 680,895 190,338
Interbank 549,044 518,095 395
Treasury bill 0 54,462 64,294
Central bank bill 29,254 1,538 10,749
Repurchase agreements (REPO) 58,100 106,800 114,900
Securities markets 1,000 16,000 16,429
Government bonds 0 15,000 15,000
Corporate bonds 1,000 1,000 1,000
Equity 0 0 429
Foreign exchange markets 605 233 328
Spot 605 233 328
TOTAL 638,002 697,127 207,095
Source: BNR, Financial Markets Department
With regard to the stock markets, the Rwanda Stock Exchange (RSE) established in 2010 counted 4 listed
companies at the end of 2011. However, only two companies have been active on RSE with approximately
12.8 million at the end of December 2011 (Figure 8).
Figure 8 RSE transactions (in millions)
Source: BNR, Financial Markets Department

15
Domestic macro prudential analysis
In this section the stability of the Rwandan financial system is assessed by analyzing a set of selected
macro-prudential indicators for the financial sector (Banks, Insurances and Microfinance institutions).
Performance indicators in the banking sector
Key indicators used in measuring the banking sector development continue to show strong asset growth,
increased competition in the mobilization of deposits, increased loans portfolio and a generally robust
banking system. Furthermore, the net profit in banking sector upgraded significantly during the last three
years. Nevertheless, Rwandan banks felt the impact of the global crisis indirectly through pressures on
liquidity and increased funding costs. The situation was reversed by the decreased level of NPLs caused by
strong economic activities and improvement in the credit underwriting procedures. The Figure 9 below
shows the growth rate of the banking sector in terms of total assets and other main items of assets and
liabilities during the last three years.
Figure 9 Growth of assets and liabilities (share of total growth)
The Banking sector registered
continuous growth in total assets
over the three years to 2011. In 2009
and 2011, there was a steady
decrease in the growth proportion as
compared to the growth proportion
observed in 2010. Significant growth
in the banking industry asset size
was buoyed mainly by deposits,
which also follow the same growth as
that of assets over the years.
Source: BNR, Bank Supervision Department
16
The proportion of growth of total loans significantly increased proportion in 2010 to 18.9% from 4.5% in
2009 and then decreased in 2011 to 4.8%. Government securities proportion of growth hugely increased in
2009, to reduce again in 2010 and 2011. While the proportion of growth of dues from banks abroad did not
significantly change over the period, except in 2009 what registered a slight decrease, the proportion of
growth of dues from banks in Rwanda, exceptionally increased from 2009 and decreased in 2010 and
2011. The detailed performance indicators of Rwandan banking sector are analyzed below in terms of
capital position, asset quality, earnings and profitability, and liquidity.
Capital position
The regulatory capital (total capital) to risk weighted assets (RWA) ratio served to assess the capital
adequacy of the each individual bank and the banking sector as a whole, while the core capital (Tier 1
capital) to risk weighted assets ratio is useful for monitoring capital quality as it measures the most freely
and immediately available resources to meet claims against deposit takers. A minimum Tier 1 capital to risk
weighted assets ratio of 10% and minimum total capital to risk weighted assets ratio of 15% are imposed to
all banks as tools to ensure that banks maintain adequate capital in relation to their risk assets thus
protecting depositors’ interests and promoting financial stability.
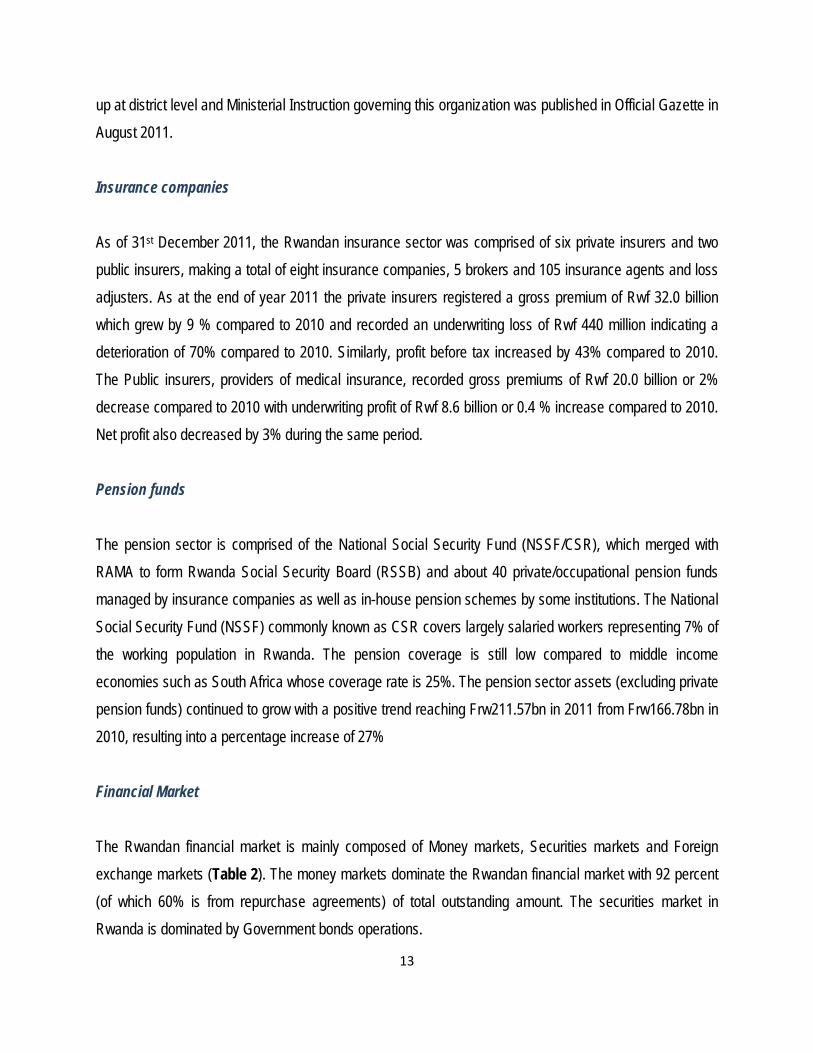
Figure 10 Banking capital adequacy as at 31 December 2011
Rwandan banks remained well
capitalized during the last three years
(2009-2011). By end December 2011,
conditions in the Rwandan banking sector
continued to show signs of improvement
and some positive developments were
recorded during the period under review
(Figure 10). Banks were adequately
capitalized in terms of Tier 1 and total
adequacy ratios, with both remaining well
Source: BNR, Bank Supervision Department

17
above the minimum prudential requirements of 10 per cent and 15 per cent respectively. The industry ratio
of core capital to total risk weighted assets as of end December 2011 was 23% in terms of Tier 1 and 25%
in terms of total capital. The key challenge for the banks going forward will be to maintain strong capital
positions if real economic activity deteriorates. The strong capital position at the industry level provides a
significant gauge of banks’ capacity to withstand unexpected losses arising from credit and market risks.
Without prejudice to the strong capital adequacy ratio of the banking industry, the National Bank of Rwanda
is continuously vigilant in prudential supervision to ensure that early problems in banks irrespective of the
size are detected and prudently addressed.
Asset quality
The total assets of the banking system grew strongly during the last three years by around 66 percent from
RWF 652 billion in 2009 to RWF 1,084 billion in 2011. Gross loans in the banking sector were around the
RWF 631.2 billion at the end of fourth quarter 2011. On an annual basis, gross loans increased by 23.1%
from RWF 512.8 billion end of December 2010 to RWF 631.2 billion as of 31st December 2011. The
performance assessment of the asset quality in the Rwandan banking system focuses on the level of non-
performing loans (NPLs ratio), credit concentration risk, and SME lending.
Non-performing loans
Figure 11 Trend of NPLs ratio (in percent)
The level of NPLs is a crucial element when assessing
the health of the banking system and financial system as
a whole. Therefore, the Non-Performing Loans to Total
Gross Loans ratio is an important measure of the quality
of the assets in banks’ loan portfolios. In times of
economic slowdown, loan repayments become
constrained and thus asset quality tends to deteriorate.
As per regulatory requirements, this situation would
require banks to make additional provisions which in
Source: BNR, Bank Supervision Department

18
turn have an impact on banks’ capital. Normally, the reported NPLs in the banking system exhibit large
variation among banks, partly reflecting different exposures to distressed sectors. During the last three
years, the ratio of Non-performing loans to Gross loans in Rwandan banking sector improved by declining
to 8% as of 31st December 2011 from 12% recorded in December 2009 (Figure 11). Although this ratio was
still above the maximum threshold required ratio of 7%, there was seven institutions out of 15 which had
their NPL rate this threshold.
The larger part of the portfolio impairment is from loans to commercial & hotel, followed by mortgages,
manufacturing, and transport & warehousing related businesses (Table 3). At the industry level, the level of
NPLs ratio above the maximum required ratio of 7% did not pose a systemic risk to financial stability and is
being addressed by a strong capital buffer held by the industry. However, the National Bank has required
the banks with high level of NPLs ratios to enhance their credit management system to curb further
deterioration of credit portfolios.
Table 3 Non-Performing Loans by activities sector as at 31 December 2011 (in 000s of RWF)
Source: BNR, Credit Reference Bureau Credit concentration risk
The credit concentration risk in asset portfolios is one of the major causes of bank distress both for
individual institutions and banking system as a whole. It is therefore important to measure concentration
risk in credit portfolios of banks that mainly arises from unexpected changes in macroeconomic and
financial market conditions on the performance of borrowers. The BNR monitors credit concentration in the

19
banking system to identify early signs of credit risk. For this purpose, in this report, the credit concentration
risk is analyzed through large exposures to capital ratio and loan by sector of activities. As of 31st
December 2011, Mortgages and Commercial & Hotels sectors accounted for the largest share of loans
both totaling 62% followed by personal loans (non-classified activities), manufacturing, and transport
sectors (Figure 12). In addition mortgages and commercial & hotels businesses were largest NPLs with
68.6% of NPLs as at end December 2011 while manufacturing and transports sectors came next.
Therefore, the credit concentration is likely to be directed mainly on mortgage industry, commercial &
hotels, manufacturing, and transports.
Figure 12 Percentage of loans by sector of activities
Source: BNR, Credit Reference Bureau
20
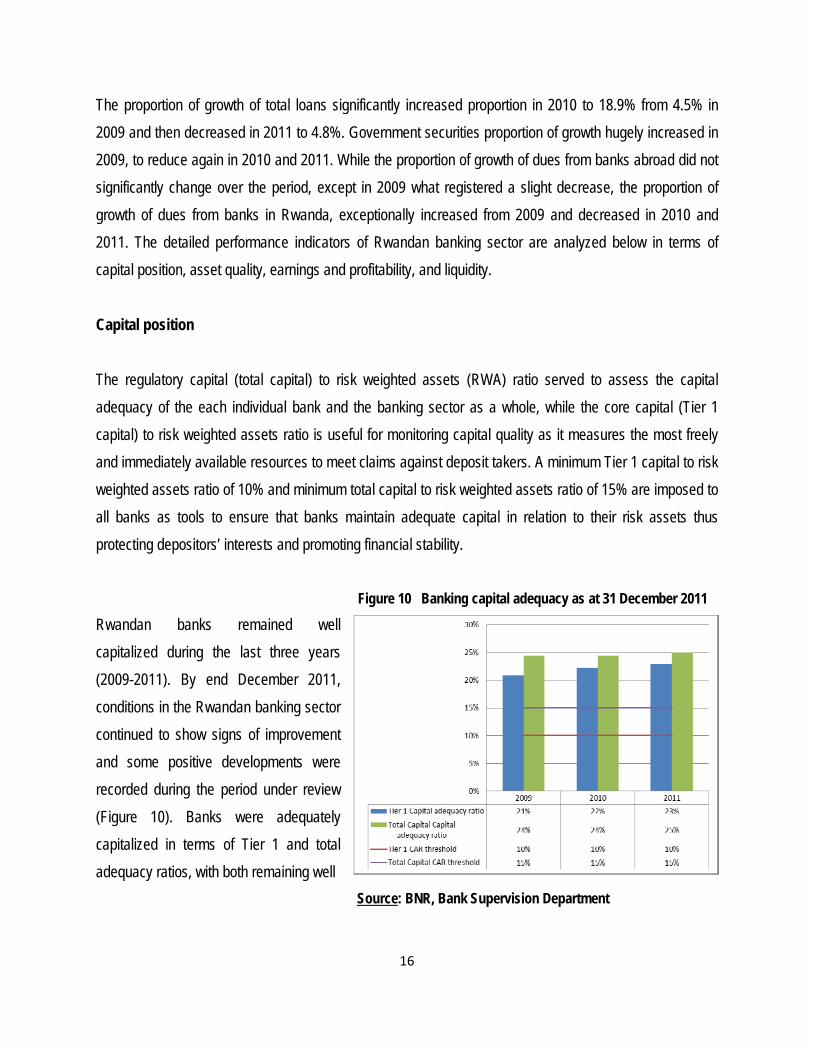
Figure 13 Large exposure to core capital as at 31 December 2011
Basically, when there is
considerable concentration in the
loan portfolio, banks become
vulnerable to the failure of large
borrowers. As far as the present
Rwandan banking system analysis
is concerned, the large exposure to
capital ratio is used as an indication
of vulnerabilities arising from the
Source: BNR, Bank Supervision Department concentration of credit risk. As of 31st
December 2011, all banks complied with the regulation on credit concentration and large exposure and the
growth rate of large exposures to core capital has registered a downward from 2010 to 2011(Figure 13).
SMEs lending
The banks’ lending to SMEs report of 2010 and 2011showed that banks extended loans to SMEs as in
2010 SMEs loans represented 17 percent of total banking system loans, and in 2011 the ratio was at 18
percent. Overall, the banking sector loans to SMEs rose from Rwf 87.5 billion to Rwf 118.4 representing an
increase of 26 percent. The expansion in the standards and credit terms and conditions was however
associated with increasing interest margins and stricter collateral requirements. If the trends that were
observed in liquidity levels continue and the expectations regarding general economic activity remain good,
these factors may contribute to further expansion of credit conditions, which may eventually have a positive
impact on economic growth.
Earnings and profitability
The earnings and profitability were assessed using the return on equity (ROE) and return on assets (ROA)
as well as the growth of income on advances and commissions.

21
The profitability indicators (Figure 14) show that profitability in Rwandan banking system recorded a
considerable increase over the last three years. The improvement in profitability can be explained by the
BNR continuous monitoring of the banking sector profitability followed by the improvement in asset quality
management in the overall banking sector. The ROE upgraded from 6% in 2009 to 14% in 2011 and ROA
increased from 1% in 2009 to 3% end of 2011.
Figure 14 Selected indicators of profitability (in percent)
In the period under review, income on advances
continued to grow, buoyed by strong loan growth.
Commissions’ income also continued to rise,
growing by 42 percent in the year to December
2011. The growth in bank lending was the main
contributor to a steady rise in after-tax profits,
which expanded by 42 percent in the year to
December 2011, maintaining the trend of the
previous period.
Source: BNR, Bank Supervision Department
Liquidity
The level of liquidity ratio is used to assess the liquidity management in Rwandan banking system. The
regulatory requirement of a minimum liquidity ratio of 20% is imposed to ensure that banks are all the time
capable of meeting the average cash withdraws at short notice.

22
Figure 15 Liquidity position as at 31 December 2011
During the last three years, the total deposits in
Rwandan banking system increased by 65%
from RWF 443 billion in 2009 to RWF 716 billion
as of 31st December 2011. This growth in
deposits indicates public confidence in the
banking system. The liquidity ratio (liquid assets
to deposits) which measures the banks’ ability to
meet liquidity needs from on hand liquid assets
was 45% as of 31st December 2011 and above
the minimum required of 20% (Figure 15). The
Source: BNR, Bank Supervision Department liquid asset to total assets ratio which gauges
banks’ ability to meet expected and unexpected demands for cash was 30% by end December 2011.
However, the liquid assets to short-term liabilities of 215% at the end of December 2011 indicates
mismatch between assets and liabilities in the Rwandan banking system.
Selected indicators in the Microfinance sector
The selected indicators will be analyzed to assess the performance of Rwandan Microfinance sector in
terms of capital position, assets quality, earnings and profitability, and liquidity.
Capital position
The capital adequacy ratio (equity to net assets) served to assess the capital position of Rwandan
Microfinance sector as at end December 2011. A minimum regulatory capital adequacy ratio of 15% is
required to all microfinance institutions to ensure they maintain adequate capital position.
23
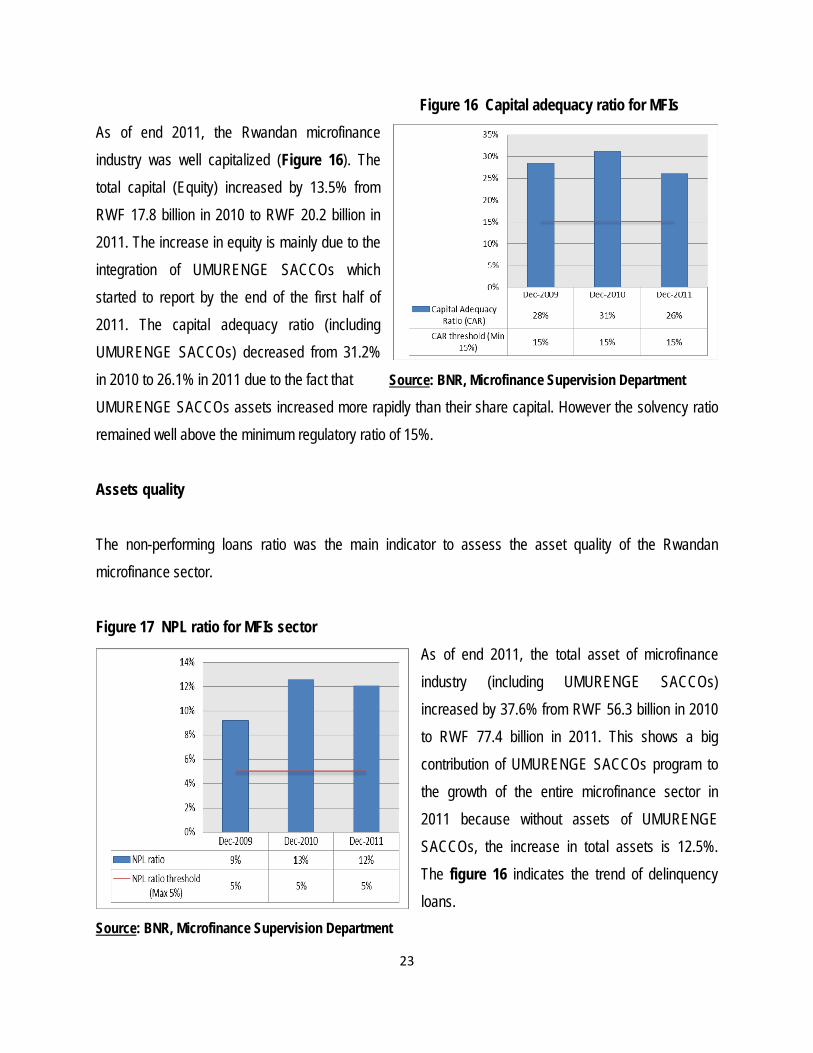
Figure 16 Capital adequacy ratio for MFIs
As of end 2011, the Rwandan microfinance
industry was well capitalized (Figure 16). The
total capital (Equity) increased by 13.5% from
RWF 17.8 billion in 2010 to RWF 20.2 billion in
2011. The increase in equity is mainly due to the
integration of UMURENGE SACCOs which
started to report by the end of the first half of
2011. The capital adequacy ratio (including
UMURENGE SACCOs) decreased from 31.2%
in 2010 to 26.1% in 2011 due to the fact that Source: BNR, Microfinance Supervision Department
UMURENGE SACCOs assets increased more rapidly than their share capital. However the solvency ratio
remained well above the minimum regulatory ratio of 15%.
Assets quality
The non-performing loans ratio was the main indicator to assess the asset quality of the Rwandan
microfinance sector.
Figure 17 NPL ratio for MFIs sector
As of end 2011, the total asset of microfinance
industry (including UMURENGE SACCOs)
increased by 37.6% from RWF 56.3 billion in 2010
to RWF 77.4 billion in 2011. This shows a big
contribution of UMURENGE SACCOs program to
the growth of the entire microfinance sector in
2011 because without assets of UMURENGE
SACCOs, the increase in total assets is 12.5%.
The figure 16 indicates the trend of delinquency
loans.
Source: BNR, Microfinance Supervision Department
24
The non-performing loans ratio decreased from 12.6% in 2010 to 12.0% in 2011. These ratios are above
the maximum of 5% accepted by best practices in microfinance sector. Without taking into account
UMURENGE SACCOs (with a standalone NPL ratio of 5.6%) the NPL ratio in the rest of microfinance
industry as at December 2011 was 12.9%.
Earnings and profitability
The return on equity (ROE) and return on assets (ROA) were the main indicators to assess the quality of
earnings and profitability in Rwandan microfinance sector.
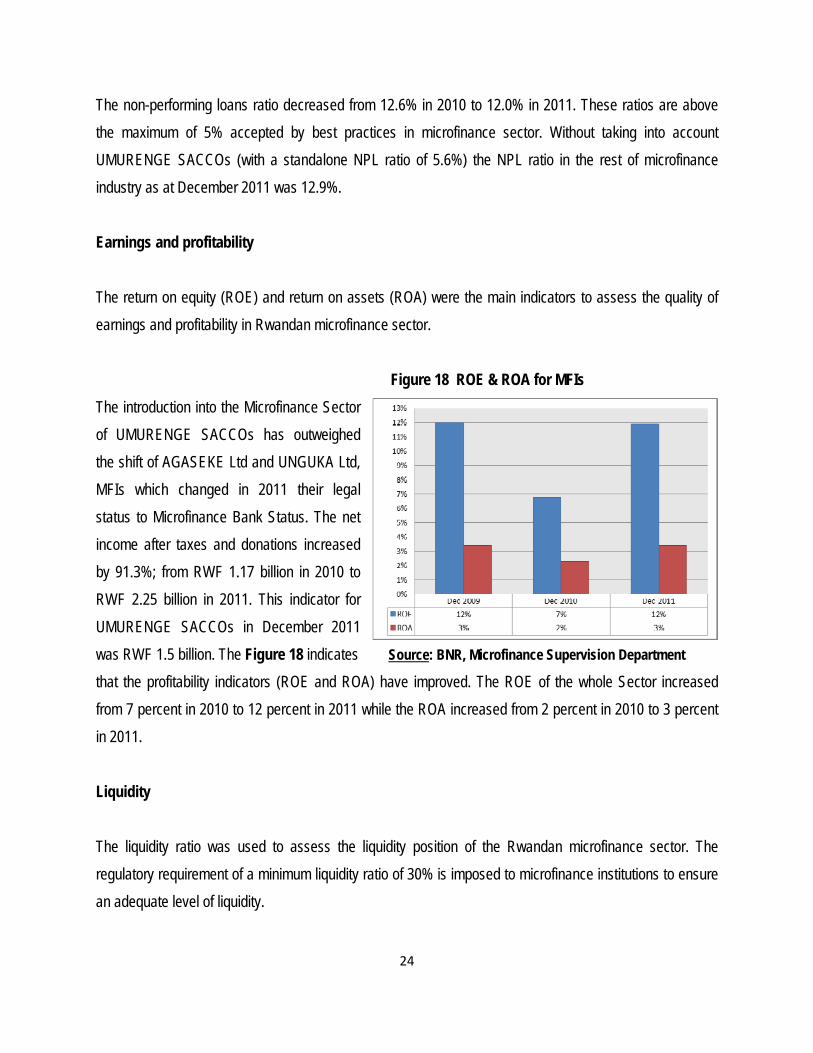
Figure 18 ROE & ROA for MFIs
The introduction into the Microfinance Sector
of UMURENGE SACCOs has outweighed
the shift of AGASEKE Ltd and UNGUKA Ltd,
MFIs which changed in 2011 their legal
status to Microfinance Bank Status. The net
income after taxes and donations increased
by 91.3%; from RWF 1.17 billion in 2010 to
RWF 2.25 billion in 2011. This indicator for
UMURENGE SACCOs in December 2011
was RWF 1.5 billion. The Figure 18 indicates Source: BNR, Microfinance Supervision Department
that the profitability indicators (ROE and ROA) have improved. The ROE of the whole Sector increased
from 7 percent in 2010 to 12 percent in 2011 while the ROA increased from 2 percent in 2010 to 3 percent
in 2011.
Liquidity
The liquidity ratio was used to assess the liquidity position of the Rwandan microfinance sector. The
regulatory requirement of a minimum liquidity ratio of 30% is imposed to microfinance institutions to ensure
an adequate level of liquidity.
25
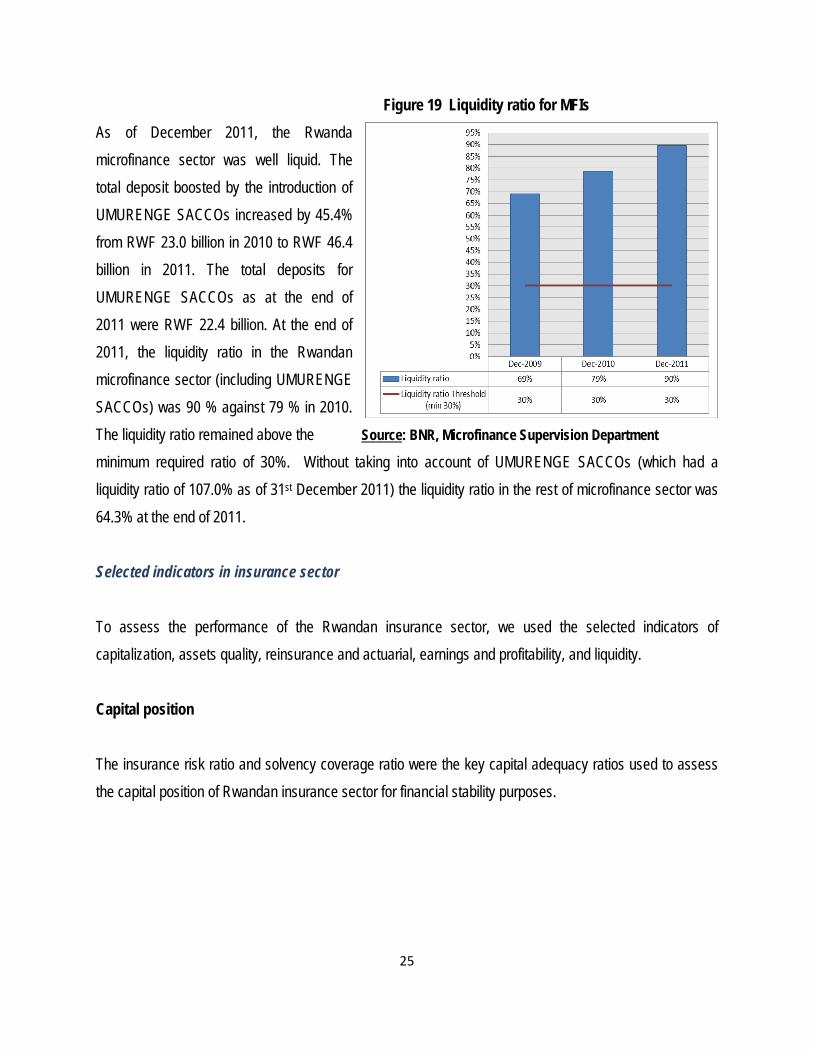
Figure 19 Liquidity ratio for MFIs
As of December 2011, the Rwanda
microfinance sector was well liquid. The
total deposit boosted by the introduction of
UMURENGE SACCOs increased by 45.4%
from RWF 23.0 billion in 2010 to RWF 46.4
billion in 2011. The total deposits for
UMURENGE SACCOs as at the end of
2011 were RWF 22.4 billion. At the end of
2011, the liquidity ratio in the Rwandan
microfinance sector (including UMURENGE
SACCOs) was 90 % against 79 % in 2010.
The liquidity ratio remained above the Source: BNR, Microfinance Supervision Department
minimum required ratio of 30%. Without taking into account of UMURENGE SACCOs (which had a
liquidity ratio of 107.0% as of 31st December 2011) the liquidity ratio in the rest of microfinance sector was
64.3% at the end of 2011.
Selected indicators in insurance sector
To assess the performance of the Rwandan insurance sector, we used the selected indicators of
capitalization, assets quality, reinsurance and actuarial, earnings and profitability, and liquidity.
Capital position
The insurance risk ratio and solvency coverage ratio were the key capital adequacy ratios used to assess
the capital position of Rwandan insurance sector for financial stability purposes.

26
Figure 20 Capital adequacy for Insurance sector
As the regulatory body, the BNR
ensure that all insurance companies
are well capitalized. Therefore, the
BNR focuses most of the attention to
the amount of capital held by
insurance companies and the level of
key capital adequacy indicators. The
Rwandan insurance industry, as at
December 2011, recorded an
increase of 27% in terms of total
capital from 85.0 billion in 2010 to 108
billion in 2011.
Source: BNR, NBFI Supervision Department
As at end December 2011 the overall insurance industry was adequately capitalized (Figure 20). The
solvency coverage ratio was far above the minimum required of 100% with an increase from 202.7% in
2010 to 208.0% in 2011. The insurance risk (Net premium written to paid up capital) ratio has been below
the regulatory maximum of 300% during the last three years with 50% and 42% as at end 2010, and 2011
respectively.
Assets quality
The key indicators served to assess the asset quality of the Rwandan insurance industry as of end 2011
were real estate investment to total assets ratio and equity investments to total assets ratio.
27
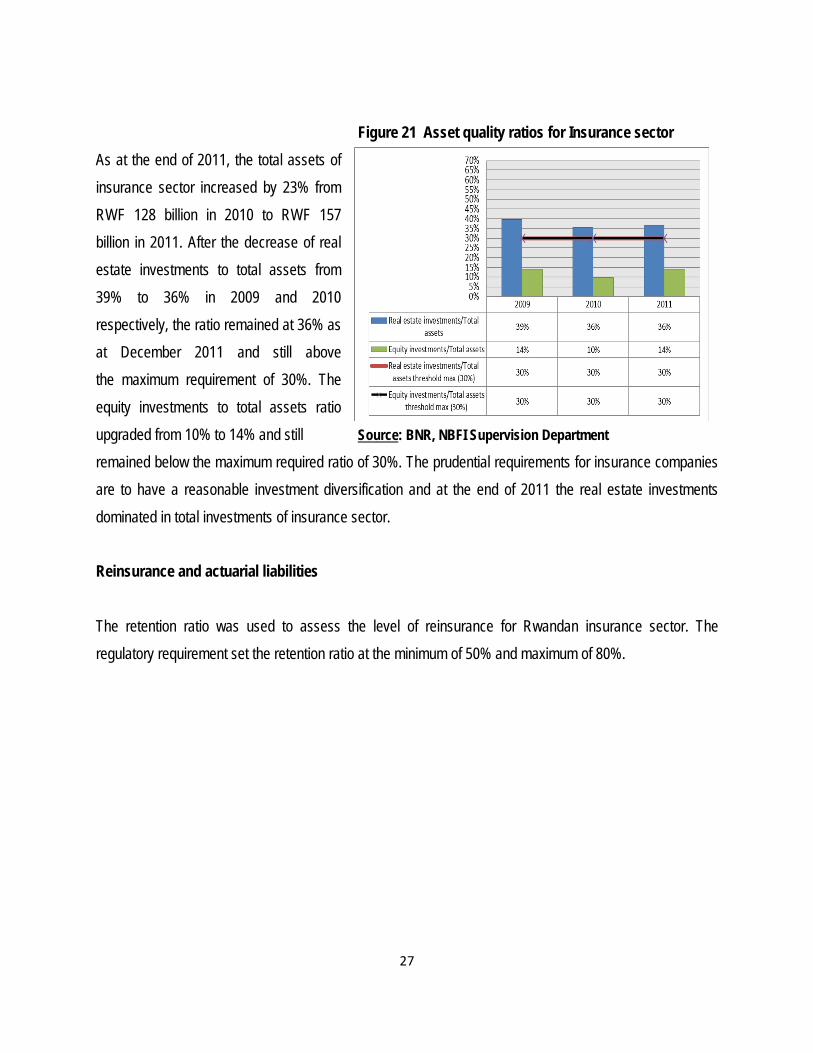
Figure 21 Asset quality ratios for Insurance sector
As at the end of 2011, the total assets of
insurance sector increased by 23% from
RWF 128 billion in 2010 to RWF 157
billion in 2011. After the decrease of real
estate investments to total assets from
39% to 36% in 2009 and 2010
respectively, the ratio remained at 36% as
at December 2011 and still above
the maximum requirement of 30%. The
equity investments to total assets ratio
upgraded from 10% to 14% and still Source: BNR, NBFI Supervision Department
remained below the maximum required ratio of 30%. The prudential requirements for insurance companies
are to have a reasonable investment diversification and at the end of 2011 the real estate investments
dominated in total investments of insurance sector.
Reinsurance and actuarial liabilities
The retention ratio was used to assess the level of reinsurance for Rwandan insurance sector. The
regulatory requirement set the retention ratio at the minimum of 50% and maximum of 80%.

28
Figure 22 Retention ratio for insurance sector
Overall, reinsurance ceded premiums for 2011
amounted to RWF 6.7 billion out of gross premiums
of RWF 51.9 representing a retention ratio of 87%.
This is above the maximum required of 80%. This
high ratio is due to the fact that only private insurers
have reinsurance arrangements. Therefore there are
no ceded premiums from public insurers. Thus,
reinsurance ceded premiums without public insurers
in 2011 remain RWF 6.7 billion out of RWF 32.0 billion Source: BNR, NBFI Supervision Department
representing a retention ratio of 79% slightly below the maximum required of 80%. It has been noted that
there is no reinsurance company operating in Rwanda and all the ceded premiums were paid to reinsurers
abroad.
Earnings and profitability
The key indicators to assess the performance of earnings and profitability in Rwandan insurance industry
were combined ratio, return on investment (ROI), return on equity (ROE), and return on assets (ROA).

29
Figure 23 Earnings and profitability for insurance sector
The insurance sector has been
profitable during the year end 2011
(Figure 23). Overall, the insurance
industry recorded an increase of 6%
from RWF 15.6 billion in 2010 to
RWF 16.6 billion in 2011. The
underwriting profit increased by 15%
from RWF 7.0 billion in 2010 to RWF
8.1 billion in 2011. The investment
income also has increased by 4%
from RWF 5.6 billion in 2010 to RWF
5.8 billion in 2011.
Source: BNR, NBFI Supervision Department
The return on investment (ROI) remained 13% in 2011 as at previous year while the return on equity (ROE)
and return on assets (ROA) ratios downgraded from 18% in 2010 to 17% in 2011 and from 12% in 2010 to
11% in 2011 respectively. The combined ratio for the industry also improved from 79% in 2010 to 83% as
of 31st December 2011 and is still between the minimum required of 50% and maximum required of 100%.
However, the private insurers indicated poor pricing and underwriting policies with combined ratio of 103%
in 2010 and 102% in 2011 above the maximum required of 100%.
Liquidity
To assess the level of liquidity of Rwandan insurance sector, the quick ratio and current ratio were used as
key indicators.
30
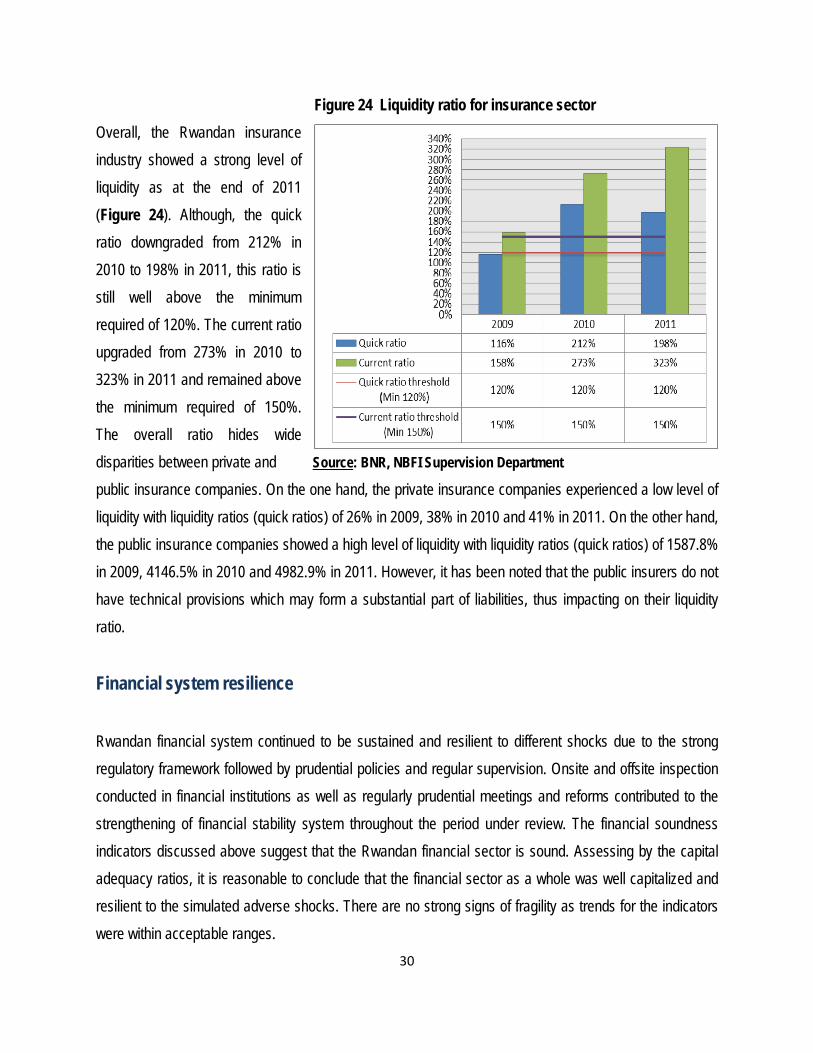
Figure 24 Liquidity ratio for insurance sector
Overall, the Rwandan insurance
industry showed a strong level of
liquidity as at the end of 2011
(Figure 24). Although, the quick
ratio downgraded from 212% in
2010 to 198% in 2011, this ratio is
still well above the minimum
required of 120%. The current ratio
upgraded from 273% in 2010 to
323% in 2011 and remained above
the minimum required of 150%.
The overall ratio hides wide
disparities between private and Source: BNR, NBFI Supervision Department
public insurance companies. On the one hand, the private insurance companies experienced a low level of
liquidity with liquidity ratios (quick ratios) of 26% in 2009, 38% in 2010 and 41% in 2011. On the other hand,
the public insurance companies showed a high level of liquidity with liquidity ratios (quick ratios) of 1587.8%
in 2009, 4146.5% in 2010 and 4982.9% in 2011. However, it has been noted that the public insurers do not
have technical provisions which may form a substantial part of liabilities, thus impacting on their liquidity
ratio.
Financial system resilience
Rwandan financial system continued to be sustained and resilient to different shocks due to the strong
regulatory framework followed by prudential policies and regular supervision. Onsite and offsite inspection
conducted in financial institutions as well as regularly prudential meetings and reforms contributed to the
strengthening of financial stability system throughout the period under review. The financial soundness
indicators discussed above suggest that the Rwandan financial sector is sound. Assessing by the capital
adequacy ratios, it is reasonable to conclude that the financial sector as a whole was well capitalized and
resilient to the simulated adverse shocks. There are no strong signs of fragility as trends for the indicators
were within acceptable ranges.

31
Under this section, the financial literacy and inclusion point was also discussed because of its influence to
the financial stability. It provides the public with the skills, knowledge and confidence to manage their
financial resources effectively and develops the culture of loan repayment and contributes to the financial
stability of the system since the public is aware of the importance of loan repayment and the consequences
of default.
Stress testing results
In monitoring the stability and resilience of the financial system, the National Bank of Rwanda (BNR)
conducts on quarterly basis stress tests on the commercial banks’ balance sheet against extreme shocks.
However, overtime, the stress tests will be extended to other deposit takers (Microfinance institutions and
development bank), pension and insurance sectors. The stress testing involves examining the impact of
key risks, namely capital adjustment, credit, exchange rate, and the liquidity risk on individual banks and on
the consolidated balance sheet of 9 commercial banks based on December 2011 data.
Capital adjustments
The first step in the stress testing exercise was to make adjustments to bank’s reported capital, risk-
weighted assets, and net assets to correct for under-provisioning in order to meet regulatory limits. The
criteria for the stress tests on assets quality used two capital measures as the relevant metric:
i. Regulatory capital divided by risk weighted assets (RWA) - CAR
ii. Core capital (Tier 1) to net assets as a conservative measure of capital.
Capital measures were also adjusted by including general provisions and combination of general and
specific provisions.
Based on data reported as of end December 2011, Rwandan banking system was well capitalized and the
capital adequacy ratios were above 10% before and after adjustments using both regulatory capital (BNR
CAR definition) and conservative measure (Core capital to net assets). Overall, the capital adequacy ratio
of 8 banks was above 15% while the capital adequacy of one bank fell between 10% and 15%.

32
Compliance with provisioning regulation has upgraded. While only one bank was under provisioned as of
September 2010 (FSAP report), no bank was under provisioned at the end of December 2011.
Credit and concentration risks
The second step in the stress testing exercises looks on credit and concentration risks. Lending is the core
of traditional banking business. In most banking systems, credit risk is the key type of risk. The stress tests
on credit and concentration risks as of December 2011 applied the following shocks: (i) a 100% discount on
collateral, imposition of general provision and combination of discount on collateral and general provisions;
(ii) a uniform increase of NPLs; (iii) the breaking point from a haircut on good loans; (iv) increase in NPLs
for housing and agriculture sectors, and (v) a 100% large borrowers default. The method used in the credit
sensitivity analysis consisted of estimating the additional provisions that would be required to cover the
estimated loss and charging it to capital. The provisioning shortfall was deducted from risk weighted assets
and net assets as well as capital.
As stress test on Banks’ balance sheets for a strict haircut to the eligible collateral held against classified
loans revealed that the overall banking industry is well provisioned. According to the regulation on loan
classification and provisioning, not all collateral held against a loan is eligible for the purposes of
provisioning; the regulation defines and lists eligible collaterals. Under the assumption that 100% of
collateral held against classified loans (NPLs) becomes valueless, the overall banking industry is still over
provisioned and core capitalization would increase slightly to 14.6% and regulatory capitalization (CAR) to
22.8%. The imposition of 1% general provisions (on normal and watch loans) would cause a downgrade of
core capitalization to 14.0% and regulatory capitalization to 21.9%. The combination of 100% discount on
collateral and imposition of 1% general provisions would lead the core capitalization to decline to 14.2%
and regulatory capitalization to 22.2%. Still the regulatory capitalization is above the minimum regulatory
level of 15% and the banking system is still well capitalized.
With regards to the shock on NPLs (uniform increase); this step consisted of testing the level at which an
increase in NPLs results in the first bank failure. The stress test as at 31st December 2011 shows that the
first bank would fail if NPLs would increase by 312%. As this is above the 100%, it shows a strong
resilience and soundness of the Rwandan banking system.
33
The industry was also stress tested by applying a haircut on good loans. This step consisted of the break
point from a haircut on total performing loans i.e. test the level at which a haircut results in the first bank
failure. The stress test as at 31 December 2011 shows that a shock of 24% in good loans (performing
loans) would cause the first bank failure in Rwandan banking system. Under this assumption, the industry
would still being adequately capitalized as a whole in term of regulatory capitalization.
When shocks for housing and agriculture sectors are introduced, the overall banking industry remains
adequately capitalized. The tests consisted to the likelihood of the increase in NPLs and haircuts of PLs for
housing and agriculture sectors. A shock to the housing sector, assuming that NPLs would increase by
30%, would reduce industry core capitalization to 14.4% and regulatory capitalization to 22.6% (still above
the required 15%). The stress testing results shows that a haircut of 67% on good housing loans would
cause the first bank failure in Rwandan banking system as at 31 December 2011. Under this assumption,
core capitalization would decline to 9.5% and regulatory capitalization to 15.3% and the industry would be
still complying with regulatory capitalization level. A shock to the agriculture sector, assuming that NPLs
would increase by 20%, would reduce industry core capitalization to 14.4% and regulatory capitalization to
22.5% (still above the required 15%). The stress testing results shows that a haircut of 100% on good
agriculture loans would cause core capitalization to reduce to 13.3% and regulatory capitalization to 20.9%
and the industry as a whole would still well capitalized.
Assuming 100% large borrowers default, tests for concentration risk found that banks will keep above their
minimum regulatory capital ratios. Under this assumption, core capitalization would decline to 11.8% and
regulatory capitalization to 18.7%.
Exchange rate risk
The third step of stress testing concerned exchange rate risk. With regard to the market risk, the effect of a
depreciation of the Rwandan Franc to the USD which is the dominant FX exposure was calculated. As at
31st December 2011, foreign exchange risk tests measured the impact of shocks on net open position
(NOP) and capital. The test measured the revaluation gains (losses) on the NOP in US dollars from
simultaneous depreciation (appreciation). The results were measured against the NOP requirement. In
Rwandan banking system, foreign exchange rate risk is dampened by the fact, over the period under

34
review, that banks are required to maintain the NOP not more than ±20 percent of capital. During the
period under review, in overall, banks were compliant and the FX position to capital was 17% of capital as
of December 2011, which was within the regulatory limits. Stress tests found that an increase of 15% in FX
rate from the rate RWF 604 to US$ 1 to a rate of RWF 695 to US$ 1 would reduce core capitalization by
only 2.0 percentage points and regulatory capitalization by only 2.9 percentage points. Therefore, this
reduction would not affect the level of capitalization because the overall banking system would still being
well capitalized.
Liquidity risk
The last step undertaken by the stress testing exercise was to assess liquidity risk. By end 31 December
2011, liquidity risk test simulated the following shocks: (i) a 20 percent drop in deposit and its effect on the
basic liquidity ratio (i.e. liquid assets to total assets); and (ii) the same shock and its effect on BNR’s
definition of liquidity ratio (i.e. liquid assets to deposits). The results were measured against the 20 percent
liquidity requirement for Rwandan banks. Under assumption of a drop of 20% in deposits as at December
2011, using BNR’s definition, the industry liquidity ratio reduced to 33% from 46% and still above the 20%
required. In overall, Rwandan commercial banks were reasonably liquid as at 31 December 2011.
Ultimately, the stress testing results indicate that the resilience of Rwandan banking system continued to be
sustained during the period under review. The static stress tests covering standard shocks and breaking
points showed that, for the period ending 31st December 2011, the Rwandan banking system was resilient
to adverse changes in asset quality (credit and concentration risk), liquidity, and exchange rate. However,
the level of NPLs and loan concentration (especially for mortgage loans) need to be monitored carefully.
Rwandan financial literacy and financial inclusion
A large proportion of the Rwandan population, particularly in rural areas, do not benefit from financial
services, i.e. they are financially excluded. During the last three years, the BNR continued to reinforce the
supervisory legal framework to accommodate new market developments such as agent banking, mobile
banking among others, all aiming to widen financial access. Banks have expressed interest in these new
innovations and as of December 2011 three banks have been licensed to offer agent banking. In addition to
35
encouraging product innovations and network expansion, two new regional banks opened up subsidiaries.
In the year 2011, the number of open accounts increased by 14.4 percent from 1.77 million accounts to
2.03 million accounts in the banking sector while bank’s branches and outlets networks reached 683
countrywide supplemented by 170 ATMs. Under the National SME development policy, Business
Development Fund (BDF) was assigned to develop access to finance and capacity building solutions for
SMEs.
In the same way of promoting access to finance, Rwanda has established savings and credit cooperatives
in each of the geographically defined sector known as UMURENGE SACCOs and BNR established a
supervision function of those SACCOs and other MFIs at the district level.
In line with the promotion of financial inclusion, Access to Finance Forums (AFF) were launched in all
districts. AFF is a platform where local authorities, commercial banks, MFIs, SACCOs and others financial
institutions, the Technical Control Unit of SACCOs and development partners meet and discuss the
constraints relating to access to finance both on demand and supply side and work out how to address
them. Issues discussed in AFF include the problem of financial exclusion, SMEs financing and the rationale
for strategic linkages between commercial banks and MFIs and SACCOs and the possible mutual benefits.
With regard to the financial literacy, many initiatives regarding financial education were put in place through
NGOs and schools financial education program, but they were still dispersed and non-coordinated. For this
reason, the Government embarked the development of a well-coordinated national literacy strategy leading
to mobilizing all stakeholders (including industry players) for a financial awareness campaign program with
BNR.
36
Infrastructure and regulation
Developments in payment systems
Although the Government of Rwanda has put considerable effort in the modernization of payment systems,
cash in form of currency in circulation (notes and coins) is still the most widely used means of payment in
Rwanda. The non-cash instruments have registered significant growth by end December 2011. They
include cheques, credit transfers, traveler’s cheques, certified cheques, bank cards both debit and credit,
and mobile banking. The table below shows basic payment indicators as at the end of December 2011.
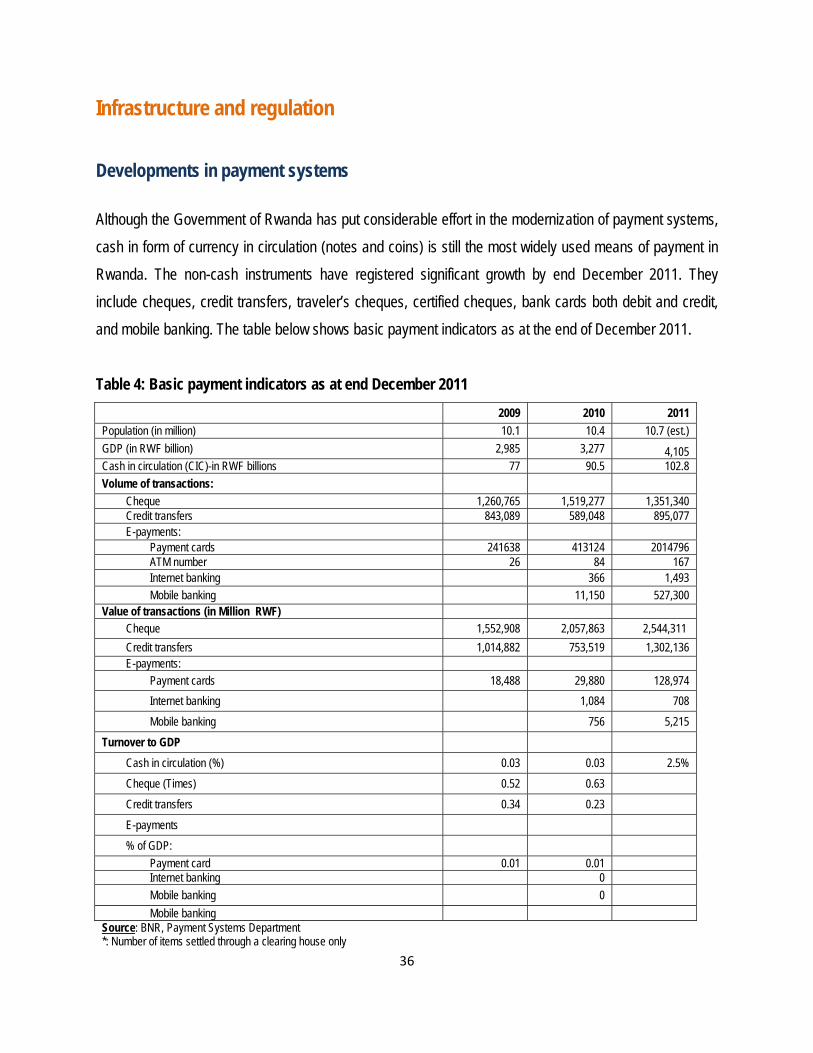
Table 4: Basic payment indicators as at end December 2011
2009 2010 2011
Population (in million) 10.1 10.4 10.7 (est.)
GDP (in RWF billion) 2,985 3,277 4,105 Cash in circulation (CIC)-in RWF billions 77 90.5 102.8
Volume of transactions:
Cheque 1,260,765 1,519,277 1,351,340 Credit transfers 843,089 589,048 895,077 E-payments:
Payment cards 241638 413124 2014796 ATM number 26 84 167 Internet banking 366 1,493
Mobile banking 11,150 527,300 Value of transactions (in Million RWF)
Cheque 1,552,908 2,057,863 2,544,311
Credit transfers 1,014,882 753,519 1,302,136 E-payments:
Payment cards 18,488 29,880 128,974
Internet banking 1,084 708
Mobile banking 756 5,215
Turnover to GDP
Cash in circulation (%) 0.03 0.03 2.5%
Cheque (Times) 0.52 0.63
Credit transfers 0.34 0.23
E-payments
% of GDP:
Payment card 0.01 0.01 Internet banking 0
Mobile banking 0
Mobile banking Source: BNR, Payment Systems Department *: Number of items settled through a clearing house only
37
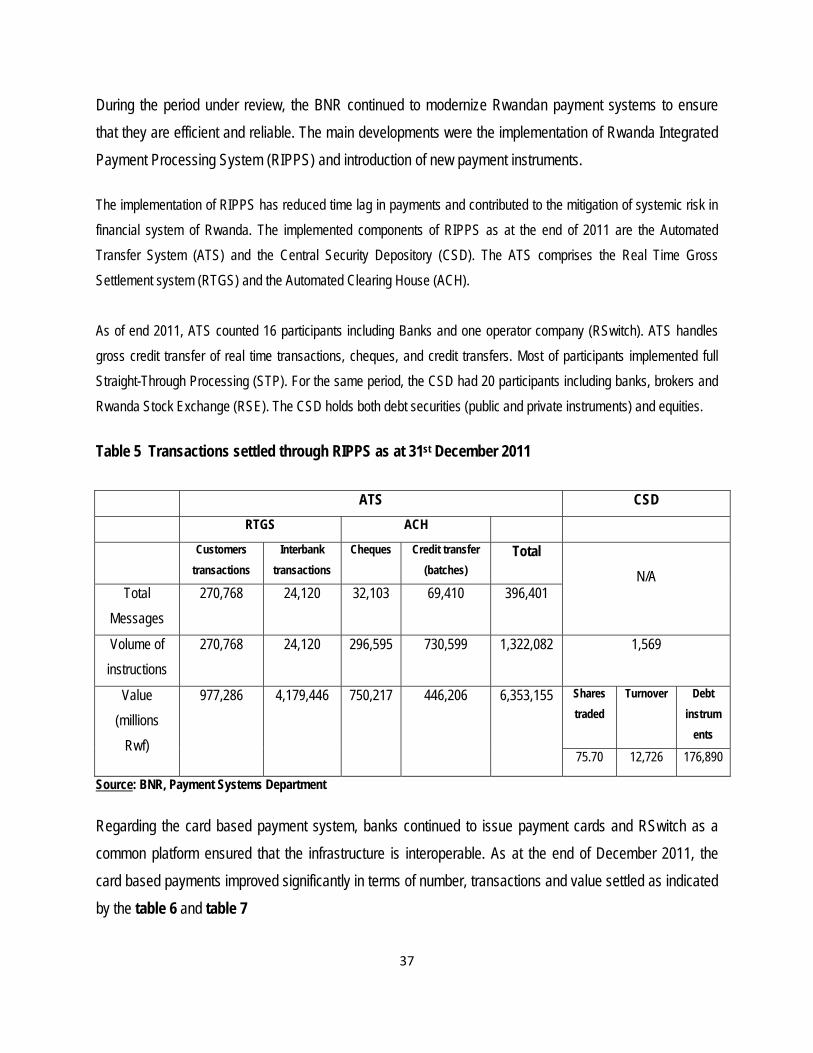
During the period under review, the BNR continued to modernize Rwandan payment systems to ensure
that they are efficient and reliable. The main developments were the implementation of Rwanda Integrated
Payment Processing System (RIPPS) and introduction of new payment instruments.
The implementation of RIPPS has reduced time lag in payments and contributed to the mitigation of systemic risk in
financial system of Rwanda. The implemented components of RIPPS as at the end of 2011 are the Automated
Transfer System (ATS) and the Central Security Depository (CSD). The ATS comprises the Real Time Gross
Settlement system (RTGS) and the Automated Clearing House (ACH).
As of end 2011, ATS counted 16 participants including Banks and one operator company (RSwitch). ATS handles
gross credit transfer of real time transactions, cheques, and credit transfers. Most of participants implemented full
Straight-Through Processing (STP). For the same period, the CSD had 20 participants including banks, brokers and
Rwanda Stock Exchange (RSE). The CSD holds both debt securities (public and private instruments) and equities.
Table 5 Transactions settled through RIPPS as at 31st December 2011
ATS CSD
RTGS ACH
Customers
transactions
Interbank
transactions
Cheques Credit transfer
(batches)
Total
N/A Total
Messages
270,768 24,120 32,103 69,410 396,401
Volume of
instructions
270,768 24,120 296,595 730,599 1,322,082 1,569
Value
(millions
Rwf)
977,286 4,179,446 750,217 446,206 6,353,155 Shares
traded
Turnover Debt
instrum
ents
75.70 12,726 176,890
Source: BNR, Payment Systems Department
Regarding the card based payment system, banks continued to issue payment cards and RSwitch as a
common platform ensured that the infrastructure is interoperable. As at the end of December 2011, the
card based payments improved significantly in terms of number, transactions and value settled as indicated
by the table 6 and table 7

38
Table 6 Evolution of card based payments as at end December 2011
Items 2009 2010 2011
Number of ATMs 26 84 167
Number of Point of Sale (POS) terminals 99 298
Number of debit cards 30,065 41,377 208,767
Number of credit cards 453 172 526
Number of prepaid cards 3,270
Total number of ATM networks 2 3 5
Total number of POS networks 1 2 Source: BNR, Payment Systems Department Except ATMs of one new bank, all ATMs are interoperable and some of ATMs and POSs accept
international cards such as VISA and ZIPP cards. Negotiations with different international card service
providers are ongoing to ensure all international cards are accepted on Rwanda payments terminals.
Table 7 Cashless Payment Instruments: Number and Value of Transactions as at 31 December 2011
Type of instruments and e-Money
2009 2010 2011
Number of Transact.
Value (in Million of RWF)
Number of Transact.
Value (in Million of RWF)
Number of Transact.
Value (in Million of RWF)
Cheque 1,260,765 1,552,908 1,519,277 2,057,863 1,351,340
Credit card 20,149 7,450 20,036 2,897 42,545 4,698
Debit card
International debit 0 0 0 0 52,930 2,396
Domestic based ATM card 221,489 11,038 393,088 26,983 1,880,881 115,442
E-money
Mobile banking 0 0 11,150 756 527,300 5,215
Internet banking 0 0 366 1,084 1493 708 Source: BNR, Payment Systems Department In the side of electronic payments and money transfer, the payment indicators show significant
improvements during the period under review. Several banks offer mobile and internet banking services to
their clients. As at the end of December 2011, two companies have been licensed to provide mobile
payment services and 14 institutions (excluding financial institutions) - two foreign and twelve domestic
institutions - were licensed as money transfer services providers.
39
New laws and regulations
For the banking system, the BNR continued to implement the banking law by putting in place new
regulations; fifteen regulations were published in the Official Gazette and two were drafted in 2011. A
feasibility study on deposit Insurance fund for banks and MFIs was completed, and the draft law on the
establishment of the Fund was prepared.
In line with the Memorandum of Economic and Financial Program signed with the IMF, in 2008 the BNR
published the National Payment System Framework and Strategy which stated the vision and objectives of
payment system modernization.
In 2009 the Payment system Law was passed by Parliament and a regulation governing the Payment
Service Providers was approved by the BNR board. In 2010, concerted effort was put into finalizing the
relevant laws and regulations such as: the Electronic Transactions law, the law on the Central Securities
Depository and the Payment Systems law which were all published in the official Gazette. Several
regulations were also published, notably; regulation on Electronic Funds transfers, regulation on licensing
payment systems, regulation on oversight and the regulation on participation in the Central Securities
Depository.
Currently the insurance sector is governed by the insurance law N 52/2008 and a number of insurance
regulations that are stipulated below:
a) The Insurance Regulation on licensing requirements and other requirements for carrying out
insurance business;
b) The Insurance Regulation on licensing and other requirements for insurance intermediaries;
c) The Insurance Regulation on corporate governance requirements;
d) The Insurance Regulation on accreditation and other requirements for external auditors of banks,
insurers and insurance brokers;
e) The Insurance Regulation on market conduct requirements for insurers and insurance
intermediaries, and,
f) The Insurance Regulation on market capacity facilitation requirements for foreign insurers.
40
In the pension area, pension law was drafted and submitted to Parliament in June 2011number of
regulations were also drafted pending for the pension law enactment:
- Regulation on Licensing and registration of service providers
- Regulation on Licensing and registration of pension schemes
- Regulation on operating standards for pension schemes and service providers. This regulation
defines investment benchmarks for pension funds, market conduct for service providers and
corporate governance.
Observance of standards, principles and codes
In the domain of banking supervision core principles, the IMF FSAP report on assessment of the state of
compliance with Basel Core Principles for Effective Banking Supervision (BCPs) in Rwanda conducted in
February 2011, showed that, out of 25 BCPs, Rwanda was compliant with 6 BCPs, largely compliant with
13 BCPs, Materially non-compliant with 4 BCPs, Non-compliant with 1 BCP, and 1 BCP was not applicable.
The same report gave recommendations to be implemented by the Central Bank for full compliance.
With regard to the insurance supervision core principles, the BNR has carried out a self-assessment on
compliance of the legal and regulatory framework to insurance core principles (ICPs) and undergone a peer
review with other EAC country members. The exercise was scheduled to be terminated in 2012.
In the domain of payment systems standards, ten core principles for systemically important payment
systems (SIPS), 30 IOSCO Principles of Securities Regulation and 5 general principles for remittances
services and retail payment systems are general standards for the design and operation of payment and
settlement systems, and aim to emphasize the basic principles of security, reliability and efficiency that
should be upheld by systemically important payment systems. As at the end of 2011, the BNR was
compliant with 5 SIPS principles, 11 IOSCO principles and all 5 general principles for remittances and retail
payment systems standards.

41
The outlook for Rwandan financial stability
The outlook for Rwandan financial stability remains positive. As of end 2011, the financial system remained
relatively stable and resilient as proven by stress testing results thanks to the strong capitalization and
strengthened legal, regulatory and supervisory framework. Although there appear to be no major threats to
systemic stability in the short term, risks, particularly to credit could emerge due to the high level of NPLs
and credit concentration in the banking system. In addition, the uncertainty of the global economic stability,
especially in the euro zone, and regional inflationary pressures could pose challenges to Rwandan financial
stability.
Going forward, it is expected that the Rwandan financial system will face some challenges due to the
unfavorable global and regional economic growth. Mindful of the potential risks to the financial stability, the
BNR remains vigilant in its regular supervision of the financial system for any early warnings and committed
to take proactive actions accordingly. The BNR will continue to monitor the soundness of financial
institutions under its supervision regime. As the financial system is dominated by the banking system, more
attention will be brought to the banks. The National Bank will continue to ensure that banks remain prudent
in their operations through on-site and off-site examinations. The non-performing loans (NPLs) ratio is an
important measure of the quality of the assets in banks’ loan portfolios. Therefore, the maximum of 5
percent of NPLs ratio is the new target set for the year end 2012 in Rwandan banking sector as measure of
the asset quality management. The risk based supervision approach adopted by the National Bank of
Rwanda is expected to contribute towards the mitigation of any emerging risks to financial sector stability.
Since safeguarding financial stability calls for a macro-supervision of the financial system as whole
(covering banks, microfinance institutions, insurance and pension companies), the BNR ensures that it is
equipped with a strong legal, regulatory and supervisory framework, as well as prudent monetary policy.
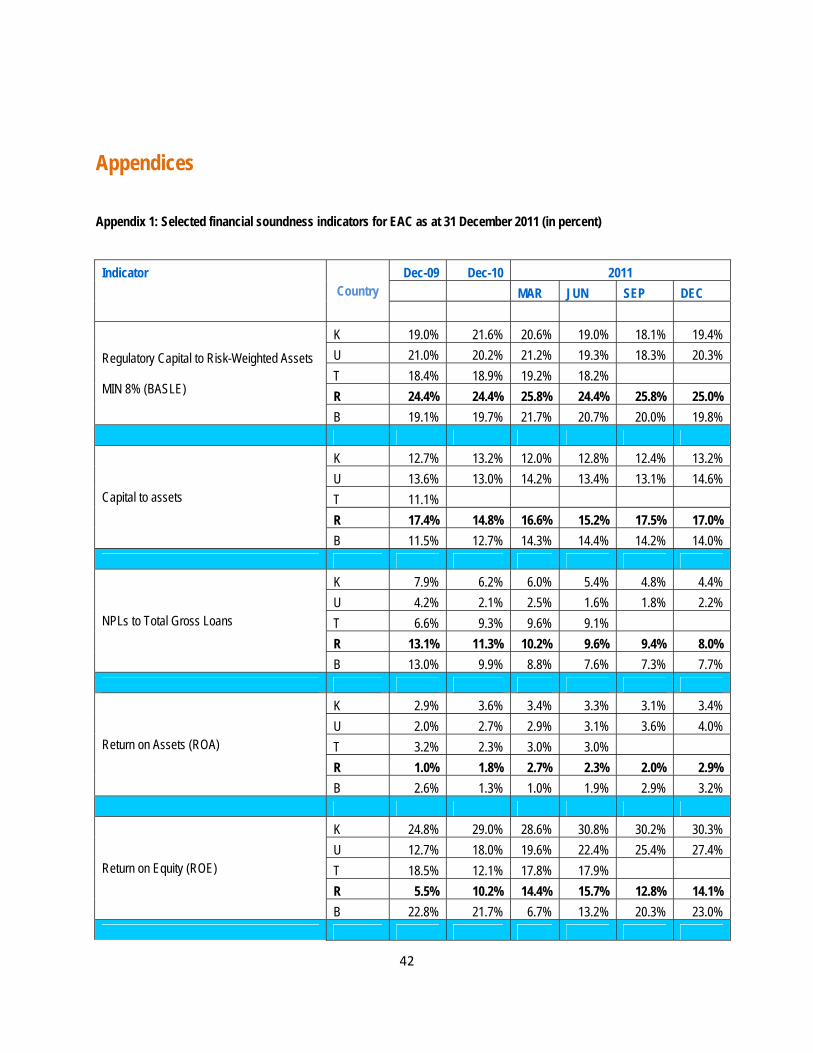
42
Appendices
Appendix 1: Selected financial soundness indicators for EAC as at 31 December 2011 (in percent)
Indicator Country
Dec-09 Dec-10 2011
MAR JUN SEP DEC
Regulatory Capital to Risk-Weighted Assets MIN 8% (BASLE)
K 19.0% 21.6% 20.6% 19.0% 18.1% 19.4%
U 21.0% 20.2% 21.2% 19.3% 18.3% 20.3%
T 18.4% 18.9% 19.2% 18.2%
R 24.4% 24.4% 25.8% 24.4% 25.8% 25.0%
B 19.1% 19.7% 21.7% 20.7% 20.0% 19.8%
Capital to assets
K 12.7% 13.2% 12.0% 12.8% 12.4% 13.2%
U 13.6% 13.0% 14.2% 13.4% 13.1% 14.6%
T 11.1%
R 17.4% 14.8% 16.6% 15.2% 17.5% 17.0%
B 11.5% 12.7% 14.3% 14.4% 14.2% 14.0%
NPLs to Total Gross Loans
K 7.9% 6.2% 6.0% 5.4% 4.8% 4.4%
U 4.2% 2.1% 2.5% 1.6% 1.8% 2.2%
T 6.6% 9.3% 9.6% 9.1%
R 13.1% 11.3% 10.2% 9.6% 9.4% 8.0%
B 13.0% 9.9% 8.8% 7.6% 7.3% 7.7%
Return on Assets (ROA)
K 2.9% 3.6% 3.4% 3.3% 3.1% 3.4%
U 2.0% 2.7% 2.9% 3.1% 3.6% 4.0%
T 3.2% 2.3% 3.0% 3.0%
R 1.0% 1.8% 2.7% 2.3% 2.0% 2.9%
B 2.6% 1.3% 1.0% 1.9% 2.9% 3.2%
Return on Equity (ROE)
K 24.8% 29.0% 28.6% 30.8% 30.2% 30.3%
U 12.7% 18.0% 19.6% 22.4% 25.4% 27.4%
T 18.5% 12.1% 17.8% 17.9%
R 5.5% 10.2% 14.4% 15.7% 12.8% 14.1%
B 22.8% 21.7% 6.7% 13.2% 20.3% 23.0%
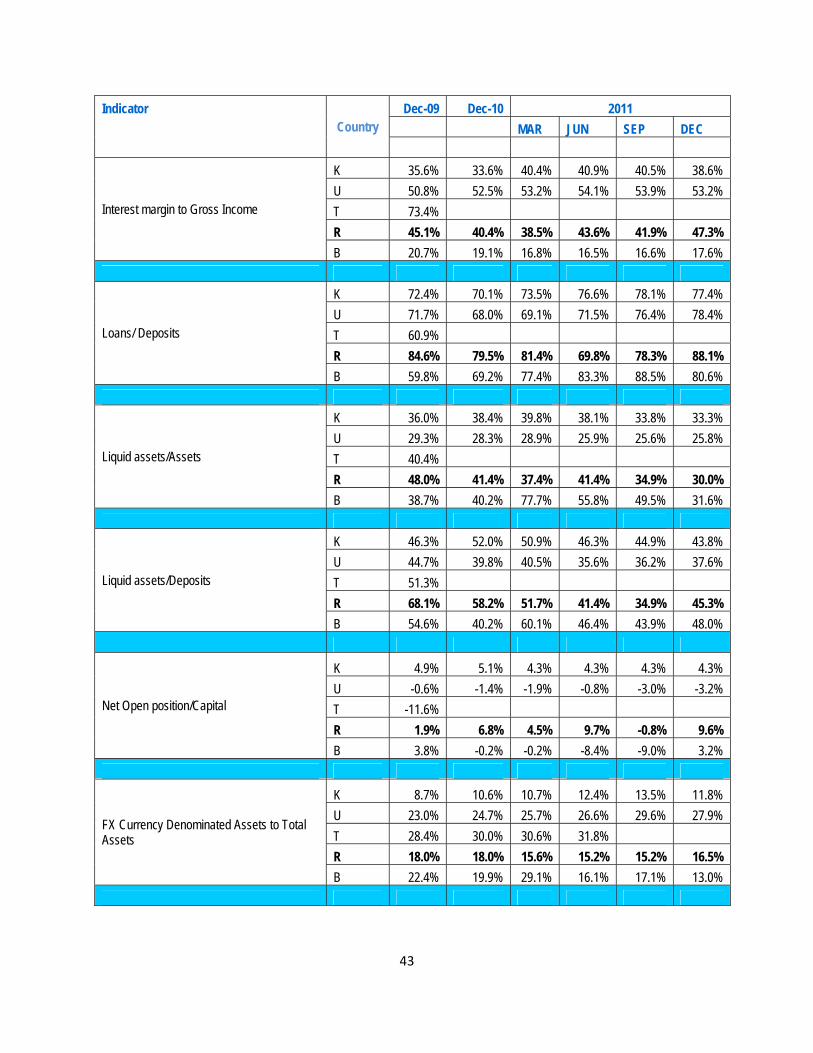
43
Indicator Country
Dec-09 Dec-10 2011
MAR JUN SEP DEC
Interest margin to Gross Income
K 35.6% 33.6% 40.4% 40.9% 40.5% 38.6%
U 50.8% 52.5% 53.2% 54.1% 53.9% 53.2%
T 73.4%
R 45.1% 40.4% 38.5% 43.6% 41.9% 47.3%
B 20.7% 19.1% 16.8% 16.5% 16.6% 17.6%
Loans/ Deposits
K 72.4% 70.1% 73.5% 76.6% 78.1% 77.4%
U 71.7% 68.0% 69.1% 71.5% 76.4% 78.4%
T 60.9%
R 84.6% 79.5% 81.4% 69.8% 78.3% 88.1%
B 59.8% 69.2% 77.4% 83.3% 88.5% 80.6%
Liquid assets/Assets
K 36.0% 38.4% 39.8% 38.1% 33.8% 33.3%
U 29.3% 28.3% 28.9% 25.9% 25.6% 25.8%
T 40.4%
R 48.0% 41.4% 37.4% 41.4% 34.9% 30.0%
B 38.7% 40.2% 77.7% 55.8% 49.5% 31.6%
Liquid assets/Deposits
K 46.3% 52.0% 50.9% 46.3% 44.9% 43.8%
U 44.7% 39.8% 40.5% 35.6% 36.2% 37.6%
T 51.3%
R 68.1% 58.2% 51.7% 41.4% 34.9% 45.3%
B 54.6% 40.2% 60.1% 46.4% 43.9% 48.0%
Net Open position/Capital
K 4.9% 5.1% 4.3% 4.3% 4.3% 4.3%
U -0.6% -1.4% -1.9% -0.8% -3.0% -3.2%
T -11.6%
R 1.9% 6.8% 4.5% 9.7% -0.8% 9.6%
B 3.8% -0.2% -0.2% -8.4% -9.0% 3.2%
FX Currency Denominated Assets to Total Assets
K 8.7% 10.6% 10.7% 12.4% 13.5% 11.8%
U 23.0% 24.7% 25.7% 26.6% 29.6% 27.9%
T 28.4% 30.0% 30.6% 31.8%
R 18.0% 18.0% 15.6% 15.2% 15.2% 16.5%
B 22.4% 19.9% 29.1% 16.1% 17.1% 13.0%
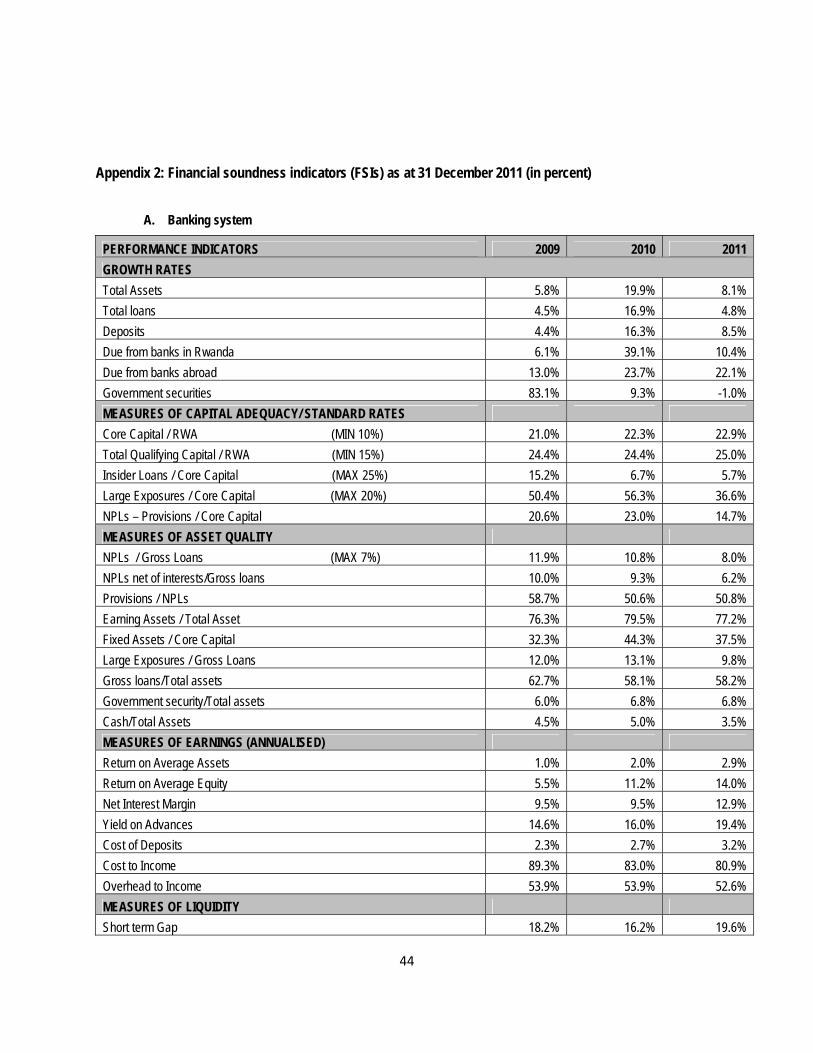
44
Appendix 2: Financial soundness indicators (FSIs) as at 31 December 2011 (in percent)
A. Banking system
PERFORMANCE INDICATORS 2009 2010 2011
GROWTH RATES
Total Assets 5.8% 19.9% 8.1%
Total loans 4.5% 16.9% 4.8%
Deposits 4.4% 16.3% 8.5%
Due from banks in Rwanda 6.1% 39.1% 10.4%
Due from banks abroad 13.0% 23.7% 22.1%
Government securities 83.1% 9.3% -1.0%
MEASURES OF CAPITAL ADEQUACY/ STANDARD RATES
Core Capital / RWA (MIN 10%) 21.0% 22.3% 22.9%
Total Qualifying Capital / RWA (MIN 15%) 24.4% 24.4% 25.0%
Insider Loans / Core Capital (MAX 25%) 15.2% 6.7% 5.7%
Large Exposures / Core Capital (MAX 20%) 50.4% 56.3% 36.6%
NPLs – Provisions / Core Capital 20.6% 23.0% 14.7%
MEASURES OF ASSET QUALITY
NPLs / Gross Loans (MAX 7%) 11.9% 10.8% 8.0%
NPLs net of interests/Gross loans 10.0% 9.3% 6.2%
Provisions / NPLs 58.7% 50.6% 50.8%
Earning Assets / Total Asset 76.3% 79.5% 77.2%
Fixed Assets / Core Capital 32.3% 44.3% 37.5%
Large Exposures / Gross Loans 12.0% 13.1% 9.8%
Gross loans/Total assets 62.7% 58.1% 58.2%
Government security/Total assets 6.0% 6.8% 6.8%
Cash/Total Assets 4.5% 5.0% 3.5%
MEASURES OF EARNINGS (ANNUALISED)
Return on Average Assets 1.0% 2.0% 2.9%
Return on Average Equity 5.5% 11.2% 14.0%
Net Interest Margin 9.5% 9.5% 12.9%
Yield on Advances 14.6% 16.0% 19.4%
Cost of Deposits 2.3% 2.7% 3.2%
Cost to Income 89.3% 83.0% 80.9%
Overhead to Income 53.9% 53.9% 52.6%
MEASURES OF LIQUIDITY
Short term Gap 18.2% 16.2% 19.6%

45
PERFORMANCE INDICATORS 2009 2010 2011
Liquid Assets / Total Deposits (MIN 20%) 68.1% 58.2% 45.3%
Interbank Borrowings / Total Deposits 12.7% 11.4% 8.5%
BNR Borrowings / Total Deposits 0.8% 0.0% 0.1%
Gross Loans / Total Deposits 84.6% 79.5% 81.3%
MEASURES OF MARKET SENSITIVITY
Forex Exposure / Core Capital 0.9% 5.0% 6.6%
Forex Loans / Forex Deposits 2.8% 0.4% 5.3%
Forex Assets / Forex Liabilities 99.0% 103.4% 111.0%
B. Insurance sector
Indicators 2009 2010 2011
Capital adequacy Solvency coverage ratio 202.7% 208.0%
Net premium to Capital 525.0% 516.0% 474.3%
Capital to total assets 7.3% 6.5% 6.4%
Capital to Technical reserves (Benchmark: MAX 100%) 24.6% 25.9% 25.8%
Asset quality (Real estate+unquoted equities+debtors) to total assets (Benchmark: MAX 30%)
39.4% 35.6% 38.6%
Receivables to (Gross premium+reinsurance recoveries)
26.0% 23.1% 33.9%
Equities to total assets (Benchmark: MAX 30%) 60.7% 66.3% 66.8%
Reinsurance and actuarial issues Risk retention ratio (Net premium to gross premium) (Benchmark: MAX 80%-MIN 50%)
88.7% 86.3% 87.1%
Net technical reserves to average of net claims paidin last three years 241.5% 224.7%
Net technical reserves to average of net premium received in last three years 99.8% 97.3%
Earnings and profitability Loss ratio (net claims to net premium) 47.2% 42.3% 42.8%
Expense ratio (Expense to net premium) 43.6% 36.9% 40.1%
Combined ratio=loss ratio+expense ratio (Benchmark: MAX 100%-MIN 50%) 90.8% 79.2% 82.9%
Revisions to technical reserves 0.0% 0.0% 0.0%
Investment income to net premium 16.7% 13.1% 12.9%
Investment income to investment assets 9.0% 6.0% 5.5%
Return on equity (ROE) 20.6% 18.4% 16.6%
Return on Assets (ROA) 12.5% 12.2% 11.1%
Liquidity Liquid assets to current liabilities (Benchmark: MIN 120%) 116.1% 211.7% 197.6%
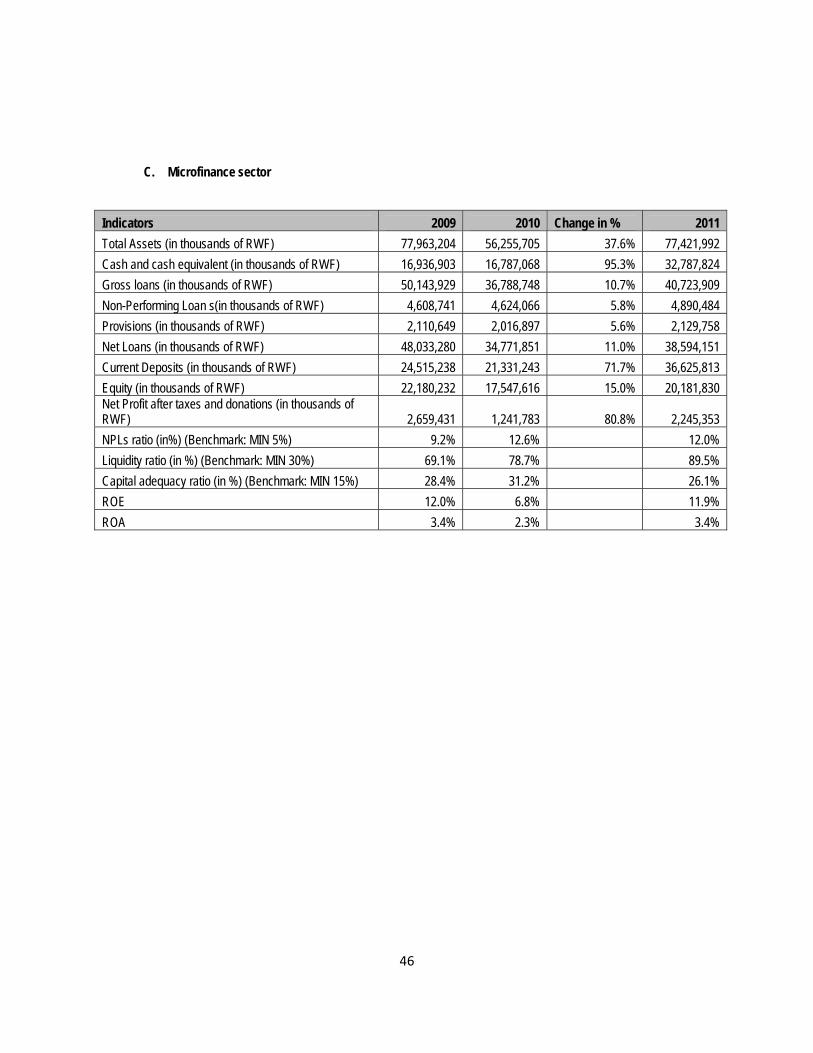
46
C. Microfinance sector
Indicators 2009 2010 Change in % 2011
Total Assets (in thousands of RWF) 77,963,204 56,255,705 37.6% 77,421,992
Cash and cash equivalent (in thousands of RWF) 16,936,903 16,787,068 95.3% 32,787,824
Gross loans (in thousands of RWF) 50,143,929 36,788,748 10.7% 40,723,909
Non-Performing Loan s(in thousands of RWF) 4,608,741 4,624,066 5.8% 4,890,484
Provisions (in thousands of RWF) 2,110,649 2,016,897 5.6% 2,129,758
Net Loans (in thousands of RWF) 48,033,280 34,771,851 11.0% 38,594,151
Current Deposits (in thousands of RWF) 24,515,238 21,331,243 71.7% 36,625,813
Equity (in thousands of RWF) 22,180,232 17,547,616 15.0% 20,181,830 Net Profit after taxes and donations (in thousands of RWF) 2,659,431 1,241,783 80.8% 2,245,353
NPLs ratio (in%) (Benchmark: MIN 5%) 9.2% 12.6% 12.0%
Liquidity ratio (in %) (Benchmark: MIN 30%) 69.1% 78.7% 89.5%
Capital adequacy ratio (in %) (Benchmark: MIN 15%) 28.4% 31.2% 26.1%
ROE 12.0% 6.8% 11.9%
ROA 3.4% 2.3% 3.4%

47
Appendix 3: Balance sheets as at 31 December 2011 (in thousands of RWF)
A. Banking system
31-Dec-09 31-Dec-10 31-Dec-11
A. ASSETS
Cash (domestic notes and coins) 29,519,036 43,283,526 37,477,761
BNR with Balances 25,672,854 24,700,636 43,881,425
Due from banks in Rwanda 109,302,681 127,631,537 128,783,160
Due from with Banks Abroad 47,945,563 96,491,305 105,802,677
Government Securities 39,360,252 59,169,534 74,107,005
Investments and Other Securities 14,999,506 20,568,991 23,880,112
(a) Loans & Overdrafts (gross) 364,122,743 449,357,601 582,594,272
(b) Less: Provisions 28,557,164 27,768,567 25,674,792
Loans & Overdrafts (Net) 335,565,580 421,589,033 556,919,480
Fixed Assets (net) 31,538,390 52,058,448 63,357,304
Other Assets 18,722,262 24,349,868 49,983,121
Total Assets(net) 652,626,124 869,842,878 1,084,192,044
B. LIABILITIES Due to banks in Rwanda 54,720,021 64,293,430 61,221,372 Borrowings from BNR 3,431,038 184,145 650,747 Borrowings (for BRD) 13,329,510 14,573,838 16,156,699 Deposits 430,383,968 565,151,993 716,466,968 Due to Banks Abroad 499,052 5,070,993 1,853,378 Bills Payable 1,039,750 1,046,375 1,046,375 Other Liabilities 32,764,295 60,101,759 61,549,317 Total Liabilities 536,167,635 710,422,533 858,944,856 C. CAPITAL Paid-up-Capital 68,492,124 73,688,665 98,144,780 Share Premium 6,366,838 7,402,094 25,674,845 Retained Reserves 5,462,338 14,481,252 13,644,455 Other Reserves/Subordinated Debt 29,948,526 46,479,711 64,964,200 Profit/loss 6,188,663 17,368,623 22,818,908 Total Shareholders’ funds 116,458,488 159,420,345 225,247,188 D. OFF BALANCE SHEET ITEMS Letters of Credit - - Guarantees and Performance Bonds 110,794,019 186,498,759 211,606,407 Unused Loans/Overdrafts commitment 46,989,709 47,374,974 122,637,722 Other off balance sheet items 11,351,258 11,080,131 47,084,855 Total Liabilities and Equity 169,134,986 244,953,864 381,328,984
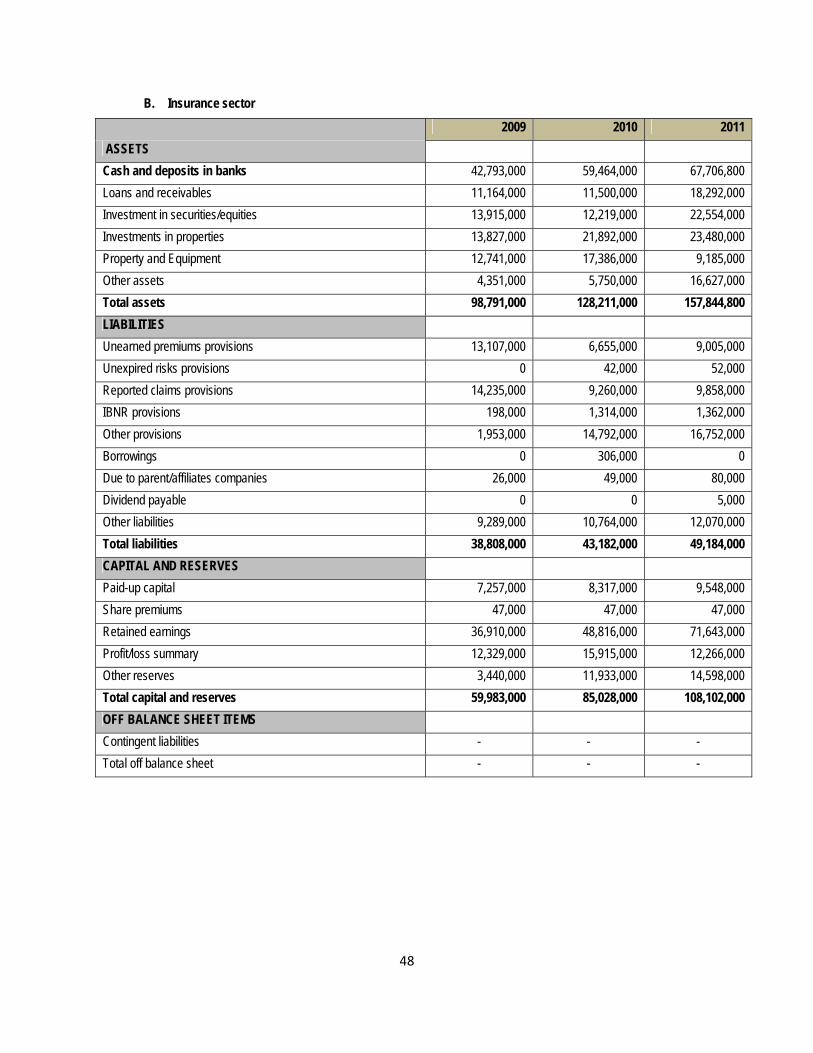
48
B. Insurance sector
2009 2010 2011
ASSETS
Cash and deposits in banks 42,793,000 59,464,000 67,706,800
Loans and receivables 11,164,000 11,500,000 18,292,000
Investment in securities/equities 13,915,000 12,219,000 22,554,000
Investments in properties 13,827,000 21,892,000 23,480,000
Property and Equipment 12,741,000 17,386,000 9,185,000
Other assets 4,351,000 5,750,000 16,627,000
Total assets 98,791,000 128,211,000 157,844,800
LIABILITIES
Unearned premiums provisions 13,107,000 6,655,000 9,005,000
Unexpired risks provisions 0 42,000 52,000
Reported claims provisions 14,235,000 9,260,000 9,858,000
IBNR provisions 198,000 1,314,000 1,362,000
Other provisions 1,953,000 14,792,000 16,752,000
Borrowings 0 306,000 0
Due to parent/affiliates companies 26,000 49,000 80,000
Dividend payable 0 0 5,000
Other liabilities 9,289,000 10,764,000 12,070,000
Total liabilities 38,808,000 43,182,000 49,184,000
CAPITAL AND RESERVES
Paid-up capital 7,257,000 8,317,000 9,548,000
Share premiums 47,000 47,000 47,000
Retained earnings 36,910,000 48,816,000 71,643,000
Profit/loss summary 12,329,000 15,915,000 12,266,000
Other reserves 3,440,000 11,933,000 14,598,000
Total capital and reserves 59,983,000 85,028,000 108,102,000
OFF BALANCE SHEET ITEMS
Contingent liabilities - - -
Total off balance sheet - - -
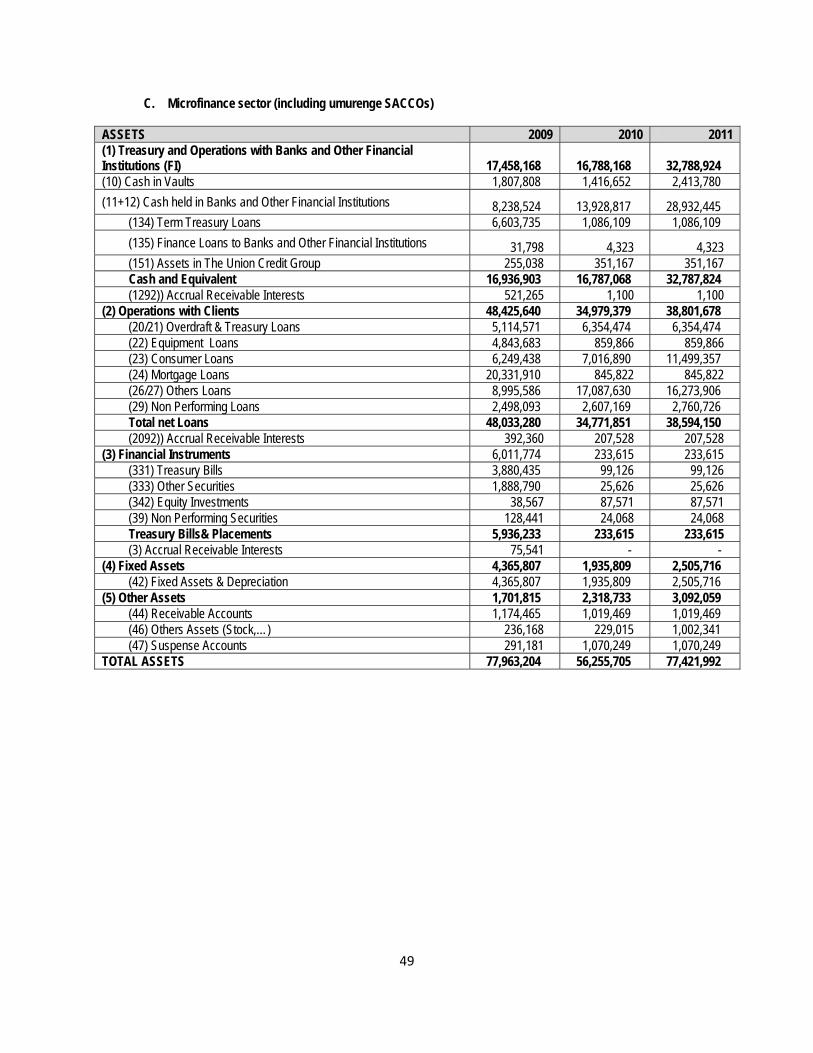
49
C. Microfinance sector (including umurenge SACCOs)
ASSETS 2009 2010 2011 (1) Treasury and Operations with Banks and Other Financial Institutions (FI) 17,458,168 16,788,168 32,788,924 (10) Cash in Vaults 1,807,808 1,416,652 2,413,780
(11+12) Cash held in Banks and Other Financial Institutions 8,238,524 13,928,817 28,932,445 (134) Term Treasury Loans 6,603,735 1,086,109 1,086,109
(135) Finance Loans to Banks and Other Financial Institutions 31,798 4,323 4,323 (151) Assets in The Union Credit Group 255,038 351,167 351,167 Cash and Equivalent 16,936,903 16,787,068 32,787,824 (1292)) Accrual Receivable Interests 521,265 1,100 1,100
(2) Operations with Clients 48,425,640 34,979,379 38,801,678 (20/21) Overdraft & Treasury Loans 5,114,571 6,354,474 6,354,474 (22) Equipment Loans 4,843,683 859,866 859,866 (23) Consumer Loans 6,249,438 7,016,890 11,499,357 (24) Mortgage Loans 20,331,910 845,822 845,822 (26/27) Others Loans 8,995,586 17,087,630 16,273,906 (29) Non Performing Loans 2,498,093 2,607,169 2,760,726 Total net Loans 48,033,280 34,771,851 38,594,150 (2092)) Accrual Receivable Interests 392,360 207,528 207,528
(3) Financial Instruments 6,011,774 233,615 233,615 (331) Treasury Bills 3,880,435 99,126 99,126 (333) Other Securities 1,888,790 25,626 25,626 (342) Equity Investments 38,567 87,571 87,571 (39) Non Performing Securities 128,441 24,068 24,068 Treasury Bills& Placements 5,936,233 233,615 233,615 (3) Accrual Receivable Interests 75,541 - -
(4) Fixed Assets 4,365,807 1,935,809 2,505,716 (42) Fixed Assets & Depreciation 4,365,807 1,935,809 2,505,716
(5) Other Assets 1,701,815 2,318,733 3,092,059 (44) Receivable Accounts 1,174,465 1,019,469 1,019,469 (46) Others Assets (Stock,…) 236,168 229,015 1,002,341 (47) Suspense Accounts 291,181 1,070,249 1,070,249
TOTAL ASSETS 77,963,204 56,255,705 77,421,992

50
LIABILITIES & EQUITY 2009 2010 2011 (1) Treasury and Operations with Banks and Other Financial Institutions (FI) 3,857,314 5,730,450 6,411,705
(143/144) Borrowings (Overnight and Term Treasury) 1,788,504 1,588,360 2,269,615 (145) Financial Borrowings 1,875,960 3,797,518 3,797,518
(153) Network Resources
188,938 344,434
344,434
(1291) Accrual Payable Interests
3,913
138
138 (2) Operations with Clients 49,865,635 29,777,780 45,881,454 Savings and Deposits: 48,929,837 29,758,087 45,861,761
(201/203) Current Accounts 24,515,238 21,331,243 36,625,813 (204) Saving Accounts 6,108,733 4,836,014 4,836,014 (205) Short Term Deposits 3,870,396 850,254 1,659,358
(205) Long Term Deposits 12,837,780 840,916
840,916
(208) Security Deposits 1,597,689 1,899,661 1,899,661
(2091)) Accrual Payable Interests 935,808 19,693
19,693
(3) Other liabilities 2,060,023 3,684,241 4,947,002 (45) Payable Accounts and other short term liabilities 1,172,768 1,804,178 3,066,940
(28) Other Long Term Liabilities
725,296 832,820
832,820
(47) Suspense Accounts
156,900 1,047,243 1,047,243 LIABILITIES 54,383,657 32,870,203 57,240,162 EQUITY 22,180,232 17,547,616 20,181,830 (53) Subsidies 6,662,730 4,922,455 5,199,274
Prior Years 3,642,894 3,539,915 3,539,915 Current Year 2,476,457 1,382,540 1,659,359
(575) Legal Reserves
154,495 271,817
271,817
(579) Other Reserves
600,920 900,959
900,959 (59) Earnings 5,755,586 472,522 1,421,591
(5798) Retained Earnings/Accumulated Losses 3,076,478 (1,039,278) (823,762) (59) Net Profit/Loss of Period +/- (From January) 2,679,022 1,511,801 2,245,353
(581) Paid up Capital 9,006,587 10,979,863 12,388,190 LIABILITIES&EQUITY 77,963,204 56,255,705 77,421,992 Provisions 2,110,649 2,016,897 2,129,758
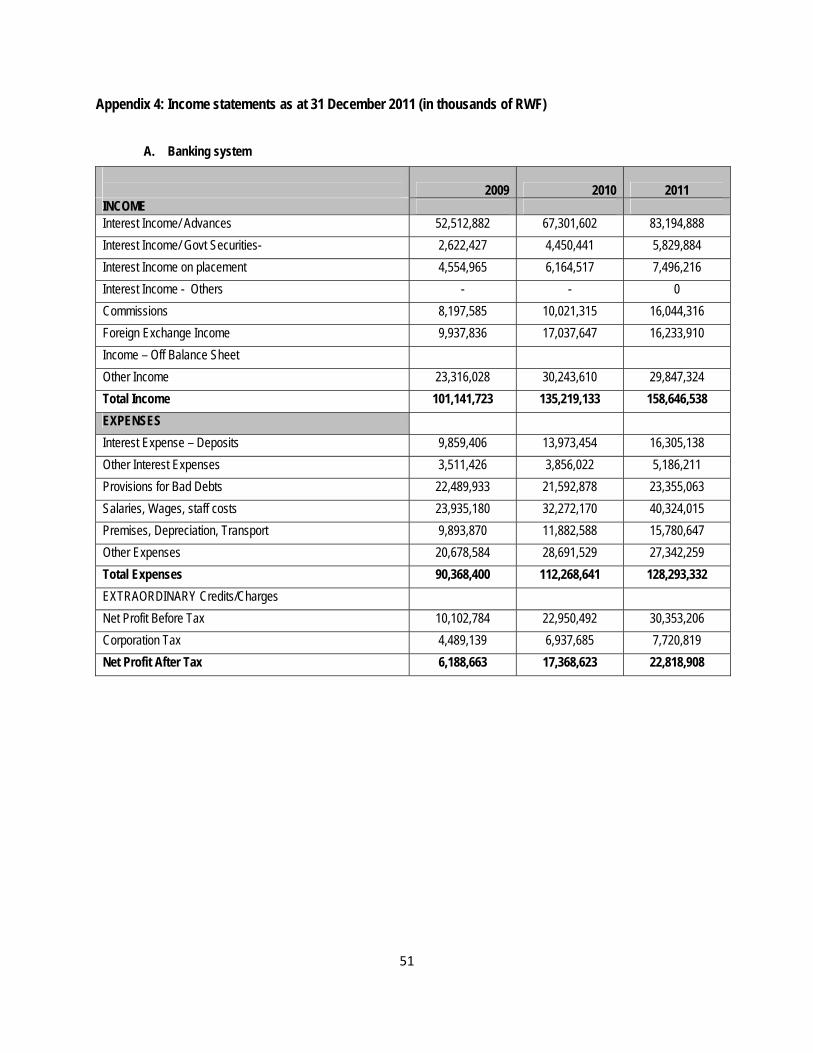
51
Appendix 4: Income statements as at 31 December 2011 (in thousands of RWF)
A. Banking system
2009 2010 2011 INCOME Interest Income/ Advances 52,512,882 67,301,602 83,194,888
Interest Income/ Govt Securities- 2,622,427 4,450,441 5,829,884
Interest Income on placement 4,554,965 6,164,517 7,496,216
Interest Income - Others - - 0
Commissions 8,197,585 10,021,315 16,044,316
Foreign Exchange Income 9,937,836 17,037,647 16,233,910
Income – Off Balance Sheet
Other Income 23,316,028 30,243,610 29,847,324
Total Income 101,141,723 135,219,133 158,646,538
EXPENSES
Interest Expense – Deposits 9,859,406 13,973,454 16,305,138
Other Interest Expenses 3,511,426 3,856,022 5,186,211
Provisions for Bad Debts 22,489,933 21,592,878 23,355,063
Salaries, Wages, staff costs 23,935,180 32,272,170 40,324,015
Premises, Depreciation, Transport 9,893,870 11,882,588 15,780,647
Other Expenses 20,678,584 28,691,529 27,342,259
Total Expenses 90,368,400 112,268,641 128,293,332
EXTRAORDINARY Credits/Charges
Net Profit Before Tax 10,102,784 22,950,492 30,353,206
Corporation Tax 4,489,139 6,937,685 7,720,819
Net Profit After Tax 6,188,663 17,368,623 22,818,908

52
B. Insurance sector
2009 2010 2011
UNDERWRITING REVENUES
Gross premiums written 42,974,000 49,738,000 46,180,000
Less: premiums ceded to reinsurers 4,876,000 6,821,000 -6,704,000
Net premiums written 38,098,000 42,917,000 39,476,000
Decrease/Increase in unearned premiums (763,000) (1,872,000) 236,000
Net premiums earned 37,335,000 41,045,000 39,712,000
CLAIMS AND EXPENSES
Claims incurred 17,969,000 18,166,000 17,507,000
Underwriting expenses 1,261,000 2,331,000 2,328,000
Management expenses 15,356,000 13,485,000 12,889,000
Total expenses 34,586,000 33,982,000 32,724,000
Net underwriting profit/loss 4,395,000 7,063,000 6,988,000
OTHER INCOME AND CHARGES
Investment income 6,345,000 5,605,000 4,063,000
Other income 2,066,000 4,541,000 3,138,000
Less: finance costs and extra charges 48,000 348,000 -192,000
Total other revenues 8,363,000 9,798,000 6,979,000
Profit/loss before tax 12,758,000 16,861,000 13,967,000
Provision for tax 429,000 1,174,000 1,336,200
Net Income after tax 12,329,000 15,687,000 12,630,800

53
C. Microfinance sector (Including Umurenge SACCOs)
RWF Thousand 2009 2010 2011
Financial Revenue 12,752,991 9,007,987 11,998,660
Income on Operations With Banks and Other Fin. Institutions 948,911 284,054 204,740
Financial Revenue from Loan Portfolio 10,709,486 7,511,421 9,056,393
Interest Income on Loan Portfolio 9,320,462 6,580,773 7,668,030
Fees and Commissions on Loan Portfolio 1,389,024 930,648 1,388,363
Financial Revenue from Investments 98,474 60,389 62,666
Other Operating Revenue (Transaction fees, passbooks, etc.) 996,120 1,152,123 2,674,861
Financial Expenses 1,624,697 730,161 752,350
Financial Expenses on Funding Liabilities 1,486,560 651,669 627,291
Interest and Fee Expenses on Deposits 1,218,429 376,555 153,015
Interests and Fee Expenses on Borrowings 268,132 275,114 474,276
Other financial expenses and Commission paid 138,137 78,492 51,615
Net Financial Income before Provisions 11,128,294 8,277,827 11,246,310
Loss on Loans 2,503,703 2,849,865 2,912,875
Provisions for Non-Performing Loans 2,180,634 2,201,461 2,032,946
Written-Off Loans 323,068 648,404 879,930
Recoveries on Loans: 1,016,707 1,922,326 1,809,542
Provisions written back 711,837 1,524,269 1,174,773
Recoveries from Loans Written-Off 304,869 398,057 634,769
Net Provision Expenses/Gains 1,486,996 927,540 873,856
Financial Revenue (After Net Provisions) 9,641,298 7,350,287 10,142,976
Operating Expenses 7,827,736 6,613,836 10,353,367
Personnel Expenses 4,041,406 3,390,424 5,656,562
Administrative Expenses: 3,786,330 3,223,412 4,696,805
Taxes (Other than Taxes on Profits) 60,984 92,331 77,416
Office Rent Fees 517,431 533,521 495,789
External Services (Consultancies) 535,211 334,160 362,439
Depreciation and Amortization Expenses 908,516 608,971 461,328
Other Administrative Expenses 1,764,188 1,654,428 1,892,017
Net Operating Income 1,813,562 736,451 (210,390)
Net Non-Operating Income/Expense (48,689) 261,110 49,344
Non-Operating Revenue 177,059 295,251 88,904
Non-Operating Expense 225,748 34,141 39,560
Net Income (Before Taxes& Donations) 1,764,872 997,561 1,135,145
Income Tax (Tax on Profits) 0 2,626 17,343
Net Income (After Taxes & Before Donations) 1,764,872 994,935 (178,389)
Donations 894,559 246,412 2,423,742
Net Income after Taxes and Donations 2,659,431 1,241,783 2,245,353

54
References Albert J., 2003, “Corporate balance sheet restructuring and investment in the euro area”, Working paper No 03/117, Washington, DC: IMF Andrew H., Simon H. and Silvia P., 2007, “A new approach to assessing risks to financial stability”, financial stability paper No 2, London: Bank of England Claudio B., Mathias D., and Kostas T., 2012, “Stress testing macro stress testing: does it live up to expectations?”, Working paper No 369, BIS: Switzerland Committee of Payment and Settlement Systems secretariat, 2000, “The contribution of payment systems to financial stability”, Papers presented at a workshop on payment systems at CEMLA, Mexico City, BIS: Basel, Switzerland EAC Secretariat, 2011, EAC development strategy, Arusha-Tanzania Erlend W. N., 2009, “Financial Stability Frameworks and the Role of Central Banks: Lessons from the Crisis”, working paper No 09/70, IMF: Washington, DC Financial Stability Board, 2011, “Macro-prudential policy tools and frameworks”, BIS: Basel, Switzerland Hervé H., 2010, “Towards a global financial stability framework”, 45th SEACEN Governors’ conference, Siem Reap province, Cambodia, BIS: Basel Switzerland International Monetary Fund (IMF), 2011, “Global Financial stability report”, Washington, DC International Monetary Fund (IMF), 2011, “Regional Economic Outlook, Sub-Saharan Africa”, World economic and financial survey, Washington, DC International Monetary Fund (IMF), 2012, “World economic outlook, updates”, Washington, DC International Monetary Fund, 2006, “Financial soundness indicators, compilation guide”, Washington, DC Martin C., 2007, “Introduction to applied stress testing”, working papers No 07/59, IMF: Washington, DC Miguel A. S. and Charles G., 2009, “Banking stability measures”, Discussion paper No 627, IMF: Washington, DC Monetary and Capital Markets Department, 2011, “Rwanda: Financial system stability assessment”, IMF country report No 11/244, Washington, DC Saul L. and Christian M., 2011, “Second Review Under the Policy Support Instrumentand Request for Modification of Assessment Criteria”, IMF country report, Washington, DC The World bank and International Monetary Fund, 2005, ”Financial sector assessment, a handbook”, Washington, DC World Economic Forum, 2012, “Global risks 2012, seventh edition”, insight report

�
Paul VI Avenue, PO Box 531 Kigali Tel. :( 250) 252 574282, Fax: (250) 252 577391
Email: [email protected] Web: www.bnr.rw
Swift code: BNRWRWRW �����