
Financial Stability Report-Bhutan - RMA Publication/FSR/FSR2015.pdfFinancial Stability Report-Bhutan...
57
Financial Stability Report-Bhutan Bhutan 2015 Financial Regulation & Supervision Department Royal Monetary Authority
Transcript of Financial Stability Report-Bhutan - RMA Publication/FSR/FSR2015.pdfFinancial Stability Report-Bhutan...
Financial
Stability
Report-Bhutan
Bhutan 2015
Financial Regulation & Supervision
Department
Royal Monetary Authority
Purpose of the Financial Stability Report
As per Section 7 of the Royal Monetary Authority (RMA) Act 2010, the primary objective of
Bhutan’s Central Bank is to formulate and implement monetary policy in order to achieve
price stability. However, Section 8 clearly states the maintenance of financial stability as
another objective of the RMA. Specifically, the Act empowers the RMA to ‘formulate and
apply financial regulations and prudential guidelines to ensure the stability and integrity of
the financial system’; and ‘promote sound practices and good governance in the financial
services industry to protect it against systemic risk’. This would in turn promote macro-
economic stability and economic growth in the country.
The RMA uses the Financial Stability Report (FSR) in pursuit of this objective. The FSR is
intended to serve as a regular report identifying: macro-economic risks to financial
stability; existing frailties in the financial sector and vulnerabilities to plausible and
implausible risks; and latest developments in financial regulation and infrastructure.
Additionally, it provides a starting point for a discussion on financial stability by different
stakeholders-including banks and other financial institutions, and the government. The FSR
is also a tool for building public confidence in the strength of the financial system.
Table of Contents
Chapter I 1
Macro-Financial Risks to Financial Stability 1
1.1 Financial Sector Overview 1 1.2 Credit to GDP and Interconnectedness in Financial System 1 1.3 India 3 1.4 Domestic Development 5 1.5 External Sector Vulnerabilities 7 Chapter II 14
Financial System Stability: Soundness and Resilience 14
2.1 Banking Sector 14 2.1.1Performance 15 2.1.2 Soundness 17 2.1.3 Asset Quality 17 2.1.4 Credit Concentration Risk 18 2.1.5 Implementation of Loan to Value Ratio to Mitigate the Risk of a Housing Market Downturn 19 2.1.6 Maximum Loan Ceiling for Personal Loans 19 2.1.7 Satisfactory Loss Absorption Capacities 19 2.1.8 Profitability 19 2.2 Resilience - Stress Tests for Credit Risk 20 2.3 Maintenance of Satisfactory Liquidity Levels 26 2.3.1 Liquidity Management 26 2.3.2 Liquidity Policy Instruments 27 2.3.3 Management of Commercial Bank Liquidity 27 2.3.4 Liquidity Stress Test 29 2.4 Non-Banks 30 2.4.1 Capital Adequacy 31 2.4.2 Asset Quality 31 2.4.3 Profitability 32 Chapter III 33
Macro-Prudential Regulations 33
3.1 Summary of Macro-prudential Regulations 34 3.2 Conclusion 36 Chapter IV 38
Recent Activities and Developments in Financial Sector Regulation 38
4.1 Investment Guidelines for Insurance Business 38 4.2 Credit Information Bureau Regulations 38 4.3 Base Rate System 39 4.4 Reserve Management Policy 39 4.5 Payments and Settlement System 40 4.6 Central Registry 40 Annexures 41
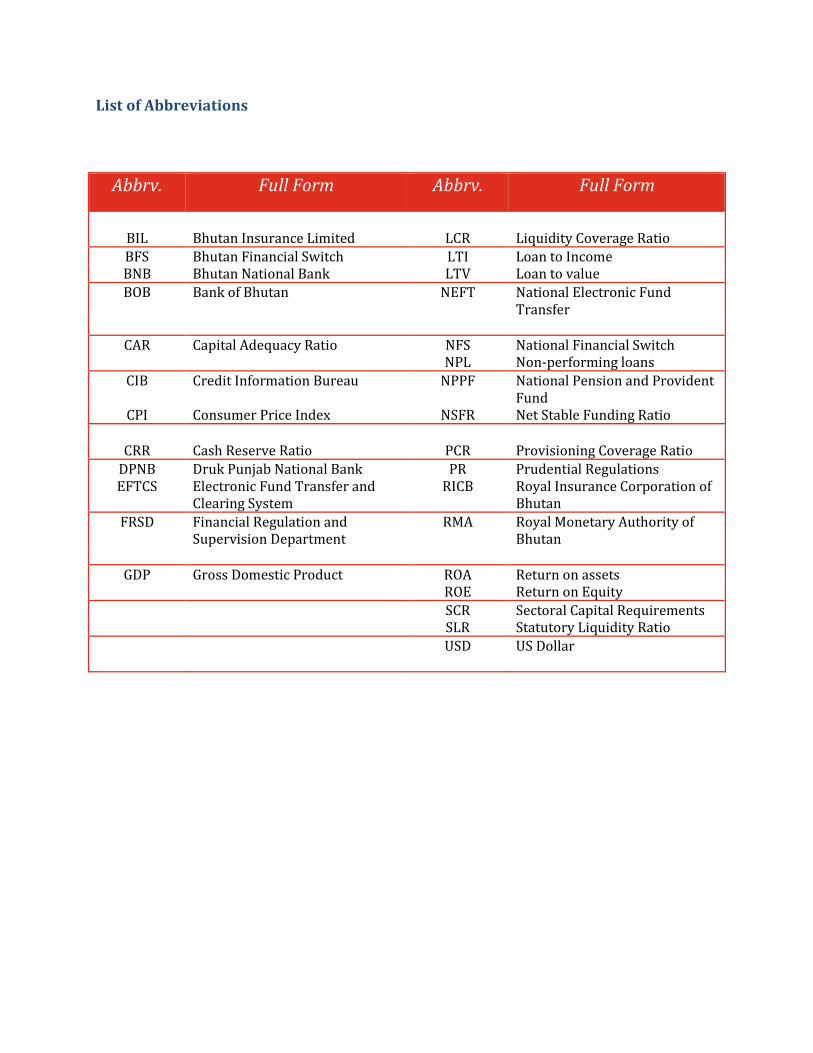
List of Abbreviations
Abbrv. Full Form Abbrv. Full Form
BIL Bhutan Insurance Limited LCR Liquidity Coverage Ratio
BFS Bhutan Financial Switch LTI Loan to Income BNB Bhutan National Bank LTV Loan to value
BOB Bank of Bhutan NEFT National Electronic Fund Transfer
CAR Capital Adequacy Ratio NFS National Financial Switch NPL Non-performing loans
CIB Credit Information Bureau NPPF National Pension and Provident Fund
CPI Consumer Price Index NSFR Net Stable Funding Ratio
CRR Cash Reserve Ratio PCR Provisioning Coverage Ratio
DPNB Druk Punjab National Bank PR Prudential Regulations EFTCS Electronic Fund Transfer and
Clearing System RICB Royal Insurance Corporation of
Bhutan
FRSD Financial Regulation and Supervision Department
RMA Royal Monetary Authority of Bhutan
GDP Gross Domestic Product ROA Return on assets ROE Return on Equity
SCR Sectoral Capital Requirements SLR Statutory Liquidity Ratio
USD US Dollar
1
Chapter I
Macro-Financial Risks to Financial Stability
1.1 Financial Sector Overview
Financial system of Bhutan is still at its
initial stage with lots of structural
deficiencies. The development of
Bhutanese financial system until 2009
was limited to only two banks, one
agricultural development bank, one
insurance company accompanied by a
small stock exchange and a Pension Fund
Bureau. Beginning 2009, major changes
have occurred in the financial system. In
2009, two new banks and one insurance
company were licensed to begin
operation in 2010. Further, the
agricultural development bank was
granted a specialized deposit-taking bank
license in 2010 to expand its business to
the urban areas. The Royal Monetary
Authority (RMA) is the central bank of
Bhutan and is also responsible for
supervision of financial institutions in
Bhutan. There are eight financial
institutions that are currently authorized
by the RMA to perform lending
operations. These include five banks, two
insurance companies, and a pension fund.
Of the banks, two are government owned,
Bank of Bhutan Limited and Bhutan
Development Bank Limited and three are
private, Bhutan National Bank Limited, T-
Bank Limited and Druk Punjab National
Bank Limited. The two insurance
companies are Royal Insurance
Corporation of Bhutan Limited (RICBL)
and Bhutan Insurance Limited (BIL).
These two insurance companies compete
with banks in terms of rendering their
services of lending to the people. The
National Pension and Provident Fund
(NPPF) responsible for managing the
retirement plans of civil servants,
employees of government owned
corporations, joint sector companies, and
armed forces is also allowed to perform
limited lending to their members. In
2013, RMA granted license to first
reinsurance company, GIC-Bhutan Re to
undertake reinsurance business in
Bhutan.
1.2 Credit to GDP and
Interconnectedness in Financial
System
1.2.1 Credit-to GDP
The credit-to-GDP gap is a measure that
provides signals of banking system stress
2
and can be used as a part of central bank
policy tools to mitigate banking system
risk. For example during recession, losses
in the banking sector can be massive
when an economic downturn is preceded
by a period of excessive lending/credit
(i.e. a credit bubble). These losses can
destabilize the banking sector and this
instability can further spread throughout
the economy which then feeds back to the
banking sector. One way of protecting the
banking sector from the crisis is to have
the banks build up additional capital
buffer. Basel III regulatory framework
requires banks to build up
a countercyclical capital buffer to ensure
that the banking sector capital
requirements take account of the macro-
financial environment in which they
operate.
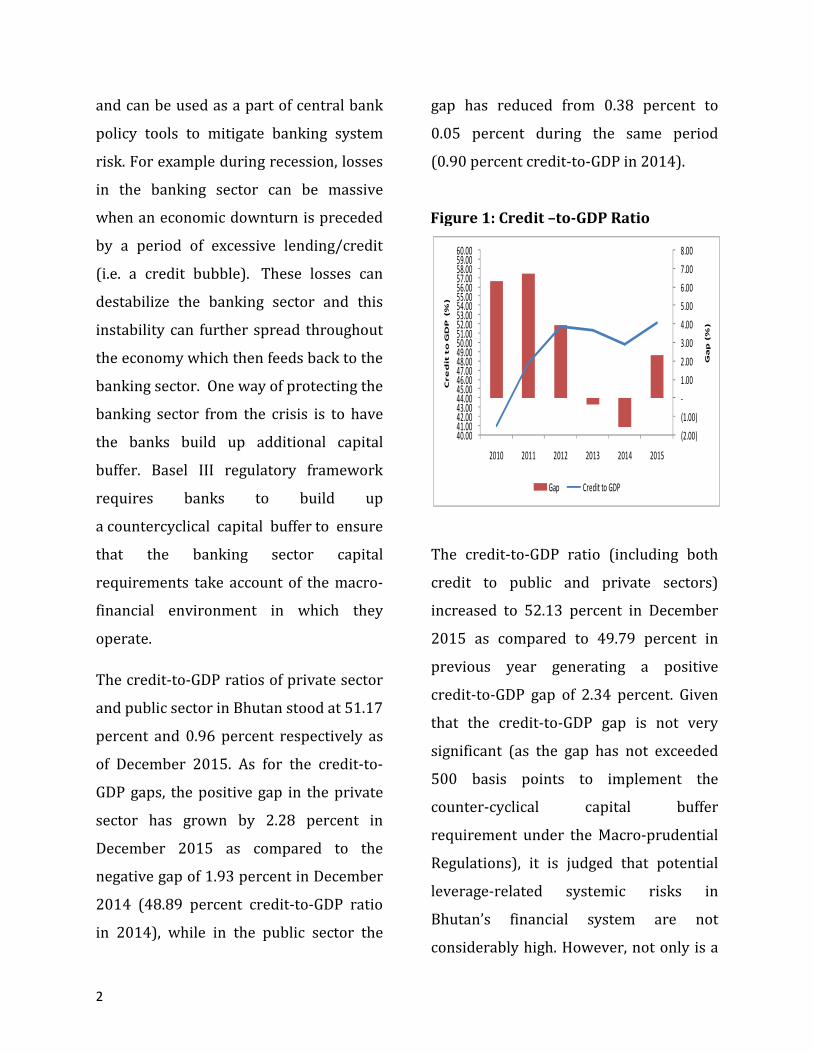
The credit-to-GDP ratios of private sector
and public sector in Bhutan stood at 51.17
percent and 0.96 percent respectively as
of December 2015. As for the credit-to-
GDP gaps, the positive gap in the private
sector has grown by 2.28 percent in
December 2015 as compared to the
negative gap of 1.93 percent in December
2014 (48.89 percent credit-to-GDP ratio
in 2014), while in the public sector the
gap has reduced from 0.38 percent to
0.05 percent during the same period
(0.90 percent credit-to-GDP in 2014).
The credit-to-GDP ratio (including both
credit to public and private sectors)
increased to 52.13 percent in December
2015 as compared to 49.79 percent in
previous year generating a positive
credit-to-GDP gap of 2.34 percent. Given
that the credit-to-GDP gap is not very
significant (as the gap has not exceeded
500 basis points to implement the
counter-cyclical capital buffer
requirement under the Macro-prudential
Regulations), it is judged that potential
leverage-related systemic risks in
Bhutan’s financial system are not
considerably high. However, not only is a
(2.00)
(1.00)
-
1.00
2.00
3.00
4.00
5.00
6.00
7.00
8.00
40.00 41.00 42.00 43.00 44.00 45.00 46.00 47.00 48.00 49.00 50.00 51.00 52.00 53.00 54.00 55.00 56.00 57.00 58.00 59.00 60.00
2010 2011 2012 2013 2014 2015
Ga
p (
%)
Cre
dit
to
GD
P (%
)
Gap Credit to GDP
Figure 1: Credit –to-GDP Ratio
3
private credit-to-GDP ratio high and
growing, but the credit-to-GDP gap in
public sector is also positive, thus, more
caution is needed concerning the
possibility of future build-up of risks.
1.2.2 Interconnectedness
A look at the financial sector
interconnectedness matrix shows that the
volume of assets and liabilities
interconnected across financial
institutions reached Nu. 117.45 billion
(USD 1.11 billion)1 as of December 2015,
up by about Nu. 7.82 billion compared to
the end of 2014 (Nu. 109.72 billion). By
sector, the volume of interconnectedness
across banking sector and non-banks had
increased by Nu. 4.95 billion (5.10
percent) and Nu. 2.87 billion (22.81
percent) respectively during the period
under review.
1.3 India
1.3.1 Relevance to Bhutan
India is Bhutan’s largest trade partner.
67.8 percent of the country’s external
debt is denominated in Indian Rupees.
Moreover, the respective governments of
the two countries have shared a cordial
1 2015 end exchange rate was Nu. 67.45 for a USD
relationship over the years. On average
between 2003-2004 and 2014-2015, the
Indian Government provided 65.6 percent
of all budgetary grants available to the
Royal Government of Bhutan (RGoB).
There are three ways by which India’s
economic circumstances can affect
Bhutan-growth, inflation and exchange
rate.
The Article IV Consultation in Bhutan
estimated a long run macro-econometric
model for Bhutan concluding that any
slowdown in India can have spillover
effects in Bhutan. Higher growth in India
for instance would have the potential to
energize exports from Bhutan-both
merchandise and service exports like
tourism. Higher growth would also
translate into fiscal space for the
government of India to provide timely
grants and hydropower financing.
Inflation and exchange rate movements in
India, both have the potential to affect
inflation in Bhutan since a majority of its
imports are from the former.
When the Indian currency depreciates,
Indians have to pay more for their
imports. This is likely to affect domestic
inflation in India. In turn, this may be
imported into Bhutan. More directly,
4
since Bhutan’s exchange rate is pegged to
India’s currency, a weaker rupee also
means a weaker Ngultrum. Hence, Bhutan
can also end up importing inflation from
countries other than India.
1.3.2 Outlook in India2
Indian economy remained resilient in a
global environment characterized by
falling macroeconomic risks. GDP picked
up in 2014-2015, rising by 7.3 per cent on
top of a growth of 6.9 per cent in 2013-
2014. The firming up of growth during
2014-2015 was driven mainly by private
consumption and supported by fixed
investment, even as government
consumption and net exports slackened
considerably. Even though, the weakness
in external demand has adversely affected
its exports, current account deficit (CAD)
as a percentage of GDP has remained at
comfortable level, and current account
deficit narrowed in 2014-2015 from its
level a year ago on terms of trade gains
and weak import demand. However,
despite improved macro-economic
fundamentals and resilience - given the
challenges for the rupee to maintain
external competitiveness on the one hand
2 RBI Annual Report and Financial Stability Report, 2015
and manage inflationary pressures and
requisite capital flows on the other,
sluggishness in domestic demand and
private investment call for higher public
investment in order to accelerate the pace
of growth.
Average inflation at 5.9 per cent during
2014-2015 turned out to be significantly
lower than 9.5 per cent a year ago. From
June 2014, inflation declined faster than
initially anticipated. A combination of
favorable factors such as the collapse of
international commodity prices,
particularly of crude, and loss of pricing
power among corporate due to
weakening demand as well as pro-active
supply management and deregulation of
key fuel prices worked in alignment with
a disinflationary monetary policy stance
that was set from September 2013.
1.3.3 Maintaining exchange rate peg of
the Ngultrum to the Indian Rupee
The Ngultrum has been pegged at par to
the Indian Rupee ever since its
introduction in 1974.3 With the
continuing dominance of bilateral trade
(over 80 percent of total imports and
close to 90 percent of total exports) and
3 RMA Monetary Policy Statement
5
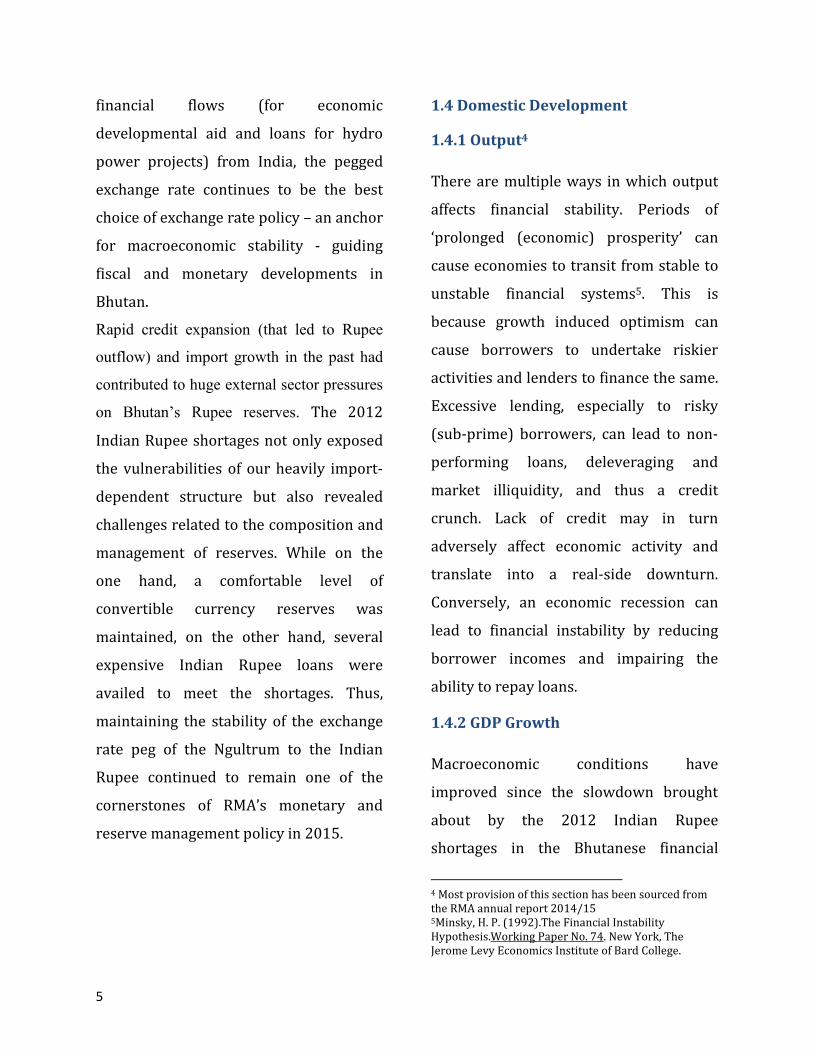
financial flows (for economic
developmental aid and loans for hydro
power projects) from India, the pegged
exchange rate continues to be the best
choice of exchange rate policy – an anchor
for macroeconomic stability - guiding
fiscal and monetary developments in
Bhutan.
Rapid credit expansion (that led to Rupee
outflow) and import growth in the past had
contributed to huge external sector pressures
on Bhutan’s Rupee reserves. The 2012
Indian Rupee shortages not only exposed
the vulnerabilities of our heavily import-
dependent structure but also revealed
challenges related to the composition and
management of reserves. While on the
one hand, a comfortable level of
convertible currency reserves was
maintained, on the other hand, several
expensive Indian Rupee loans were
availed to meet the shortages. Thus,
maintaining the stability of the exchange
rate peg of the Ngultrum to the Indian
Rupee continued to remain one of the
cornerstones of RMA’s monetary and
reserve management policy in 2015.
1.4 Domestic Development
1.4.1 Output4
There are multiple ways in which output
affects financial stability. Periods of
‘prolonged (economic) prosperity’ can
cause economies to transit from stable to
unstable financial systems5. This is
because growth induced optimism can
cause borrowers to undertake riskier
activities and lenders to finance the same.
Excessive lending, especially to risky
(sub-prime) borrowers, can lead to non-
performing loans, deleveraging and
market illiquidity, and thus a credit
crunch. Lack of credit may in turn
adversely affect economic activity and
translate into a real-side downturn.
Conversely, an economic recession can
lead to financial instability by reducing
borrower incomes and impairing the
ability to repay loans.
1.4.2 GDP Growth
Macroeconomic conditions have
improved since the slowdown brought
about by the 2012 Indian Rupee
shortages in the Bhutanese financial
4 Most provision of this section has been sourced from the RMA annual report 2014/15 5Minsky, H. P. (1992).The Financial Instability Hypothesis.Working Paper No. 74. New York, The Jerome Levy Economics Institute of Bard College.
6
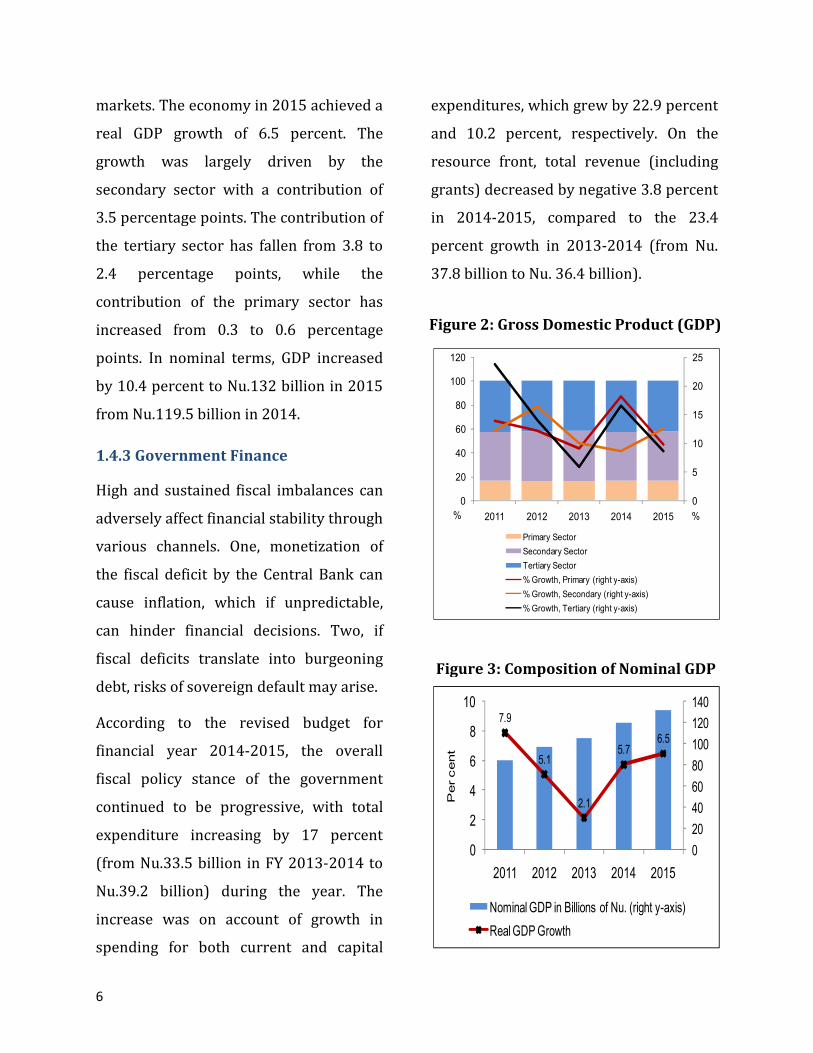
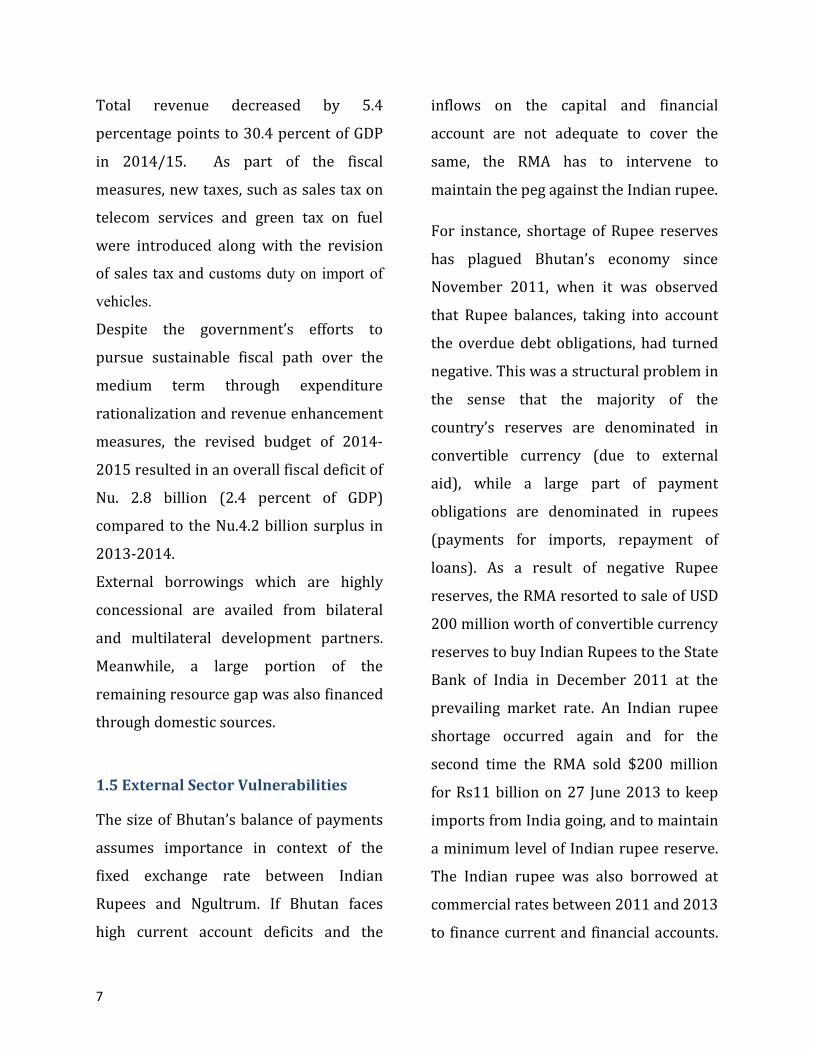
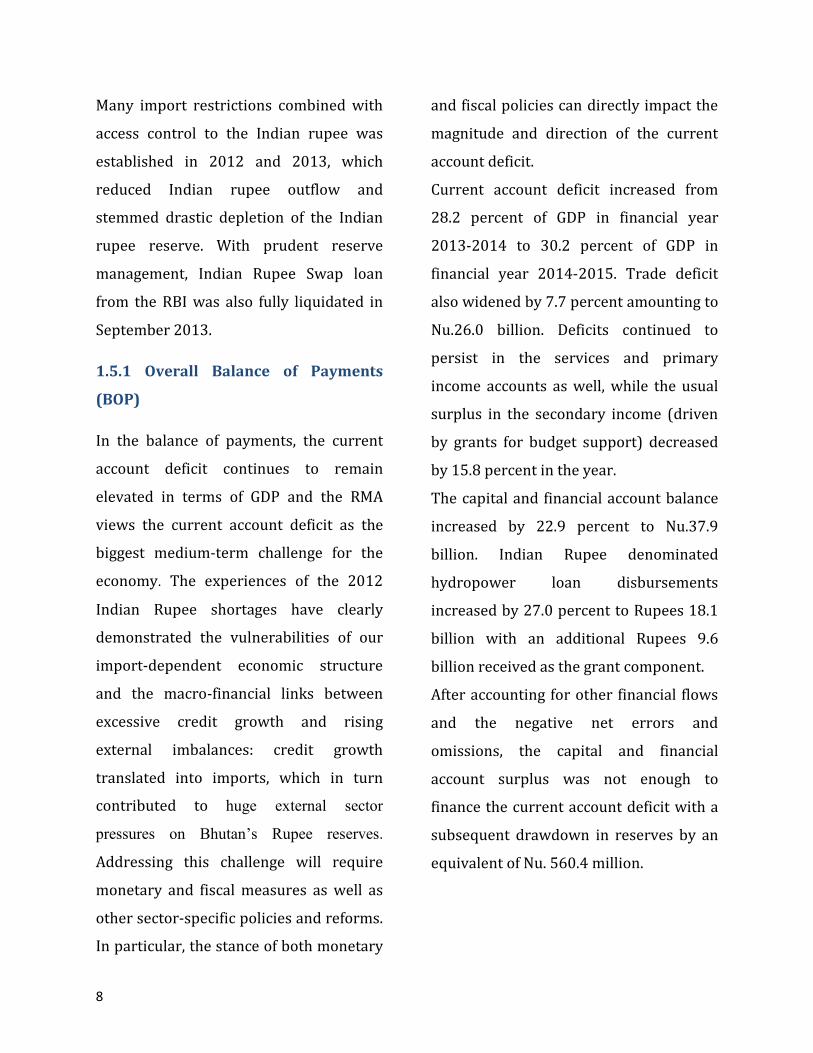
markets. The economy in 2015 achieved a
real GDP growth of 6.5 percent. The
growth was largely driven by the
secondary sector with a contribution of
3.5 percentage points. The contribution of
the tertiary sector has fallen from 3.8 to
2.4 percentage points, while the
contribution of the primary sector has
increased from 0.3 to 0.6 percentage
points. In nominal terms, GDP increased
by 10.4 percent to Nu.132 billion in 2015
from Nu.119.5 billion in 2014.
1.4.3 Government Finance
High and sustained fiscal imbalances can
adversely affect financial stability through
various channels. One, monetization of
the fiscal deficit by the Central Bank can
cause inflation, which if unpredictable,
can hinder financial decisions. Two, if
fiscal deficits translate into burgeoning
debt, risks of sovereign default may arise.
According to the revised budget for
financial year 2014-2015, the overall
fiscal policy stance of the government
continued to be progressive, with total
expenditure increasing by 17 percent
(from Nu.33.5 billion in FY 2013-2014 to
Nu.39.2 billion) during the year. The
increase was on account of growth in
spending for both current and capital
expenditures, which grew by 22.9 percent
and 10.2 percent, respectively. On the
resource front, total revenue (including
grants) decreased by negative 3.8 percent
in 2014-2015, compared to the 23.4
percent growth in 2013-2014 (from Nu.
37.8 billion to Nu. 36.4 billion).
0
5
10
15
20
25
0
20
40
60
80
100
120
2011 2012 2013 2014 2015
Primary Sector
Secondary Sector
Tertiary Sector
% Growth, Primary (right y-axis)
% Growth, Secondary (right y-axis)
% Growth, Tertiary (right y-axis)
%%
7.9
5.1
2.1
5.76.5
0
20
40
60
80
100
120
140
0
2
4
6
8
10
2011 2012 2013 2014 2015
Per cent
Nominal GDP in Billions of Nu. (right y-axis)
Real GDP Growth
Figure 2: Gross Domestic Product (GDP)
Figure 3: Composition of Nominal GDP
7
Total revenue decreased by 5.4
percentage points to 30.4 percent of GDP
in 2014/15. As part of the fiscal
measures, new taxes, such as sales tax on
telecom services and green tax on fuel
were introduced along with the revision
of sales tax and customs duty on import of
vehicles.
Despite the government’s efforts to
pursue sustainable fiscal path over the
medium term through expenditure
rationalization and revenue enhancement
measures, the revised budget of 2014-
2015 resulted in an overall fiscal deficit of
Nu. 2.8 billion (2.4 percent of GDP)
compared to the Nu.4.2 billion surplus in
2013-2014.
External borrowings which are highly
concessional are availed from bilateral
and multilateral development partners.
Meanwhile, a large portion of the
remaining resource gap was also financed
through domestic sources.
1.5 External Sector Vulnerabilities
The size of Bhutan’s balance of payments
assumes importance in context of the
fixed exchange rate between Indian
Rupees and Ngultrum. If Bhutan faces
high current account deficits and the
inflows on the capital and financial
account are not adequate to cover the
same, the RMA has to intervene to
maintain the peg against the Indian rupee.
For instance, shortage of Rupee reserves
has plagued Bhutan’s economy since
November 2011, when it was observed
that Rupee balances, taking into account
the overdue debt obligations, had turned
negative. This was a structural problem in
the sense that the majority of the
country’s reserves are denominated in
convertible currency (due to external
aid), while a large part of payment
obligations are denominated in rupees
(payments for imports, repayment of
loans). As a result of negative Rupee
reserves, the RMA resorted to sale of USD
200 million worth of convertible currency
reserves to buy Indian Rupees to the State
Bank of India in December 2011 at the
prevailing market rate. An Indian rupee
shortage occurred again and for the
second time the RMA sold $200 million
for Rs11 billion on 27 June 2013 to keep
imports from India going, and to maintain
a minimum level of Indian rupee reserve.
The Indian rupee was also borrowed at
commercial rates between 2011 and 2013
to finance current and financial accounts.
8
Many import restrictions combined with
access control to the Indian rupee was
established in 2012 and 2013, which
reduced Indian rupee outflow and
stemmed drastic depletion of the Indian
rupee reserve. With prudent reserve
management, Indian Rupee Swap loan
from the RBI was also fully liquidated in
September 2013.
1.5.1 Overall Balance of Payments
(BOP)
In the balance of payments, the current
account deficit continues to remain
elevated in terms of GDP and the RMA
views the current account deficit as the
biggest medium-term challenge for the
economy. The experiences of the 2012
Indian Rupee shortages have clearly
demonstrated the vulnerabilities of our
import-dependent economic structure
and the macro-financial links between
excessive credit growth and rising
external imbalances: credit growth
translated into imports, which in turn
contributed to huge external sector
pressures on Bhutan’s Rupee reserves.
Addressing this challenge will require
monetary and fiscal measures as well as
other sector-specific policies and reforms.
In particular, the stance of both monetary
and fiscal policies can directly impact the
magnitude and direction of the current
account deficit.
Current account deficit increased from
28.2 percent of GDP in financial year
2013-2014 to 30.2 percent of GDP in
financial year 2014-2015. Trade deficit
also widened by 7.7 percent amounting to
Nu.26.0 billion. Deficits continued to
persist in the services and primary
income accounts as well, while the usual
surplus in the secondary income (driven
by grants for budget support) decreased
by 15.8 percent in the year.
The capital and financial account balance
increased by 22.9 percent to Nu.37.9
billion. Indian Rupee denominated
hydropower loan disbursements
increased by 27.0 percent to Rupees 18.1
billion with an additional Rupees 9.6
billion received as the grant component.
After accounting for other financial flows
and the negative net errors and
omissions, the capital and financial
account surplus was not enough to
finance the current account deficit with a
subsequent drawdown in reserves by an
equivalent of Nu. 560.4 million.
9
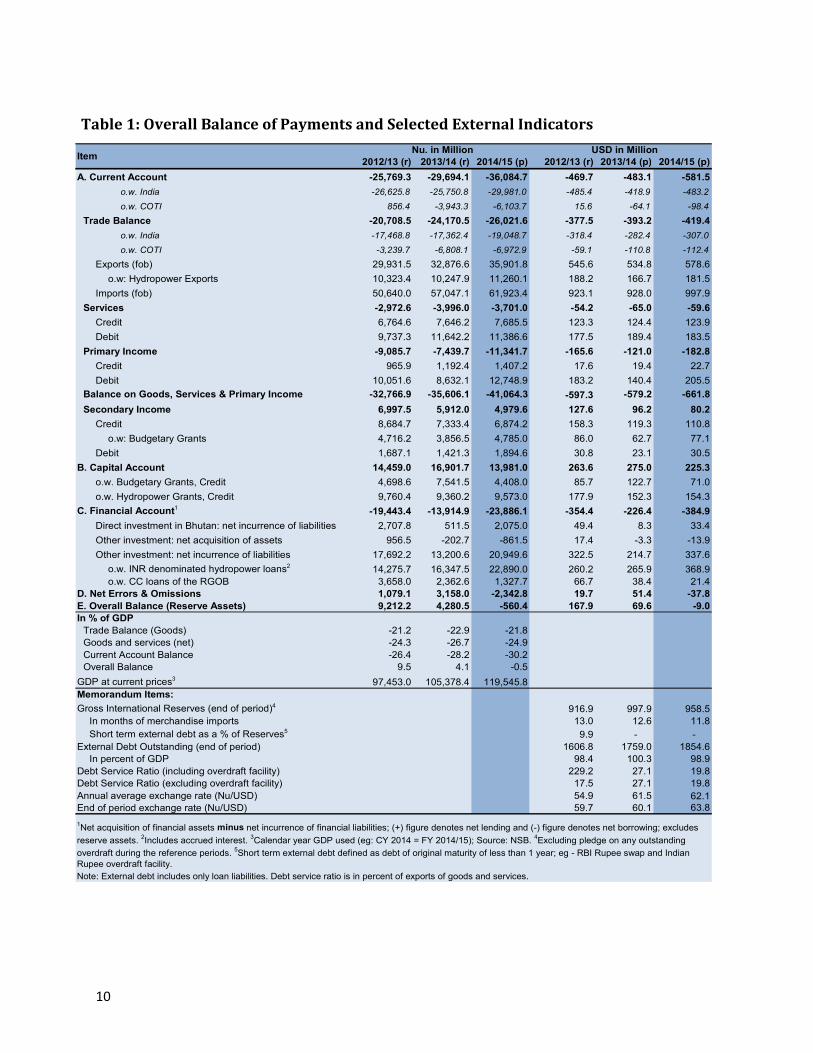
1.5.2 Balance of Payments with India
Bhutan’s current account deficit with
India increased from 24.4 percent of GDP
to 25.1 percent in 2014-2015. The trade
deficit has widened from Nu.17.4 billion
to Nu.19.0 billion. In the income account,
budgetary grants increased from Rupees
2.2 billion to Rupees 3.3 billion. Interest
paid on hydropower debt (Kurichhu and
Tala) amounted to Rupees 1.4 billion
while accrued interest on the three
ongoing hydropower projects
(Punatsangchhu I and II and
Mangdechhu) amounted to almost Rupees
6.3 billion for the year. In the capital and
financial account, grants for budget
support decreased from Rupees 7.1
billion to Rupees 4.1 billion while grants
for hydropower projects increased
marginally from Rupees 9.4 billion to
Rupees 9.6 billion.
1.5.3 Reserves Position
Gross international reserves fell to USD
958.5 million as of June 2015 from USD
997.9 million as of June 2014, although
reserves were sufficient to finance 11.8
months of merchandise imports while
also covering 51.7 percent of public
external debt. Of the total, USD 788
million was convertible currency reserves
while Rupees 10.9 billion was Indian
Rupees.
The management of reserves, in
particular of Indian Rupee reserves,
remains one of the key challenges for the
RMA because of the persistently high
current account deficit. RMA has set
operational threshold for convertible
currency reserves as part of the RMA’s
reserve management policy to ensure
adequate composition of reserves
between India Rupees and other
convertible currencies in line with the
needs for Indian Rupees. Addressing the
challenge of the current account deficit
will require longer-term structural
measures and policies aimed at
channeling investments into productive
sectors, diversifying the economy,
increasing productivity and building the
domestic supply and production base for
increasing exports.
10
2012/13 (r) 2013/14 (r) 2014/15 (p) 2012/13 (r) 2013/14 (p) 2014/15 (p)
A. Current Account -25,769.3 -29,694.1 -36,084.7 -469.7 -483.1 -581.5
o.w. India -26,625.8 -25,750.8 -29,981.0 -485.4 -418.9 -483.2
o.w. COTI 856.4 -3,943.3 -6,103.7 15.6 -64.1 -98.4
Trade Balance -20,708.5 -24,170.5 -26,021.6 -377.5 -393.2 -419.4
o.w. India -17,468.8 -17,362.4 -19,048.7 -318.4 -282.4 -307.0
o.w. COTI -3,239.7 -6,808.1 -6,972.9 -59.1 -110.8 -112.4
Exports (fob) 29,931.5 32,876.6 35,901.8 545.6 534.8 578.6
o.w: Hydropower Exports 10,323.4 10,247.9 11,260.1 188.2 166.7 181.5
Imports (fob) 50,640.0 57,047.1 61,923.4 923.1 928.0 997.9
Services -2,972.6 -3,996.0 -3,701.0 -54.2 -65.0 -59.6
Credit 6,764.6 7,646.2 7,685.5 123.3 124.4 123.9
Debit 9,737.3 11,642.2 11,386.6 177.5 189.4 183.5
Primary Income -9,085.7 -7,439.7 -11,341.7 -165.6 -121.0 -182.8
Credit 965.9 1,192.4 1,407.2 17.6 19.4 22.7
Debit 10,051.6 8,632.1 12,748.9 183.2 140.4 205.5
Balance on Goods, Services & Primary Income -32,766.9 -35,606.1 -41,064.3 -597.3 -579.2 -661.8
Secondary Income 6,997.5 5,912.0 4,979.6 127.6 96.2 80.2
Credit 8,684.7 7,333.4 6,874.2 158.3 119.3 110.8
o.w: Budgetary Grants 4,716.2 3,856.5 4,785.0 86.0 62.7 77.1
Debit 1,687.1 1,421.3 1,894.6 30.8 23.1 30.5
B. Capital Account 14,459.0 16,901.7 13,981.0 263.6 275.0 225.3
o.w. Budgetary Grants, Credit 4,698.6 7,541.5 4,408.0 85.7 122.7 71.0
o.w. Hydropower Grants, Credit 9,760.4 9,360.2 9,573.0 177.9 152.3 154.3
C. Financial Account1-19,443.4 -13,914.9 -23,886.1 -354.4 -226.4 -384.9
Direct investment in Bhutan: net incurrence of liabilities 2,707.8 511.5 2,075.0 49.4 8.3 33.4
Other investment: net acquisition of assets 956.5 -202.7 -861.5 17.4 -3.3 -13.9
Other investment: net incurrence of liabilities 17,692.2 13,200.6 20,949.6 322.5 214.7 337.6
o.w. INR denominated hydropower loans214,275.7 16,347.5 22,890.0 260.2 265.9 368.9
o.w. CC loans of the RGOB 3,658.0 2,362.6 1,327.7 66.7 38.4 21.4
D. Net Errors & Omissions 1,079.1 3,158.0 -2,342.8 19.7 51.4 -37.8
E. Overall Balance (Reserve Assets) 9,212.2 4,280.5 -560.4 167.9 69.6 -9.0
In % of GDP
Trade Balance (Goods) -21.2 -22.9 -21.8
Goods and services (net) -24.3 -26.7 -24.9
Current Account Balance -26.4 -28.2 -30.2
Overall Balance 9.5 4.1 -0.5
GDP at current prices397,453.0 105,378.4 119,545.8
Memorandum Items:
Gross International Reserves (end of period)4916.9 997.9 958.5
In months of merchandise imports 13.0 12.6 11.8
Short term external debt as a % of Reserves59.9 - -
External Debt Outstanding (end of period) 1606.8 1759.0 1854.6
In percent of GDP 98.4 100.3 98.9
Debt Service Ratio (including overdraft facility) 229.2 27.1 19.8
Debt Service Ratio (excluding overdraft facility) 17.5 27.1 19.8
Annual average exchange rate (Nu/USD) 54.9 61.5 62.1
End of period exchange rate (Nu/USD) 59.7 60.1 63.8
Note: External debt includes only loan liabilities. Debt service ratio is in percent of exports of goods and services.
ItemUSD in MillionNu. in Million
1Net acquisition of financial assets minus net incurrence of financial liabilities; (+) figure denotes net lending and (-) figure denotes net borrowing; excludes
reserve assets. 2Includes accrued interest.
3Calendar year GDP used (eg: CY 2014 = FY 2014/15); Source: NSB.
4Excluding pledge on any outstanding
overdraft during the reference periods. 5Short term external debt defined as debt of original maturity of less than 1 year; eg - RBI Rupee swap and Indian
Rupee overdraft facility.
Table 1: Overall Balance of Payments and Selected External Indicators
11
1.5.4 External Debt
Bhutan’s total outstanding external debt
increased to an equivalent of USD 1.9
billion as of June 2015 (5.4 percent
growth between June 2014 to June 2015).
Of this, an equivalent of USD 581.2 million
was outstanding on convertible currency
loans and the remaining Rupees 81.2
billion were outstanding Indian Rupee
loans. Of the total Rupee debt, 90.2
percent were outstanding public debt on
hydropower projects while 8.6 percent
represented debt taken to finance BOP
transactions with India (the GOI line of
credit).
External debt denominated in rupees can
be another source of stress. As of 2011-
2012, the first year when the Rupee
shortage became apparent, the total
external debt was USD 1.3 billion. Since
then, it has been on increasing trend. This
will also translate into higher Rupee
outgo on a yearly basis for debt servicing,
especially when Punatsangchhu I, II and
Mangdechhu become operational and the
schedule of repayment begins.
Within the convertible currency loan
portfolio, concessional public and publicly
guaranteed debt accounted for 99.9
percent while the remaining 0.1 percent
represented outstanding external debt of
the private sector.
The Government of India remains
Bhutan's largest creditor with 67.8
percent of overall external debt at Nu.80.2
billion or 98.8 percent of total Rupee
outstanding debt. This is followed by the
ADB with USD 259.2 million, the World
Bank with USD 165.4 million and the
Government of Austria with USD 81.0
million. Bhutan’s total debt outstanding
stood at 98.9 percent of GDP.
Overall debt servicing on both convertible
currency and Indian Rupee debt for 2014-
2015 was USD 139.5 million as compared
to USD 178.9 million in 2013-2014.
Bhutan’s debt service ratio measured as a
percent of the export earnings from goods
and services decreased to 19.9 percent in
2014-2015 from 27.1 percent in 2013-
2014.
12
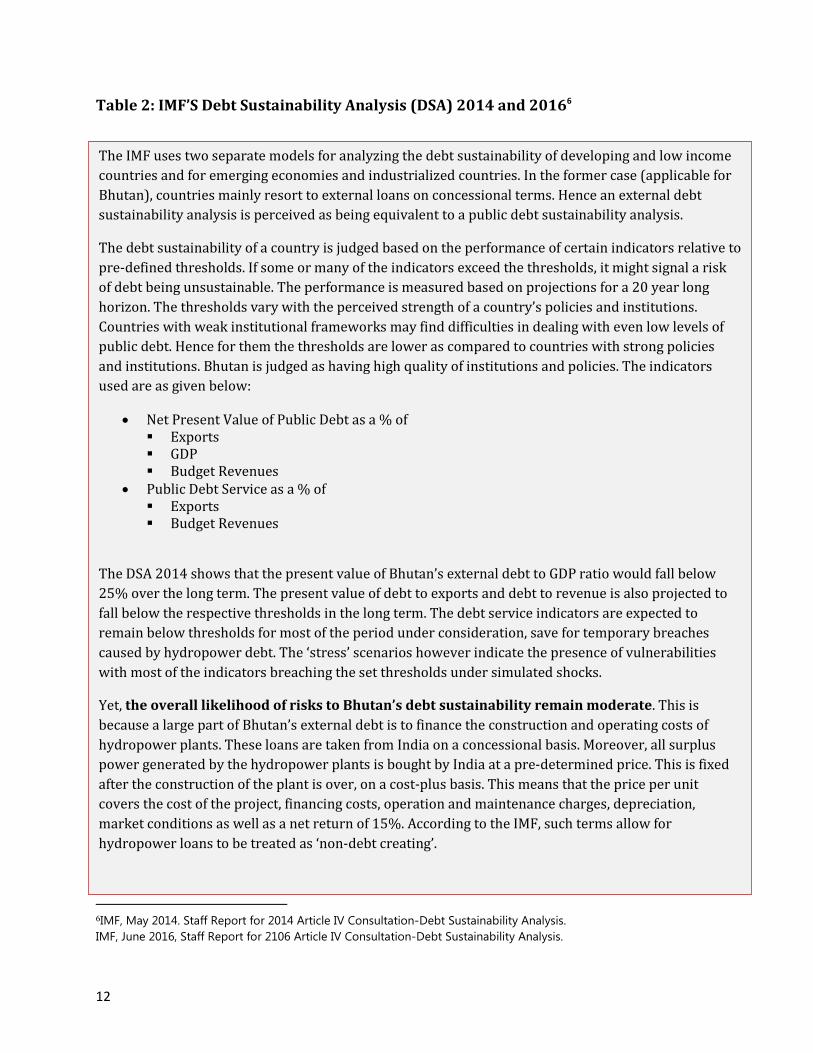
The IMF uses two separate models for analyzing the debt sustainability of developing and low income
countries and for emerging economies and industrialized countries. In the former case (applicable for
Bhutan), countries mainly resort to external loans on concessional terms. Hence an external debt
sustainability analysis is perceived as being equivalent to a public debt sustainability analysis.
The debt sustainability of a country is judged based on the performance of certain indicators relative to
pre-defined thresholds. If some or many of the indicators exceed the thresholds, it might signal a risk
of debt being unsustainable. The performance is measured based on projections for a 20 year long
horizon. The thresholds vary with the perceived strength of a country’s policies and institutions.
Countries with weak institutional frameworks may find difficulties in dealing with even low levels of
public debt. Hence for them the thresholds are lower as compared to countries with strong policies
and institutions. Bhutan is judged as having high quality of institutions and policies. The indicators
used are as given below:
• Net Present Value of Public Debt as a % of � Exports � GDP � Budget Revenues
• Public Debt Service as a % of � Exports � Budget Revenues
The DSA 2014 shows that the present value of Bhutan’s external debt to GDP ratio would fall below
25% over the long term. The present value of debt to exports and debt to revenue is also projected to
fall below the respective thresholds in the long term. The debt service indicators are expected to
remain below thresholds for most of the period under consideration, save for temporary breaches
caused by hydropower debt. The ‘stress’ scenarios however indicate the presence of vulnerabilities
with most of the indicators breaching the set thresholds under simulated shocks.
Yet, the overall likelihood of risks to Bhutan’s debt sustainability remain moderate. This is
because a large part of Bhutan’s external debt is to finance the construction and operating costs of
hydropower plants. These loans are taken from India on a concessional basis. Moreover, all surplus
power generated by the hydropower plants is bought by India at a pre-determined price. This is fixed
after the construction of the plant is over, on a cost-plus basis. This means that the price per unit
covers the cost of the project, financing costs, operation and maintenance charges, depreciation,
market conditions as well as a net return of 15%. According to the IMF, such terms allow for
hydropower loans to be treated as ‘non-debt creating’.
Table 2: IMF’S Debt Sustainability Analysis (DSA) 2014 and 20166
6IMF, May 2014. Staff Report for 2014 Article IV Consultation-Debt Sustainability Analysis.
IMF, June 2016, Staff Report for 2106 Article IV Consultation-Debt Sustainability Analysis.
13
1.5.5 Inflationary Risk
Inflation can adversely affect financial
stability by misleading agents about their
financial decisions. In a situation where
the inflation rate exceeds the interest
rate, individuals would be unlikely to
save, investors would be unlikely to
invest or lenders to lend. The resultant
lack of credit in the market could hamper
economic activity which could translate
into increasing non-performing loans and
financial instability. A sustained increase
in inflation can also lead to permanently
higher inflation expectations. So the
problem may persist if the interest rate
fails to catch up with these expectations.
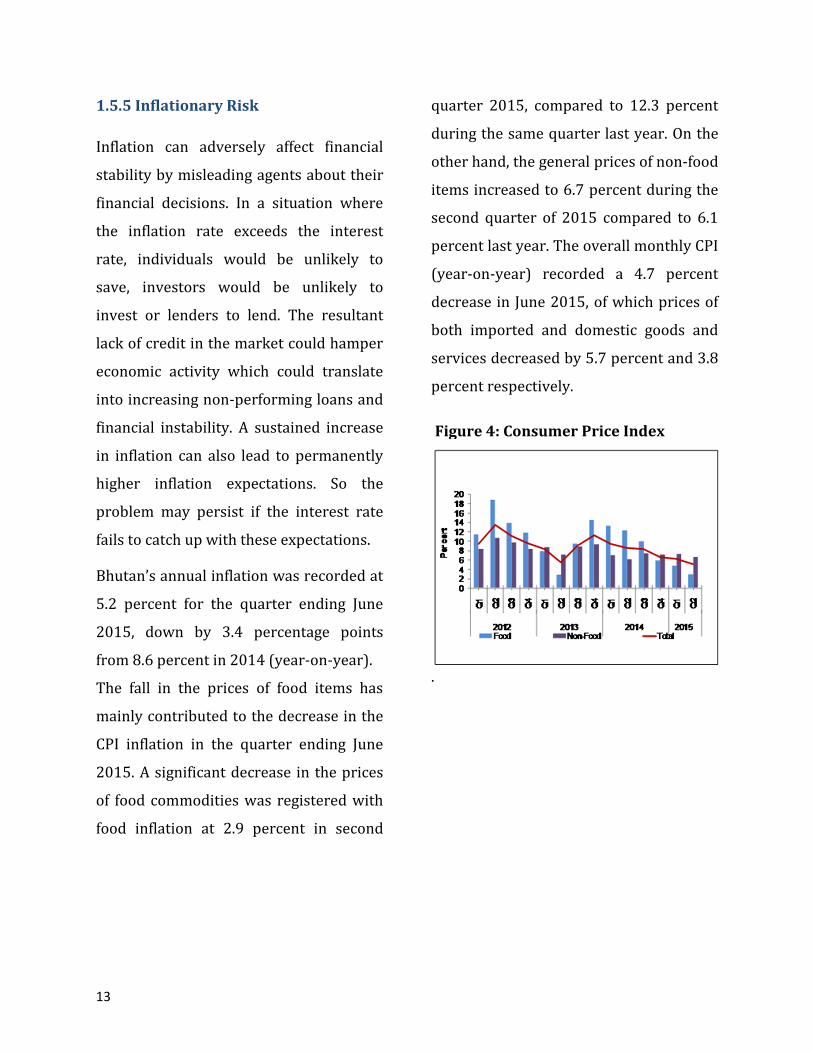
Bhutan’s annual inflation was recorded at
5.2 percent for the quarter ending June
2015, down by 3.4 percentage points
from 8.6 percent in 2014 (year-on-year).
The fall in the prices of food items has
mainly contributed to the decrease in the
CPI inflation in the quarter ending June
2015. A significant decrease in the prices
of food commodities was registered with
food inflation at 2.9 percent in second
quarter 2015, compared to 12.3 percent
during the same quarter last year. On the
other hand, the general prices of non-food
items increased to 6.7 percent during the
second quarter of 2015 compared to 6.1
percent last year. The overall monthly CPI
(year-on-year) recorded a 4.7 percent
decrease in June 2015, of which prices of
both imported and domestic goods and
services decreased by 5.7 percent and 3.8
percent respectively.
.
Figure 4: Consumer Price Index
14
Chapter II
Financial System Stability: Soundness and Resilience
Financial soundness refers to the ability of the financial system to withstand shocks. A
healthier financial system, as measured by capital adequacy, profitability etc. is likely to be
resilient. The resilience of the commercial banks in respect of credit risk and liquidity risk
were studied through stress testing by imparting extreme but plausible shocks, since these
risks are the most relevant risk in financial sector for now. An important macro-prudential
goal of stress testing is to assess whether the banking system is sufficiently capitalized to
maintain the supply of credit in the face of adverse shocks. The Bhutanese financial system
remains well capitalized relative to current regulatory requirements. The stress-test
results suggest that the banking system is well capitalized to support the economy in a
severe stress scenario, which would adversely affect Bhutan. The capitalization of the
system has improved further over the course of 2015. The financial system also has a
liquid asset buffer that exceeds regulatory requirements, which are designed to enable
financial institutions to withstand temporary periods of stress. Financial sector’s
profitability remains strong with high net interest margins. However, it is important that
financial institutions manage risks relating to their exposures and adequately provision for
expected losses.
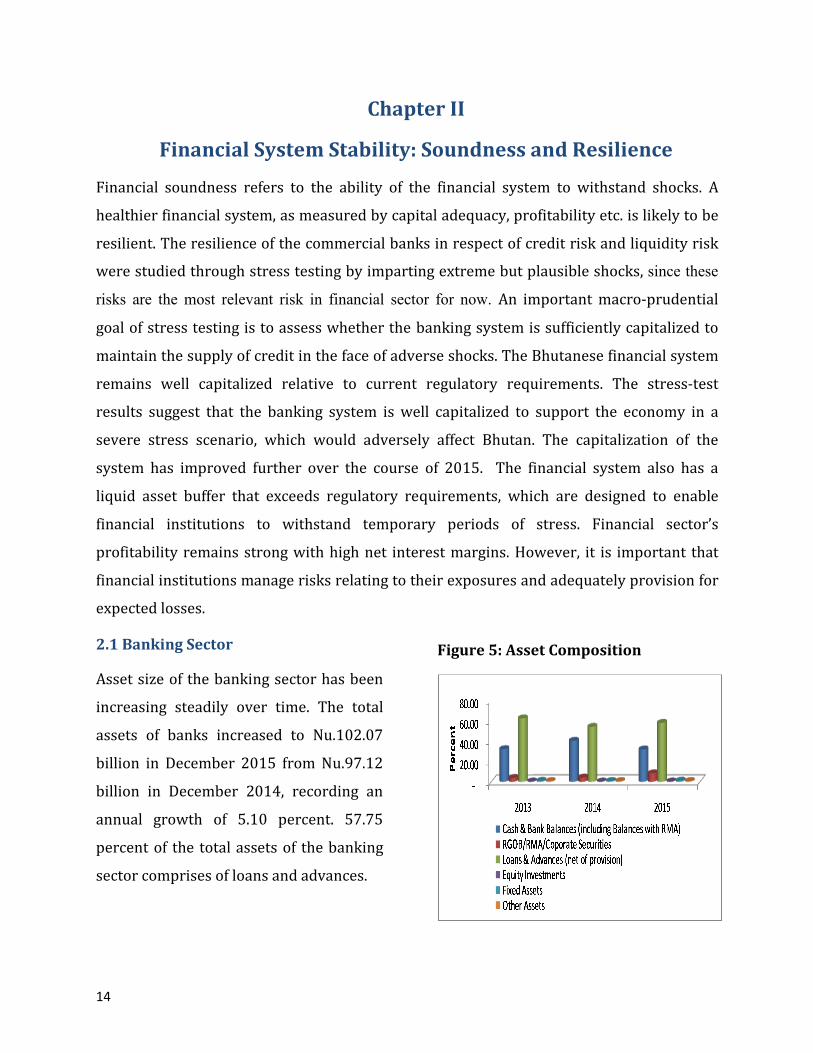
2.1 Banking Sector
Asset size of the banking sector has been
increasing steadily over time. The total
assets of banks increased to Nu.102.07
billion in December 2015 from Nu.97.12
billion in December 2014, recording an
annual growth of 5.10 percent. 57.75
percent of the total assets of the banking
sector comprises of loans and advances.
Figure 5: Asset Composition
15
2.1.1Performance
Credit and Deposit Growth
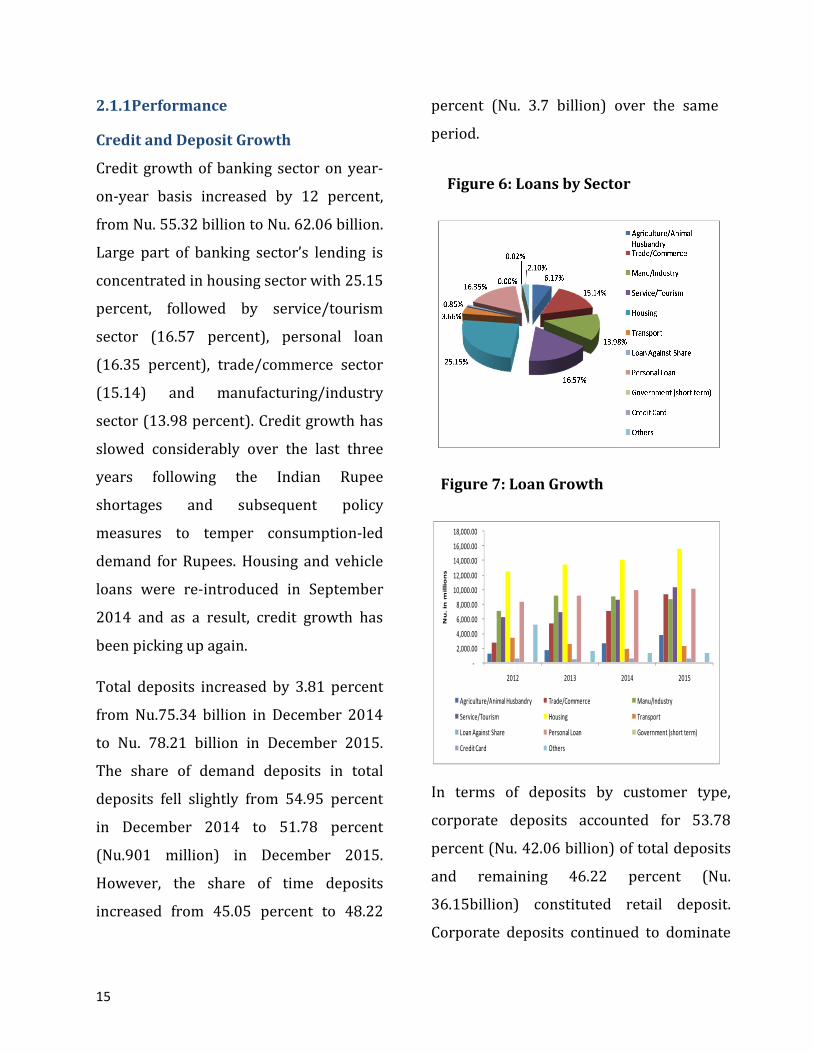
Credit growth of banking sector on year-
on-year basis increased by 12 percent,
from Nu. 55.32 billion to Nu. 62.06 billion.
Large part of banking sector’s lending is
concentrated in housing sector with 25.15
percent, followed by service/tourism
sector (16.57 percent), personal loan
(16.35 percent), trade/commerce sector
(15.14) and manufacturing/industry
sector (13.98 percent). Credit growth has
slowed considerably over the last three
years following the Indian Rupee
shortages and subsequent policy
measures to temper consumption-led
demand for Rupees. Housing and vehicle
loans were re-introduced in September
2014 and as a result, credit growth has
been picking up again.
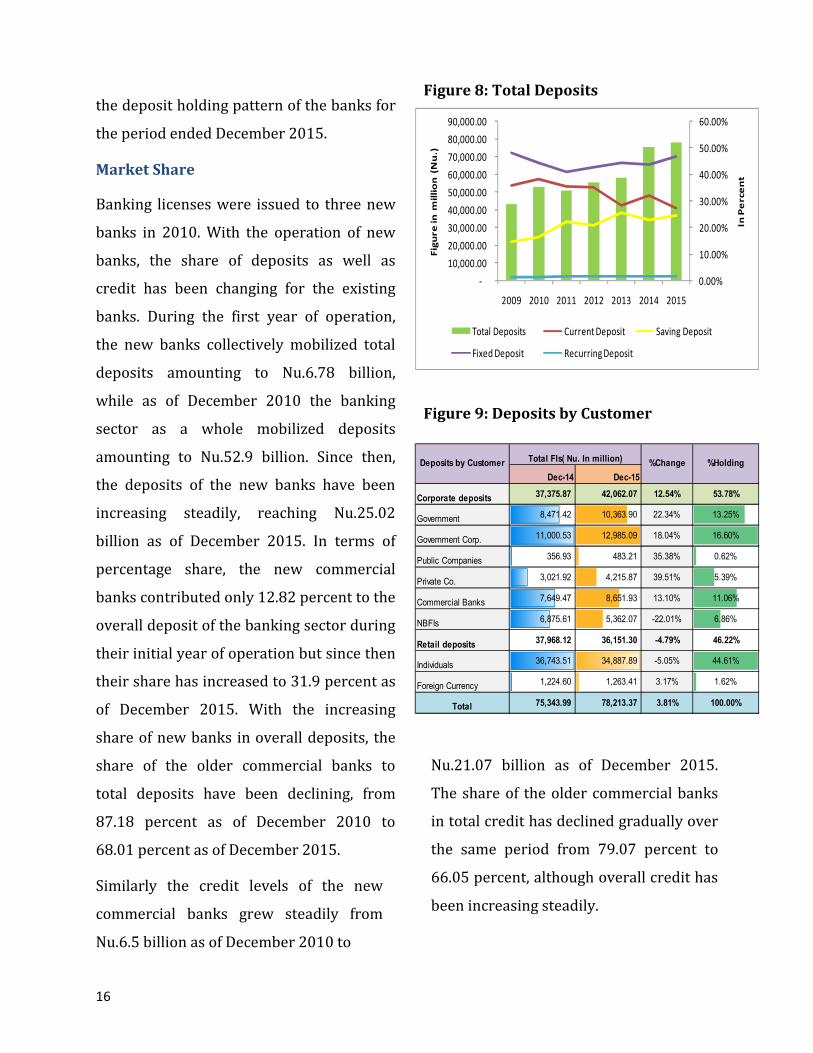
Total deposits increased by 3.81 percent
from Nu.75.34 billion in December 2014
to Nu. 78.21 billion in December 2015.
The share of demand deposits in total
deposits fell slightly from 54.95 percent
in December 2014 to 51.78 percent
(Nu.901 million) in December 2015.
However, the share of time deposits
increased from 45.05 percent to 48.22
percent (Nu. 3.7 billion) over the same
period.
In terms of deposits by customer type,
corporate deposits accounted for 53.78
percent (Nu. 42.06 billion) of total deposits
and remaining 46.22 percent (Nu.
36.15billion) constituted retail deposit.
Corporate deposits continued to dominate
-
2,000.00
4,000.00
6,000.00
8,000.00
10,000.00
12,000.00
14,000.00
16,000.00
18,000.00
2012 2013 2014 2015
Nu
. in
mil
lio
ns
Agriculture/Animal Husbandry Trade/Commerce Manu/Industry
Service/Tourism Housing Transport
Loan Against Share Personal Loan Government (short term)
Credit Card Others
Figure 6: Loans by Sector
Figure 7: Loan Growth
16
Dec-14 Dec-15
Corporate deposits 37,375.87 42,062.07 12.54% 53.78%
Government 8,471.42 10,363.90 22.34% 13.25%
Government Corp. 11,000.53 12,985.09 18.04% 16.60%
Public Companies 356.93 483.21 35.38% 0.62%
Private Co. 3,021.92 4,215.87 39.51% 5.39%
Commercial Banks 7,649.47 8,651.93 13.10% 11.06%
NBFIs 6,875.61 5,362.07 -22.01% 6.86%
Retail deposits37,968.12 36,151.30 -4.79% 46.22%
Individuals 36,743.51 34,887.89 -5.05% 44.61%
Foreign Currency 1,224.60 1,263.41 3.17% 1.62%
Total 75,343.99 78,213.37 3.81% 100.00%
%ChangeDeposits by Customer %HoldingTotal FIs( Nu. In million)
the deposit holding pattern of the banks for
the period ended December 2015.
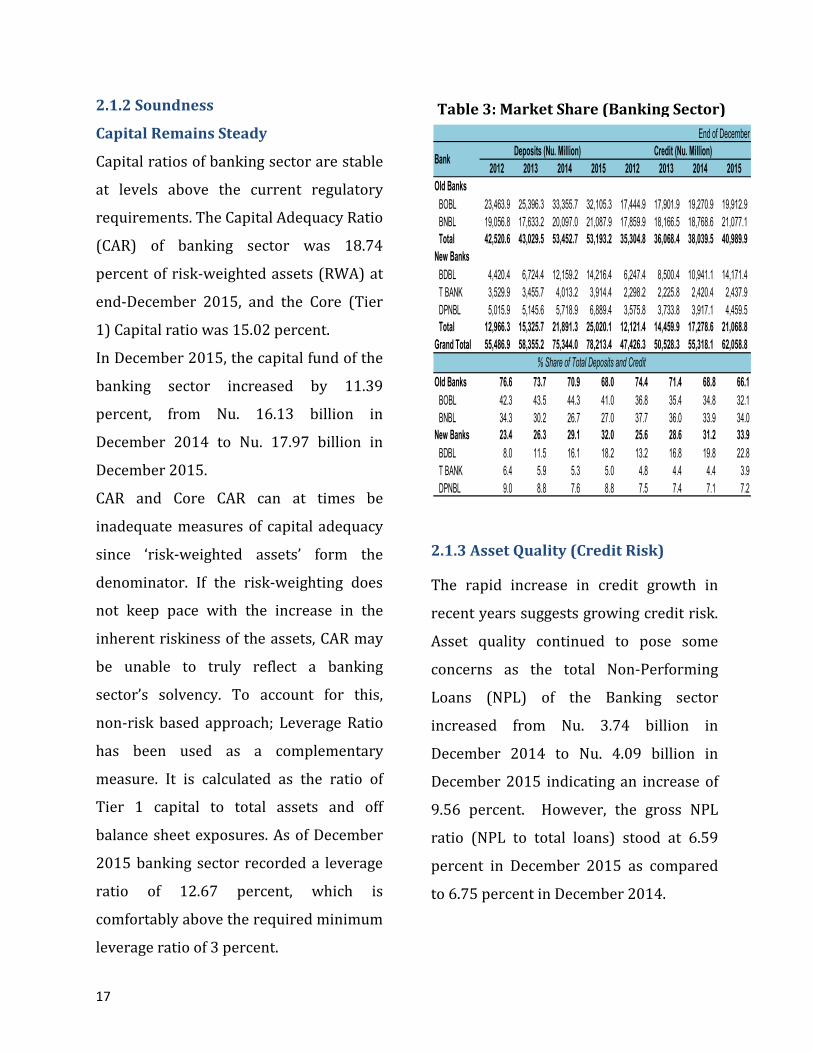
Market Share
Banking licenses were issued to three new
banks in 2010. With the operation of new
banks, the share of deposits as well as
credit has been changing for the existing
banks. During the first year of operation,
the new banks collectively mobilized total
deposits amounting to Nu.6.78 billion,
while as of December 2010 the banking
sector as a whole mobilized deposits
amounting to Nu.52.9 billion. Since then,
the deposits of the new banks have been
increasing steadily, reaching Nu.25.02
billion as of December 2015. In terms of
percentage share, the new commercial
banks contributed only 12.82 percent to the
overall deposit of the banking sector during
their initial year of operation but since then
their share has increased to 31.9 percent as
of December 2015. With the increasing
share of new banks in overall deposits, the
share of the older commercial banks to
total deposits have been declining, from
87.18 percent as of December 2010 to
68.01 percent as of December 2015.
Similarly the credit levels of the new
commercial banks grew steadily from
Nu.6.5 billion as of December 2010 to
Nu.21.07 billion as of December 2015.
The share of the older commercial banks
in total credit has declined gradually over
the same period from 79.07 percent to
66.05 percent, although overall credit has
been increasing steadily.
0.00%
10.00%
20.00%
30.00%
40.00%
50.00%
60.00%
-
10,000.00
20,000.00
30,000.00
40,000.00
50,000.00
60,000.00
70,000.00
80,000.00
90,000.00
2009 2010 2011 2012 2013 2014 2015
In P
erce
nt
Fig
ure
in
mil
lio
n (
Nu
.)
Total Deposits Current Deposit Saving Deposit
Fixed Deposit Recurring Deposit
Figure 8: Total Deposits
Figure 9: Deposits by Customer
17
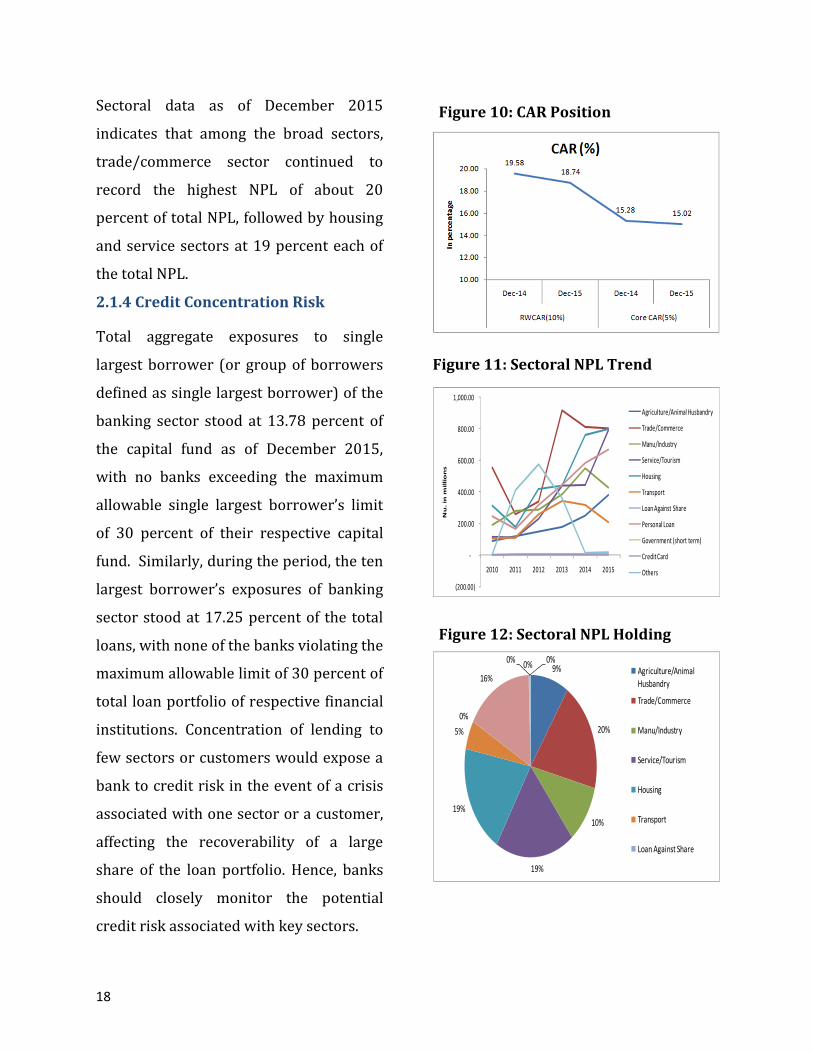
2.1.2 Soundness
Capital Remains Steady
Capital ratios of banking sector are stable
at levels above the current regulatory
requirements. The Capital Adequacy Ratio
(CAR) of banking sector was 18.74
percent of risk-weighted assets (RWA) at
end-December 2015, and the Core (Tier
1) Capital ratio was 15.02 percent.
In December 2015, the capital fund of the
banking sector increased by 11.39
percent, from Nu. 16.13 billion in
December 2014 to Nu. 17.97 billion in
December 2015.
CAR and Core CAR can at times be
inadequate measures of capital adequacy
since ‘risk-weighted assets’ form the
denominator. If the risk-weighting does
not keep pace with the increase in the
inherent riskiness of the assets, CAR may
be unable to truly reflect a banking
sector’s solvency. To account for this,
non-risk based approach; Leverage Ratio
has been used as a complementary
measure. It is calculated as the ratio of
Tier 1 capital to total assets and off
balance sheet exposures. As of December
2015 banking sector recorded a leverage
ratio of 12.67 percent, which is
comfortably above the required minimum
leverage ratio of 3 percent.
2.1.3 Asset Quality (Credit Risk)
The rapid increase in credit growth in
recent years suggests growing credit risk.
Asset quality continued to pose some
concerns as the total Non-Performing
Loans (NPL) of the Banking sector
increased from Nu. 3.74 billion in
December 2014 to Nu. 4.09 billion in
December 2015 indicating an increase of
9.56 percent. However, the gross NPL
ratio (NPL to total loans) stood at 6.59
percent in December 2015 as compared
to 6.75 percent in December 2014.
2012 2013 2014 2015 2012 2013 2014 2015
Old Banks
BOBL 23,463.9 25,396.3 33,355.7 32,105.3 17,444.9 17,901.9 19,270.9 19,912.9
BNBL 19,056.8 17,633.2 20,097.0 21,087.9 17,859.9 18,166.5 18,768.6 21,077.1
Total 42,520.6 43,029.5 53,452.7 53,193.2 35,304.8 36,068.4 38,039.5 40,989.9
New Banks
BDBL 4,420.4 6,724.4 12,159.2 14,216.4 6,247.4 8,500.4 10,941.1 14,171.4
T BANK 3,529.9 3,455.7 4,013.2 3,914.4 2,298.2 2,225.8 2,420.4 2,437.9
DPNBL 5,015.9 5,145.6 5,718.9 6,889.4 3,575.8 3,733.8 3,917.1 4,459.5
Total 12,966.3 15,325.7 21,891.3 25,020.1 12,121.4 14,459.9 17,278.6 21,068.8
Grand Total 55,486.9 58,355.2 75,344.0 78,213.4 47,426.3 50,528.3 55,318.1 62,058.8
Old Banks 76.6 73.7 70.9 68.0 74.4 71.4 68.8 66.1
BOBL 42.3 43.5 44.3 41.0 36.8 35.4 34.8 32.1
BNBL 34.3 30.2 26.7 27.0 37.7 36.0 33.9 34.0
New Banks 23.4 26.3 29.1 32.0 25.6 28.6 31.2 33.9
BDBL 8.0 11.5 16.1 18.2 13.2 16.8 19.8 22.8
T BANK 6.4 5.9 5.3 5.0 4.8 4.4 4.4 3.9
DPNBL 9.0 8.8 7.6 8.8 7.5 7.4 7.1 7.2
% Share of Total Deposits and Credit
End of December
BankDeposits (Nu. Million) Credit (Nu. Million)
Table 3: Market Share (Banking Sector)
18
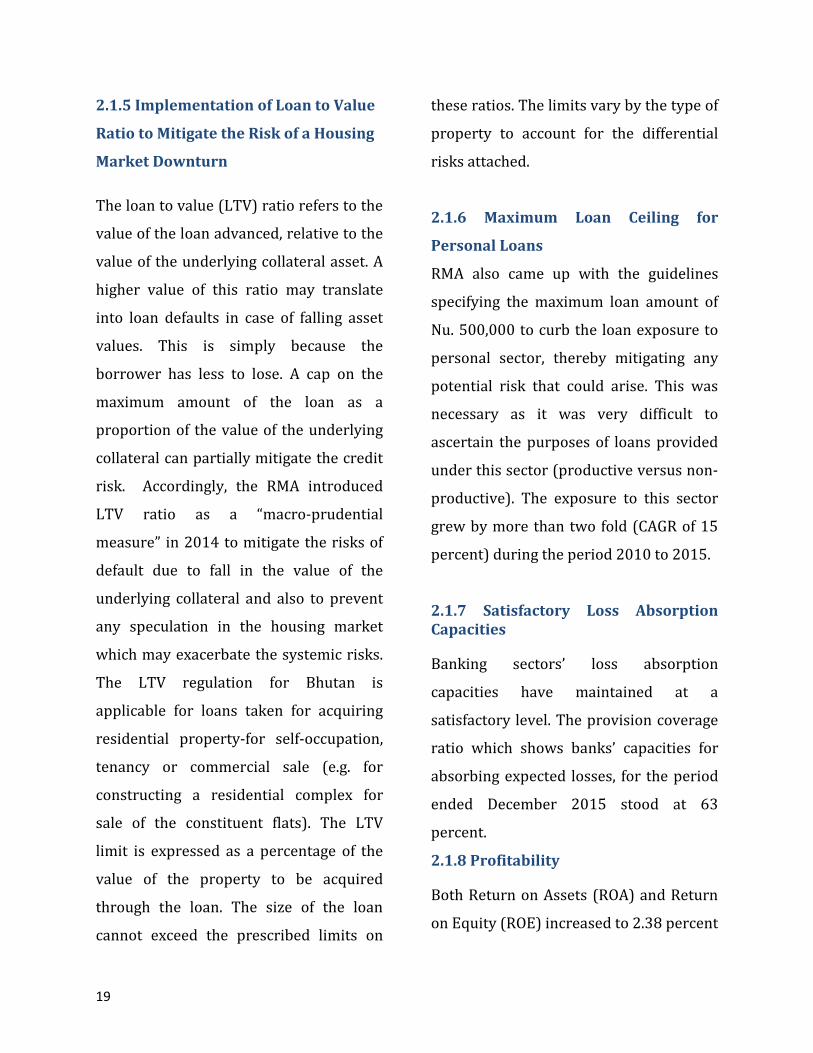
Sectoral data as of December 2015
indicates that among the broad sectors,
trade/commerce sector continued to
record the highest NPL of about 20
percent of total NPL, followed by housing
and service sectors at 19 percent each of
the total NPL.
2.1.4 Credit Concentration Risk
Total aggregate exposures to single
largest borrower (or group of borrowers
defined as single largest borrower) of the
banking sector stood at 13.78 percent of
the capital fund as of December 2015,
with no banks exceeding the maximum
allowable single largest borrower’s limit
of 30 percent of their respective capital
fund. Similarly, during the period, the ten
largest borrower’s exposures of banking
sector stood at 17.25 percent of the total
loans, with none of the banks violating the
maximum allowable limit of 30 percent of
total loan portfolio of respective financial
institutions. Concentration of lending to
few sectors or customers would expose a
bank to credit risk in the event of a crisis
associated with one sector or a customer,
affecting the recoverability of a large
share of the loan portfolio. Hence, banks
should closely monitor the potential
credit risk associated with key sectors.
(200.00)
-
200.00
400.00
600.00
800.00
1,000.00
2010 2011 2012 2013 2014 2015
Nu
. in
mil
lio
ns
Agriculture/Animal Husbandry
Trade/Commerce
Manu/Industry
Service/Tourism
Housing
Transport
Loan Against Share
Personal Loan
Government (short term)
Credit Card
Others
9%
20%
10%
19%
19%
5%
0%
16%
0%0%0%
Agriculture/Animal
Husbandry
Trade/Commerce
Manu/Industry
Service/Tourism
Housing
Transport
Loan Against Share
Figure 10: CAR Position
Figure 11: Sectoral NPL Trend
Figure 12: Sectoral NPL Holding
19
2.1.5 Implementation of Loan to Value
Ratio to Mitigate the Risk of a Housing
Market Downturn
The loan to value (LTV) ratio refers to the
value of the loan advanced, relative to the
value of the underlying collateral asset. A
higher value of this ratio may translate
into loan defaults in case of falling asset
values. This is simply because the
borrower has less to lose. A cap on the
maximum amount of the loan as a
proportion of the value of the underlying
collateral can partially mitigate the credit
risk. Accordingly, the RMA introduced
LTV ratio as a “macro-prudential
measure” in 2014 to mitigate the risks of
default due to fall in the value of the
underlying collateral and also to prevent
any speculation in the housing market
which may exacerbate the systemic risks.
The LTV regulation for Bhutan is
applicable for loans taken for acquiring
residential property-for self-occupation,
tenancy or commercial sale (e.g. for
constructing a residential complex for
sale of the constituent flats). The LTV
limit is expressed as a percentage of the
value of the property to be acquired
through the loan. The size of the loan
cannot exceed the prescribed limits on
these ratios. The limits vary by the type of
property to account for the differential
risks attached.
2.1.6 Maximum Loan Ceiling for
Personal Loans
RMA also came up with the guidelines
specifying the maximum loan amount of
Nu. 500,000 to curb the loan exposure to
personal sector, thereby mitigating any
potential risk that could arise. This was
necessary as it was very difficult to
ascertain the purposes of loans provided
under this sector (productive versus non-
productive). The exposure to this sector
grew by more than two fold (CAGR of 15
percent) during the period 2010 to 2015.
2.1.7 Satisfactory Loss Absorption
Capacities
Banking sectors’ loss absorption
capacities have maintained at a
satisfactory level. The provision coverage
ratio which shows banks’ capacities for
absorbing expected losses, for the period
ended December 2015 stood at 63
percent.
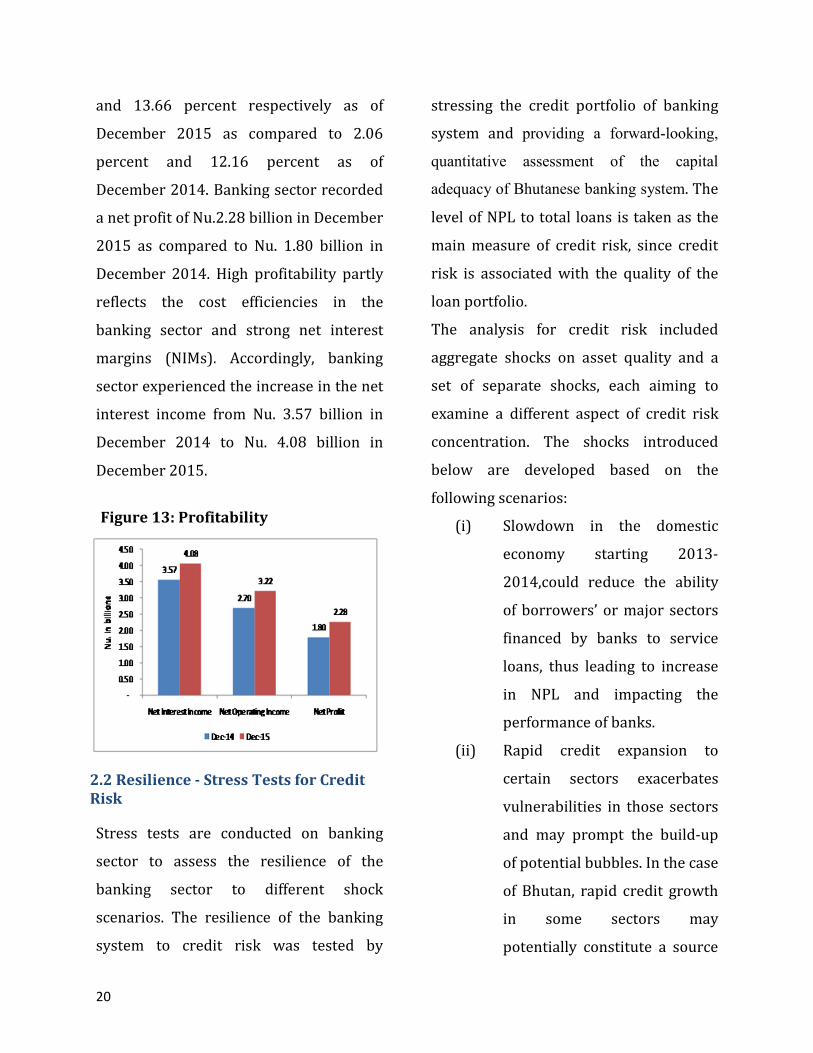
2.1.8 Profitability
Both Return on Assets (ROA) and Return
on Equity (ROE) increased to 2.38 percent
20
and 13.66 percent respectively as of
December 2015 as compared to 2.06
percent and 12.16 percent as of
December 2014. Banking sector recorded
a net profit of Nu.2.28 billion in December
2015 as compared to Nu. 1.80 billion in
December 2014. High profitability partly
reflects the cost efficiencies in the
banking sector and strong net interest
margins (NIMs). Accordingly, banking
sector experienced the increase in the net
interest income from Nu. 3.57 billion in
December 2014 to Nu. 4.08 billion in
December 2015.
2.2 Resilience - Stress Tests for Credit
Risk
Stress tests are conducted on banking
sector to assess the resilience of the
banking sector to different shock
scenarios. The resilience of the banking
system to credit risk was tested by
stressing the credit portfolio of banking
system and providing a forward-looking,
quantitative assessment of the capital
adequacy of Bhutanese banking system. The
level of NPL to total loans is taken as the
main measure of credit risk, since credit
risk is associated with the quality of the
loan portfolio.
The analysis for credit risk included
aggregate shocks on asset quality and a
set of separate shocks, each aiming to
examine a different aspect of credit risk
concentration. The shocks introduced
below are developed based on the
following scenarios:
(i) Slowdown in the domestic
economy starting 2013-
2014,could reduce the ability
of borrowers’ or major sectors
financed by banks to service
loans, thus leading to increase
in NPL and impacting the
performance of banks.
(ii) Rapid credit expansion to
certain sectors exacerbates
vulnerabilities in those sectors
and may prompt the build-up
of potential bubbles. In the case
of Bhutan, rapid credit growth
in some sectors may
potentially constitute a source
Figure 13: Profitability
21
of risk over the medium term.
Thus, going forward, it is
important to be aware of
potentially vulnerable sectors
and concentration to single and
group of borrowers
(counterparty risk)
Under each scenario, the after-shock CAR
is compared with the minimum
regulatory CAR requirement of 10
percent. Accordingly, four kinds of credit
shocks introduced are as follows:
(i) What happens when a fixed
proportion of doubtful loans
turn into loss assets?
(ii) What happens when a fixed
proportion of performing loans
turn into non-performing
loans?
(iii) What happens when loans to
specific sectors turn into NPL?
(iv) Concentration risk analysis
RMA Prudential Regulations requires
banks to provision for loans based on the
level of its quality. Therefore, any
increase in NPL would require the banks
to set aside additional provisions in order
to cover for any potential losses from
these loans. These additional provisions
are deducted from the capital fund of the
bank, which in turn affects the level of the
capital adequacy of the bank.
Credit shock 1: What happens when a
fixed proportion of doubtful loans turn
into loss assets?
This shock has been introduced to
measure the impact on the banking
sector’s capital stock when certain
proportion of doubtful loans turns into
loss assets. The degree of provisioning
required for loss assets is higher than for
doubtful loans. For loss assets (loans) 100
percent of the value of non-performing
loan has to set aside as a specific
provision as compared to 50 percent
provisioning requirement for doubtful
loans. As 56 percent of total NPL are in
the loss category (25 percent under
doubtful category) as of December 2015,
a shock of 30 percent of doubtful loans
moving into a loss category is assumed,
and provisioning those loans at 100
percent.
Result: The result of this shock as
measured by the movement of loans from
doubtful to loss category indicates that
banking system is resilient to this shock
occurred in isolation. With 30 percent
slippage of loans, the average total Capital
Adequacy Ratio (CAR) of the Bhutanese
banking system falls slightly from 18.8
22
percent to 18.7 percent, with none of the
banks falling below the minimum
regulatory CAR requirement of 10
percent. This is indicating that provisions
(specific provisions) provided by banking
sector against NPLs are more than the
minimum requirement prescribed by
RMA Prudential Regulation, as a result,
has a little or no impact on the capital
adequacy of the banking system.
Generally, when the loans move from
doubtful to loss category, there is higher
provisioning requirement pressure on the
banking system. This is assumed to be
met through the capital fund of banks,
that is, the capital fund decreases by the
extent of the additional provisioning
required.
Credit Shock 2: What happens when a
fixed proportion of performing loans
turn into non-performing loans?
Second shock is a situation where asset
quality declines, affecting all banks
proportionately. This shock was
introduced to measure the impact on
capital when an additional proportion of
hitherto performing loans turn non-
performing loans. The extent of
provisions kept against performing loans
is much lower than that kept against non-
performing loans. Hence, an increase in
non-performing loans leads to an increase
in the provisioning requirement. As
before, the capital stock will be reduced
by the extent of the additional provisions
required. The following are the
assumptions used under this shock:
(i) 20 percent of performing loans
turning into NPL
(ii) The new NPL will require a
uniform provisioning (specific
provision) requirement of 25
percent
(iii)The new NPL will bear a risk
weight of 100 percent
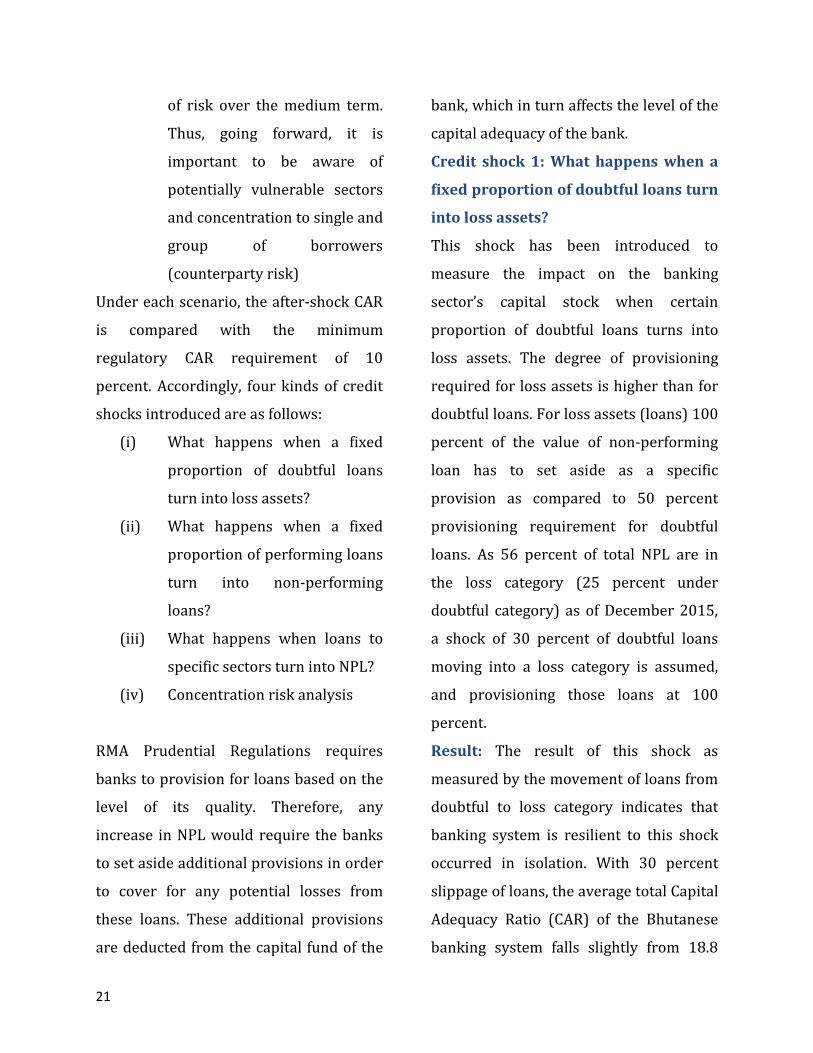
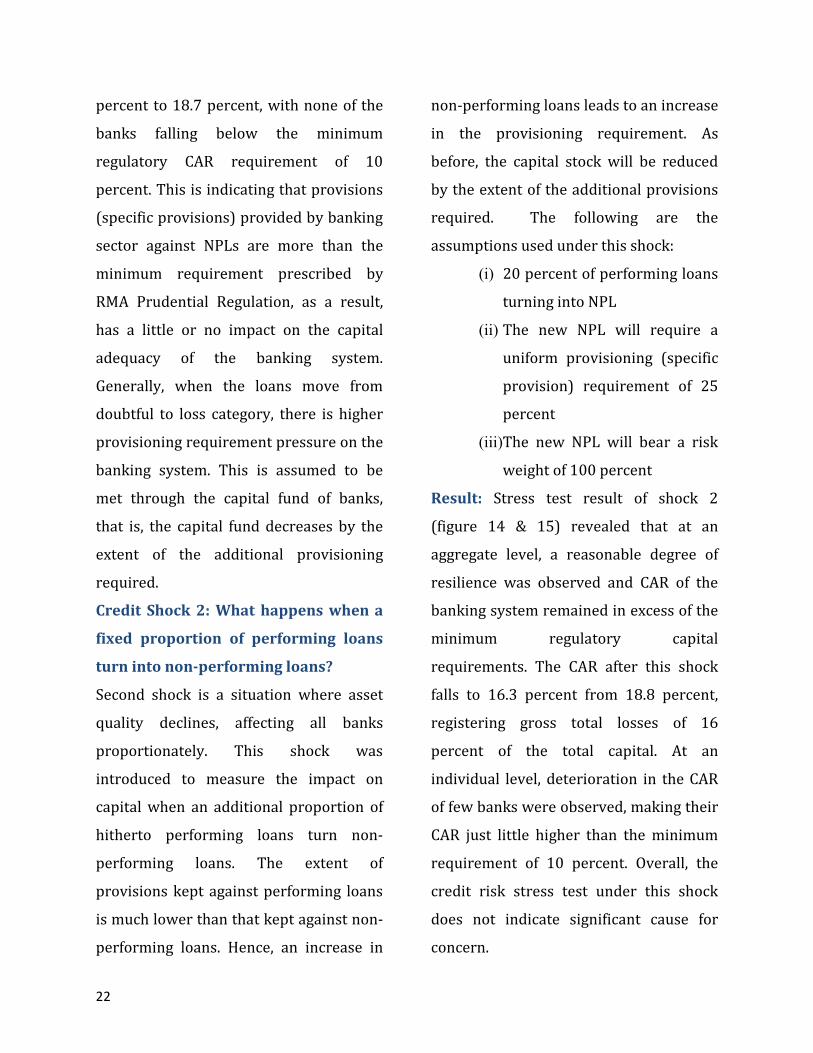
Result: Stress test result of shock 2
(figure 14 & 15) revealed that at an
aggregate level, a reasonable degree of
resilience was observed and CAR of the
banking system remained in excess of the
minimum regulatory capital
requirements. The CAR after this shock
falls to 16.3 percent from 18.8 percent,
registering gross total losses of 16
percent of the total capital. At an
individual level, deterioration in the CAR
of few banks were observed, making their
CAR just little higher than the minimum
requirement of 10 percent. Overall, the
credit risk stress test under this shock
does not indicate significant cause for
concern.
23
Credit Shock 3: What happens when
loans to specific sectors turn into NPL?
Apart from overall decline in the asset
quality, shocks in specific sectors may
also have a bearing on the banks’
economic value. This test aims to measure
the impact on capital when a fixed
proportion of performing loans in specific
sectors turn non-performing. The
advantage of this test is that we can
directly simulate the impact of the
emergence of non-performing loans in the
vulnerable sectors. This stress test will
examine the impact of the combined
shock for three sectors (sectors in which
banking sector as a whole is highly
exposed to): Trade & Commerce, Housing
and Personal sectors of the banking
system as a whole as well as on the
individual bank, although, sector-specific
increase in NPLs may have different
implications for different banks
depending on the relative size of the
banks’ credit exposures to these sectors.
Housing and personal sector has been
assumed for this test, given the fact that
housing sector is the highly exposed
sector and also prior to 2015, the loans
under the personal sector did not have
specified purposes and moreover most of
the personal loans were also sanctioned
for housing purposes. It should be noted
that banks being highly exposed to these
sectors, any creation of asset bubble
would pose a significant risk to the
banking sector. Therefore, this test will
assess the level of bank resilience, should
the vulnerabilities under these sectors
0
1
2
3
4
5
Less than 10% 10% to 15% 15% to 20% More than 20%
No
. o
f b
an
ks
CAR wise distribution of banks(Post Shock 2)
No. of banks (pre shocks) No. of banks (post shocks)
15.2
23.9
17.6 15.5
18.0 18.8
12.9
21.5
14.8 12.9
15.2 16.3
-
5.0
10.0
15.0
20.0
25.0
30.0
BOBL BNBL Tbank DPNBL BDBL All banks
Percen
t
CAR Post Shock 2
Pre shock CAR Post shock CAR
Figure 14: CAR Distribution
Figure 15: CAR Post-Shock 2
24
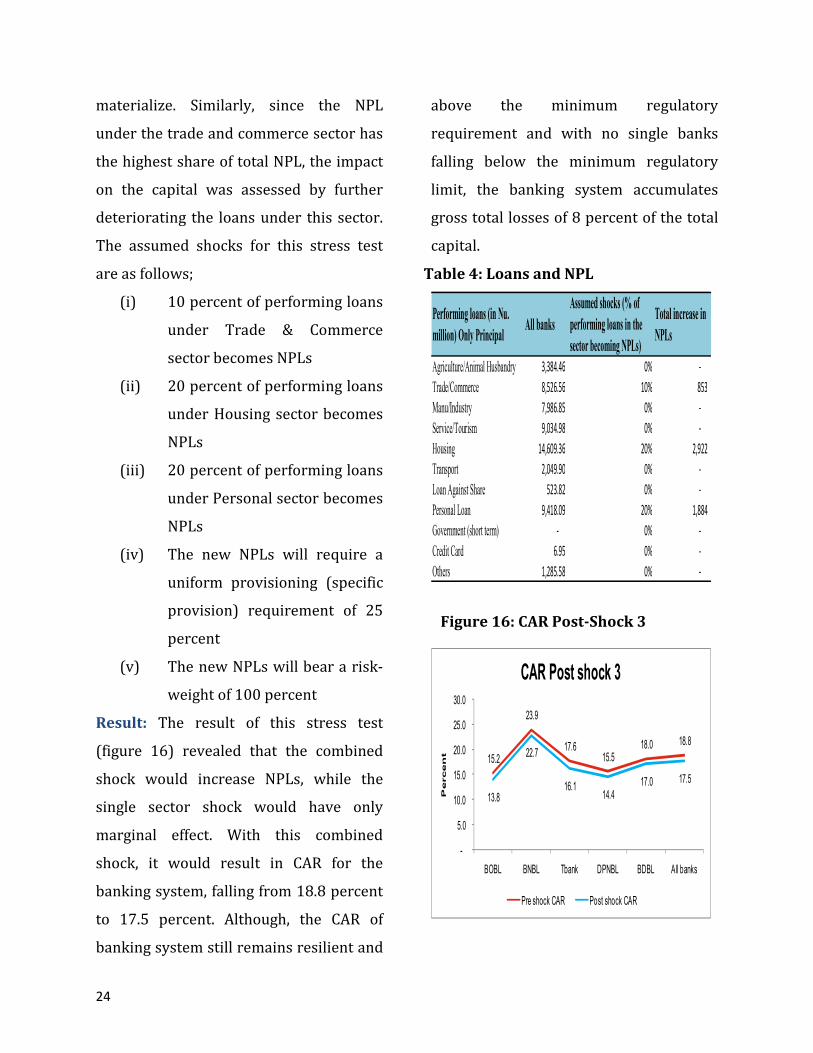
materialize. Similarly, since the NPL
under the trade and commerce sector has
the highest share of total NPL, the impact
on the capital was assessed by further
deteriorating the loans under this sector.
The assumed shocks for this stress test
are as follows;
(i) 10 percent of performing loans
under Trade & Commerce
sector becomes NPLs
(ii) 20 percent of performing loans
under Housing sector becomes
NPLs
(iii) 20 percent of performing loans
under Personal sector becomes
NPLs
(iv) The new NPLs will require a
uniform provisioning (specific
provision) requirement of 25
percent
(v) The new NPLs will bear a risk-
weight of 100 percent
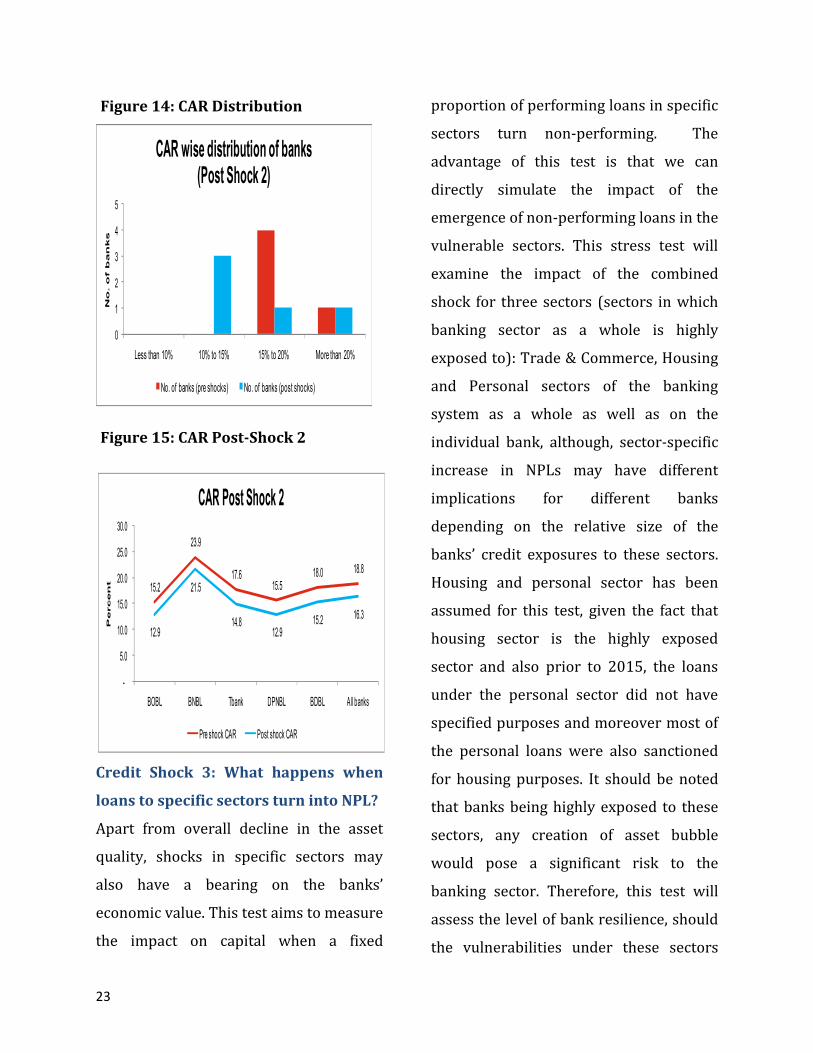
Result: The result of this stress test
(figure 16) revealed that the combined
shock would increase NPLs, while the
single sector shock would have only
marginal effect. With this combined
shock, it would result in CAR for the
banking system, falling from 18.8 percent
to 17.5 percent. Although, the CAR of
banking system still remains resilient and
above the minimum regulatory
requirement and with no single banks
falling below the minimum regulatory
limit, the banking system accumulates
gross total losses of 8 percent of the total
capital.
Agriculture/Animal Husbandry 3,384.46 0% -
Trade/Commerce 8,526.56 10% 853
Manu/Industry 7,986.85 0% -
Service/Tourism 9,034.98 0% -
Housing 14,609.36 20% 2,922
Transport 2,049.90 0% -
Loan Against Share 523.82 0% -
Personal Loan 9,418.09 20% 1,884
Government (short term) - 0% -
Credit Card 6.95 0% -
Others 1,285.58 0% -
Performing loans (in Nu.
million) Only PrincipalAll banks
Assumed shocks (% of
performing loans in the
sector becoming NPLs)
Total increase in
NPLs
15.2
23.9
17.6 15.5
18.0 18.8
13.8
22.7
16.1 14.4
17.0 17.5
-
5.0
10.0
15.0
20.0
25.0
30.0
BOBL BNBL Tbank DPNBL BDBL All banks
Percen
t
CAR Post shock 3
Pre shock CAR Post shock CAR
Table 4: Loans and NPL
Figure 16: CAR Post-Shock 3
25
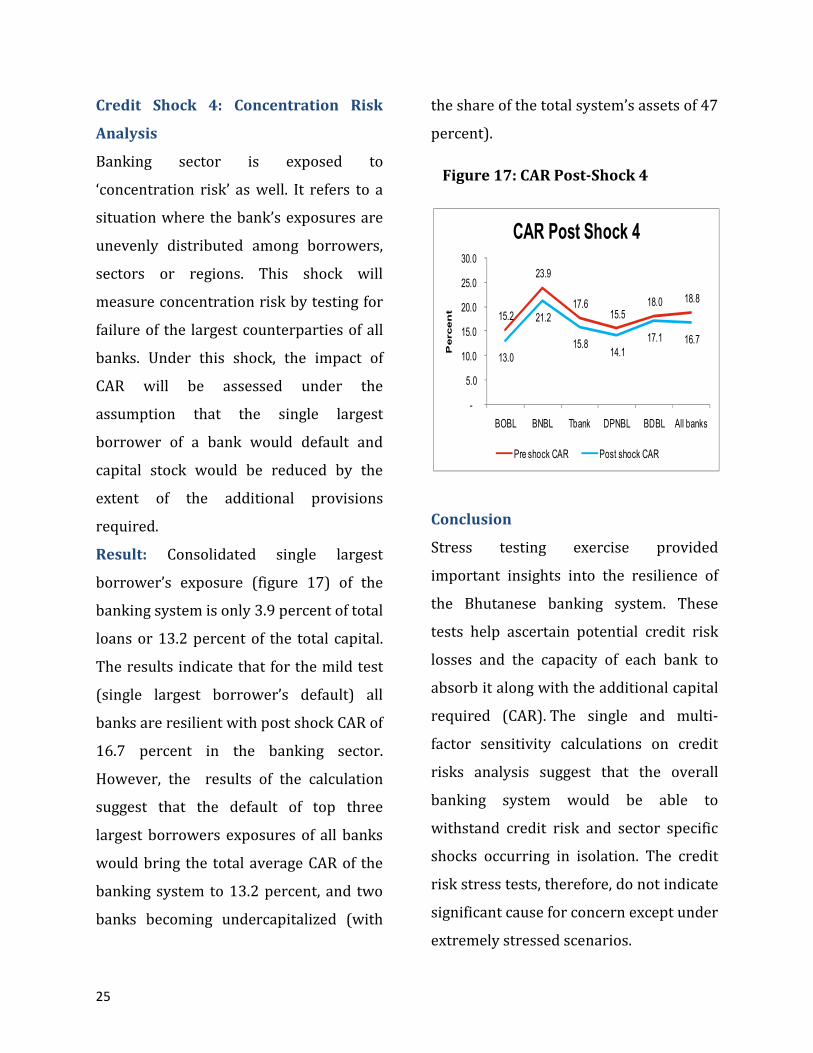
Credit Shock 4: Concentration Risk
Analysis
Banking sector is exposed to
‘concentration risk’ as well. It refers to a
situation where the bank’s exposures are
unevenly distributed among borrowers,
sectors or regions. This shock will
measure concentration risk by testing for
failure of the largest counterparties of all
banks. Under this shock, the impact of
CAR will be assessed under the
assumption that the single largest
borrower of a bank would default and
capital stock would be reduced by the
extent of the additional provisions
required.
Result: Consolidated single largest
borrower’s exposure (figure 17) of the
banking system is only 3.9 percent of total
loans or 13.2 percent of the total capital.
The results indicate that for the mild test
(single largest borrower’s default) all
banks are resilient with post shock CAR of
16.7 percent in the banking sector.
However, the results of the calculation
suggest that the default of top three
largest borrowers exposures of all banks
would bring the total average CAR of the
banking system to 13.2 percent, and two
banks becoming undercapitalized (with
the share of the total system’s assets of 47
percent).
Conclusion
Stress testing exercise provided
important insights into the resilience of
the Bhutanese banking system. These
tests help ascertain potential credit risk
losses and the capacity of each bank to
absorb it along with the additional capital
required (CAR). The single and multi-
factor sensitivity calculations on credit
risks analysis suggest that the overall
banking system would be able to
withstand credit risk and sector specific
shocks occurring in isolation. The credit
risk stress tests, therefore, do not indicate
significant cause for concern except under
extremely stressed scenarios.
15.2
23.9
17.6 15.5
18.0 18.8
13.0
21.2
15.8 14.1
17.1 16.7
-
5.0
10.0
15.0
20.0
25.0
30.0
BOBL BNBL Tbank DPNBL BDBL All banks
Percen
t
CAR Post Shock 4
Pre shock CAR Post shock CAR
Figure 17: CAR Post-Shock 4
26
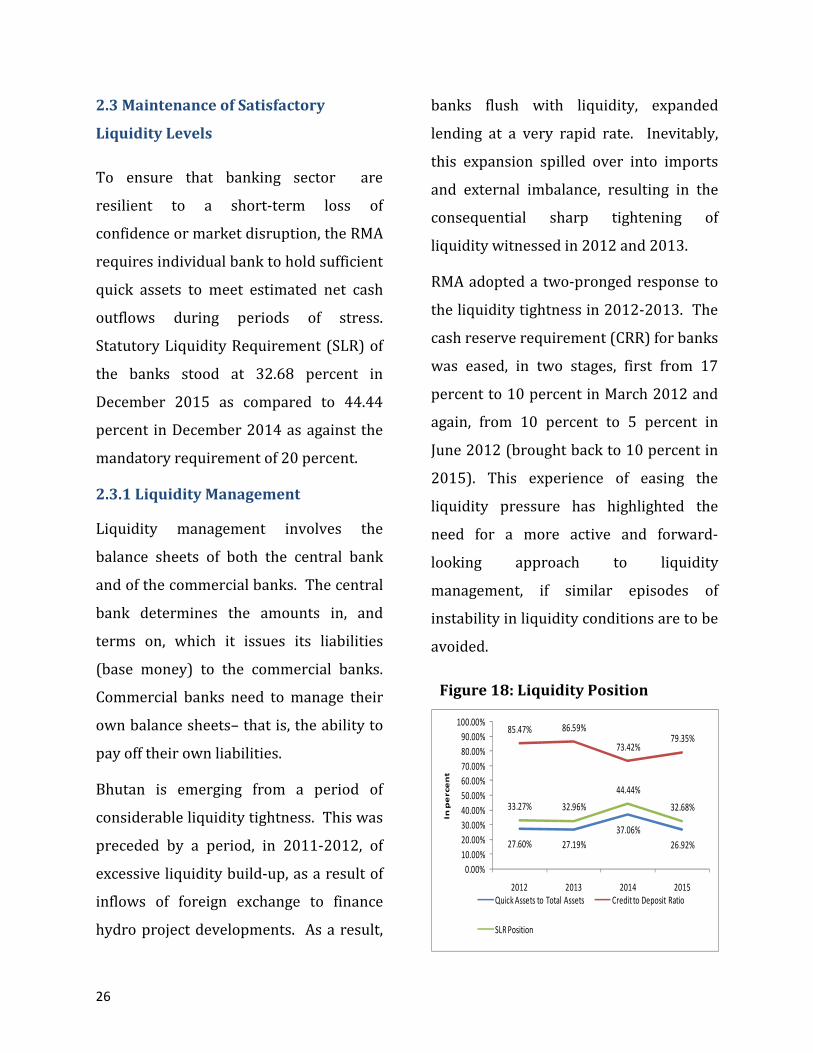
2.3 Maintenance of Satisfactory
Liquidity Levels
To ensure that banking sector are
resilient to a short-term loss of
confidence or market disruption, the RMA
requires individual bank to hold sufficient
quick assets to meet estimated net cash
outflows during periods of stress.
Statutory Liquidity Requirement (SLR) of
the banks stood at 32.68 percent in
December 2015 as compared to 44.44
percent in December 2014 as against the
mandatory requirement of 20 percent.
2.3.1 Liquidity Management
Liquidity management involves the
balance sheets of both the central bank
and of the commercial banks. The central
bank determines the amounts in, and
terms on, which it issues its liabilities
(base money) to the commercial banks.
Commercial banks need to manage their
own balance sheets– that is, the ability to
pay off their own liabilities.
Bhutan is emerging from a period of
considerable liquidity tightness. This was
preceded by a period, in 2011-2012, of
excessive liquidity build-up, as a result of
inflows of foreign exchange to finance
hydro project developments. As a result,
banks flush with liquidity, expanded
lending at a very rapid rate. Inevitably,
this expansion spilled over into imports
and external imbalance, resulting in the
consequential sharp tightening of
liquidity witnessed in 2012 and 2013.
RMA adopted a two-pronged response to
the liquidity tightness in 2012-2013. The
cash reserve requirement (CRR) for banks
was eased, in two stages, first from 17
percent to 10 percent in March 2012 and
again, from 10 percent to 5 percent in
June 2012 (brought back to 10 percent in
2015). This experience of easing the
liquidity pressure has highlighted the
need for a more active and forward-
looking approach to liquidity
management, if similar episodes of
instability in liquidity conditions are to be
avoided.
27.60% 27.19%
37.06%
26.92%
85.47% 86.59%
73.42%79.35%
33.27% 32.96%
44.44%
32.68%
0.00%
10.00%
20.00%
30.00%
40.00%
50.00%
60.00%
70.00%
80.00%
90.00%
100.00%
2012 2013 2014 2015
In p
erce
nt
Quick Assets to Total Assets Credit to Deposit Ratio
SLR Position
Figure 18: Liquidity Position
27
2.3.2 Liquidity Policy Instruments
Primary instruments currently available
to RMA to manage the level of liquidity in
the financial system are the CRR and SLR
ratios. These ratios can be raised to make
liquidity unavailable to support lending
expansion, and vice versa. They operate
on the quantity of liquidity available to
fund lending and thus the quantity of
lending that it is possible for banks to
undertake.
RMA’s capacity to manage domestic
liquidity conditions can be further
strengthened by measures that help to
achieve a level of interest rates consistent
with equilibrating the supply of, and
demand for loanable funds; that is, that
help to develop an interest rate
transmission mechanism in Bhutan. In
2012 an important step was taken in this
direction with the establishment, in
collaboration with the commercial banks,
of a 'base rate' system for bank lending.
This provides a base from which banks
price loans to individual borrowers,
according to the risk and tenor of the
loan.
A next step for RMA would be to
undertake more active and market-based
operations to manage the amount of
liquidity in Bhutan's financial system.
Those operations can either be by way of
sale/purchase of Government of Bhutan
Treasury bills or by way of sale/purchase
of bills issued by the RMA itself. These
operations are needed to anchor the
riskless short-term end of the Nu. yield
curve at a level consistent with
maintenance of liquidity conditions in line
with RMA's policy objectives.7
2.3.3 Management of Commercial Bank
Liquidity
Whilst a central bank provides base
money to banking system, the commercial
banks need to manage their liquidity so as
to be able to pay their obligations on time.
The core underpinning for that is that
banks manage their balance sheets so as
to maintain demonstrable solvency, i.e., a
margin of assets over their liabilities.
That requires, mostly, that lending is on
terms that provide high levels of
assurance that loans will be repaid. In
addition, however, it is important that
banks underpin confidence in their
solvency with demonstrable ability to pay
their obligations on time. Banks need to
7Longer term rates are determined as the average of expected short rates over the investment or borrowing horizon.
28
Liquidity coverage ratio (LCR) – which is a
measure of a bank's stock of high quality liquid
assets relative to the cash outflow, it could face
under a short-term (30-day) 'stress scenario'.
30-day cash outflow is estimated by applying
percentages to the bank's liabilities payable
within 30 days (the percentages varying
according to how 'sticky' or 'flighty' different
categories of liability could be in a period of
financial stress); net of contractual cash
inflows during that period. The international
standard is that, commencing 2015, banks
should hold sufficient high quality liquid assets
(balances with RMA or assets that can reliably
and quickly be converted into such balances) to
cover 60% of 30-day cash outflow, increasing
to 100% by 2019.
Net stable funding ratio (NSFR) – a measure
of the underlying resilience of a bank's funding
sources. This ratio is calculated as the ratio of
stable funding (comprising, in broad terms,
funding with a term to maturity of at least one
year, or from retail sources) to the banks long-
term illiquid assets (comprising essentially all
assets except for its 'liquid assets').
Internationally this ratio takes formal effect in
2018, at a level of 100%.
manage their own liquidity – the maturity
structure of their liabilities and assets and
the availability of cash and assets that can
be converted into 'cash' at short notice
and little or no risk of loss (quick assets)
to achieve that.
Banks in Bhutan hold quite substantial
amounts of quick assets. However, as
discussed above, the more comfortable
position currently follows a period in
2012-2013 during which Bhutan's banks
came under liquidity pressures.
In the light of this experience, RMA, in
addition to strengthening its monitoring
and forecasting of banking system-wide
liquidity influences, is planning to extend
its monitoring of individual banks'
liquidity positions. It plans to do this
using a framework based on liquidity
standards developed by the Basel
Committee on Banking Supervision, for
international adoption. The framework
comprises two parts-Liquidity Coverage
Ratio (LCR) and Net Stable Funding Ratio
(NSFR). These measures provide a
framework better designed for prudential
monitoring of, and for banks managing
liquidity risk. However, RMA does not
propose to apply the LCR and NSFR as
regulatory standards at this stage. Rather
the existing Cash Reserve Ratio (CRR) and
Statutory Liquidity Ratio (SLR)
requirements will remain in place for the
foreseeable future. These, particularly
the CRR, currently also play an important
role in terms of RMA's management of
monetary policy and any change to banks'
liquidity requirements would therefore
need to take account of that aspect as
well.
Table 5: LCR and NSFR
29
2.3.4 Liquidity Stress Test
Liquidity stress tests allow banks to
assess the possible impact of exceptional
but plausible stress scenarios on their
liquidity position. The test will assess the
ability of a bank to withstand unexpected
deposit withdrawal without recourse to
any outside liquidity support. The
scenarios have been developed based on
unexpected deposit withdrawals in
different proportions (depending on the
type of deposits). The test assesses the
adequacy of liquid assets available to fund
these withdrawals. The deposit run is
assumed to continue for five days. At the
end of each day, we calculate the net cash
inflow as the difference between the cash
available on account of asset liquidation
(since the beginning of the withdrawal
pressures) and the cash outflow on
account of the deposit withdrawal. If at
the end of the day, this net cash inflow is
positive, the bank is deemed to be liquid.
If not, the bank is illiquid. The following
assumptions are made under this
liquidity stress test:
(i) The total unexpected
withdrawal of deposits is
assumed to take place in the
following proportions;
a. Daily 20 percent of
demand deposits in
domestic currency will
be withdrawn
b. Since foreign currency
deposits are relatively
stable and subject to
lesser volatility, daily
withdrawal for each
bank is assumed at 10
percent.
c. Daily withdrawal rate
for time deposits in
domestic currency and
foreign currency are 3
percent and 1 percent
respectively since there
are restrictions on
number of transactions.
(ii) The bank is assumed to meet
stressed withdrawal of
deposits through sale of liquid
assets based on the following
proportions;
a. 95 percent of the quick
assets can be
immediately used to
meet obligations
b. 70 percent of non-quick
but liquid assets can be
30
immediately used to
meet obligations
c. In case of non-liquid
assets, it is assumed
that only 1 percent can
be liquidated to meet
obligations.
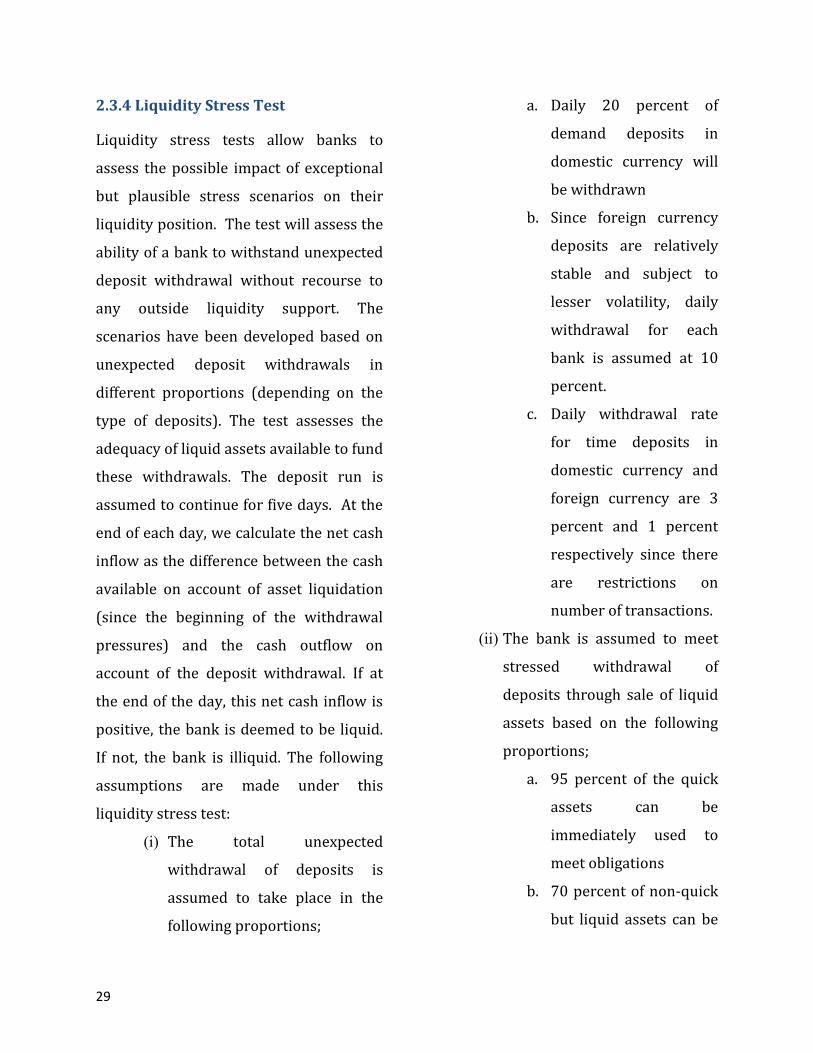
Result: Stress test results showed that
based on the above assumptions, banking
system can withstand a quite severe
deposit run, although a number of banks
becoming illiquid. One bank will not have
adequate liquid assets to meet its
withdrawal from the 4thday of liquidity
stress, with another two banks becoming
illiquid on the 5th day. In the worst case
scenario, which may force banks to
liquidate all their liquid/quick assets,
collectively they can manage a run of up
to 70 percent of the total demand
deposits.
2.4 Non-Banks
Total assets of non-banks recorded a year-
on-year growth of 22.81 percent between
December 2014 (Nu.12.59 billion) and
December 2015 (Nu.15.47 billion). Similar
to banking sector, the share of loans and
advances is the largest share of the asset
item with 80.06 percent. The non-banks’
overall credit portfolio increased from Nu.
8.67 billion as of December 2014 to Nu.
12.72 billion as of December 2015
indicating a growth of 46.67 percent. The
sector wise distribution of credit shows the
largest share of the credit portfolio under
the trade/commerce sector with 38.45
percent, followed by housing sector (21.08
percent), personal loan (12.60 percent) and
manufacturing/industry sector (11.61
percent).
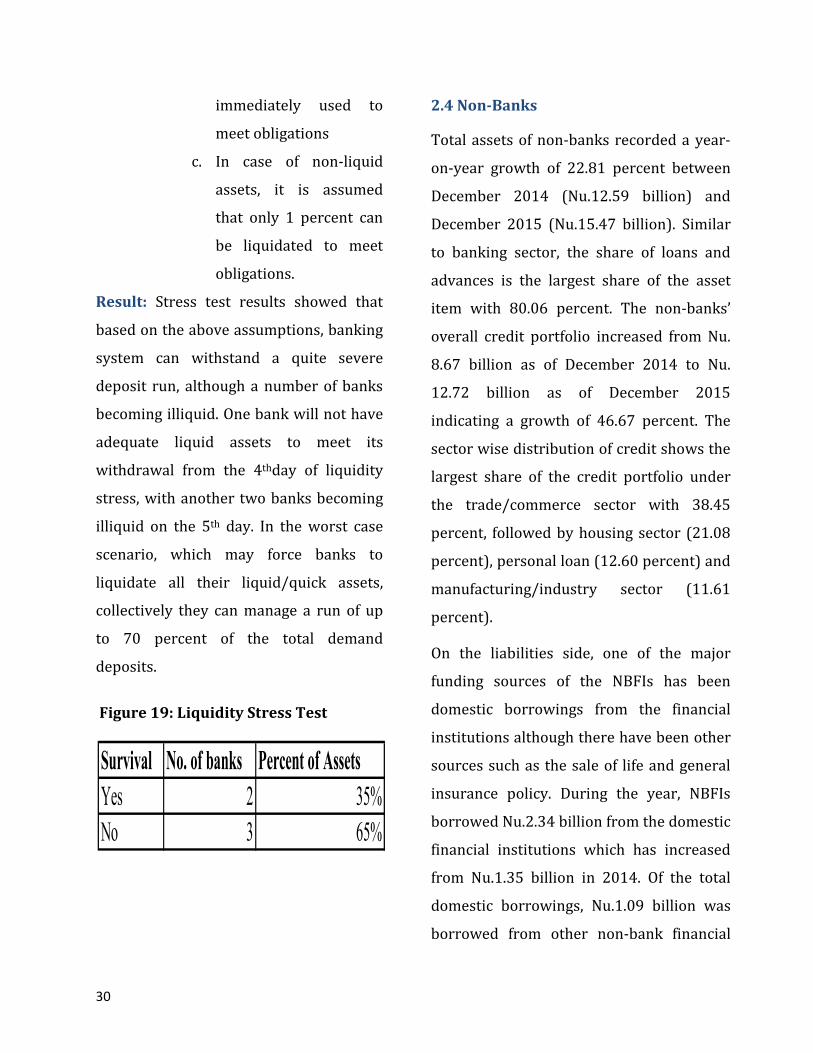
On the liabilities side, one of the major
funding sources of the NBFIs has been
domestic borrowings from the financial
institutions although there have been other
sources such as the sale of life and general
insurance policy. During the year, NBFIs
borrowed Nu.2.34 billion from the domestic
financial institutions which has increased
from Nu.1.35 billion in 2014. Of the total
domestic borrowings, Nu.1.09 billion was
borrowed from other non-bank financial
Survival No. of banks Percent of Assets
Yes 2 35%
No 3 65%
Figure 19: Liquidity Stress Test
31
institutions while Nu.1.24 billion was
borrowed from commercial banks. NBFIs
also issued a corporate bond worth Nu. 2.5
billion.
2.4.1 Capital Adequacy
The RWCAR of non-banks stood at 13.70
percent in December 2015 as compared
to RWCAR of 14.29 percent in December
2014. The risk-weighted assets of the
non-banks have increased by 22 percent
during the period under review. Non-
banks also recorded a leverage ratio of
14.64 percent.
2.4.2 Asset Quality
NPL for non-banks has also increased by
33 percent (from Nu.0.32 billion to
Nu.0.42 billion) as against the increase in
the total loans by 47 percent (from
Nu.8.67 billion to Nu. 12.72 billion). The
NPL ratio of non-banks stood at 3.30
percent in December 2015 as compared
to 3.64 percent in December 2014.
Sectoral data as of December 2015
indicates that among the broad sectors,
trade/commerce sector continued to
record the highest NPL of about 50
percent of total NPL, followed by personal
and transport sectors at 24 percent and
14 percent respectively.
14.94
13.70
12.35
11.39
10.00
10.50
11.00
11.50
12.00
12.50
13.00
13.50
14.00
14.50
15.00
Dec-14 Dec-15 Dec-14 Dec-15
RWCAR(10%) Core CAR(5%)
In p
erc
en
tag
e
CAR (%)
Figure 20: Loans for Non-Banks
Figure 21: CAR Position
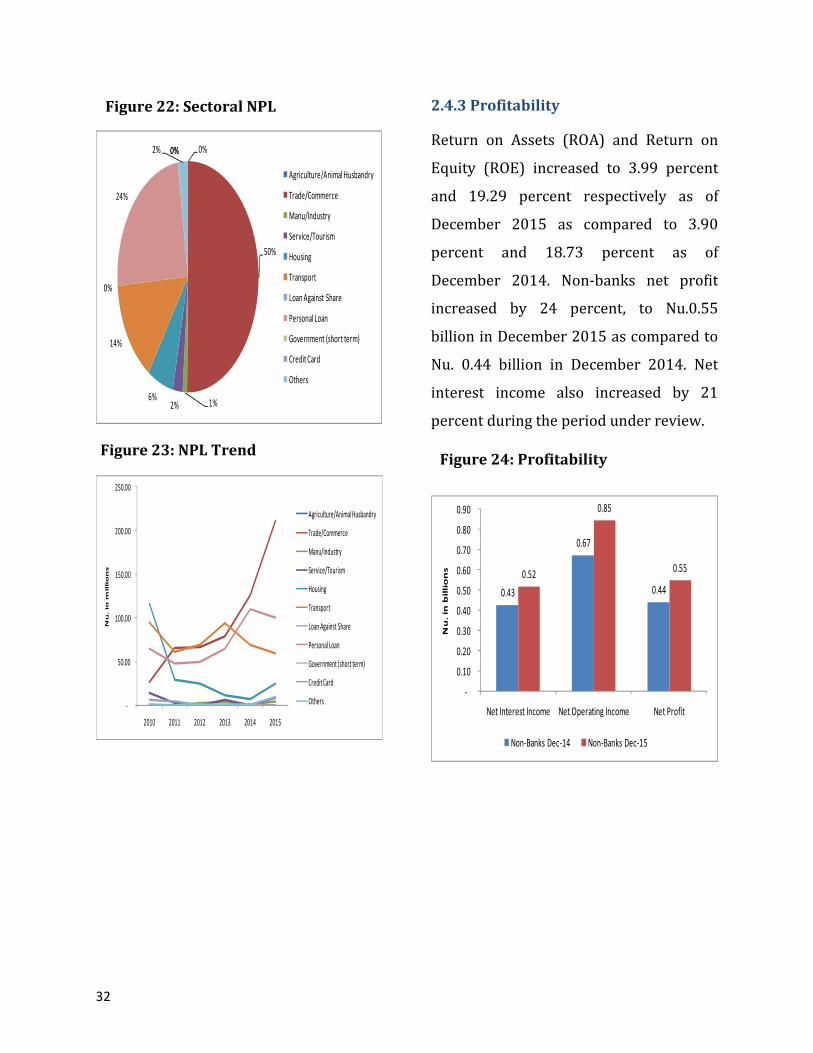
32
2.4.3 Profitability
Return on Assets (ROA) and Return on
Equity (ROE) increased to 3.99 percent
and 19.29 percent respectively as of
December 2015 as compared to 3.90
percent and 18.73 percent as of
December 2014. Non-banks net profit
increased by 24 percent, to Nu.0.55
billion in December 2015 as compared to
Nu. 0.44 billion in December 2014. Net
interest income also increased by 21
percent during the period under review.
0%
50%
1%2%6%
14%
0%
24%
0%0%2%
Agriculture/Animal Husbandry
Trade/Commerce
Manu/Industry
Service/Tourism
Housing
Transport
Loan Against Share
Personal Loan
Government (short term)
Credit Card
Others
-
50.00
100.00
150.00
200.00
250.00
2010 2011 2012 2013 2014 2015
Nu
. in
mil
lio
ns
Agriculture/Animal Husbandry
Trade/Commerce
Manu/Industry
Service/Tourism
Housing
Transport
Loan Against Share
Personal Loan
Government (short term)
Credit Card
Others
0.43
0.67
0.44
0.52
0.85
0.55
-
0.10
0.20
0.30
0.40
0.50
0.60
0.70
0.80
0.90
Net Interest Income Net Operating Income Net Profit
Nu
. in
bil
lio
ns
Non-Banks Dec-14 Non-Banks Dec-15
Figure 23: NPL Trend
Figure 22: Sectoral NPL
Figure 24: Profitability
33
Chapter III
Macro-Prudential Regulations
After the global financial crisis, there have
been efforts across the world to develop
macro-prudential instruments that can be
operationalised at desired times. Macro-
prudential regulation aims to contain
systemic risk. The IMF describes systemic
risk as the “risk of disruption to financial
services that is caused by an impairment
of all or parts of the financial system and
has the potential to have serious negative
consequences on the real economy”8.
Macro-prudential policy instruments
broadly have two aims. The first is to
strengthen the financial system’s
resilience to economic downturns and
other adverse aggregate shocks. Second,
macro-prudential policy instruments can
help “lean against the wind” by pro-
actively limiting the build-up of financial
risks. The same instrument may be
capable of serving both functions. For
example, the counter-cyclical capital
8Monetary and Capital Markets Department, I. M. F., Monetary and Economics Department, Bank for International Settlements, the Secretariat of the Financial Stability Board (2009). Guidance to Assess the Systemic Importance of Financial Institutions, Markets, and Instruments: Initial Considerations—Background Paper. Report to G20 Finance Ministers and Governors, International Monetary Fund, Bank for International Settlements, Financial Stability Board: 27.
buffer can mandate banks to increase
capital in good times which can be drawn
down during bad times. Availability of the
buffer could provide a financial
institution with the requisite space to
maintain the flow of credit even during
downturns of the economic cycle-the first
function. Moreover, the act of building up
additional capital during good times can
itself modulate the hitherto excessive
flow of credit-the second function.
Currently eight macro-prudential
regulations have been notified in Bhutan.
Macro-prudential Regulations in Bhutan
and implementation dates are mentioned
in the table below:
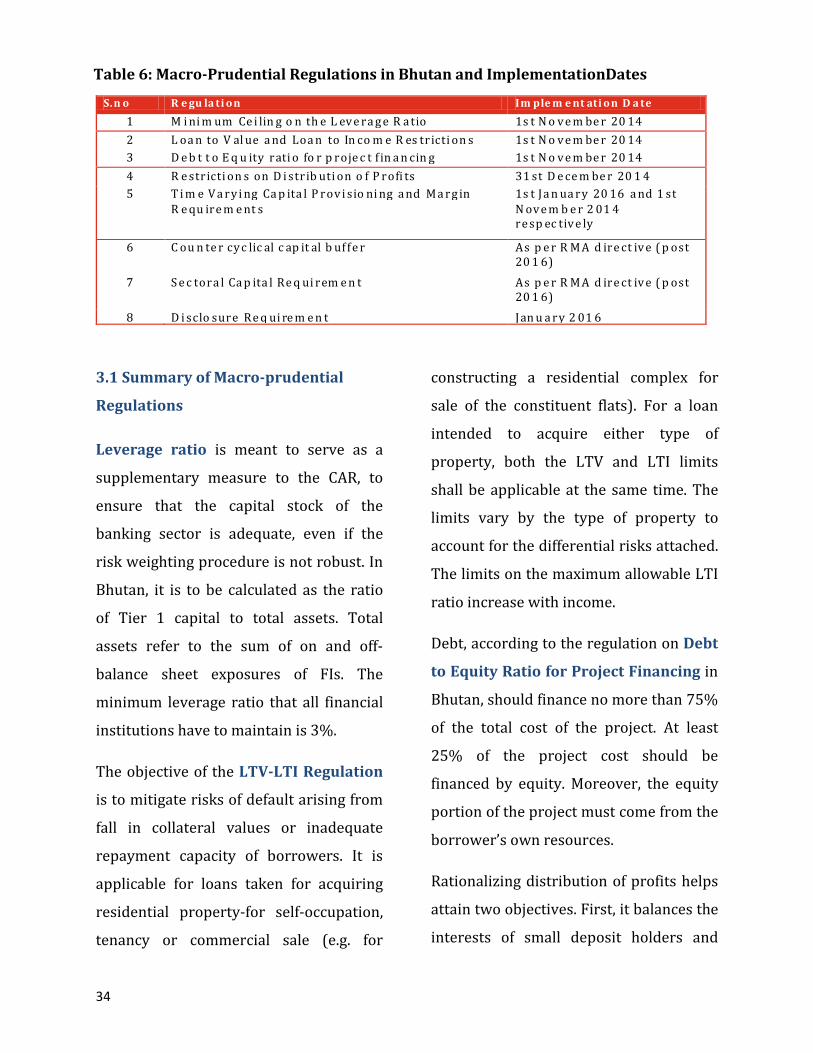
34
3.1 Summary of Macro-prudential
Regulations
Leverage ratio is meant to serve as a
supplementary measure to the CAR, to
ensure that the capital stock of the
banking sector is adequate, even if the
risk weighting procedure is not robust. In
Bhutan, it is to be calculated as the ratio
of Tier 1 capital to total assets. Total
assets refer to the sum of on and off-
balance sheet exposures of FIs. The
minimum leverage ratio that all financial
institutions have to maintain is 3%.
The objective of the LTV-LTI Regulation
is to mitigate risks of default arising from
fall in collateral values or inadequate
repayment capacity of borrowers. It is
applicable for loans taken for acquiring
residential property-for self-occupation,
tenancy or commercial sale (e.g. for
constructing a residential complex for
sale of the constituent flats). For a loan
intended to acquire either type of
property, both the LTV and LTI limits
shall be applicable at the same time. The
limits vary by the type of property to
account for the differential risks attached.
The limits on the maximum allowable LTI
ratio increase with income.
Debt, according to the regulation on Debt
to Equity Ratio for Project Financing in
Bhutan, should finance no more than 75%
of the total cost of the project. At least
25% of the project cost should be
financed by equity. Moreover, the equity
portion of the project must come from the
borrower’s own resources.
Rationalizing distribution of profits helps
attain two objectives. First, it balances the
interests of small deposit holders and
S.n o R e gu la ti on Im ple m e nt ati on D a te
1 M i ni m um Ce i lin g o n th e L ev e ra g e R a tio 1s t N o v e m be r 20 14
2 L oa n to V al ue a nd Loa n to In co m e R es tricti on s 1s t N o v e m be r 20 14
3 D e b t t o E q u ity rati o fo r p roje c t f in a n cin g 1s t N o v e m be r 20 14
4 R e stricti on s on D i str ib uti on o f P rofi ts 31 st D e ce m be r 20 1 4
5 T i m e V a ry i ng Ca p ita l P rov i sio ni ng a nd M a rg in
R e qu ire m e nt s
1s t Ja n ua ry 20 16 a nd 1 st
N ov e m b e r 2 01 4 re sp ec tiv e ly
6 C ou n te r cy c lic al c ap it al b uf fe r As p e r R M A d ire ct iv e ( p ost 20 1 6)
7 S e c tora l Ca p ita l Re q ui rem e n t As p e r R M A d ire ct iv e ( p ost 20 1 6)
8 D i sclo sure Re q ui re m e n t Jan u a ry 2 01 6
Table 6: Macro-Prudential Regulations in Bhutan and ImplementationDates
35
shareholders. Second, introducing a
standard regulation determining the
quantum of dividend payable introduces
discipline and uniformity to the practice
of dividend distribution across the
financial sector. Bhutan’s regulation on
Restrictions on Distribution of Profit
requires financial institutions to fulfill
two conditions for being able to distribute
any profit. These centre on capital
adequacy (as measured by CAR) and asset
quality (as measured by the net NPL
ratio).
Provisioning is generally pro-cyclical
implying that during good times, non-
performing loans are low and thus the
required provisioning is low as well. The
reverse is true during bad times when
high non-performing loans translate into
higher provisioning requirements. This
adversely affects already dwindling
profits. Dynamic loss provisioning can
help alleviate this situation. Bhutan’s
regulation on Time Varying Capital
Provisioning helps address this.
The Counter Cyclical Capital Buffer
(CCyB) aims to safeguard the
intermediation activities of financial
institutions by ensuring they have
adequate capital in hand during the
downward phase of the economic cycle.
This is done by building buffers when the
economy is in good shape and
experiencing a credit boom. ‘Good times’
are assumed to be signaled when there is
excessive credit outstanding in the
economy-i.e., the gap of the credit-GDP
ratio from its trend value is at least 500
basis points.
Alternatively, the Sectoral Capital
Requirement can be used when
excessive credit is being disbursed in a
specific sector. In that case, capital buffers
are built against the risk weighted assets
of a particular sector. For a sector to
qualify for the imposition of the SCR, it
must account for 15% or more of the
economy’s total outstanding credit, and
the growth of credit to the sector must
exceed the overall growth of credit in the
economy by 500 basis points or more.
Regulation on Disclosure Requirement
specifies the forms and content of the
information that financial institutions will
disclose at regular intervals to ensure a
higher degree of transparency. It will
enable stakeholders to take informed
decisions with regard to their financial
activities.
36
3.2 Conclusion
The ultimate objective of macro-
prudential regulation is to preserve
financial stability. This includes making
the financial system more resilient and
limiting the build-up of vulnerabilities, in
order to mitigate systemic risk and
ensure that financial services continue to
be provided effectively to the real
economy. RMA now has many
classifications of macro-prudential
instruments to be implemented according
to the source of systemic risk. For
example, credit booms can be addressed
by measures that influenced all credit
exposures of the banking system. These
measures include countercyclical capital
buffers, loan loss provisioning
requirement and leverage ratio. On the
other hand, sectoral vulnerabilities can be
contained through a range of sectoral
tools that target specific credit categories
such as sectoral capital requirements,
loan-to-value and loan-income-ratio
limits. In line with the objective of macro-
prudential regulations, RMA has issued
the following guidelines to mitigate
exposure to housing sector, personal
loans and concentration risk:
(i) Guideline on the Housing
Regulations (LTV and LTI
Limits)
Such limits were in place in banking
system (debt-equity ratio) even before
the introduction of macro-prudential
regulations but did not adequately
cover the housing sector related
lending and financing activities. As a
result, banks’ actual exposure to the
housing sector turned out to be higher
than suggested by the regulatory caps
(debt-equity ratio). Regulations on
LTV and LTI for the housing
(Guidelines on Commercial Housing
Loan and Home Loan 2014) sector
help to stem the housing sector boom.
LTV and LTI limits are now serving as
potentially useful instruments for
containing banks’ exposure to the
housing sector (real estate sector).
(ii) Guideline on
Consumer/Personal Loans
Personal lending regulation assumes
macro-prudential significance because
of its high share in total lending. RMA
has capped the personal/consumer
loan ceiling to Nu. 500,000 in order
the curb the exposure for personal
sector and mitigate any potential risk
that could arise.
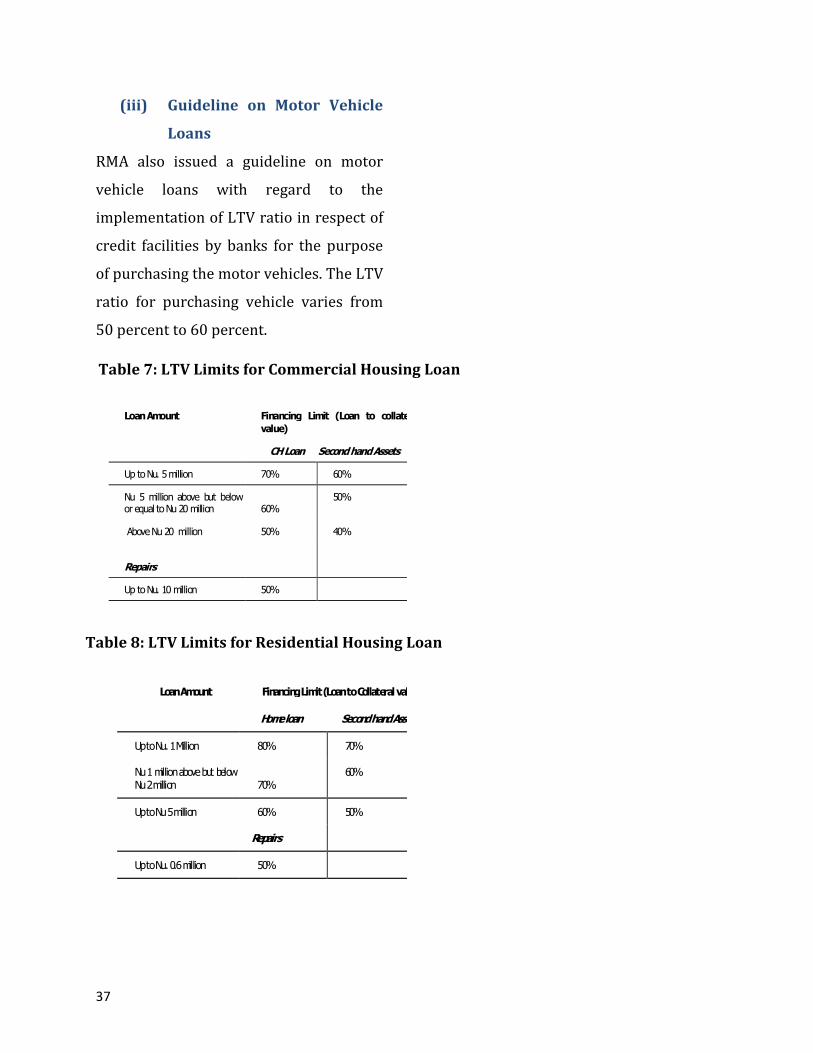
37
(iii) Guideline on Motor Vehicle
Loans
RMA also issued a guideline on motor
vehicle loans with regard to the
implementation of LTV ratio in respect of
credit facilities by banks for the purpose
of purchasing the motor vehicles. The LTV
ratio for purchasing vehicle varies from
50 percent to 60 percent.
Loan Amount Financing Limit (Loan to collateral
value)
CH Loan Second hand Assets
Up to Nu. 5 million 70% 60%
Nu 5 million above but below or equal to Nu 20 million 60%
50%
Above Nu 20 million 50% 40%
Repairs
Up to Nu. 10 million 50%
Loan Amount Financing Limit (Loan to Collateral value)
Home loan Second hand Assets
Up to Nu. 1 Million 80% 70%
Nu 1 million above but below Nu 2 million 70%
60%
Up to Nu 5 million 60% 50%
Repairs
Up to Nu. 0.6 million 50%
Table 7: LTV Limits for Commercial Housing Loan
Table 8: LTV Limits for Residential Housing Loan
38
Chapter IV
Recent Activities and Developments
in Financial Sector Regulation
In order to strengthen the RMA’s role as
Bhutan’s integrated financial regulator,
the following sets of regulations, aimed at
financial services providers has been
implemented:9
4.1 Investment Guidelines for
Insurance Business
In order to ensure that investments by
the insurance companies are carried out
in line with international best practices,
the RMA issued Investment Guidelines for
Insurance Business 2015 for
implementation from January 2016. The
main objectives of issuing the guidelines
are to ensure:
(i) Investments by the insurance
companies are carried out in
line with international best
practices
(ii) All insurance assets
(investments) are covered
by appropriate investments
with safety 9 Most provision in this section has been sourced from RMA Annual Report 2014/15
(iii) All investments have the
level of liquidity to meet
their predicted outward
cash flow
(iv) The return on assets is
commensurate with the
risk of the assets
The guideline will also address the
problem of asset liability mismatch of the
insurance companies. It details the list
and limit of investment in various
avenues.
4.2 Credit Information Bureau
Regulations
Since the Credit Information Bureau
collects a large amount of sensitive
personal information, it was necessary to
ensure that the Bureau is subject to
formal oversight by RMA in order to
safeguard the credit data and consumers’
interests. As a result, the RMA issued the
Credit Information Bureau Regulations
2015.
39
4.3 Base Rate System
The Base Rate Operational Guidelines,
effective since July 2013, set the standard
for calculating the minimum rate below
which lending institutions would not lend.
In fact, it is designed to be the rate below
which lenders would find it unviable to
lend. Actual lending rates would be
calculated as the sum of the base rate and
borrower specific charges-accounting for
credit risk premium, time premium and
so on.
The third Base Rate Review was
conducted with the representatives of the
commercial banks from May 4-6, 2015.
The base rate for 2015 was computed in
line with the audited annual accounts for
the year 2014 and the standing provisions
contained in the Revised Base Rate
Operational Guidelines. In order to
promote the flow of credit towards
priority sectors, the RMA continued to
provide the following exemptions on the
base rate framework to the financial
institutions:
- Loans for the agricultural sector;
- Loans for small businesses and
artisan schemes;
- Entrepreneurship Development
Program (EDP) loans;
- Staff incentive loans;
- Loans against fixed deposits;
- Pension membership loans of the
NPPF.
RMA also encourage the banks to work
towards initiating variable interest rate
system and semi-annual computation of
the base rate. Currently, the base rate is
being computed on an annual basis with a
one-year time lag.
4.4 Reserve Management Policy
Reserve Management Policy was also
implemented in 2015 empowering RMA
with the responsibility to manage,
monitor and invest the country’s foreign
exchange reserve in a more prudent and
efficient manner through upholding the
principal objective of safety, liquidity and
return. The RMA’s recent efforts have
focused on managing recurrent pressures
on Indian Rupee reserves. The
operational threshold for convertible
currency reserves established as part of
the RMA’s reserve management policy
has ensured adequate composition of
reserves between the Indian Rupee and
other convertible currency to position for
Indian Rupee needs. As such in 2015, the
RMA has not availed any short-term
40
overdraft since June 2013 and the Indian
Rupee Swap loan from the RBI was also
fully liquidated in September 2013 (RMA
Monetary Policy Statement, May 2015).
4.5 Payments and Settlement System
Moving forward with the payment
systems reform process, the RMA is
currently working on the following
projects, namely the:
- implementation of the bank-led
model Interbank Mobile Payment
System (IMPS) which offers round
the clock, interbank funds transfer
facility through mobile phones,
internet banking, etc on a real time
basis;
- integration of Bhutan Financial
Switch (BFS) with the National
Financial Switch (NFS) of National
Payments Corporation of India
which will facilitate the use of ATM
cards issued by Bhutanese banks
in India and vice versa;
- formation of a National Payments
Council which will provide overall
guidance for the development of
payment and settlement systems
of the country.
4.6 Central Registry
Central Registry for Secured Transaction
(CRST) is a division under the Credit
Information Bureau of Bhutan established
with the executive directive from the
Royal Government of Bhutan and acts as a
single and centralized repository for all
security interest in moveable property.
The Central Registry for Secured
Transaction is in operation since July 1st
2014.
The purpose of the Central Registry of
Secured Transaction (CRST) in moveable
property is a computer registry that
serves the entire Kingdom of Bhutan. The
CRST allows both individual and
institutions to record their financial
interest in moveable goods (vehicles,
stocks, shares, etc.). The benefit of the
registry is that it improves the access to
credit by allowing more types of
moveable collateral to be used in loan.
The registry allows more certainty for
secured parties on where they stand in
terms of priority in relation to other
secured parties having the same
moveable collateral pledged.
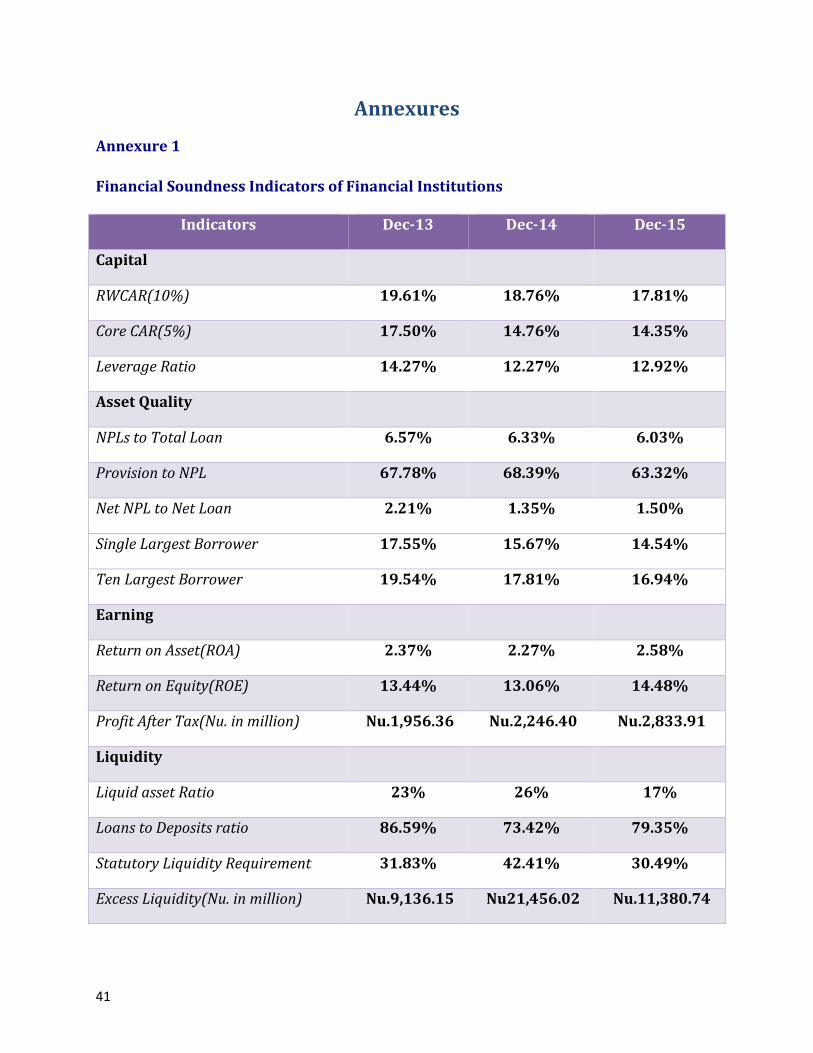
41
Annexures
Annexure 1
Financial Soundness Indicators of Financial Institutions
Indicators Dec-13 Dec-14 Dec-15
Capital
RWCAR(10%) 19.61% 18.76% 17.81%
Core CAR(5%) 17.50% 14.76% 14.35%
Leverage Ratio 14.27% 12.27% 12.92%
Asset Quality
NPLs to Total Loan 6.57% 6.33% 6.03%
Provision to NPL 67.78% 68.39% 63.32%
Net NPL to Net Loan 2.21% 1.35% 1.50%
Single Largest Borrower 17.55% 15.67% 14.54%
Ten Largest Borrower 19.54% 17.81% 16.94%
Earning
Return on Asset(ROA) 2.37% 2.27% 2.58%
Return on Equity(ROE) 13.44% 13.06% 14.48%
Profit After Tax(Nu. in million) Nu.1,956.36 Nu.2,246.40 Nu.2,833.91
Liquidity
Liquid asset Ratio 23% 26% 17%
Loans to Deposits ratio 86.59% 73.42% 79.35%
Statutory Liquidity Requirement 31.83% 42.41% 30.49%
Excess Liquidity(Nu. in million) Nu.9,136.15 Nu21,456.02 Nu.11,380.74
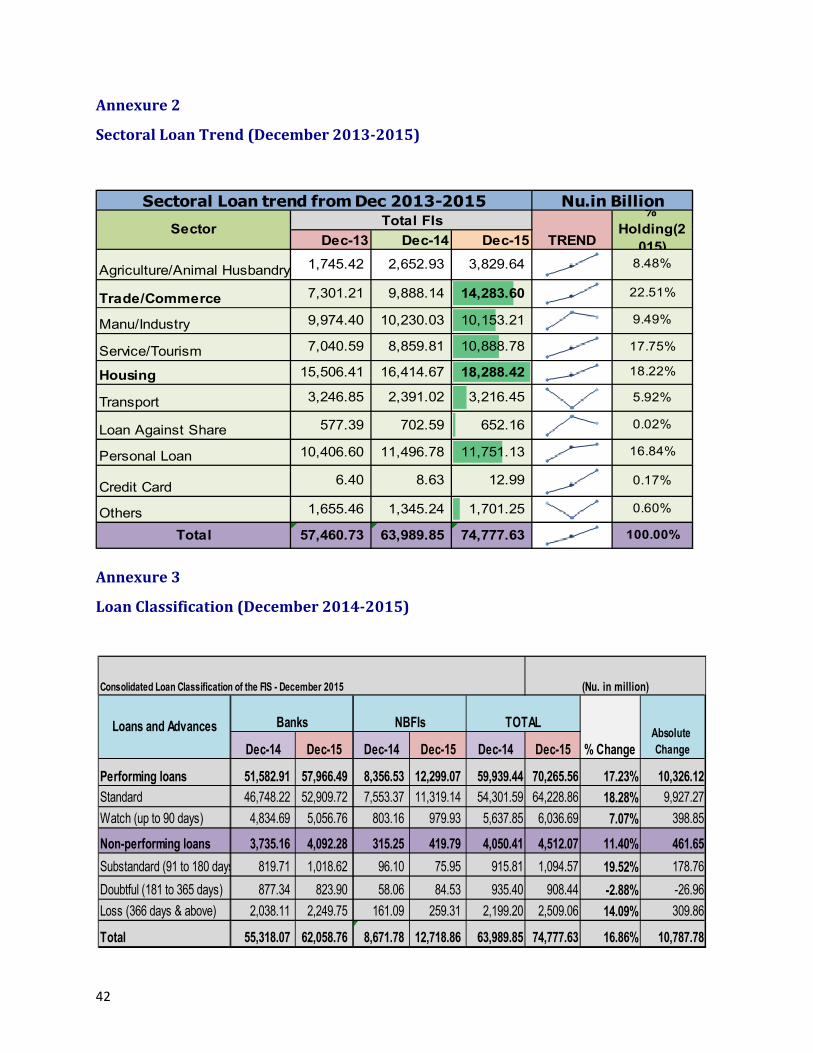
42
Dec-13 Dec-14 Dec-15
Agriculture/Animal Husbandry 1,745.42 2,652.93 3,829.64 8.48%
Trade/Commerce 7,301.21 9,888.14 14,283.60 22.51%
Manu/Industry 9,974.40 10,230.03 10,153.21 9.49%
Service/Tourism 7,040.59 8,859.81 10,888.78 17.75%
Housing 15,506.41 16,414.67 18,288.42 18.22%
Transport 3,246.85 2,391.02 3,216.45 5.92%
Loan Against Share 577.39 702.59 652.16 0.02%
Personal Loan 10,406.60 11,496.78 11,751.13 16.84%
Credit Card6.40 8.63 12.99 0.17%
Others 1,655.46 1,345.24 1,701.25 0.60%
Total 57,460.73 63,989.85 74,777.63 100.00%
Sectoral Loan trend from Dec 2013-2015 Nu.in Billion
SectorTotal FIs
TREND
%
Holding(2
015)
Annexure 2
Sectoral Loan Trend (December 2013-2015)
Annexure 3
Loan Classification (December 2014-2015)
Dec-14 Dec-15 Dec-14 Dec-15 Dec-14 Dec-15
Performing loans 51,582.91 57,966.49 8,356.53 12,299.07 59,939.44 70,265.56 17.23% 10,326.12
Standard 46,748.22 52,909.72 7,553.37 11,319.14 54,301.59 64,228.86 18.28% 9,927.27
Watch (up to 90 days) 4,834.69 5,056.76 803.16 979.93 5,637.85 6,036.69 7.07% 398.85
Non-performing loans 3,735.16 4,092.28 315.25 419.79 4,050.41 4,512.07 11.40% 461.65
Substandard (91 to 180 days) 819.71 1,018.62 96.10 75.95 915.81 1,094.57 19.52% 178.76
Doubtful (181 to 365 days) 877.34 823.90 58.06 84.53 935.40 908.44 -2.88% -26.96
Loss (366 days & above) 2,038.11 2,249.75 161.09 259.31 2,199.20 2,509.06 14.09% 309.86
Total 55,318.07 62,058.76 8,671.78 12,718.86 63,989.85 74,777.63 16.86% 10,787.78
Consolidated Loan Classification of the FIS - December 2015 (Nu. in million)
Banks NBFIs TOTAL
% Change
Absolute
Change
Loans and Advances
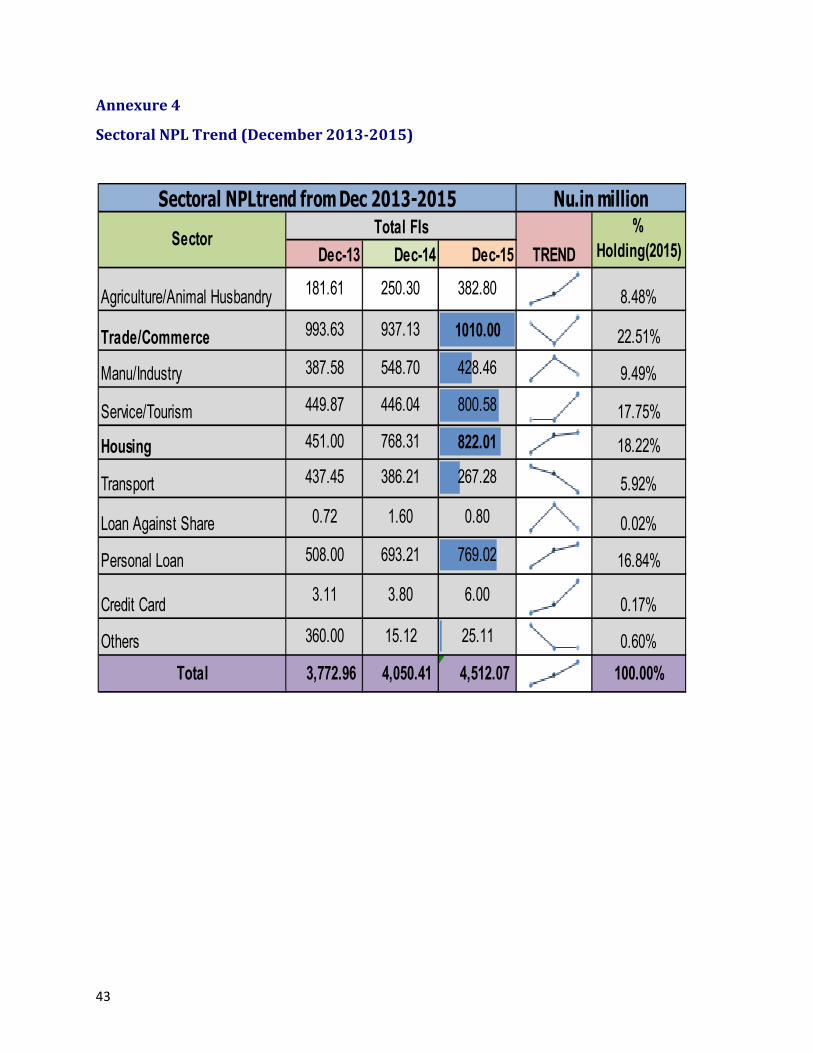
43
Annexure 4
Sectoral NPL Trend (December 2013-2015)
Dec-13 Dec-14 Dec-15
Agriculture/Animal Husbandry 181.61 250.30 382.80 8.48%
Trade/Commerce 993.63 937.13 1010.00 22.51%
Manu/Industry 387.58 548.70 428.46 9.49%
Service/Tourism 449.87 446.04 800.58 17.75%
Housing 451.00 768.31 822.01 18.22%
Transport 437.45 386.21 267.28 5.92%
Loan Against Share 0.72 1.60 0.80 0.02%
Personal Loan 508.00 693.21 769.02 16.84%
Credit Card3.11 3.80 6.00
0.17%
Others 360.00 15.12 25.11 0.60%
Total 3,772.96 4,050.41 4,512.07 100.00%
SectorTotal FIs %
Holding(2015)TREND
Sectoral NPLtrend from Dec 2013-2015 Nu.in million
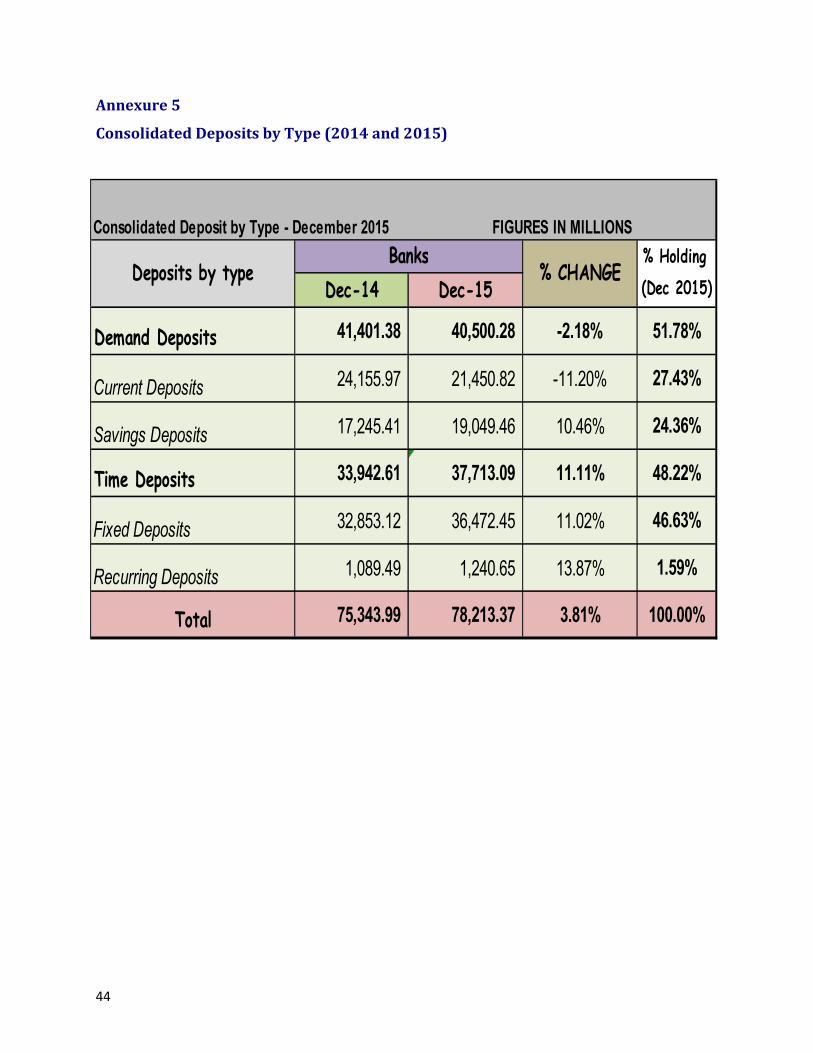
44
Annexure 5
Consolidated Deposits by Type (2014 and 2015)
Consolidated Deposit by Type - December 2015
Demand Deposits 41,401.38 40,500.28 -2.18% 51.78%
Current Deposits 24,155.97 21,450.82 -11.20% 27.43%
Savings Deposits 17,245.41 19,049.46 10.46% 24.36%
Time Deposits 33,942.61 37,713.09 11.11% 48.22%
Fixed Deposits 32,853.12 36,472.45 11.02% 46.63%
Recurring Deposits 1,089.49 1,240.65 13.87% 1.59%
Total 75,343.99 78,213.37 3.81% 100.00%
FIGURES IN MILLIONS
Dec-14 Dec-15
% Holding
(Dec 2015)
BanksDeposits by type % CHANGE
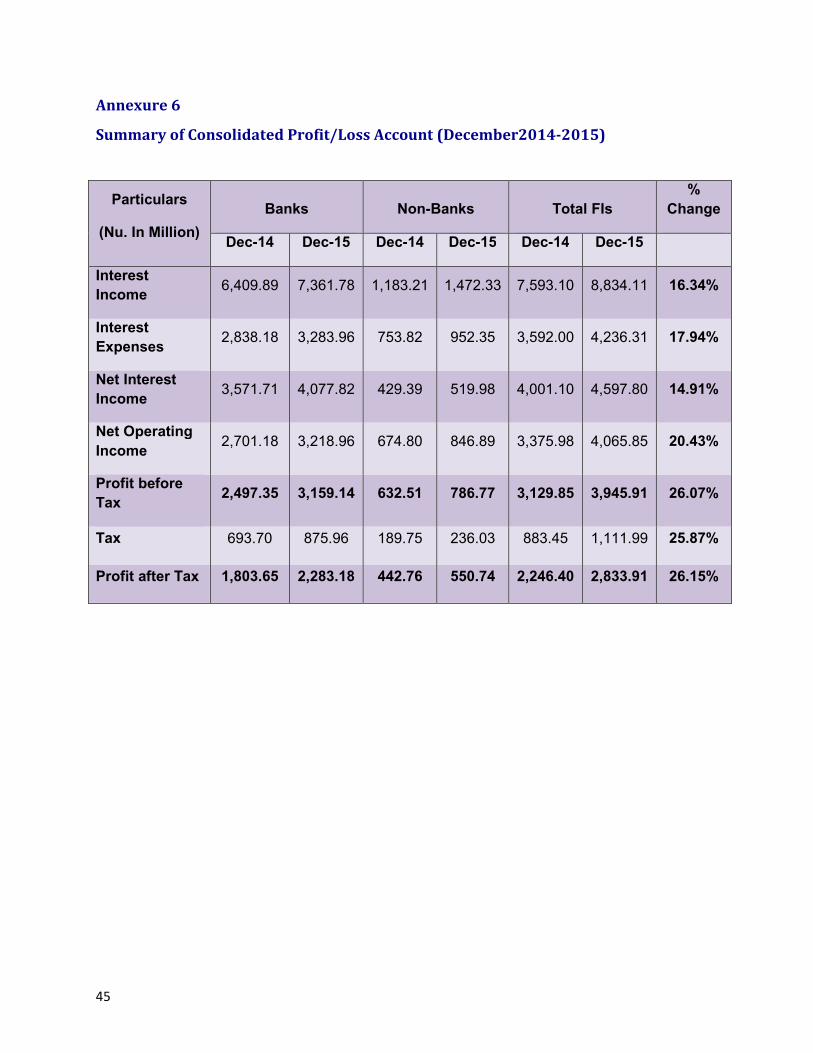
45
Annexure 6
Summary of Consolidated Profit/Loss Account (December2014-2015)
Particulars
(Nu. In Million)
Banks Non-Banks Total FIs
%
Change
Dec-14 Dec-15 Dec-14 Dec-15 Dec-14 Dec-15
Interest
Income 6,409.89 7,361.78 1,183.21 1,472.33 7,593.10 8,834.11 16.34%
Interest
Expenses 2,838.18 3,283.96 753.82 952.35 3,592.00 4,236.31 17.94%
Net Interest
Income 3,571.71 4,077.82 429.39 519.98 4,001.10 4,597.80 14.91%
Net Operating
Income 2,701.18 3,218.96 674.80 846.89 3,375.98 4,065.85 20.43%
Profit before
Tax 2,497.35 3,159.14 632.51 786.77 3,129.85 3,945.91 26.07%
Tax 693.70 875.96 189.75 236.03 883.45 1,111.99 25.87%
Profit after Tax 1,803.65 2,283.18 442.76 550.74 2,246.40 2,833.91 26.15%
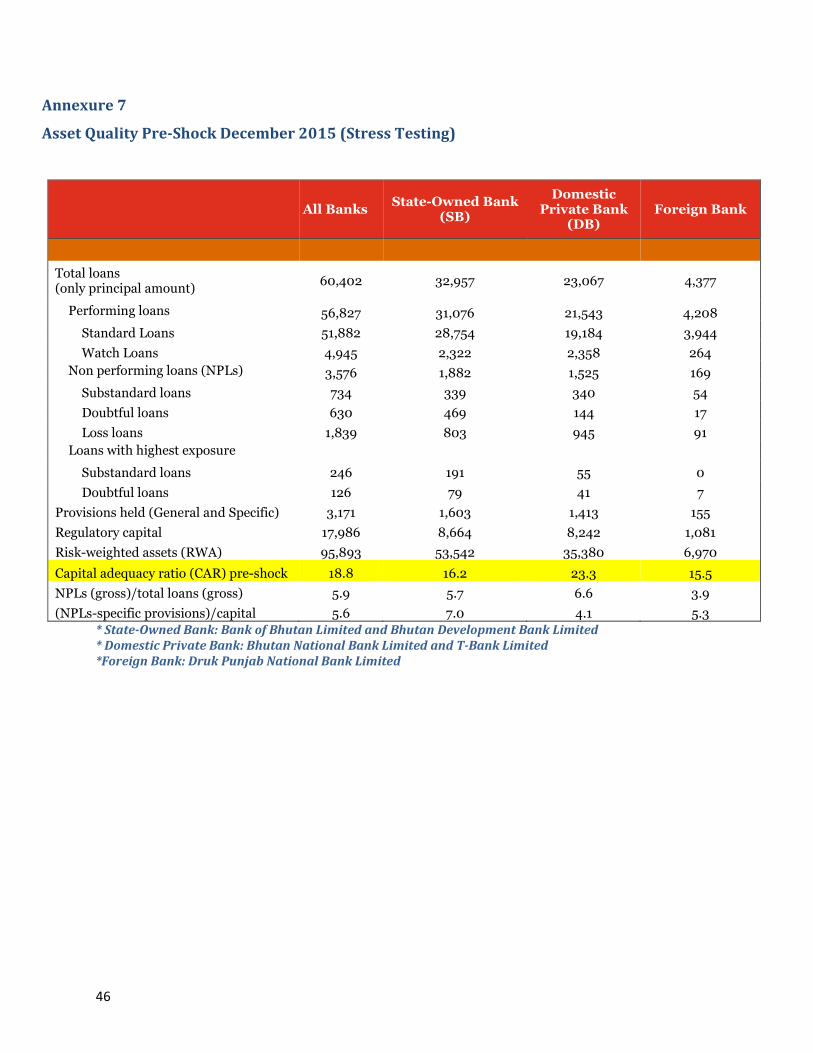
46
Annexure 7
Asset Quality Pre-Shock December 2015 (Stress Testing)
All Banks State-Owned Bank
(SB)
Domestic Private Bank
(DB) Foreign Bank
Total loans (only principal amount)
60,402 32,957 23,067 4,377
Performing loans 56,827 31,076 21,543 4,208
Standard Loans 51,882 28,754 19,184 3,944
Watch Loans 4,945 2,322 2,358 264
Non performing loans (NPLs) 3,576 1,882 1,525 169
Substandard loans 734 339 340 54
Doubtful loans 630 469 144 17
Loss loans 1,839 803 945 91
Loans with highest exposure
Substandard loans 246 191 55 0
Doubtful loans 126 79 41 7
Provisions held (General and Specific) 3,171 1,603 1,413 155
Regulatory capital 17,986 8,664 8,242 1,081
Risk-weighted assets (RWA) 95,893 53,542 35,380 6,970
Capital adequacy ratio (CAR) pre-shock 18.8 16.2 23.3 15.5
NPLs (gross)/total loans (gross) 5.9 5.7 6.6 3.9
(NPLs-specific provisions)/capital 5.6 7.0 4.1 5.3
* State-Owned Bank: Bank of Bhutan Limited and Bhutan Development Bank Limited
* Domestic Private Bank: Bhutan National Bank Limited and T-Bank Limited
*Foreign Bank: Druk Punjab National Bank Limited
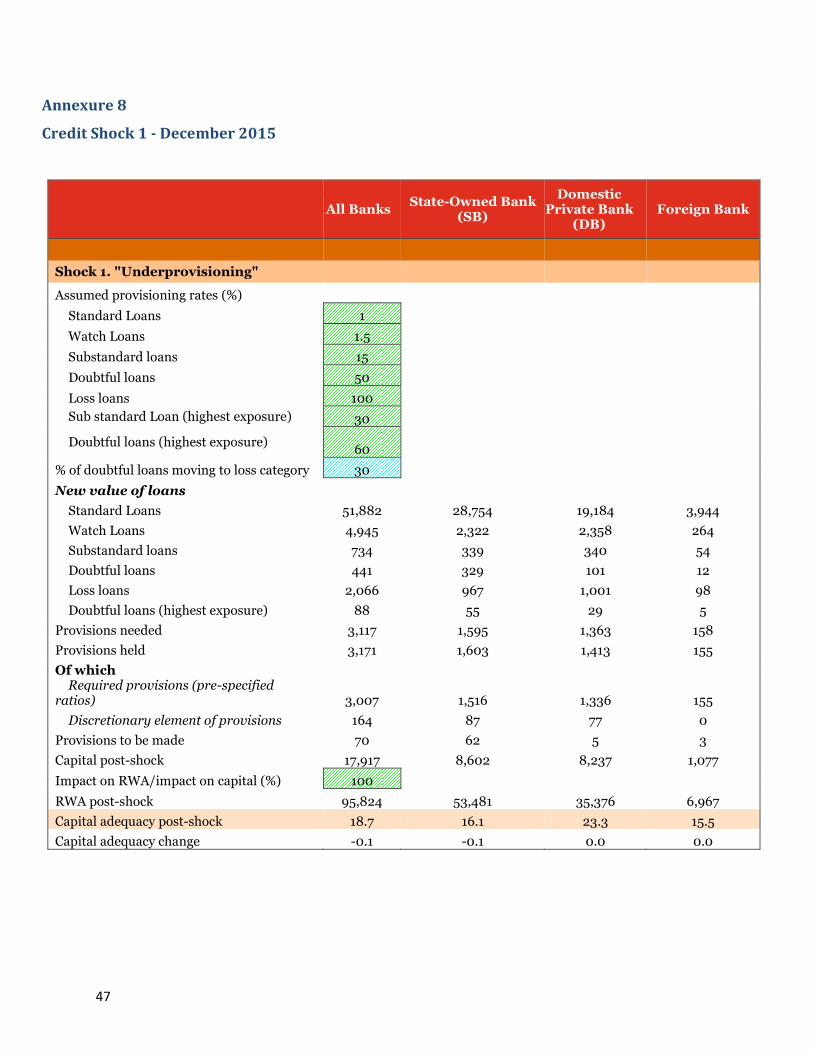
47
Annexure 8
Credit Shock 1 - December 2015
All Banks State-Owned Bank
(SB)
Domestic Private Bank
(DB) Foreign Bank
Shock 1. "Underprovisioning"
Assumed provisioning rates (%) Standard Loans 1
Watch Loans 1.5 Substandard loans 15 Doubtful loans 50
Loss loans 100 Sub standard Loan (highest exposure) 30
Doubtful loans (highest exposure) 60
% of doubtful loans moving to loss category 30 New value of loans Standard Loans 51,882 28,754 19,184 3,944
Watch Loans 4,945 2,322 2,358 264
Substandard loans 734 339 340 54
Doubtful loans 441 329 101 12
Loss loans 2,066 967 1,001 98
Doubtful loans (highest exposure) 88 55 29 5
Provisions needed 3,117 1,595 1,363 158
Provisions held 3,171 1,603 1,413 155
Of which Required provisions (pre-specified
ratios) 3,007 1,516 1,336 155
Discretionary element of provisions 164 87 77 0
Provisions to be made 70 62 5 3
Capital post-shock 17,917 8,602 8,237 1,077
Impact on RWA/impact on capital (%) 100 RWA post-shock 95,824 53,481 35,376 6,967
Capital adequacy post-shock 18.7 16.1 23.3 15.5
Capital adequacy change -0.1 -0.1 0.0 0.0
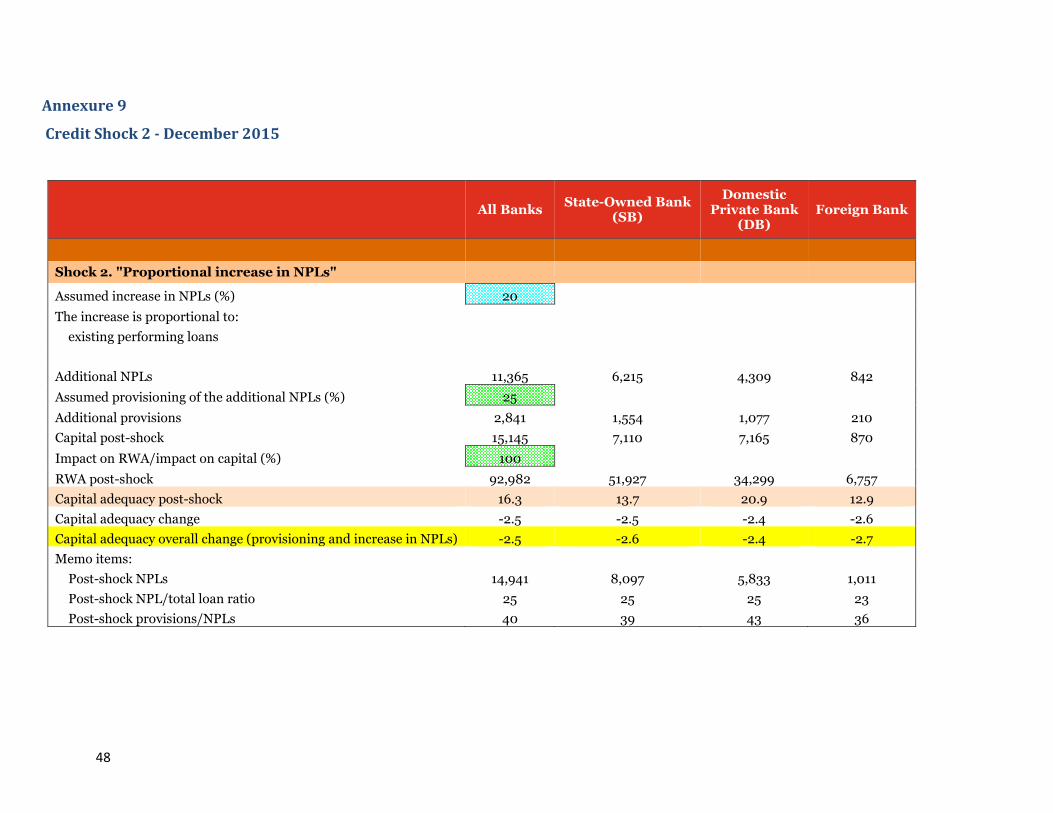
48
Annexure 9
Credit Shock 2 - December 2015
All Banks State-Owned Bank
(SB)
Domestic Private Bank
(DB) Foreign Bank
Shock 2. "Proportional increase in NPLs"
Assumed increase in NPLs (%) 20 The increase is proportional to:
existing performing loans
Additional NPLs 11,365 6,215 4,309 842
Assumed provisioning of the additional NPLs (%) 25 Additional provisions 2,841 1,554 1,077 210
Capital post-shock 15,145 7,110 7,165 870
Impact on RWA/impact on capital (%) 100 RWA post-shock 92,982 51,927 34,299 6,757
Capital adequacy post-shock 16.3 13.7 20.9 12.9
Capital adequacy change -2.5 -2.5 -2.4 -2.6
Capital adequacy overall change (provisioning and increase in NPLs) -2.5 -2.6 -2.4 -2.7
Memo items: Post-shock NPLs 14,941 8,097 5,833 1,011
Post-shock NPL/total loan ratio 25 25 25 23
Post-shock provisions/NPLs 40 39 43 36
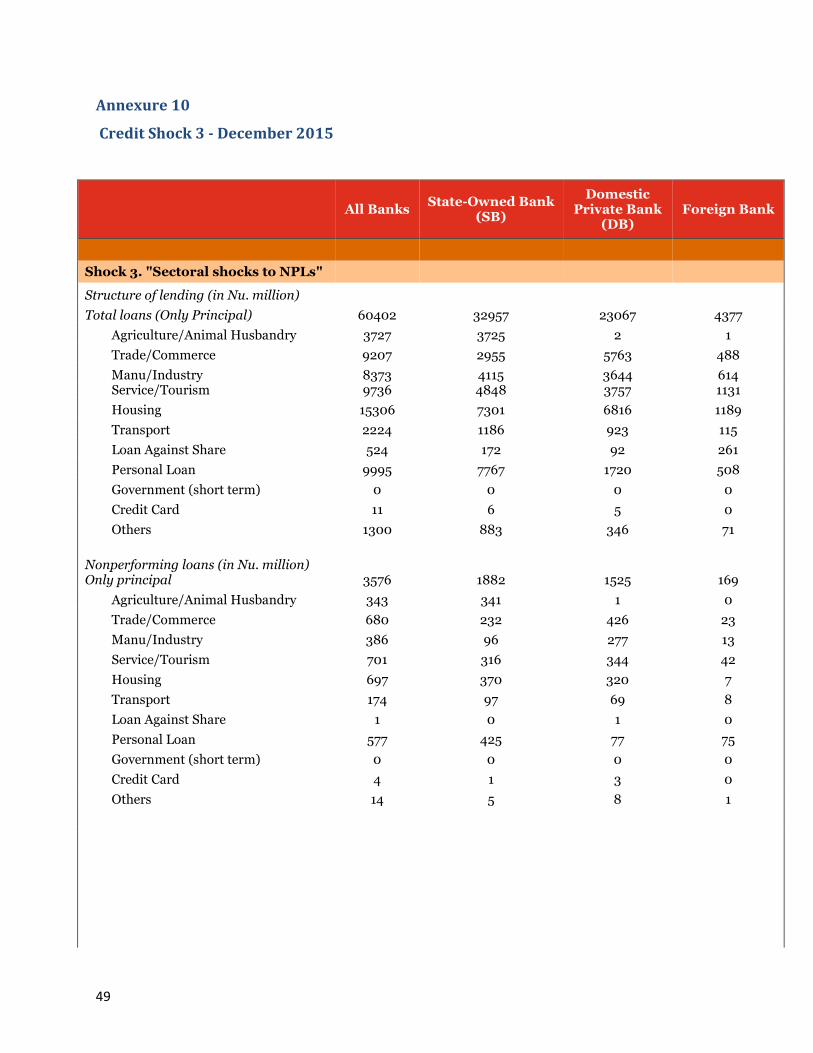
49
Annexure 10
Credit Shock 3 - December 2015
All Banks State-Owned Bank
(SB)
Domestic Private Bank
(DB) Foreign Bank
Shock 3. "Sectoral shocks to NPLs"
Structure of lending (in Nu. million) Total loans (Only Principal) 60402 32957 23067 4377
Agriculture/Animal Husbandry 3727 3725 2 1
Trade/Commerce 9207 2955 5763 488
Manu/Industry 8373 4115 3644 614 Service/Tourism 9736 4848 3757 1131
Housing 15306 7301 6816 1189
Transport 2224 1186 923 115
Loan Against Share 524 172 92 261
Personal Loan 9995 7767 1720 508
Government (short term) 0 0 0 0
Credit Card 11 6 5 0
Others 1300 883 346 71
Nonperforming loans (in Nu. million) Only principal 3576 1882 1525 169
Agriculture/Animal Husbandry 343 341 1 0
Trade/Commerce 680 232 426 23
Manu/Industry 386 96 277 13
Service/Tourism 701 316 344 42
Housing 697 370 320 7
Transport 174 97 69 8
Loan Against Share 1 0 1 0
Personal Loan 577 425 77 75
Government (short term) 0 0 0 0
Credit Card 4 1 3 0
Others 14 5 8 1
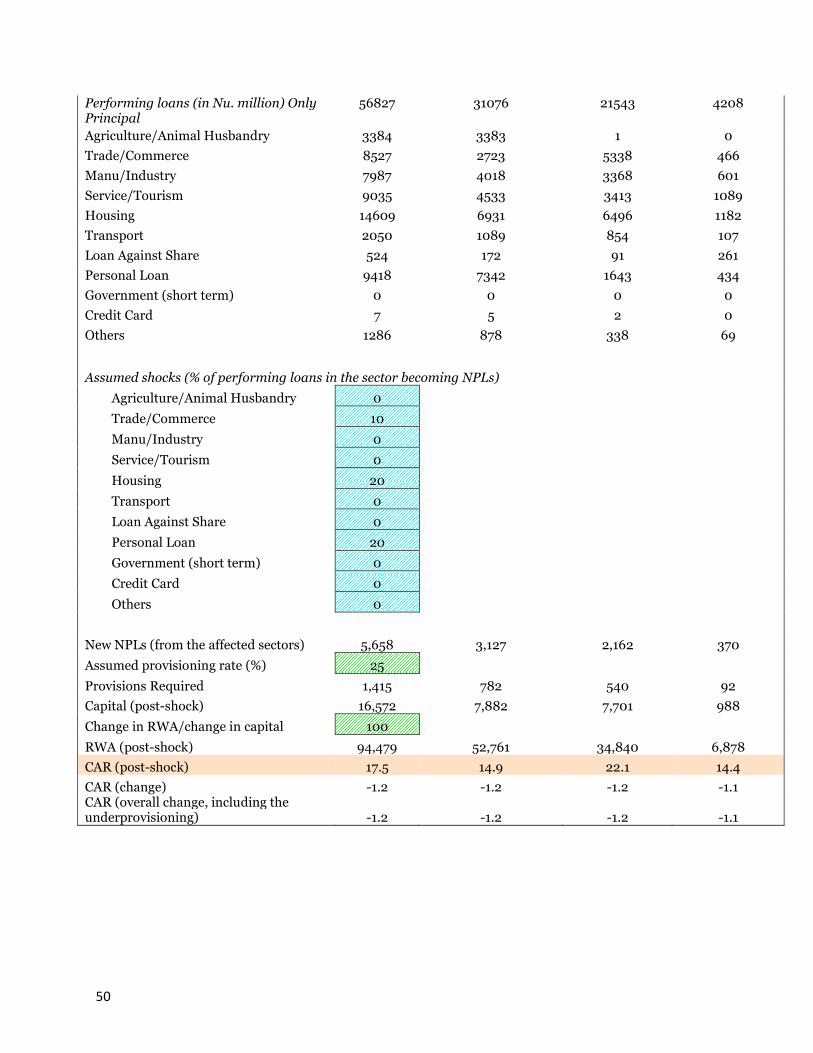
50
Performing loans (in Nu. million) Only Principal
56827 31076 21543 4208
Agriculture/Animal Husbandry 3384 3383 1 0
Trade/Commerce 8527 2723 5338 466
Manu/Industry 7987 4018 3368 601
Service/Tourism 9035 4533 3413 1089
Housing 14609 6931 6496 1182
Transport 2050 1089 854 107
Loan Against Share 524 172 91 261
Personal Loan 9418 7342 1643 434
Government (short term) 0 0 0 0
Credit Card 7 5 2 0
Others 1286 878 338 69
Assumed shocks (% of performing loans in the sector becoming NPLs)
Agriculture/Animal Husbandry 0 Trade/Commerce 10 Manu/Industry 0 Service/Tourism 0 Housing 20 Transport 0 Loan Against Share 0 Personal Loan 20 Government (short term) 0 Credit Card 0 Others 0
New NPLs (from the affected sectors) 5,658 3,127 2,162 370
Assumed provisioning rate (%) 25 Provisions Required 1,415 782 540 92
Capital (post-shock) 16,572 7,882 7,701 988
Change in RWA/change in capital 100 RWA (post-shock) 94,479 52,761 34,840 6,878
CAR (post-shock) 17.5 14.9 22.1 14.4
CAR (change) -1.2 -1.2 -1.2 -1.1 CAR (overall change, including the underprovisioning) -1.2 -1.2 -1.2 -1.1
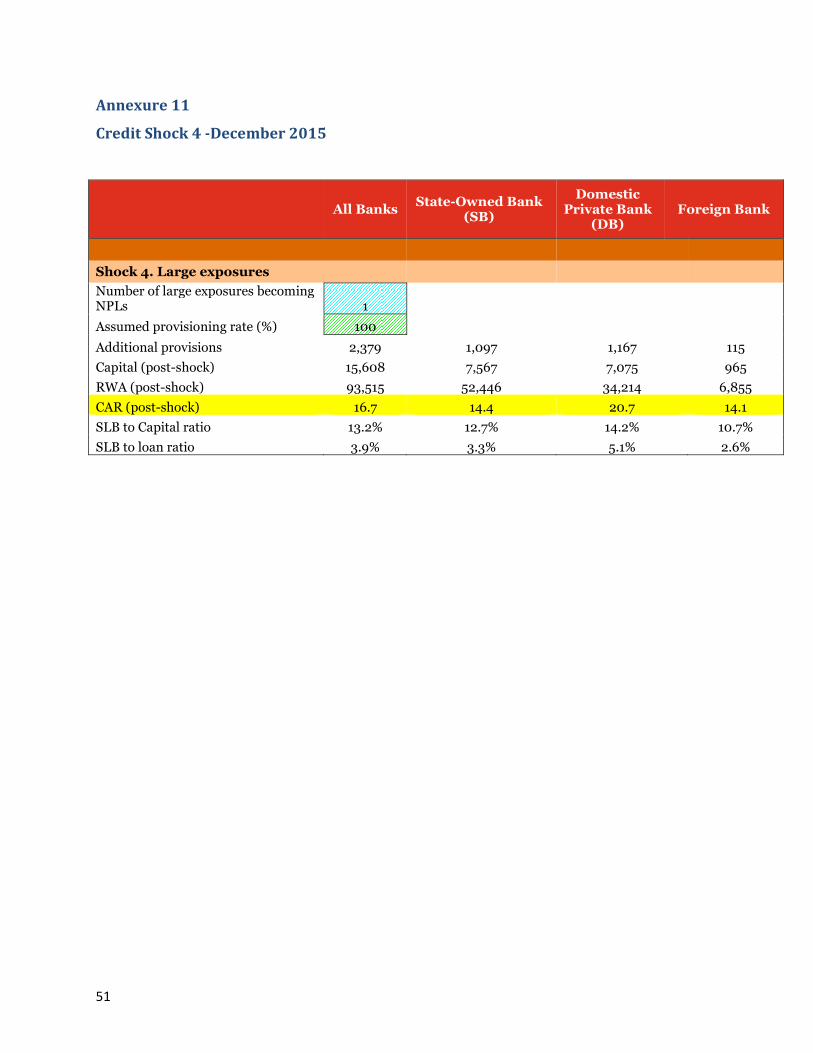
51
Annexure 11
Credit Shock 4 -December 2015
All Banks State-Owned Bank
(SB)
Domestic Private Bank
(DB) Foreign Bank
Shock 4. Large exposures
Number of large exposures becoming NPLs 1
Assumed provisioning rate (%) 100 Additional provisions 2,379 1,097 1,167 115
Capital (post-shock) 15,608 7,567 7,075 965
RWA (post-shock) 93,515 52,446 34,214 6,855
CAR (post-shock) 16.7 14.4 20.7 14.1
SLB to Capital ratio 13.2% 12.7% 14.2% 10.7%
SLB to loan ratio 3.9% 3.3% 5.1% 2.6%
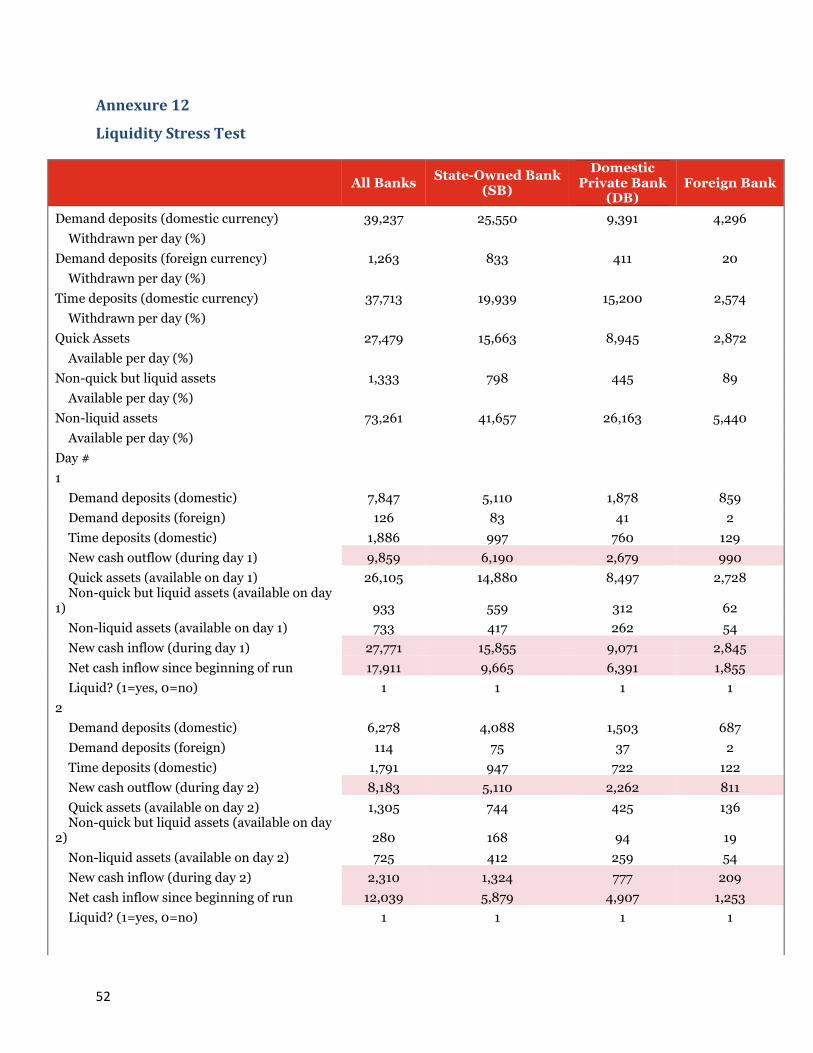
52
Annexure 12
Liquidity Stress Test
All Banks State-Owned Bank
(SB)
Domestic Private Bank
(DB) Foreign Bank
Demand deposits (domestic currency) 39,237 25,550 9,391 4,296
Withdrawn per day (%) Demand deposits (foreign currency) 1,263 833 411 20
Withdrawn per day (%) Time deposits (domestic currency) 37,713 19,939 15,200 2,574
Withdrawn per day (%) Quick Assets 27,479 15,663 8,945 2,872
Available per day (%) Non-quick but liquid assets 1,333 798 445 89
Available per day (%) Non-liquid assets 73,261 41,657 26,163 5,440
Available per day (%) Day # 1 Demand deposits (domestic) 7,847 5,110 1,878 859
Demand deposits (foreign) 126 83 41 2
Time deposits (domestic) 1,886 997 760 129
New cash outflow (during day 1) 9,859 6,190 2,679 990
Quick assets (available on day 1) 26,105 14,880 8,497 2,728 Non-quick but liquid assets (available on day
1) 933 559 312 62
Non-liquid assets (available on day 1) 733 417 262 54
New cash inflow (during day 1) 27,771 15,855 9,071 2,845
Net cash inflow since beginning of run 17,911 9,665 6,391 1,855
Liquid? (1=yes, 0=no) 1 1 1 1
2 Demand deposits (domestic) 6,278 4,088 1,503 687
Demand deposits (foreign) 114 75 37 2
Time deposits (domestic) 1,791 947 722 122
New cash outflow (during day 2) 8,183 5,110 2,262 811
Quick assets (available on day 2) 1,305 744 425 136 Non-quick but liquid assets (available on day
2) 280 168 94 19
Non-liquid assets (available on day 2) 725 412 259 54
New cash inflow (during day 2) 2,310 1,324 777 209
Net cash inflow since beginning of run 12,039 5,879 4,907 1,253
Liquid? (1=yes, 0=no) 1 1 1 1
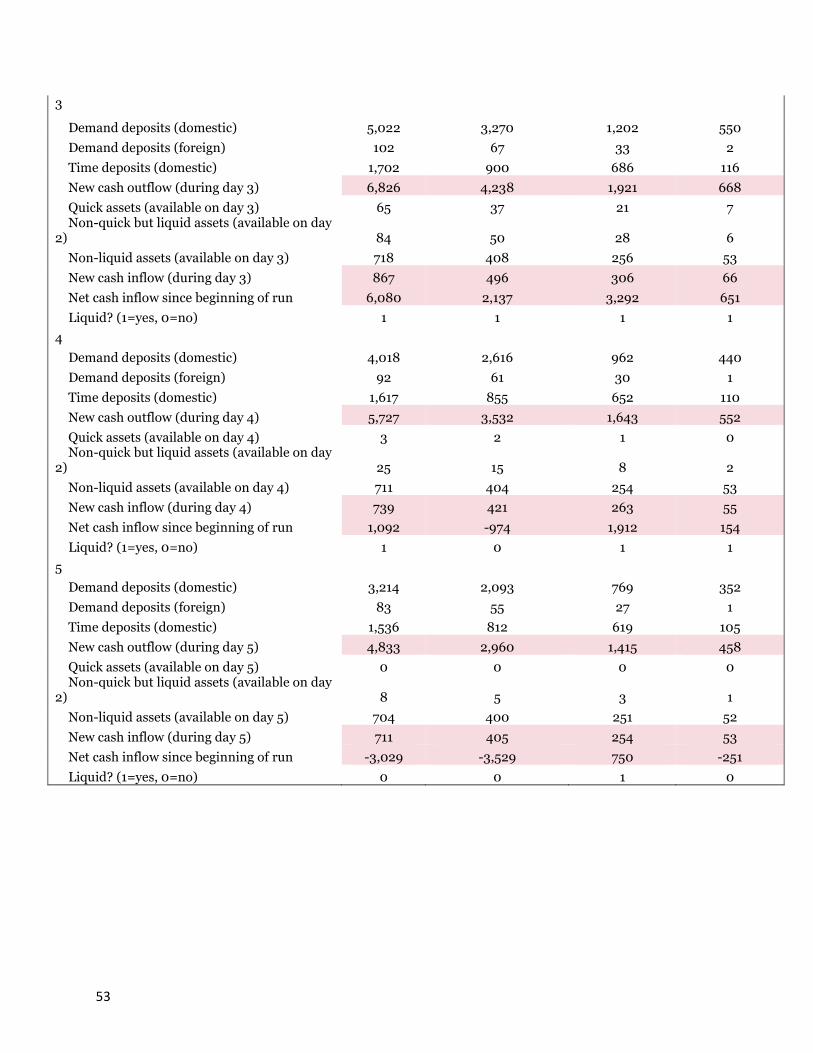
53
3
Demand deposits (domestic) 5,022 3,270 1,202 550
Demand deposits (foreign) 102 67 33 2
Time deposits (domestic) 1,702 900 686 116
New cash outflow (during day 3) 6,826 4,238 1,921 668
Quick assets (available on day 3) 65 37 21 7 Non-quick but liquid assets (available on day
2) 84 50 28 6
Non-liquid assets (available on day 3) 718 408 256 53
New cash inflow (during day 3) 867 496 306 66
Net cash inflow since beginning of run 6,080 2,137 3,292 651
Liquid? (1=yes, 0=no) 1 1 1 1
4 Demand deposits (domestic) 4,018 2,616 962 440
Demand deposits (foreign) 92 61 30 1
Time deposits (domestic) 1,617 855 652 110
New cash outflow (during day 4) 5,727 3,532 1,643 552
Quick assets (available on day 4) 3 2 1 0 Non-quick but liquid assets (available on day
2) 25 15 8 2
Non-liquid assets (available on day 4) 711 404 254 53
New cash inflow (during day 4) 739 421 263 55
Net cash inflow since beginning of run 1,092 -974 1,912 154
Liquid? (1=yes, 0=no) 1 0 1 1
5 Demand deposits (domestic) 3,214 2,093 769 352
Demand deposits (foreign) 83 55 27 1
Time deposits (domestic) 1,536 812 619 105
New cash outflow (during day 5) 4,833 2,960 1,415 458
Quick assets (available on day 5) 0 0 0 0 Non-quick but liquid assets (available on day
2) 8 5 3 1
Non-liquid assets (available on day 5) 704 400 251 52
New cash inflow (during day 5) 711 405 254 53
Net cash inflow since beginning of run -3,029 -3,529 750 -251
Liquid? (1=yes, 0=no) 0 0 1 0


![Himalayan Kingdom Marathon Bhutan Information 2015[1].pdfHimalayan Kingdom Marathon Bhutan Bhutan Information 31st May, 2015 . Bhutan Bhutan, the land of the Thunder Dragon is mystical,](https://static.fdocuments.in/doc/165x107/5f11fd557037e051160106f9/himalayan-kingdom-marathon-bhutan-information-20151pdf-himalayan-kingdom-marathon.jpg)
