2011 Crop Market Outlook
36
University Extension/Department of Economics 2011 Crop Market Outlook Coleman Research Group Presentation Apr. 13, 2011 Chad Hart Assistant Professor/Grain Markets Specialist [email protected] 515-294-9911
-
Upload
philip-obrien -
Category
Documents
-
view
27 -
download
0
description
2011 Crop Market Outlook. Coleman Research Group Presentation Apr. 13, 2011 Chad Hart Assistant Professor/Grain Markets Specialist [email protected] 515-294-9911. U.S. Corn Supply and Use. Source: USDA. U.S. Soybean Supply and Use. Source: USDA. U.S. Wheat Supply and Use. Source: USDA. - PowerPoint PPT Presentation
Transcript of 2011 Crop Market Outlook
University Extension/Department of Economics
2011 Crop Market Outlook
Coleman Research Group PresentationApr. 13, 2011
Chad HartAssistant Professor/Grain Markets Specialist
University Extension/Department of Economics
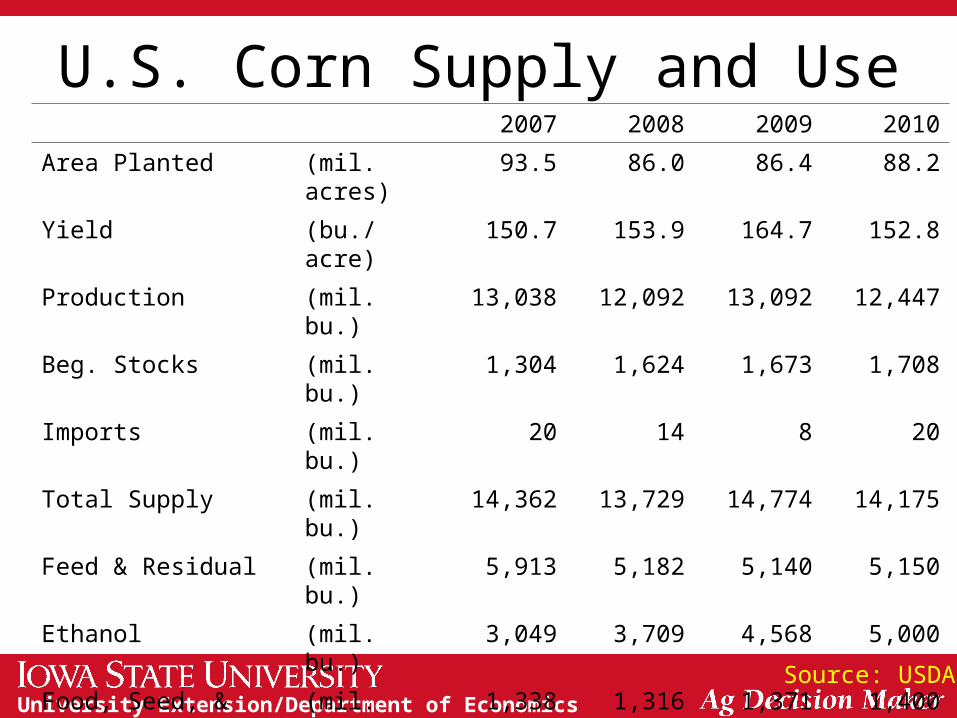
U.S. Corn Supply and Use
Source: USDA
2007 2008 2009 2010
Area Planted (mil. acres) 93.5 86.0 86.4 88.2
Yield (bu./acre) 150.7 153.9 164.7 152.8
Production (mil. bu.) 13,038 12,092 13,092 12,447
Beg. Stocks (mil. bu.) 1,304 1,624 1,673 1,708
Imports (mil. bu.) 20 14 8 20
Total Supply (mil. bu.) 14,362 13,729 14,774 14,175
Feed & Residual (mil. bu.) 5,913 5,182 5,140 5,150
Ethanol (mil. bu.) 3,049 3,709 4,568 5,000
Food, Seed, & Other (mil. bu.) 1,338 1,316 1,371 1,400
Exports (mil. bu.) 2,437 1,849 1,987 1,950
Total Use (mil. bu.) 12,737 12,056 13,066 13,500
Ending Stocks (mil. bu.) 1,624 1,673 1,708 675
Season-Average Price ($/bu.) 4.20 4.06 3.55 5.40
University Extension/Department of Economics
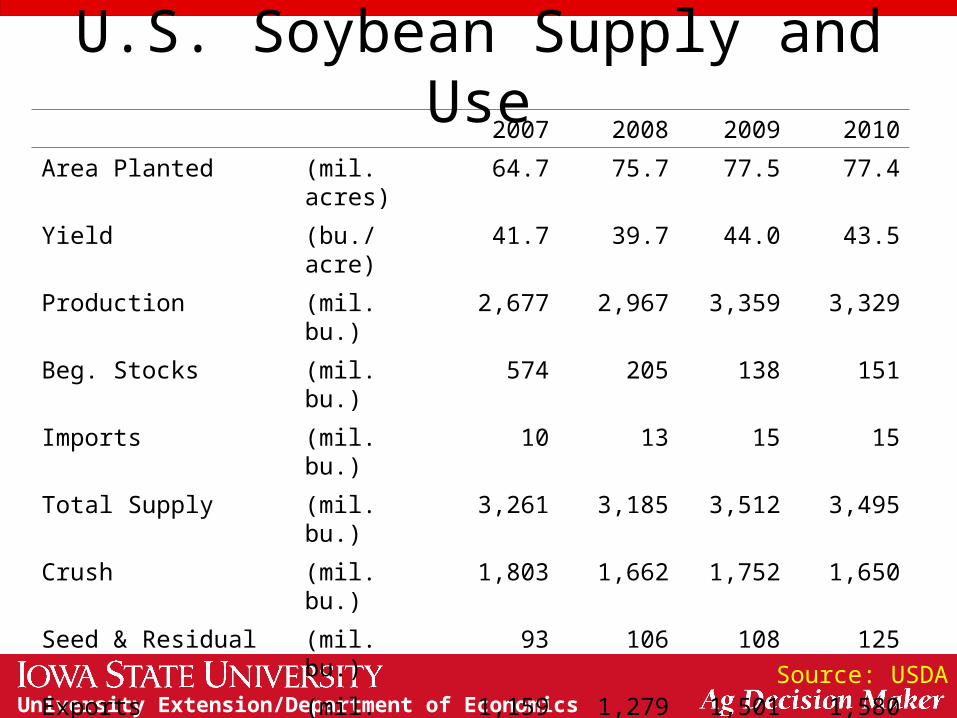
U.S. Soybean Supply and Use2007 2008 2009 2010
Area Planted (mil. acres) 64.7 75.7 77.5 77.4
Yield (bu./acre) 41.7 39.7 44.0 43.5
Production (mil. bu.) 2,677 2,967 3,359 3,329
Beg. Stocks (mil. bu.) 574 205 138 151
Imports (mil. bu.) 10 13 15 15
Total Supply (mil. bu.) 3,261 3,185 3,512 3,495
Crush (mil. bu.) 1,803 1,662 1,752 1,650
Seed & Residual (mil. bu.) 93 106 108 125
Exports (mil. bu.) 1,159 1,279 1,501 1,580
Total Use (mil. bu.) 3,056 3,047 3,361 3,355
Ending Stocks (mil. bu.) 205 138 151 140
Season-Average Price ($/bu.) 10.10 9.97 9.59 11.50
Source: USDA
University Extension/Department of Economics
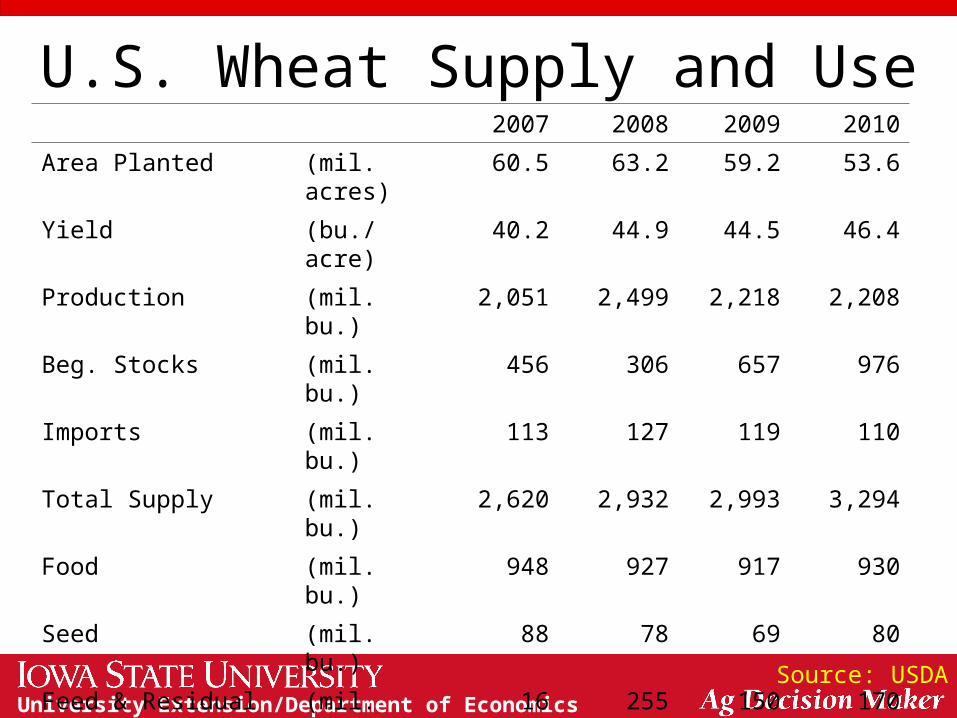
U.S. Wheat Supply and Use2007 2008 2009 2010
Area Planted (mil. acres) 60.5 63.2 59.2 53.6
Yield (bu./acre) 40.2 44.9 44.5 46.4
Production (mil. bu.) 2,051 2,499 2,218 2,208
Beg. Stocks (mil. bu.) 456 306 657 976
Imports (mil. bu.) 113 127 119 110
Total Supply (mil. bu.) 2,620 2,932 2,993 3,294
Food (mil. bu.) 948 927 917 930
Seed (mil. bu.) 88 78 69 80
Feed & Residual (mil. bu.) 16 255 150 170
Exports (mil. bu.) 1,263 1,015 881 1,275
Total Use (mil. bu.) 2,314 2,275 2,018 2,455
Ending Stocks (mil. bu.) 306 657 976 839
Season-Average Price ($/bu.) 6.48 6.78 4.87 5.60
Source: USDA
University Extension/Department of Economics
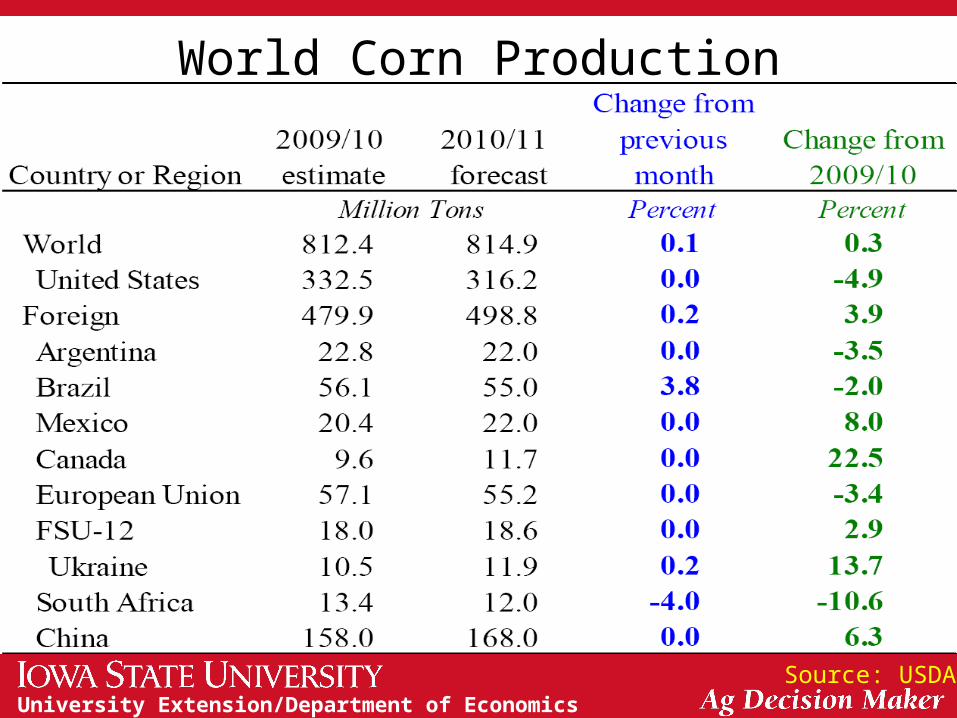
World Corn Production
Source: USDA
University Extension/Department of Economics
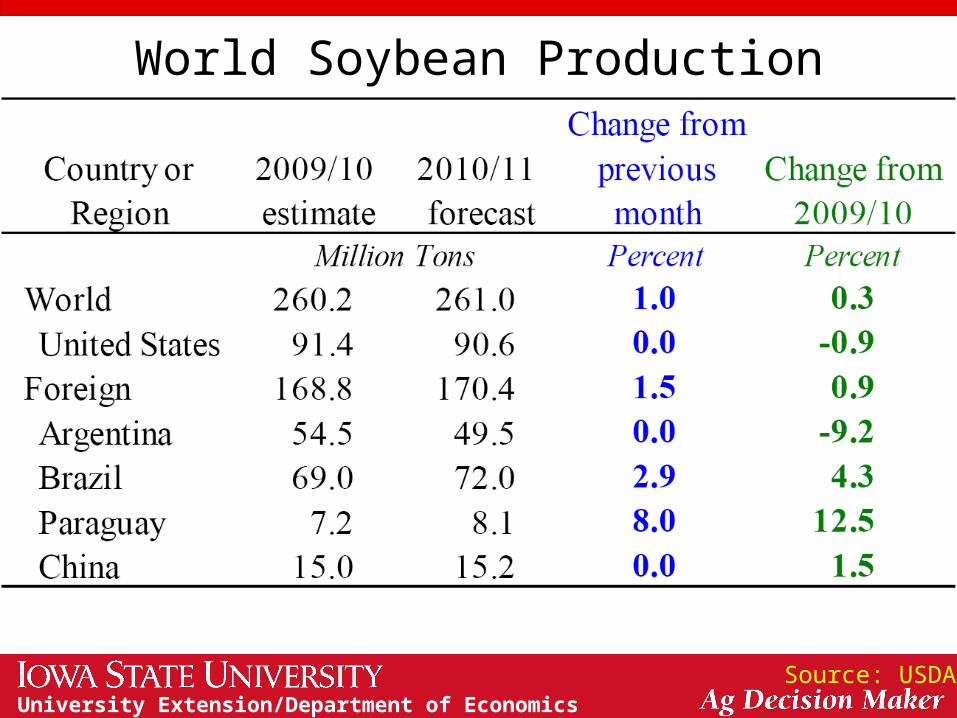
World Soybean Production
Source: USDA
University Extension/Department of Economics
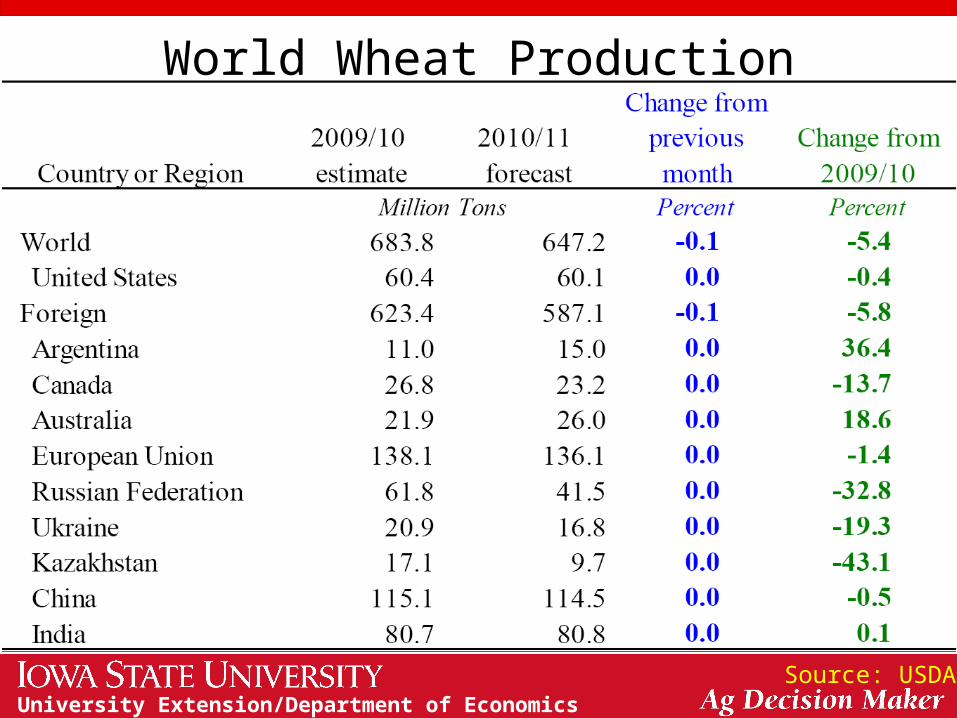
World Wheat Production
Source: USDA
University Extension/Department of Economics
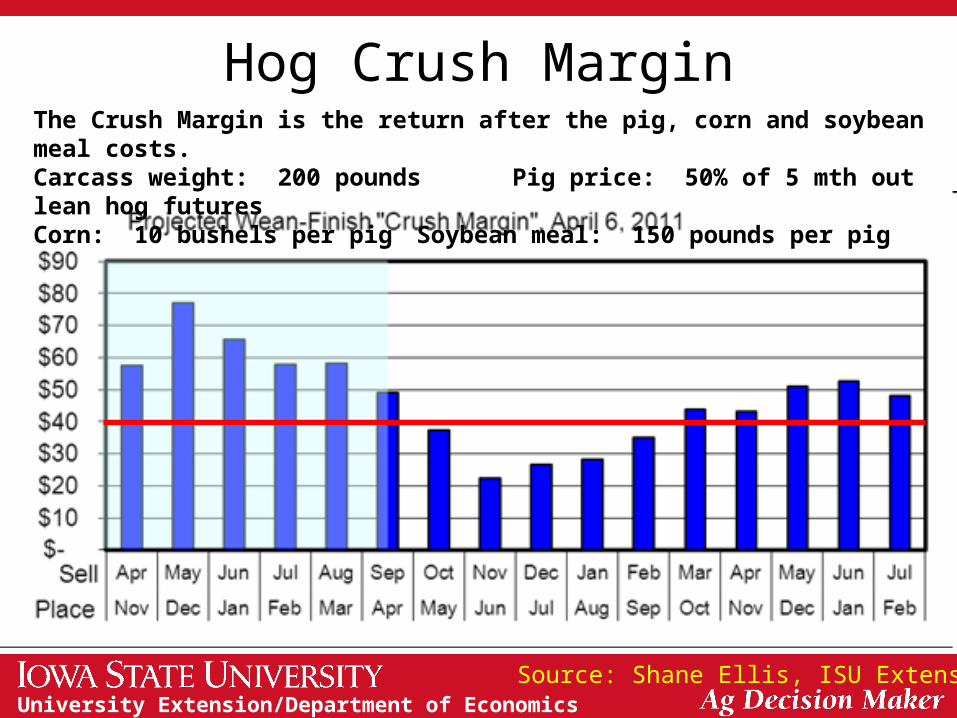
Hog Crush Margin
Source: Shane Ellis, ISU Extension
The Crush Margin is the return after the pig, corn and soybean meal costs.Carcass weight: 200 pounds Pig price: 50% of 5 mth out lean hog futuresCorn: 10 bushels per pig Soybean meal: 150 pounds per pig
University Extension/Department of Economics
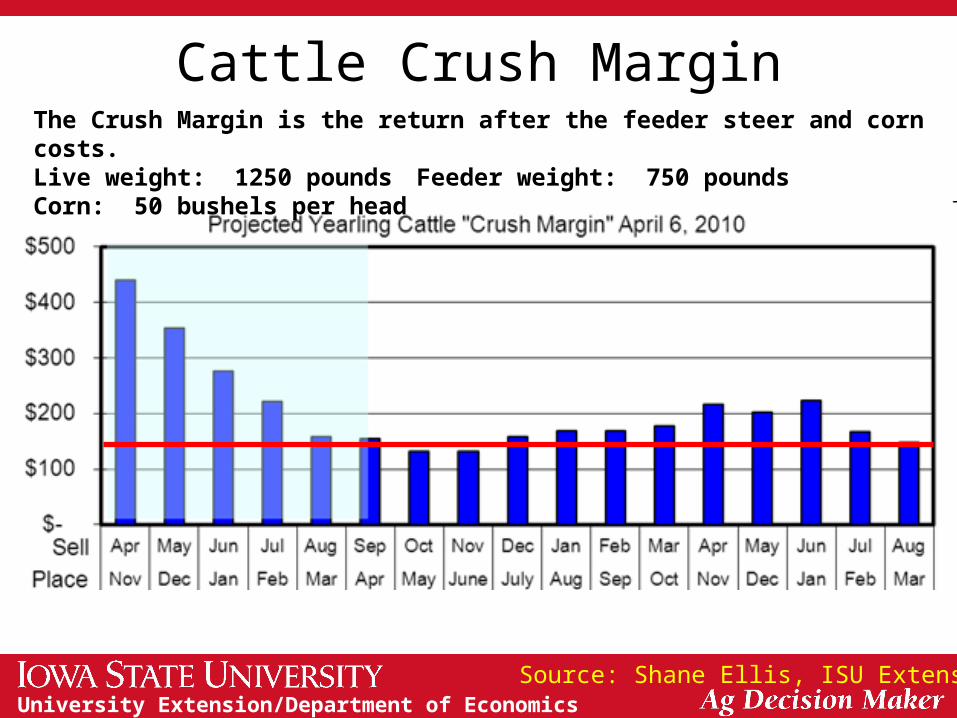
Cattle Crush Margin
Source: Shane Ellis, ISU Extension
The Crush Margin is the return after the feeder steer and corn costs.Live weight: 1250 pounds Feeder weight: 750 pounds Corn: 50 bushels per head
University Extension/Department of Economics
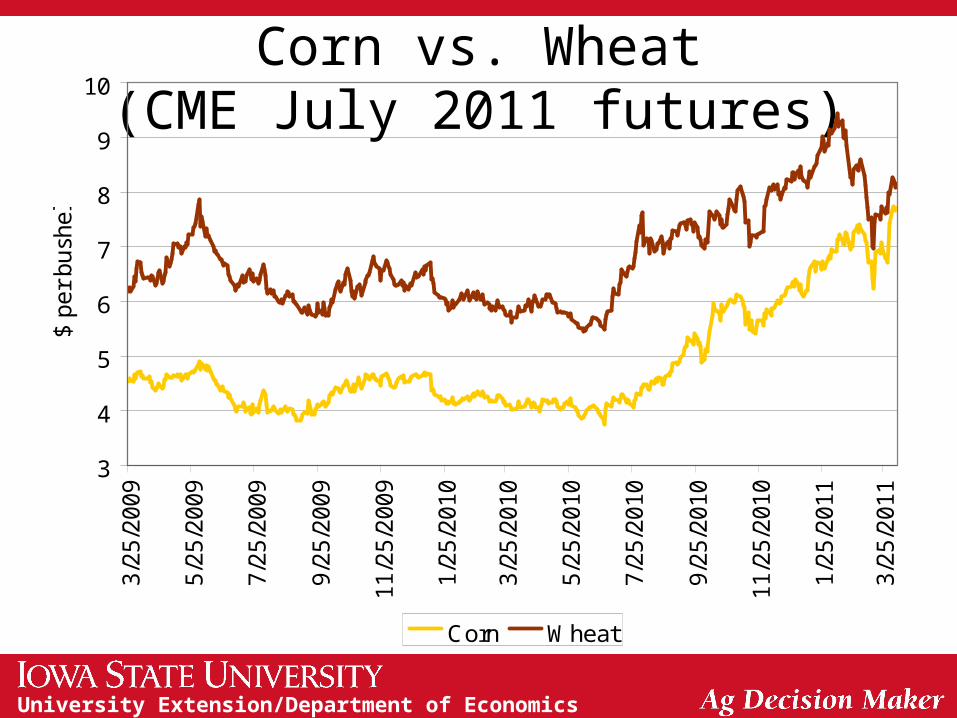
Corn vs. Wheat(CME July 2011 futures)
3
4
5
6
7
8
9
10
3/2
5/2
009
5/2
5/2
009
7/2
5/2
009
9/2
5/2
009
11/2
5/2
009
1/2
5/2
010
3/2
5/2
010
5/2
5/2
010
7/2
5/2
010
9/2
5/2
010
11/2
5/2
010
1/2
5/2
011
3/2
5/2
011
$ p
er
bush
el
Corn Wheat
University Extension/Department of Economics
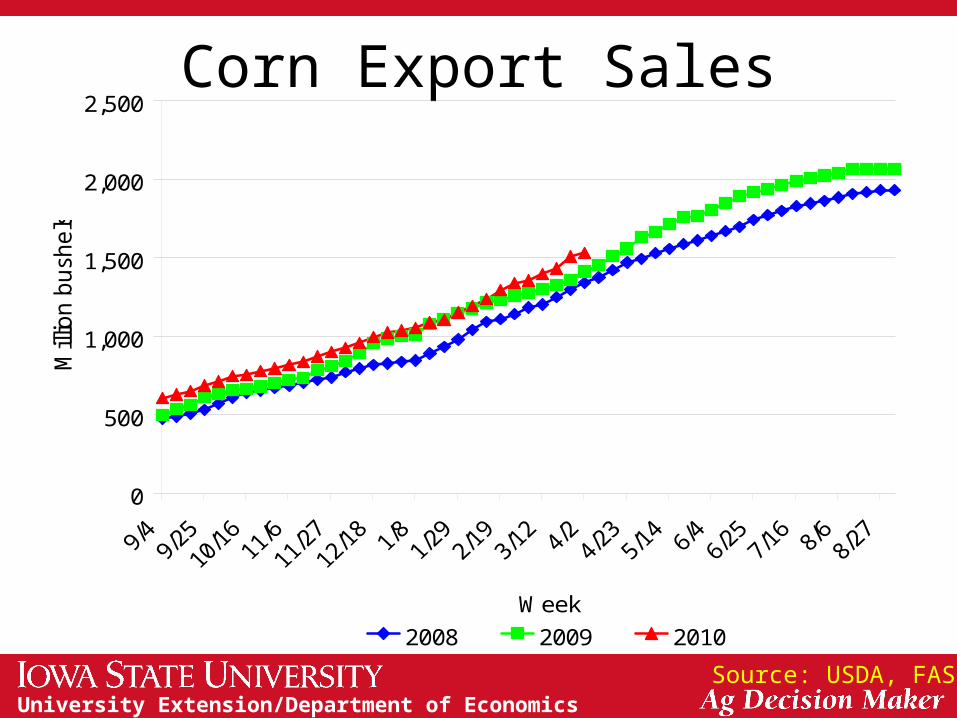
Corn Export Sales
Source: USDA, FAS
0
500
1,000
1,500
2,000
2,500
Week
Mill
ion b
ush
els
2008 2009 2010

University Extension/Department of Economics
Corn Advance Export Sales
Source: USDA, FAS
0
100
200
300
400
500
600
700
12/3
0
1/1
3
1/2
7
2/1
0
2/2
4
3/1
0
3/2
4
4/7
4/2
1
5/5
5/1
9
6/2
6/1
6
6/3
0
7/1
4
7/2
8
8/1
1
8/2
5
Mill
ion b
ush
els
2011 Crop 2010 Crop
University Extension/Department of Economics
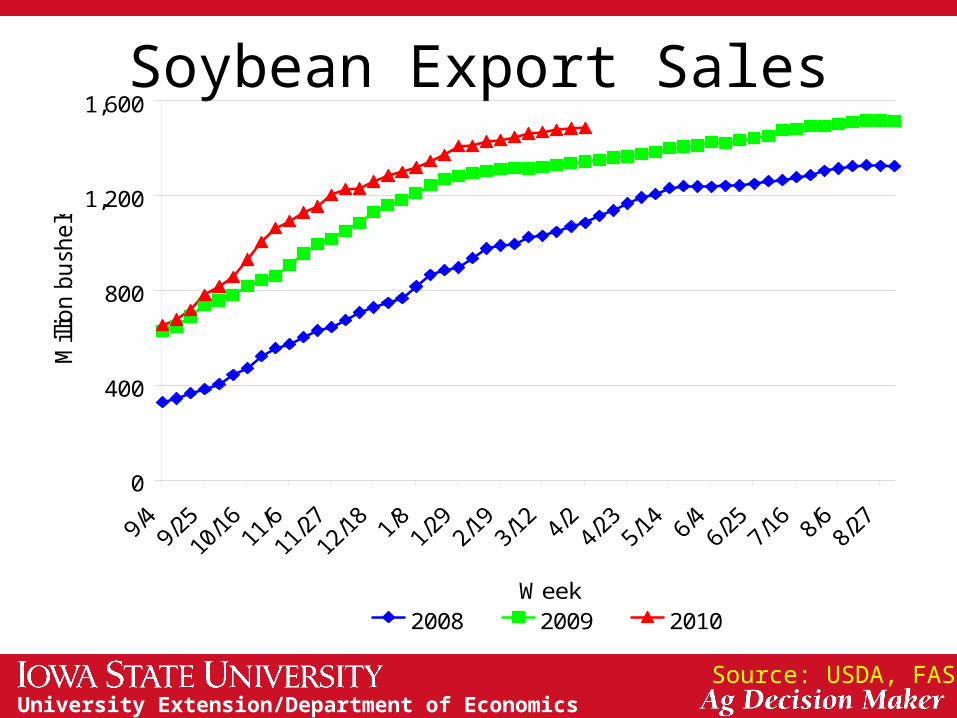
Soybean Export Sales
Source: USDA, FAS
0
400
800
1,200
1,600
Week
Mill
ion b
ush
els
2008 2009 2010
University Extension/Department of Economics
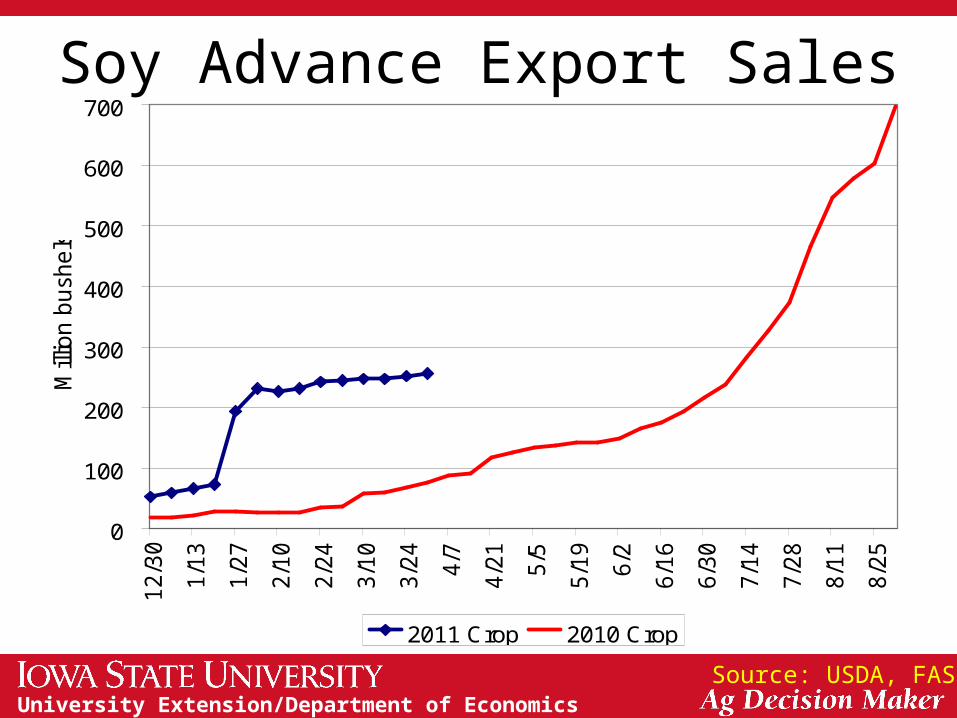
Soy Advance Export Sales
Source: USDA, FAS
0
100
200
300
400
500
600
700
12/3
0
1/1
3
1/2
7
2/1
0
2/2
4
3/1
0
3/2
4
4/7
4/2
1
5/5
5/1
9
6/2
6/1
6
6/3
0
7/1
4
7/2
8
8/1
1
8/2
5
Mill
ion b
ush
els
2011 Crop 2010 Crop
University Extension/Department of Economics
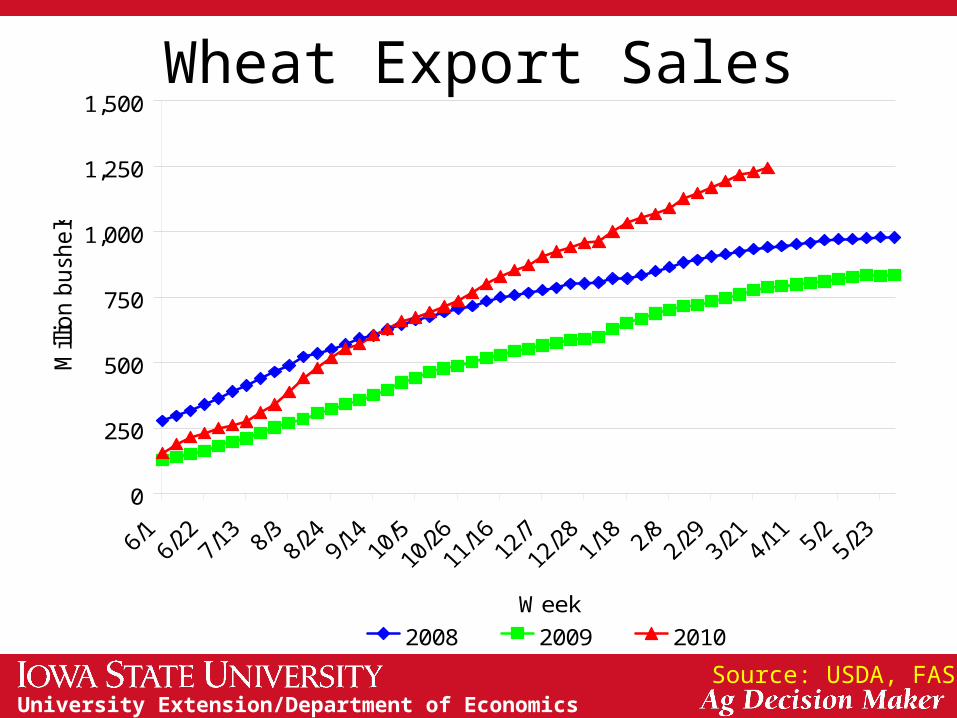
Wheat Export Sales
Source: USDA, FAS
0
250
500
750
1,000
1,250
1,500
Week
Mill
ion b
ush
els
2008 2009 2010
University Extension/Department of Economics
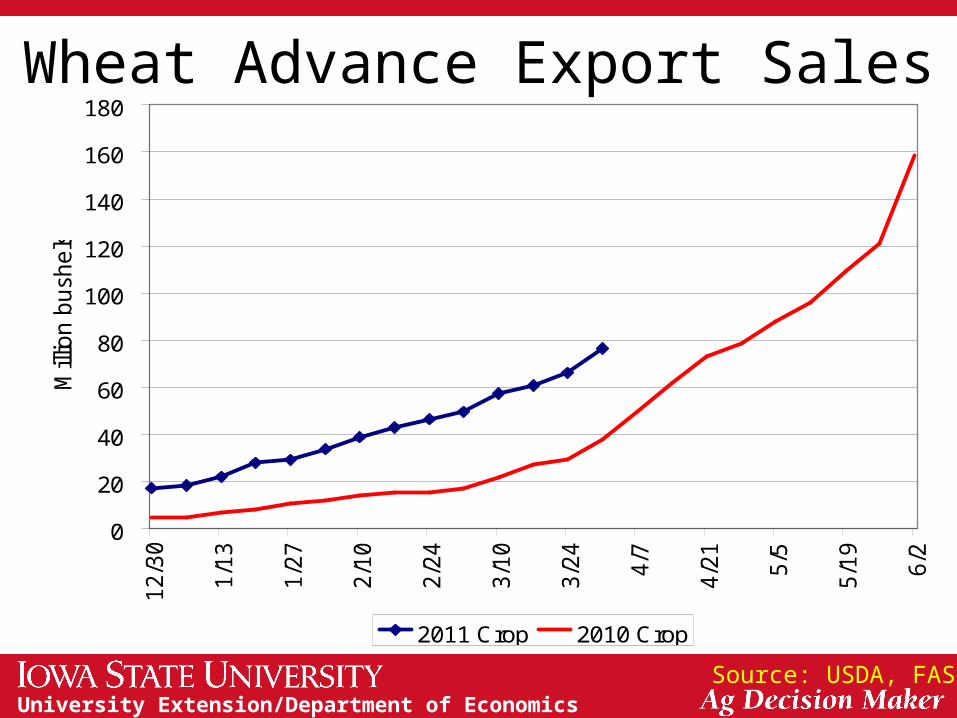
Wheat Advance Export Sales
Source: USDA, FAS
0
20
40
60
80
100
120
140
160
180
12/3
0
1/1
3
1/2
7
2/1
0
2/2
4
3/1
0
3/2
4
4/7
4/2
1
5/5
5/1
9
6/2
Mill
ion b
ush
els
2011 Crop 2010 Crop

University Extension/Department of Economics
0
2
4
6
8
10
12
14
16
2010 2011 2012
Bill
ion
ga
llon
s
Conventional Biofuels Cellulosic Biofuels
Biodiesel Additional Advanced Biofuels
Renewable Fuels Standard (RFS)
CropYear
Billion Bushels
2009 4.11
2010 4.43
2011 4.64
2012 4.86
University Extension/Department of Economics
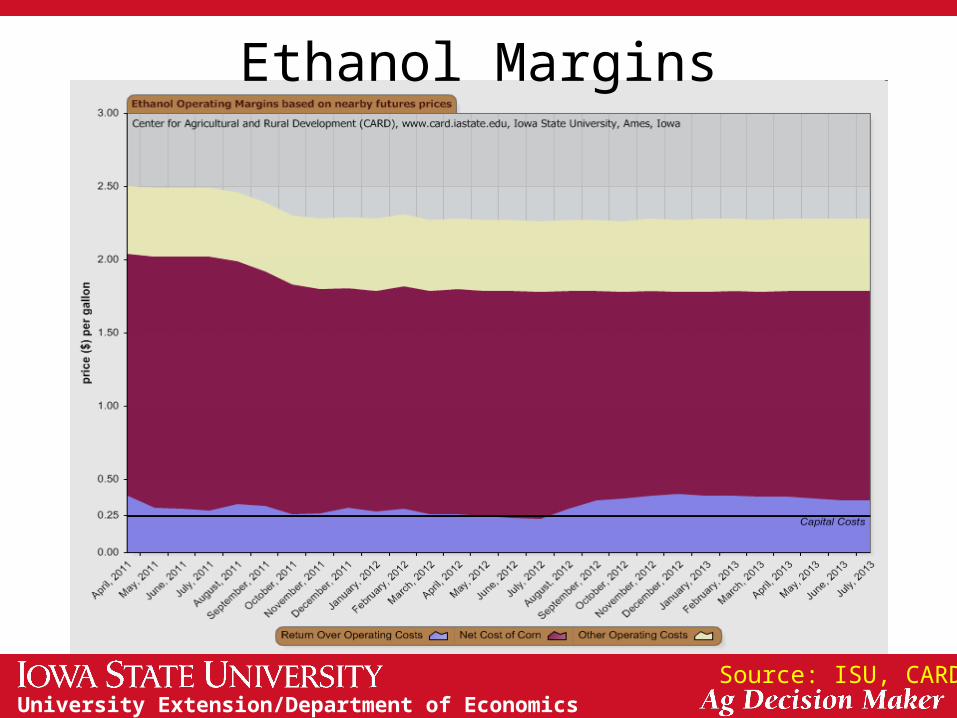
Ethanol Margins
Source: ISU, CARD
University Extension/Department of Economics
-0.04
-0.02
0.00
0.02
0.04
0.06
0.08
0.10
0.12
0.14
0.16
1/3
/2007
4/3
/2007
7/3
/2007
10/3
/2007
1/3
/2008
4/3
/2008
7/3
/2008
10/3
/2008
1/3
/2009
4/3
/2009
7/3
/2009
10/3
/2009
1/3
/2010
4/3
/2010
7/3
/2010
10/3
/2010
1/3
/2011
4/3
/2011
$ p
er
gallo
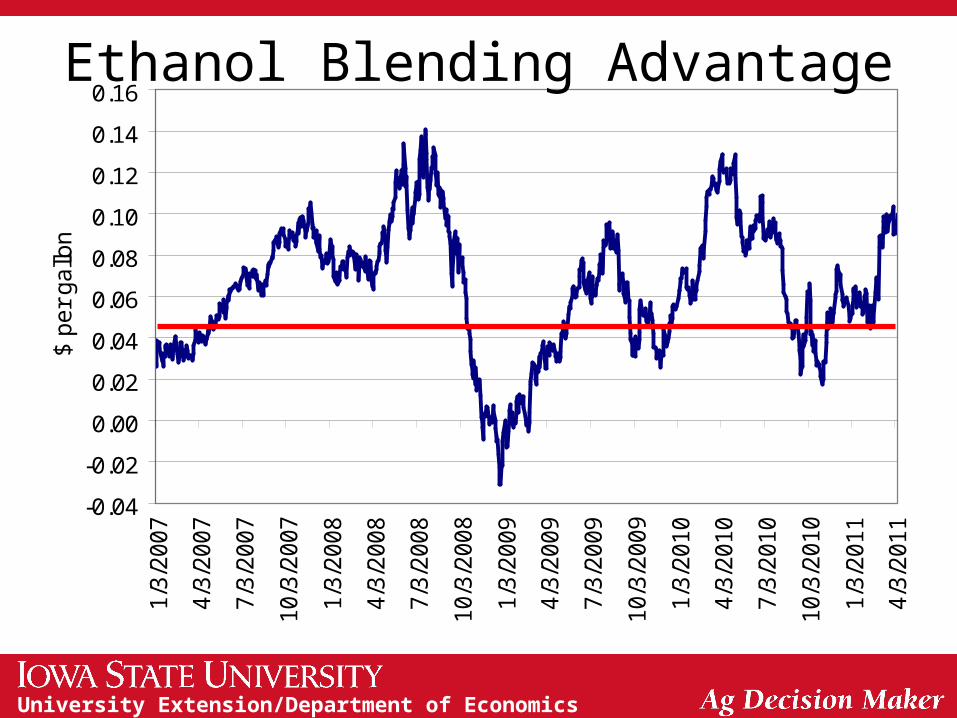
nEthanol Blending Advantage
University Extension/Department of Economics
0.50
1.00
1.50
2.00
2.50
3.00
3.50
4.00
1/3
/20
07
5/3
/20
07
9/3
/20
07
1/3
/20
08
5/3
/20
08
9/3
/20
08
1/3
/20
09
5/3
/20
09
9/3
/20
09
1/3
/20
10
5/3
/20
10
9/3
/20
10
1/3
/20
11
$ p
er
ga
llon
Ethanol Gasoline
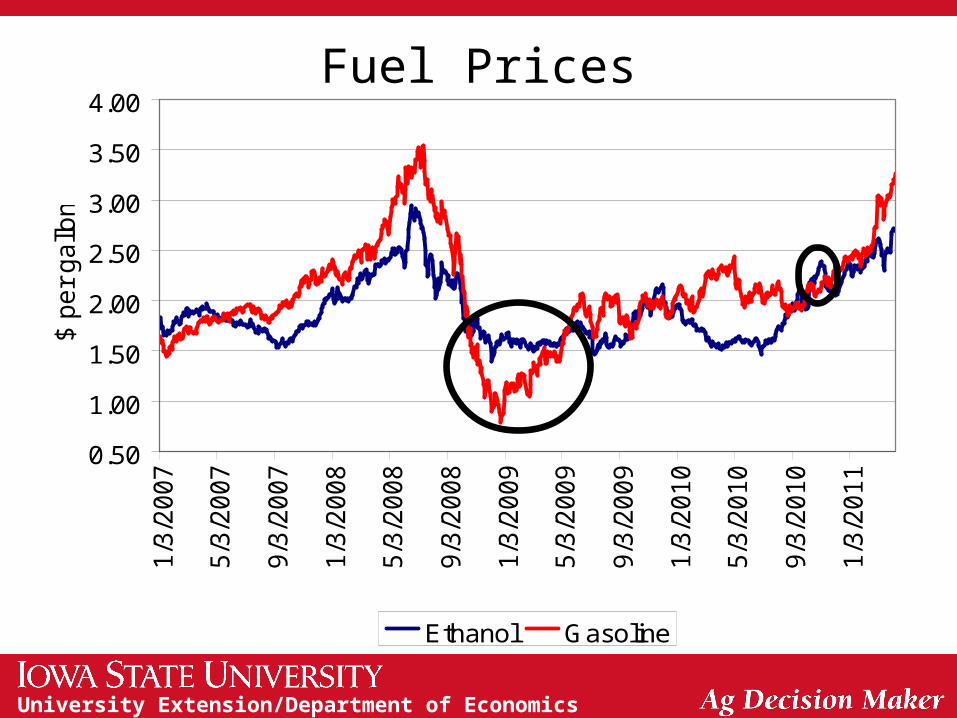
Fuel Prices
University Extension/Department of Economics
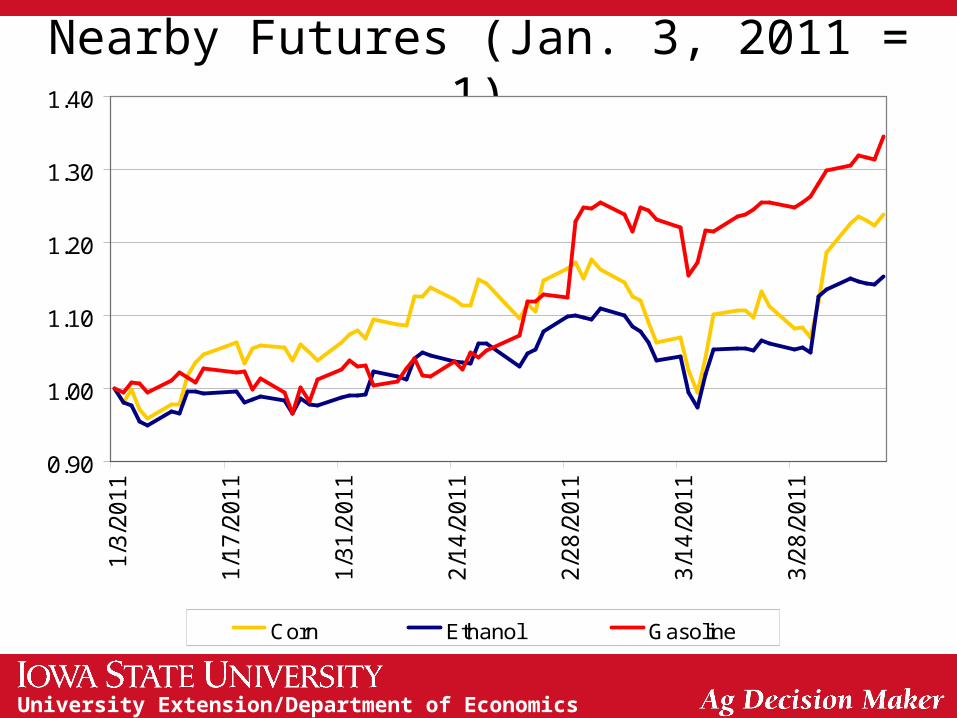
Nearby Futures (Jan. 3, 2011 = 1)
0.90
1.00
1.10
1.20
1.30
1.401/3
/201
1
1/1
7/2
011
1/3
1/2
011
2/1
4/2
011
2/2
8/2
011
3/1
4/2
011
3/2
8/2
011
Corn Ethanol Gasoline

University Extension/Department of Economics
Projected 2010 Season-Average Corn Price
3.00
3.50
4.00
4.50
5.00
5.50
6.00
6/8
/20
09
8/8
/20
09
10/8
/20
09
12/8
/20
09
2/8
/20
10
4/8
/20
10
6/8
/20
10
8/8
/20
10
10/8
/20
10
12/8
/20
10
2/8
/20
11
4/8
/20
11
$ p
er
bush
el
Futures USDA
University Extension/Department of Economics
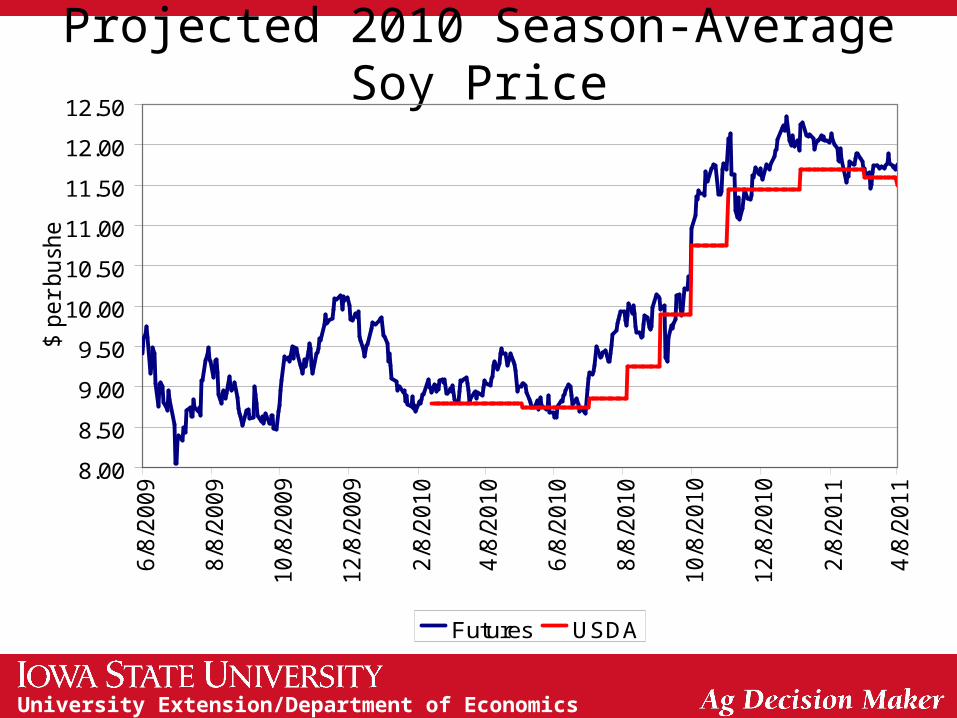
Projected 2010 Season-Average Soy Price
8.00
8.50
9.00
9.50
10.00
10.50
11.00
11.50
12.00
12.50
6/8
/200
9
8/8
/200
9
10/8
/20
09
12/8
/20
09
2/8
/201
0
4/8
/201
0
6/8
/201
0
8/8
/201
0
10/8
/20
10
12/8
/20
10
2/8
/201
1
4/8
/201
1
$ p
er
bu
she
l
Futures USDA
University Extension/Department of Economics
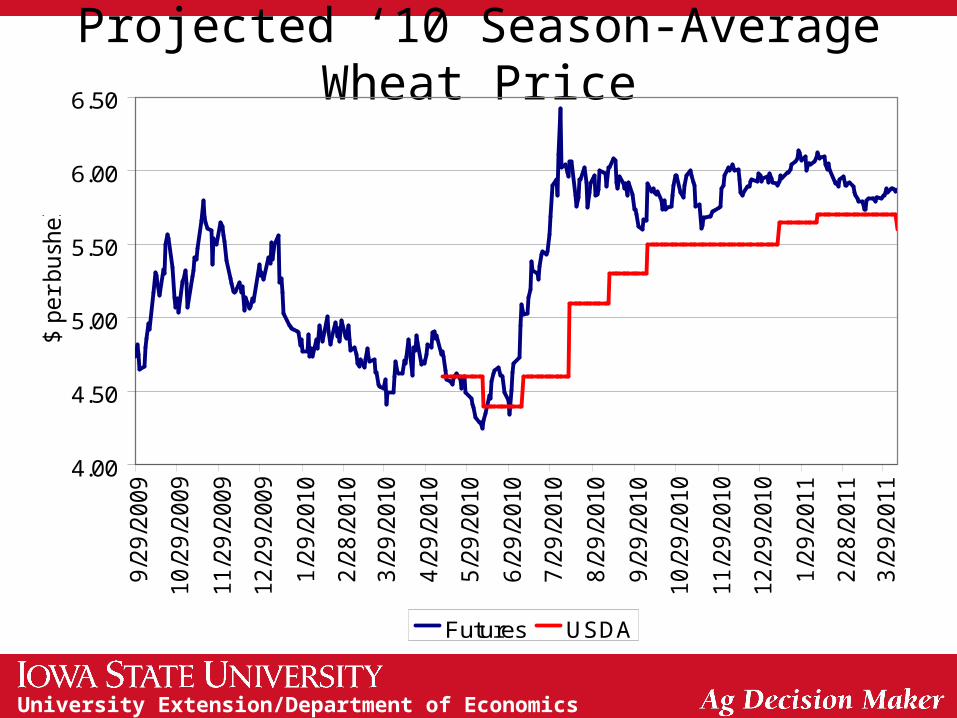
Projected ‘10 Season-Average Wheat Price
4.00
4.50
5.00
5.50
6.00
6.50
9/2
9/2
009
10/2
9/2
00
9
11/2
9/2
00
9
12/2
9/2
00
9
1/2
9/2
010
2/2
8/2
010
3/2
9/2
010
4/2
9/2
010
5/2
9/2
010
6/2
9/2
010
7/2
9/2
010
8/2
9/2
010
9/2
9/2
010
10/2
9/2
01
0
11/2
9/2
01
0
12/2
9/2
01
0
1/2
9/2
011
2/2
8/2
011
3/2
9/2
011
$ p
er
bush
el
Futures USDA
University Extension/Department of Economics
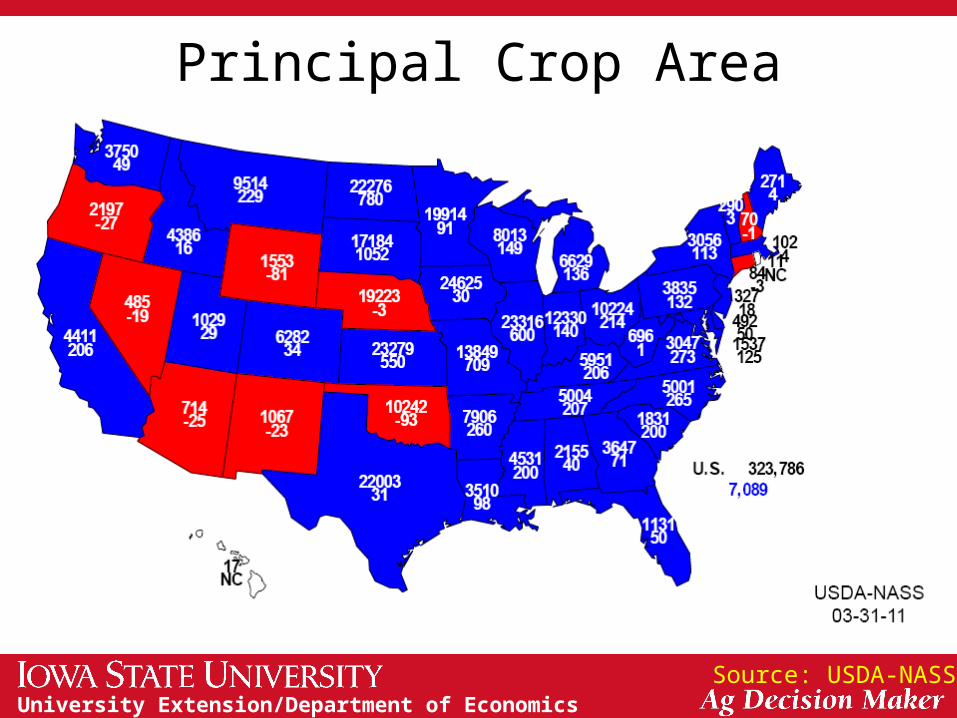
Principal Crop Area
Source: USDA-NASS
University Extension/Department of Economics
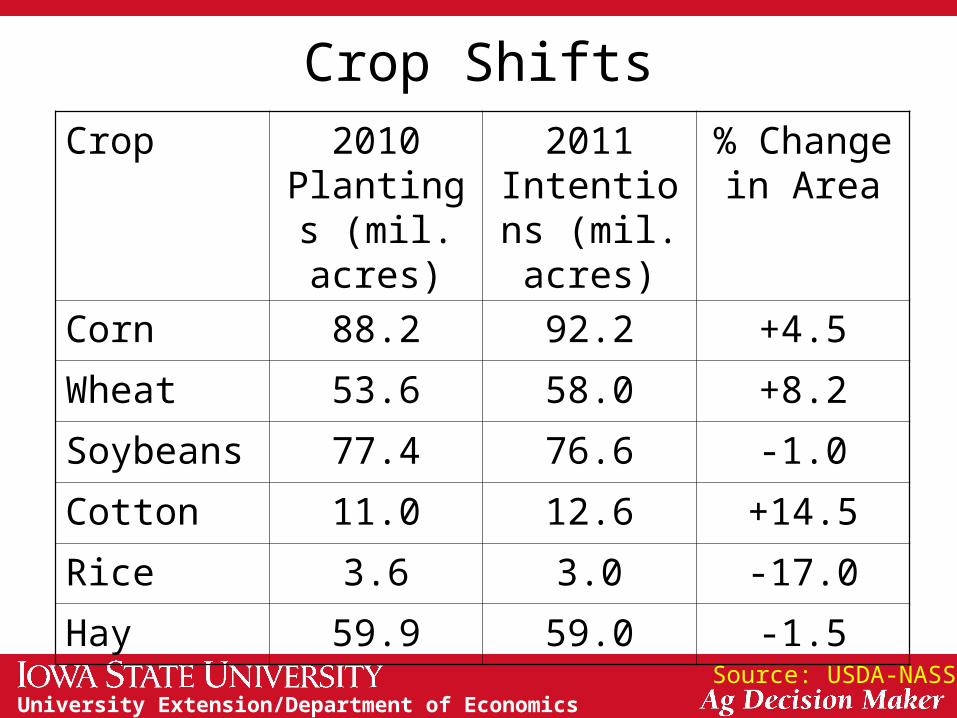
Crop Shifts
Source: USDA-NASS
Crop 2010 Plantings
(mil. acres)
2011 Intentions
(mil. acres)
% Change in Area
Corn 88.2 92.2 +4.5
Wheat 53.6 58.0 +8.2
Soybeans 77.4 76.6 -1.0
Cotton 11.0 12.6 +14.5
Rice 3.6 3.0 -17.0
Hay 59.9 59.0 -1.5
University Extension/Department of Economics
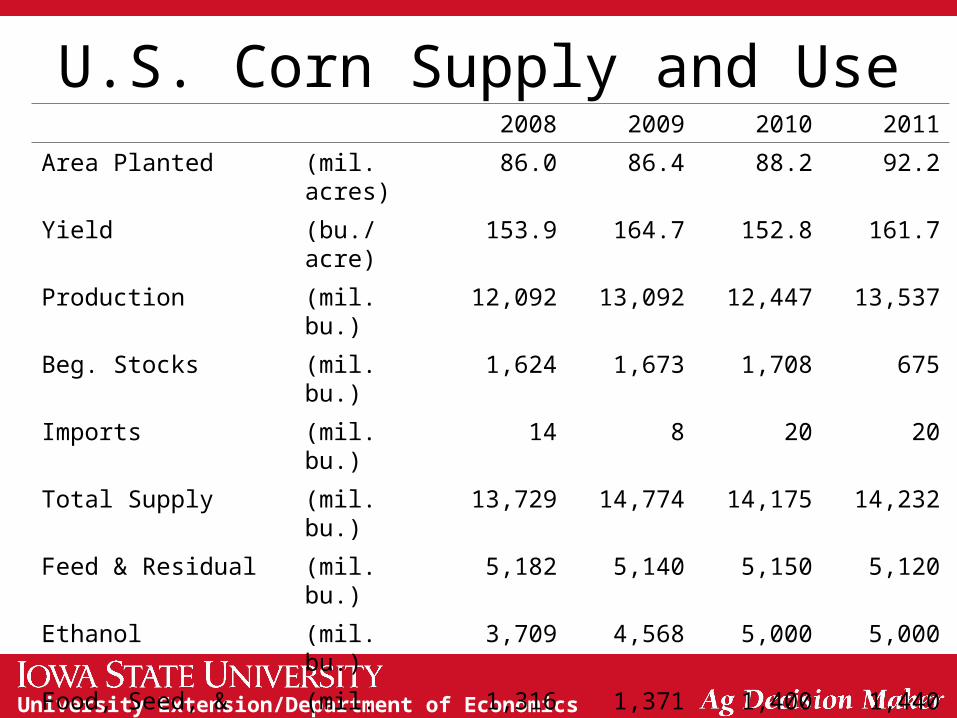
U.S. Corn Supply and Use2008 2009 2010 2011
Area Planted (mil. acres) 86.0 86.4 88.2 92.2
Yield (bu./acre) 153.9 164.7 152.8 161.7
Production (mil. bu.) 12,092 13,092 12,447 13,537
Beg. Stocks (mil. bu.) 1,624 1,673 1,708 675
Imports (mil. bu.) 14 8 20 20
Total Supply (mil. bu.) 13,729 14,774 14,175 14,232
Feed & Residual (mil. bu.) 5,182 5,140 5,150 5,120
Ethanol (mil. bu.) 3,709 4,568 5,000 5,000
Food, Seed, & Other (mil. bu.) 1,316 1,371 1,400 1,440
Exports (mil. bu.) 1,849 1,987 1,950 2,000
Total Use (mil. bu.) 12,056 13,066 13,500 13,560
Ending Stocks (mil. bu.) 1,673 1,708 675 672
Season-Average Price ($/bu.) 4.06 3.55 5.40 ?.??
University Extension/Department of Economics
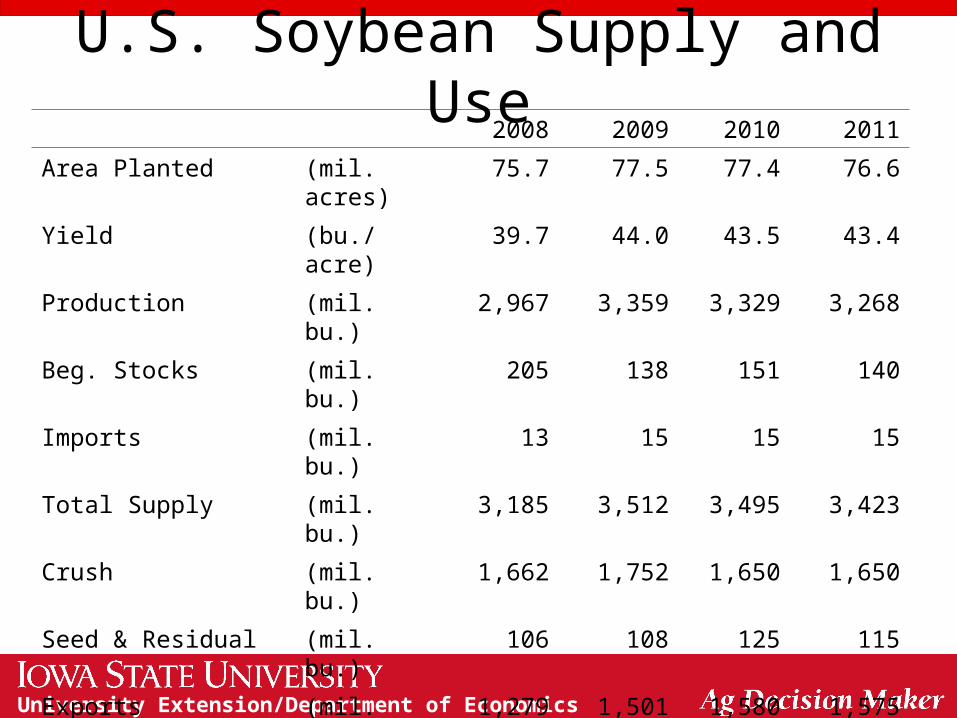
U.S. Soybean Supply and Use2008 2009 2010 2011
Area Planted (mil. acres) 75.7 77.5 77.4 76.6
Yield (bu./acre) 39.7 44.0 43.5 43.4
Production (mil. bu.) 2,967 3,359 3,329 3,268
Beg. Stocks (mil. bu.) 205 138 151 140
Imports (mil. bu.) 13 15 15 15
Total Supply (mil. bu.) 3,185 3,512 3,495 3,423
Crush (mil. bu.) 1,662 1,752 1,650 1,650
Seed & Residual (mil. bu.) 106 108 125 115
Exports (mil. bu.) 1,279 1,501 1,580 1,575
Total Use (mil. bu.) 3,047 3,361 3,355 3,340
Ending Stocks (mil. bu.) 138 151 140 83
Season-Average Price ($/bu.) 9.97 9.59 11.50 ??.??
University Extension/Department of Economics
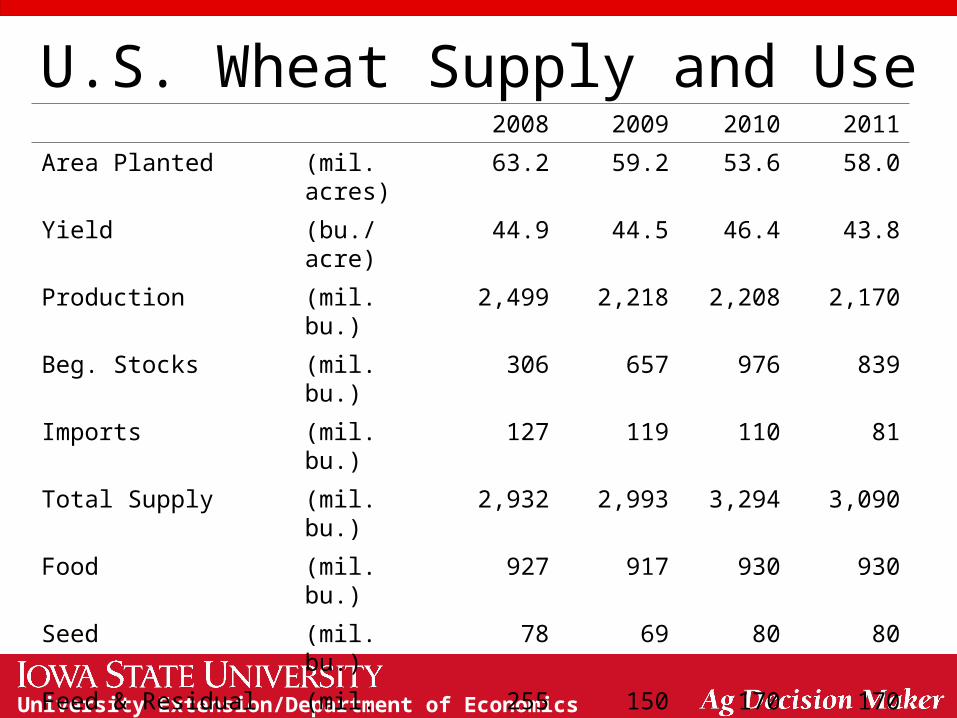
U.S. Wheat Supply and Use2008 2009 2010 2011
Area Planted (mil. acres) 63.2 59.2 53.6 58.0
Yield (bu./acre) 44.9 44.5 46.4 43.8
Production (mil. bu.) 2,499 2,218 2,208 2,170
Beg. Stocks (mil. bu.) 306 657 976 839
Imports (mil. bu.) 127 119 110 81
Total Supply (mil. bu.) 2,932 2,993 3,294 3,090
Food (mil. bu.) 927 917 930 930
Seed (mil. bu.) 78 69 80 80
Feed & Residual (mil. bu.) 255 150 170 170
Exports (mil. bu.) 1,015 881 1,275 1,150
Total Use (mil. bu.) 2,275 2,018 2,455 2,330
Ending Stocks (mil. bu.) 657 976 839 760
Season-Average Price ($/bu.) 6.78 4.87 5.60 ?.??
University Extension/Department of Economics
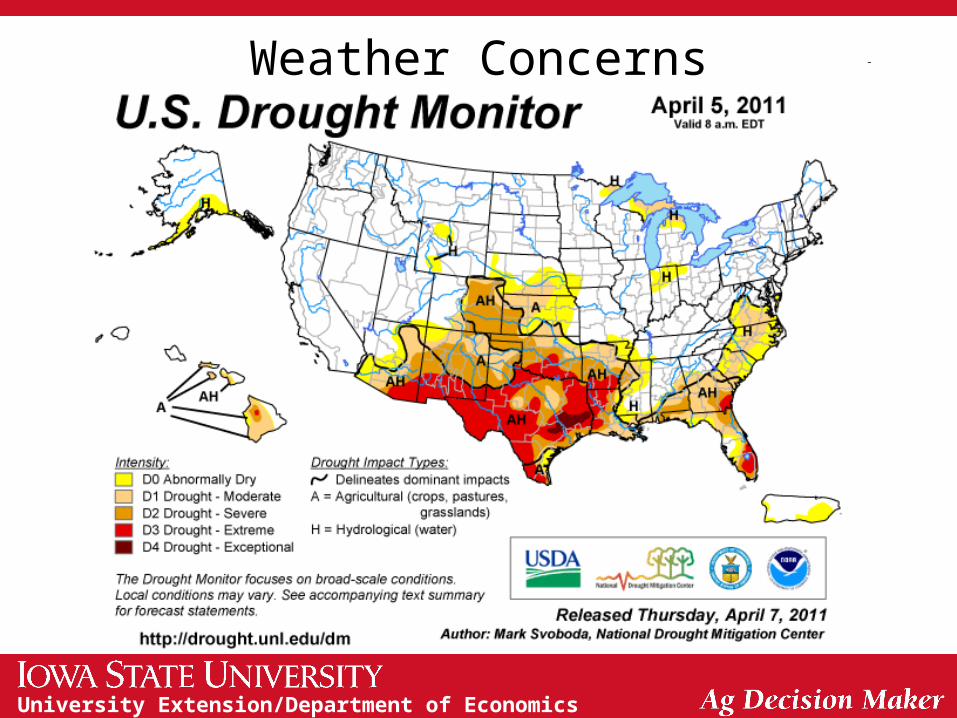
Weather Concerns
University Extension/Department of Economics
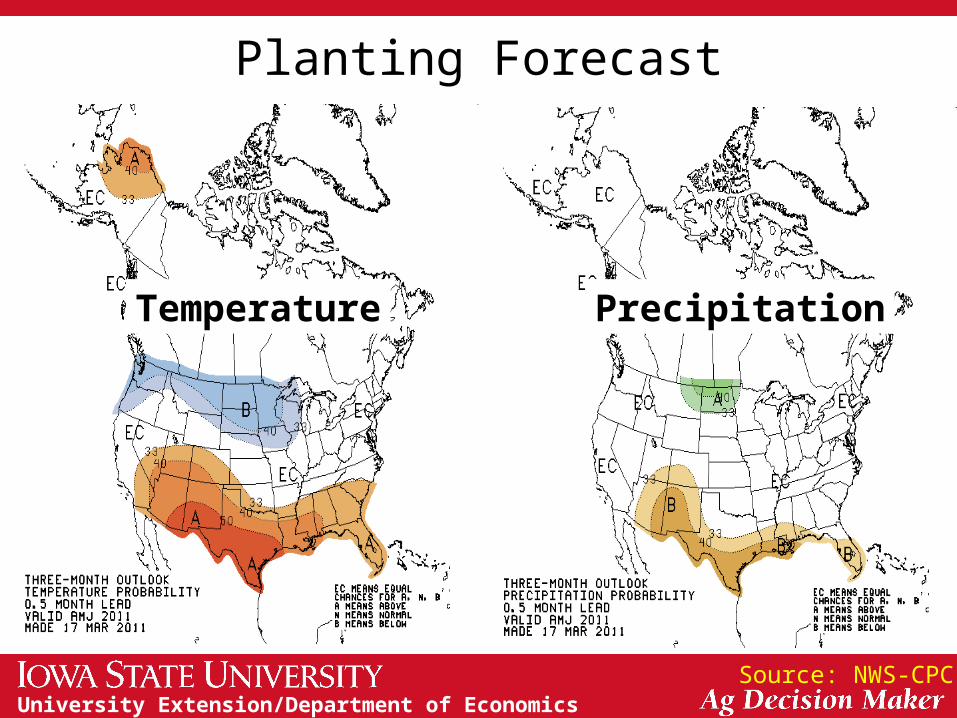
Planting Forecast
Temperature Precipitation
Source: NWS-CPC
University Extension/Department of Economics
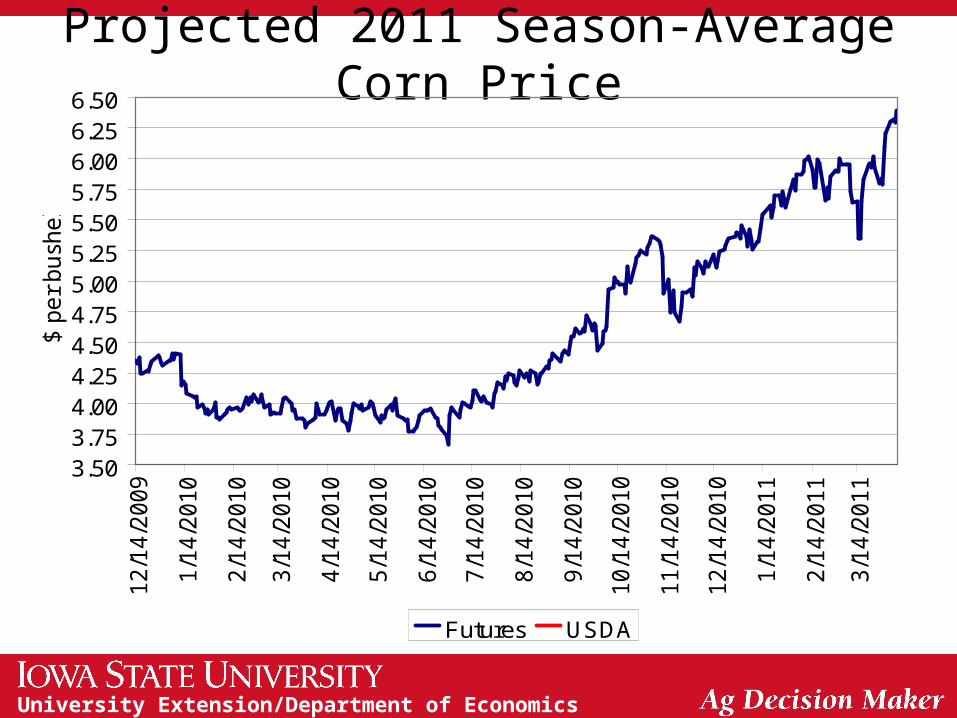
Projected 2011 Season-Average Corn Price
3.503.754.004.254.504.755.005.255.505.756.006.256.50
12/1
4/2
00
9
1/1
4/2
010
2/1
4/2
010
3/1
4/2
010
4/1
4/2
010
5/1
4/2
010
6/1
4/2
010
7/1
4/2
010
8/1
4/2
010
9/1
4/2
010
10/1
4/2
01
0
11/1
4/2
01
0
12/1
4/2
01
0
1/1
4/2
011
2/1
4/2
011
3/1
4/2
011
$ p
er
bush
el
Futures USDA
University Extension/Department of Economics
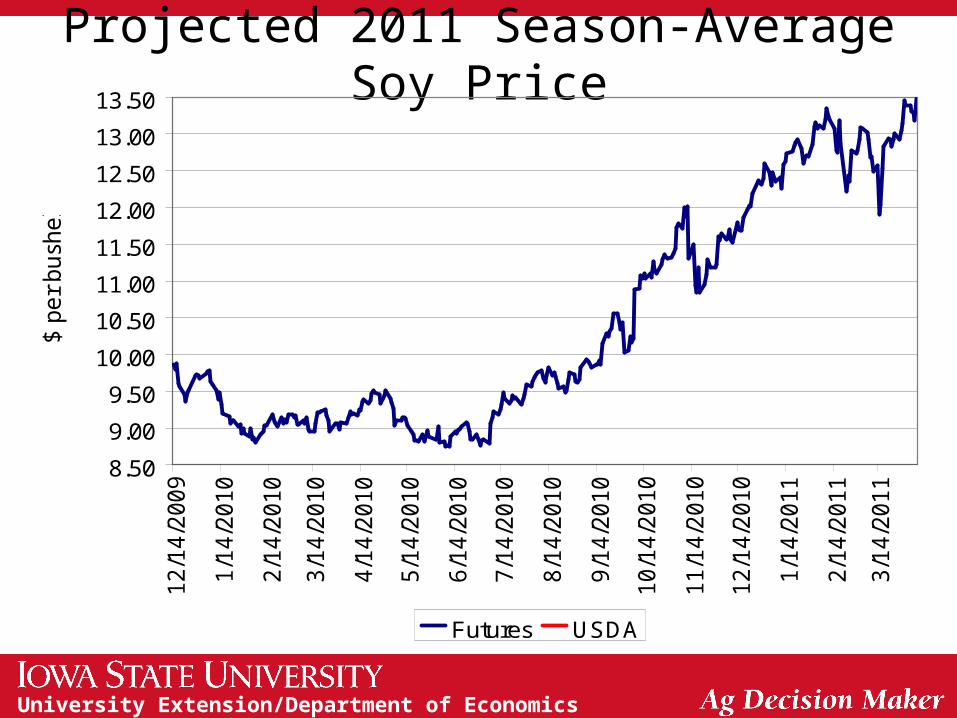
Projected 2011 Season-Average Soy Price
8.50
9.00
9.50
10.00
10.50
11.00
11.50
12.00
12.50
13.00
13.50
12/1
4/2
00
9
1/1
4/2
010
2/1
4/2
010
3/1
4/2
010
4/1
4/2
010
5/1
4/2
010
6/1
4/2
010
7/1
4/2
010
8/1
4/2
010
9/1
4/2
010
10/1
4/2
01
0
11/1
4/2
01
0
12/1
4/2
01
0
1/1
4/2
011
2/1
4/2
011
3/1
4/2
011
$ p
er
bush
el
Futures USDA
University Extension/Department of Economics
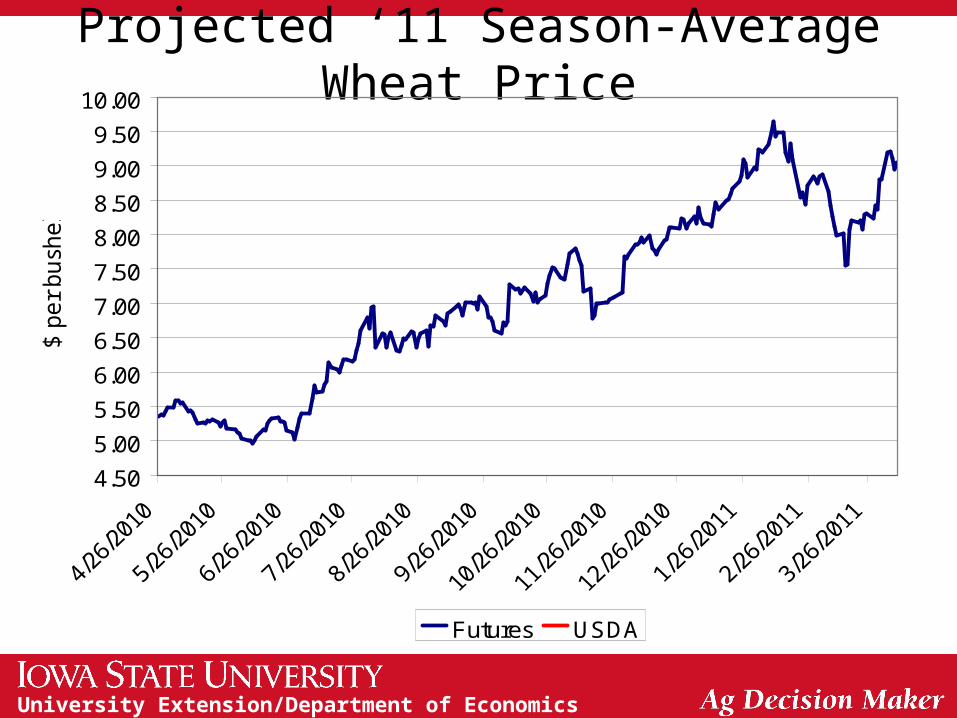
Projected ‘11 Season-Average Wheat Price
4.50
5.00
5.50
6.00
6.50
7.00
7.50
8.00
8.50
9.00
9.50
10.00
$ p
er
bush
el
Futures USDA
University Extension/Department of Economics
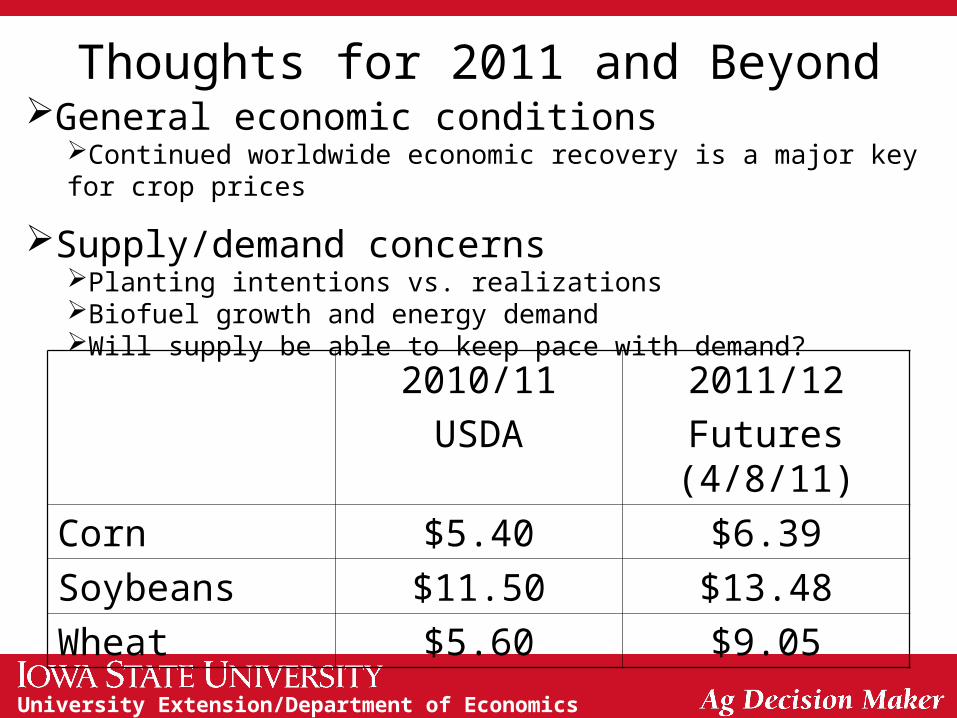
Thoughts for 2011 and BeyondGeneral economic conditions
Continued worldwide economic recovery is a major key for crop prices
Supply/demand concernsPlanting intentions vs. realizationsBiofuel growth and energy demandWill supply be able to keep pace with demand?
2010/11
USDA
2011/12
Futures (4/8/11)
Corn $5.40 $6.39
Soybeans $11.50 $13.48
Wheat $5.60 $9.05

University Extension/Department of Economics
Thank you for your time!
Any questions?
My web site:http://www.econ.iastate.edu/~chart/
Iowa Farm Outlook:http://www.econ.iastate.edu/ifo/
Ag Decision Maker:http://www.extension.iastate.edu/agdm/