04 - Senthilkumar - 3.12.2013 - APEM journal
11
231 Advances in Production Engineering & Management ISSN 1854-6250 Volume 8 | Number 4 | December 2013 | pp 231–241 Journal home: apem-journal.org http://dx.doi.org/10.14743/apem2013.4.170 Original scientific paper An ANN approach for predicting the cutting inserts performances of different geometries in hard turning Senthilkumar, N. a,* , Tamizharasan, T. b , Anandakrishnan, V. c a Adhiparasakthi Engineering College, Melmaruvathur, TamilNadu, India – 603319 b TRP Engineering College, Irungalur, Tiruchirappalli, TamilNadu, India – 621105 c National Institute of Technology, Tiruchirappalli, TamilNadu, India – 620015 A B S T R A C T A R T I C L E I N F O In this work an artificial intelligent (AI) technique viz. artificial neural network (ANN) is applied for predicting output responses such as wear occurring at the flank face of the cutting insert and the roughness of the machined workpiece's surface during the hard turning process. The experiments were designed using Taguchi’s design of experiments (DoE) and suitable L18 orthogonal array (OA) was selected for the chosen parameters: cutting speed, feed rate, depth of cut, material hardness, cutting insert shape, relief angle, and nose radius. They are varied through three different levels. 18 different ISO designated cutting in- serts were used for conducting the experiments on a CNC turning centre. An ANN model consisting of two hidden layers with 15 neurons each was mod- elled based on the complexity of the work. From the 18 experimental data, a set of 12 data was used for training the framed model and a set of 6 data for testing. An overall R-squared value of 0.9926 obtained during training the data showed the supremacy of the ANN technique. From the obtained results, it is obvious that the neural network models can be successfully used for predict- ing the output responses without performing the experiments. © 2013 PEI, University of Maribor. All rights reserved. Keywords: Hard turning Flank wear Surface roughness Artificial neural network *Corresponding author: [email protected] (Senthilkumar, N.) Article history: Received 21 January 2012 Revised 22 November 2013 Accepted 25 November 2013 1. Introduction Hard machining is mainly a finishing or semi-finishing process used to machine workpieces hav- ing hardness 190-326 BHN where higher dimensional tolerances and accuracy has to be achieved. Case-hardened steel components having typical hardness-depth of just over 1 mm, giv- ing it a wear resistant case and a tough core used in automobile axles are the typical example of hard machining that are converted from grinding process. [1]. Hard turning can provide a rela- tively high accuracy for many hard parts but sometimes important problems arise with surface integrity, especially with undesirable patterns of residual stresses and the changes of subsurface microstructure, so-called white layer, which reduces the fatigue life of turned surfaces [2]. In particular, the hard cutting process performed with ceramic or CBN tools can often cut manufac- turing costs, decrease production time (lead time), improve overall product quality, offer greater flexibility and allow dry machining by eliminating coolants. By local plastic deformation some amount of material is removed from the cutting tool causing damage. Therefore, the flank wear occurring at the tool chip interface have to be periodically monitored. As the flank wear in- creases, the surface roughness on the machined surface of the specimen also increases in most of the cases.
Transcript of 04 - Senthilkumar - 3.12.2013 - APEM journal
231
Advances in Production Engineering & Management ISSN 1854-6250
Volume 8 | Number 4 | December 2013 | pp 231–241 Journal home: apem-journal.org
http://dx.doi.org/10.14743/apem2013.4.170 Original scientific paper
An ANN approach for predicting the cutting inserts
performances of different geometries in hard turning
Senthilkumar, N.a,*
, Tamizharasan, T.b, Anandakrishnan, V.
c
aAdhiparasakthi Engineering College, Melmaruvathur, TamilNadu, India – 603319
bTRP Engineering College, Irungalur, Tiruchirappalli, TamilNadu, India – 621105
cNational Institute of Technology, Tiruchirappalli, TamilNadu, India – 620015
A B S T R A C T A R T I C L E I N F O
In this work an artificial intelligent (AI) technique viz. artificial neural network
(ANN) is applied for predicting output responses such as wear occurring at the
flank face of the cutting insert and the roughness of the machined workpiece's
surface during the hard turning process. The experiments were designed using
Taguchi’s design of experiments (DoE) and suitable L18 orthogonal array (OA)
was selected for the chosen parameters: cutting speed, feed rate, depth of cut,
material hardness, cutting insert shape, relief angle, and nose radius. They are
varied through three different levels. 18 different ISO designated cutting in-
serts were used for conducting the experiments on a CNC turning centre. An
ANN model consisting of two hidden layers with 15 neurons each was mod-
elled based on the complexity of the work. From the 18 experimental data, a
set of 12 data was used for training the framed model and a set of 6 data for
testing. An overall R-squared value of 0.9926 obtained during training the data
showed the supremacy of the ANN technique. From the obtained results, it is
obvious that the neural network models can be successfully used for predict-
ing the output responses without performing the experiments.
© 2013 PEI, University of Maribor. All rights reserved.
Keywords:
Hard turning
Flank wear
Surface roughness
Artificial neural network
*Corresponding author:
(Senthilkumar, N.)
Article history:
Received 21 January 2012
Revised 22 November 2013
Accepted 25 November 2013
1. Introduction
Hard machining is mainly a finishing or semi-finishing process used to machine workpieces hav-
ing hardness 190-326 BHN where higher dimensional tolerances and accuracy has to be
achieved. Case-hardened steel components having typical hardness-depth of just over 1 mm, giv-
ing it a wear resistant case and a tough core used in automobile axles are the typical example of
hard machining that are converted from grinding process. [1]. Hard turning can provide a rela-
tively high accuracy for many hard parts but sometimes important problems arise with surface
integrity, especially with undesirable patterns of residual stresses and the changes of subsurface
microstructure, so-called white layer, which reduces the fatigue life of turned surfaces [2]. In
particular, the hard cutting process performed with ceramic or CBN tools can often cut manufac-
turing costs, decrease production time (lead time), improve overall product quality, offer greater
flexibility and allow dry machining by eliminating coolants. By local plastic deformation some
amount of material is removed from the cutting tool causing damage. Therefore, the flank wear
occurring at the tool chip interface have to be periodically monitored. As the flank wear in-
creases, the surface roughness on the machined surface of the specimen also increases in most of
the cases.

Senthilkumar, Tamizharasan, Anandakrishnan
232 Advances in Production Engineering & Management 8(4) 2013
A neural network model mimics the human brain function which consists of larger number of neurons. The network in the brain is called biological neural network, whereas we build artificial neural networks for solving physical problems. The ANN may be very different from a biological neural network. Neural networks are systems which can acquire, store and utilize knowledge gained from experience. Neural network techniques have been found capable of learning from a dataset to describe the non-linear and interaction effects with great success.
The important requirement of ANN is the amount of data required for training the model. The total data by which the neural network understands the relation between the variables is called training data. After the network has been trained based on the training data, it has to be tested with a few data called testing data. If a set of training data is large, then a better neural network model can be developed [3].
Jackson et al. [4] determined the amount of wear on small milling cutter designed using a neural image-processing program and developed a program for compensating it. Özel et al. [5] investigated the surface finish and tool flank wear in finish turning AISI D2 steel with multi-radii design inserts using neural network model and multiple linear regression model and found that neural network model is superior. Wang et al. [6] designed a novel but simple neural network-based generalized optimal estimator for CBN tool wear prediction in hard turning by using an extended Kalman filter algorithm as the network-training algorithm. Abburi and Dixit [7] devel-oped a knowledge-based system for predicting the surface roughness in turning using neural networks and fuzzy-set based rule generation module and compared it with the experimental data.
Karayel [8] proposed an ANN and control algorithm for predicting surface roughness values corresponding to the cutting parameters and suitable cutting parameters for a certain surface roughness. Nalbant et al. [9] has machined AISI 1030 steel using uncoated, PVD- and CVD-coated cemented carbide inserts, predicted the surface roughness values by various algorithms, and found that scaled conjugate gradient is found to be accurate. Paulo Davim et al. [10] investigated the effects of cutting conditions during turning free machining steel 9SMnPb28k (DIN) and re-veals that cutting speed and feed rate have significant effects in reducing the surface roughness. Yilmaz et al. [11] predicted the surface roughness of an extruded PA6G cast polyamide for the machining tests by means of neural network approach method on machining of an engineering plastic material.
Caydas and Hascalik [12] developed ANN and regression model were developed to predict surface roughness in abrasive water jet machining (AWJ) process and concluded that the per-formance of regression model is slightly better compared to the ANN model. Asilturk and Cunkas [132] predicted the surface roughness of AISI 1040 steel during turning using ANN and multiple regression method by training the system through conducting experiments by full factorial de-sign. Patowari et al. [14] proposed a model to predict the surface modification phenomenon by EDM with artificial neural networks.
Sarkar et al. [15] developed an appropriate machining strategy for a maximum process crite-ria yield using a feed forward back-propagation neural to model the WEDM machining process. Umbrello et al. [16] proposed a predictive hybrid model based on the ANN and finite element method (FEM) that can be used for both forward and inverse prediction of residual stresses on machined surface and subsurface. Umbrello et al. [17] predicted the subsurface residual stresses using ANN approach used for both forward and reverse predictions in hard machining of 52100 bearing steel.
ANN mimics the behaviour of human brain and likewise non-traditional optimization tech-niques such as genetic algorithm mimics the genetic behaviour of human system and swarm intelligence mimic the nature of group of birds flying in search for their food and simulated an-nealing technique mimics the annealing process of heat treatment. In this, ANN models are used for predicting the output responses depending on the training provided to the model. But other techniques such as genetic algorithm, swarm intelligence and simulated annealing are used for optimizing the output responses. Researchers couple these optimization techniques with ANN model to train their operator values during optimization.
Most of the researchers uses ANN models to predict the responses accurately rather than multiple linear regression models and some researchers have used a hybrid of ANN models with
An ANN approach for predicting the cutting inserts performances of different geometries in hard turning
Advances in Production Engineering & Management 8(4) 2013 233
other techniques viz. finite element models, optimization techniques and fuzzy logic to predict the best input variables for these methods. For training the ANN models mostly researchers have used one hidden layer to reduce the computational time. But in this work we have used two hidden layers to increase the perfection of predicting the result. Also to the best of our knowl-edge researchers have not considered the geometrical parameters that we have chosen for our work along with different workpiece materials and machining parameters.
Researchers compare ANN technique with multiple linear regression models for predicting the output responses. In multiple linear regression models the R-squared value obtained cannot be altered. But in ANN model, upon several training of the network the R-squared value can be significantly altered and in most of the cases it settles around 1, which is highly acceptable. The main drawback of ANN technique is, it has to be trained several times so that a better network model can be developed which increases the computational time.
In this work 18 different ISO designated cutting inserts are chosen for machining which has different included angle viz. C shaped diamond inserts (included angle 80°), D shaped diamond inserts (included angle 55°) and S shaped square inserts (included angle 90°), relief angle for cutting insert are selected as 0°, 3° and 7° and the nose radii for cutting inserts are 0.4 mm, 0.8 mm and 1.2 mm. For each experiments comprising of various combinations of cutting speed, feed rate, depth of cut [18], workpiece material a separate cutting insert of different shape, relief angle and nose radius is used.
2. Workpiece and cutting insert material
The workpiece materials chosen for this analysis are practically used as wheel axles of medium and heavy-duty automobile vehicles. The chemical compositions and hardness values of the se-lected specimens are shown in Table 1.
Table 1 Chemical composition and hardness of workpiece materials
No. Element present % of composition
Material A Material B Material C 1 Carbon 0.369 0.384 0.439 2 Silicon 0.212 0.253 0.174 3 Manganese 1.503 1.485 0.787 4 Chromium 0.000 0.109 0.183 5 Nickel 0.000 0.039 0.038 6 Aluminium 0.018 0.014 0.032 7 Copper 0.037 0.125 0.119 8 Tungsten 0.031 0.027 0.037 9 Vanadium 0.001 0.003 0.001 10 Phosphorous 0.020 0.027 0.023 11 Sulphur 0.031 0.020 0.033 12 Iron Remaining Remaining Remaining
Brinell hardness (BHN) 512 448 522
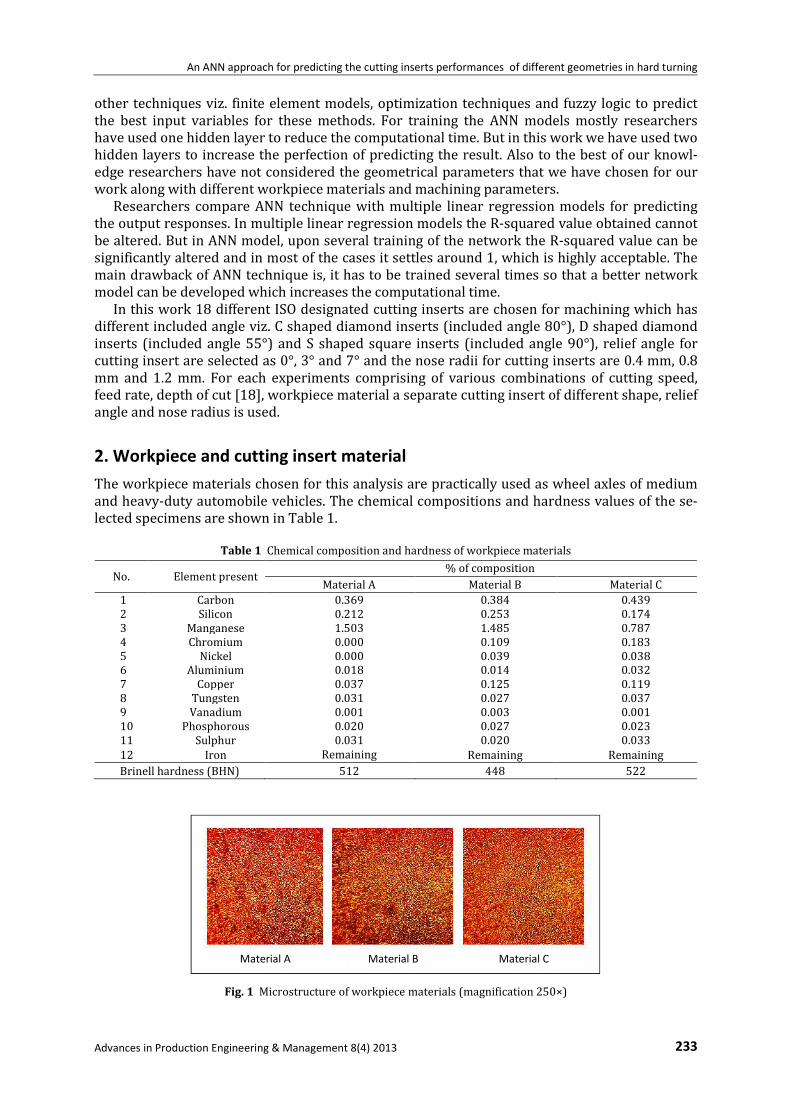
Fig. 1 Microstructure of workpiece materials (magnification 250×)
Material A Material B Material C
Senthilkumar, Tamizharasan, Anandakrishnan
234 Advances in Production Engineering & Management 8(4) 2013
Table 2 Chemical composition of cutting insert
No. Element present % of composition
1 Tungsten carbide 96.4 2 Tantalum carbide 0.8 3 Titanium carbide 0.5 4 Cobalt 2.19
The microstructure of the workpiece materials chosen are shown in Fig. 1. The microstruc-ture of the induction hardened material A, which is used as the wheel axle of Ambassador Car is a fine tempered martensite and the matrix is almost free from the presence of undissolved fer-rite. The microstructure of the induction hardened material B, which is used as the wheel axle of Standard jeep is a fine tempered martensite and the matrix shows the presence of some undis-solved ferrite. The microstructure of the induction hardened material C, which is used as the wheel axle of Ashok Leyland Bus is a fine tempered martensite and the matrix shows almost free from the presence of undissolved ferrite.
The cutting inserts selected for this work is uncoated cemented carbide insert, WIDIA – THM grade of hardness 1433 BHN, whose chemical composition are shown in Table 2.
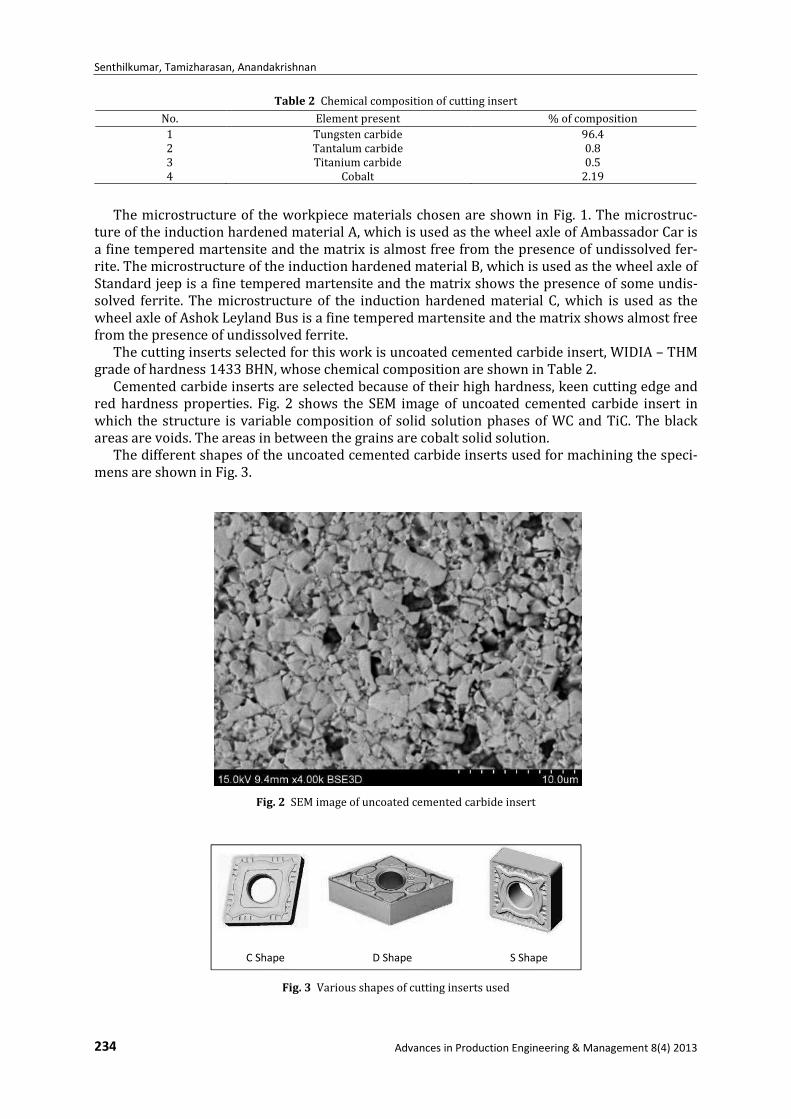
Cemented carbide inserts are selected because of their high hardness, keen cutting edge and red hardness properties. Fig. 2 shows the SEM image of uncoated cemented carbide insert in which the structure is variable composition of solid solution phases of WC and TiC. The black areas are voids. The areas in between the grains are cobalt solid solution.
The different shapes of the uncoated cemented carbide inserts used for machining the speci-mens are shown in Fig. 3.
Fig. 2 SEM image of uncoated cemented carbide insert
Fig. 3 Various shapes of cutting inserts used
C Shape D Shape S Shape
An ANN approach for predicting the cutting inserts performances of different geometries in hard turning
Advances in Production Engineering & Manag
3. Experimental setup and methodology
The experiments are conducted on a CNC turning centre, Lokeshdiameter 350 mm, between centre 600kW. After performing the machining process, the flank wear is measured and recorded by using a Mitutoyo digital tool maker’s microscope of field diameter 13 mm, objective 2roughness values of the machined surfaces are recorded by using a Kosaka LaboraSurfcorder SE1200 with a vertical measuring range of 520mm, vertical resolution of 0.008equipment’s used for measuring flank wear and surface roughness values.
Fig. 4 Flank wear and surface roughness measuring instruments
3.1 Taguchi’s design of experiment
The Taguchi’s DoE is a powerful tool in quality optimization. to study many factors simultaneously and most economically. By studying the effects of indiviual factors on the results, the best factor combination can be determined. When applied to a dsign, the technique helps to seek technique makes use of a special design of orthogonal atics through a minimal number of experiments [OA for seven parameters varied through three levels. The control parameters and their levels chosen are shown in Table 3.
For various combinations of input parameters and their level values, the inner Larray is formulated and the ISO insert desiidentified as shown in Table 4.
No. Parameter / Level
1 Cutting speed (m/min)2 Feed rate (mm/rev) 3 Depth of cut (mm) 4 Material 5 Cutting insert shape 6 Relief angle (°) 7 Nose radius (mm)
An ANN approach for predicting the cutting inserts performances of different geometries in hard turning
Management 8(4) 2013
Experimental setup and methodology
The experiments are conducted on a CNC turning centre, Lokesh make 2 axis CNC TLmm, between centre 600 mm, spindle speed 4500 rpm, main motor power of 11
kW. After performing the machining process, the flank wear is measured and recorded by using a Mitutoyo digital tool maker’s microscope of the following specifications:
mm, objective 2�, working distance 67 mm, total magnification 30roughness values of the machined surfaces are recorded by using a Kosaka Labora
with a vertical measuring range of 520 µm, horizontal measuring range of 25mm, vertical resolution of 0.008 µm, cut-off value of 0.8 mm with Gaussian filter. Fig. 4 shows the equipment’s used for measuring flank wear and surface roughness values.
Flank wear and surface roughness measuring instruments
xperiment
The Taguchi’s DoE is a powerful tool in quality optimization. DoE is a statistical technique used to study many factors simultaneously and most economically. By studying the effects of indiviual factors on the results, the best factor combination can be determined. When applied to a dsign, the technique helps to seek out the best design among the many alternatives [
kes use of a special design of orthogonal array to examine the quality characteritics through a minimal number of experiments [20-22]. Taguchi’s DoE is used to design the L
or seven parameters varied through three levels. The control parameters and their levels
For various combinations of input parameters and their level values, the inner Larray is formulated and the ISO insert designation for the corresponding cutting inserts are also
Table 3 Parameters and their level values
Level 1 Level 2
peed (m/min) 168 183 0.07 0.08
0.18 0.23 Material A Material B
C (Diamond 80°) D (Diamond 55°) 0 3
0.4 0.8
An ANN approach for predicting the cutting inserts performances of different geometries in hard turning
235
make 2 axis CNC TL-20, swing mm, spindle speed 4500 rpm, main motor power of 11
kW. After performing the machining process, the flank wear is measured and recorded by using eyepiece 15�, view
mm, total magnification 30�. Surface roughness values of the machined surfaces are recorded by using a Kosaka Laboratory Ltd make
µm, horizontal measuring range of 25 off value of 0.8 mm with Gaussian filter. Fig. 4 shows the
is a statistical technique used to study many factors simultaneously and most economically. By studying the effects of individ-ual factors on the results, the best factor combination can be determined. When applied to a de-
out the best design among the many alternatives [19]. Taguchi’s rray to examine the quality characteris-
]. Taguchi’s DoE is used to design the L18 or seven parameters varied through three levels. The control parameters and their levels
For various combinations of input parameters and their level values, the inner L18 orthogonal gnation for the corresponding cutting inserts are also
Level 3
198 0.1
0.28 Material C
S (Square 90°) 7
1.2
Senthilkumar, Tamizharasan, Anandakrishnan
236
No. Machining parameters
Cutting speed
(m/min)
Feed rate (mm/rev)
Depth of cut (mm)
1 168 0.07 2 168 0.08 3 168 0.10 4 183 0.07 5 183 0.08 6 183 0.10 7 198 0.07 8 198 0.08 9 198 0.10
10 168 0.07 11 168 0.08 12 168 0.10 13 183 0.07 14 183 0.08 15 183 0.10 16 198 0.07 17 198 0.08 18 198 0.10
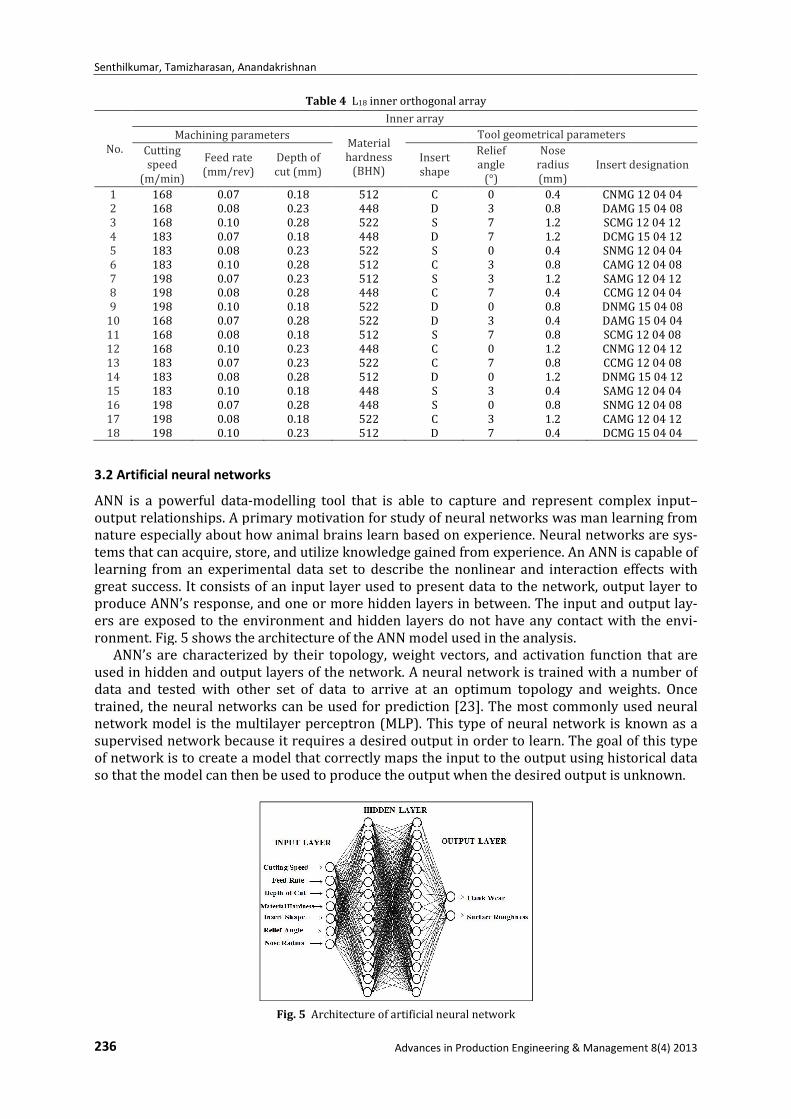
3.2 Artificial neural networks
ANN is a powerful data-modelling tool that is able to capture and represent complex inputoutput relationships. A primary motivation for study of neural networks was man learning from nature especially about how animal brains learn based on tems that can acquire, store, and utilize knowledge gained from experience. An ANN is capable of learning from an experimental data set to describe the nonlinear and interaction effects with great success. It consists of an input layer used to present data to the network, output layer to produce ANN’s response, and one or more hidden layers in between. The input and output laers are exposed to the environment and hidden layers do not have any contact with the envronment. Fig. 5 shows the architecture of the ANN model used in the analysis.
ANN’s are characterized by their topology, weight vectors, and activation function that are used in hidden and output layers of the network. A neural network is trained with a number ofdata and tested with other set of data to arrive at an optimum topology and weights. Once trained, the neural networks can be used for prediction [network model is the multilayer perceptron (MLP). This type of neural netsupervised network because it requires a desired output in order to learn. The goal of this type of network is to create a model that correctly maps the input to the output using historical data so that the model can then be used to prod
Fig. 5
Senthilkumar, Tamizharasan, Anandakrishnan
Advances in Production Engineering &
Table 4 L18 inner orthogonal array
Inner array
arameters Material hardness
(BHN)
Tool geometrical p
Depth of ut (mm)
Insert shape
Relief angle
(°)
Nose radius (mm)
0.18 512 C 0 0.4 0.23 448 D 3 0.8 0.28 522 S 7 1.2 0.18 448 D 7 1.2 0.23 522 S 0 0.4 0.28 512 C 3 0.8 0.23 512 S 3 1.2 0.28 448 C 7 0.4 0.18 522 D 0 0.8 0.28 522 D 3 0.4 0.18 512 S 7 0.8 0.23 448 C 0 1.2 0.23 522 C 7 0.8 0.28 512 D 0 1.2 0.18 448 S 3 0.4 0.28 448 S 0 0.8 0.18 522 C 3 1.2 0.23 512 D 7 0.4
modelling tool that is able to capture and represent complex inputoutput relationships. A primary motivation for study of neural networks was man learning from nature especially about how animal brains learn based on experience. Neural networks are sytems that can acquire, store, and utilize knowledge gained from experience. An ANN is capable of learning from an experimental data set to describe the nonlinear and interaction effects with
an input layer used to present data to the network, output layer to produce ANN’s response, and one or more hidden layers in between. The input and output laers are exposed to the environment and hidden layers do not have any contact with the env
Fig. 5 shows the architecture of the ANN model used in the analysis.ANN’s are characterized by their topology, weight vectors, and activation function that are
used in hidden and output layers of the network. A neural network is trained with a number ofdata and tested with other set of data to arrive at an optimum topology and weights. Once trained, the neural networks can be used for prediction [23]. The most commonly used neural network model is the multilayer perceptron (MLP). This type of neural netsupervised network because it requires a desired output in order to learn. The goal of this type of network is to create a model that correctly maps the input to the output using historical data so that the model can then be used to produce the output when the desired output is unknown.
Fig. 5 Architecture of artificial neural network
ing & Management 8(4) 2013
Tool geometrical parameters
Insert designation
CNMG 12 04 04 DAMG 15 04 08 SCMG 12 04 12 DCMG 15 04 12 SNMG 12 04 04 CAMG 12 04 08 SAMG 12 04 12 CCMG 12 04 04 DNMG 15 04 08 DAMG 15 04 04 SCMG 12 04 08 CNMG 12 04 12 CCMG 12 04 08 DNMG 15 04 12 SAMG 12 04 04 SNMG 12 04 08 CAMG 12 04 12 DCMG 15 04 04
modelling tool that is able to capture and represent complex input–output relationships. A primary motivation for study of neural networks was man learning from
experience. Neural networks are sys-tems that can acquire, store, and utilize knowledge gained from experience. An ANN is capable of learning from an experimental data set to describe the nonlinear and interaction effects with
an input layer used to present data to the network, output layer to produce ANN’s response, and one or more hidden layers in between. The input and output lay-ers are exposed to the environment and hidden layers do not have any contact with the envi-
Fig. 5 shows the architecture of the ANN model used in the analysis. ANN’s are characterized by their topology, weight vectors, and activation function that are
used in hidden and output layers of the network. A neural network is trained with a number of data and tested with other set of data to arrive at an optimum topology and weights. Once
]. The most commonly used neural network model is the multilayer perceptron (MLP). This type of neural network is known as a supervised network because it requires a desired output in order to learn. The goal of this type of network is to create a model that correctly maps the input to the output using historical data
uce the output when the desired output is unknown.

An ANN approach for predicting the cutting inserts performances of different geometries in hard turning
Advances in Production Engineering & Management 8(4) 2013 237
The back-propagation is a popular learning method of the multi-layered neural network. The forward path computing of the multi-layered neural network is performed with each layer fully connected to the next layer.
In this work, the input layer consists of seven input neurons; two intermediate hidden layers with 15 neurons each and output layer with two neurons to be predicted is chosen. The number of neurons in the hidden layer is calculated as,
������������ �ℎ ��������� = {�2 � ������ ����������� + 1} (1)
The flank wear and surface roughness values [24-29] are predicted as a function of cutting speed, feed rate, depth of cut, material hardness, cutting insert shape, relief angle and nose ra-dius. In this work, feed forward-back propagation network type is selected. A traingdm training function of neurons is selected, which is based on gradient-descent method. The transfer function used is sigmoidal function. The output of the sigmoidal function is in the form:
������ = 11 + exp�−" � #����� (2)
where S is a constant. From the 18 experiments conducted, 12 sets of input values and output values are used for training the network and for testing the remaining six sets of input parame-ters are used. The network learning process is supervised, i.e., the network receives (at training phase) both the raw data as inputs and the targets as output. The learning involves adjusting weights so that errors will be minimized. The function used to measure errors is usually the sum-of-squares. For an input pattern x and the associated target t, the sum-of-squares error function E (W) (E is dependent on all weights W) is defined as:
$�%� = 12&'()*�+� −�*�+�,-./
*01 (3)
where ZLq is the output of neuron q from the output layer, i.e., the component q of the output vector [30].
4. Results and discussion
With the designed OA, experiments are conducted and the output quality characteristics flank wear and surface roughness for all experimental test conditions are determined, which are re-corded in Table 5.
Table 5 Quality characteristics of L18 orthogonal array
Trial No. Flank wear (mm) Surface roughness (µm)
1 0.240 1.395 2 0.063 0.946 3 0.479 0.917 4 0.085 1.763 5 2.370 0.391 6 0.564 0.464 7 0.979 2.150 8 0.189 1.263 9 0.972 2.156
10 0.646 1.642 11 1.172 0.576 12 0.686 1.956 13 0.848 1.095 14 0.112 0.695 15 1.219 2.21 16 2.098 1.335 17 0.963 0.359 18 0.306 1.482
Senthilkumar, Tamizharasan, Anandakrishnan
238 Advances in Production Engineering & Management 8(4) 2013
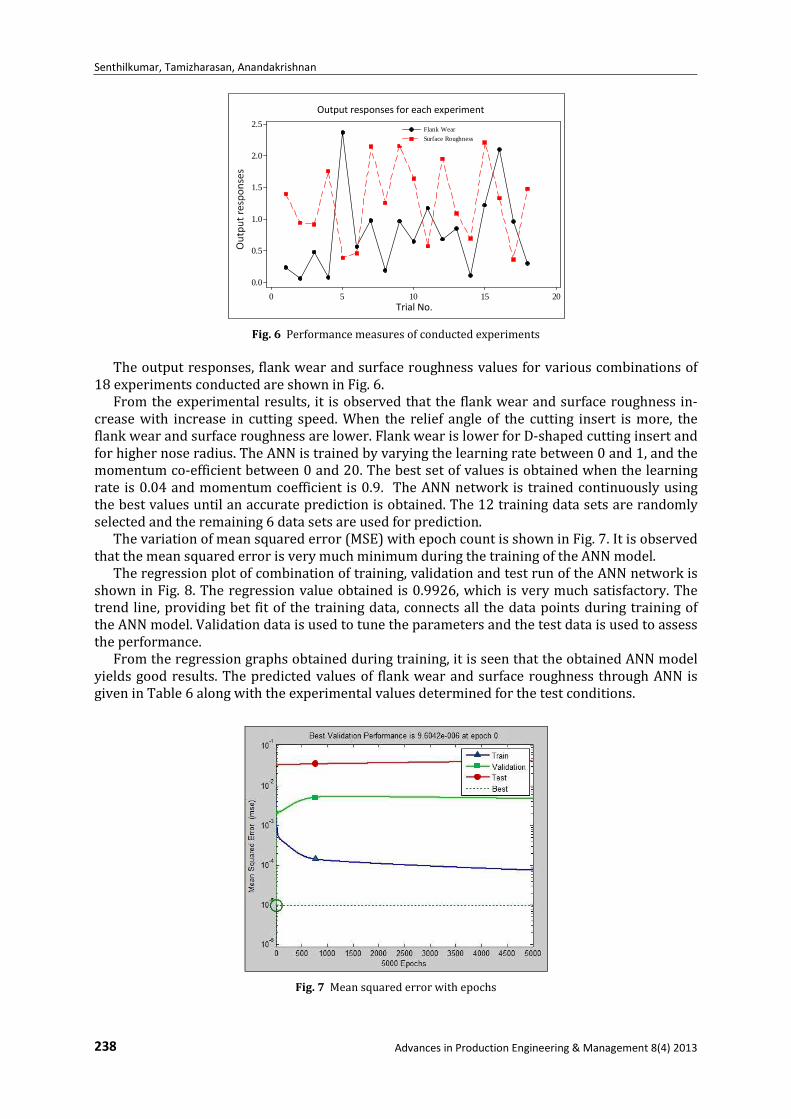
Fig. 6 Performance measures of conducted experiments
The output responses, flank wear and surface roughness values for various combinations of
18 experiments conducted are shown in Fig. 6. From the experimental results, it is observed that the flank wear and surface roughness in-
crease with increase in cutting speed. When the relief angle of the cutting insert is more, the flank wear and surface roughness are lower. Flank wear is lower for D-shaped cutting insert and for higher nose radius. The ANN is trained by varying the learning rate between 0 and 1, and the momentum co-efficient between 0 and 20. The best set of values is obtained when the learning rate is 0.04 and momentum coefficient is 0.9. The ANN network is trained continuously using the best values until an accurate prediction is obtained. The 12 training data sets are randomly selected and the remaining 6 data sets are used for prediction.
The variation of mean squared error (MSE) with epoch count is shown in Fig. 7. It is observed that the mean squared error is very much minimum during the training of the ANN model.
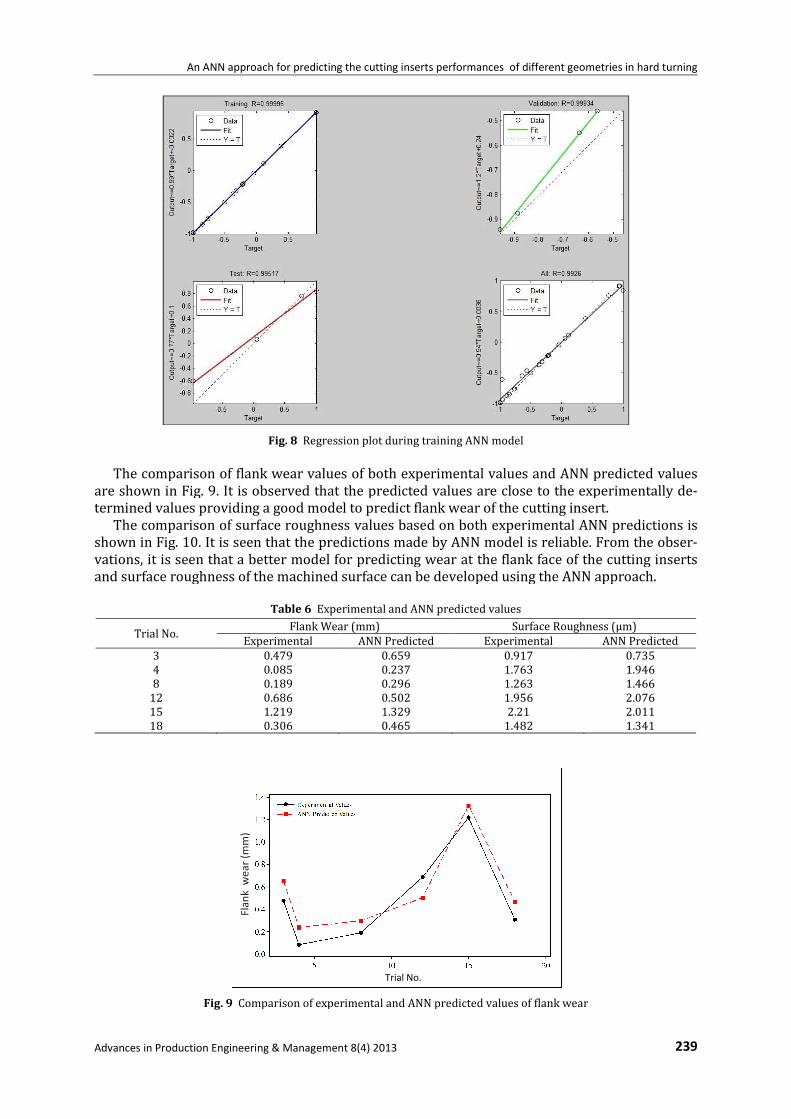
The regression plot of combination of training, validation and test run of the ANN network is shown in Fig. 8. The regression value obtained is 0.9926, which is very much satisfactory. The trend line, providing bet fit of the training data, connects all the data points during training of the ANN model. Validation data is used to tune the parameters and the test data is used to assess the performance.
From the regression graphs obtained during training, it is seen that the obtained ANN model yields good results. The predicted values of flank wear and surface roughness through ANN is given in Table 6 along with the experimental values determined for the test conditions.
Fig. 7 Mean squared error with epochs
20151050
2.5
2.0
1.5
1.0
0.5
0.0
Trial No
Out
put
Res
pons
es
Flank Wear
Surface Roughness
Output responses for each experiment
Output responses for each experiment
Trial No.
An ANN approach for predicting the cutting inserts performances of different geometries in hard turning
Advances in Production Engineering & Manag
Fig. 8
The comparison of flank wear values of both experimental values and ANN predicted values
are shown in Fig. 9. It is observed that the predicted values are close to the experimentally dtermined values providing a good model
The comparison of surface roughness values based on both experimental ANN predictions is shown in Fig. 10. It is seen that the predictions made by ANN model is reliable.vations, it is seen that a better model for predicting wear at the flank face of the cutting inserts and surface roughness of the machined surface can be developed using the ANN approach.
Table 6
Trial No. Experimental
3 0.4794 0.0858 0.189
12 0.68615 1.21918 0.306
Fig. 9 Comparison of experimental and
An ANN approach for predicting the cutting inserts performances of different geometries in hard turning
Management 8(4) 2013
Fig. 8 Regression plot during training ANN model
The comparison of flank wear values of both experimental values and ANN predicted values are shown in Fig. 9. It is observed that the predicted values are close to the experimentally dtermined values providing a good model to predict flank wear of the cutting insert.
The comparison of surface roughness values based on both experimental ANN predictions is shown in Fig. 10. It is seen that the predictions made by ANN model is reliable.
a better model for predicting wear at the flank face of the cutting inserts and surface roughness of the machined surface can be developed using the ANN approach.
Table 6 Experimental and ANN predicted values
Flank Wear (mm) Surface Roughness (Experimental ANN Predicted Experimental
0.479 0.659 0.917 0.085 0.237 1.763 0.189 0.296 1.263 0.686 0.502 1.956 1.219 1.329 2.21 0.306 0.465 1.482
Comparison of experimental and ANN predicted values of flank wear
Trial No.
An ANN approach for predicting the cutting inserts performances of different geometries in hard turning
239
The comparison of flank wear values of both experimental values and ANN predicted values are shown in Fig. 9. It is observed that the predicted values are close to the experimentally de-
to predict flank wear of the cutting insert. The comparison of surface roughness values based on both experimental ANN predictions is
shown in Fig. 10. It is seen that the predictions made by ANN model is reliable. From the obser-a better model for predicting wear at the flank face of the cutting inserts
and surface roughness of the machined surface can be developed using the ANN approach.
Surface Roughness (µm) ANN Predicted
0.735 1.946 1.466 2.076 2.011 1.341
predicted values of flank wear

Senthilkumar, Tamizharasan, Anandakrishnan
240 Advances in Production Engineering & Management 8(4) 2013
Fig. 10 Comparison of experimental and ANN predicted values of surface roughness
5. Conclusion
This analysis predicts the effects of machining and geometrical parameters on flank wear and surface roughness in hard turning processes using ANN technique. Some of the outcomes of this work are,
• An L18 OA is formulated using Taguchi’s DoE for seven input parameters varied through three levels for all possible combinations and the experiments are conducted on a CNC turning centre.
• For training the neural network data, a set of 12 data is randomly chosen from the de-signed 18 experiments and the remaining set of 6 data is used for testing the developed ANN model and prediction is carried out. Network model with two hidden layers are cho-sen with 15 neurons in each layer, based on the complexity of the problem and number of data for testing the models.
• The problem encountered with the ANN models are that they must be retrained several times to obtain accurate results. An R-squared value of 0.0026 is obtained which is a bet-ter one for prediction of output responses flank wear and surface roughness.
• The average % of error for the flank wear and surface roughness is 22.24 and –2.69, respec-tively, which is an acceptable prediction error. Results predicted by neural network model are compared with the experimental results, which show that the predicted values are closer to the experimental values showing the supremacy of the system.
• A graphical user interface may be developed for predicting the responses, which will be a user friendly approach for future work and many other cutting insert geometrical parame-ters should be considered for better performance of cutting inserts.
References
[1] Astakhov, V.P. (2011). Machining of hard materials – Definitions and industrial applications, In: Davim, J. P. (ed.), Machining of hard materials, Springer, London, 1-32.
[2] Grzesik, W. (2008). Machining of hard materials, In: Paulo Davim, J. (ed.), Machining fundamentals and recent
advances, Springer-Verlag London Limited, 97-126. [3] Dixit, P.M., Dixit, U.S. (2008). Modeling of metal forming and machining processes by finite element and soft com-
puting methods, Springer-Verlag London. [4] Jackson, M.J., Robinson, G.M., Hyde, L.J., Rhodes, R. (2006). Neural image processing of the wear of cutting tools
coated with thin films, Journal of Materials Engineering and Performance, Vol. 15, No. 2, 223-229, doi: 10.1361/105994906X95922.
[5] Özel, T., Karpat, Y., Figueira, L., Davim, J.P. (2007). Modelling of surface finish and tool flank wear in turning of AISI D2 steel with ceramic wiper inserts, Journal of Materials Processing Technology, Vol. 189, No. 1-3, 192-198, doi: 10.1016/j.jmatprotec.2007.01.021.
2015105
2.4
2.2
2.0
1.8
1.6
1.4
1.2
1.0
0.8
0.6
Trial No
Surf
ace
Rou
ghne
ss (
mic
rons
)
Experimental ValuesANN Predicted Values
Comparison of Experimental and ANN predicted values of Surface Roughness
Trial No.
An ANN approach for predicting the cutting inserts performances of different geometries in hard turning
Advances in Production Engineering & Management 8(4) 2013 241
[6] Wang, X., Wang, W., Huang, Y., Nguyen, N., Krishnakumar, K. (2008). Design of neural network-based estimator for tool wear modeling in hard turning, Journal of Intelligence manufacturing, Vol. 19, No. 4, 383-396, doi: 10.1007/s10845-008-0090-8.
[7] Abburi, N.R., Dixit, U.S. (2006). A knowledge-based system for the prediction of surface roughness in turning process, Robotics and Computer-Integrated Manufacturing, Vol. 22, No. 4, 363-372, doi: 10.1016/j.rcim. 2005.08.002.
[8] Karayel, D. (2009). Prediction and control of surface roughness in CNC lathe using artificial neural network, Journal of Materials Processing Technology, Vol. 209, No. 7, 3125-3137, doi: 10.1016/j.jmatprotec.2008.07.023.
[9] Nalbant, M., Gökkaya, H., Toktaş, İ., Sur, G. (2009). The experimental investigation of the effects of uncoated, PVD- and CVD-coated cemented carbide inserts and cutting parameters on surface roughness in CNC turning and its prediction using artificial neural networks, Robotics and Computer-Integrated Manufacturing, Vol. 25, No. 1, 211-223, doi: 10.1016/j.rcim.2007.11.004.
[10] Davim, J.P., Gaitonde, V.N., Karnik, S.R. (2008). Investigations into the effect of cutting conditions on surface roughness in turning of free machining steel by ANN models, Journal of Materials Processing Technology, Vol. 205, No. 1-3, 16-23, doi: 10.1016/j.jmatprotec.2007.11.082.
[11] Yilmaz, S., Arici, A.A., Feyzullahoglu, E. (2011). Surface roughness prediction in machining of cast polyamide using neural network, Neural Computing & Applications, Vol. 20, No. 8, 1249-1254, doi: 10.1007/s00521-011-0557-y.
[12] Çaydaş, U., Hasçalık, A. (2008). A study on surface roughness in abrasive water jet machining process using arti-ficial neural networks and regression analysis method, Journal of Materials Processing Technology, Vol. 202, No. 1-3, 574-582, doi: 10.1016/j.jmatprotec.2007.10.024.
[13] Asiltürk, İ., Çunkaş, M. (2011). Modeling and prediction of surface roughness in turning operations using artifi-cial neural network and multiple regression method, Expert Systems with Applications, Vol. 38, No. 5, 5826-5832, doi: 10.1016/j.eswa.2010.11.041.
[14] Patowari, P.K., Saha, P., Mishra, P.K. (2010). Artificial neural network model in surface modification by EDM using tungsten-copper powder metallurgy sintered electrodes, The International Journal of Advanced Manufac-
turing Technology, Vol. 51, No. 5-8, 627-638, doi: 10.1007/s00170-010-2653-z. [15] Sarkar, S., Mitra, S., Bhattacharyya, B. (2006). Parametric optimisation of wire electrical discharge machining of γ
titanium aluminide alloy through an artificial neural network model, International Journal of Advanced Manufac-
turing Technology, Vol. 27, No. 5-6, 501-508, doi: 10.1007/s00170-004-2203-7. [16] Umbrello, D., Ambrogio, G., Filice, L., Shivpuri, R. (2008). A hybrid finite element method–artificial neural net-
work approach for predicting residual stresses and the optimal cutting conditions during hard turning of AISI 52100 bearing steel, Materials & Design, Vol. 29, No. 4, 873-883, doi: 10.1016/j.matdes.2007.03.004.
[17] Umbrello, D., Ambrogio, G., Filice, L., Shivpuri, R. (2007). An ANN approach for predicting subsurface residual stresses and the desired cutting conditions during hard turning, Journal of Materials Processing Technology, Vol. 189, No. 1-3, 143-152, doi: 10.1016/j.jmatprotec.2007.01.016.
[18] Walsh, R.A. (2001). Handbook of machining and metalworking calculations, McGraw-Hill, USA. [19] Roy, R.K. (2001). Design of experiments using the Taguchi approach: 16 steps to product and process improvement,
John Wiley & Sons, Inc., USA. [20] Senthilkumar, N., Tamizharasan, T. (2012). Impact of interface temperature over flank wear in hard turning
using carbide inserts, Procedia Engineering, Vol. 38, 613-621, doi: 10.1016/j.proeng.2012.06.076. [21] Tamizharasan, T., Senthilkumar, N. (2012). Analysis of surface roughness and material removal rate in turning
using Taguchi’s technique, In: Proceedings of IEEE – International Conference on Advances in Engineering, Science
and Management, EGS Pillay Engineering College, Nagapattinam, 231-236. [22] Nalbant, M., Gökkaya, H., Sur, G. (2007). Application of Taguchi method in the optimization of cutting parameters
for surface roughness in turning, Materials & Design, Vol. 28, 1379-1385, doi: 10.1016/j.matdes.2006.01.008. [23] Venkata Rao, R. (2011). Advanced Modeling and Optimization of Manufacturing Processes: International Research
and Development, Springer London, 10.1007/978-0-85729-015-1. [24] Jafarian, F., Taghipour, M., Amirabadi, H. (2013). Application of artificial neural network and optimization algo-
rithms for optimizing surface roughness, tool life and cutting forces in turning operation, Journal of Mechanical
Science and Technology, Vol. 27, No. 5, 1469-1477, doi: 10.1007/s12206-013-0327-0. [25] Siddhpura, A., Paurobally, R. (2013). A review of flank wear prediction methods for tool condition monitoring in
a turning process, The International Journal of Advanced Manufacturing Technology, Vol. 65, No. 1-4, 371-393, doi: 10.1007/s00170-012-4177-1.
[26] Natarajan, C., Muthu, S., Karuppuswamy, P. (2011). Prediction and analysis of surface roughness characteristics of a non-ferrous material using ANN in CNC turning, The International Journal of Advanced Manufacturing
Technology, Vol. 57, No. 9-12, 1043-1051, doi: 10.1007/s00170-011-3343-1. [27] Upadhyay, V., Jain, P.K., Mehta, N.K. (2013). In-process prediction of surface roughness in turning of Ti–6Al–4V
alloy using cutting parameters and vibration signals, Measurement, Vol. 46, No. 1, 154-160, doi: 10.1016/ j.measurement.2012.06.002.
[28] Ahilan, C., Kumanan, S., Sivakumaran, N., Edwin Raja Dhas, J. (2013). Modeling and prediction of machining qual-ity in CNC turning process using intelligent hybrid decision making tools, Applied Soft Computing, Vol. 13, No. 3, 1543-1551, doi: 10.1016/j.asoc.2012.03.071.
[29] Attanasio, A., Ceretti, E., Giardini, C. (2013). Analytical models for tool wear prediction during AISI 1045 turning operations, Procedia CIRP, Vol. 8, 218-223.
[30] Hristev, R.M. (1998). The ANN Book, Edition 1, GNU Public License, Ver. 2.


![[XLS] · Web viewLATHA DINDIGUL Dindigul -Urban DUDLEY HSS,DINDIGUL SARAVANAN G GANESH M PARIMALA G GOKULAPRIYA S SENTHILKUMAR KRISHNAVENI S Edappadi GGHSS EDAPPADI PRIYADHARSHINI](https://static.fdocuments.in/doc/165x107/5afd67cd7f8b9a8b4d8d7e5b/xls-viewlatha-dindigul-dindigul-urban-dudley-hssdindigul-saravanan-g-ganesh.jpg)