บทความวิจัย The Determinants of Sticky Cost Behavior: A ... · ป ที่...
33
บทความวิจัย ปที่ 8 ฉบับที่ 23 ธันวาคม 2555 หนา 29-61 วารสารวิชาชีพบัญชี The Determinants of Sticky Cost Behavior: A Structural Equation Modeling Approach Nuchjaree Pichetkun* Panarat Panmanee, Ph.D.** * Assistant Professor of Accounting and Finance Department, Faculty of Business Administration at Rajamangala University of Technology Thanyaburi ** Associate Professor of Accounting and Finance Department, Faculty of Business Administration at Rajamangala University of Technology Thanyaburi การงานวิจัยนี้ศึกษาปจจัยในการกําหนดพฤติกรรมตนทุนที่ไมสมมาตรของบริษัท จดทะเบียนในตลาดหลักทรัพยแหงประเทศไทยโดยวิธีโมเดลสมการโครงสราง โปรแกรมที่นํา มาใชในการพัฒนาตัวแบบพฤติกรรมตนทุนคือ โปรแกรม AMOS (Analysis of Moment Structures) ซึ่งไดนํามาใชในการสรางโมเดลการวัด เพื่อยืนยันตัวแปรแฝงของตัวแบบ พฤติกรรมตนทุนดวยวิธีการวิเคราะหปจจัยเชิงยืนยัน ผลการวิเคราะหแสดงใหเห็นวาโมเดล การวัดที่ไดมามีความเหมาะสมดี นอกจากนี้การวิเคราะหปจจัยเชิงสํารวจและการวิเคราะห ถดถอยพหุคูณไดนํามาใชเพื่อกําหนดปจจัยที่ทําใหเกิดความไมสมมาตรของตนทุน ผลการวิจัย พบวา ตนทุนในการปรับตัวและตนทุนตัวแทนมีผลทําใหระดับความไมสมมาตรของตนทุนเพิ่ม ขึ้น ในขณะที่ตนทุนทางการเมืองและบรรษัทภิบาลมีผลทําใหระดับความไมสมมาตรของตนทุน ลดลง ผลที่ไดจากการศึกษานี้จะมีประโยชนตอผูบริหารทําใหมีความเขาใจมากขึ้นเกี่ยวกับ พฤติกรรมตนทุนซึ่งเปนเรื่องที่มีความสําคัญตอผูบริหารสําหรับการวางแผน การควบคุมและ บทคัดยอ Download จาก..วารสารวิชาชีพบัญชี
Transcript of บทความวิจัย The Determinants of Sticky Cost Behavior: A ... · ป ที่...
บ ท ค ว า ม วิ จั ย
ป�ที่ 8 ฉบับที่ 23ธันวาคม 2555หน�า 29-61
วารสารวิชาชีพบัญชี
The Determinants of Sticky Cost Behavior:A Structural Equation Modeling Approach
Nuchjaree Pichetkun*
Panarat Panmanee, Ph.D.**
* Assistant Professor of Accounting and Finance Department,
Faculty of Business Administration at Rajamangala University of Technology Thanyaburi
** Associate Professor of Accounting and Finance Department,
Faculty of Business Administration at Rajamangala University of Technology Thanyaburi
การงานวิจัยน้ีศึกษาป�จจัยในการกําหนดพฤติกรรมต�นทุนท่ี ไม�สมมาตรของบริษัท
จดทะเบียนในตลาดหลักทรัพย�แห�งประเทศไทยโดยวิธีโมเดลสมการโครงสร�าง โปรแกรมที่นํา
มาใช�ในการพัฒนาตัวแบบพฤติกรรมต�นทุนคือ โปรแกรม AMOS (Analysis of Moment
Structures) ซึ่งได�นํามาใช�ในการสร�างโมเดลการวัด เพื่อยืนยันตัวแปรแฝงของตัวแบบ
พฤติกรรมต�นทุนด�วยวิธีการวิเคราะห�ป�จจัยเชิงยืนยัน ผลการวิเคราะห�แสดงให�เห็นว�าโมเดล
การวัดที่ ได�มามีความเหมาะสมดี นอกจากน้ีการวิเคราะห�ป�จจัยเชิงสํารวจและการวิเคราะห�
ถดถอยพหุคูณได�นํามาใช�เพื่อกําหนดป�จจัยท่ีทําให�เกิดความไม�สมมาตรของต�นทุน ผลการวิจัย
พบว�า ต�นทุนในการปรับตัวและต�นทุนตัวแทนมีผลทําให�ระดับความไม�สมมาตรของต�นทุนเพิ่ม
ขึ้น ในขณะที่ต�นทุนทางการเมืองและบรรษัทภิบาลมีผลทําให�ระดับความไม�สมมาตรของต�นทุน
ลดลง ผลที่ ได�จากการศึกษานี้จะมีประโยชน�ต�อผู�บริหารทําให�มีความเข�าใจมากขึ้นเกี่ยวกับ
พฤติกรรมต�นทุนซึ่งเป�นเร่ืองที่มีความสําคัญต�อผู�บริหารสําหรับการวางแผน การควบคุมและ
บทคัดย�อ
Down
load จ
าก..วา
รสารวิช
าชีพบัญ
ชี
30 วารสารวิชาชีพบัญชี ป�ที่ 8 ฉบับที่ 23 ธันวาคม 2555
บทความวิจัย
การกําหนดแนวทางลดต�นทุน นอกจากนี้ผลการศึกษายังเป�นประโยชน�ต�อผู�ลงทุนและนักวิเคราะห�ทางการเงินให�เข�าใจ
พฤติกรรมของผู�บริหารซึ่งเป�นข�อมูลที่สําคัญในการตัดสินใจลงทุน แต�ข�อมูลดังกล�าวไม�ได�เป�ดเผยไว�ในรายงานทางการ
เงินของบริษัทจดทะเบียน
คําสําคัญ: พฤติกรรมต�นทุนท่ีไม�สมมาตร พฤติกรรมต�นทุนยืดหยุ�นท่ีไม�สม่ําเสมอ วิธีโมเดลสมการโครงสร�างต�นทุนการปรับตัว ต�นทุนทางการเมือง ต�นทุนตัวแทน บรรษัทภิบาล
This study aimed to investigate the determinants of sticky cost behavior of Thai listed companies
by using the structural equation modeling (SEM) approach. In order to obtain the good-fit cost behavior
model, AMOS (Analysis of Moment Structures) program was used to construct the measurement models
to confirm the latent variables of cost behavior model through the confirmatory factor analysis (CFA).
The results indicated that the measurement models were good-fit models. The exploratory factor analysis
(EFA) and multiple regression analysis were utilized to specify the determinants of cost stickiness. The
results showed that adjustment costs and agency costs are positively associated with the degree of
cost stickiness, but political costs and corporate governance are negatively associated with the degree
of cost stickiness. These findings will contribute to management for understanding cost behavior which
is critical to mangers for planning, controlling and reducing costs. In addition, the result of this study
will also contribute to investors and financial analysts for understanding managers’ behavior, which is
useful information in making the investment decisions. However, it is not disclosed in financial reports.
Keywords: Sticky Cost Behavior, Asymmetrical Cost Behavior, Structural Equation Modeling,
Adjustment Costs, Political costs, Agency Costs, Corporate Governance
ABSTRACT
1. IntroductionThe more the international competition
increases, the more managers need cost management information. Managers are interested in estimating past cost-behavior patterns, since this information can help more accurate cost predictions concerning future cost for planning and decisions. An understanding of cost behavior is therefore critical for managers and accountants in providing
and using information to make effective decisions (Maher, Stickney, & Weil, 2008). From management perspective, “managers need to know how costs behave to make informed decision about products, to plan, and to evaluate performance” (Lanen, Shannon, & Maher, 2011, p. 51). The traditional model of cost behavior identifi es the separation of cost into fi xed and variable components. The variable costs change proportionately with changes Do
wnloa
d จาก.
.วารสา
รวิชาชีพ
บัญชี
ป�ที่ 8 ฉบับที่ 23 ธันวาคม 2555 วารสารวิชาชีพบัญชี 31
The Determinants of Sticky Cost Behavior: A Structural Equation Modeling Approach
in the activity volume, but the fi xed costs remain unchanged as the volume changes within the relevant range (Hilton, Maher, & Selto, 2008). The recent empirical research discovered that some costs (e.g., selling, general, and administrative costs, cost of goods sold and total operating costs) are sticky or asymmetric; that is, costs increase more when activity rises than they decrease when activity falls by an equivalent amount (Anderson, Banker, & Janakiraman, 2003). Therefore, costs do not always increase or decrease proportionally with the changing of activities. In applying cost estimation methods that based on traditional model of cost behavior in cost analysis such as cost-volume-profi t analysis, fl exible budgeting, and cost-plus pricing, it is necessary to consider whether costs behave mechanistically or sticky (Maher et al., 2008). Otherwise, managers may lose fi rm’s competitive advantage to the others who have the more accurate information.
From perspect ive of investors , the implication of determinants cost behavior may reveals management behavior and advantage of corporate governance that cannot be observed directly. Because cost behavior can be affected by management decision and information in company’s published fi nancial statements is the result of the decision made by managers. Moreover, fi nancial information can affect the distribution of wealth among investors, management and other stakeholders (Beaver, 1989).
Previous research has a major controversy about the determinants of cost stickiness phenomenon. Anderson et al. (2003) stated that
“sticky costs occur because managers deliberately adjust the resources committed to activities” (p. 47). Even though agency costs were mentioned, agency theory was not applied to examine the reasons for sticky costs. Chen, Lu, and Sougiannis (2008) expanded the research of Anderson et al. (2003) and found cost asymmetry or cost stickiness increases with managerial empire building incentive due to confl ict of interest between managers and shareholders. However, Anderson and Lanen (2007) found weak evidence of sticky costs. They revised the estimated models of previous research and considered the foundational model of economic production. Their paper suggested that the problem is in “ambiguity about what defi nes managerial discretion (cost management) and how managerial discretion about redeploying verves releasing resources interacts with recording costs in the accounting system…” (p. 29). Dierynck and Renders (2009) studied the relationship between labor cost asymmetry and earnings management incentive and found that the degree of cost asymmetry of companies, which have incentive to mange earnings, is declining. In summary, the academic research literature has not been able to provide strong evidence of the reasons of cost stickiness.
In addition, only few empirical researches provided evidence of the sticky cost behavior of Thai companies. To the best of knowledge there are no results in the recent literature regarding how both agency costs and political costs impact on cost stickiness. The purpose of this study was to construct a model to perform a comprehensive Do
wnloa
d จาก.
.วารสา
รวิชาชีพ
บัญชี
32 วารสารวิชาชีพบัญชี ป�ที่ 8 ฉบับที่ 23 ธันวาคม 2555
บทความวิจัย
investigation of sticky cost behavior. It fulfi lls a gap and attempts to contribute to knowledge base by exploring sticky cost behavior for developing a greater understanding of cost stickiness which is useful for not only managers but also accountants, investors, fi nancial analysts and the other users of fi nancial reports. These external users need information to help them make investment and credit decisions.
From methodological perspective, prior research used only multiple regression analysis to develop a cost behavior model. Multiple regression analysis is a method for a single model; there are one dependent variable and a number of independent variables. Because of limitation of multiple regression analysis, this study utilized a new method called structural equation modeling (SEM). Smith and Langfi eld-Smith (2004) suggested that SEM offers advantages over multiple regression analysis. It is the analysis of sets of relations between observed variables and latent variables which cannot be measured directly. Therefore, this research utilized SEM with AMOS program to study the proxy of agency costs and other latent variables for searching the causes of sticky cost behavior.
2. Literature Review and Hypothesis Development2.1 Empirical Evidence of Cost BehaviorEmpirical research found overhead costs
are not proportional to overhead activities by using cross-sectional data form 100 hospitals in Washington State at department level since 1989 and 1990 (Noreen & Soderstrom, 1994) and using
panel data from 108 hospitals in Washington State during 1977–1992 (Noreen & Soderstrom, 1997). Consequently, Noreen and Soderstrom (1997) confi rmed that costing systems which assume costs are proportional to activity will overstate relevant overhead costs for decision-making and performance evaluation purposes.
Anderson et al. (2003) introduced the concept of a sticky cost behavior. They examined cost behavior by using selling, general, and administrative (SG&A) costs and sales revenue of 7,629 fi rms over 20-year period (during 1979–1998). They found that SG&A costs are sticky; SG&A costs increased 0.55% per 1% increase in sales revenue but decreased only 0.35% per 1% decrease in sales revenue.
Several researches investigated cross-countries differences in sticky cost behavior. Medeiros and Costa (2004) studied the properties of sticky costs and the stickiness of SG&A costs in Brazilian companies and confirmed cost stickiness for Brazilian companies. Calleja, Steliaros, and Thomas (2006) used data for a sample of US, UK, French and German companies. The results found costs are stickier for French and German companies than for US and UK companies due to differences in the corporate governance regimes across these four countries. Banker and Chen (2006a) analyzed a sample of 19 OECD countries and recommended that labor market characteristics are signifi cant factors of across-country variations in the degree of cost stickiness.
In Asian countries, Yang, Lee, and Park (2005) inspected cost behavior of Korean general hospital, and found total costs, labor cost Do
wnloa
d จาก.
.วารสา
รวิชาชีพ
บัญชี
ป�ที่ 8 ฉบับที่ 23 ธันวาคม 2555 วารสารวิชาชีพบัญชี 33
The Determinants of Sticky Cost Behavior: A Structural Equation Modeling Approach
and administrative costs are sticky. The results provided strong support that the more hospitals have assets intensity or employees intensity, the more costs are sticky. Kuo (2007) found that SG&A costs of Taiwanese computer electronic industry are sticky; costs increased 0.470% per 1% increase in sales revenue but decreased only 0.316% per 1% decrease in sales revenue. Recent study on cost behavior of Japanese companies revealed that SG& A costs and cost of goods sold (COS) are sticky (Yasukata & Kajiwara, 2008).
The cost st ickiness researchers have attempted to fi nd the causes of cost stickiness. Prior research has been centered on economic factors which make managers to hesitate to adjust cost downward. In assessing the factors reducing of demand in the market, management considers measures of economic activity. A decline in demand is more likely to endure in periods of recession than in periods of economic growth. Anderson et al. (2003) used the percentage growth in real gross national product (GNP) as measure of economic growth and found that the degree of cost stickiness is greater in higher growth period. The same results in previous research, Banker and Chen (2006a) included variable measuring the rate of macroeconomic growth (GDP) to study cost stickiness of 19 OECD countries during 1996–2005.
In summary, prior research has found that: 1) cost behavior is sticky in different countries; 2) economic growth is the determinant of cost stickiness. Based on the discussion of empirical evidence of cost behavior, the following questions may be raised:
Q1: Is cost behavior of Thai listed companies sticky? and
Q2: Is cost behavior still sticky, after controlling for economic variables?
It is proposed that cost behavior of Thai listed companies is also sticky and cost behavior is still sticky, after controlling for economic variables. In accordance with these research questions, the study introduced the following hypotheses.
H1a: Cost behavior of Thai listed companies is sticky.
H2a: Cost behavior is still sticky, after controlling for economic variables.
2.2 Adjustment Cost TheoryThe cost of adjustment theory was introduced
by Lucas (1967). When a shock happens, a company cannot immediately change its factors of production without cost of adjustment. That is, changing the level of the production factors used is costly. Many researchers have adapted this concept to change circumstances such as changes of investment or capital (Mortensen, 1973; Epstien & Denny, 1986; Cooper & Haltiwanger, 2006; Groth & Khan, 2010), change of employment (Leitao, 2011; Nakamura, 1993) and changes of the level of inventories (Danziger, 2008).
Adjustment costs “are implicit, in that they result in lost output and are thus not measured and reported on income and expenditure statement generated by fi rm’s accounts” (Hamermesh & Pfann, 1996, p. 1267). If managers need to increase or decrease committed resources, adjustment costs will be incurred. Therefore, managers may be hesitant about cutting resources when sales decline.Do
wnloa
d จาก.
.วารสา
รวิชาชีพ
บัญชี
34 วารสารวิชาชีพบัญชี ป�ที่ 8 ฉบับที่ 23 ธันวาคม 2555
บทความวิจัย
Previous research on cost stickiness used intensity of total assets and intensity of employees as the proxy of adjustment costs. To support this, all prior research indicated that cost stickiness is impacted by both intensity of assets and intensity of employees (Anderson et al., 2003; Subramaniam & Weidenmier, 2003; Medeiros & Costa, 2004; Yang et al., 2005; Anderson, Chen, & Young, 2005).
Although, adjustment costs are not explicit monetary costs presented in fi nancial reports, prior research utilized only intensity of total assets and intensity of employees as the proxy of adjustment costs. This study introduced three variables to measure adjustment costs -i.e. stock intensity, equity intensity, and capital intensity. They are measured from book value of common stock, equity (or net assets) and fi xed assets that reported in statement of fi nancial position.
In summary, prior research has found that adjustment costs infl uenced the degree of cost stickiness. Based on the discussion for adjustment costs, the following question is raised:
Q3: Do adjustment costs affect the degree of cost stickiness?
It is proposed that adjustment costs will moderate the extent of resources decreases for decreases in sales, so adjustment costs will infl uence the degree of cost stickiness. In accordance with this research question, the study introduced the following hypothesis.
H3a: Adjustment costs affect the degree of cost stickiness in a positive direction.
2.3 Political Process TheoryThis study introduced political process
theory to expands knowledge base about cost behavior because “society, politics and economics are inseparable, and economic issues cannot meaningfully be investigated in the absence of considerations about the political, social and institutional framework in which the economic activity take place” (Deegan & Unerman, 2011, p. 322).
Political process theory adopt the self-interest assumption that politician maximize their utility. Therefore, political process is a competition for wealth transfer via governance service. Political costs are costs associated with the government expropriating wealth from companies and redistributing it to other parties in society (Foster, 1986). The corporations must incur costs of coalescing into lobbying group and becoming informed about how prospective government actions will affect them (Watts & Zimmerman, 1986). Political process theory proposes postulations about the use of accounting numbers in political process; for example, politicians may use large reported earnings as evidence of monopoly. Consequently, management of large companies may prefer to manage earnings to optimal level by maintaining unutilized resources rather than adjust costs when sales revenue declines.
On the other hand, profi t-sharing agreement with workers always uses financial statement numbers as a basis for profit-sharing plan. Management has the potential to affect their Do
wnloa
d จาก.
.วารสา
รวิชาชีพ
บัญชี
ป�ที่ 8 ฉบับที่ 23 ธันวาคม 2555 วารสารวิชาชีพบัญชี 35
The Determinants of Sticky Cost Behavior: A Structural Equation Modeling Approach
compensation by adjusting cost when sales revenue declines.
Empirical research suggested that political costs are important variables in disclosure decision and accounting method decision. Management will attempt to reduce political costs. Wong (1988) found that companies, with higher effective tax rate, larger market concentration ratio and more capital intensive, volunteered to disclose current cost fi nancial statements. This result recommended that political costs influenced management’s decision to voluntary disclose. Further, political costs infl uenced mangers’ decision to disclose segment reports (Birt, Bilson, Smith, & Whaley, 2006) and corporate social responsibility (CSR) disclosures (Belkaoui & Karpik, 1989; Gamerschlag, Moller, & Verbeeten, 2010). In conclusion, companies disclosed this information to decrease or avoid political costs.
Additionally, political costs also infl uence manager’s choices of accounting policies. The political process theory explains that managers utilize accounting choices to decrease wealth transfers resulting from the regulatory process (Watts & Zimmerman, 1986; Grace & Leverty, 2010).
This study applied political process theory to search the determinants of sticky cost behavior and utilized political costs as independent variables. There are fi ve variables that are used as a proxy for political costs.
1) Size The investigators have used company size
as a proxy for company’s political sensitivity and incentive of management to mange earnings. The
larger company is more and has relatively larger wealth transfer than small company (Watts & Zimmerman, 1986; Kern & Morris, 1991; Lamm-Tennant & Rollins, 1994; Seay, Pitts, & Kamery, 2004). Hence, this study hypothesized that the larger company has more cost stickiness than the small company.
2) Risk The political costs vary with the company’s
risk. The high-risk company is more likely to maintain costs when sales revenue declines. Beta of company’s stock is a measure of risk. (Peltzman, 1976; Zmijewski & Hagerman, 1981; Watts & Zimmerman, 1986; Seay et al., 2004).
3) Capital intensity The capital intensive company is subject
to relatively more political costs and more cost stickiness. Wong (1988) and Belkaoui and Karpik (1989) measured political costs by capital intensity in their research.
4) Concentration Concentration ratio is a measure of degree
of competition in an industry (Watts & Zimmerman, 1986; Wong, 1988; Godfrey & Jones, 1999). The higher competition degree, the more likely the management is to stick costs to reduce political costs.
5) Tax ratio Effective tax rate is component of political
costs (Kern & Morris, 1991). Inoue and Thomas (1996) confirmed that taxation has significant impact on managers’ choice because Japanese tax system is related to fi nancial reporting system.Do
wnloa
d จาก.
.วารสา
รวิชาชีพ
บัญชี
36 วารสารวิชาชีพบัญชี ป�ที่ 8 ฉบับที่ 23 ธันวาคม 2555
บทความวิจัย
In sum, prior research has found that political costs have strong effect on managers, decision on disclosing information and choosing accounting methods. This study introduced political costs to investigate cost behavior; the following questions may be raised:
Q4: Do political costs affect the degree of cost stickiness?
It is proposed that political costs infl uence the degree of cost stickiness because management may manage earnings to optimal level in order to reduce wealth transfers. In accordance with this research question, the study introduced the following hypothesis.
H4a: Political costs affect the degree of cost stickiness in a positive direction.
2.4 Agency TheoryAgency theory was developed by Jensen
and Meckling (1976), and it was used to study management’s incentive. Agency theory is applied to explain the relationship and behavior between shareholders (principals) and managers (agents). They engage in contract that shareholders assign authority and responsibility to managers and managers work on behalf of shareholders. The incentive plan or contract will motivate managers to behave in the way that aligned with shareholders’ interests.
Although Anderson et al. (2003) explained the impact of managers’ decisions on cost behavior, a few study has explored the underlying theory affecting management decisions. Chen et al. (2008) and Banker, Byzalov, and Plehn-Dujowich (2011) draw on agency theory, and used free cash fl ow to
measure the degree of managers’ empire-building incentives. The results found cost stickiness is greater in fi rm-years with higher free cash fl ows. Their results suggested that corporate governance can reduces cost stickiness. Furthermore, Banker, Ciftci, and Mashruwala (2008) examined the role of managers’ optimism in managerial decisions regarding capacity of activity resources that led to costs. Accordingly, exploring management decision processes and additional factors which affect cost behavior in each industry is important to better understanding stickiness.
The most results implied that sticky costs occur from the role of manager in adjusting committed resources in response to change in activities. Nevertheless, previous research on cost stickiness phenomenon found only indirect evidence on the proposition that sticky cost behavior is result of management’s decisions.
This study applied agency theory because cost stickiness may stem from empire building incentive. Thus, this study used agency costs as independent variables to explain sticky cost behavior and postulated that the company with higher agency costs has the higher degree of cost stickiness. The existing research has applied fi nancial statement-based agency cost measures as follows.
1) Asset utilization ratio It is a proxy for management’s effi ciency
in use of assets. This provides a measure of the effectiveness of company investment decisions and the ability of company’s management to direct assets to their most productive use. Company with Do
wnloa
d จาก.
.วารสา
รวิชาชีพ
บัญชี
ป�ที่ 8 ฉบับที่ 23 ธันวาคม 2555 วารสารวิชาชีพบัญชี 37
The Determinants of Sticky Cost Behavior: A Structural Equation Modeling Approach
lower asset utilization ratio is making non-optimal investment decision or using fund to purchase unproductive assets, and creating agency costs for shareholders. This is a variable used by Ang, Cole, and Lin (2000), Singh and Wallance (2003), and McKnight and Weir (2009). A lower asset utilization ratio is a signal of agency misalignment and the existence of agency costs.
2) Discretionary expenditure ratio It is a proxy for management’s effi ciency
in perquisite consumption. This is variable used by Ang et al. (2000), Singh and Wallance (2003), Truong (2006), Florackis (2008), Henry (2009) and Jelinek and Stuerke (2009). A higher discretionary expenditure ratio is an indicator of agency misalignment and the existence of agency costs.
3) Free cash fl ow (FCF) It is involved in underinvestment. Company
with agency problems will has high free cash fl ow. This is variable employed by Chen et al. (2008), Florackis (2008), Chae, Kim, and Lee (2009), and Banker et al. (2011).
4) Tobin’s Q It is employed as a representation of
managerial performance. The premise is that poorly-performing managers are more likely to make decisions that increase agency costs. The lower Tobin’s Q ratio indicates poorer managerial performance and the existence of agency costs. This is similar to variables used by Lang, Stulz, and Walkling (1991), Dey (2008) and Heney (2009).
5) Firm size Larger companies have a greater scale of
operations, which provides greater opportunity and
incentive for managers to shirk (Demsetz & Lehn, 1985). Hence, larger companies will have higher agency confl icts. Similar to Dey (2008) and Birt et al. (2006), this variable was used to measure agency costs.
6) Leverage It is probable that companies with greater
leverage will have higher agency costs related to debt. The companies with higher leverage ratio have greater incentive to manage earnings so that they protect adverse effects on their debt rating (Dey, 2008). This means that when leverage increases, agency costs of debt also increase (Jensen, 1986).
7) ROA (Return on Assets) The prior research utilized ROA as a proxy
for fi rm performance, similar to Tobin’s Q (Dey, 2008; Jelinek & Stuerke, 2009). The lower ROA indicates poor performance and agency problems.
According to existing studies, this research gathered these variables together in order to develop measurement model of agency costs. Based on the discussion of the degree of cost stickiness in context of agency theory, the following questions may be raised:
Q5: Do agency costs affect the degree of cost stickiness?
It is proposed that agency costs positively relate to the degree of cost stickiness. In accordance with this research question, the study introduced the following hypothesis.
H5a: Agency costs affect the degree of cost stickiness in positive direction.Do
wnloa
d จาก.
.วารสา
รวิชาชีพ
บัญชี
38 วารสารวิชาชีพบัญชี ป�ที่ 8 ฉบับที่ 23 ธันวาคม 2555
บทความวิจัย
2.5 Corporate Governance VariablesJensen (1993) presented that there are four
basic categories of corporate governance; legal and regulatory mechanisms, internal control mechanisms, external control mechanisms, and product market competition. Internal control mechanisms consist of the board of directors, the executive compensation, the fi rm’s ownership structure, and the fi rm’s debt structure. They are the most variables being used in public interest and academic research. There are interactions between these variables, encourage serious endogeneity problems in corporate governance research (Bhagat & Jefferis, 2002).
In Thailand, the Thai Institute of Directors Association (IOD) has conducted the corporate governance report, which presenting the results of the evaluation of corporate governance practices of Thai listed companies since 2001. The current evaluation criteria are corporate governance indexes (CGI) or ratings, that base on components of code of practice. Thai listed companies are evaluated according to 132 criteria in the following fi ve categories derived from the Organization for Economic Cooperation and Development (OECD) principles of corporate governance, as follows:
1. Rights of Shareholders2. Equitable Treatment of Shareholders3. Role of Stakeholders4. Disclosure and Transparency5. Board ResponsibilitiesEach of Thai listed companies is clustered into
following six groups according to their corporate governance performance:
1. Excellent CGI = 52. Very Good CGI = 43. Good CGI = 34. Satisfactory CGI = 25. Pass CGI = 16. N/AThis study used CGI as a proxy for corporate
governance variable in order to correct the problem of endogeneity between corporate governance variables and provide empirical evidence for regulating about corporate governance standards.
Empirical research of cost behavior which considered corporate governance started with research by Calleja et al. (2006) and Banker and Chen (2006a). They found that corporate governance system infl uences the degree of cost stickiness. Costs of companies that are subject to code-law system of corporate governance are stickier than costs of companies which are subject to common-law system of corporate governance. They did not add corporate governance as a variable into cost behavior model. Lastly, Chen et al. (2008) and Banker et al. (2011) found cost asymmetry or cost stickiness increases with managerial empire building incentive due to confl ict of interest between managers and shareholders. Chen et al. (2008) suggested that good corporate governance can reduce cost stickiness by preventing managers’ over-spending on selling, general and administrative costs.
In summary, earlier research has found that corporate governance factors impact on cost stickiness. Based on the discussion of causes and consequences of the sticky cost behavior and Do
wnloa
d จาก.
.วารสา
รวิชาชีพ
บัญชี
ป�ที่ 8 ฉบับที่ 23 ธันวาคม 2555 วารสารวิชาชีพบัญชี 39
The Determinants of Sticky Cost Behavior: A Structural Equation Modeling Approach
empirical evidence of cost behavior, the following questions may be raised:
Q6: Does corporate governance affect the degree of cost stickiness?
It is proposed that there is a negative association between the strength of corporate governance and the degree of cost stickiness. In accordance with this research question, the study introduced the following hypothesis.
H6a: The higher corporate governance affects the degree of cost stickiness in negative direction.
There is no study in this review investigated latent constructs for adjustment costs, political costs, and agency costs measured by multiple indicators. To address this issue, latent constructs for adjustment costs, political costs, and agency costs were developed and examined in this study using confi rmatory factor analysis (CFA).
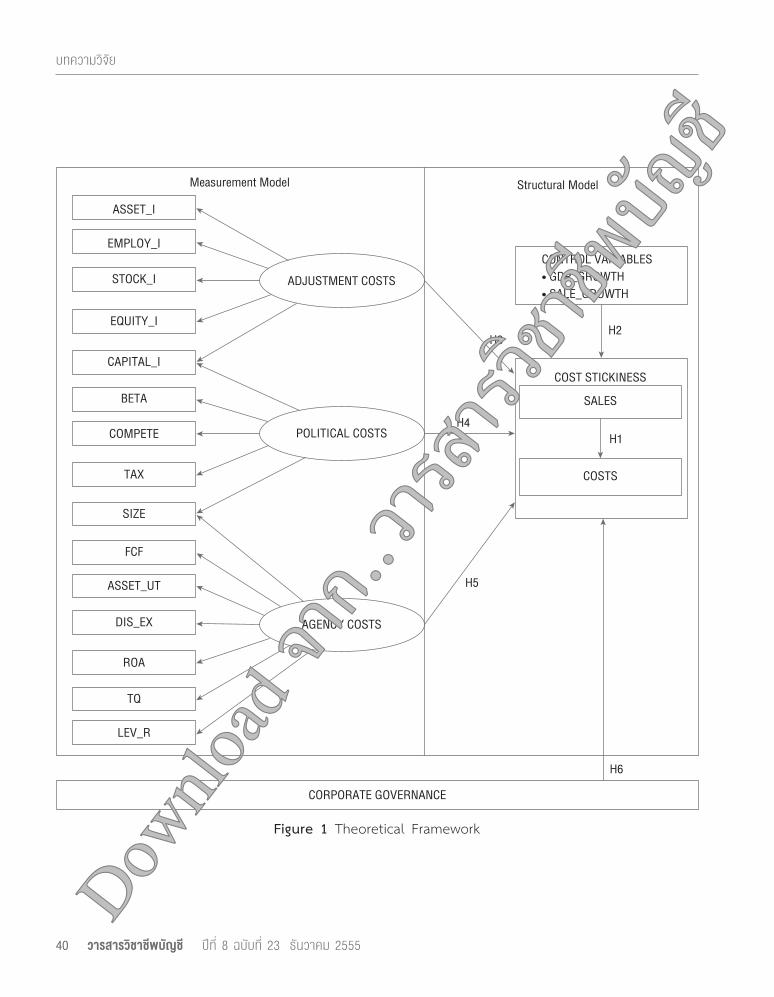
3. Research Methodology3.1 Theoretical FrameworkTo better understand the determinants of
sticky cost behavior or asymmetrical cost behavior, the theoretical framework was developed (Figure 1). The measurement model was proposed to investigate theoretical constructs or latent variables that cannot be observed directly. The relationships of observed variables and latent variables of adjustment costs, political costs, and agency costs, were specifi ed a priori, and described as implied conceptual models. They are measurement models as analyzed in confi rmatory factor analysis (CFA), which is Semi-SEM (Kline, 2011).
3.2 Research Design3.2.1 Selection of the Subjects
Target population of this study was Thai listed companies. The Stock Exchange of Thailand classifi ed the companies into 8 industries. The study used the purposive selection procedure to investigate cost behavior of companies in 7 industries except for fi nancials industry and property fund sector in property and construction industry, because of the difference of standardized fi nancial reports. The analysis spanned nine years during 2001-2009. After eliminating companies with missing values of variables, the fi nal sample comprises 160 companies, with 1,280 company-year observations (from only eight years due to time lag).
3.2.2 Instrumentation and Materials This study adapted the model of Anderson
et al. (2003) which used selling, general, and administrative costs as the proxy for costs and sales revenue as the proxy for activity due to the paucity of cost and activity driver data. However, this study used total operating costs as the proxy for costs because of the different classifying items in fi nancial reports. Banker et al. (2011) and Balakrishnan, Labro, and Soderstrom (2010) also used total operating costs as the proxy for costs. In additional, this study adapted two models of Balakrishnan et al. (2010), which removed committed fi xed cost (BLS1 Model and BLS2 Model).
Down
load จ
าก..วา
รสารวิช
าชีพบัญ
ชี
40 วารสารวิชาชีพบัญชี ป�ที่ 8 ฉบับที่ 23 ธันวาคม 2555
บทความวิจัย
EMPLOY_I
STOCK_I
EQUITY_I
CAPITAL_I
ADJUSTMENT COSTS
FCF
ASSET_UT
DIS_EX
ROA
AGENCY COSTS
BETA
COMPETE
TAX
POLITICAL COSTS
COST STICKINESS
H1
SALES
COSTS
TQ
LEV_R
SIZE
H3
H5
H4
Measurement Model Structural Model
ASSET_I
H6
CORPORATE GOVERNANCE
CONTROL VARIABLES
H2
Figure 1 Theoretical Framework
Down
load จ
าก..วา
รสารวิช
าชีพบัญ
ชี
ป�ที่ 8 ฉบับที่ 23 ธันวาคม 2555 วารสารวิชาชีพบัญชี 41
The Determinants of Sticky Cost Behavior: A Structural Equation Modeling Approach
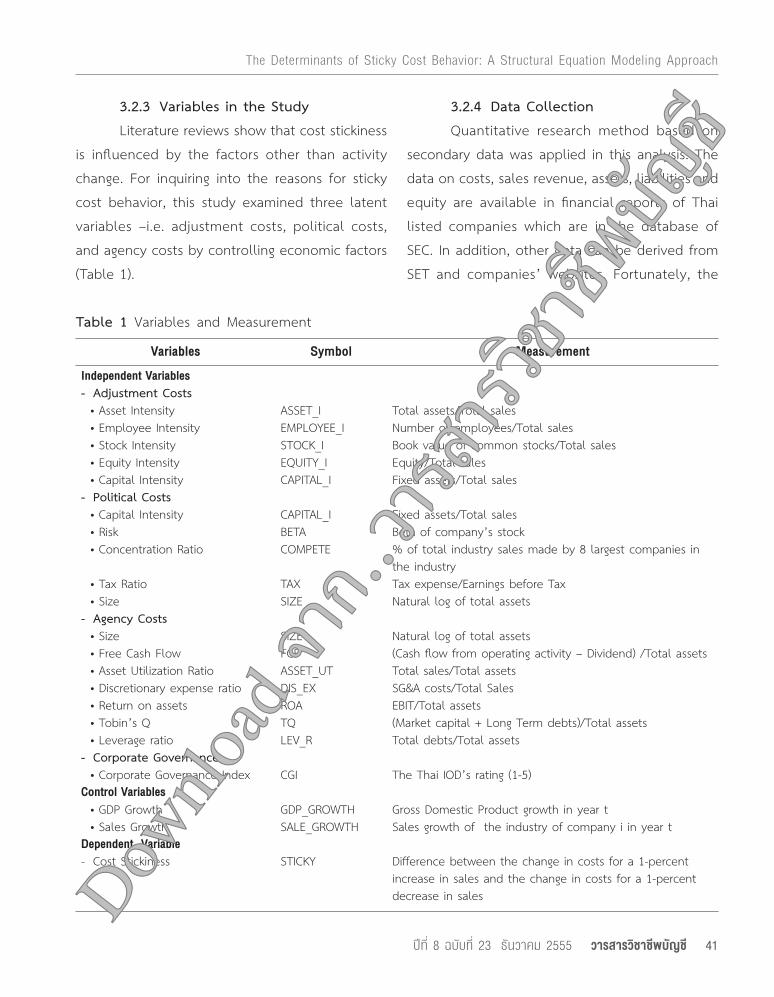
Table 1 Variables and Measurement
Variables Symbol Measurement
Independent Variables- Adjustment Costs • Asset Intensity ASSET_I Total assets/Total sales • Employee Intensity EMPLOYEE_I Number of employees/Total sales • Stock Intensity STOCK_I Book value of common stocks/Total sales • Equity Intensity EQUITY_I Equity/Total sales • Capital Intensity CAPITAL_I Fixed assets/Total sales- Political Costs • Capital Intensity CAPITAL_I Fixed assets/Total sales • Risk BETA Beta of company’s stock • Concentration Ratio COMPETE % of total industry sales made by 8 largest companies in
the industry • Tax Ratio TAX Tax expense/Earnings before Tax • Size SIZE Natural log of total assets - Agency Costs • Size SIZE Natural log of total assets • Free Cash Flow FCF (Cash flow from operating activity – Dividend) /Total assets • Asset Utilization Ratio ASSET_UT Total sales/Total assets • Discretionary expense ratio DIS_EX SG&A costs/Total Sales • Return on assets ROA EBIT/Total assets • Tobin’s Q TQ (Market capital + Long Term debts)/Total assets • Leverage ratio LEV_R Total debts/Total assets- Corporate Governance • Corporate Governance Index CGI The Thai IOD’s rating (1-5)Control Variables • GDP Growth GDP_GROWTH Gross Domestic Product growth in year t • Sales Growth SALE_GROWTH Sales growth of the industry of company i in year tDependent Variable- Cost Stickiness STICKY Difference between the change in costs for a 1-percent
increase in sales and the change in costs for a 1-percent decrease in sales
3.2.3 Variables in the Study Literature reviews show that cost stickiness
is infl uenced by the factors other than activity change. For inquiring into the reasons for sticky cost behavior, this study examined three latent variables –i.e. adjustment costs, political costs, and agency costs by controlling economic factors (Table 1).
3.2.4 Data Collection Quantitative research method based on
secondary data was applied in this analysis. The data on costs, sales revenue, assets, liabilities and equity are available in fi nancial reports of Thai listed companies which are in the database of SEC. In addition, other data can be derived from SET and companies’ websites. Fortunately, the
Down
load จ
าก..วา
รสารวิช
าชีพบัญ
ชี
42 วารสารวิชาชีพบัญชี ป�ที่ 8 ฉบับที่ 23 ธันวาคม 2555
บทความวิจัย
companies’ fi nancial reports can also be accessed from SETSMART (SET Market Analysis and Reporting Tool), the web-based application from the SET.
3.3 Data Processing and AnalysisThere were three stages of analysis in this
study. The first stage is confirmatory factor analysis (CFA), to evaluate and optimize the priori measurement models for adequate model fi t and validity. The measurement models for adjustment costs, for political costs, and for agency costs were evaluated and optimized separately. The second stage is exploratory factor analysis (EFA), to obtain a more parsimonious set of composite scores (i.e., factor scores) that are then used in subsequent analyses (e.g., regression) instead of the measured variable scores. The last stage is multiple regression analysis, to analyze the data for the purpose of answering the research questions.
Data was prepared and screened before analyzed. Because the most estimated methods in SEM make specifi c distributional assumption about the data. Data-related problems can make result biased and SEM computer programs failed to yield a logical solution (Kline, 2011). AMOS version 18 was used to analyze the data for measurement models. In contrast, the structural model defi nes relations among latent variables. The software application used to organize and analyze the data for structural model was SPSS version 17.
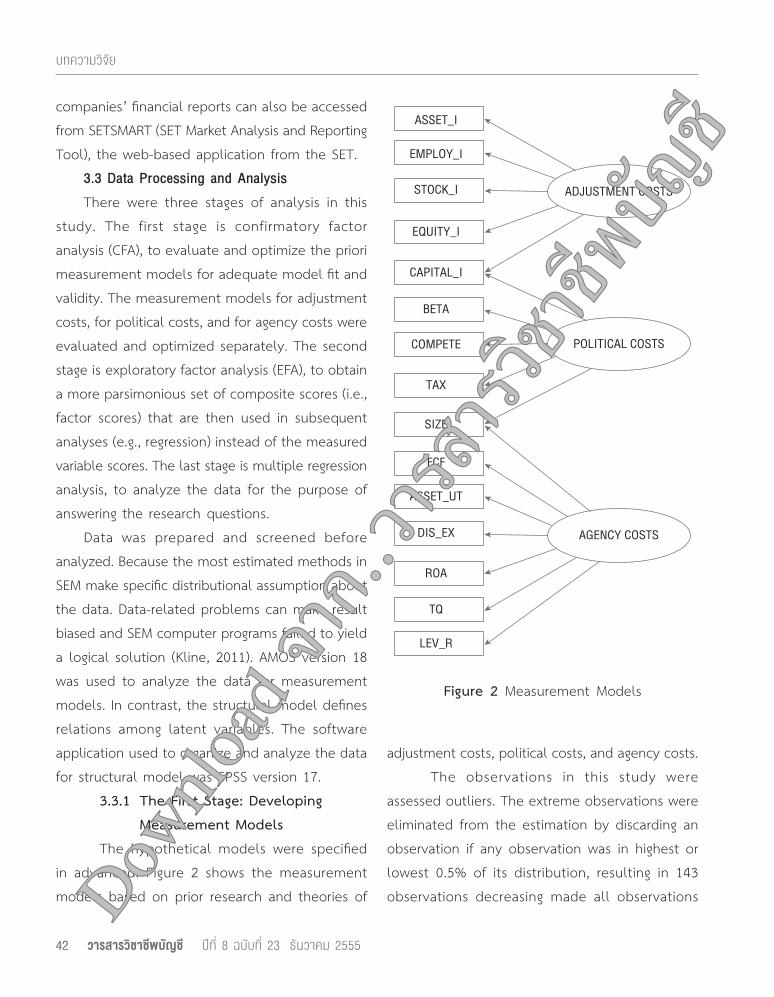
3.3.1 The First Stage: Developing Measurement Models
The hypothetical models were specifi ed in advanced. Figure 2 shows the measurement models based on prior research and theories of
Figure 2 Measurement Models
EMPLOY_I
STOCK_I
EQUITY_I
CAPITAL_I
ADJUSTMENT COSTS
FCF
ASSET_UT
DIS_EX
ROA
AGENCY COSTS
BETA
COMPETE
TAX
POLITICAL COSTS
TQ
LEV_R
SIZE
ASSET_I
adjustment costs, political costs, and agency costs. The observations in this study were
assessed outliers. The extreme observations were eliminated from the estimation by discarding an observation if any observation was in highest or lowest 0.5% of its distribution, resulting in 143 observations decreasing made all observations Do
wnloa
d จาก.
.วารสา
รวิชาชีพ
บัญชี
ป�ที่ 8 ฉบับที่ 23 ธันวาคม 2555 วารสารวิชาชีพบัญชี 43
The Determinants of Sticky Cost Behavior: A Structural Equation Modeling Approach
to 1137 observations. Furthermore, multivariate outlier was assessed. There is minimal evidence of serious multivariate outliers in this study for transformed data.
The original data fi le should be screened for collinearity and normality. The collinearity can occur when separate variables measure the same thing. Tolerance and variance infl ation factor (VIF) are statistics that can detect collinearity among three or more variables or multivariate collinearity. Kline (2011) recommended that tolerance value lesser than 0.10 or VIF greater than 10.0 may indicate extreme multivariate collinearity. The screened data reveals no item to be substantially multivariate collinearity (VIF = 1.0320 to 4.3860).
Multivariate normality is the most important assumption in the conduct of SEM analysis and especially in use of AMOS (Arbuckle, 2007). Estimation in SEM with maximum likelihood assumes multivariate normality; this means that all univariate distributions are normal and each variable is normally distributed for each value of every other variable and all bivariate scatterplots are linear, and fi nally the distribution of residuals is homoscedastic (Kline, 2011). It is very diffi cult to assess all these aspects of multivariate normality. Fortunately, many cases of multivariate normality are detectable by inspection of univariate normality. Non-normal distribution causes by skewness and kurtosis. Kline (2011) suggested that absolute value of skew index greater than 3.0 indicates extremely skewness and absolute value of kurtosis index greater than 10.0 suggesting a problem; value greater than 20.0 signals serious
problem. However, the maximum likelihood estimation, which is estimation technique in AMOS, is robust against moderate violation of multivariate normality (Anderson& Garbing, 1988; Bentler & Chou, 1987).
Kline (2011) recommended four approximate fi t indexes that are the most widely presented in the SEM literature. They are Root Mean Square Error of Approximation (RMSEA), Goodness of Fit Index (GFI), Comparative Fit Index (CFI), and Standardized Root Mean Square Residual (SRMR).
In addition, quality of the latent construct should be evaluated. This index indicates internal consistency in set of observed variables. It is referred to as maximal reliability in the context of scale construction and as the measure of construct reliability (Hancock & Mueller, 2006). Construct reliability measures convergent validity that is proportion of covariance in set of observed variables.
3.3.2 The Second Stage: Estimating Factor Scores
This study utilized factor analysis to summarize relationships among the variables in the form of a more parsimonious set of factor scores so that these factor scores can then be used in multiple regression analyses instead of the measured variable scores. Exploratory factor analysis (EFA) is the statistical method that can be used for exploring the relationships among measured variables and trying to determine whether these relationships can be summarized in a smaller number of latent constructs (Thompson, 2004).Do
wnloa
d จาก.
.วารสา
รวิชาชีพ
บัญชี
44 วารสารวิชาชีพบัญชี ป�ที่ 8 ฉบับที่ 23 ธันวาคม 2555
บทความวิจัย
EFA extraction method used for this study is principal component analysis. It was used to compute factor pattern coeffi cients. Factor rotation was performed by the varimax rotation method. Then regression method was used to obtain factor scores. If there are multiple factors in one latent construct, factor scores will be weighted average value with percentage of variance.
3.3.3 The Final Stage: Constructing Structural Model of Cost Behavior
Multiple regression analysis was used to analyze the relationship among variables, especially causal relationship. This study examined the conditions when analyzed the data. There
are four conditions about residual or error term. Three models were investigated the conditions. The residual terms of ABJ model and BLS1 model are normal while residual term of BLS2 model is approximately normal. Residual terms of all models are constant, so they are homoscedasticity. All models have no autocorrelation and multicollinearity problems (Durbin-Watson < 3 and VIF < 10).
After examining these conditions, the models of Anderson et al. (2003) and Balakrishnan et al. (2010) were employed to investigate cost stickiness.
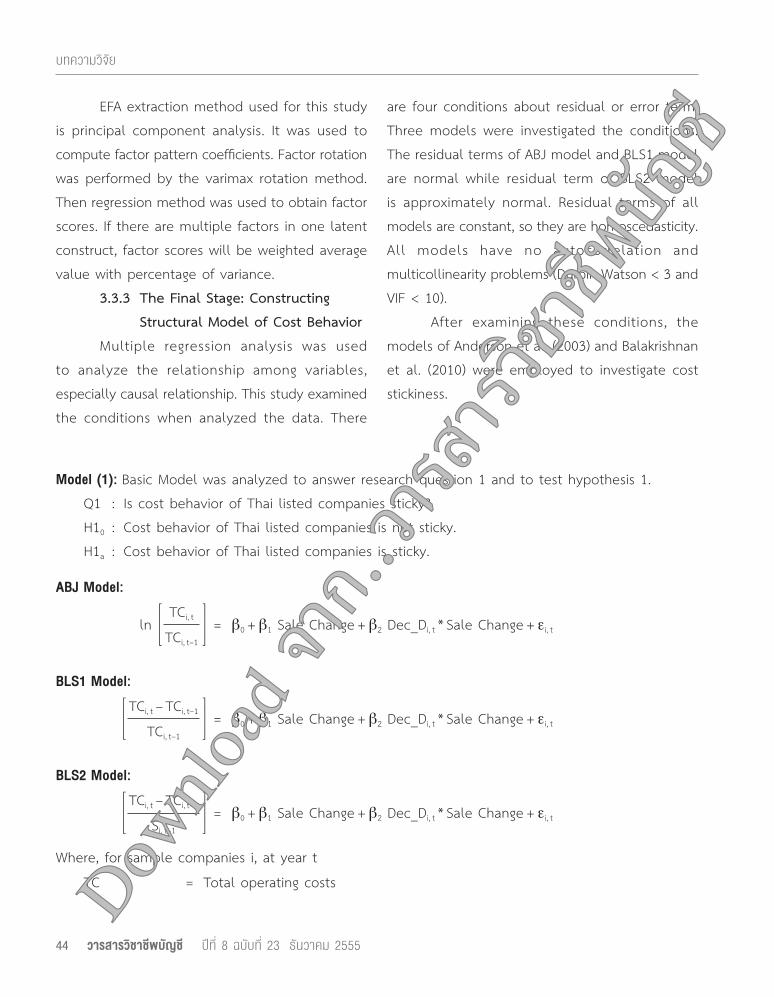
Model (1): Basic Model was analyzed to answer research question 1 and to test hypothesis 1.Q1 : Is cost behavior of Thai listed companies sticky?H10 : Cost behavior of Thai listed companies is not sticky.H1a : Cost behavior of Thai listed companies is sticky.
ABJ Model:
ln⎡⎢⎢⎣
TCi, t⎤⎥⎥⎦
= β0 + β1 Sale Change + β2 Dec_Di, t * Sale Change + εi, tTCi, t–1
BLS1 Model:⎡⎢⎢⎣
TCi, t – TCi, t–1⎤⎥⎥⎦
= β0 + β1 Sale Change + β2 Dec_Di, t * Sale Change + εi, tTCi, t–1
BLS2 Model:⎡⎢⎢⎣
TCi, t – TCi, t–1⎤⎥⎥⎦
= β0 + β1 Sale Change + β2 Dec_Di, t * Sale Change + εi, tSi, t–1
Where, for sample companies i, at year t
TC = Total operating costsDown
load จ
าก..วา
รสารวิช
าชีพบัญ
ชี
ป�ที่ 8 ฉบับที่ 23 ธันวาคม 2555 วารสารวิชาชีพบัญชี 45
The Determinants of Sticky Cost Behavior: A Structural Equation Modeling Approach
S = Total sales
Dec_Di, t = 1 when sales have decreased from year t–1 to t, and 0 otherwise
Sale Change = ln⎡⎢⎢⎣
Si, t⎤⎥⎥⎦
for ABJ ModelSi, t–1
Sale Change = ln⎡⎢⎢⎣
Si, t – Si, t–1⎤⎥⎥⎦
for BLS1 and BLS2 ModelSi, t
Cost is sticky, when β1 more than β1 + β2
Hence, H10 : β1 = β2 = 0 H1a : β1 > β1 + β2 or β2 < 0
Model (2): Basic model with economic variables was analyzed to answer research question 2 and to test hypothesis 2.
Q2 : Is cost behavior still sticky, after controlling for economic variables?H20 : Cost behavior is not sticky, after controlling for economic variables.H2a : Cost behavior is still sticky, after controlling for economic variables.
ABJ Model:
ln⎡⎢⎢⎣
TCi, t⎤⎥⎥⎦
= β0 + β1 Sale Change + β2 Dec_Di, t * Sale Change + β3 GDP_GROWTH+ β4 SALE_GROWTH + εi, t
TCi, t–1
BLS1 Model:⎡⎢⎢⎣
TCi, t – TCi, t–1⎤⎥⎥⎦
= β0 + β1 Sale Change + β2 Dec_Di, t * Sale Change + β3 GDP_GROWTH+ β4 SALE_GROWTH + εi, t
TCi, t–1
BLS2 Model:⎡⎢⎢⎣
TCi, t – TCi, t–1⎤⎥⎥⎦
= β0 + β1 Sale Change + β2 Dec_Di, t * Sale Change + β3 GDP_GROWTH+ β4 SALE_GROWTH + εi
Si, t–1
Cost is sticky, when β1 more than β1 + β2 + . β3 + β4
Hence, H20 : βi = 0 i = 1, 2,…….,4 H2a : β1 > β1 + β2 + . β3 + β4 ; or β2 < 0 or β3 < 0 or β4 < 0Down
load จ
าก..วา
รสารวิช
าชีพบัญ
ชี
46 วารสารวิชาชีพบัญชี ป�ที่ 8 ฉบับที่ 23 ธันวาคม 2555
บทความวิจัย
Model (3): Full Model with all variables was analyzed to answer research question 3, 4, 5 and to test hypothesis 3, 4, 5.
Q3 : Do adjustment costs affect the degree of cost stickiness?Q4 : Do political costs affect the degree of cost stickiness?Q5 : Do agency costs affect the degree of cost stickiness?H30 : Adjustment costs do not affect the degree of cost stickiness in positive direction.H3a : Adjustment costs affect the degree of cost stickiness in positive direction.H40 : Political costs do not affect the degree of cost stickiness in positive direction.H4a : Political costs affect the degree of cost stickiness in positive direction.H50 : Agency costs do not affect the degree of cost stickiness in positive direction.H5a : Agency costs affect the degree of cost stickiness in positive direction.
ABJ Model:
ln⎡⎢⎢⎣
TCi, t⎤⎥⎥⎦
= β0 + β1 Sale Change + β2 Dec_Di, t * Sale Change + β3 GDP_GROWTH+ β4 SALE_GROWTH + β5 ADJUSTMENT COSTS + β6 POLITICAL COSTS+ β7 AGENCY COSTS + εi, t
TCi, t–1
BLS1 Model:⎡⎢⎢⎣
TCi, t – TCi, t–1⎤⎥⎥⎦
= β0 + β1 Sale Change + β2 Dec_Di, t * Sale Change + β3 GDP_GROWTH+ β4 SALE_GROWTH + β5 ADJUSTMENT COSTS + β6 POLITICAL COSTS+ β7 AGENCY COSTS + εi, t
TCi, t–1
BLS2 Model:⎡⎢⎢⎣
TCi, t – TCi, t–1⎤⎥⎥⎦
= β0 + β1 Sale Change + β2 Dec_Di, t * Sale Change + β3 GDP_GROWTH + β4 SALE_GROWTH + β5 ADJUSTMENT COSTS + β6 POLITICAL COSTS + β7 AGENCY COSTS + εi, t
Si, t–1
Adjustment costs affect the degree of cost stickiness in positive direction, when β5 less than 0
Hence, H30 : β5 = 0 H3a : β5 < 0The higher political costs, the more likely manager is to mange earnings. Political costs affect the
degree of cost stickiness in positive direction, when β6 less than 0.Down
load จ
าก..วา
รสารวิช
าชีพบัญ
ชี
ป�ที่ 8 ฉบับที่ 23 ธันวาคม 2555 วารสารวิชาชีพบัญชี 47
The Determinants of Sticky Cost Behavior: A Structural Equation Modeling Approach
Hence, H40 : β6 = 0 H4a : β6 < 0The higher agency costs, the more likely manager is to retain costs; that is the “stickier” cost
behavior. Agency costs affect the degree of cost stickiness in positive direction, when β7 less than 0
Hence, H50 : β7 = 0 H5a : β7 < 0
ABJ Model, BlS1 Model and BLS2 Model: The observations were separated weak corporate governance from strong corporate governance. Then model (3) of three models were analyzed to answer research question 6 and to test hypothesis 6.
Q6 : Does corporate governance affect the degree of cost stickiness?H60 : Corporate governance does not affect the degree of cost stickiness in negative direction.H6a : Corporate governance affects the degree of cost stickiness in negative direction.The stronger corporate governance, the more likely manager is to utilize resources more effi ciently;
that is the “less sticky” cost behavior.β21 = degree of cost stickiness of weak corporate governanceβ22 = degree of cost stickiness of strong corporate governance
Hence, H60 : β21 = 0 or β22 = 0 H6a : β21 < 0 and β21 < β22
4. Research Results4.1 The Descriptive Statistic SummaryPanel B, C and D of Table 2 display the
descriptive statistics of variables which are the proxy for adjustment costs, political costs, and agency costs after data transformation. All of variable distributions were close to normal because absolute value of skew index less than 3.0 and absolute value of kurtosis index less than 10.0. As soon as data had been prepared and screened, multivariate statistic analysis can be used in this study.
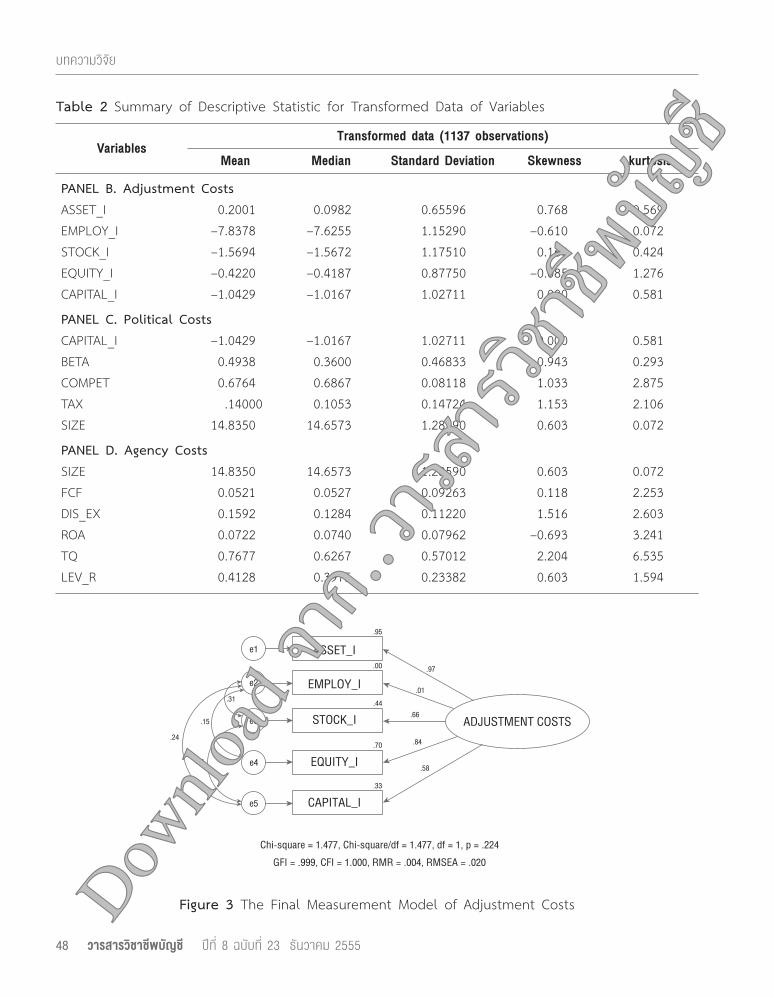
4.2 Measurement Models4.2.1 Adjustment Cost Model
The f inal measurement model of adjustment costs was indicated by four observed variables (asset intensity, stock intensity, equity intensity, and capital intensity). Employee intensity was deleted from the model (p = .712, squared multiple correlation = .00). Figure 3 illustrates the fi nal measurement model with standardized coeffi cients and squared multiple correlations.
Down
load จ
าก..วา
รสารวิช
าชีพบัญ
ชี
48 วารสารวิชาชีพบัญชี ป�ที่ 8 ฉบับที่ 23 ธันวาคม 2555
บทความวิจัย
Table 2 Summary of Descriptive Statistic for Transformed Data of Variables
VariablesTransformed data (1137 observations)
Mean Median Standard Deviation Skewness kurtosis
PANEL B. Adjustment CostsASSET_I 0.2001 0.0982 0.65596 0.768 0.569EMPLOY_I –7.8378 –7.6255 1.15290 –0.610 0.072STOCK_I –1.5694 –1.5672 1.17510 0.160 0.424EQUITY_I –0.4220 –0.4187 0.87750 –0.085 1.276CAPITAL_I –1.0429 –1.0167 1.02711 0.000 0.581
PANEL C. Political CostsCAPITAL_I –1.0429 –1.0167 1.02711 0.000 0.581BETA 0.4938 0.3600 0.46833 0.943 0.293COMPET 0.6764 0.6867 0.08118 1.033 2.875TAX .14000 0.1053 0.14724 1.153 2.106SIZE 14.8350 14.6573 1.28590 0.603 0.072
PANEL D. Agency CostsSIZE 14.8350 14.6573 1.28590 0.603 0.072FCF 0.0521 0.0527 0.09263 0.118 2.253DIS_EX 0.1592 0.1284 0.11220 1.516 2.603ROA 0.0722 0.0740 0.07962 –0.693 3.241TQ 0.7677 0.6267 0.57012 2.204 6.535LEV_R 0.4128 0.3975 0.23382 0.603 1.594
Figure 3 The Final Measurement Model of Adjustment Costs
EMPLOY_I
STOCK_I
EQUITY_I
CAPITAL_I
Chi-square = 1.477, Chi-square/df = 1.477, df = 1, p = .224
GFI = .999, CFI = 1.000, RMR = .004, RMSEA = .020
ADJUSTMENT COSTS
ASSET_Ie1
.95
.00
.44
.70
.33
.58
.84
.66
.01
.97
.24
.11
.15
e2
e3
e4
e5
.31
Down
load จ
าก..วา
รสารวิช
าชีพบัญ
ชี
ป�ที่ 8 ฉบับที่ 23 ธันวาคม 2555 วารสารวิชาชีพบัญชี 49
The Determinants of Sticky Cost Behavior: A Structural Equation Modeling Approach
Measurement Model Fit: Measurement Model of adjustment costs is good fi t. Table 3 shows comparing the adjustment cost model fi t results with recommended values.
Quality of the Latent Construct: The variance of latent variable can be explained by observed variables 96%.
In summary, the result confirmed that adjustment costs can be measured by asset intensity, stock intensity, equity intensity, and capital intensity.
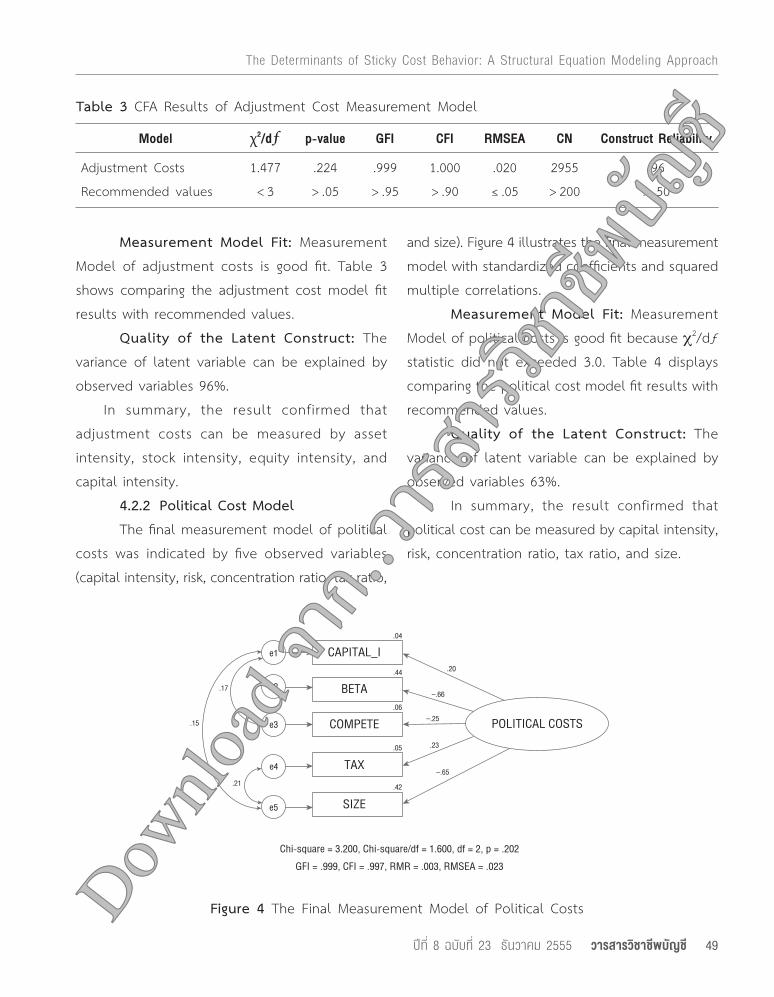
4.2.2 Political Cost Model The fi nal measurement model of political
costs was indicated by fi ve observed variables (capital intensity, risk, concentration ratio, tax ratio,
and size). Figure 4 illustrates the fi nal measurement model with standardized coeffi cients and squared multiple correlations.
Measurement Model Fit: Measurement Model of political costs is good fi t because χ2/dƒ statistic did not exceeded 3.0. Table 4 displays comparing the political cost model fi t results with recommended values.
Quality of the Latent Construct: The variance of latent variable can be explained by observed variables 63%.
In summary, the result confirmed that political cost can be measured by capital intensity, risk, concentration ratio, tax ratio, and size.
Table 3 CFA Results of Adjustment Cost Measurement Model
Model χ2/dƒ p-value GFI CFI RMSEA CN Construct Reliability
Adjustment Costs 1.477 .224 .999 1.000 .020 2955 .96
Recommended values < 3 > .05 > .95 > .90 ≤ .05 > 200 > .50
Figure 4 The Final Measurement Model of Political Costs
Chi-square = 3.200, Chi-square/df = 1.600, df = 2, p = .202
GFI = .999, CFI = .997, RMR = .003, RMSEA = .023
e1
.04
.44
.06
.05
.42
–.65
.23
–.25
–.66
.20
.15
.21
e2
e3
e4
e5
.17
CAPITAL_I
BETA
COMPETE
TAX
POLITICAL COSTS
SIZE
Down
load จ
าก..วา
รสารวิช
าชีพบัญ
ชี
50 วารสารวิชาชีพบัญชี ป�ที่ 8 ฉบับที่ 23 ธันวาคม 2555
บทความวิจัย
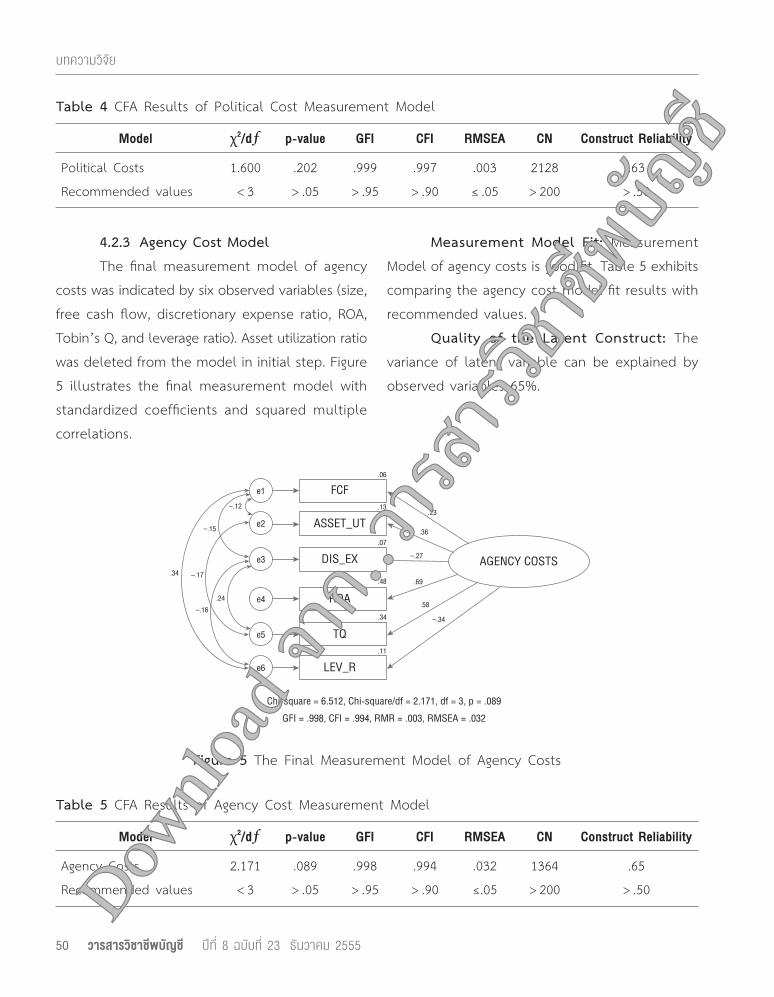
4.2.3 Agency Cost Model The fi nal measurement model of agency
costs was indicated by six observed variables (size, free cash fl ow, discretionary expense ratio, ROA, Tobin’s Q, and leverage ratio). Asset utilization ratio was deleted from the model in initial step. Figure 5 illustrates the fi nal measurement model with standardized coeffi cients and squared multiple correlations.
Measurement Model Fit: Measurement Model of agency costs is good fi t. Table 5 exhibits comparing the agency cost model fi t results with recommended values.
Quality of the Latent Construct: The variance of latent variable can be explained by observed variables 65%.
Table 4 CFA Results of Political Cost Measurement Model
Model χ2/dƒ p-value GFI CFI RMSEA CN Construct Reliability
Political Costs 1.600 .202 .999 .997 .003 2128 .63
Recommended values < 3 > .05 > .95 > .90 ≤ .05 > 200 > .50
Table 5 CFA Results of Agency Cost Measurement Model
Model χ2/dƒ p-value GFI CFI RMSEA CN Construct Reliability
Agency Costs 2.171 .089 .998 .994 .032 1364 .65
Recommended values < 3 > .05 > .95 > .90 ≤.05 > 200 > .50
Figure 5 The Final Measurement Model of Agency Costs
Chi-square = 6.512, Chi-square/df = 2.171, df = 3, p = .089GFI = .998, CFI = .994, RMR = .003, RMSEA = .032
e1
e2
e3
e4
e5
e6
FCF
ASSET_UT
DIS_EX
ROA
AGENCY COSTS
TQ
LEV_R
.06
.13
.07
.48
.34
.11
.58
–.34
.69
–.27
.36
.23
.34
–.16.24
–.12
–.15
–.17
Down
load จ
าก..วา
รสารวิช
าชีพบัญ
ชี

ป�ที่ 8 ฉบับที่ 23 ธันวาคม 2555 วารสารวิชาชีพบัญชี 51
The Determinants of Sticky Cost Behavior: A Structural Equation Modeling Approach
In summary, the result confirmed that agency costs can be measured by size, free cash fl ow, discretionary expense ratio, ROA, Tobin’s Q, and leverage ratio.
4.3 Estimation Factor ScoresAn exploratory factor analysis was performed
on three constructs; adjustment costs, political costs, and agency costs.
Adjustment costsThe measurement model from CFA found that
asset intensity, stock intensity, equity intensity, and capital intensity can be used to measure adjustment costs. Next step is estimating factor scores.
Data is appropriate for EFA (KMO = .739). This analysis resulted in one factor with eigenvalues greater than one, explaining 67.98% of variance.
Political costsThe measurement model from CFA found that
capital intensity, risk, concentration ratio, tax ratio, and size can be used to measure political costs. Next step is estimating factor scores.
Data is appropriate for EFA (KMO = .515). This analysis resulted in three factors with eigenvalues greater than .999, explaining 73.58% of variance. In this case, factor scores were weighted average value with percentage of variance.
Agency costsThe measurement model from CFA found that
size, free cash fl ow, discretionary expense ratio, ROA, Tobin’s Q, and leverage ratio can be used to measure agency costs. Next step is estimating factor scores.
Data is appropriate for EFA (KMO = .545). This analysis resulted in two factors with eigenvalues greater than .997, explaining 67.84% of variance. In this case, factor scores were weighted average value with percentage of variance.
4.4 Structural Model of Sticky Cost BehaviorThe four conditions about residual or error
term were investigated. Then the multiple regression analysis was used to formulate model according to Figure 6 and Table 6.
Down
load จ
าก..วา
รสารวิช
าชีพบัญ
ชี
52 วารสารวิชาชีพบัญชี ป�ที่ 8 ฉบับที่ 23 ธันวาคม 2555
บทความวิจัย
Figure 6 The Structural Model of Sticky Cost BehaviorABJ Model:
ln⎡⎢⎢⎣
TCi, t⎤⎥⎥⎦
= –.019 + .954 Sale Change – .097 Dec_Di, t * Sale Change+ .053 GDP_GROWTH + .068 POLITICAL COSTS – .059 AGENCY COSTS + εi, t
TCi, t–1
BLS1 Model:⎡⎢⎢⎣
TCi, t – TCi, t–1⎤⎥⎥⎦
= – .020 + .941 Sale Change – .085 Dec_Di, t * Sale Change+ .050 GDP_GROWTH + .075 POLITICAL COSTS – .073 AGENCY COSTS + εi, t
TCi, t–1
BLS2 Model:⎡⎢⎢⎣
TCi, t – TCi, t–1⎤⎥⎥⎦
= – .026 + .882 Sale Change – .074 Dec_Di, t * Sale Change+ .049 GDP_GROWTH – .045 ADJUSTMENT COSTS + .084 POLITICAL COSTS – .088 AGENCY COSTS + εi, t
Si, t–1
ASSET_I
STOCK_I
EQUITY_I
CAPITAL_I
ADJUSTMENT COSTS
FCF
DIS_EX
ROA
AGENCY COSTS
BETA
COMPETE
TAX
POLITICAL COSTS
COST STICKINESS
H1
SALES
COSTS
TQ
LEV_R
SIZE
H3
H5
ABJ –.059BLS1 –.073BLS2 –.088
ABJ 0.68BLS1 .075BLS2 .084
ABJ .000BLS1 .000BLS2 –.045
ABJ –.092BLS1 –.083BLS2 –.070
H4
Measurement Model Structural Model
CONTROL VARIABLES
H2.58
.84
.66
.97
–.65
.23
–.25
–.66
.20
.58
–.34
.69
–.27
.36
.23
Down
load จ
าก..วา
รสารวิช
าชีพบัญ
ชี

ป�ที่ 8 ฉบับที่ 23 ธันวาคม 2555 วารสารวิชาชีพบัญชี 53
The Determinants of Sticky Cost Behavior: A Structural Equation Modeling Approach
Tabl
e 6
Regr
essio
n An
alys
is Re
sults
of
Mod
el (
1),
Mod
el (
2),
and
Mod
el (
3)
ABJ
Mod
elBL
S1 M
odel
BLS2
Mod
el
Mod
el (
1)M
odel
(2)
Mod
el (
3)M
odel
(1)
Mod
el (
2)M
odel
(3)
Mod
el (
1)M
odel
(2)
Mod
el (
3)
Coef
f.Si
gCo
eff.
Sig
Coef
f.Si
gCo
eff.
Sig
Coef
f.Si
gCo
eff.
Sig
Coef
f.Si
gCo
eff.
Sig
Coef
f.Si
g
β 0.0
00–.
019
–.01
9.0
00–.
020
–.02
0–.
006
–.02
6–.
026
(–0.
202)
(–3.
256)
(–3.
314)
(–0.
220)
(–3.
179)
(–3.
239)
(–1.
240)
(–3.
319)
(–3.
391)
β 1.9
60**
*.9
45**
*.9
54**
*.9
42**
*.9
32**
*.9
41**
*.8
83**
*.8
72**
*.8
82**
*
(43.
851)
(42.
839)
(42.
711)
(53.
912)
(52.
957)
(53.
093)
(41.
881)
(41.
004)
(41.
146)
β 2–.
087
***
–.09
2**
*–.
097
***
–.07
3**
*–.
083
***
–.08
5**
*–.
060
**–.
070
***
–.07
4**
*
(–3.
971)
(–4.
214)
(–4.
457)
(–4.
186)
(–4.
706)
(–4.
859)
(–2.
868)
(–3.
293)
(–3.
502)
β 3.0
53**
*.0
53**
*.0
50**
*.0
50**
*.0
49**
.049
**
(3.5
48)
(3.6
12)
(3.3
89)
(3.4
56)
(2.7
61)
(2.7
82)
β 4.0
12.0
06.0
11.0
05.0
15.0
10
(.823
)(.4
23)
(.757
)(.3
49)
(.897
)(.6
11)
β 5–.
020
–.02
0–.
045
*
(–1.
331)
(–1.
366)
(–2.
496)
β 6.0
68**
*.0
75**
*.0
84**
*
(3.6
44)
(4.0
61)
(3.7
59)
β 7–.
059
**–.
073
***
–.08
8**
*
(–3.
107)
(–3.
894)
(–3.
914)
Adj.
R279
.6%
79.9
%80
.1%
80.2
%80
.4%
80.7
%71
.2%
71.4
%71
.8%
D-W
2.34
12.
352
2.33
02.
416
2.42
62.
406
2.46
42.
471
2.89
9
Note
: *,
**,
***
repr
esen
t sig
nific
ance
lev
els
of .
05,
.01
and
.001
, re
spec
tivel
y.
Down
load จ
าก..วา
รสารวิช
าชีพบัญ
ชี
54 วารสารวิชาชีพบัญชี ป�ที่ 8 ฉบับที่ 23 ธันวาคม 2555
บทความวิจัย
4.5 Hypotheses TestingResearch Question: 1. Is cost behavior of Thai
listed companies sticky?The results revealed that total operating
costs are sticky. Total operating costs increased 0.88–0.96% per 1% increase in sales revenue but decreased only 0.82–.087% per 1% decrease in sales revenue (see Model (1) in Table 6).
Research Hypothesis:H1a. Cost behavior of Thai listed companies
is sticky.Hypothesis 1a predicted that cost behavior
of Thai listed companies is sticky. To test this hypothesis, change in costs was regressed on change in sales.
Total operating costs are sticky for all models (ABJ Model, BLS1 Model, and BLS2 Model). Thereby, hypothesis 1a was supported by behavior of total operating costs.
Research Question: 2. Is cost behavior still sticky, after controlling for economic variables?
As can see in Figure 6 and Model (2) in Table 6, total operating costs are still sticky.
Research Hypothesis:H2a. Cost behavior is still sticky, after
controlling for economic variables.Hypothesis 2a predicted that cost behavior is
still sticky, after controlling for economic variables. Hypothesis 2a was supported for all models.
Research Question: 3. Do adjustment costs affect the degree of cost stickiness?
The results indicated that adjustment costs
affect the degree of cost stickiness.Research Hypothesis:H3a. Adjustment costs affect the degree of
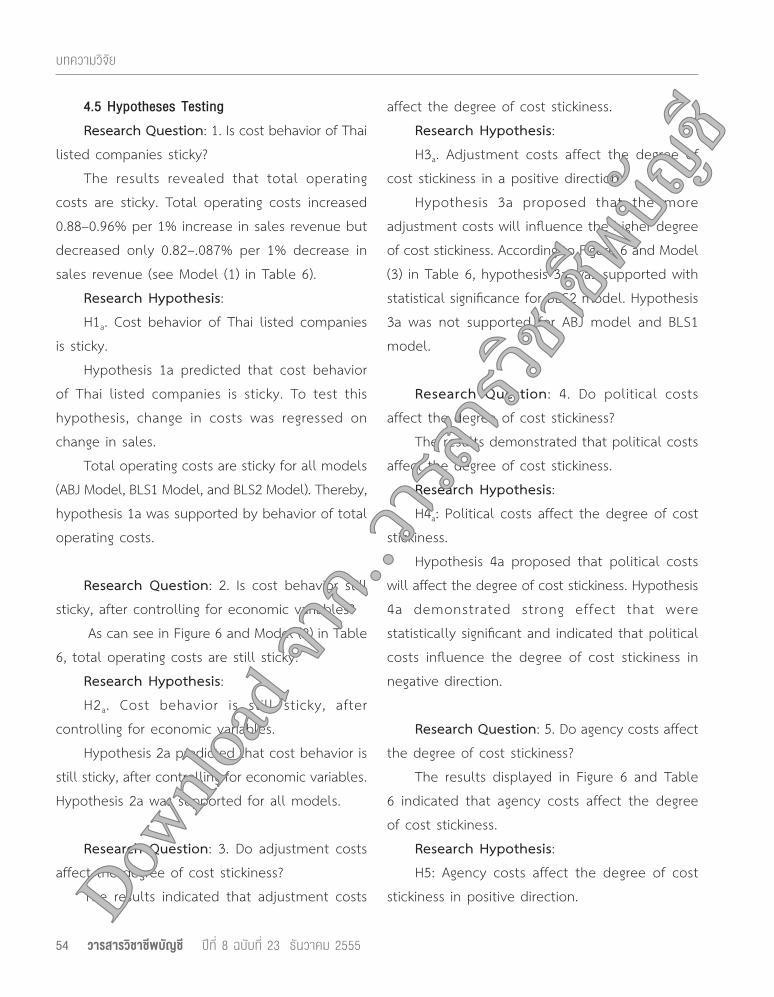
cost stickiness in a positive direction.Hypothesis 3a proposed that the more
adjustment costs will infl uence the higher degree of cost stickiness. According to Figure 6 and Model (3) in Table 6, hypothesis 3a was supported with statistical signifi cance for BLS2 model. Hypothesis 3a was not supported for ABJ model and BLS1 model.
Research Question: 4. Do political costs affect the degree of cost stickiness?
The results demonstrated that political costs affect the degree of cost stickiness.
Research Hypothesis:H4a: Political costs affect the degree of cost
stickiness.Hypothesis 4a proposed that political costs
will affect the degree of cost stickiness. Hypothesis 4a demonstrated strong effect that were statistically signifi cant and indicated that political costs infl uence the degree of cost stickiness in negative direction.
Research Question: 5. Do agency costs affect the degree of cost stickiness?
The results displayed in Figure 6 and Table 6 indicated that agency costs affect the degree of cost stickiness.
Research Hypothesis:H5: Agency costs affect the degree of cost
stickiness in positive direction.Down
load จ
าก..วา
รสารวิช
าชีพบัญ
ชี
ป�ที่ 8 ฉบับที่ 23 ธันวาคม 2555 วารสารวิชาชีพบัญชี 55
The Determinants of Sticky Cost Behavior: A Structural Equation Modeling Approach
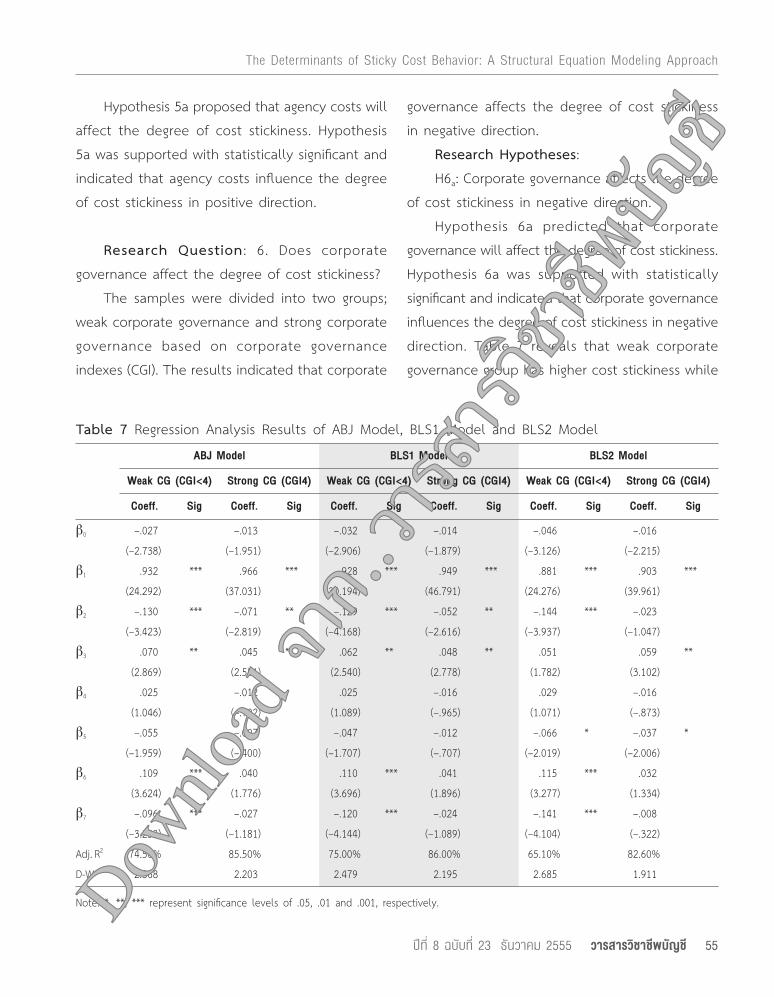
Hypothesis 5a proposed that agency costs will affect the degree of cost stickiness. Hypothesis 5a was supported with statistically signifi cant and indicated that agency costs infl uence the degree of cost stickiness in positive direction.
Research Question: 6. Does corporate governance affect the degree of cost stickiness?
The samples were divided into two groups; weak corporate governance and strong corporate governance based on corporate governance indexes (CGI). The results indicated that corporate
governance affects the degree of cost stickiness in negative direction.
Research Hypotheses:H6a: Corporate governance affects the degree
of cost stickiness in negative direction.Hypothesis 6a predicted that corporate
governance will affect the degree of cost stickiness. Hypothesis 6a was supported with statistically signifi cant and indicated that corporate governance infl uences the degree of cost stickiness in negative direction. Table 7 reveals that weak corporate governance group has higher cost stickiness while
Table 7 Regression Analysis Results of ABJ Model, BLS1 Model and BLS2 Model
ABJ Model BLS1 Model BLS2 Model
Weak CG (CGI<4) Strong CG (CGI4) Weak CG (CGI<4) Strong CG (CGI4) Weak CG (CGI<4) Strong CG (CGI4)
Coeff. Sig Coeff. Sig Coeff. Sig Coeff. Sig Coeff. Sig Coeff. Sig
β0 –.027 –.013 –.032 –.014 –.046 –.016
(–2.738) (–1.951) (–2.906) (–1.879) (–3.126) (–2.215)
β1 .932 *** .966 *** .928 *** .949 *** .881 *** .903 ***
(24.292) (37.031) (30.194) (46.791) (24.276) (39.961)
β2 –.130 *** –.071 ** –.129 *** –.052 ** –.144 *** –.023
(–3.423) (–2.819) (–4.168) (–2.616) (–3.937) (–1.047)
β3 .070 ** .045 * .062 ** .048 ** .051 .059 **
(2.869) (2.551) (2.540) (2.778) (1.782) (3.102)
β4 .025 –.012 .025 –.016 .029 –.016
(1.046) (–.702) (1.089) (–.965) (1.071) (–.873)
β5 –.055 –.007 –.047 –.012 –.066 * –.037 *
(–1.959) (–.400) (–1.707) (–.707) (–2.019) (–2.006)
β6 .109 *** .040 .110 *** .041 .115 *** .032
(3.624) (1.776) (3.696) (1.896) (3.277) (1.334)
β7 –.096 *** –.027 –.120 *** –.024 –.141 *** –.008
(–3.253) (–1.181) (–4.144) (–1.089) (–4.104) (–.322)
Adj. R2 74.50% 85.50% 75.00% 86.00% 65.10% 82.60%
D-W 2.368 2.203 2.479 2.195 2.685 1.911
Note: *, **, *** represent significance levels of .05, .01 and .001, respectively.Down
load จ
าก..วา
รสารวิช
าชีพบัญ
ชี
56 วารสารวิชาชีพบัญชี ป�ที่ 8 ฉบับที่ 23 ธันวาคม 2555
บทความวิจัย
cost behavior of strong corporate governance group is less sticky. The results indicated that the determinants of cost stickiness are political costs and agency costs, when companies are weak in corporate governance. These fi ndings implied that good corporate governance can reduce agency cost.
5. Conclusions and DiscussionsThis study was designed to investigate the
determinants of sticky cost behavior by using the structural equation modeling (SEM) approach. The measurement models of adjustment costs, political costs, and agency costs were developed and tested. The results suggested that total operating costs are sticky for all sticky cost behavior models (ABJ Model, BLS1 Model, and BLS2 Model). Total operating costs increase by around 0.93% per 1% increase in sale revenue, but decrease only 0.86% per 1% decrease in sale revenue. Cost behavior is still sticky after controlling economic growth for all models. Only BLS2 model demonstrated effect of adjustment costs on the degree of cost stickiness in positive direction while agency costs affect the degree of cost stickiness in positive direction for all models. Political costs and corporate governance affect the degree of cost stickiness in negative direction.
Cost behavior of Thai listed companies is sticky. This fi nding provided support to prior research (Anderson et al., 2003; Subramaniam & Weidenmier, 2003; Medeiros and Costa, 2004; Banker et al., 2008; Balakrishnan & Gruca, 2008). The results reveled that they are not only economic variables but
also other factors which affect the degree of cost stickiness. Several research studied supported the effects of economic growth on sticky cost behavior (Anderson et al., 2003; Banker & Chen, 2006b; Anderson& Lanen, 2007; Banker et al., 2008; Chen et al., 2008). Therefore, these fi ndings implied that the degree of cost stickiness is subjected to the deliberate resource adjustment decision made by managers. The effects of adjustment costs on the degree of cost stickiness partially supported the fi ndings in the existing literature. The premise of adjustment cost theory, which managers will be hesitant about making decision to decrease resources when sales decrease, is confi rmed by these fi ndings.
The results from this study demonstrated that political costs were related to the degree of cost stickiness. This provided further evidence to support the accounting research which found that high political cost companies have a greater incentive to adjust accounting number and financial ratios to desired target (Seay et al., 2004). Agency costs showed signifi cant effects on sticky cost behavior, and therefore provided support for the existing literature (Anderson et al., 2003; Banker et al., 2008; Chen et al., 2008; Banker et al., 2011). This result confi rmed agency theory which proposed that managers may not behave in the way that aligned with shareholders’ interests. Then, sticky costs may occur from the role of manager in adjusting committed resources in response to change in activities. The evidence from this study has revealed that higher agency costs were associated with a signifi cantly higher Do
wnloa
d จาก.
.วารสา
รวิชาชีพ
บัญชี
ป�ที่ 8 ฉบับที่ 23 ธันวาคม 2555 วารสารวิชาชีพบัญชี 57
The Determinants of Sticky Cost Behavior: A Structural Equation Modeling Approach
degree of cost stickiness. Even though CGI cannot be a variable in the model, the findings are consistent with earlier studies (Chen et al., 2008). It proved that corporate governance can reduce agency costs and the degree of cost stickiness. It makes managers to act aligned with shareholders’ interests instead of their own interests.
It is the most important to understand the limitations of this research so that circumspection can be exercised when interpreting and referring the results. To begin with new methodology that introduced in this study is only Semi-SEM, so indirect effects of the variables cannot be examined. The measurement models of adjustment costs, political costs, and agency costs were constructed with confi rmatory factor analysis (CFA). The adjustment cost model, agency cost model, and political cost model are good fi t. However, measurement model of political costs has construct reliability only 63%. It is recommended that future studies, which utilize political costs as variables, continue to develop an appropriate and reliable measurement model of political costs.
This study has implication for practice. To increase potential for competition, Thai companies should have accounting systems that are consistent with international standards, transparent and verifiable (Trairatvorakul, 2011). Information is therefore important. Management accounting is a part of the information system. Managers need economic information in order to make decisions effi ciently concerning the allocation of scarce economic resources (Atrill & McLaney, 2009). An understanding cost behavior is critical to managers
so that they can predict accurate future costs. Knowing that cost behavior is sticky can help managers and accountants to realize and be careful when they apply cost estimation method that based on tradition model of cost behavior in cost analysis.
Another consideration for understanding managers’ behavior, the determinants of sticky cost behavior may reveal behavior of managers which is not disclosed in fi nancial reports. This is material information for investors and fi nancial analysts when they analyze fi nancial statements. They can make informed decision so that they will receive highest returns from investment.
In this study, the political costs were shown to be associated with the degree of cost stickiness. The result implied that the government policies have an infl uence on cost behavior of companies. Hence, the government should consider policies and regulations in macroeconomic and microeconomic perspectives.
As reported above, this study proved that good corporate governance can reduce agency cost. Thai Institute of Directors Association (IOD) should encourage and invite companies to engage in the IOD’s project which has reported the results of the evaluation of corporate governance practices of Thai listed companies since 2001.
A further important implication is the research model. Political process theory was incorporated into the model via political costs and was a major addition that has not been adequately addressed in the existing literature in regard to the effects it has on cost stickiness. In addition, the new method Do
wnloa
d จาก.
.วารสา
รวิชาชีพ
บัญชี
58 วารสารวิชาชีพบัญชี ป�ที่ 8 ฉบับที่ 23 ธันวาคม 2555
บทความวิจัย
and alternative models were utilized to develop cost behavior models. Although the results of the models relations were mixed, there were a suffi cient number of paths which had statistically significant interaction between constructs to support the complex relationships.
Lastly, it is recommended to confi rm the fi ndings of this study with non-listed companies. Additional research results that utilize different samples would validate that these results found here could be generalized to all Thai companies.
ReferencesAnderson, J. C., & Gerbing, D. W. (1988). Structural
Equation Modeling in Practice: A Review and
Recommended Two-step Approach. Psychological
Bulletin, 103(3), 411–423.
Anderson, M. C., Banker, R. D., & Janakiraman, S. N.
(2003). Are Selling, General, and Administrative
Costs “Sticky”? Journal of Accounting Research,
41(1), 47–63.
Anderson, S. W., & .Lanen, W. N. (2007). Understanding
Cost Management: What Can We Learn from
the Evidence on ‘Sticky Costs? Working Paper.
Rice University.
Anderson, W. S., Chen, C. X., & Young, S. M. (2005).
Sticky Costs as Competitive Response: Evidence
on Strategic Cost Management at Southwest
Airlines. Working Paper. Rive University.
Ang, J. S., Cole, R. A., & Lin, J. W. (2000). Agency
Costs and Ownership Structure. Journal of
Finance, 55(1), 81–106.
Arbuckle,J.L. (2007). Amos™ 16 user’s guide. Chicago:
SPSS.
Atrill, P., & McLaney, E. (2009) Management Accounting
for Decision Makers (6th ed.). Harlow: Prentice-
Hall, Inc.
Balakrishnan, R., & Gruca, T. S. (2008). Cost Stickiness
and Core Competency: A Note. Contemporary
Accounting Research, 25(1), 993–1006.
Balakrishnan, R., Labro, E., & Soderstrom, N. (2010).
Cost Structure and Sticky Costs. Working Paper.
University of Iowa.
Banker, R. D., Byzalov, D., & Plehn-Dujowich, J.M.
(2011). Sticky Cost Behavior: Theory and
Evidence. Working Paper. Temple University.
Banker, R. D., & Chen, L. (2006a). Labor Market
Characteristics and Cross-Country Differences
in Cost Stickiness. Working Paper. Temple
University.
Banker, R. D., & Chen, L. (2006b). Predicting Earnings
Using a Model Based on Cost Variability and
Cost Stickiness. The Accounting Review, 81(2),
285–307.
Banker, R. D., Ciftci, M., & Mashruwala, R. (2008).
Managerial Optimism, Prior Period Sales Changes,
and Sticky Cost Behavior. Working Paper. Temple
University.
Beaver, William H. (1989). Financial Reporting: An
Accounting Revolution (2nd Ed.). New Jersey:
Prentice-Hall, Inc.
Belkaoui, A., & Karpik, P. G. (1989). Determinants of the
Corporate Decision to Disclose Social Information.
Accounting, Auditing and Accountability Journal
2(1), 36–51.
Bentler, P. M. & Chou, C. P. (1987). Practice Issue
in Structural Equation Modeling. Sociological
Methods and Research, 16(1), 78–117.Down
load จ
าก..วา
รสารวิช
าชีพบัญ
ชี
ป�ที่ 8 ฉบับที่ 23 ธันวาคม 2555 วารสารวิชาชีพบัญชี 59
The Determinants of Sticky Cost Behavior: A Structural Equation Modeling Approach
Bhagat, S., & Jefferis., R. H. (2002). The Econometrics
of Corporate Governance Studies. London: The
MIT Press.
Birt, J. l., Bilson, C. M., Smith, T., & Whaley, R. E.
(2006). Ownership, Competition, and Financial
Disclosure. Australian Journal of Management,
31(2), 235-263.
Calleja, K., Steliaros, M. E., & Thomas, D. C. (2006).
A Note on Cost Stickiness: Some International
Comparisons. Management Accounting Research,
17, 127–140.
Chae, J., Kim, S., & Lee, E. J. (2009). How Corporate
Governance Affects Payout Policy under Agency
Problems and External Financing Constraints.
Journal of Banking & Finance, In Press, Corrected
Proof.
Chen, C. X., Lu, H., & Sougiannis, T. (2008). Managerial
Empire Building, Corporate Governance, and the
Asymmetrical Behavior of Selling, General, and
Administrative Costs. Paper presented at the
2009 Management Accounting Section Research
and Case Conference, Florida.
Cooper, R.W., & Haltiwanger, C.J. (2006). On the
Nature of Capital Adjustment Costs. Review of
Economic Study, 73, 611–633.
Danizger, L.(2008). Adjustment Costs, Inventories and
Output. The Scandinavian Journal of Economic,
110(3), 519–542.
Deegan, C.,& Unerman, J. (2011). Financial Accounting
Theory (2nd ed.). London: McGraw-Hill Companies,
Inc.
Demsetz, H.,& Lehn, K.(1985). The Structure of
Corporate Ownership: Causes and Consequences.
Journal of Political Economy, 93, 1155–1177.
Dey, A. (2008). Corporate Governance and Agency
Confl icts. Journal of Accounting Research, 46(5),
1143–1181.
Dierynck, B., & Renders, A. (2009). Earnings Management
Incentives and the Asymmetric Behavior of Labor
Costs. Paper presented at the 2009 GMARS
Conference.
Epstein, L. G., & Denny, M.G.S. (1986). The Multivariate
Flexible Accelerator Model: Its Empirical Restrictions
and an Application to U.S. Manufacturing.
Econometrica, 51(3), 647–674.
Florackis, C. (2008). Agency Costs and Corporate
Governance Mechanisms : Evidence for UK fi rms.
International Journal of Managerial Finance,
4(1), 37–59.
Foster, G. (1986). Financial Statement Analysis (2nd
ed.). New Jersey: Prentice-Hall,Inc.
Gamerschlag, R., Moller, K., & Verbeeten, F. (2010).
Determinants of Voluntary CSR Disclosure:
Empirical Evidence from Germany. Review
Management Science, 1–30.
Godfrey, J. M., & Jones, K. L. (1999). Political cost
infl uence on income smoothing via extraordinary
item classifi cation. Accounting & Finance, 39,
229–254.
Grace, M. F., & Leverty, J. T. (2010). Political Cost
Incentives for Managing the Property-Liability
Insurer Loss Reserve. Journal of Accounting
Research, 48, 21–49.
Groth, C.,& Khan, H. (2010). Investment Adjustment
Costs: An Empirical Assessment. Journal of
Money, Credit and Banking, 42(8), 1469–1494.
Hamermesh, D. S.,& Pfann, G. A. (1996). Adjustment
Costs in Factor Demand. Journal of Economic Down
load จ
าก..วา
รสารวิช
าชีพบัญ
ชี
60 วารสารวิชาชีพบัญชี ป�ที่ 8 ฉบับที่ 23 ธันวาคม 2555
บทความวิจัย
literature, 34(3), 1264–1292.
Hancock, G. R., & Mueller, R, O. (2006). Structural
Equation Modeling: A Second Course. Connecticut:
Information Age Publishing, Inc.
Henry, D. (2009). Agency Costs, Ownership Structure
and Corporate Governance Compliance: A Private
Contracting Perspective. Pacifi c-Basin Finance
Journal, In Press, Corrected Proof.
Hilton, R. W., Maher, M. W., & Selto, F. H. (2008). Cost
Management : Strategies for Business Decisions
(4th ed.). New York: McGraw-Hill, Inc.
Inoue, T., & Thomas, W. B. (1996). The Choice of
Accounting Policy in Japan. Journal of International
Financial Management and Accounting, 7(1), 1–23.
Jelinek, K., & Stuerke, P. S. (2009). The Nonlinear
Relation Between Agency Costs and Managerial
Equity Ownership. International Journal of
Managerial Finance, 5(2), 156–178.
Jensen, M. C. (1986). Agency Costs of Free Cash Flow,
Corporate Finance, and Takeovers. American
Economic Review, 76(2), 323–329.
Jensen, M. C. (1993). The Modern Industrial Revolution,
Exit, and The Failure of Internal Control Systems.
Journal of Finance, 48, 831–880.
Jensen, M. C., & Meckling, W. H. (1976). Theory of
the Firm : Managerial Behavior, Agency Costs
and Ownership Structure. Journal of Financial
Economics, 3(4), 305–360.
Kern, B. B., & Morris, M. H. (1991). Taxes and Firm Size:
The Effect of Tax Legislation during the 1980s.
The Journal of the American Taxation Association,
80–96.
Kline, R. B.(2011). Principles and Practice of Structural
Equation Modeling (3rd ed.). New York: Guilford
Press.
Kuo, K. (2007). The Impact of Product Diversifi cation
and Capacity Utilization on Cost Behavior : A
test of Cost Stickiness. Working Paper. Taiwan
University.
Lamm-Tennant, J., & Rollins, T. (1994). Incentives for
Discretionary Accounting Practices: Ownership
Structure, Earnings, Size, and Taxation. Journal
of Risk & Insurance, 61(3), 476–491.
Lanen, W. N.,Shannon W. S.,& Maher, M, W.(2011).
Fundamental of Cost Accounting (3rd ed.). New
York: McGraw-Hill.
Lang, L. H.P., Stulz, R. M., & Walkling, R. A. (1991). A
Test of the Free Cash Flow Hypothesis. Journal
of Financial Economics. 29, 315–335.
Leitao, N. C. (2011). Intra-industry Trade, Knowledge
and Adjustment Costs. Journal of Applied
Sciences, 11(14), 2652–2656.
Lucas, R. E. (1967). Adjustment Costs and the Theory
of Supply. The Journal of Political Economy,
75(4), 321–334.
Maher, M. W., Stickney, C. P., & Weil, R. L. (2008).
Manangerial Accounting: An Introduction to
Concepts, Methods and Uses (10th ed.). Manson:
Thomson Higher Education.
McKnight, P. J., & Weir, C. (2009). Agency Costs,
Corporate Governance Mechanisms and Ownership
Structure in Large UK Publicly Quoted Companies:
A Panel Data Analysis. The Quarterly Review of
Economics and Finance, 49(2), 139–158.
Medeiros, O. R., & Costa, P. S. (2004). Cost Stickiness
in Brazilian Firms. Paper presented at the
4th USP Congress of Managerial Control and
Accounting.Down
load จ
าก..วา
รสารวิช
าชีพบัญ
ชี
ป�ที่ 8 ฉบับที่ 23 ธันวาคม 2555 วารสารวิชาชีพบัญชี 61
The Determinants of Sticky Cost Behavior: A Structural Equation Modeling Approach
Mortensen, D. T.(1973). Generalized Costs of
Adjustment and Dynamic factor Demand Theory.
Econometrica, 41(4), 657- 665.
Nakamura, S. (1993). An Adjustment Cost model of
Long-term Employment in Japan. Journal of
Applied Econometrics, 8(2), 175–194.
Noreen, E., & Soderstrom, N. (1994). Are Overhead
Costs Strictly Proportional to Activity?: Evidence
From Hospital Departments. Journal of Accounting
and Economics, 17(1-2), 255–278.
Noreen, E., & Soderstrom, N. (1997). The Accuracy of
Proportional Cost Models: Evidence from Hospital
Service Departments. Review of Accounting
Studies, 2(1), 89–114.
Peltzman, S. (1976). Toward a More General Theory
of Regulation. Journal of Law and Economics,
19(8), 211–240.
Seay, S. S., Pitts, S. T., & Kamery, R. H. (2004). The
Contribution of Firm-specifi c Factors: Theory
Development of the Ratio Adjustment Process.
Paper presented at the Alli Academies international
Conference, New Orleans.
Singh, M., & Wallace, N. D. (2003). Agency Costs,
Ownership Structure and Corporate Governance
Mechanisms. Journal of Banking & Finance,
27(5), 793–816.
Smith, D.& Langfield-Smith, K. (2004). Structural
Equation Modeling on Management Accounting
Research: Critical Analysis and Opportunities.
Journal of Accounting Literature, 23, 49–86.
Subramaniam, C., & Weidenmier, M. L. (2003).
Additional Evidence on the Sticky Behavior of
Costs. Working Paper. Texas Christian University.
Thompson, B. (2004). Exploratory and Confi rmatory
Factor Analysis: Understanding Concepts
and Applications. Washington DC: American
Psychological Association.
Trairatvorakul, P. (2011). Changing and Adapting in
Financial Business Sector for Preparing into
Trade Liberalization. Retrieved May 2, 2012 from
http://www.bot.or.th/Thai/Press AndSpeeches/
Speeches/Gov/ SpeechGov_07oct2011.pdf
Truong, T. (2006). Corporate Boards, Ownership and
Agency Costs: Evidence from Australia. The
Business Review, Cambridge, 5(2), 163.
Watts, R. L., & Zimmerman, J. L. (1986). Positive
Accounting Theory. New Jersey: Prentice-Hall,
Inc.
Wong, J. (1988). Economic Incentives for the Voluntary
disclosure of Current Cost Financial Statements.
Journal of Accounting and Economics, 10,
151–167.
Yang, D. H., Lee, Y. T., & Park, K. H. (2005). Sticky
Cost Behavior Analysis of General Hospitals in
Korea. Korean Journal of Health Policy and
Administration, 15(1), 78–96.
Yasukata, K., & Kajiwara, T. (2008). Are ‘Sticky Costs’
the Result of Deliberate Decision of Managers?
Paper presented at the 2008 Annual Conference
of the Japan Accounting Association, Japan.
Zmijewski, M., & Hagerman, R. (1981). An Income
Strategy Approach to the Positive Theory of
Accounting Standard Setting Choice. Journal of
Accounting and Economics, 8, 129–149.
Down
load จ
าก..วา
รสารวิช
าชีพบัญ
ชี