


Languages
Pages
Legal


BIG telematics dataVehicle tracking
2
Sources:• Fleet surveillance e.g.
• TfL iBus data• Eddie Stobbart• Taxis*
• Insurance industry• GPS and CAN/OBD link
‘white box’ tracking• Second-by-second (1Hz)• Young driver bias• Data anonymised
* Nyhan, M., Sobolevsky, S., Kang, C., Robinson, P., Corti, A., Szell, M., Streets, D., Lu, L., Britter, R., Barrett, S., Ratti, C. 2016. Predicting vehicularemissions in high spatial resolution using pervasively measured transportation data and microscopic emissions model. Atmospheric Environment 140(2016) 352-363. http://dx.doi.org/10.1016/j.atmosenv.2016.06.018
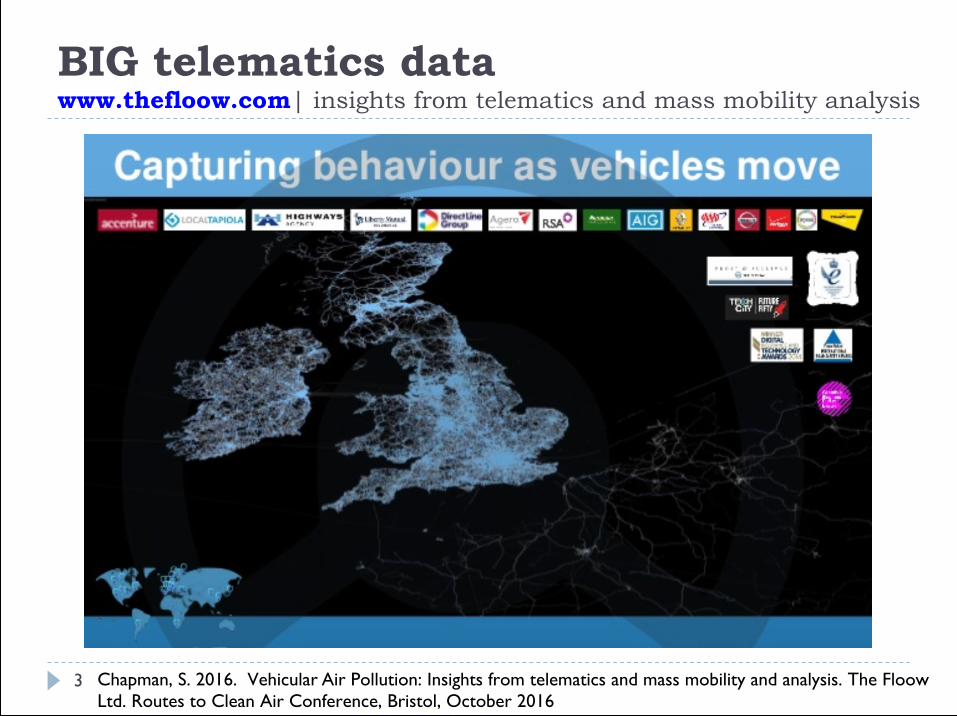
BIG telematics datawww.thefloow.com| insights from telematics and mass mobility analysis
3 Chapman, S. 2016. Vehicular Air Pollution: Insights from telematics and mass mobility and analysis. The FloowLtd. Routes to Clean Air Conference, Bristol, October 2016https://www.slideshare.net/secret/km7kcqE8oHtrn9
BENEFITSBIG telematics data
4
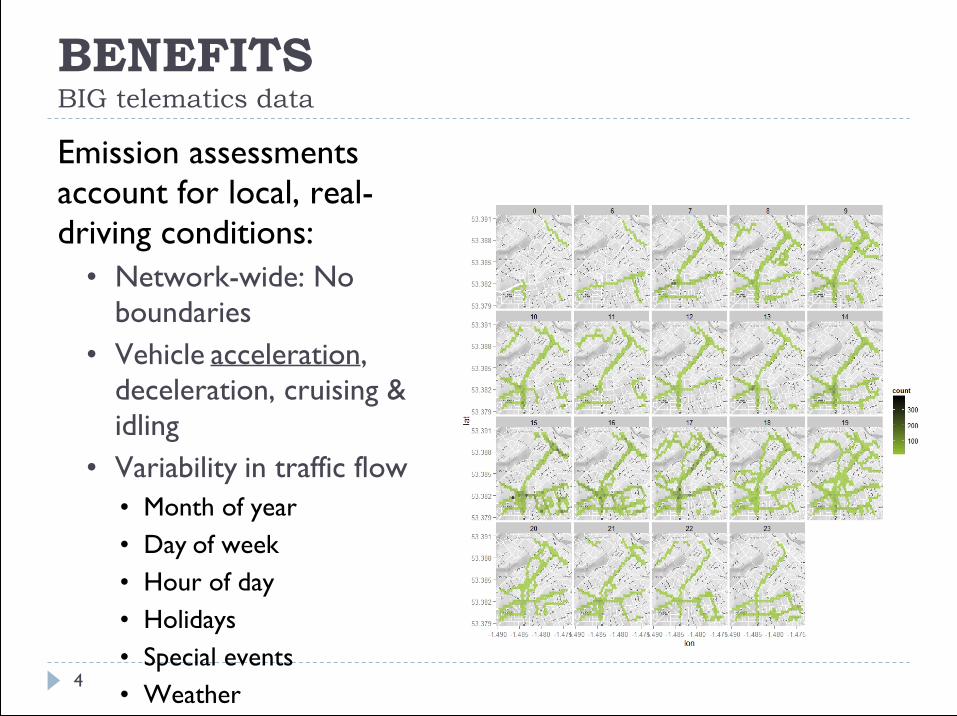
Emission assessmentsaccount for local, real-driving conditions:
• Network-wide: Noboundaries
• Vehicle acceleration,deceleration, cruising &idling
• Variability in traffic flow• Month of year• Day of week• Hour of day• Holidays• Special events• Weather• etc
FIGURE | Sample weekday GPS data byhour
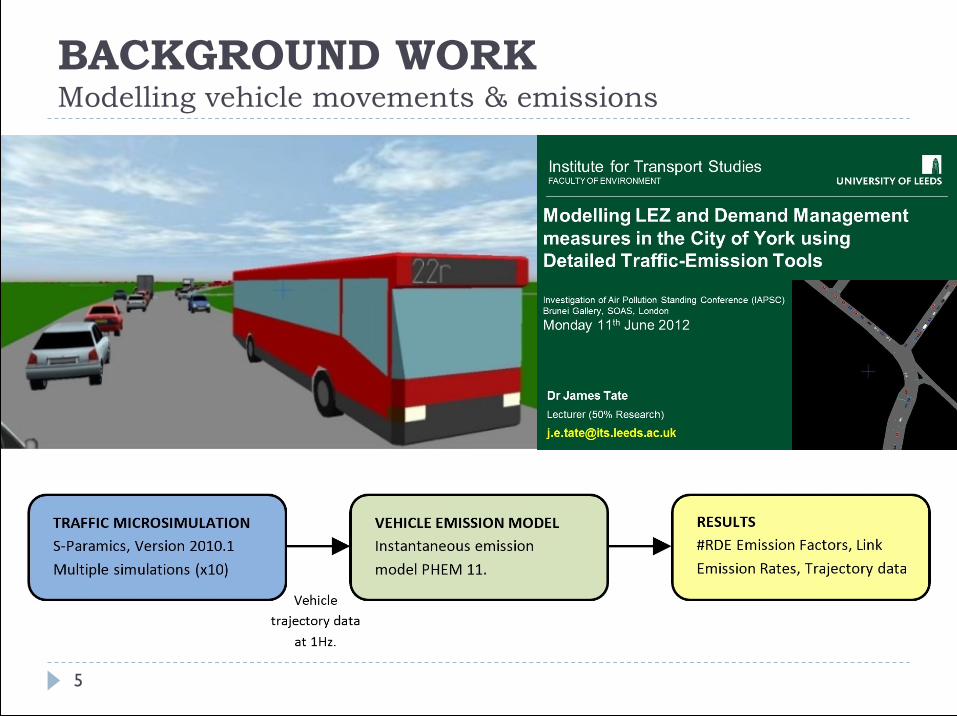
BACKGROUND WORKModelling vehicle movements & emissions
5

0 100 200 300 400 500
02
040
6080
Spee
d (k
m. h-1
)
0 100 200 300 400 500
012
34
56
7
CO2(
g.s e
c-1)
0 100 200 300 400 500
0.00
0.02
0.04
0.06
Time (seconds)
NOX(
g.s e
c-1)
UNDER-PINNING ";����-+ ;-."!�� ������� "�� ��� ;���� (6";&
Passengercar and Heavy-duty Emission Model (Euro 0 –6 / VI)FIGURES | Sample time series, TfLLondon Drive Cycle, Euro 5 diesel MPV
Modelled_NOx
Obse
rved
_NO x
0.00
0.01
0.02
0.03
0.00 0.01 0.02 0.03
Counts
112357
111623345175
111165244361535
Modelled_CO2
Obse
rved
_CO
2
0
2
4
6
8
0 2 4 6 8
Counts
1123468
11162231436186
121171241
Zallinger, M., Tate, J., Hausberger, S. 2008. An instantaneous emission model for the passengercar fleet. Transport & Air Pollution conference, Graz 2008
Moody, A., Tate, J. 2017. In Service CO2 and NOX Emissions of Euro 6/VI Cars, Light- andHeavy- duty goods Vehicles in Real London driving: Taking the Road into the Laboratory.Journal of Earth Sciences and Geotechnical Engineering 7(1):51-62 01 Jan 2017.

CASE STUDIESBIG telematics data
7
• Leeds Clean Air Zone study• One calendar year (May 2015 – May 2016)• 56,000 kms quality checked telematics data• Supporting data
• Automatic Traffic Count (ATC) data (Leeds CC on A58M)
• Log special events, incidents etc.
• Turning proportions from 2015 traffic model (SATURN)
• Detailed fleet analysis from ANPR study (April 2016)
• Met. (wind speed, direction, temp, RH, rainfall)
• Sheffield City Centre• One calendar year (May 2014 – May 2015)• 15,000 kms quality checked telematics data• Supporting data
• Met. (wind speed, direction, temp, RH, rainfall)

SHEFFIELD RESULTSVariability in driver behaviour by HOUR of day
8
FIGURE | Variation in positive VSP with HOUR of the day
NOTE: Vehicle Specific Power (VSP) is the sum of the engine loads (aerodynamicdrag, acceleration, rolling resistance, hill climbing) divided by the mass of the vehicle

SHEFFIELD RESULTSVariability in driver behaviour on HOLIDAYS
9
FIGURE | Variation in positive VSP with type of DAY / HOLIDAY
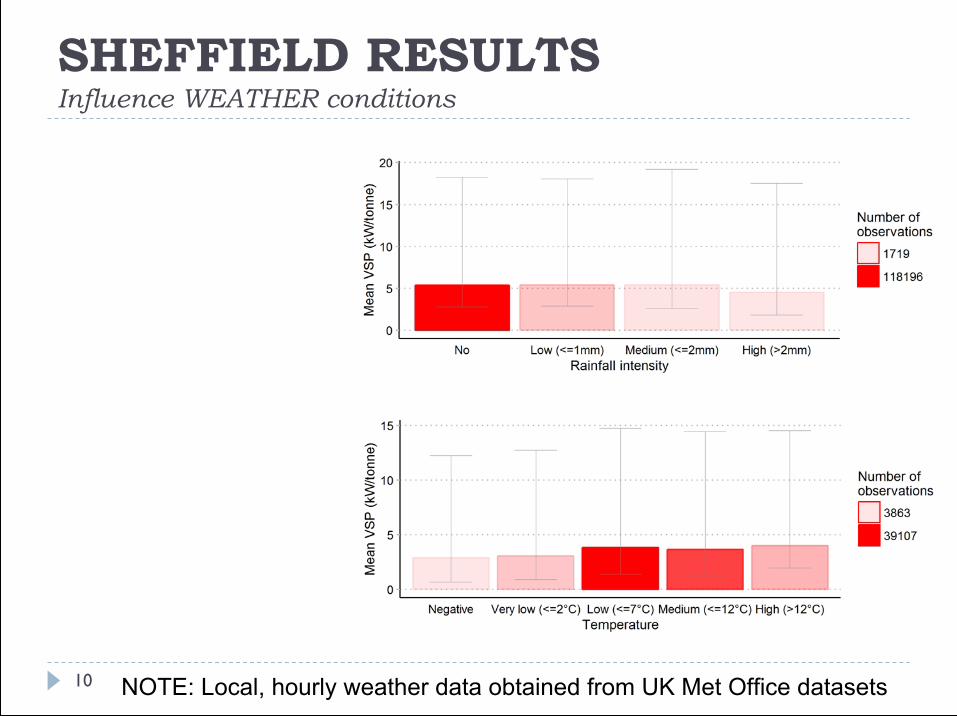
SHEFFIELD RESULTSInfluence WEATHER conditions
10
FIGURE | Variation inpositive VSP with
RAINFALL
NOTE: Local, hourly weather data obtained from UK Met Office datasets
FIGURE | Variation inpositive VSP withTEMPERATURE

LEEDS CLEAN AIR ZONE STUDY 2017
METHOD
11
'Raw' telematics
data
Temporal & Spatial
variation in VEHICLE
EMISSIONS
DATA CLEANING
Kalman filter > SPEED& ACCELERATION
+ GRADIENT
INSTANTANEOUSEMISSION MODEL
[PHEM]
LINK EMISSION FACTORS (EFs)grams.km-1 all
vehicle sub-types
WEIGHTING& SCALING EFs
by local Fleet Mix & Flowin time slices
Day typeSchool term time:
- AutumnA + B- Spring A + B
- Summer A + BSchool half-terms (all)
Christmas holidayEaster holiday
Summer holidayBank holidays
Special events [X, Y, Z]
DATAFORMAT
PHEM compatible
ANPR dataFleet mix and specification
Traffic Count data
Automatic
TIME SLICE00:00 to 06:00
36 half-hour periods:06:0006:3007:0007:3008:0008:3009:00
etc23:30
FLEET MIXProportions vary by
hour & week / weekend
A58(M) TURNING %Output SATURN
2015
CLASSIFIED LINK FLOWS
all segment IDs
DIGITAL TERRAIN MAP
0.5m gridlink GRADIENTS

METHODBIG telematics data ▶ vehicle emissions process (START)
12
'Raw' telematics
data
DATA CLEANING
Kalman filter > SPEED& ACCELERATION
+ GRADIENT
INSTANTANEOUSEMISSION MODEL
[PHEM]
Day typeSchool term time:
- AutumnA + B- Spring A + B
- Summer A + BSchool half-terms (all)
Christmas holidayEaster holiday
Summer holidayBank holidays
Special events [X, Y, Z]
DATAFORMAT
PHEM compatible
ANPR dataFleet mix and specificationTIME SLICE
00:00 to 06:0036 half-hour periods:
06:0006:3007:0007:3008:0008:3009:00
etc23:30
DIGITAL TERRAIN MAP
0.5m gridlink GRADIENTS
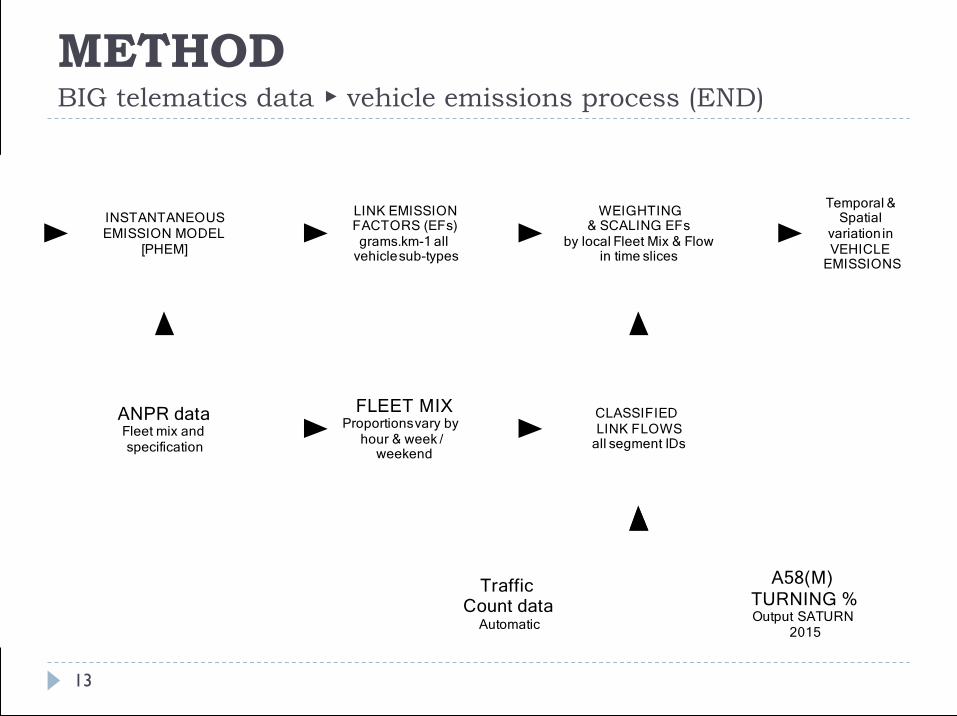
METHODBIG telematics data ▶ vehicle emissions process (END)
13
Temporal & Spatial
variation in VEHICLE
EMISSIONS
INSTANTANEOUSEMISSION MODEL
[PHEM]
LINK EMISSION FACTORS (EFs)grams.km-1 all
vehicle sub-types
WEIGHTING& SCALING EFs
by local Fleet Mix & Flowin time slices
ANPR dataFleet mix and specification
Traffic Count data
Automatic
FLEET MIXProportions vary by
hour & week / weekend
A58(M) TURNING %Output SATURN
2015
CLASSIFIED LINK FLOWS
all segment IDs

SUPPORTING DATATraffic flow on A58(M): LEEDS CC Automatic Traffic Count (ATC) site
14

BIG telematics dataHow good is the data?
15
• Pair contrasting North-South journeys (3 of 56,000 kms data)

BIG telematics dataHow good is the data?
16
• Pair contrasting North-South journeys (3 of 56,000 kms data)

LEEDS RESULTSPassenger car NOX Emission Factors (EFs)
17
FIGURE | Average (all trajectories) passenger car NOX and NO2 EmissionFactors (EFs)

LEEDS RESULTSPassenger car NOX Emission Factors (EFs)
18
FIGURE | Passenger car NOX Emission Factors (EFs) all journeys

LEEDS RESULTSVariation in time & space
19
FIGURE | Autumn term-time (first half) 08:00 Q >G�B> �� Direction South BoundPassenger car (a) speed & (b) Euro 5 diesel car NOX Emission Factors

LEEDS RESULTSVariation in time & space
20
FIGURE | Autumn term-time (first half) 08:00 Q >G�B> �� Direction North BoundPassenger car (a) speed & (b) Euro 5 diesel car NOX Emission Factors

LEEDS RESULTSVariation in time & space
21
FIGURE | Autumn term-time (first half) 12:00 Q 5��B> �� Direction South BoundPassenger car (a) speed & (b) Euro 5 diesel car NOX Emission Factors

LEEDS RESULTSVariation in time & space
22
FIGURE | Autumn term-time (first half) 12:00 Q 5��B> �� Direction North BoundPassenger car (a) speed & (b) Euro 5 diesel car NOX Emission Factors

LEEDS RESULTSVariation in time & space
23
FIGURE | Autumn term-time (first half) 17:00 Q 5I�B> �� Direction South BoundPassenger car (a) speed & (b) Euro 5 diesel car NOX Emission Factors
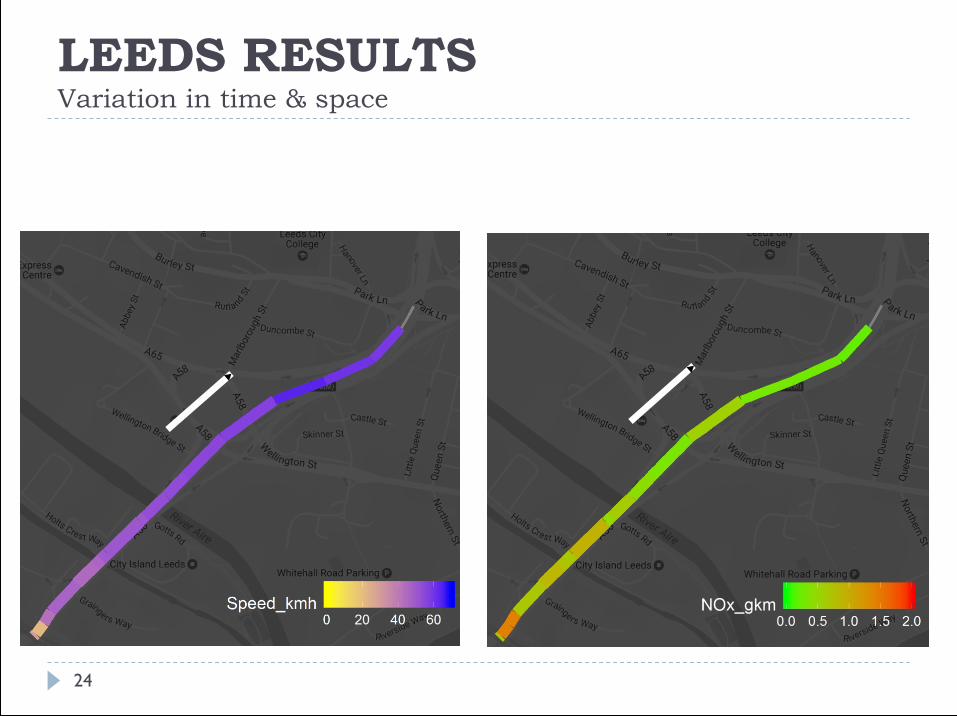
LEEDS RESULTSVariation in time & space
24
FIGURE | Autumn term-time (first half) 17:00 Q 5I�B> �� Direction North BoundPassenger car (a) speed & (b) Euro 5 diesel car NOX Emission Factors

WORK IN PROGRESSLeeds CAZ study
25
• Key tasks:• Sampling “calmer” driving trajectories estimate LGV, HGV & Bus
trajectories• Weighting & scaling time & space varying EFs by classified flow levels• Clean Air Zone scenarios• Primary NO2 fraction sensitivity testing
'Raw' telematics
data
Temporal & Spatial
variation in VEHICLE
EMISSIONS
DATA CLEANING
Kalman filter > SPEED& ACCELERATION
+ GRADIENT
INSTANTANEOUSEMISSION MODEL
[PHEM]
LINK EMISSION FACTORS (EFs)grams.km-1 all
vehicle sub-types
WEIGHTING& SCALING EFs
by local Fleet Mix & Flowin time slices
Day typeSchool term time:
- AutumnA + B- Spring A + B
- Summer A + BSchool half-terms (all)
Christmas holidayEaster holiday
Summer holidayBank holidays
Special events [X, Y, Z]
DATAFORMAT
PHEM compatible
ANPR dataFleet mix and specification
Traffic Count data
Automatic
TIME SLICE00:00 to 06:00
36 half-hour periods:06:0006:3007:0007:3008:0008:3009:00
etc23:30
FLEET MIXProportions vary by
hour & week / weekend
A58(M) TURNING %Output SATURN
2015
CLASSIFIED LINK FLOWS
all segment IDs
DIGITAL TERRAIN MAP
0.5m gridlink GRADIENTS

OUTLOOKBIG telematics data
26
SHORT-TERM: Target Case Study applications• Traffic management interventions
• Variable Speed Limits (VSL) & ‘Smart’ motorways• Demand management to alleviate congestion• Smoothing traffic flow including ecoDriving
• Complex, unstable, congested networks• Challenging to observe & model traffic flow e.g. Leeds Inner Ring Road
LONG-TERM:• Network wide, system approach• Real-time fusion of telematics, fast IEM & in-situ flow monitoring• All vehicle types: Buses (e.g. iBus London) and HGVs

Top Related