


Languages
Pages
Legal


Scottish Conservation Credits Scheme
UK Seafood Processing Sector Labour 2017
Hazel Curtis Chief Economist, Seafish
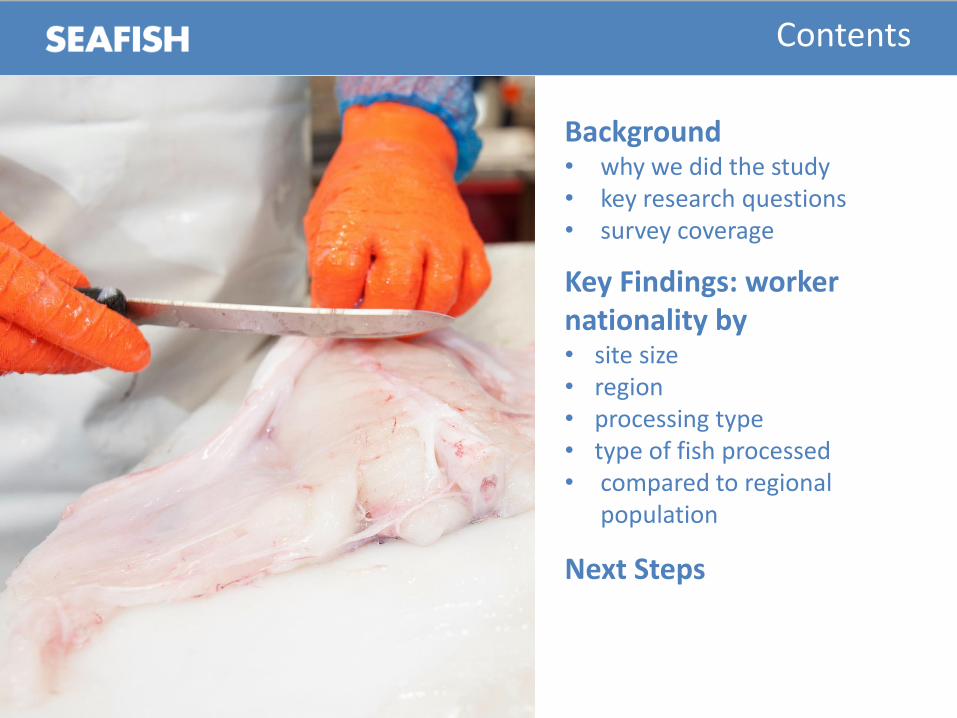
Contents
Background • why we did the study • key research questions • survey coverage
Key Findings: worker nationality by • site size • region • processing type • type of fish processed • compared to regional
population
Next Steps
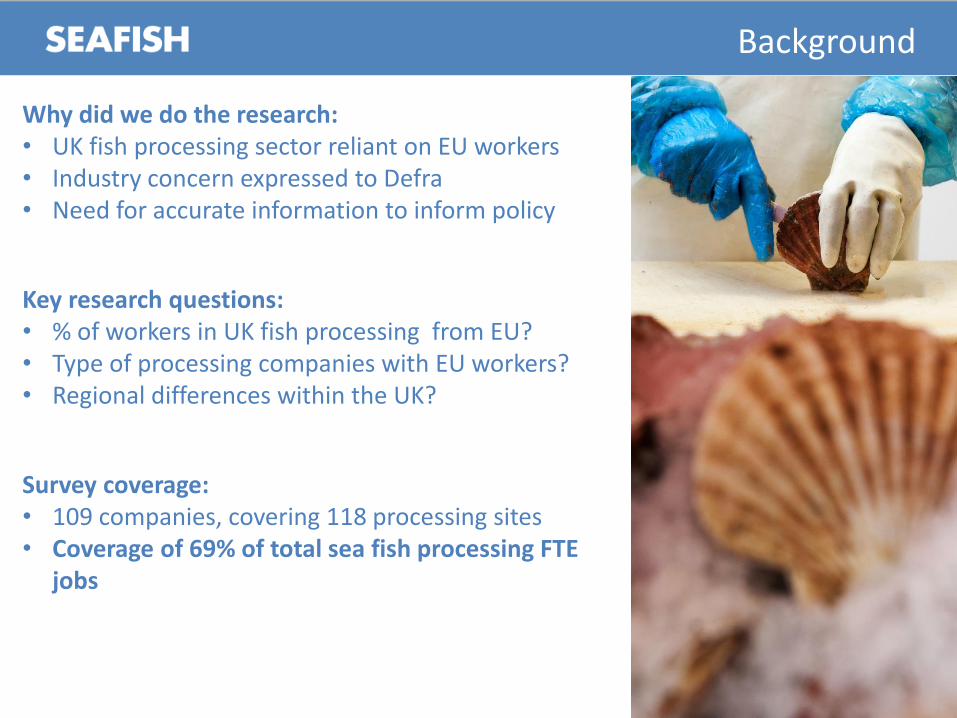
Background
Why did we do the research: • UK fish processing sector reliant on EU workers • Industry concern expressed to Defra • Need for accurate information to inform policy
Key research questions: • % of workers in UK fish processing from EU? • Type of processing companies with EU workers? • Regional differences within the UK?
Survey coverage: • 109 companies, covering 118 processing sites • Coverage of 69% of total sea fish processing FTE
jobs
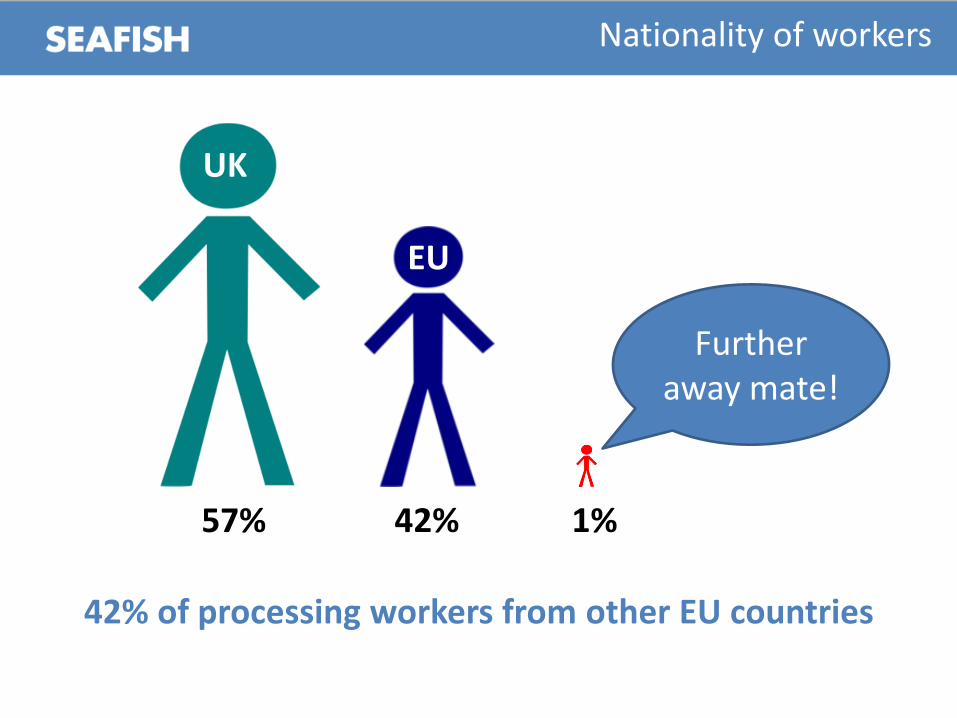
Nationality of workers
42% of processing workers from other EU countries
Further away mate!
UK
57%
EU
42% 1%
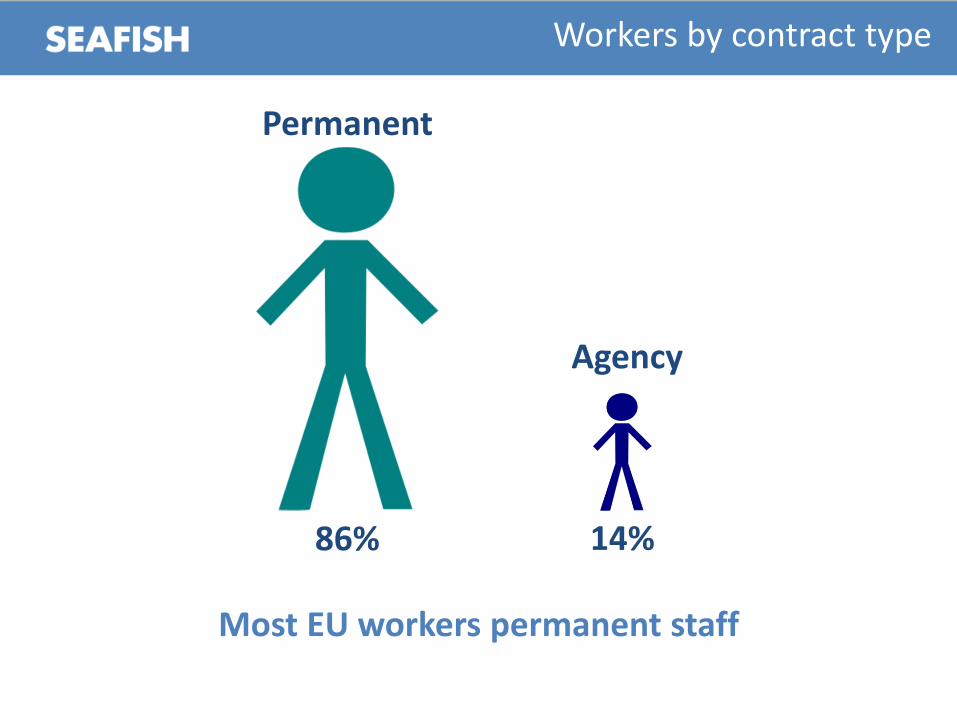
Workers by contract type
Most EU workers permanent staff
Permanent
86%
Agency
14%
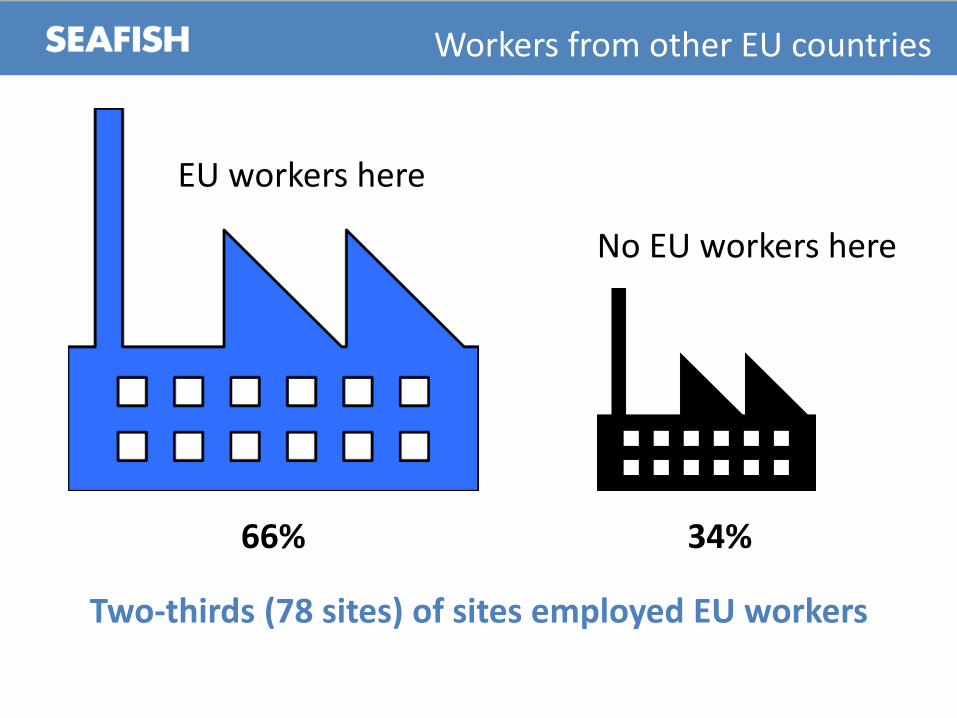
Workers from other EU countries
Two-thirds (78 sites) of sites employed EU workers
No EU workers here
34%
EU workers here
66%
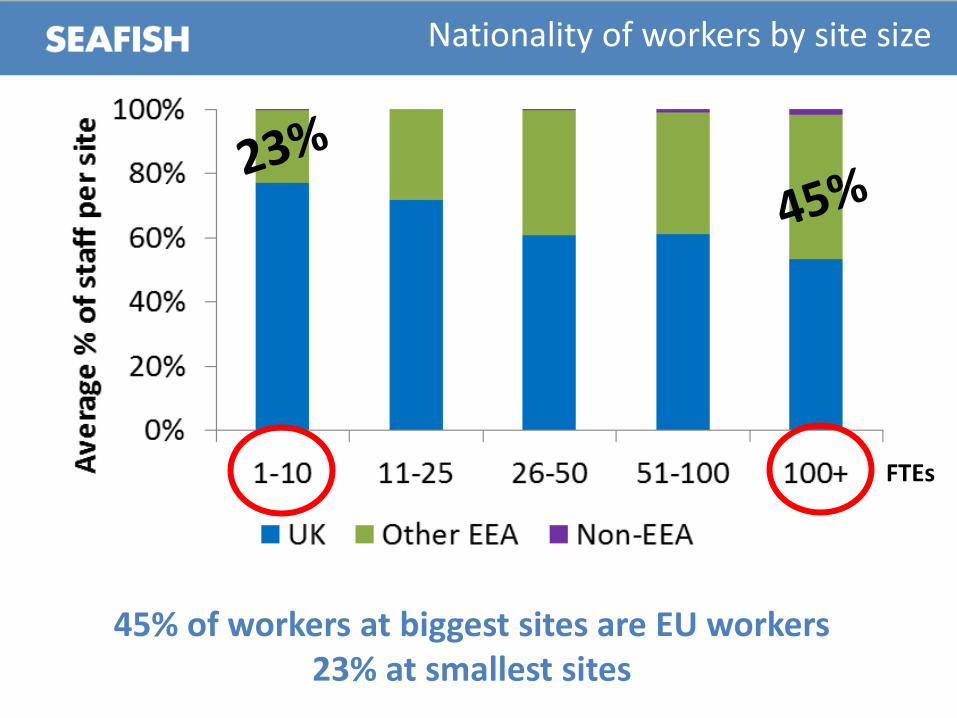
Nationality of workers by site size
45% of workers at biggest sites are EU workers 23% at smallest sites
FTEs
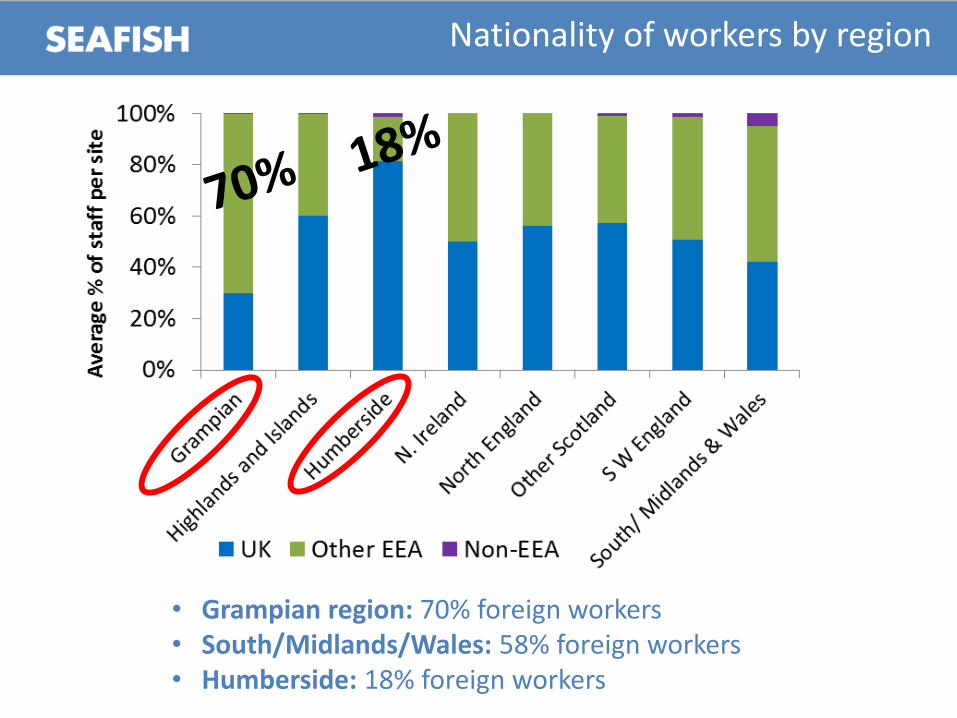
Nationality of workers by region
• Grampian region: 70% foreign workers • South/Midlands/Wales: 58% foreign workers • Humberside: 18% foreign workers
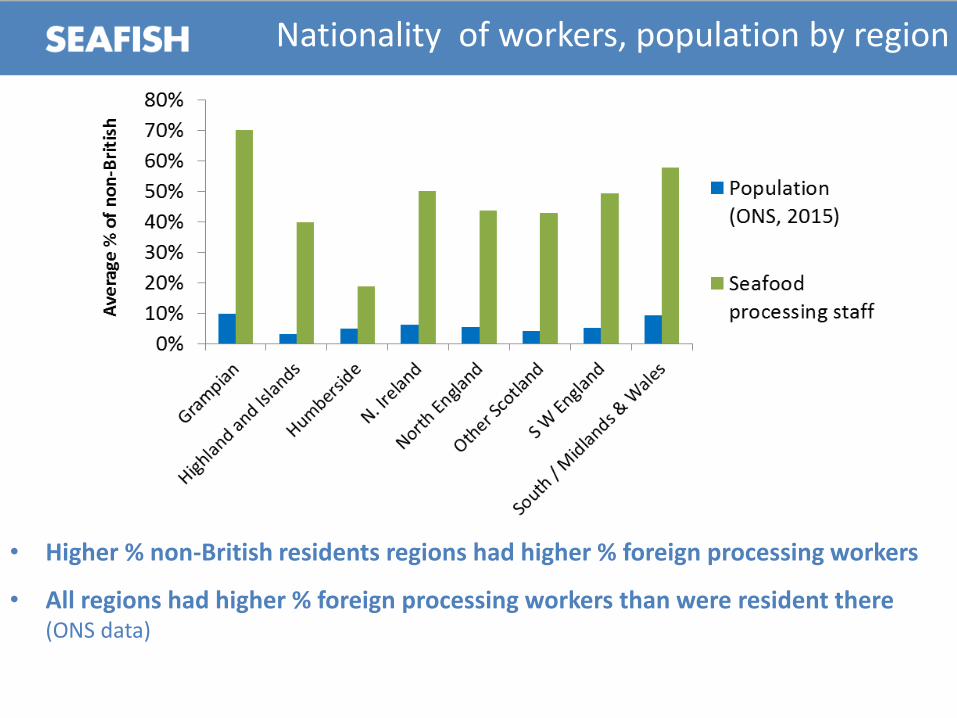
Nationality of workers, population by region
• Higher % non-British residents regions had higher % foreign processing workers
• All regions had higher % foreign processing workers than were resident there (ONS data)
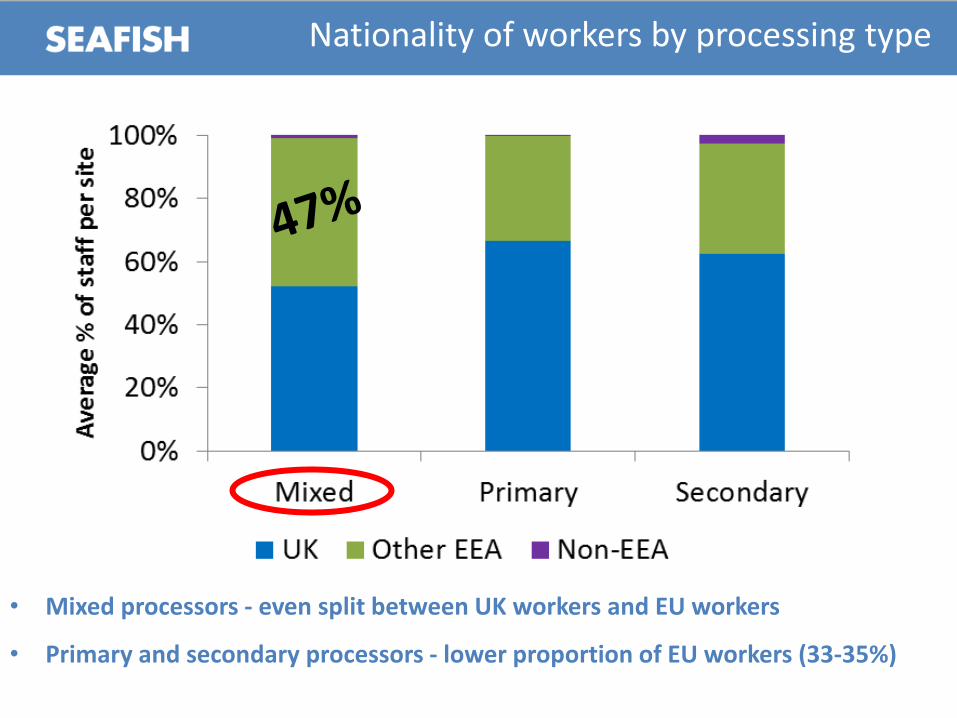
Nationality of workers by processing type
• Mixed processors - even split between UK workers and EU workers
• Primary and secondary processors - lower proportion of EU workers (33-35%)
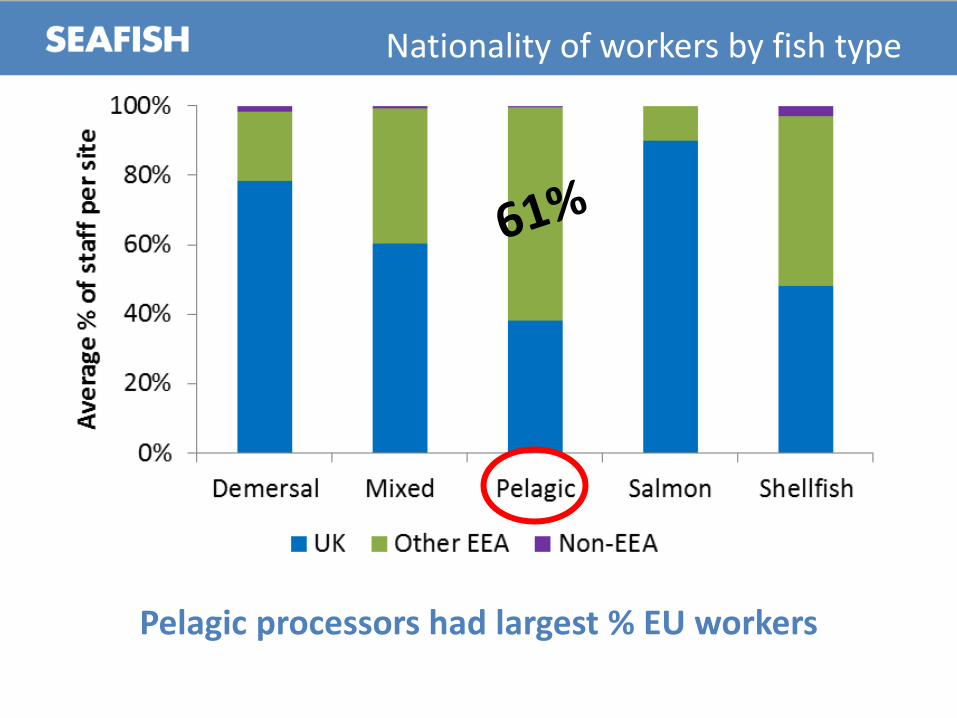
Nationality of workers by fish type
Pelagic processors had largest % EU workers
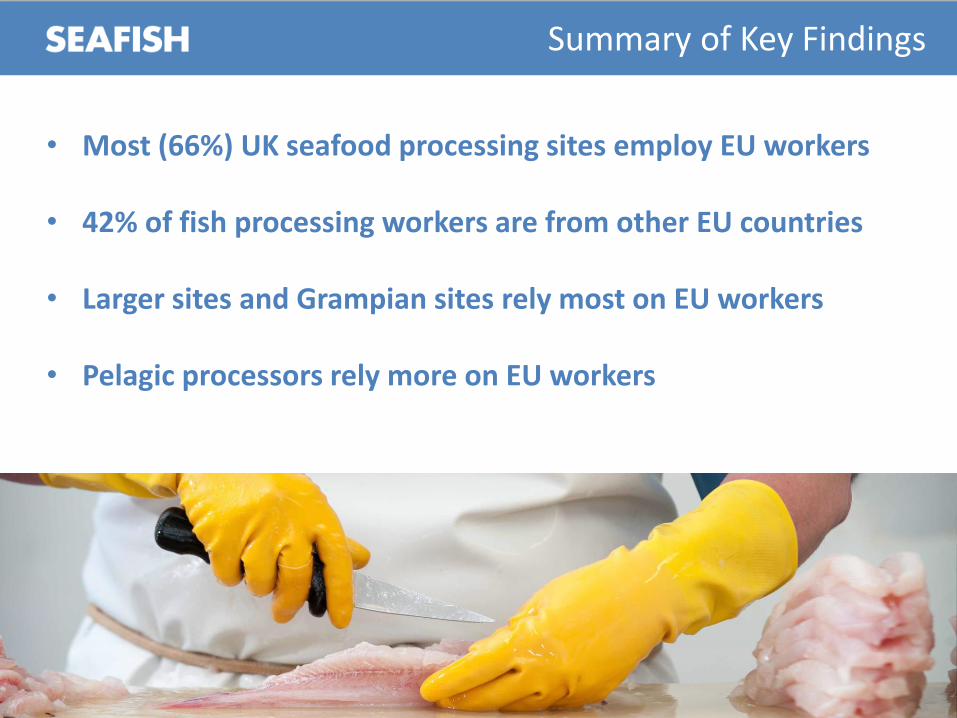
• Most (66%) UK seafood processing sites employ EU workers
• 42% of fish processing workers are from other EU countries • Larger sites and Grampian sites rely most on EU workers • Pelagic processors rely more on EU workers
Summary of Key Findings
Next Steps
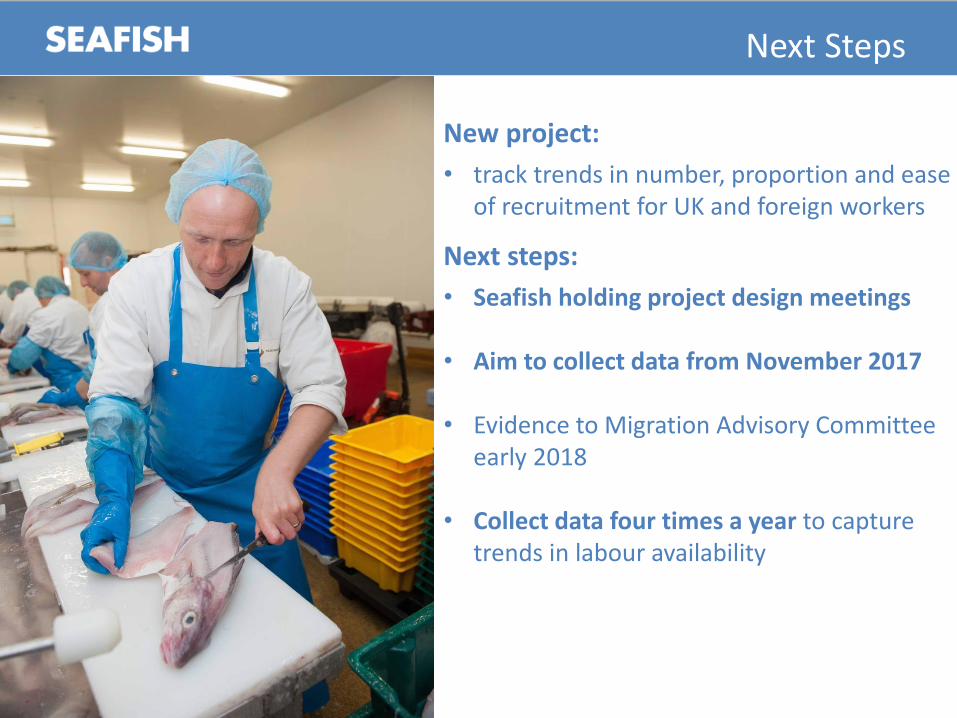
New project:
• track trends in number, proportion and ease of recruitment for UK and foreign workers
Next steps:
• Seafish holding project design meetings
• Aim to collect data from November 2017
• Evidence to Migration Advisory Committee early 2018
• Collect data four times a year to capture trends in labour availability

Thank you Hazel Curtis Chief Economist Seafish Edinburgh, UK [email protected]
Top Related