Solids Recovery from Seafood Processing Stick Water Using...
38
Solids Recovery from Seafood Processing Stick Water Using Electrocoagulation A Joint Project of: Pacific Northwest Pollution Prevention UniSea, Inc. Research Center Alaska Department of Environmental Conservation Study performed by Aqua-Terra Consultants Funded in part by a grant from the Alaska Science and Technology Foundation Printed on 100% recycled paper February 1996
Transcript of Solids Recovery from Seafood Processing Stick Water Using...
Solids Recovery fromSeafood Processing Stick Water
Using Electrocoagulation
A Joint Project of:
Pacific NorthwestPollution Prevention UniSea, Inc.
R e s e a r c h C e n t e r
Alaska Departmentof Environmental
Conservation
Study performed by Aqua-Terra Consultants
Funded in part by a grant from the Alaska Science and Technology Foundation
Printed on 100% recycled paperFebruary 1996
ACKNOWLEDGEMENTS
This report is based on a study performed by Aqua-Terra Consultants for UniSea, Inc., the PacificNorthwest Pollution Prevention Research Center (PPRC), and the Alaska Department of Environ-mental Conservation (ADEC). Alan Ismond, P.Eng., of Aqua-Terra Consultants developed theproject protocol, supervised the pilot testing and prepared a final report. The document wasreviewed, edited, and produced by Joe Frazier of UniSea, David Leviten and Kristi Thomdike ofthe PPRC, and David Wigglesworth of the ADEC. Without the full support of the project team,the study and subsequent report would not have been possible.
This project was funded in part by a grant from the Alaska Science and Technology Foundation,as well as contributions from UniSea, the PPRC, and the ADEC.
For additional copies of this report, contact:
Alaska Department of Environmental ConservationPollution Prevention Office
555 Cordova StreetAnchorage, Alaska 99501
Telephone: 907-269-7500, ext. 7586
TABLE OF CONTENTS
Introduction ....................................................................................................................................... 1UniSea Seafood Processing Wastewater Streams ....................................................................... 2Electrocoagulation ...................................................................................................................... 4Preliminary Bench Tests .............................................................................................................. 4Project Goals and Objectives ....................................................................................................... 4
Equipment and Methods .................................................................................................................... 5Equipment .................................................................................................................................... 5Methods ....................................................................................................................................... 7
Results and Discussion ...................................................................................................................... 8Set-up and Start-up ..................................................................................................................... 8Test Results and Discussion.. ....................................................................................................... 9
Conclusions and Recommendations .................................................................................................. 12Conclusions ................................................................................................................................ 12Impact of Electrocoagulation on Permit Requirements ................................................................ 13Recommendations ~..................................................................................................................... 14Additional Considerations for Future Testing .............................................................................. 14
Appendix I:
Appendix II:
Appendix III:
Appendix IV:
Appendix V:
Appendix VI:
Appendix VII:
Appendix VIII:
Appendix IX:
Appendix X:
Separability Test of Treated Stick Water, With and Without Chemical Addition
Preliminary Electrocoagulation Test, With and Without Chemical Addition (Options 1and 4 Only)
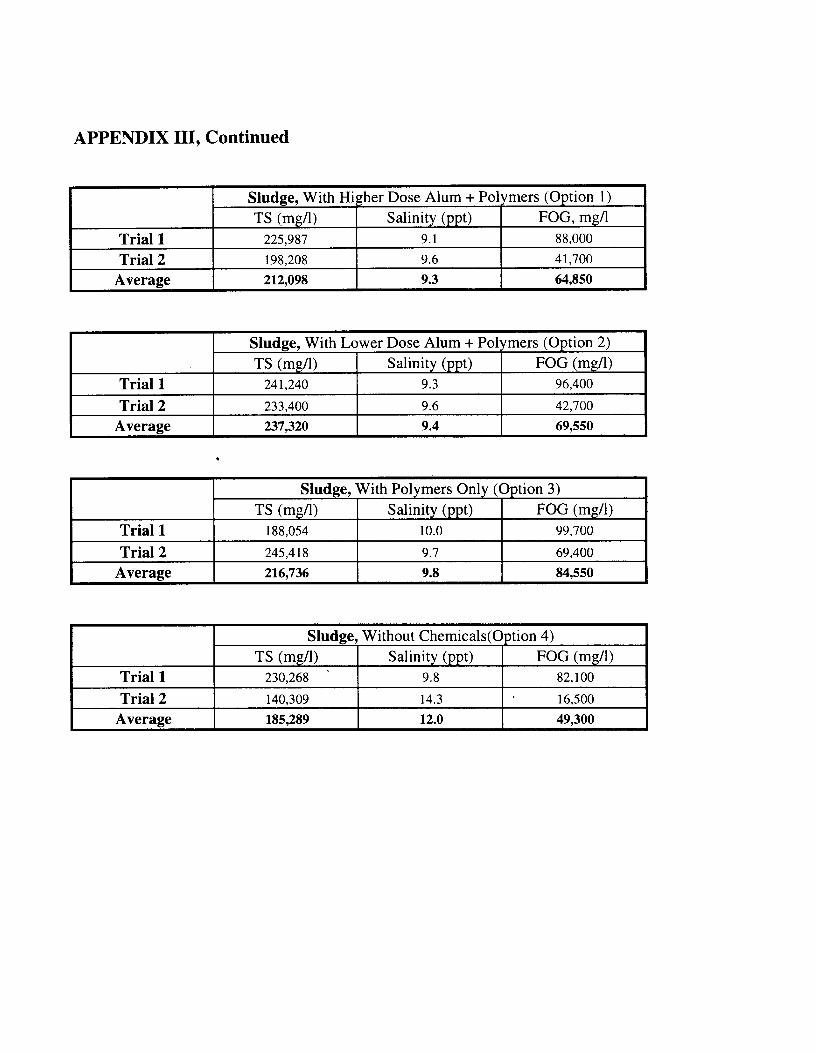
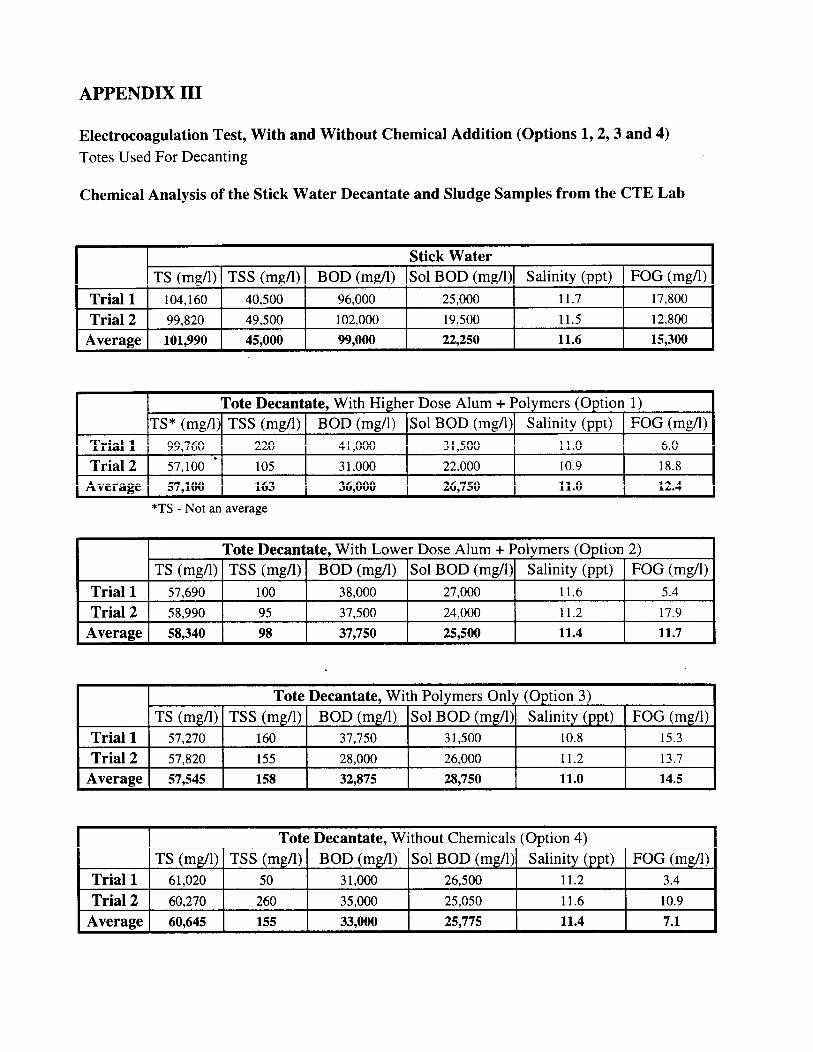
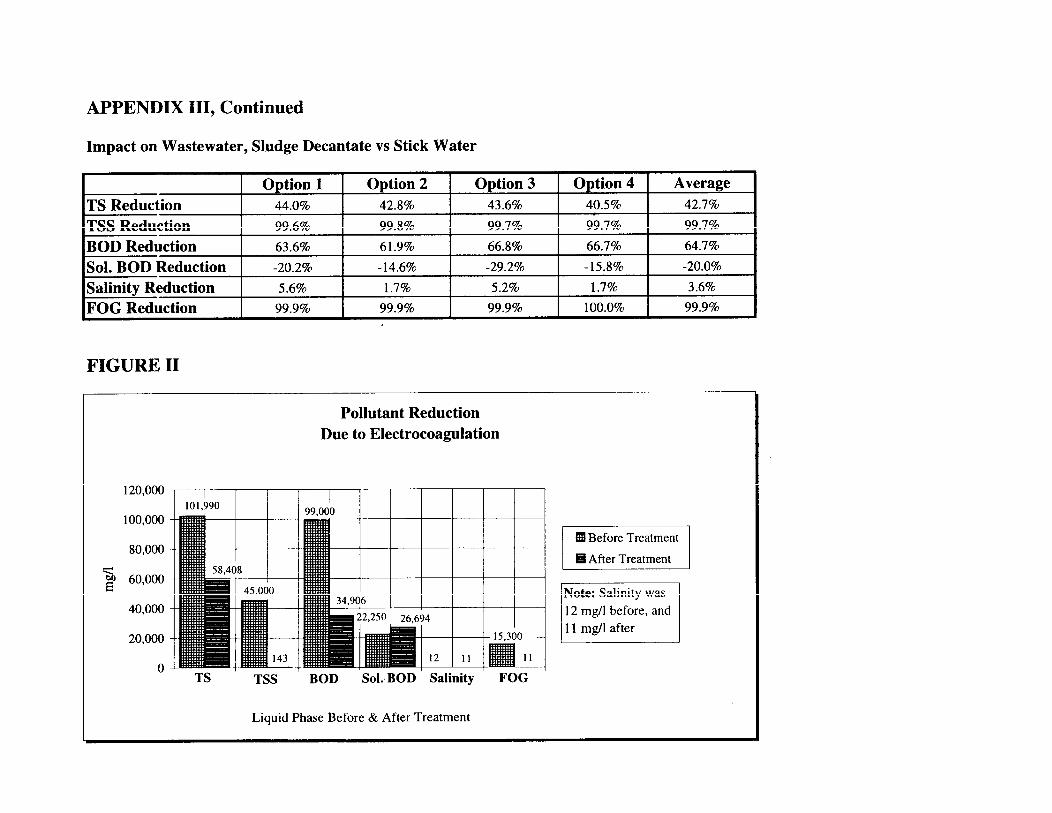
Electrocoagulation Test, With and Without Chemical Addition (Options 1, 2, 3 and 4)Impact on Wastewater, Sludge Decantate vs Stick Water
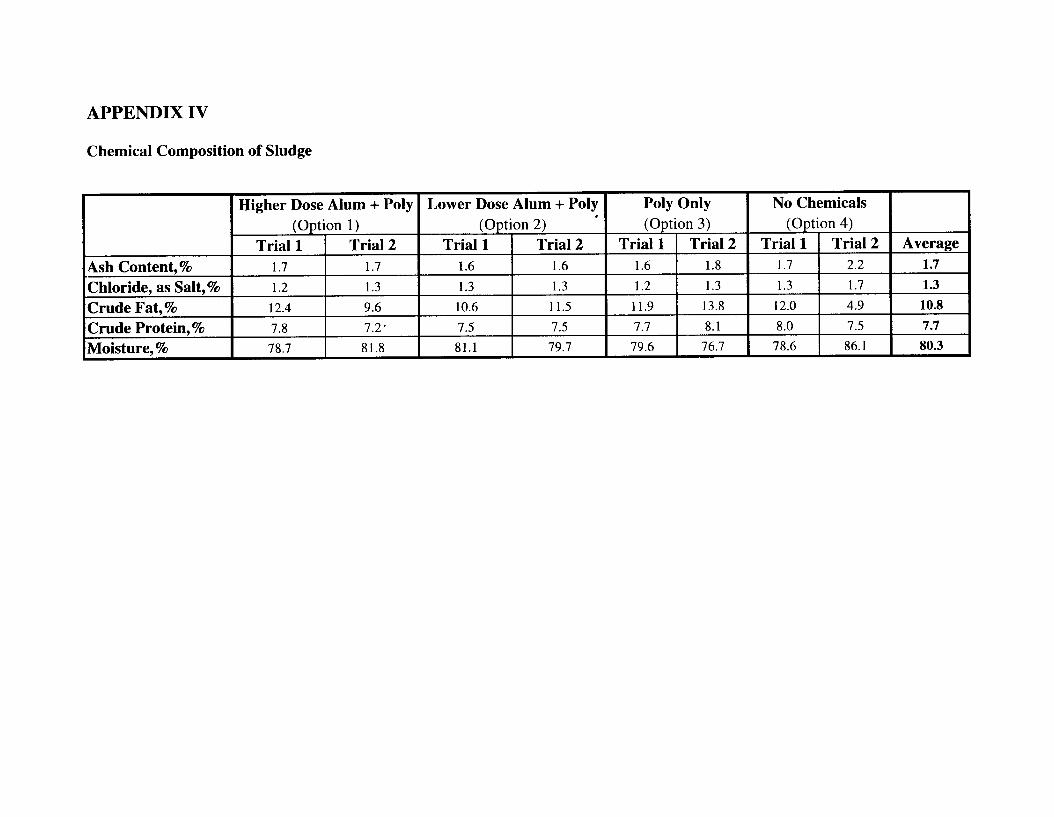
Chemical Composition of Sludge
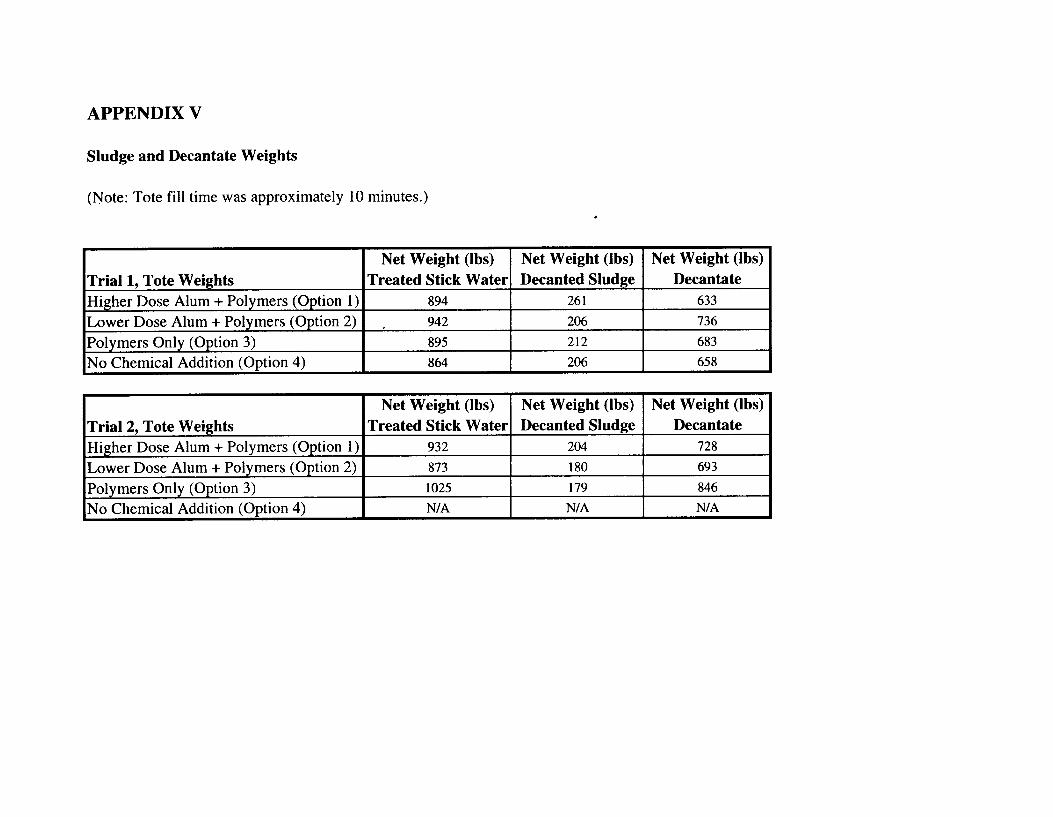
Sludge and Decantate Weights
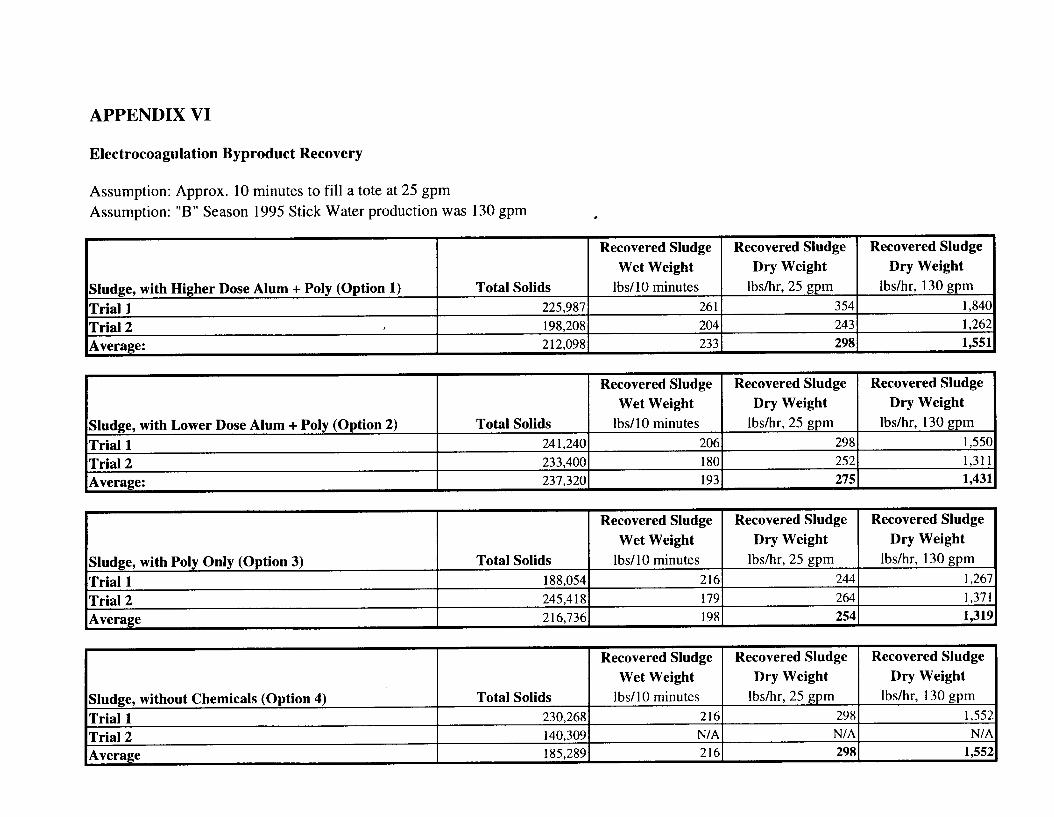
Electrocoagulation By-product Recovery
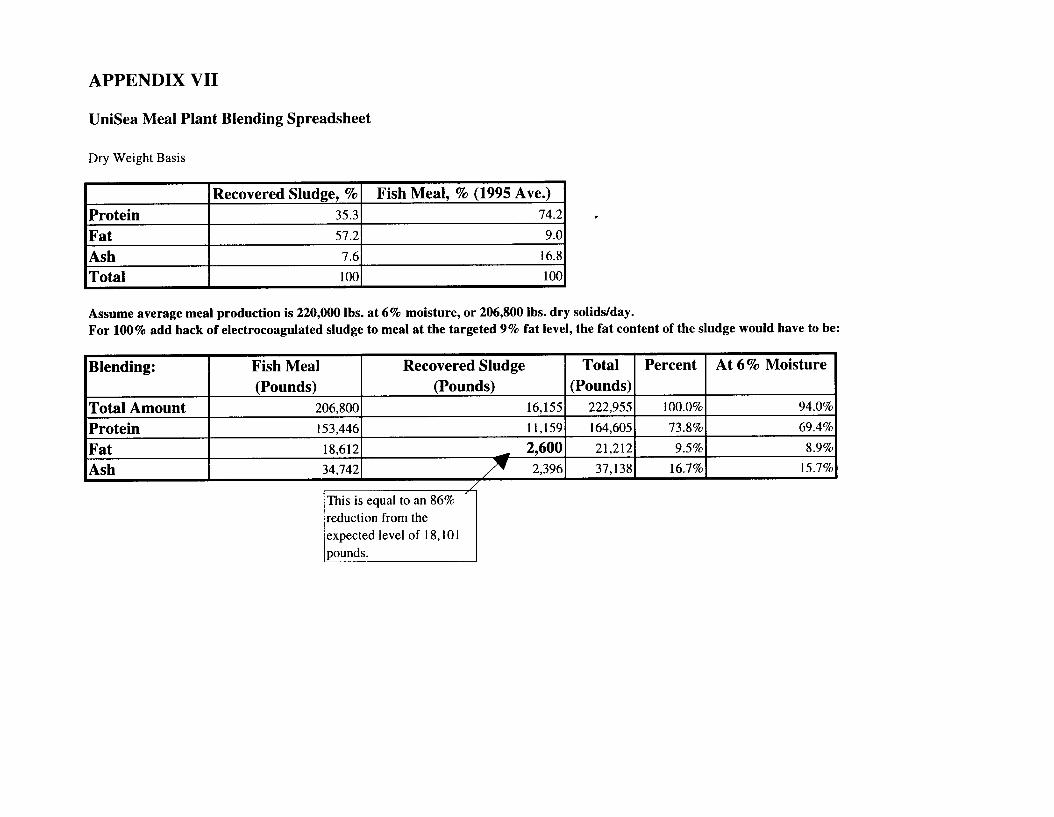
UniSea Meal Plant Blending Spreadsheet
Order of Magnitude Capital and Operating Costs Treating 100% of Stick Water
Estimate of Revenue from Recycling Electrocoagulated Sludge into Fish Meal
Project Cost Analysis Using P2/FINANCE
equipment used for the pilot test and the methods used for monitoring process stream parameters, Thedocument also discusses the project results, and offers recommendations for further testing. Detailed testresults are included in the appendices.
UniSea Seafood Processing Wastewater StreamsAt its Dutch Harbor, Alaska processing facility, UniSea processes pollock (used to produce surimi, themain ingredient in imitation crab meat), bottom fish, and crab. As a consequence, a large volume ofinedible waste fish solids is generated. To maximize the use of the seafood resource, many of the largerseafood processors render the waste materials into fish meal, which is used for the production ofaquaculture feeds and as a feed supplement for animals.
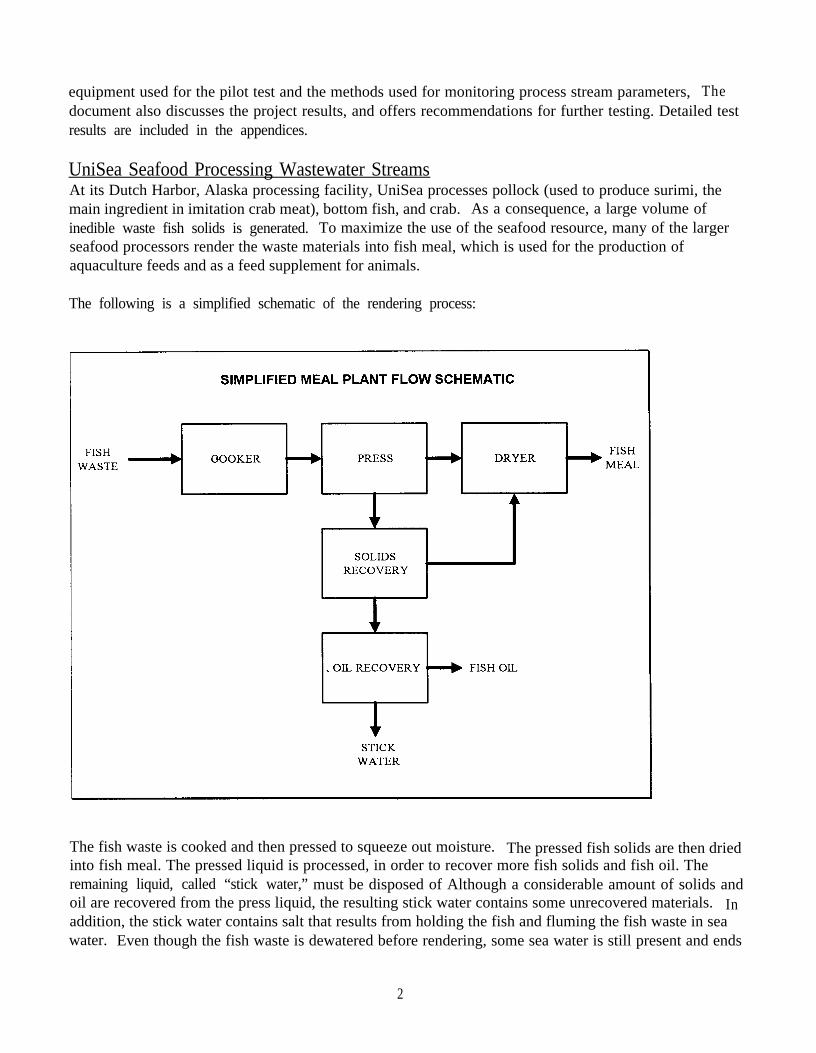
The following is a simplified schematic of the rendering process:
The fish waste is cooked and then pressed to squeeze out moisture. The pressed fish solids are then driedinto fish meal. The pressed liquid is processed, in order to recover more fish solids and fish oil. Theremaining liquid, called “stick water,” must be disposed of Although a considerable amount of solids andoil are recovered from the press liquid, the resulting stick water contains some unrecovered materials. Inaddition, the stick water contains salt that results from holding the fish and fluming the fish waste in seawater. Even though the fish waste is dewatered before rendering, some sea water is still present and ends
2
Solids Recovery fromSeafood Processing Stick Water
Using Electrocoagulation
INTRODUCTION
A significant challenge facing the seafood processing industry in the Pacific Northwest, as well as otherregions of the United States, is determining cost-effective ways to further reduce and recover suspendedand dissolved solids found in plant wastewater streams. Solutions are needed for a number of reasons,including:
l External political and internal industry pressure to strive for full utilization of the seafood resource.
l The need to increase the efficiency of the processing plants over time to maximize theircompetitiveness and profitability.
l The need to comply with upcoming federal regulations that will impose stricter limits on theseafood processing industry’s wastewater discharges. In many cases, current technology used inthe industry will not meet the discharge limits proposed in these regulations, and the only allowableoption is for the companies to barge the wastewater three miles out to sea and dump it.
l The need to minimize the negative environmental impacts of the seafood processing plants’operations on surrounding communities.
The Pacific Northwest Pollution Prevention Research Center (PPRC), UniSea, Inc., and the AlaskaDepartment of Environmental Conservation (ADEC) formed a partnership to address the issue ofwastewater pollution from seafood processing by signing a joint memorandum of understanding (MOU) inearly 1995. The MOU committed the group to working to identify a demonstration project that wouldreduce wastewater discharges, secure funding to support the project, and actively disseminate all projectdata and results to the rest of the seafood processing industry, so that the work would benefit the entireindustry. The pilot project was funded by a grant from the Alaska Science and Technology Foundation, aswell as contributions from the PPRC, UniSea, and ADEC. Aqua-Terra Consultants, with locations inSeattle, Washington and Vancouver, British Columbia, Canada, was selected to develop a project protocol,oversee pilot testing, and prepare a final report.
Electrocoagulation was identified as a technology having the potential to recover solids from seafoodprocessing wastewater at UniSea’s fish meal plant in Dutch Harbor, Alaska. Electrocoagulation has beenused successfully in other wastewater treatment and recovery operations, but has not been proven forapplications with wastewater having a high concentration of biochemical oxygen demand (BOD).Typically, the BOD in the seafood processing wastewater is more than 50,000 milligrams per liter, which isfive times higher than previously tested applications.
This report includes an overview of UniSea’s seafood processing wastewater stream, a discussion of theelectrocoagulation process, and a list of the goals and objectives of the pilot project. The report details the
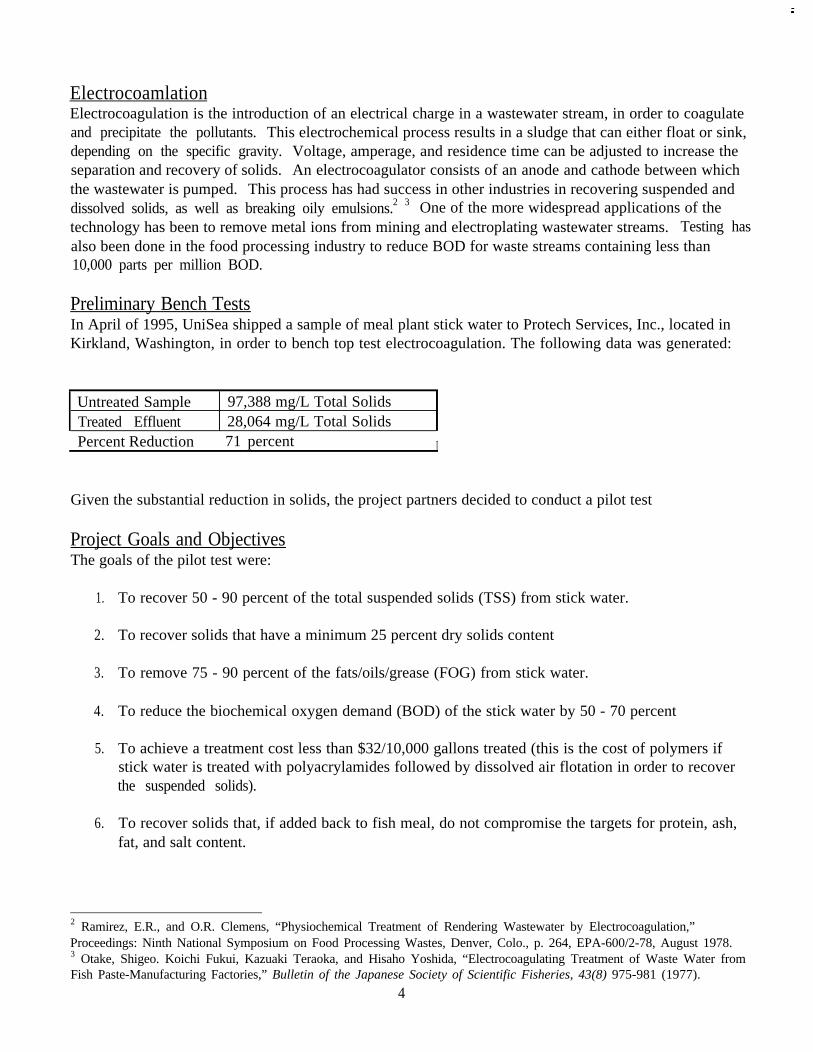
ElectrocoamlationElectrocoagulation is the introduction of an electrical charge in a wastewater stream, in order to coagulateand precipitate the pollutants. This electrochemical process results in a sludge that can either float or sink,depending on the specific gravity. Voltage, amperage, and residence time can be adjusted to increase theseparation and recovery of solids. An electrocoagulator consists of an anode and cathode between whichthe wastewater is pumped. This process has had success in other industries in recovering suspended anddissolved solids, as well as breaking oily emulsions.2 3 One of the more widespread applications of thetechnology has been to remove metal ions from mining and electroplating wastewater streams. Testing hasalso been done in the food processing industry to reduce BOD for waste streams containing less than10,000 parts per million BOD.
Preliminary Bench TestsIn April of 1995, UniSea shipped a sample of meal plant stick water to Protech Services, Inc., located inKirkland, Washington, in order to bench top test electrocoagulation. The following data was generated:
Untreated Sample 97,388 mg/L Total SolidsTreated Effluent 28,064 mg/L Total SolidsPercent Reduction 71 percent I
Given the substantial reduction in solids, the project partners decided to conduct a pilot test
Project Goals and ObjectivesThe goals of the pilot test were:
1. To recover 50 - 90 percent of the total suspended solids (TSS) from stick water.
2. To recover solids that have a minimum 25 percent dry solids content
3. To remove 75 - 90 percent of the fats/oils/grease (FOG) from stick water.
4. To reduce the biochemical oxygen demand (BOD) of the stick water by 50 - 70 percent
5. To achieve a treatment cost less than $32/10,000 gallons treated (this is the cost of polymers ifstick water is treated with polyacrylamides followed by dissolved air flotation in order to recoverthe suspended solids).
6. To recover solids that, if added back to fish meal, do not compromise the targets for protein, ash,fat, and salt content.
2 Ramirez, E.R., and O.R. Clemens, “Physiochemical Treatment of Rendering Wastewater by Electrocoagulation,”Proceedings: Ninth National Symposium on Food Processing Wastes, Denver, Colo., p. 264, EPA-600/2-78, August 1978.3 Otake, Shigeo. Koichi Fukui, Kazuaki Teraoka, and Hisaho Yoshida, “Electrocoagulating Treatment of Waste Water fromFish Paste-Manufacturing Factories,” Bulletin of the Japanese Society of Scientific Fisheries, 43(8) 975-981 (1977).
4
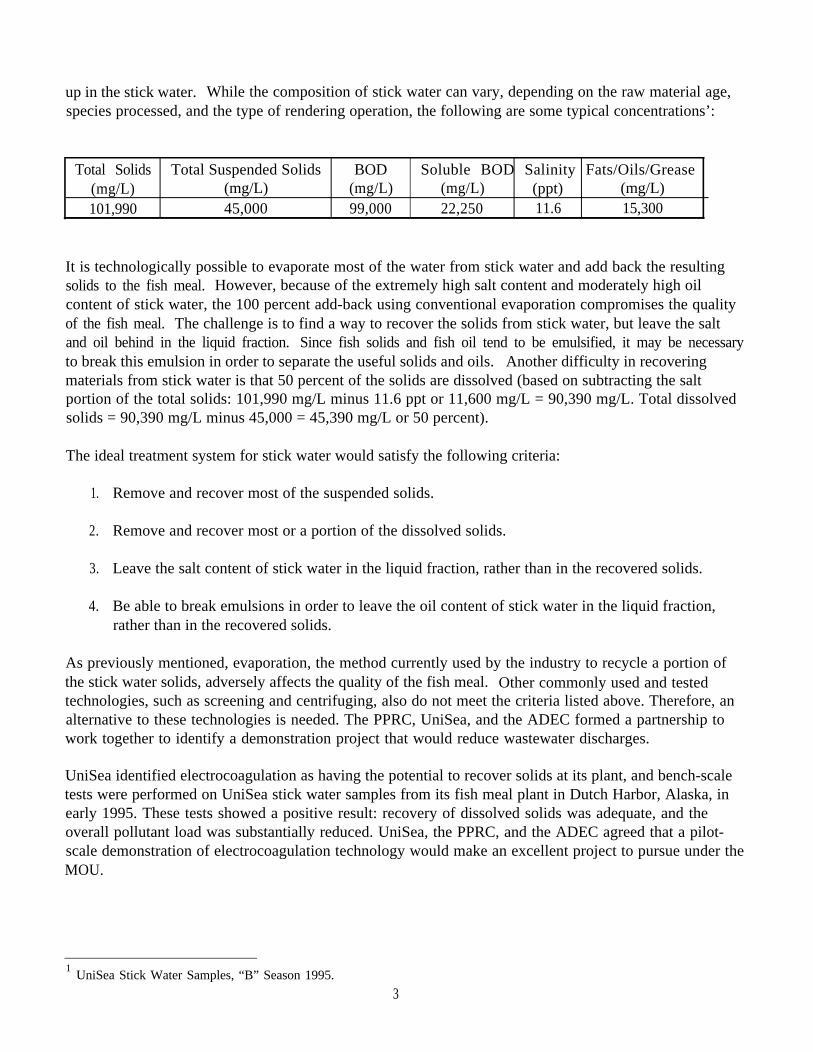
up in the stick water. While the composition of stick water can vary, depending on the raw material age,species processed, and the type of rendering operation, the following are some typical concentrations’:
Total Solids Total Suspended Solids BOD Soluble BOD Salinity Fats/Oils/Grease(mg/L) (mg/L) (mg/L) (mg/L) (ppt) (mg/L)101,990 45,000 99,000 22,250 11.6 15,300
It is technologically possible to evaporate most of the water from stick water and add back the resultingsolids to the fish meal. However, because of the extremely high salt content and moderately high oilcontent of stick water, the 100 percent add-back using conventional evaporation compromises the qualityof the fish meal. The challenge is to find a way to recover the solids from stick water, but leave the saltand oil behind in the liquid fraction. Since fish solids and fish oil tend to be emulsified, it may be necessaryto break this emulsion in order to separate the useful solids and oils. Another difficulty in recoveringmaterials from stick water is that 50 percent of the solids are dissolved (based on subtracting the saltportion of the total solids: 101,990 mg/L minus 11.6 ppt or 11,600 mg/L = 90,390 mg/L. Total dissolvedsolids = 90,390 mg/L minus 45,000 = 45,390 mg/L or 50 percent).
The ideal treatment system for stick water would satisfy the following criteria:
1. Remove and recover most of the suspended solids.
2. Remove and recover most or a portion of the dissolved solids.
3. Leave the salt content of stick water in the liquid fraction, rather than in the recovered solids.
4. Be able to break emulsions in order to leave the oil content of stick water in the liquid fraction,rather than in the recovered solids.
As previously mentioned, evaporation, the method currently used by the industry to recycle a portion ofthe stick water solids, adversely affects the quality of the fish meal. Other commonly used and testedtechnologies, such as screening and centrifuging, also do not meet the criteria listed above. Therefore, analternative to these technologies is needed. The PPRC, UniSea, and the ADEC formed a partnership towork together to identify a demonstration project that would reduce wastewater discharges.
UniSea identified electrocoagulation as having the potential to recover solids at its plant, and bench-scaletests were performed on UniSea stick water samples from its fish meal plant in Dutch Harbor, Alaska, inearly 1995. These tests showed a positive result: recovery of dissolved solids was adequate, and theoverall pollutant load was substantially reduced. UniSea, the PPRC, and the ADEC agreed that a pilot-scale demonstration of electrocoagulation technology would make an excellent project to pursue under theMOU.
1 UniSea Stick Water Samples, “B” Season 1995.
3
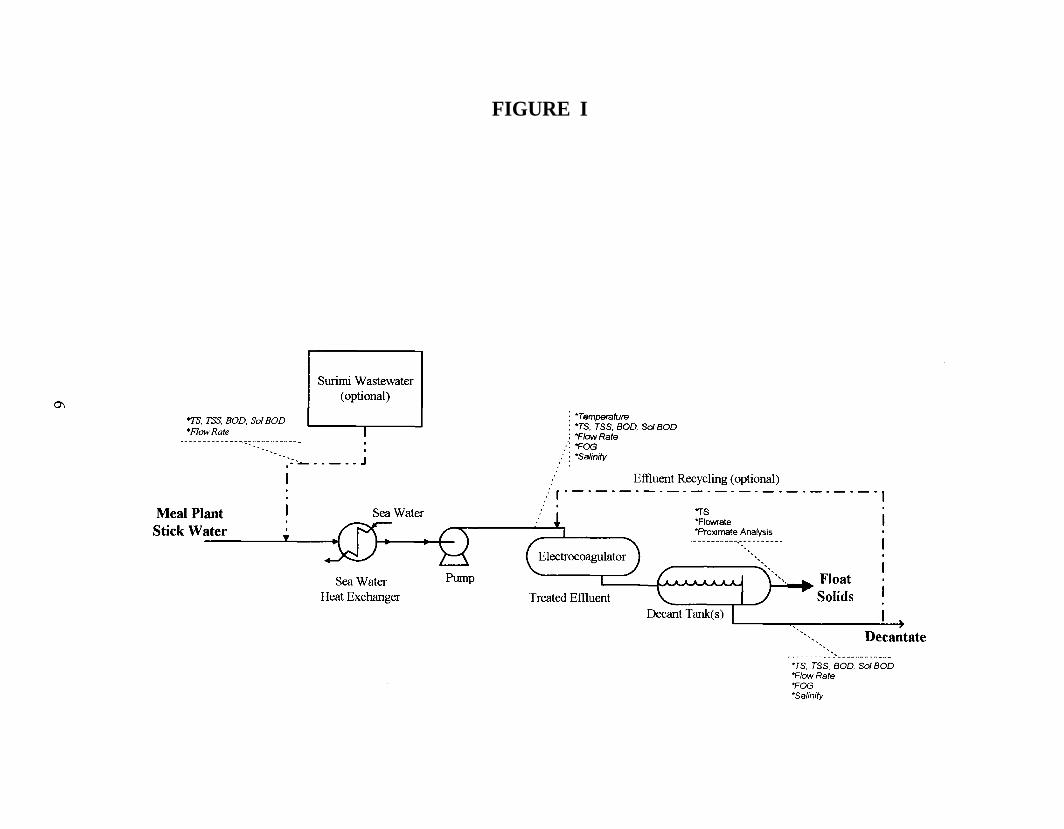
FIGURE I
In support of project goals, the objectives of the project were:
1. To determine whether electrocoagulation can effectively recover the total suspended and dissolvedsolids in meal plant stick water.
2. To determine whether and to what degree the recovered solids can be recycled into fish meal.
3. To determine the reduction in conventional pollutants (TS, TSS, BOD, and FOG) resulting fromthe electrocoagulation of stick water.
To determine whether electrocoagulation is a cost-effective technology for recovering solids andreducing the effluent pollutant loading from meal plant stick water.
EquipmentThe electrocoagulator for the pilot test was provided by Protech Services, Inc., of Kirkland, Washingtonand was manufactured by Clean Water, Inc., of Kansas City, Missouri. The test unit was a Model CWI-050 and consisted of two cells plumbed in parallel. The unit was rated for 25 gpm per cell or 50 gpm totalflow. Each cell contained aluminum plates for electrodes. The voltage and amperage to the cells wasadjustable, and the settings were recorded. The power requirement was 220 volts, single phase. Theamperage needed to operate the unit was measured.
Meal plant stick water is approximately 190 degrees Fahrenheit and the electrocoagulation venderrequested that the feed to the unit be approximately 110 degrees Fahrenheit because of limitations due tothe plastic plumbing. Provisions were made for cooling the stick water prior to entering theelectrocoagulator. Another consideration for determining the operating temperature is the ease ofseparation of the recoverable solids. If treated samples of stick water are placed in a beaker immediatelyafter treatment, the recoverable solids should rise to the surface of the beaker. The rate of rise and clarityof the resulting decantate are dependent, in part, on the temperature of the stick water.
Prior experience indicated that dilution of high solids streams before electrocoagulation may be beneficial.As a consequence, provisions were made for the possibility of adding surimi wastewater. An alternativeoption was to recycle a portion of the treated wastewater.
Once stick water is electrocoagulated, the recoverable solids should float to the surface if contained in atank. To determine the amount of recoverable solids and the quality of the decantate, totes were used tosimulate decant tanks. Totes were sequentially filled and allowed to sit undisturbed in order to monitor thetime required for the solids to float to the top of the tote, and to be able to sample the decantate and thesolid sludge.
Figure I, shown on the following page, is a flow schematic for the pilot test equipment, including thesampling points.
5
recovered solids, as well as the separation time from #4, are necessary to determine the size andnumber of decant tanks that will be required for a full-scale installation.
6. Decanted or Float Solids Chemical Parameters (TS, Proximate Analysis)To determine the moisture content or dry solids of the float solids, samples were taken andanalyzed for total solids. The quality (content of ash, protein, fat, and salt) of the recovered solidswas measured. These parameters are important if the recovered solids are to be added back to thefish meal. Most meals have a maximum limit for fat, ash, and salt content.
7. Decantate Chemical Parameters (TS, TSS, BOD, Soluble BOD, FOG. Salinity)The same parameters that were measured in the stick water were also measured in the decantate, inorder to accurately gauge the level of pollutant reduction.
The following chart shows the sampling and measurement frequency protocol that was used:
Measurement Sampling/Recording FrequencyTemperature HourlyFlow Rates Every 30 MinutesTS, TSS, BOD, Soluble BOD, FOG, At optimal settings, two 8-hour compositeSalinity samples (30-minute sampling frequency)
(note: Due to unanticipated technical difficulties, discussed in the following section, actual runs werelimited to one-hour periods of operation. Therefore, grab samples w&e taken, rather than composites.)
RESULTS AND DISCUSSION
Set-Up and Start-UpThe start-up and installation of the electrocoagulation unit was delayed due to damage that occurred to theequipment during transportation. As well, the site had been prepared for a 480-volt, 3-phase electricalconnection, per the vendor’s request, but the unit that was delivered was 220-volt, 1 -phase connection.Mechanical repairs were successfully completed and power supply modifications were made.Unfortunately, the electrical meter for 480-volt, 3-phase connection that was to be used for recordingpower consumption could not be used. Instead, power consumption was monitored by takinginstantaneous readings using a hand-held meter.
Initial tests that were conducted indicated that cooling the stick water did not result in optimal treatment.Samples of the treated stick water were placed in beakers and Imhoff cones, and the rate of separation andclarity of the decantate were observed. The results were not as good as those observed for bench toptesting. The stick water was then cooled to 145 degrees Fahrenheit, with a marginal increase inperformance. At 155 degrees Fahrenheit, the results continued to improve. Finally, the vendor agreed torun the stick water at a higher temperature, but not so high as to compromise the integrity of the plasticpiping. At a feed temperature of 170 degrees Fahrenheit, the treated effluent was separating quickly, withreasonably clear decantate.
8
MethodsThe following is the list of process stream parameters that were monitored during the pilot test:
1. Influent TemperatureThe electrocoagulator vendor requested that the trials be conducted with the influent temperatureat about 110 degrees Fahrenheit. Bench top testing with a different vendor had indicated that thehigher the influent temperature, the better the treatment and separation of solids. Therefore, thetemperature of the influent to the electrocoagulator was controlled and monitored.
2. Electrocoagulator Influent (Stick Water) Flow RateThe cells were rated for 25 gpm. To determine the optimal flow rate and residence time in theelectrocoagulator, the effluent flow rate before separation of the solids was recorded. This wasdone by using a bucket of a known volume and recording the time (with a stopwatch) it took to fillthe bucket.
3, Electrocoanulator Influent (Stick Water) Chemical Parameters (BOD. Soluble BOD, TS, TSS,FOG. Salinity)To determine the level of treatment, several parameters were measured. BOD (biochemical oxygendemand) is a measure of the pollutant load that can affect the receiving body of water into whichthe waste stream is discharged. As well, new U.S. Environmental Protection Agency permits havea limit on the amount of BOD that can be discharged per day. The measurement of BOD reductionin stick water is important in order to see if electrocoagulation can potentially be used for EPAwastewater permit compliance. Soluble BOD is the measure of BOD that comes from thedissolved solids. This is generally the more difficult of the BOD fraction to reduce. TS (totalsolids) is an indication of the amount of pollutants in the waste stream. It is composed of TSS(total suspended solids), which is a measure of the amount of solids that are in suspension in thewastewater, and TDS (total dissolved solids), which is a measure of the solids that are dissolved inthe wastewater. In general, measuring two of these parameters (TS and TSS) is sufficient toestimate the third parameter (TDS). FOG (fats, oils, and grease) is a measure of the amount of fishoil that is present in the stick water. Salinity is a measure of the salt content of the stick water.
4. Decanted or Float Solids Separation TimeThe effluent from the electrocoagulator was discharged into totes. The decant time, or the timeneeded for the solids to float to the top of the tote and the decantate to be free of visible particles,was determined by filling Imhoff cones and recording the volume of separated sludge versus time.(Imhoff cones are tapered, cone-shaped containers that generally hold one liter of sample. Thesides of the cone are marked with graduations from zero to 1,000 milliliters. Samples to be testedare poured into the cone and allowed to sit undisturbed. The volume of floating solids can bevisually observed and recorded over time.)
5. Decanted or Float Solids and Decantate Flow RatesThe gross weight of the totes that were filled with the electrocoagulated stick water was recorded.After allowing for the separation time determined in #4 (above), the decantate was drained from thetotes by cracking open a drain plug near the bottom of the tote. Once sludge was observed to beflowing from the drain plug, the drain was resealed. The weight of wet solids in the tote wasrecorded so that the amount of recovered solids and decantate could be calculated. The amount of
7
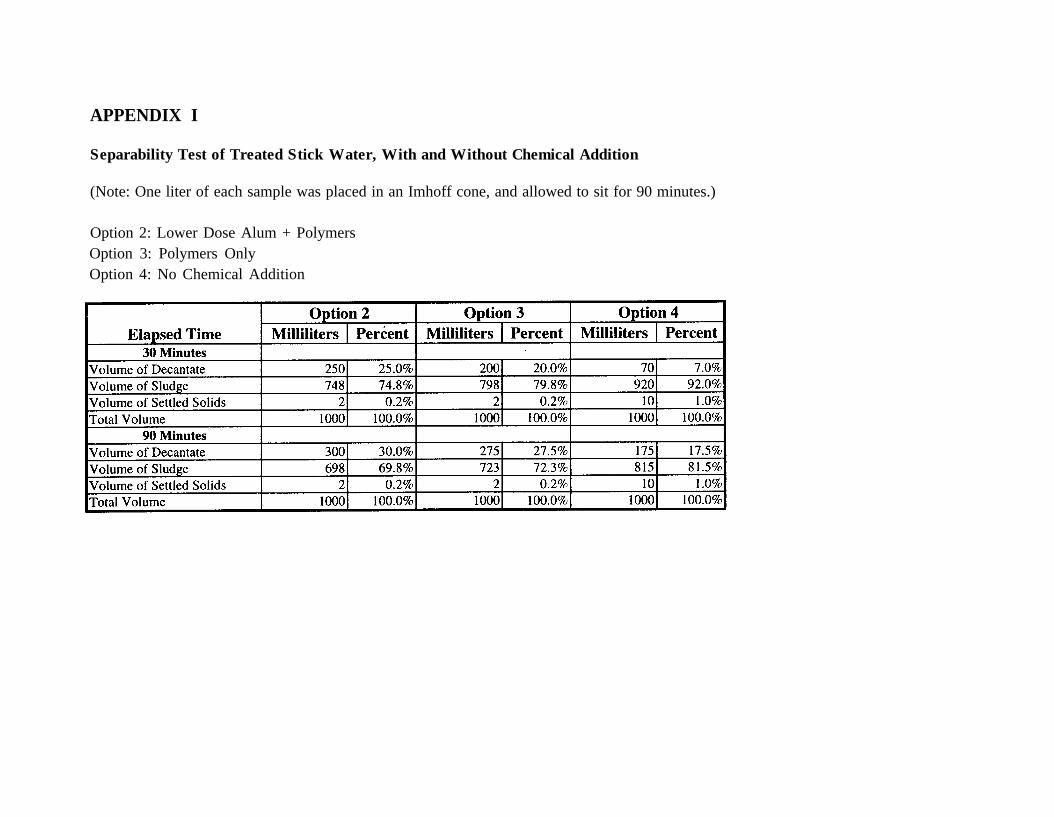
90 minutes, the separation of solids was complete. The sample with no chemicals resulted in a bulkiersludge layer and with more settled solids. Also, the samples with chemical addition reached 70-80 percentof the final separation within 30 minutes, versus only 40 percent for the sample with no chemicals. Sinceall four samples were taken at the same time, it is reasonable to assume that the amount of separable solidswas the same. Therefore, the larger volume of sludge in the sample without chemicals could indicate thatthe addition of chemicals reduces the volume and possibly the moisture content of the sludge. Based onthe rate of separation of the samples tested, it was decided to allow for a 2-hour decant time forsubsequent tests using totes for decanting.
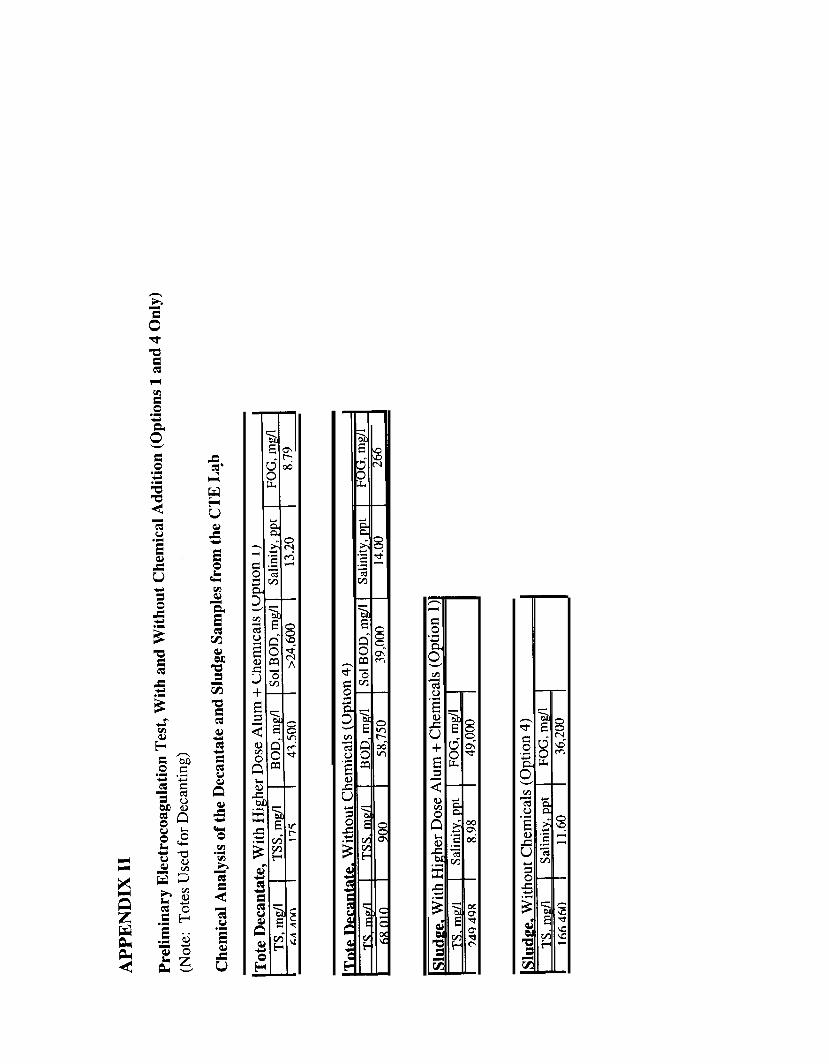
A preliminary test run was done whereby two totes were filled with electrocoagulated stick water. Onetote had no chemicals mixed in (option 4); the second tote had the higher dose, three-chemical programadded (option 1). Appendix II contains the results from sampling the tote decantate and float solids orsludge. The totes were allowed to sit for two hours before the decantate was drained off. The decantatefrom the tote with no chemicals had higher levels of pollutants than the decantate from the tote that had thechemicals added. Additionally, the sludge from the tote with chemical addition had a lower moisturecontent and a greater recovery of FOG.
A second test run was done whereby four totes were filled with electrocoagulated stick water using thefour scenarios outlined in the table on the previous page. The test was duplicated a second time, with theresults summarized in Appendix III. The totes were allowed to sit for two hours, and were slowly drainedover two hours until the decantate was completely drained. The efficacy of treatment was fairly consistentwith and without chemicals. But once again, the sludge produced with chemical addition was easier toseparate from the decantate. Based on the data, the following observations can be made:
1. Allowing for laboratory and sampling error, it appears that the electrocoagulation process primarilyremoves suspended solids and not dissolved solids. Also, it is interesting to note that the solubleBOD actually increased in the decantate, which indicates a solubilization of some of the stick watersolids or a degradation of some of the dissolved solids, making them more bioavailable for bacterialdigestion (as occurs during the BOD test).
2. The total suspended solids in stick water was only 44 percent of the total solids and the nonsolubleBOD was 78 percent of the total BOD. This may account for why the overall BOD reduction was65 percent when the total solids reduction was only 43 percent.
3. Electrocoagulation removed the FOG, as virtually no FOG was left in the decantate (i.e. the oilfraction remained with the sludge).
4. Electrocoagulation appeared to be very ineffective at removing salt from stick water, as thereduction in salinity in the decantate was only 4 percent (i.e. the salt remained with the liquidfraction).
Figure II in Appendix III illustrates the impact of electrocoagulation on the liquid phase, based on theaverage values for the eight totes.
Samples of the various sludges were sent to a laboratory to analyze the constituents that are of value forfish meal (i.e. protein) and also those that are limiting to the quality (i.e. salt, fat, and ash). Appendix IVcontains the summary of the results of the laboratory analysis.
10
With regards to the amperage and voltage of the cells, the voltage range was five to 10 volts, and theamperage range was 40 to 110 amps. The optimal settings were found to be five volts and 90 amps. Sincethe two cells were in parallel and could handle 25 gpm each, it was decided to run only one cell since thevolume from two cells would have required more totes than were available.
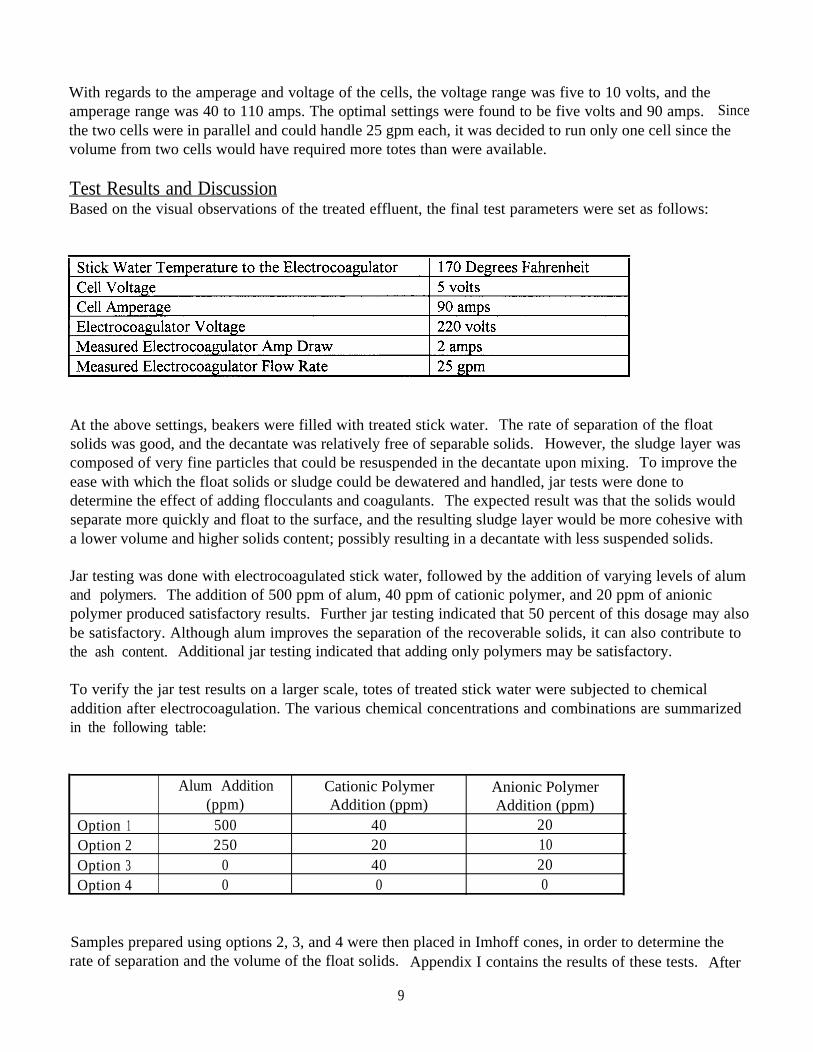
Test Results and DiscussionBased on the visual observations of the treated effluent, the final test parameters were set as follows:
At the above settings, beakers were filled with treated stick water. The rate of separation of the floatsolids was good, and the decantate was relatively free of separable solids. However, the sludge layer wascomposed of very fine particles that could be resuspended in the decantate upon mixing. To improve theease with which the float solids or sludge could be dewatered and handled, jar tests were done todetermine the effect of adding flocculants and coagulants. The expected result was that the solids wouldseparate more quickly and float to the surface, and the resulting sludge layer would be more cohesive witha lower volume and higher solids content; possibly resulting in a decantate with less suspended solids.
Jar testing was done with electrocoagulated stick water, followed by the addition of varying levels of alumand polymers. The addition of 500 ppm of alum, 40 ppm of cationic polymer, and 20 ppm of anionicpolymer produced satisfactory results. Further jar testing indicated that 50 percent of this dosage may alsobe satisfactory. Although alum improves the separation of the recoverable solids, it can also contribute tothe ash content. Additional jar testing indicated that adding only polymers may be satisfactory.
To verify the jar test results on a larger scale, totes of treated stick water were subjected to chemicaladdition after electrocoagulation. The various chemical concentrations and combinations are summarizedin the following table:
Alum Addition Cationic Polymer Anionic Polymer(ppm) Addition (ppm) Addition (ppm)
Option 1 500 40 20Option 2 250 20 10Option 3 0 40 20Option 4 0 0 0
Samples prepared using options 2, 3, and 4 were then placed in Imhoff cones, in order to determine therate of separation and the volume of the float solids. Appendix I contains the results of these tests. After
9
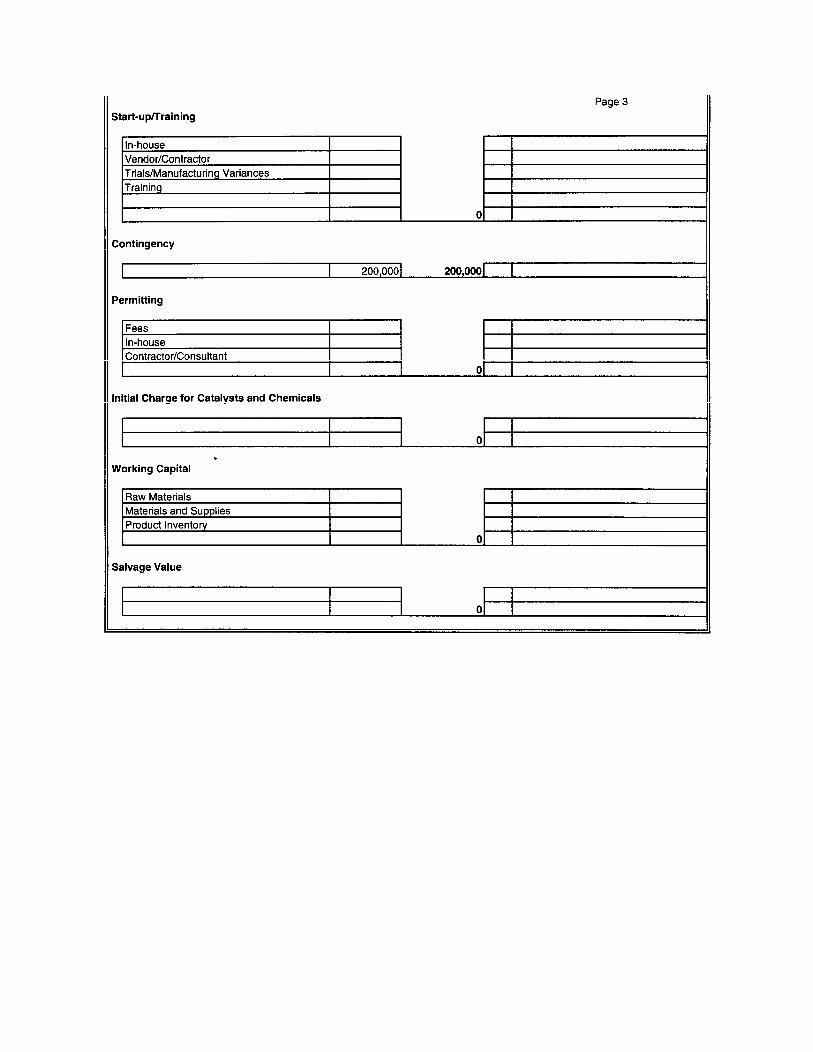
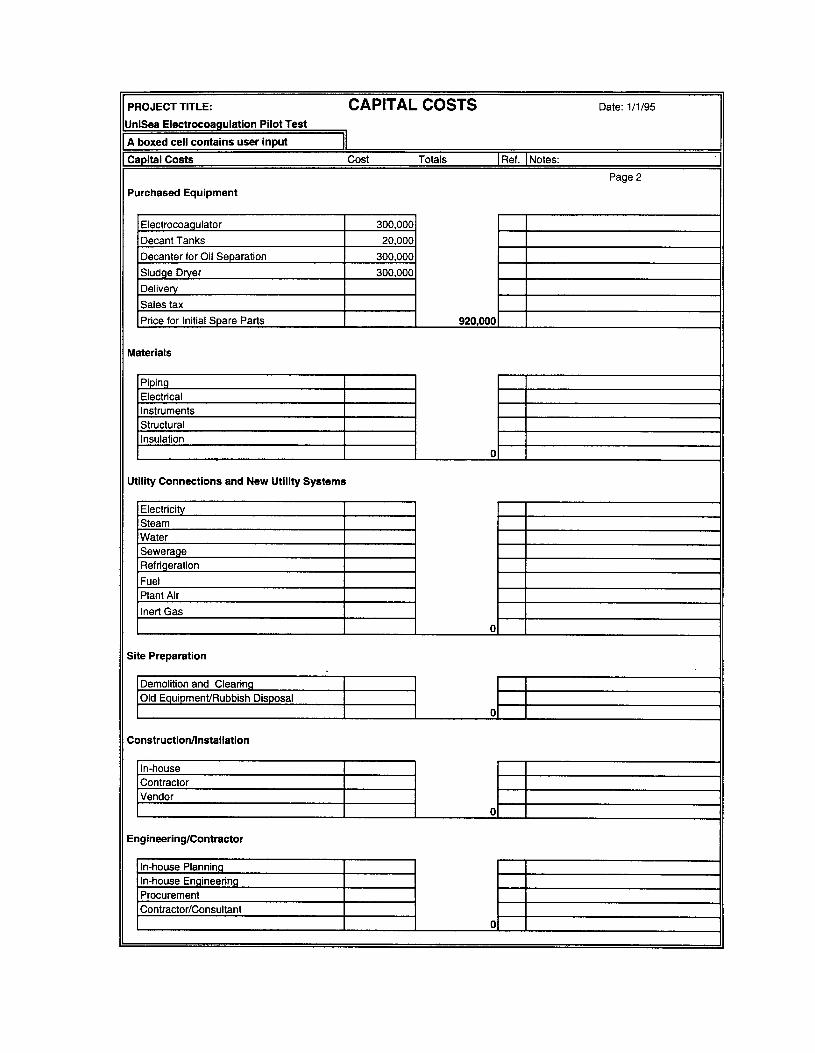
percent of the separable solids from the electrocoagulated stick water, and reduce the oil content of thesolids to the required level for 100 percent add-back of the solids. The solids percent recovery is based onthe current performance of decanters to recover meal plant press water solids. Although the pilot test wasnot run long enough to determine the life of the plates in the cells, which are consumed over time, the costestimates are based on vendor data (1 million gallons per cell). Regarding the power consumption of theelectrocoagulator, the vendor estimates that a 480-volt, 3-phase, full-scale system would consume 2kilowatts/l,000 gallons treated. This system would be more efficient than the 220-volt, l-phase system.Based on the pilot test results and limited power measurement, the power consumption equates to 2.1kilowatts/l,000 gallons treated.
Appendix IX is an estimate of the revenue that could be realized if the sludge could be added back to meal,assuming that the fat content can be reduced. Since it is beyond the scope of this project to estimate thefeasibility and cost of separating out the oil from the sludge (i.e. whether pH shifting can break theemulsion, if present, and a 3-phase decanter can separate out the wastewater/oil/solids), it will be assumedthat any incremental cost will be offset by the increased revenue in oil.
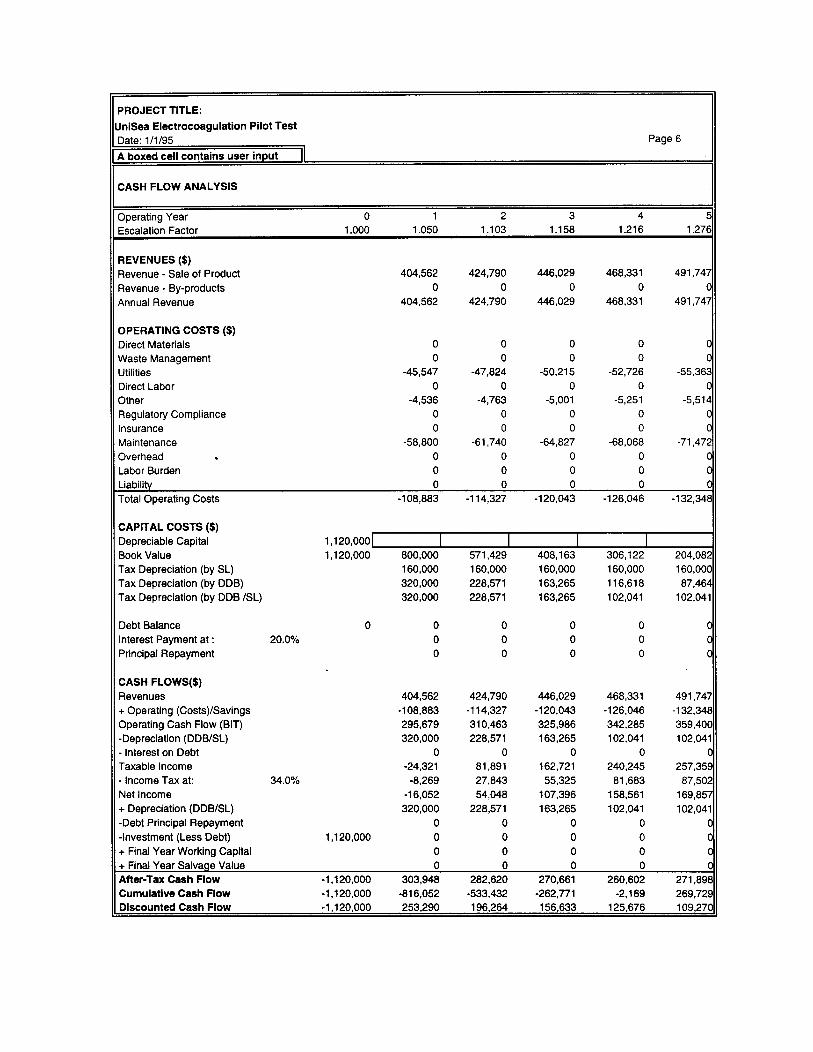
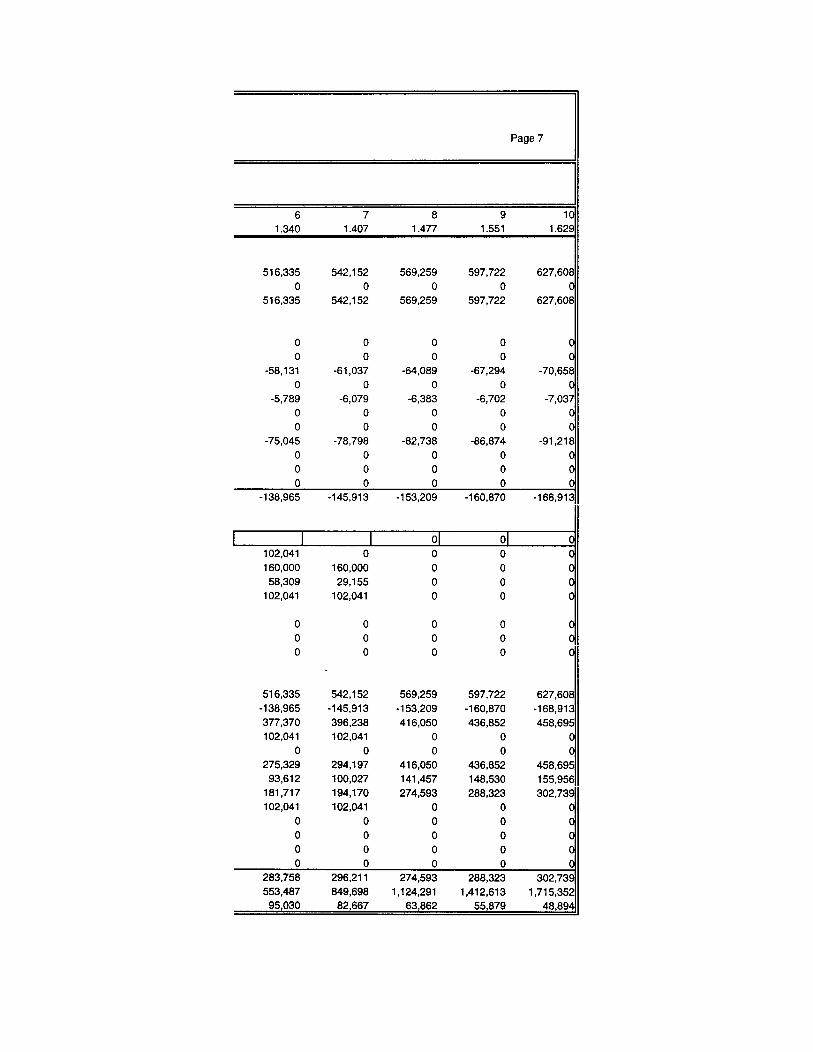
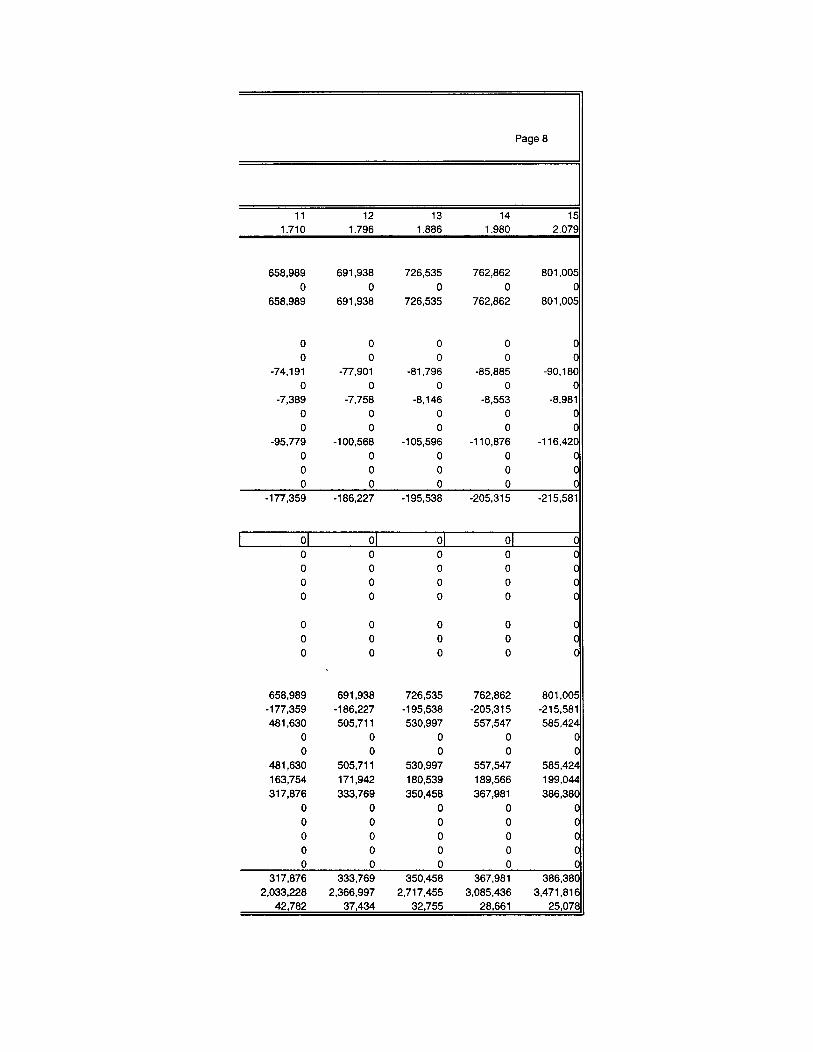
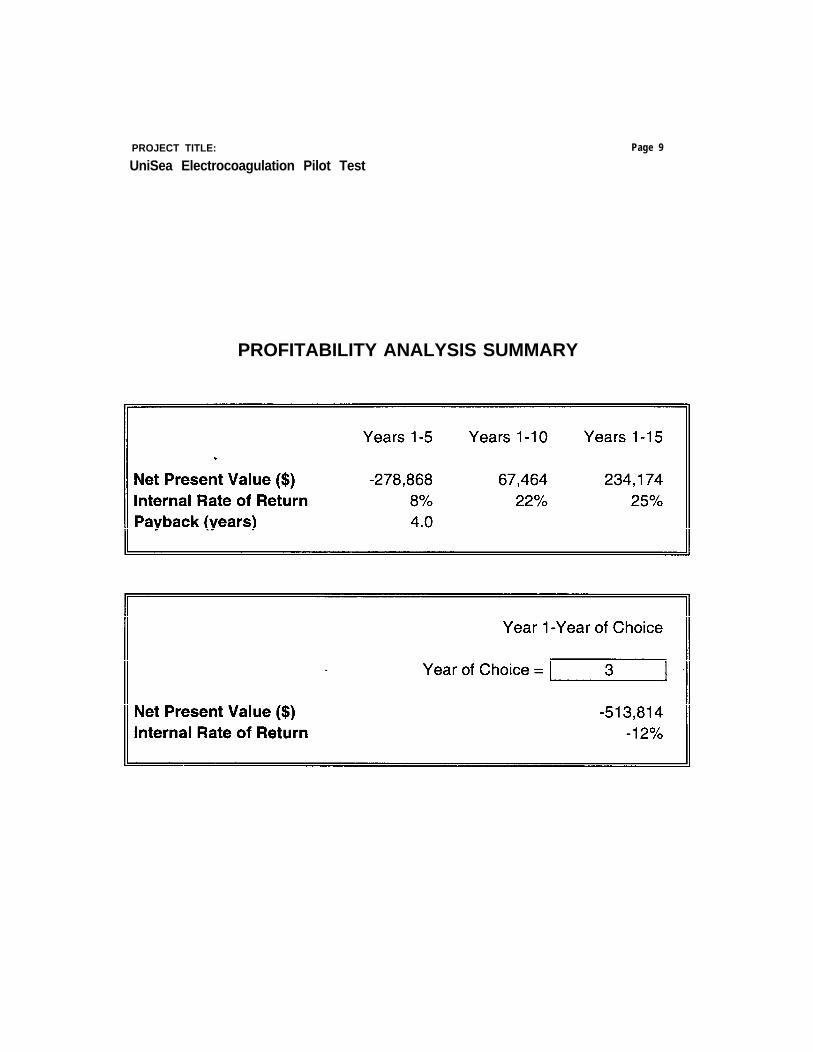
Appendix X is the payback analysis based on the merit of cost recovery only, without consideration of thecost savings due to reduced effluent load and EPA compliance. The analysis is based on the assumptionthat the oil can be separated from the recovered solids, and that 100 percent of the remaining solids areadded back to the fish meal. The incremental revenue is based on the information in Appendix IX, and thecapital and operating costs are based on the information in Appendix VIII.
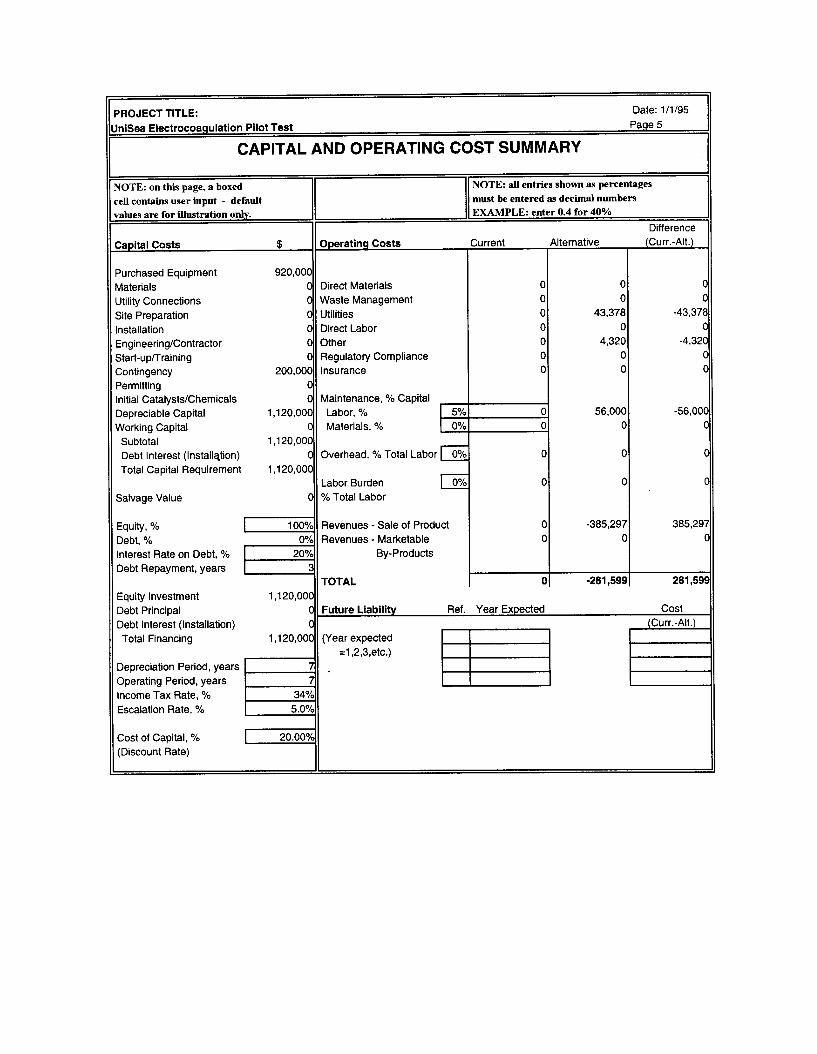
Page 9 of Appendix X of the cost analysis shows a payback of four years for installation of the full-scalesystem. This estimate includes a contingency of $200,000 that was included to cover ancillaries (piping,valves, etc.) and installation costs. Note that the cost of capital entered into the cost estimate on page 5 ofthe appendix, 20 percent, was specified by UniSea and is somewhat higher than the figure that is typicallyused by companies. A more typical figure is 12- 15 percent, which improves the net present value of theinvestment.
The cost assessment was performed in a spreadsheet called P2/FINANCE. P2/FINANCE uses the totalcost assessment method for financial analysis. A free copy of P2/FINANCE is available in Lotus 1-2-3 orMicrosoft Excel versions from the U.S. EPA’s Pollution Prevention Information Clearinghouse by calling202-260- 1023, and asking for the product by name.
CONCLUSIONS AND RECOMMENDATIONS
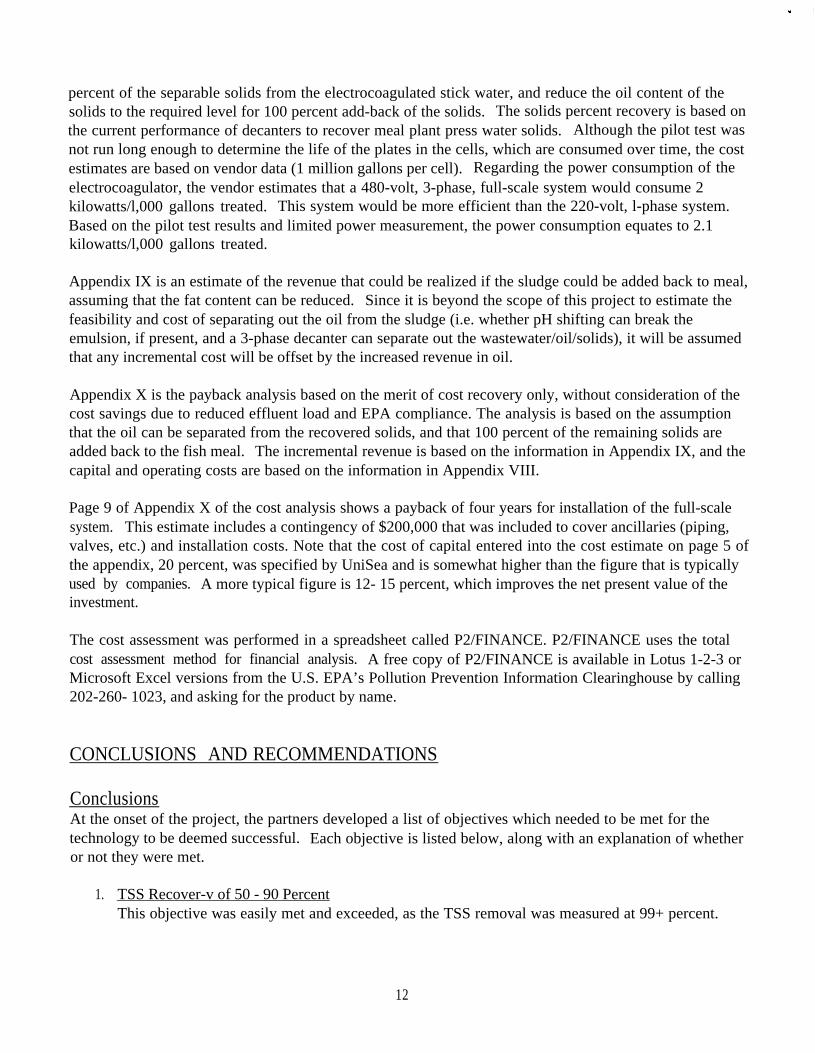
ConclusionsAt the onset of the project, the partners developed a list of objectives which needed to be met for thetechnology to be deemed successful. Each objective is listed below, along with an explanation of whetheror not they were met.
1. TSS Recover-v of 50 - 90 PercentThis objective was easily met and exceeded, as the TSS removal was measured at 99+ percent.
12
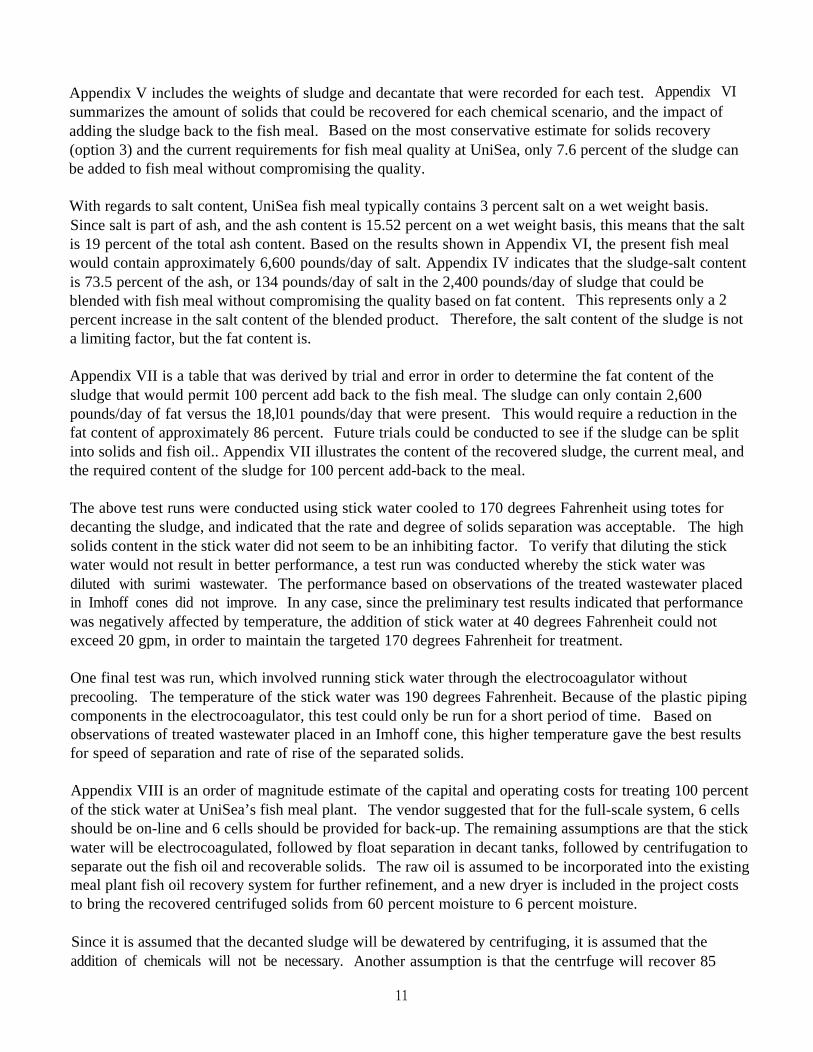
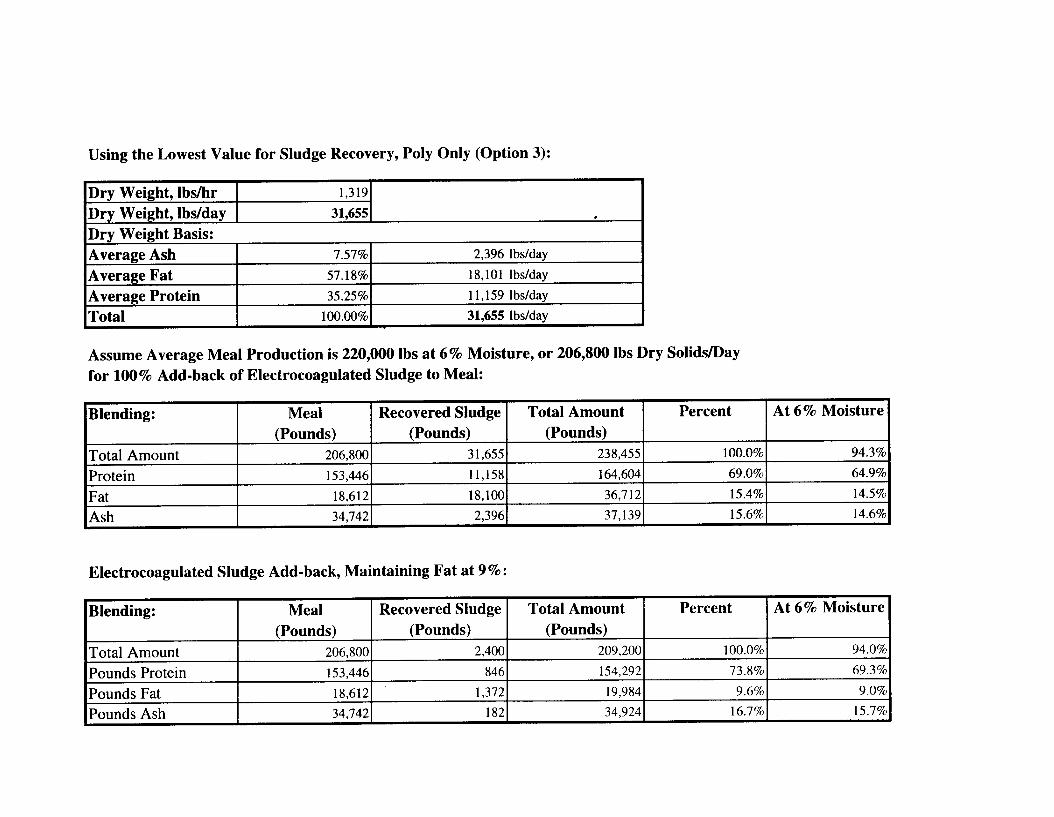
Appendix V includes the weights of sludge and decantate that were recorded for each test. Appendix VIsummarizes the amount of solids that could be recovered for each chemical scenario, and the impact ofadding the sludge back to the fish meal. Based on the most conservative estimate for solids recovery(option 3) and the current requirements for fish meal quality at UniSea, only 7.6 percent of the sludge canbe added to fish meal without compromising the quality.
With regards to salt content, UniSea fish meal typically contains 3 percent salt on a wet weight basis.Since salt is part of ash, and the ash content is 15.52 percent on a wet weight basis, this means that the saltis 19 percent of the total ash content. Based on the results shown in Appendix VI, the present fish mealwould contain approximately 6,600 pounds/day of salt. Appendix IV indicates that the sludge-salt contentis 73.5 percent of the ash, or 134 pounds/day of salt in the 2,400 pounds/day of sludge that could beblended with fish meal without compromising the quality based on fat content. This represents only a 2percent increase in the salt content of the blended product. Therefore, the salt content of the sludge is nota limiting factor, but the fat content is.
Appendix VII is a table that was derived by trial and error in order to determine the fat content of thesludge that would permit 100 percent add back to the fish meal. The sludge can only contain 2,600pounds/day of fat versus the 18,l01 pounds/day that were present. This would require a reduction in thefat content of approximately 86 percent. Future trials could be conducted to see if the sludge can be splitinto solids and fish oil.. Appendix VII illustrates the content of the recovered sludge, the current meal, andthe required content of the sludge for 100 percent add-back to the meal.
The above test runs were conducted using stick water cooled to 170 degrees Fahrenheit using totes fordecanting the sludge, and indicated that the rate and degree of solids separation was acceptable. The highsolids content in the stick water did not seem to be an inhibiting factor. To verify that diluting the stickwater would not result in better performance, a test run was conducted whereby the stick water wasdiluted with surimi wastewater. The performance based on observations of the treated wastewater placedin Imhoff cones did not improve. In any case, since the preliminary test results indicated that performancewas negatively affected by temperature, the addition of stick water at 40 degrees Fahrenheit could notexceed 20 gpm, in order to maintain the targeted 170 degrees Fahrenheit for treatment.
One final test was run, which involved running stick water through the electrocoagulator withoutprecooling. The temperature of the stick water was 190 degrees Fahrenheit. Because of the plastic pipingcomponents in the electrocoagulator, this test could only be run for a short period of time. Based onobservations of treated wastewater placed in an Imhoff cone, this higher temperature gave the best resultsfor speed of separation and rate of rise of the separated solids.
Appendix VIII is an order of magnitude estimate of the capital and operating costs for treating 100 percentof the stick water at UniSea’s fish meal plant. The vendor suggested that for the full-scale system, 6 cellsshould be on-line and 6 cells should be provided for back-up. The remaining assumptions are that the stickwater will be electrocoagulated, followed by float separation in decant tanks, followed by centrifugation toseparate out the fish oil and recoverable solids. The raw oil is assumed to be incorporated into the existingmeal plant fish oil recovery system for further refinement, and a new dryer is included in the project coststo bring the recovered centrifuged solids from 60 percent moisture to 6 percent moisture.
Since it is assumed that the decanted sludge will be dewatered by centrifuging, it is assumed that theaddition of chemicals will not be necessary. Another assumption is that the centrfuge will recover 85
11
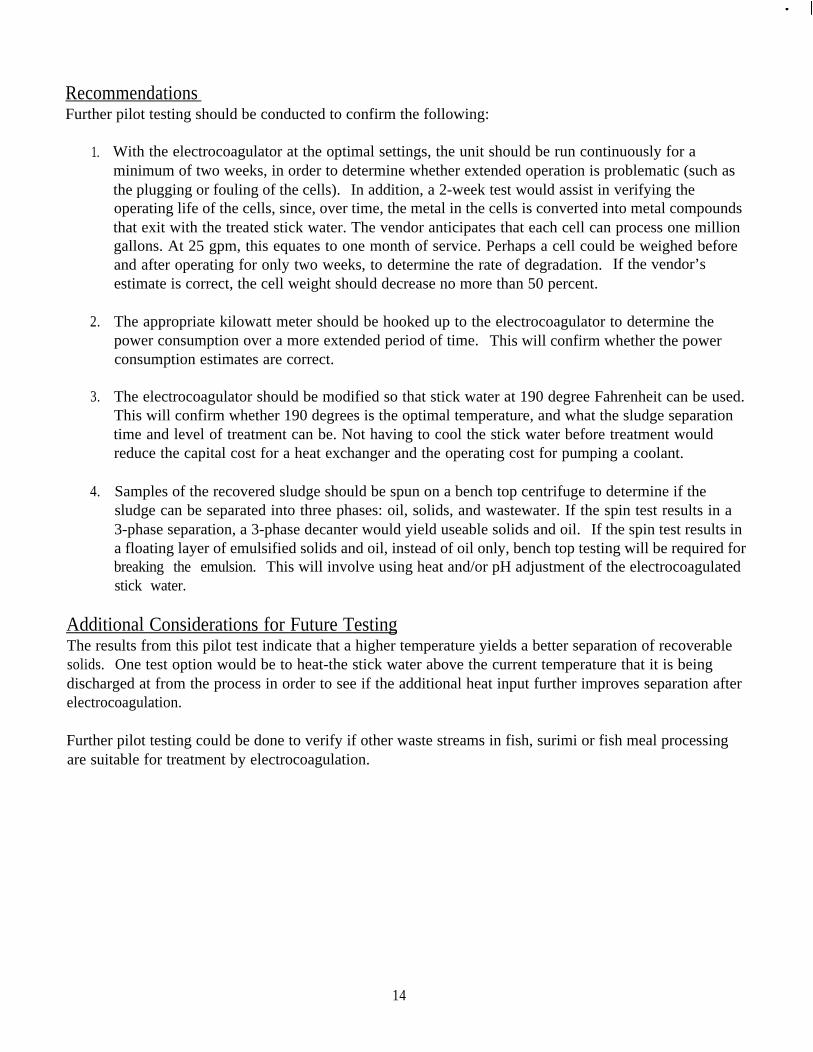
RecommendationsFurther pilot testing should be conducted to confirm the following:
1. With the electrocoagulator at the optimal settings, the unit should be run continuously for aminimum of two weeks, in order to determine whether extended operation is problematic (such asthe plugging or fouling of the cells). In addition, a 2-week test would assist in verifying theoperating life of the cells, since, over time, the metal in the cells is converted into metal compoundsthat exit with the treated stick water. The vendor anticipates that each cell can process one milliongallons. At 25 gpm, this equates to one month of service. Perhaps a cell could be weighed beforeand after operating for only two weeks, to determine the rate of degradation. If the vendor’sestimate is correct, the cell weight should decrease no more than 50 percent.
2. The appropriate kilowatt meter should be hooked up to the electrocoagulator to determine thepower consumption over a more extended period of time. This will confirm whether the powerconsumption estimates are correct.
3. The electrocoagulator should be modified so that stick water at 190 degree Fahrenheit can be used.This will confirm whether 190 degrees is the optimal temperature, and what the sludge separationtime and level of treatment can be. Not having to cool the stick water before treatment wouldreduce the capital cost for a heat exchanger and the operating cost for pumping a coolant.
4. Samples of the recovered sludge should be spun on a bench top centrifuge to determine if thesludge can be separated into three phases: oil, solids, and wastewater. If the spin test results in a3-phase separation, a 3-phase decanter would yield useable solids and oil. If the spin test results ina floating layer of emulsified solids and oil, instead of oil only, bench top testing will be required forbreaking the emulsion. This will involve using heat and/or pH adjustment of the electrocoagulatedstick water.
Additional Considerations for Future TestingThe results from this pilot test indicate that a higher temperature yields a better separation of recoverablesolids. One test option would be to heat-the stick water above the current temperature that it is beingdischarged at from the process in order to see if the additional heat input further improves separation afterelectrocoagulation.
Further pilot testing could be done to verify if other waste streams in fish, surimi or fish meal processingare suitable for treatment by electrocoagulation.
14
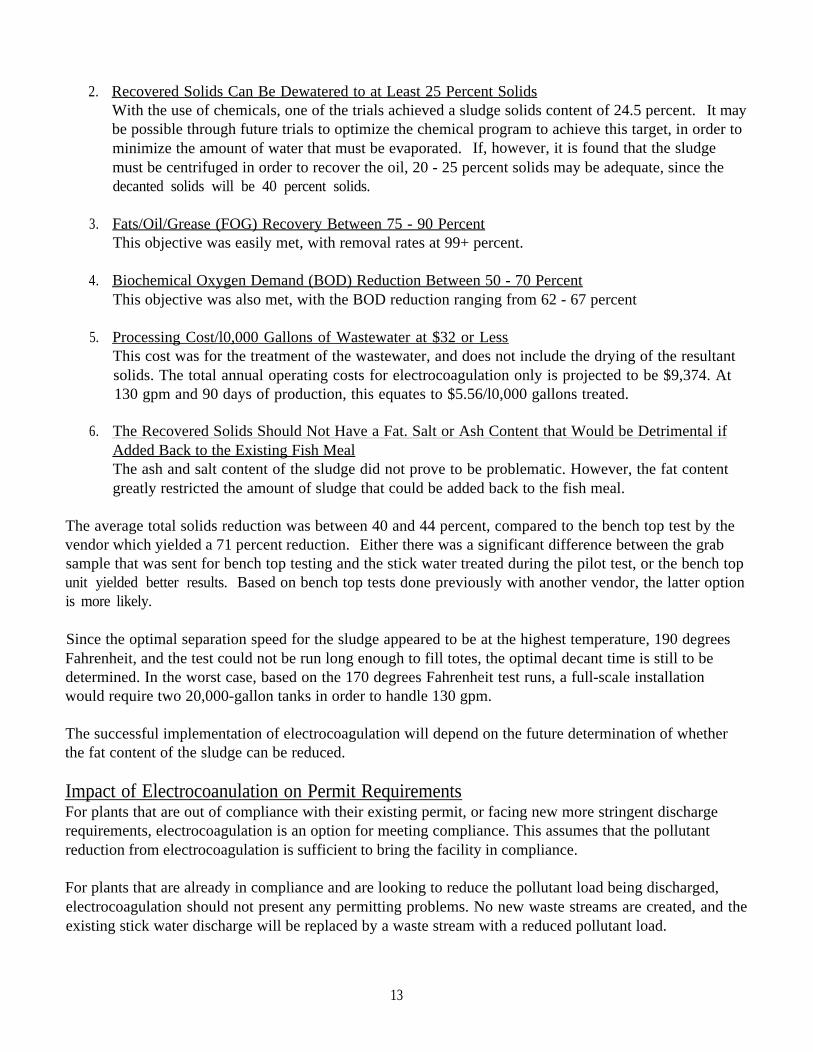
2. Recovered Solids Can Be Dewatered to at Least 25 Percent SolidsWith the use of chemicals, one of the trials achieved a sludge solids content of 24.5 percent. It maybe possible through future trials to optimize the chemical program to achieve this target, in order tominimize the amount of water that must be evaporated. If, however, it is found that the sludgemust be centrifuged in order to recover the oil, 20 - 25 percent solids may be adequate, since thedecanted solids will be 40 percent solids.
3. Fats/Oil/Grease (FOG) Recovery Between 75 - 90 PercentThis objective was easily met, with removal rates at 99+ percent.
4. Biochemical Oxygen Demand (BOD) Reduction Between 50 - 70 PercentThis objective was also met, with the BOD reduction ranging from 62 - 67 percent
5. Processing Cost/l0,000 Gallons of Wastewater at $32 or LessThis cost was for the treatment of the wastewater, and does not include the drying of the resultantsolids. The total annual operating costs for electrocoagulation only is projected to be $9,374. At130 gpm and 90 days of production, this equates to $5.56/l0,000 gallons treated.
6. The Recovered Solids Should Not Have a Fat. Salt or Ash Content that Would be Detrimental ifAdded Back to the Existing Fish MealThe ash and salt content of the sludge did not prove to be problematic. However, the fat contentgreatly restricted the amount of sludge that could be added back to the fish meal.
The average total solids reduction was between 40 and 44 percent, compared to the bench top test by thevendor which yielded a 71 percent reduction. Either there was a significant difference between the grabsample that was sent for bench top testing and the stick water treated during the pilot test, or the bench topunit yielded better results. Based on bench top tests done previously with another vendor, the latter optionis more likely.
Since the optimal separation speed for the sludge appeared to be at the highest temperature, 190 degreesFahrenheit, and the test could not be run long enough to fill totes, the optimal decant time is still to bedetermined. In the worst case, based on the 170 degrees Fahrenheit test runs, a full-scale installationwould require two 20,000-gallon tanks in order to handle 130 gpm.
The successful implementation of electrocoagulation will depend on the future determination of whetherthe fat content of the sludge can be reduced.
Impact of Electrocoanulation on Permit RequirementsFor plants that are out of compliance with their existing permit, or facing new more stringent dischargerequirements, electrocoagulation is an option for meeting compliance. This assumes that the pollutantreduction from electrocoagulation is sufficient to bring the facility in compliance.
For plants that are already in compliance and are looking to reduce the pollutant load being discharged,electrocoagulation should not present any permitting problems. No new waste streams are created, and theexisting stick water discharge will be replaced by a waste stream with a reduced pollutant load.
13
APPENDIX I
Separability Test of Treated Stick Water, With and Without Chemical Addition
(Note: One liter of each sample was placed in an Imhoff cone, and allowed to sit for 90 minutes.)
Option 2: Lower Dose Alum + PolymersOption 3: Polymers OnlyOption 4: No Chemical Addition
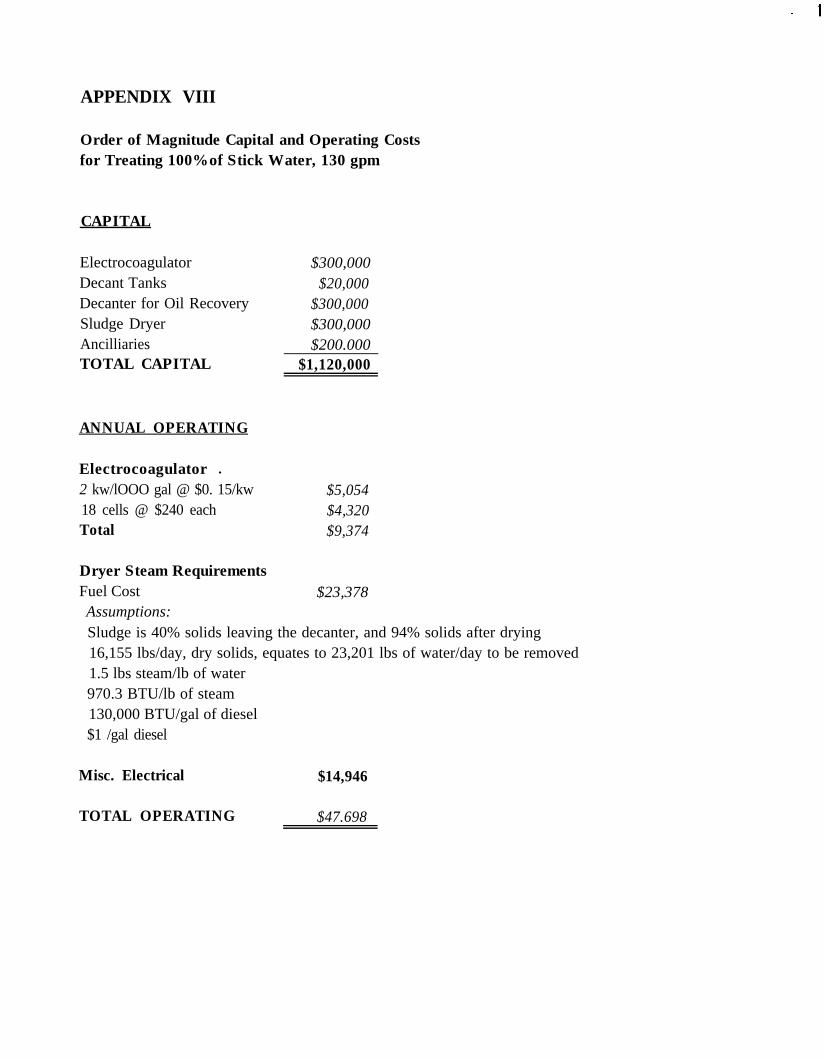
APPENDIX VIII
Order of Magnitude Capital and Operating Costsfor Treating 100% of Stick Water, 130 gpm
CAPITAL
ElectrocoagulatorDecant TanksDecanter for Oil RecoverySludge DryerAncilliariesTOTAL CAPITAL
ANNUAL OPERATING
Electrocoagulator l
2 kw/lOOO gal @ $0. 15/kw18 cells @ $240 eachTotal
Dryer Steam RequirementsFuel CostAssumptions:
$300,000$20,000
$300,000$300,000$200.000
$1,120,000
$5,054$4,320$9,374
$23,378
Sludge is 40% solids leaving the decanter, and 94% solids after drying16,155 lbs/day, dry solids, equates to 23,201 lbs of water/day to be removed1.5 lbs steam/lb of water970.3 BTU/lb of steam130,000 BTU/gal of diesel$1 /gal diesel
Misc. Electrical $14,946
TOTAL OPERATING $47.698
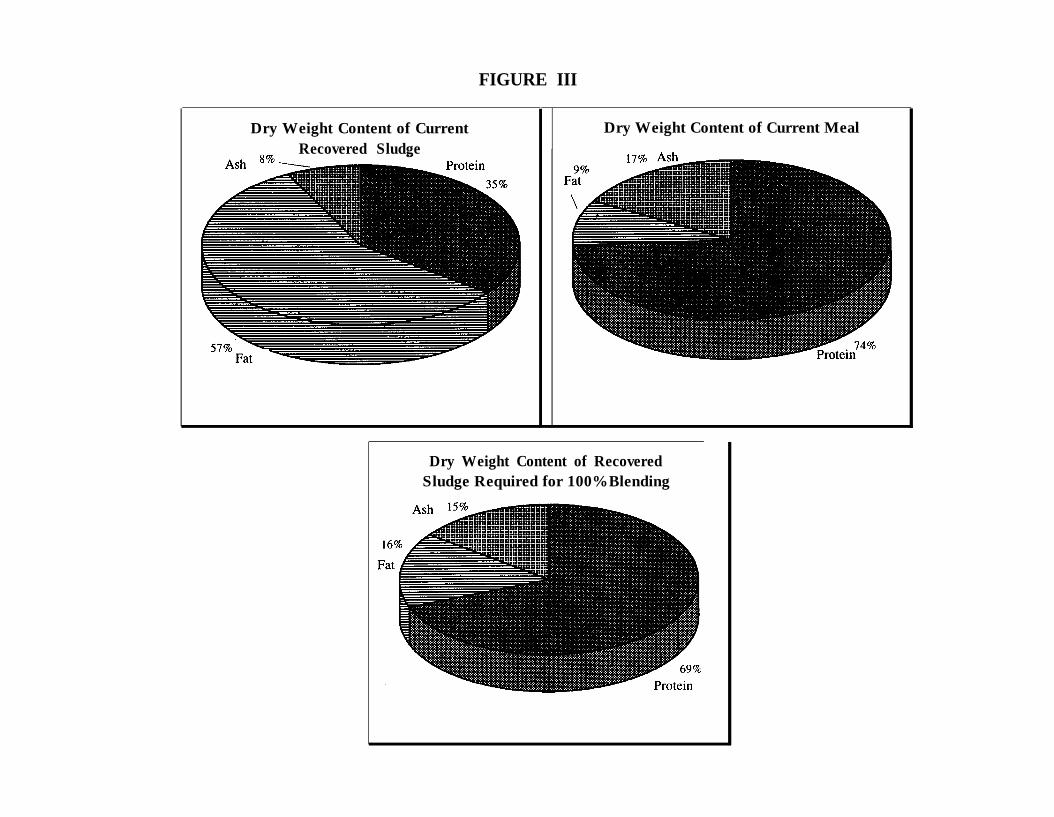
FIGURE III
Dry Weight Content of CurrentRecovered Sludge
Dry Weight Content of Current Meal
Dry Weight Content of RecoveredSludge Required for 100% Blending
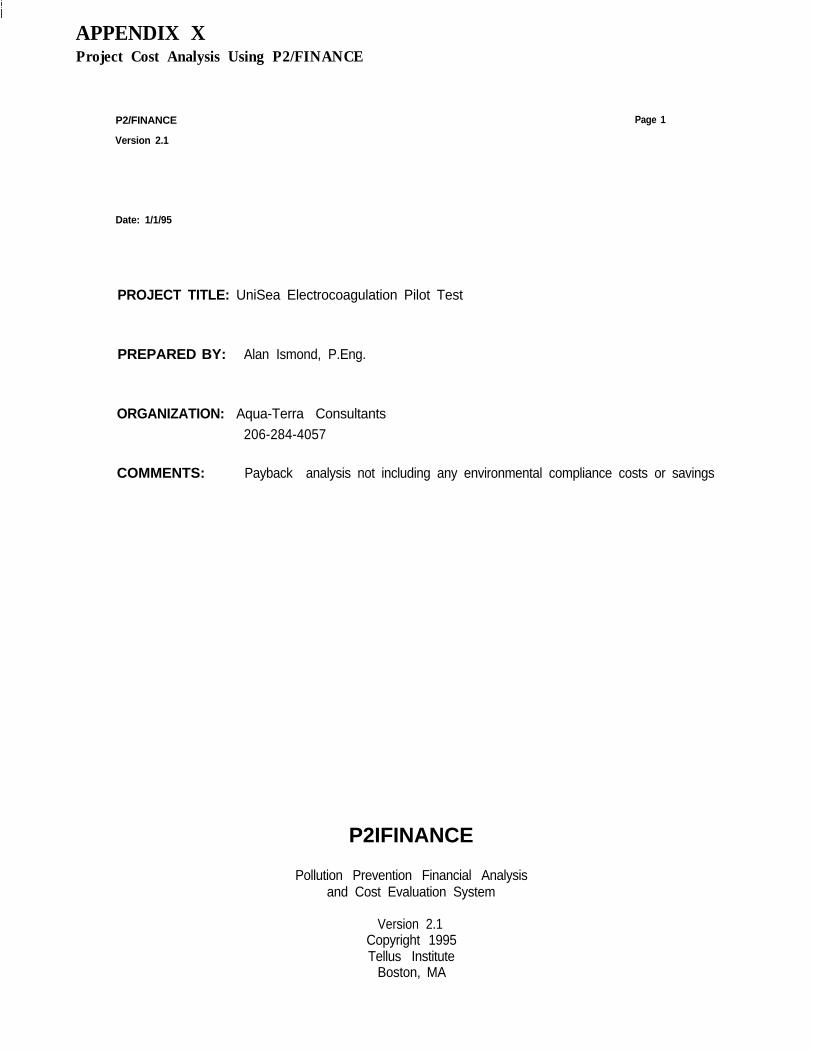
APPENDIX XProject Cost Analysis Using P2/FINANCE
P2/FINANCE Page 1
Version 2.1
Date: 1/1/95
PROJECT TITLE: UniSea Electrocoagulation Pilot Test
PREPARED BY: Alan Ismond, P.Eng.
ORGANIZATION: Aqua-Terra Consultants206-284-4057
COMMENTS: Payback analysis not including any environmental compliance costs or savings
P2IFINANCE
Pollution Prevention Financial Analysisand Cost Evaluation System
Version 2.1Copyright 1995Tellus Institute
Boston, MA
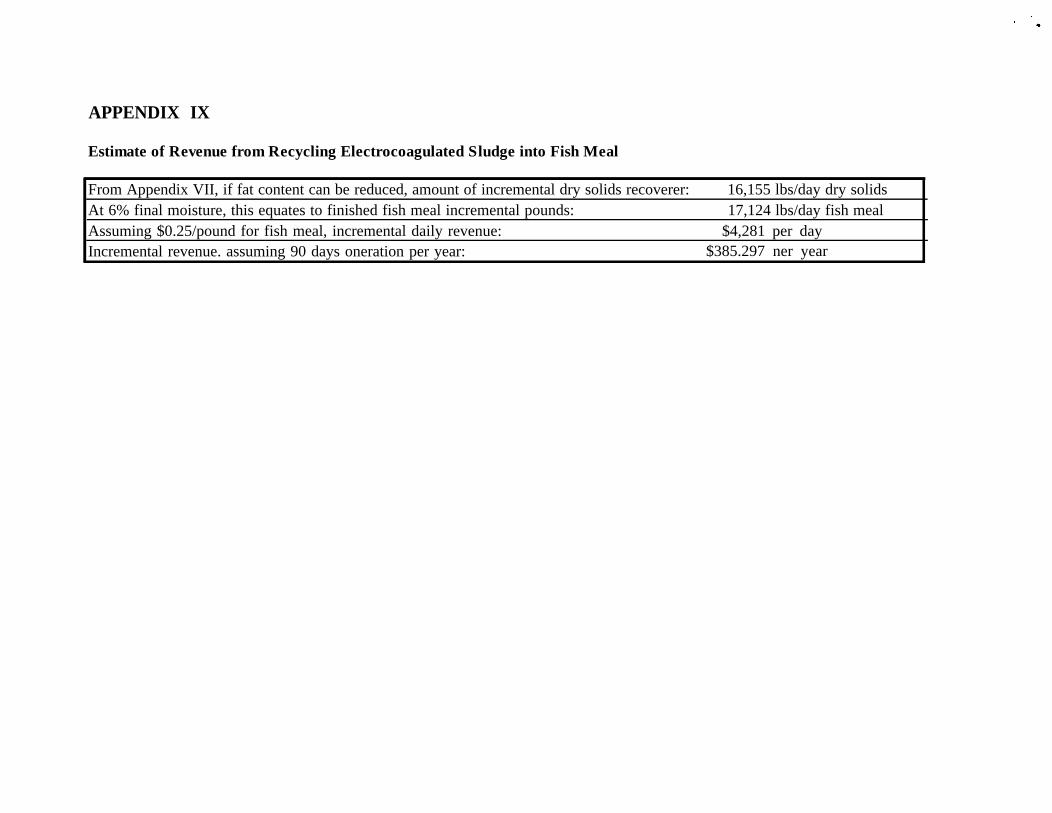
APPENDIX IX
Estimate of Revenue from Recycling Electrocoagulated Sludge into Fish Meal
From Appendix VII, if fat content can be reduced, amount of incremental dry solids recoverer: 16,155 lbs/day dry solidsAt 6% final moisture, this equates to finished fish meal incremental pounds: 17,124 lbs/day fish mealAssuming $0.25/pound for fish meal, incremental daily revenue: $4,281 per dayIncremental revenue. assuming 90 days oneration per year: $385.297 ner year
PROJECT TITLE:
UniSea Electrocoagulation Pilot Test
PROFITABILITY ANALYSIS SUMMARY
Page 9