
![VIOLONCELLO · 2019. 12. 6. · Viola + Violoncello + Doublebass ☆8901 村雲 あや子 (1949-) インタースパーション (1988) [10'30"] [R-8901] MURAKUMO Ayako Interspersion](https://static.fdocuments.in/doc/165x107/60dca7873292620d7378f372/violoncello-2019-12-6-viola-violoncello-doublebass-a8901-e-.jpg)


Languages
Pages
Legal


1
EXTREME STORMS AND CLIMATE
CHANGE
Rachel G. Mauk
Geography 8901
1 October 2012

2
Monitoring and Understanding Trends in Extreme Storms: State of Knowledge
Kunkel et al. (in press), Bulletin of the American Meteorological Society

3
Motivation
2011: 14 weather/climate disasters exceeding $1B in damage
Climate is changing Means AND extremes
How are extreme storms changing?How well can we detect changes?How well do we understand the changes?Next step: are the impacts changing?

4
Extreme storms Short-duration events with levels/types of wind
and/or precipitation that are uncommon for a particular place and time of year
Severe convective storms Tornadoes, hail storms, severe thunderstorms
Extreme precipitation Tropical cyclones Winter weather
Snowstorms, ice storms

5
Overriding Issues
Climate model resolution Knowledge of physical mechanisms Data heterogeneity
Changes in observing practices and technologies
Changes in station locationDefinitions of phenomenaAnalysis proceduresOften, changes are improvements….but still
impact validity of long-term trends

6
Severe Thunderstorms: Reports and Environments
7
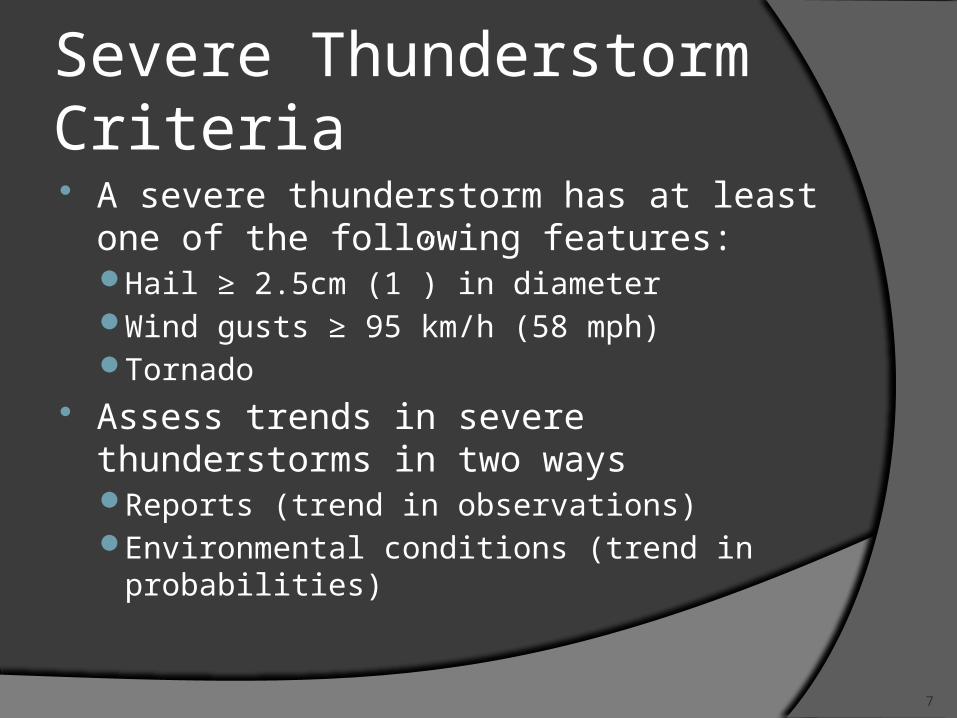
Severe Thunderstorm Criteria A severe thunderstorm has at least one
of the following features:Hail ≥ 2.5cm (1”) in diameterWind gusts ≥ 95 km/h (58 mph)Tornado
Assess trends in severe thunderstorms in two waysReports (trend in observations)Environmental conditions (trend in
probabilities)

8
Tornado Reports
Tornadoes: increased number of tornado reports since 1954No trend in F1+ tornadoes since 1954All of trend due to F0 tornadoes
?
Fig. 1

9
WSR-88D: doppler radar enables detection of radial motion (toward/away from radar)
Identify mesocyclones (tornado precursor)
Send NWS survey teams to areas with radar-indicated tornadoes

10
Tornado Reports
Upward trend in tornado frequency over last 50 years due to increase in (E)F0 reportsF0 are weak and short-lived tornadoesPrior to Doppler era, damage likely
attributed to straight-line winds or never observed

11
Tornado damage reporting Fujita (F) scale replaced by Enhanced
Fujita (EF) scale in May 2007Adjusted damage ratings for construction
quality and maintenance (28 structures)Cannot directly compare F-scale ratings to
EF-scale ratingsNo plans for conversion
Changes in damage assessment over the decades (subjective/objective)

12
From Changnon and Changnon (2000; J. Clim)

13
From Changnon and Changnon (2000; J. Clim)

14
From Changnon and Changnon (2000; J. Clim)

15
Severe weather ingredients are well-knownLower-troposphere wind shear: self-supporting
thunderstorms; induce mesocyclones Instability: deep convection (tall cumulonimbus)

16

17
Compare to wind event….

18
How well are severe thunderstorm environments modeled?
Trapp et al. (2011), Clim. Dyn. Downscaled NCEP/NCAR Reanalysis
data (2.5°) using WRF to 4.25 km grid spacing
Identified severe thunderstorms as events exceeding minimum thresholds in updraft helicity (vertical motion + vorticity) and radar returns

19
Too few events in May/June Too many in N. Gr. Plains in June, too few in E. US
[Clim. Dyn., 2011]

20
How will GHGs affect severe weather frequency? Trapp et al. (2009; GRL, L01703)
5-member ensemble of CCSM3 (NCAR) Ran simulation from 1951-2099 Examined changes in parameters
known to be conducive to severe thunderstorm formation:CAPE (instability—vertically summed
difference between parcel & env. temp)Wind shear (0-6 km)—rotationWater vapor content (convection)
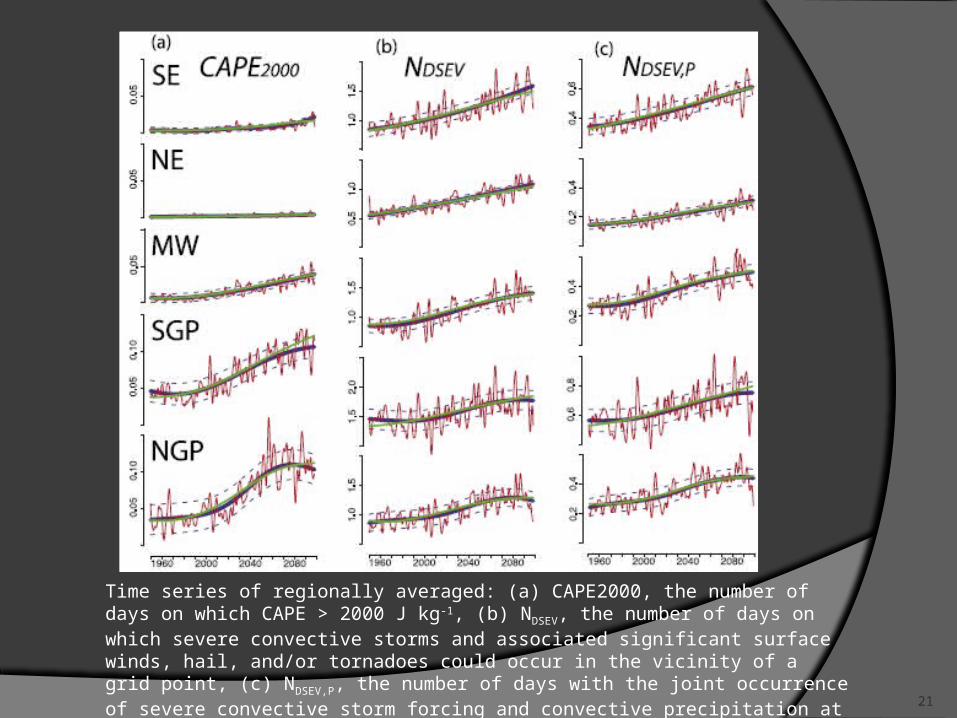
21
Time series of regionally averaged: (a) CAPE2000, the number of days on which CAPE > 2000 J kg-1, (b) NDSEV, the number of days on which severe convective storms and associated significant surface winds, hail, and/or tornadoes could occur in the vicinity of a grid point, (c) NDSEV,P, the number of days with the joint occurrence of severe convective storm forcing and convective precipitation at a grid point (Trapp et al. 2009, GRL, L01703)

22
Time series of regionally averaged: (d) S06, the magnitude of the vector differencebetween the horizontal wind at 6 km AGL and the wind at the lowest model level (m s -1), (e) CAPE (J kg-1), and (f) q, the surface specific humidity (x 10-3 kg kg-1) (Trapp et al. 2009, GRL, L01703)
23
Summary: Severe Convective Storms
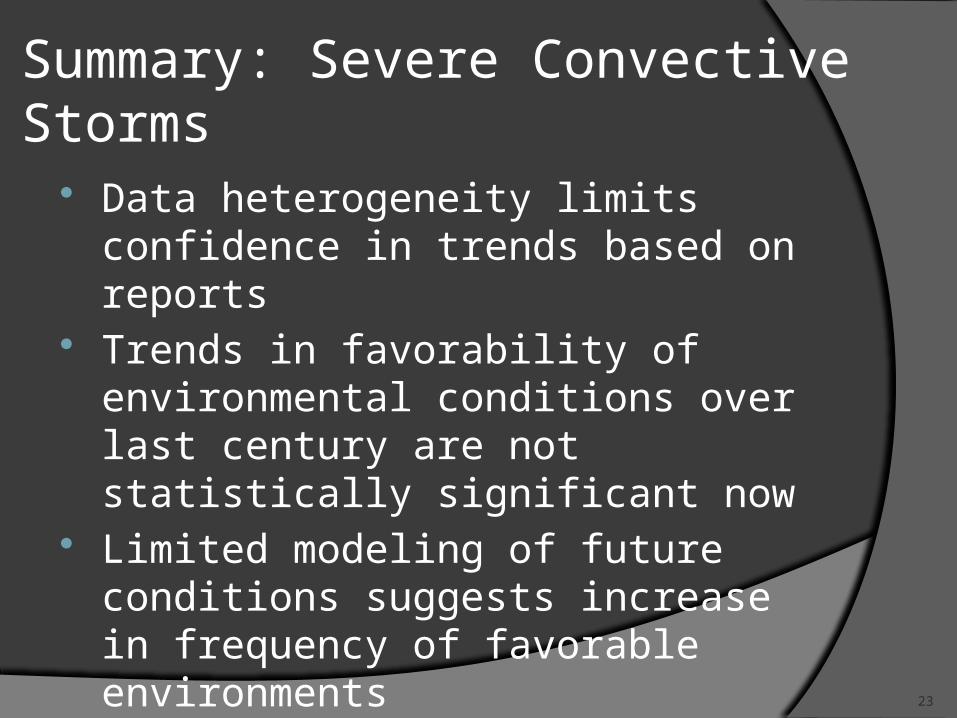
Data heterogeneity limits confidence in trends based on reports
Trends in favorability of environmental conditions over last century are not statistically significant now
Limited modeling of future conditions suggests increase in frequency of favorable environmentsMore studies needed
24
Extreme Precipitation: Events and Favorable Conditions

25
Extreme precipitation: data US observing network well-suited to
assessing changes in heavy precipitation NWS Cooperative Observer network has used
same 8” nonrecording precipitation gaugeNo time-dependent instrumentation biasMinimal wind-driven bias and gauge undercatch for
large amounts of precipitation Network of observers relatively dense Does not distinguish convective from non-
convective events
26
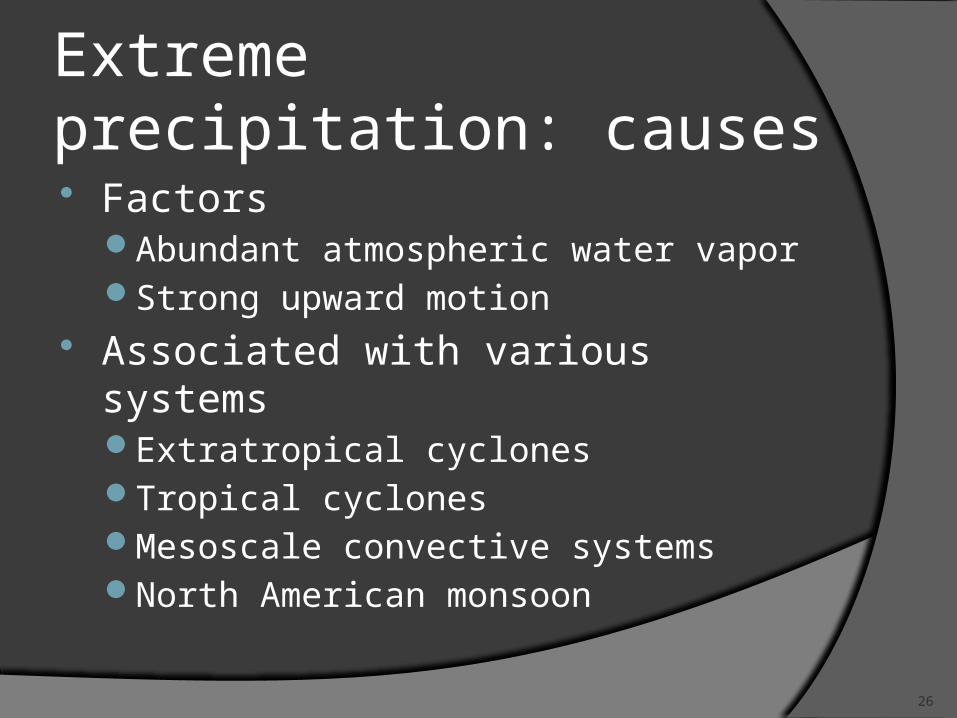
Extreme precipitation: causes Factors
Abundant atmospheric water vaporStrong upward motion
Associated with various systemsExtratropical cyclonesTropical cyclonesMesoscale convective systemsNorth American monsoon

27
Extreme precipitation: metrics Analyze using statistics
Empirical (distribution, trends, threshold exceedance)
Theoretical (extreme value theory—maxima, return levels)
Choice of metrics involves tradeoff Low-probability events are most
societally relevant Less extreme but more frequent events
minimize sampling uncertainty Recurrence interval thresholds used
for runoff control structures

28
Extreme precipitation: trends Many studies have found statistically
significant increases in extreme precipitation events of hours to daysNumber and intensity
Change in tails of distribution, not shift+0.6% / decade in mean precipitation+2% / decade in extreme precipitation
What about spatial trends?

29
Figure 3. Time series of decadal values of an index (standardized to 1) of the number of 2-day precipitation totals exceeding a threshold for a 1 in 5-yr occurrence for 7 regions and the U.S. as a whole. This was based on an individual analysis of 930 long-term stations. Station time series of the annual number of events were gridded and then regional annual values were determined by averaging grid points within the region. Finally, the results were averaged over decadal periods.

30
Extreme precipitation: trends U.S. as whole: more events in last 30
years Considerable spatial variation on
decadal scaleLess consistency in trends in west, more in
east Trend is significant for U.S. as whole,
Midwest and Southeast No significant trends in western U.S.

31
Extreme precipitation: trends Estimated 1948-2010 change in 20-year
return values at individual stations calculated
76% of all stations experience increases in extreme precipitation
15% statistically significant (station-specific)

32
Figure 4. Changes in observed twenty year return value of the daily accumulated precipitation from 1948 to 2010. Units: inches. Only locations for which data from at least 2/3 of the days in the 1948-2010 period were recorded are included in this analysis. The change in the return value at each station is shown by a circle whose relative size portrays its statistical significance: the large circles indicate the z-score (estimated change in the return value divided by its standard error) is greater than two in magnitude, medium circles indicate the z-score is between one and two in magnitude, and the small circles indicate the z-score is less than one in magnitude.

33
Extreme precipitation: attribution Changes in extreme precipitation have
been linked to:Human-induced changes to atmospheric
compositionIncreased temperatures
○ For same annual or seasonal precipitation total, warmer climates generate more extreme events
Increased water vapor concentrations

34
Water vapor and extreme precipitation Study documented significant increases in
water vapor associated with extreme precipitation eventsExtreme precip event assigned precipitable
water value: maximum value from any radiosonde station within 300 km and 24 h of event
Increase in water vapor in environment of precipitation-producing systems may be physical cause of increase in intense events

35
Other causes: Physical changes to meteorological systems
Possible upward trend in number of extreme precipitation events associated with TCs (2 of 3 recent studies)
Upward trend in number of extreme precipitation events in the vicinity of fronts
Temporal redistribution of EN/LN events, land use changes
Possible changes to characteristics of meteorological systems?
36
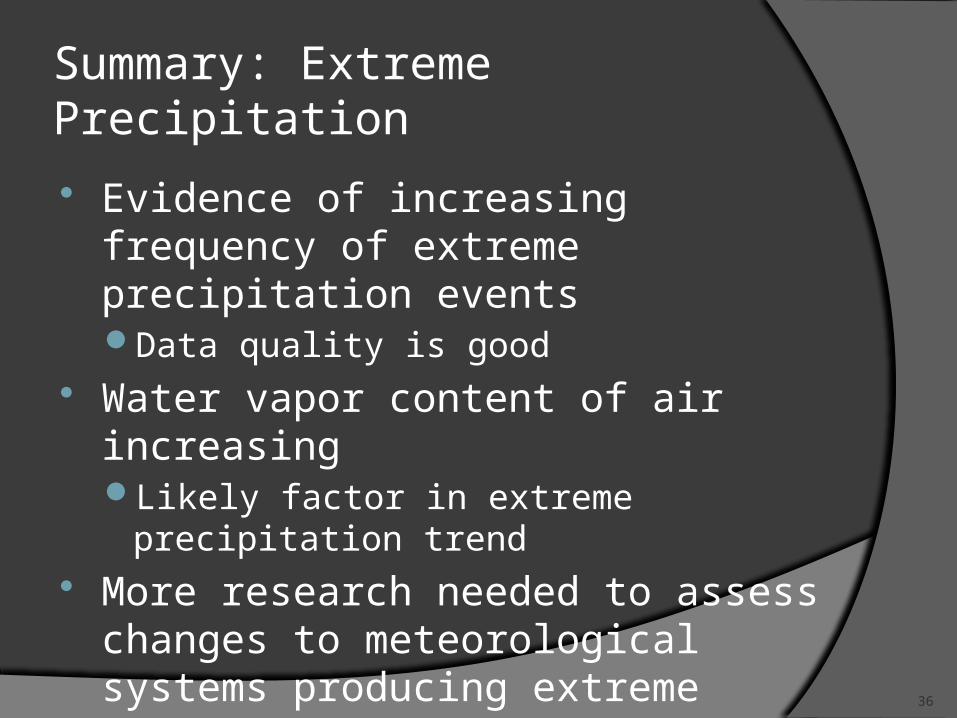
Summary: Extreme Precipitation
Evidence of increasing frequency of extreme precipitation eventsData quality is good
Water vapor content of air increasingLikely factor in extreme precipitation trend
More research needed to assess changes to meteorological systems producing extreme precipitation

37
Winter Storms: Snow and Ice

38
Winter storms Quantifying trends in frequency, duration,
and severity of winter storms requires ability to accurately and consistently measure:Amount of snow that fallsIce that accumulatesFor individual storms and throughout entire
season Data are complicated by changing observing
practices and technologies and reporting procedures

39
Winter storm data heterogeneity The following cause “artifacts” in data
series:Transition from primarily afternoon to
morning observation timesMove to direct measurement from previous
estimation of precipitation by “10:1” snow to water ratio
Periodic changes in observer training practices

40
What constitutes a winter storm? Characteristics
vary regionally 10” in NE is
fairly regular occurrence
10” in SE could cripple region for 1+ week
ILN just changed criteria for winter weather advisory

41
What constitutes a winter storm? Regional Snowfall Index (RSI)
Combines population, snowfall amount, and spatial extent Thresholds differ for different regions
http://www.ncdc.noaa.gov/snow-and-ice/rsi/

42
Winter storms: Influences Winter storm trajectories, frequency, and
intensity are affected by:
El Nino/Southern Oscillation (ENSO) North Atlantic/Arctic Oscillation
(NAO/AO)

43
Winter storms: ENSO
El Nino/Southern Oscillation (ENSO)La Nina: northerly storm track (more snow to
northern/central Rockies)El Nino: southerly storm track (rain/snow to
desert SW, rain to SE) Regime changes over last century
Low activity from 1930s-1940sEN favored early in 20th century, mid 1970s-
late 1990sLN favored in 1950s- mid 1970s

44
Winter storms: (N)AO
(N)AO dominates eastern U.S. weather patternsPositive phase: mild winter weatherNegative phase: strong storms
Also a regime change:Positive phase in early/late 20th centuryNegative phase in mid 20th centuryLast 15-20 years more even split
○ Negative in 2009-2010, 2010-2011 winters○ Positive in 2011-2012 winter

45
Figure 6. Number of extreme snowstorms (upper 10 percentile) occurring each decade within the six U.S. climate regions in the eastern two-thirds of the contiguous U.S. (Based on an analysis of the 50 strongest storms for each of the six climate regions from October 1900-April 2010). The inset map shows the boundaries of each climate region. These regions were selected for consistency with NOAA’s monthly to annual operational climate monitoring activities. The map includes standardized temperature anomalies and precipitation departures from the 20 th century mean calculated across all snow seasons in which each storm occurred. The snow season is defined as December-March for the South and Southeast regions and November-April for the other four regions.

46
Extreme snowstorms: trends Based on RSI:
From 1961-2010, 21 extreme regional snowstormsFrom 1900-1960, 9 extreme snowstorms
Extreme storms occurred more frequently in colder and wetter winters (Fig. 6)35% were warmer than average30% drier than average
Even if temperatures continue to warm, for at least next few decades record storms are still possible
47
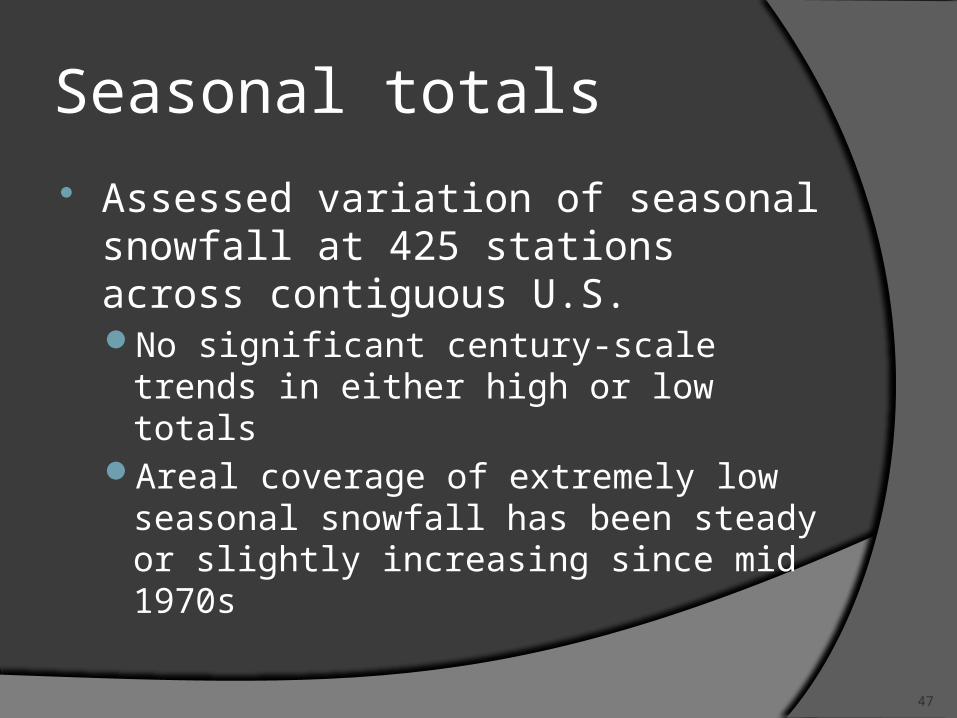
Seasonal totals
Assessed variation of seasonal snowfall at 425 stations across contiguous U.S.No significant century-scale trends in either
high or low totalsAreal coverage of extremely low seasonal
snowfall has been steady or slightly increasing since mid 1970s

48
Figure 7. (a). Area weighted annual percentage of U.S. homogenous snowfall stations exceeding their own 90th percentile seasonal totals, 1900-01 to 2010-11. Reference period is 1937-38 to 2006-07. Adapted from Kunkel et al. (2009c). Thick blue line: 11-year running mean of the percentages. Dashed line: Number of grid cells with active stations each year.

49
Figure 7(b). Area weighted annual percentage of U.S. homogenous snowfall stations below their own 10th percentile seasonal totals, 1900-01 to 2010-11. Reference period is 1937-38 to 2006-07. Adapted from Kunkel et al. (2009c). Thick blue line: 11-year running mean of the percentages. Dashed line: Number of grid cells with active stations each year.

50
Winter storm modeling Number of extreme snowstorms could
increase in latter half of 20th century Areal coverage of extremely low seasonal
snowfall totals constant or increasing Contradiction? No: comparing short-term extreme events
versus sum of all events over a seasonNorthern areas of U.S.: not uncommon for extreme
snowstorm to occur in year with below-average snowfall totals

51
Ice storms
Ice storms disrupt transportation, can cause catastrophic damage to ecosystems and infrastructure
Most events occur east of Rockies Climatologies:
Begin in mid 20th centuryLimited to “days with”Coarsely distinguish magnitudeReporting highly inconsistent
52
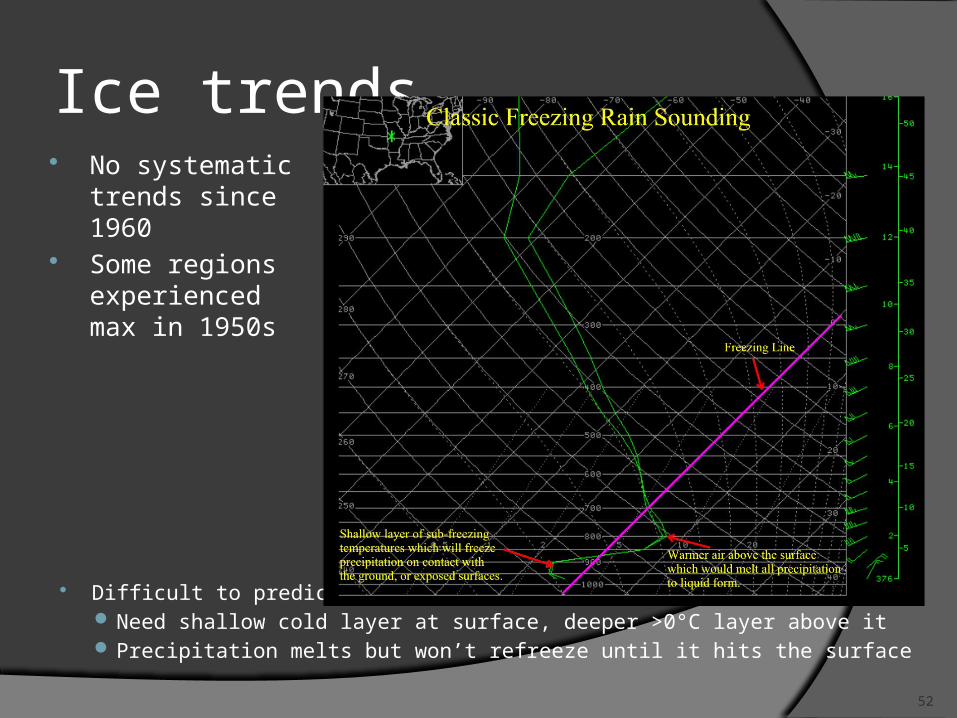
Ice trends
Difficult to predict Need shallow cold layer at surface, deeper >0°C layer above it Precipitation melts but won’t refreeze until it hits the surface
No systematic trends since 1960
Some regions experienced max in 1950s

53
Summary: Snow and Ice
Many data issues with snow and ice reportsLow confidence in observed trends
Large-scale climate teleconnections affecting winter storms knownFrequency and location of storms
Frozen precipitation not likely to disappear in warmer worldHigher latitudes and elevations

54
Trends in Impacts
Data quality and attribution issues also affect trends in impacts of extreme weather eventsSpatial/temporal changes in social
vulnerabilityEconomic loss reporting practices also changeMetrics vary in precision and adjustment
techniques (for population, wealth, mortality, type of loss)
Low confidence in loss trends

55
Figure 8. Authors’ assessments of the adequacy of data and physical understanding to detect and attribute trends. Phenomena are put into one of three categories of knowledge from less to more. The dashed lines on the top and right sides denote that knowledge about phenomena in the top category is not complete.
Developed through extensive verbal discussion at a meeting of the author team to reach a group consensus.

56
Recommendations Severe thunderstorms
Develop collecting procedures independent of weather warningsObjective remotely-sensed observations (radar)
Extreme precipitationMaintain observation networkExplore role of water vapor
Snow and ice stormsReduce uncertainties in historical record (new data sources,
techniques to account for changing observations technology/practices)
Improve observation network (density and technology)Consistent observation and reporting practices
Top Related