


Languages
Pages
Legal

Potential Grain Yield Using Calculated ComponentsAssume 90,000 kernels/bu and 56 lb/bu; kernel mass = 282 mg
500500 Row spacingPlant density 15 in 30 in(number/A) Plant spacing
)
400 15 000 28 14 25 000 17 8 30 000 14 7
( ) p g
yiel
d (b
u/A
)
300 35 000 12 6 45 000 9 5
Gra
in y
200
100
0 200 400 600 800 10000
Kernels/ear
Lauer © 1994-2008University of Wisconsin – Agronomyhttp://corn.agronomy.wisc.edu
0.12 0.25 0.37 0.50 0.62Grain(lb)/ear
1
• In the 1990s, we usually recommended buying more expensive seed, if hybrid was better performing.
• Today, not true due to high seed cost.
• “It's no secret that the price of seed corn has been on the prise. Better genetics and improved traits have increased that seed's performance — at a cost. With the retail price of the elite corn hybrids now well over $200 per unit producerselite corn hybrids now well over $200 per unit, producers can expect another significant price rise. And $300, even $500 seed corn is on the horizon …”M k M “$500 S d?” I F d I d t N S t b 1 2008Mark Moore “$500 Seed?” In Farm and Industry News, September 1, 2008
Lauer © 1994-2008University of Wisconsin – Agronomyhttp://corn.agronomy.wisc.edu
2
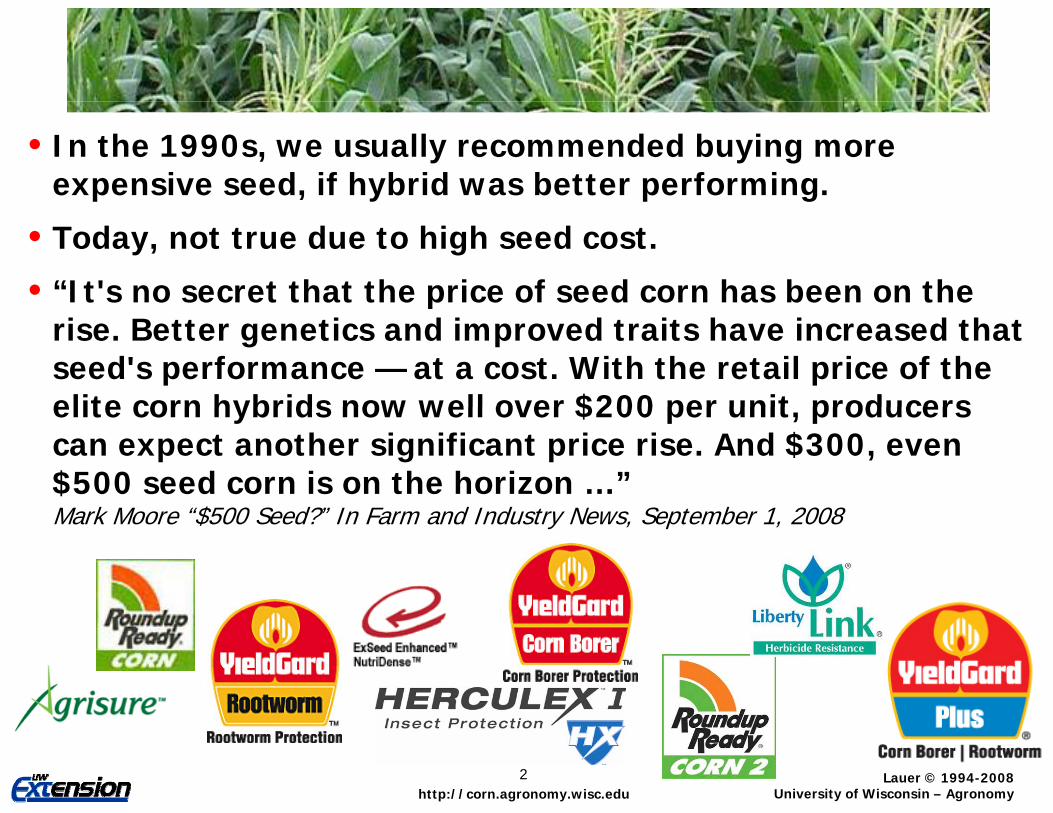
Corn response to plant density in Wisconsin)
280
All sitesArlingtonChippewa FallsFond du LacGalesvilleHancockJanesvilleLancaster )
240
280All sitesArlingtonChippewa FallsFond du LacGalesvilleHancockJanesvilleLancaster
20042002
Gra
in y
ield
(bu/
A)
200
240LancasterMarshfieldValders
Gra
in y
ield
(bu/
A)
160
200
LancasterMarshfieldSeymourValders
Plant density (number/A)20000 25000 30000 35000 40000 45000 50000 55000
160
Plant density (number/A)15000 20000 25000 30000 35000 40000 45000 50000 55000
80
120
Plant density (number/A) Plant density (number/A)
280All sitesArlingtonChippewa FallsFond du LacGalesvilleHancock
• Varies by location and hybrid (GxE)
Usually grain yield increases with 2003
rain
yie
ld (b
u/A)
160
200
240HancockJanesvilleLancasterMarshfieldSeymourValders
higher plant density to an optimum
• Concerns
Lodging
10000 15000 20000 25000 30000 35000 40000 45000 50000
Gr
80
120
160 Lodging
Drought
Higher plant density rarely lowers yield
Lauer © 1994-2008University of Wisconsin – Agronomyhttp://corn.agronomy.wisc.edu
Plant density (number/A)10000 15000 20000 25000 30000 35000 40000 45000 50000
3
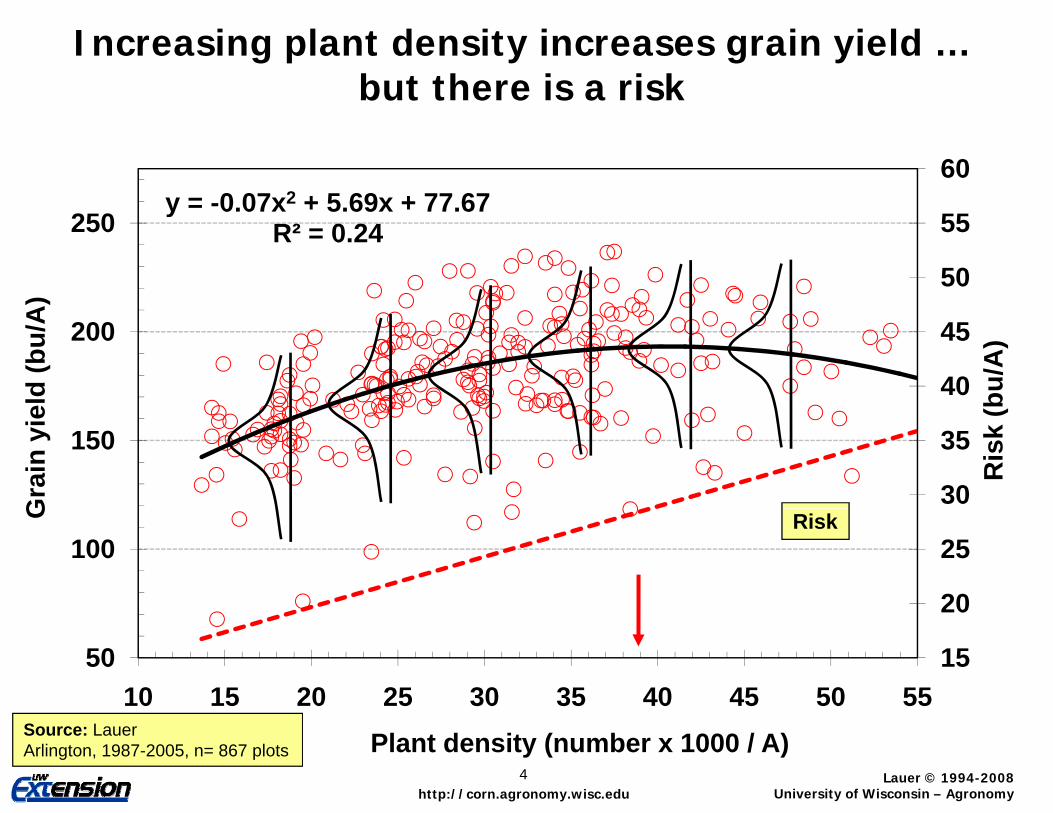
Increasing plant density increases grain yield … but there is a risk
y = -0 07x2 + 5 69x + 77 6760
y = -0.07x2 + 5.69x + 77.67R² = 0.24
50
55250
)
40
45200
bu/A
)
eld
(bu/
A
30
35150
Ris
k (
Gra
in y
ie
20
25100
G Risk
15
20
5010 15 20 25 30 35 40 45 50 55
Lauer © 1994-2008University of Wisconsin – Agronomyhttp://corn.agronomy.wisc.edu
Plant density (number x 1000 / A)Source: LauerArlington, 1987-2005, n= 867 plots
4
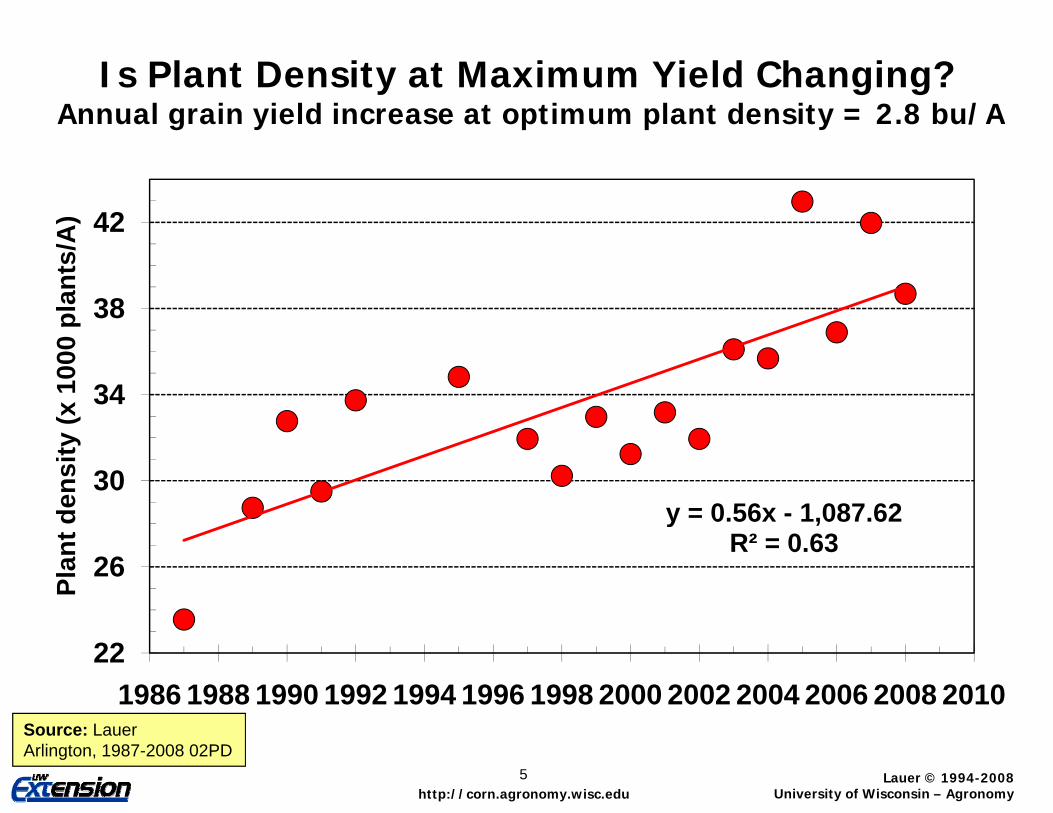
Is Plant Density at Maximum Yield Changing?Annual grain yield increase at optimum plant density = 2.8 bu/A
38
42
ants
/A)
34
38
x 10
00 p
l
y = 0 56x 1 087 6230en
sity
(x
y = 0.56x - 1,087.62R² = 0.63
26
Plan
t d
221986 1988 1990 1992 1994 1996 1998 2000 2002 2004 2006 2008 2010
Lauer © 1994-2008University of Wisconsin – Agronomyhttp://corn.agronomy.wisc.edu
5
Source: LauerArlington, 1987-2008 02PD
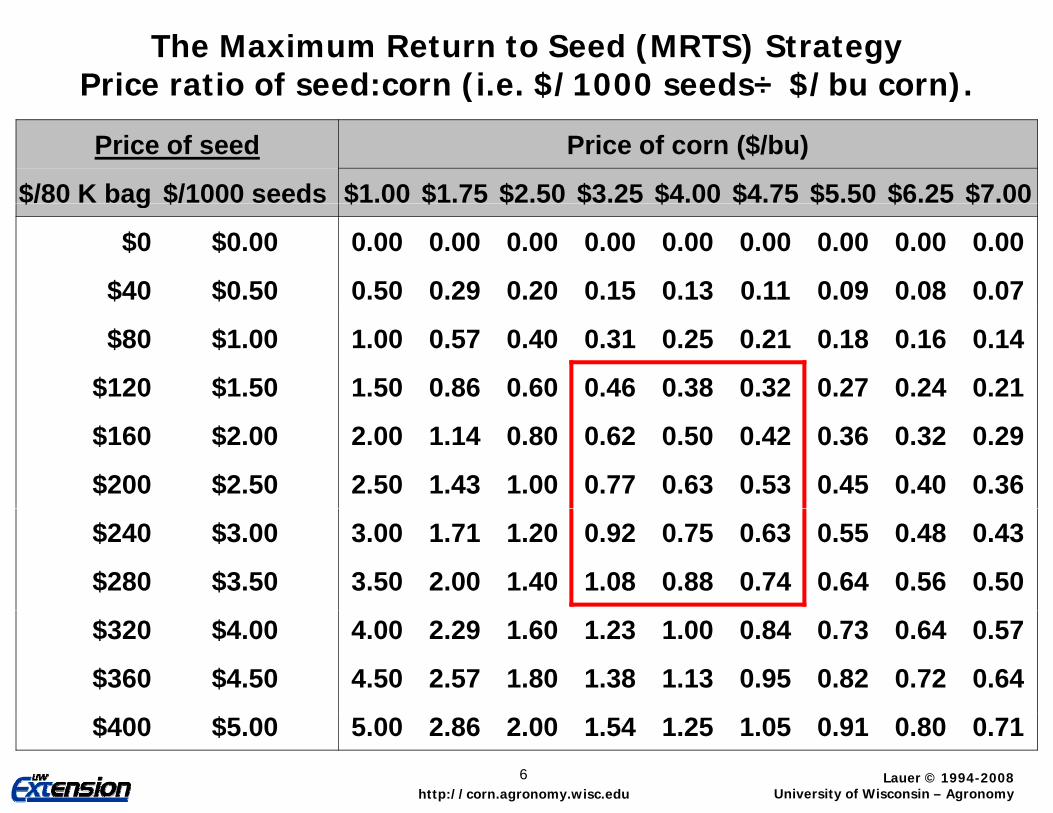
The Maximum Return to Seed (MRTS) StrategyPrice ratio of seed:corn (i.e. $/1000 seeds÷ $/bu corn). ( )
Price of seed Price of corn ($/bu)
$/80 K bag $/1000 seeds $1.00 $1.75 $2.50 $3.25 $4.00 $4.75 $5.50 $6.25 $7.00$ g $ $ $ $ $ $ $ $ $ $
$0 $0.00 0.00 0.00 0.00 0.00 0.00 0.00 0.00 0.00 0.00
$40 $0.50 0.50 0.29 0.20 0.15 0.13 0.11 0.09 0.08 0.07
$80 $1.00 1.00 0.57 0.40 0.31 0.25 0.21 0.18 0.16 0.14
$120 $1.50 1.50 0.86 0.60 0.46 0.38 0.32 0.27 0.24 0.21
$160 $2.00 2.00 1.14 0.80 0.62 0.50 0.42 0.36 0.32 0.29
$200 $2.50 2.50 1.43 1.00 0.77 0.63 0.53 0.45 0.40 0.36
$240 $3.00 3.00 1.71 1.20 0.92 0.75 0.63 0.55 0.48 0.43
$280 $3.50 3.50 2.00 1.40 1.08 0.88 0.74 0.64 0.56 0.50
$320 $4.00 4.00 2.29 1.60 1.23 1.00 0.84 0.73 0.64 0.57
$360 $4.50 4.50 2.57 1.80 1.38 1.13 0.95 0.82 0.72 0.64
Lauer © 1994-2008University of Wisconsin – Agronomyhttp://corn.agronomy.wisc.edu
$400 $5.00 5.00 2.86 2.00 1.54 1.25 1.05 0.91 0.80 0.716
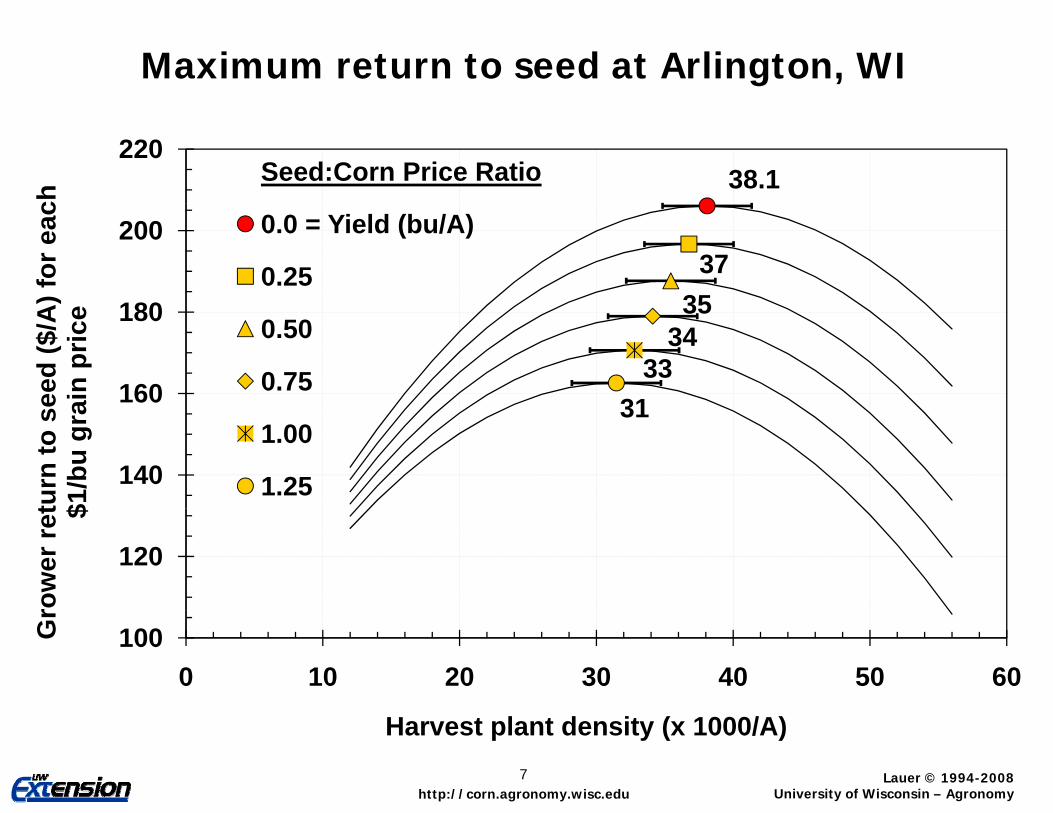
Maximum return to seed at Arlington, WI
38.1220
ch Seed:Corn Price Ratio
3735180
200
A) f
or e
ac 0.0 = Yield (bu/A)
0.2535
3433
31160
180
eed
($/A
ain
pric
e 0.50
0.7531
140
turn
to s
$1/b
u gr
a
1.00
1.25
120
row
er re
t $
1000 10 20 30 40 50 60
Gr
Lauer © 1994-2008University of Wisconsin – Agronomyhttp://corn.agronomy.wisc.edu
Harvest plant density (x 1000/A)7
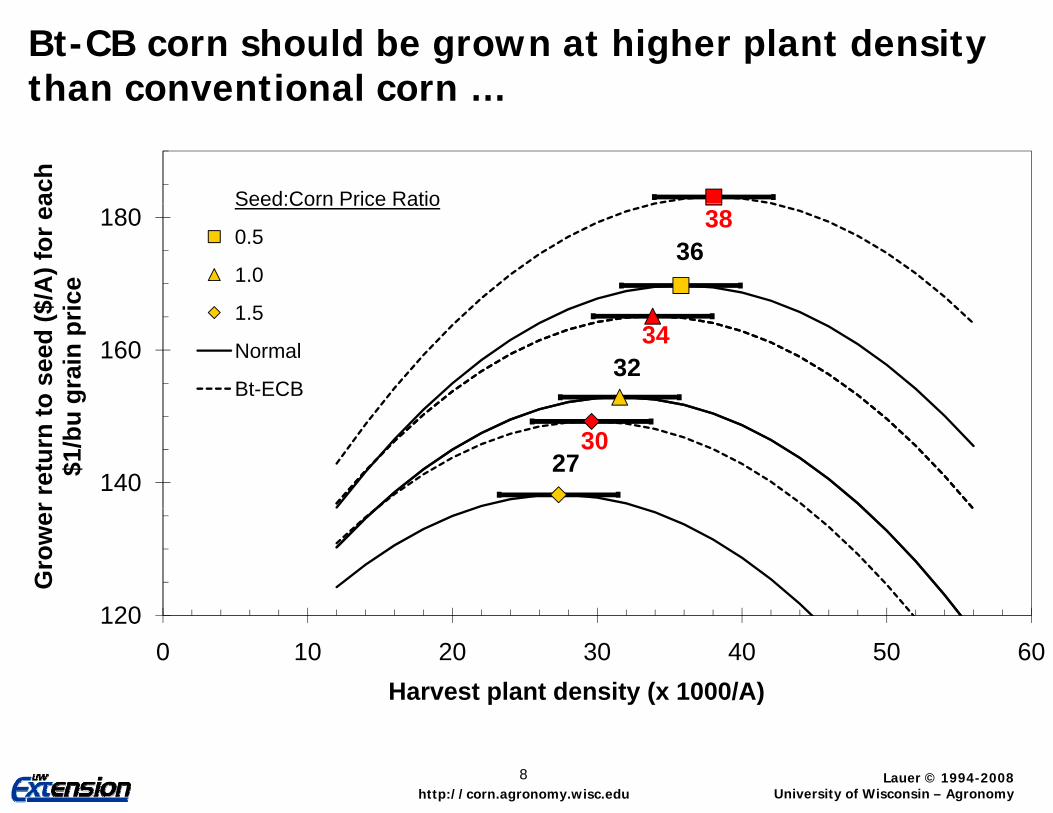
Bt-CB corn should be grown at higher plant density than conventional corn …
ach
Seed:Corn Price Ratio
3638180
$/A
) for
ea
ce
Seed:Corn Price Ratio
0.5
1.0
1
3234160
o se
ed ($
grai
n pr
i 1.5
Normal
Bt-ECB
2730
140
r ret
urn
to$1
/bu
120
Gro
wer
1200 10 20 30 40 50 60
Harvest plant density (x 1000/A)
Lauer © 1994-2008University of Wisconsin – Agronomyhttp://corn.agronomy.wisc.edu
8
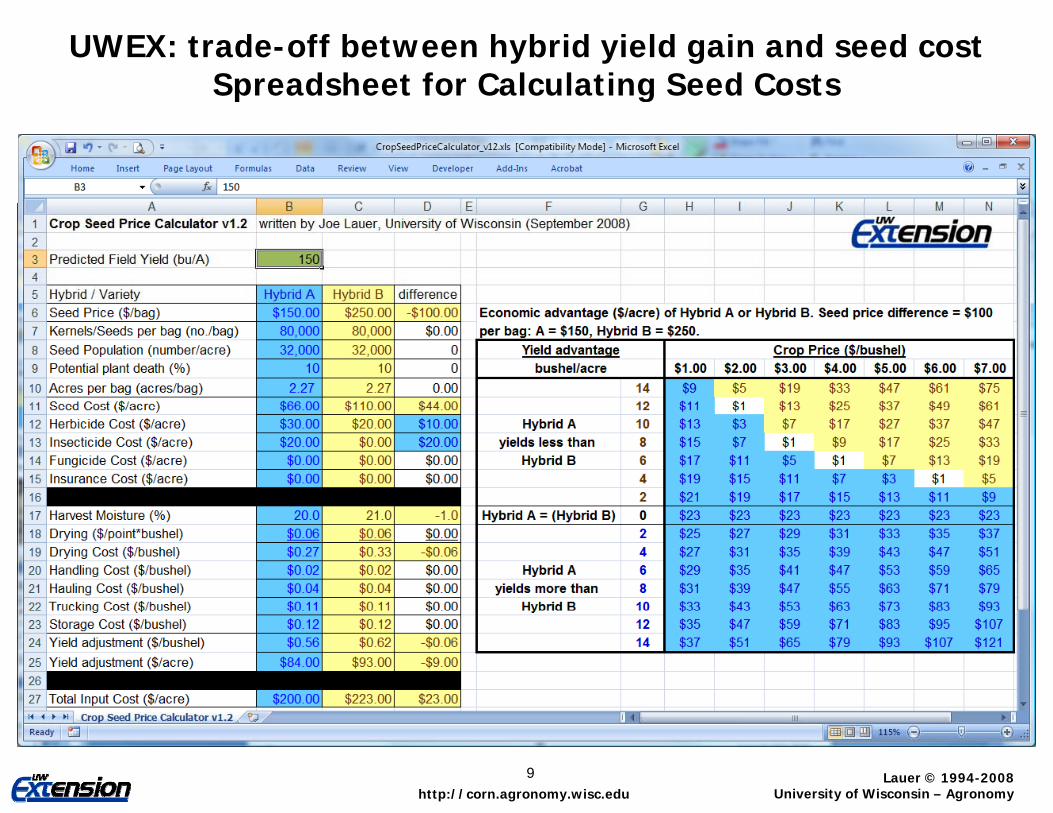
UWEX: trade-off between hybrid yield gain and seed costSpreadsheet for Calculating Seed Costsp g
Lauer © 1994-2008University of Wisconsin – Agronomyhttp://corn.agronomy.wisc.edu
9
Guidelines for Choosing an Appropriate Plant Density for Corny
• May have the most potential to move a farmer from current yield levels. Might be the place to start for moving off the “yield plateau.”Optimum plant densities seem to be increasing as newer hybrids are
commercialized.Grain yield increases to plant densities of 39,400 plants/A.
• The EOPD for seed:corn price ratios between 0.5 and 1.5 is 29,800 to 36,200 plants/A.29,800 to 36,200 plants/A. The plant density of 32,700 plants/A is within $1.00 of the EOPD for ratios
between 0.5 and 1.5.
• In general silage yield increases as plant density increases• In general, silage yield increases as plant density increases. A trade-off exists where quality decreases with increasing population. Thus, the EOPD is the same for corn grown for silage or grain. , g g gCorn silage is often more valuable than grain, thus the EOPD follows more
closely seed:corn price ratios less than 1.0.
Lauer © 1994-2008University of Wisconsin – Agronomyhttp://corn.agronomy.wisc.edu
10
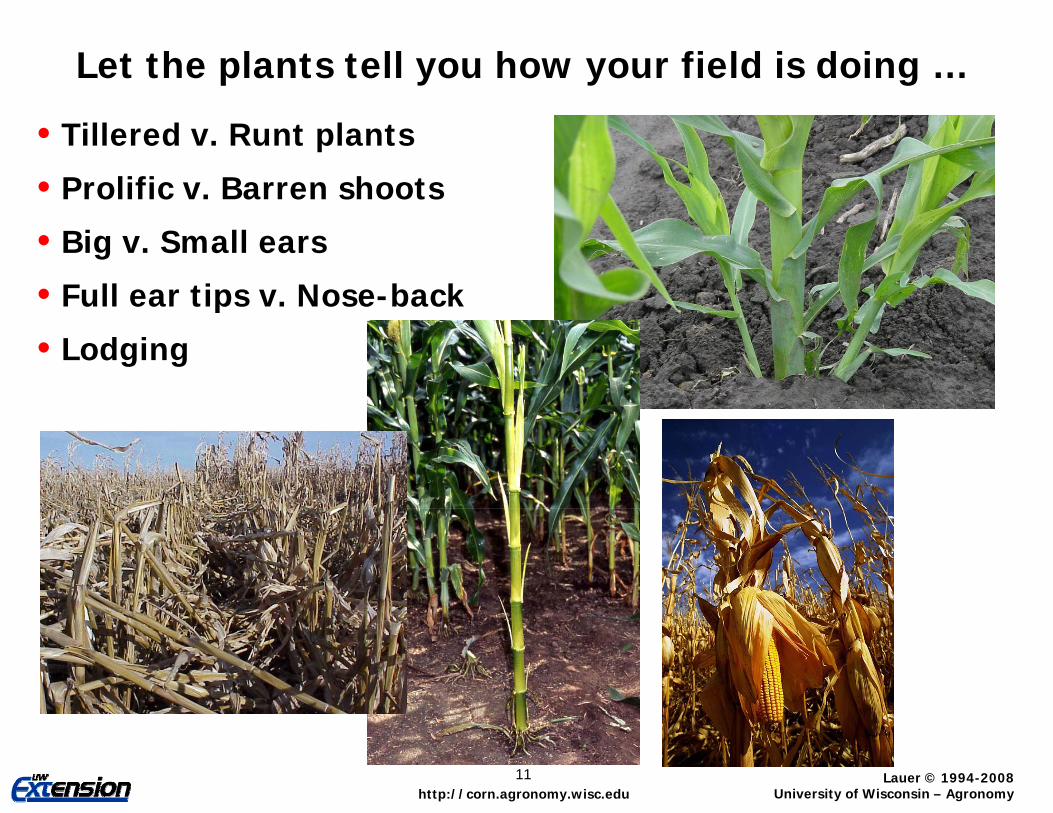
Let the plants tell you how your field is doing …
• Tillered v. Runt plants
• Prolific v. Barren shoots
• Big v. Small ears
• Full ear tips v. Nose-backFull ear tips v. Nose back
• Lodging
Lauer © 1994-2008University of Wisconsin – Agronomyhttp://corn.agronomy.wisc.edu
11
Top Related