Objective Yield Techniques for Estimating Grain Sorghum · PDF fileObjective Yield Techniques...
20
Objective Yield Techniques for Estimating Grain Sorghum Yields by Fred Vogel Research and Development Branch Standards and Research Division Statistical Reporting Service November 1970
Transcript of Objective Yield Techniques for Estimating Grain Sorghum · PDF fileObjective Yield Techniques...

Objective Yield Techniques for EstimatingGrain Sorghum Yields
by
Fred Vogel
Research and Development BranchStandards and Research DivisionStatistical Reporting Service
November 1970
1II
\I
II
~.
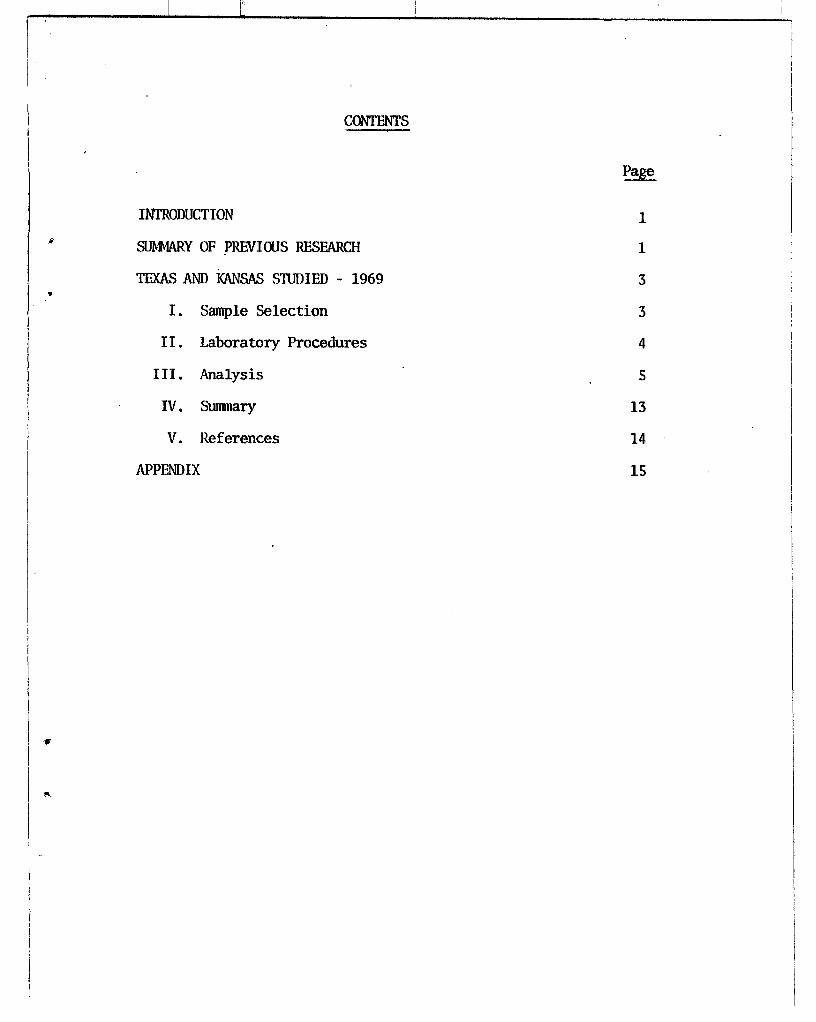
CONTENTS
INI'RODUCTION8mNARY OF PREVIOOS RESEARCH
TEXAS AND KANSAS STIJDIED - 1969
I. Sample SelectionII. Laboratory Procedures
III. AnalysisIV. StulDDaryV. References
APPENDIX
Page
1
1
3
3
4
5
131415

'"",
-
Introduction
The Statistical Reporting Service sponsored grain sorghumresearch by~owaState Ul!iversity during 1959-64. A separate study was conductedIn OklahomaIn 1964. The purpose of these projects was to examinegrowth patterns that could be used as yield indicators in an objectiveyield survey.
Additional research was conducted in 1969 in Kansas and Texas. Here~the primary goal was to obtain experience dealing with someof theproblems encountered in the earlier studies.
This report summarizesthe major findings of the Iowa and Oklahomastudies. Then it doaunents procedures followed and data collectedfrom the Kansas and Texas studies in 1969. Sameanalysis is shownalong with suggestions for additional research.
SlUlUllaryof Previous Research
Iowa State University Research~ 1959-64
The item given primary consideration during the first three years wasthe determination of an optimumsampling design for estimating drykernel weight. The results follow:
1. 1959 - The'optimumplot size was three rows wide by 80 feetlong. Twoplots within each sample field should beselected. The optimumnmber of sorghumheads toselect from each plot was 7.
2. 1960 - The optimm plot size for completely harvesting theplots was determined. It was two TOWS wide by 4feet long.
3. 1961 - The optimumsample design for each sample field was5 plots ~ each one row wide by 10 feet long. Threesample heads per plot should be selected.
The optimumsampling rates detennined each year differ considerably.This was effected somewhatby variable growing conditions between theyears and differences in the nmber of sample fields. The cost andvariance functions used each year also contributed to the variabilitybetween years.
1

The estimated numberof. kernels per head was obtained by visuallycanparing the .sample.head with another head for which the kernel COlBltwa$ known. This was a subjective procedure and was not very precise.The actual count of kernels per head was fOtmdto be correlated withfinal yield.~ver, they experienced difficulties in finding acOl.m;ting·procedure that was.both accurate and efficient.
In 1961, several plant·characteristics were examined to detenninetheir relationship with firial yield. The observations were made in
. AugUstand September. These were thEmcorrelated with the dry kernel
. weight per head at harvest time. The results appear in Table 1.
Table 2 contains the correlations for someadditional variables thatwere also observed in 1962 and 1963.
In 1960 and 1963, gleaning operations were conducted to mea~ureharvesting losses. The estimated average loss per acre represented8.0 percent of the total biological yield per acre in 1960 and 5.4percent in 1963. Loose kernels contributed .24percent of the arnolBltleft in 1960 and 34 percent in 1963. It was time consumingandcostly to pick up the loose kernels by hand. An alternate proceduretried was to use a broomto gather the kernels and then a sieve toseparate the kernels. This procedure was not very successful.
Table 1. - -Correlation coefficients between harvest weight per sorghumhead and observations made on sample plants, Iowa, 1961.
Variable
Plant heightStem diameter at plant baseStem diameter at head baseHead lengthHead·circwnferenceEye estimate No. branches in headEye estimate No. kernels in headNwnberplants in rowNumberheads in row
August(r)
.42
.75
.41-.35
.40
.39
.57-.34
.02
September(r)
.38
.68
.53-.59
•.49.66.23
-.33.31

-3-
Table 2.--Correlation coefficients between harvest weight and observedvariables, Iowa, 1961, 1962, and 1963.
•
Variable
August plants per footAugust % headsAugust DKW* per headAugust % dry matterAugust DKW X % dry matterSeptember heads per footSeptember DKW per headSeptember % dry matterSeptember DKW X % dry matter
* Dry kernel weight
1961
-.3994.4244.5167.2746.4222
-.3820.7198.2025.6071
1962
.6650
.4243•6310.3476.6289
-.5547.7593.3098.7082
1963
-.7234.3467.4445
-.0324.3414
-.7641.7449.0995.6697
••
Oklahoma Research - 1964
The length of the head and the diameter of the culm (stem) at the baseof the head appeared to be the best plant characteristics to be used.The relationship of number of kernels per head to total head weightwas very good. However, the number of kernels per head was difficultto obtain.The optimum plot size was fOtmd to be two rows wide by five feet long.The optimum number of plots to sample within a field was one.
Texas and Kansas Studies - 1969I. Sample Selection
A. TexasSorghum heads were randanly selected fran several sample Wlitslaid out for a remote sensing study in the lower Rio GrandeValley. Sample heads were clipped at two different times -once in the flower stage of development in J1.D1e,1969 againin the hard dough stage in July, 1969.

•
-4-
"B. KansasFields were,subjectively selected in four cOWlties. Headswere clipped from each field during regular SSO field travelin July and August, 1969. '
II • Laboratory Procedures:
A. Texas Samples
The following measurementswere obtained for all sample headsin both growth stages:
(1) Weight of head (air dried).
(2) Diameter of culm one inch below base of head.
(3) Length of head from the lowest node to ti'(>.
A total of 10 heads were clipped from plants in the floweringstage Whenfields reached the hard dough stage, 199 heads wereclipped.
Additiona1 observations were madeon the 10 heads from thefirst sample and a subsample of 20 heads from the secondsample. Theywere:
(1) The m.unberof nodes on a head.
(2) The m.unberof branches on each node.
(3) The numberof spike lets on each branch.
(4) The numberof kernels in spikelets of two selectedbranches.
The twenty heads from the second sample were threshed in amechanical harvestor (similar to that used in wheat objectiveyield surveys). A count of threshed kernels was obtained .
B. ~nsas Samples
Similar observations were madeon the 110 heads collected inKansas. Theywere:
'(1) Dry head weight.
(2) Length of head.
(3) Headwidth at mid-point.
II.
-5-
(4) Diameter of culm.
Unfortunately the monthly samples were not identified by thedate they were clipped. Thus, it was not possible to analyzethe data separately by month.
III. Analysis:
A large part of the analysis consisted of computingcorrelationsbetween the variables observed. TIle relati<;mships found maynotnecessarily hold over the season. For example, culm diametermaybe correlated with head weight when it is in the hard doughstage. However,the relationship between the culm diameter atthe flowering stage and the head weight at maturity is moreimportant for forecasting purposes. This report will not answerall such questions. The data mayprove helpful if additionalresearch is to be conducted•.
The data was analyzed separately by state with emphasis on theTexas observations.
A. Texas
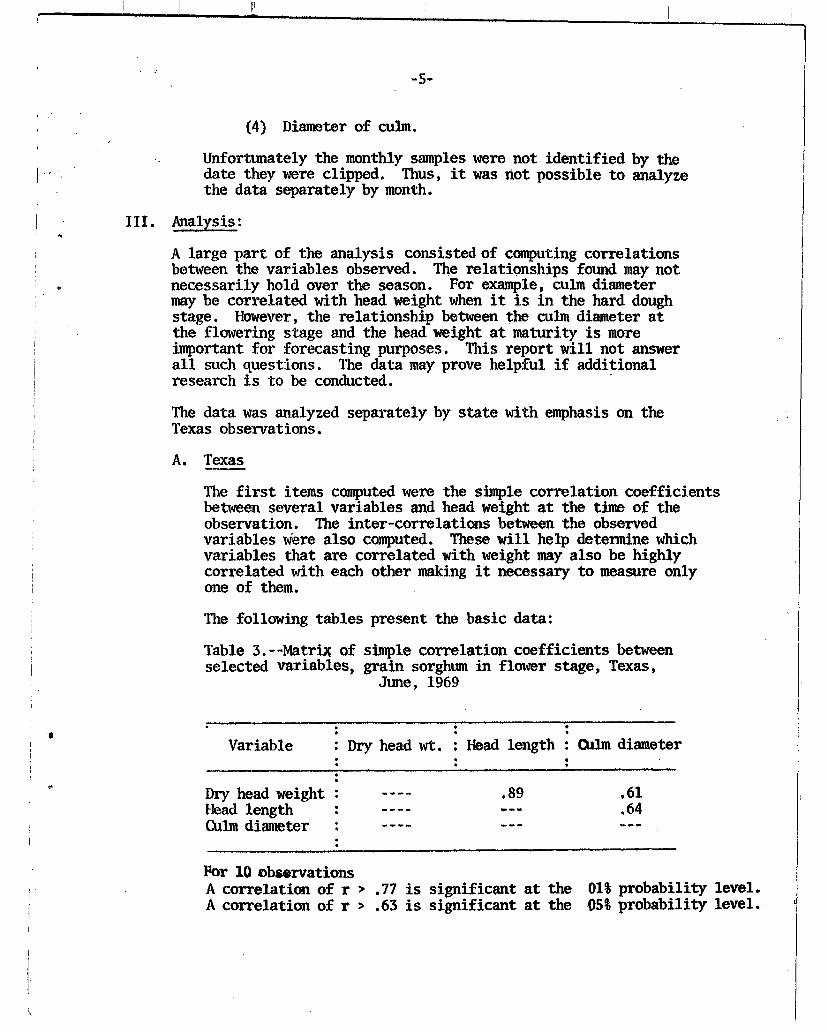
The first items computedwere the simple correlation coefficientsbetween several variables and head weight at the time of theobservation. The inter-correlations between the observedvariables were also computed. These will help detennine whichvariables that are correlated with weight mayalso be highlycorrelated with each other making it necessary to measure onlyone of them.
The fOllowing tables present the basic data:
Table 3.--Matrix of simple correlation coefficients betweenselected variables, grain sorghumin flower stage, Texas,
June, 1969
11Variable Dry head wt. Head length O1lmdiameter
Dry head weightHead lengthCulmdiameter
.89 .61.64
III
For 10 cbaarvationsA correlation of r > .77 is significant at the 01% probability level.A correlation of r > .63 is significant at the 05%probability level.

fl
-6-
Table 4.--Matrix of simple correlation coefficients betweenselected variables, grain sorghum in hard dough stage, July,
1969
Variable (1) (2) (3) (4) (5) (6)"
(1) Dry head weight .82 .60 .84 .82 .83(2) CUlm diameter .73 .98 .97 .96(3) Head length .66 .84 .72(4) CulmC.S.A • .95 .99(5) Culm circtunference
x head length .97(6) Culm C.S.A. x
head length
For 199 observations, a correlation coefficient of .18 issignificant at the 01 percent probability level, and acoefficient of .14 is significant at the OS percentprobabili ty level.The correlations did not remain very consistent over the twotime periods. However, the sample sizes'differed considerablyand the observations were on different plants.Research has shown that an early season COlmt of kernels iscorrelated with grain weight at harvest time. To gainexperience with laboratory procedures, detailed COlmts of nodes,branches, spikelets, and kernels were made on all plantsselected in the flower stage and on a subsample of thosecollected in the hard dough growth stage.The basic data is summarized in Tables 5 and 6. In order toobtain these counts it was necessary to clip the branches fromthe nodes. Thus, it would not be possible to obtain theseobservations in the field. The number of minutes it took toanalyze each head is also shown. It appears that a subsamplingseheme will be necessary to reduce the time.The next item examined was the distribution of kernels in thesorghum head. A nested analysis of variance was computed foreach set of data. The results appear in Tables 7 and 8. Itcan be concluded that:
(1) Within a node, every branch has about the same nlDllberof kernels per spike1et~

i( '., '
~,t'
i ••
I
III
'(2) Within a plant, every node has about the same numberof kernels per spikelet.
(3) There is a significant difference between heads.
The variance components indicate it would be sufficient tocomt the kernels on one branch fran one node in each headto estimate the ntunber of kernels per head. It would stillbe necessary to cotmt the number of nodes and the number ofbranches on the selected node.
Table 5. --COlD1tsobtained from selected sorghumheads in flowerstage, Texas, June, 1969
Number Number Number Minutes toPlant of of of count nodes
nodes branches spike lets etc.
1 13 54 459 802 16 44 164 293 11 54 422 594 13 51 419 865 "10 45 320 536 11 47 425 547 11 48 383 1078 11 53 363 669 13 55 234 69

I -I
••
-8-
Table 6.--Counts obtained fran selected sorghtunheads in harddough stage, Texas, July, 1969
Nwnber Number Number Minutes toPlant of of of CO\Dlt nodes
nodes branches spike1ets etc•. .
0
1 11 55 355 322 11 51 316 313 12 52 360 544 8 56 826 67.5 11 40 114 166 9 54 838 707 10 54 428 318 10 53 812 1209 9· 68 1244 110
10 10 S5 648 5911 11 S6 384 3812 0 10 57 404 60.0
13 8 51 258 2714 14 54 283 4915 10 33 137 1716 0 11 41 133 73.17 '12 41 159 3118 11 38 IS2 2819 12 4S 250 4420 11 46 199 30

,.,e
II' II
','~:
~ !
Table 7.--Analysis of variance on observations made on sorghumheads, flower stage, Texas, 1969
Source Mean . Varianceof D.F. Fvariation square ;components
Between heads 22 8.28 6.05** .479Between nodes/plants head 220 1.37 1.42 .313Between branches/nodes 238 .96 .92 -.125Between spikelets/branches :2802 1.05 1.050..Mean = 3.08 = average number of kernels per spike1et.
** Significant at the 01 percent level of probability.
Table 8.--Analysis of variance on observations made on sorghumhead, hard dough stage, July, Texas, 1969
** Significant at the D1 percent level of probability.

•
•
-10-
The sorghum heads in the ~rd dough stage were then threshedin a mechanical thresher.- Heads in the flower stage werenot threshed as the kernels were not developed enough to beseparated from the chaff.The threshed kernels were counted and weighed. The timespent on each step was also obtained. The observations aresunnnarized in Table 9. Some difficulties were encountered.
(1) The branches had to be clipped from the nodes andseparated into two or three groups because themachine available would not handle the entire head.
(2) The machine shattered many kernels - thus, causinga counting problem.
(3) The chaff did not separate very well - considerablehand sorting was necessary.
The time required to count the kernels was also lengthy. Theuse of the mechanical thresher does not seem warranted fortwo reasons:
(1) The number of kernels per head can be detenninedearly in the head deyelopment. This is probablywhen the information in needed in a fprecastingmddel. However, at this stage, it will be necessaryto count or estimate the number of kernels on thehead because they cannot be mechanically threshed.
(2) A subsampling procedure would probably be less timeconsuming
Some additional correlations were computed for the heads inthe hard dough stage. They are shown in Table 10. If theserelationships remained consistent until harvest time, theywould be good forecast indicators .
YThe machine is cOnlnonly referred to as the "micro thresher"developed for the wheat objective yield survey laboratoryprocedures in the State Statistical Offices. It is basicallya blender that breaks up the head and a vacuum to removeUte cn«:rI.
i
IIIIiI
II
IiI
iI

-11-
B. ·Kansas
Simple corr~lation coefficients were compu~edfor thevariables measured. No real inferences can be madebecause the ~ata represent several different samples,that is, heads selected in different months. They dogive somebasis for comparing the· growth characteristics.The sample was not collected in a manner to allow anyfurther analysis.
The correlation matrix is shownin Table 11.
Table 9.--0bservations made on threshed grain sorg1u.unheads inhard dough stage, Texas, July, 1969
.: Ntunber
Plant; of. whole•. kernels
... .: Weight of : Weight whole
damaged and damagedkernels kernels(grams) (grams)
: Minutes ; Minutesto to
thresh count
1011714816
204318
21801154110128072012
7401124664857386308506o
63944
l23456789
1011121314151617181920 .
___ ,.l::>. ..••.. __
.31.4
.32.l.2
1.0.3.3.6.3
3.1.4.2.1o
.1oo
.9o
16.213.615.439.1
.542.624.432.786.850.627.429.812.219.712.018.413.7o
14.8.5
303037555
845
2022173120105
12201510
323845
1303
7030285831602618207
37172010

-12•.
Table lO.--Correlation coefficient between weight of allkernels and observations made on grain sorghum head in
. hard dou~hgrowth stage, Texas, JUly, 1969
••
,.
VariableCorrelations
: with weightof kernels
Meansof
variable
No. of kernelsNo. of nodes·No. of.branchesNo. of spike1etsAve. wt. ofkernels per head .:
.924
.449
.766
.918
1060 kernels per head10.6 nodes per head50.0 branches per head415 spike lets per head23.5 grams
For 20 observations, a coefficient of .56 is significantat the 01 percent probability level, and a coefficientof .44 is significant at the OS percent probabilitylevel.
Table 11.-~MatTix of simple correlation coefficients betweenselected variables, grain sorghum, Kansas, 1969
Variable (1) (2) (3) (4) (5) (6) (7)
(1) Dry head weight .21 .75 .42 .18 .64 .43(2) Head length .22 .43 .99 .17 .40
.(3) Head width .54 .21 .95 .54(4) CUlm diameter .43 .53 .98
; • '(S) Length squared ,.•..•.... ,16 .40(6) Width squared --- .55(7) Diameter squared
110 observations.

•
•
-13-
IV. Sunlnary:,
The-results sh~'d that the actual numberof kernels in a sorghumhead is -highly-correlated with the head weight. Hc)wever,it wasdifficult and tine consmning'to obtain these,cmmts. Evenif abetter procedure for threshing the heads is devised, it stillwouldtake considerable time to do the cOWlting•
A-reasOnablealternative wouldbe to estimate the numberofkeme'ls. ' '111e numberof nodes and branches within nodes can becomted easily and ,quickly. Thenumberof ~emels in a smallsubsampleof branches,mayprovide a fairly precise estimate •

"
•1',
-14-
REFERENCES
1. 1959 SorghlDllProduction Study, Progress Report, Jose Nieto de Pascual,Statistical Laboratory, Iowa State University, June 1960.
2. 1960 SorghtDllProduction Study, Progress Report, Jose Nieto de Pascual,Statistical Laboratory, Iowa State University, April 1961.
3. 1961 Sorghum Production Study, Progress Report, Robert Cochran,Statistical Laboratory, Iowa State University, November 1962.
4. 1962 Sorghum Report, Progress Report, Robert Cochran, .StatisticalLaboratory, Iowa State University, September 1963.
5. 1963 Sorghum Production Study, ~mro1d Baker, Statistical Laboratory,Iowa State University, July 1964.
6. Sorghum Grain Study, Donald H. Von Steen, Research and DevelopmentBranch, Statistical Reporting Service, United States Departmentof Agriculture, March 1966.
7. Summary of Grain Sorghum Research, Robert D. Fenley, Research andDevelopment Branch, Statistical Reporting Service, UnitedStates Department of Agriculture, 1969 •

••
'l'
~15~
APPENDIX
Fonn I
July 1969 Texas SorghtunHead LABMeasurementsand Weights
Head No.Flight line (Field) (Unit ) (Head)
____ (1/10 grams)
iI
II
I!l
ft-(
I t .~
1. Diameter of culm (measured 1 inch below node where) (1/32 inch)
2. Length of head (measure fran node where firstbranches emerge to tip of head) •....••.•.•••••.• (1/10 inch)
3. Weight of dry head (after cutting head stalk1 inch below node where first branches emerge)•••
* If the wit ilmber is even (2, 4, 6, or 8), complete COWltsonBranches, spike1ets, and kernels and record on CO\Dltfonn.

" (,.,
iilI!Ii ,<'
Ii
i
IiI! -
i -1
Instruction for Measuring 1969 Kansas SorghumHeads
1. Each bag contains several sorghlDDheads. Removefrom bag and
separate them carefully so that no stems are broken.
2. Weighhead - record to 1/10 gram.
3. Measure length of head from lowest node to tip.
4. Measure width at mid-point of head.
5. Measure diameter of culm approximately one inch below lowest
node.
6. After measuring all heads frrim a bag replace them. Be sure
that identification slips are replaced also.
Record data to one decimal place.

A. Threshing
1. The only infonnation that needs to be recorded is the starting
and ending time.
2. Clip spike lets from head using scissors. Divide the spikelets
in three ,equal size piles - thresh each separately ..
3. After threshing each group - removechaff and check it for
Wlthreshed kernels.
4. Put kernels back into original bag - throw chaff away.
B. HandCount
1. Count numbe~of whole kernels using hand counter.
2. Count numberof cracked kernels and loose pieces.
3. Be sure to enter starting and ending times.
UNITED STATES DEPAR1MENT OF AGRICULTIJRERESEARCH AND DEVELOPMENT BRANCH. SI'ATISfICAL REPORTING SERVICE
Sorghum. Threshing and Counting InstructionsAugust, 1969

Head ;;....h _
Nwnber of Branches on Node
~ulY 1969 Texas'~Citghum... ',Lab Cowts
Number of Branches on Node ----
. Spikelet 1., 2.3.4.5•.6. --7. __8. --
Spikelet 1.- 2.3. --4.S.6. --7.--8.
••• Number of Spikelets on Branch:
1. 4~ 7.2. --- 5. -- 8. _-__3. - 6. 9~
•. Nwnber of kernels in Spikelets oftwo selected Branches:
Branch Branch~-- ----__ Y Spikelet ~: __
3.4.5.6.7.8. --
Head Starting Time ._----
Ntunber of Branches on Node ~
Number of Spikelets on Branch:
1. 4. 7~2•. _-- 5. - 8. --3. ==== 6~ __ 9. ==
.. Ntunher of kernels in Spike lets oftwo selected Branches:
Branch Branch--...,..,-- ----SpikcHet 1.
2.3.4.5. --6.7.8. --
• Number of Spikelets on Branch:
1. 4. 7.2.-5. -8.3. 6. 9. ---- -- --
••Ntunber of kernels in Spikelets oftwo selected Branches: "
Branch Branch---- ---Spikelet 1. Spitelet 1.2. 2.
3. - 3.4. 4.5. 5.6. __ 6. __7. __ 7.8. 8.---- --
Head ,_. Starting Time _
Ntunber.of Branches on Node ----• Nwnber of'Spikelets on Branch:
1.' .. ' 4.- " " 7 •2. -..,-- 5.' ~ 8. '.---,- --3._6. __ 9.__
••Nwnber of kernels in Spikelets oftwo selected Branches:
Branch Branch---- ---Spikelet 1. __ Spikelet l~ __
2. ' 2.- --3. __ 3. __4. 4•.-- ----s. S.--6. 6.-- --7. 7.-- ----8. 8.-- --
'11 Noch;l 1 is the node nearest the, base of the head.Y Spikelet I i:s the spike let nearest the main stalk of the head.