Grain Yield Stability and Adaptability of Some Rice...
17
Ambit Journals Ambit Journal of Agriculture.Vol 1(3) pp. 068-084 August, 2015. http://www.ambitjournals.org/ajar Copyright © 2015 Ambit Journals Full Length Research Paper Grain Yield Stability and Adaptability of Some Rice (Oryza Sativa L.) Germplasm Materials within the Guinea and Sudan Savannah Zones of Ghana 1 Yirzagla J., 2 J. Sarkodie-Addo, 2 R. Akromah and 4 Wilson Dogbe 1 Savannah Agricultural Research Institute Box 46 Manga. 2 Crops and Soil Science Department, Faculty of Agriculture, KNUST Kumasi. 3 Savannah Agricultural Research Institute Box 52 Tamale. Accepted 26th April, 2015. Multi-location rice evaluation trials were conducted during the 2013 cropping season at four locations which were key rice production areas within the Guinea and Sudan savannah agro-ecological zones of northern Ghana. Two growing ecologies: one irrigated and one rain-fed were involved in each agro-ecological zone. The purpose of the trials was to evaluate some thirty germplasm materials for grain yield stability and adaptability within the northern savannas. Entries were planted in a randomized complete block design replicated three times in each location. Adaptability studies using Additive Main effect and Multiplicative Interaction (AMMI) analysis for grain yield indicated that the genotype (G), environment (E) and their interaction (GEI) effects were significantly different (p<0.01), indicating broad range of diversity existed among the genotypes. Five genotypes, including Anyofula, Basmati 123, GH1837, Good and New and Perfume (ST) showed superior grain yield performance over the checked material, GR 18, and appeared to be specifically adapted to the higher yielding irrigated sites. On the other hand, genotypes that were identified as broadly adapted to all the four locations included Sebota 87, Matigey, Basmati 113, Sebota 68, IR 72 (pH) and Sebota 36. The adapted materials, especially those which outperformed the checked material, had the potential to increase rice productivity within the northern savannas and were therefore recommended for further breeding work and subsequent release to rice farmers. Keywords: Germplasm materials, grain yield stability, adaptability, lowland and genotype. Corresponding Author: [email protected]
-
Upload
trinhquynh -
Category
Documents
-
view
228 -
download
2
Transcript of Grain Yield Stability and Adaptability of Some Rice...
Ambit Journals
Ambit Journal of Agriculture.Vol 1(3) pp. 068-084 August, 2015.
http://www.ambitjournals.org/ajar
Copyright © 2015 Ambit Journals
Full Length Research Paper
Grain Yield Stability and Adaptability of Some Rice (Oryza
Sativa L.) Germplasm Materials within the Guinea and Sudan
Savannah Zones of Ghana
1 Yirzagla J.,
2J. Sarkodie-Addo,
2R. Akromah and
4 Wilson Dogbe
1 Savannah Agricultural Research Institute Box 46 Manga.
2 Crops and Soil Science Department, Faculty of Agriculture, KNUST Kumasi.
3 Savannah Agricultural Research Institute Box 52 Tamale.
Accepted 26th April, 2015.
Multi-location rice evaluation trials were conducted during the 2013 cropping season at four locations which
were key rice production areas within the Guinea and Sudan savannah agro-ecological zones of northern
Ghana. Two growing ecologies: one irrigated and one rain-fed were involved in each agro-ecological zone. The
purpose of the trials was to evaluate some thirty germplasm materials for grain yield stability and adaptability
within the northern savannas. Entries were planted in a randomized complete block design replicated three
times in each location. Adaptability studies using Additive Main effect and Multiplicative Interaction (AMMI)
analysis for grain yield indicated that the genotype (G), environment (E) and their interaction (GEI) effects were
significantly different (p<0.01), indicating broad range of diversity existed among the genotypes. Five genotypes,
including Anyofula, Basmati 123, GH1837, Good and New and Perfume (ST) showed superior grain yield
performance over the checked material, GR 18, and appeared to be specifically adapted to the higher yielding
irrigated sites. On the other hand, genotypes that were identified as broadly adapted to all the four locations
included Sebota 87, Matigey, Basmati 113, Sebota 68, IR 72 (pH) and Sebota 36. The adapted materials,
especially those which outperformed the checked material, had the potential to increase rice productivity within
the northern savannas and were therefore recommended for further breeding work and subsequent release to
rice farmers.
Keywords: Germplasm materials, grain yield stability, adaptability, lowland and genotype.
Corresponding Author: [email protected]
Y i r z a g l a J A m b i t . J . A g r i c . | 69
INTRODUCTION
Rice (Oryza sativa L.) is an important grain crop
worldwide and is a primary food source for many
people. More than half of the world’s population
depends on rice for its major daily source of food
energy and protein and thus the importance of
rice in relation to food security and socio-
economic stability is self-evident (FAO, 2003). It
is the second most important staple food in
Ghana and its consumption keeps increasing as
a result of population growth, urbanization and
changes in consumer eating habits. Its
consumption, however, is significantly greater
than domestic production, necessitating
increased imports that drain huge amounts of
scarce foreign exchange (Bam et al., 1998).
Average annual rice consumption per capita in
Ghana increased from 7.3 kg in 1980s to 22 kg in
2003 when a total of 500,000 tons of rice was
imported (ISSER, 2002).
To achieve food security and foreign exchange
savings, increased production of highly
competitive domestic rice should be the utmost
priority of Ghana’s agriculture. Even though
northern Ghana is a potential breadbasket of the
country because of its high production potential
for staple food crops- such as rice, maize,
sorghum pearl millet and yam- and the largest
rural farming population, the region generally
experiences hot, distinct, dry and wet conditions.
It is also a region with a wide range of agro-
ecological and climatic factors with rainfall being
extremely variable and erratic. Northern Ghana
is, thus, characterized by diverse climatic
conditions and soil types which escalate the
problem of genotype x environment interaction
(GEI). To overcome this problem, the universal
practice of scientists in most crops when
selecting genotypes, is to plant them in yield
(performance) trials over several environments to
ensure that the selected genotypes have a high
and stable performance over a wide range of
environments. A genotype, which shows a
relatively constant yield, independent of
environmental condition is characterized as being
stable. Therefore the growing of a crop in a
particular agro-ecological niche and screening for
a stable and adaptable trait will establish a long
period of very little change and hence could be
selected for farmers
Multi-location trials were therefore conducted in
the major rice producing areas of Guinea and
Sudan savannah agro-ecological zones of
northern Ghana to evaluate some thirty
germplasm materials for grain yield stability and
adaptability. The specific objectives of the study
were to;
1. Evaluate the presence of genotype by
environment interactions (GEIs) in the
germplasm materials so as to determine
their grain yield potential and other
agronomic performance within the northern
savannas.
2. Determine the most stable and adaptable
materials for recommendation to rice
farmers within the northern savannas
MATERIALS AND METHODS
Experimental sites, treatments and design
Multi-location field trials were conducted at four
major rice growing locations of the Guinea and
Sudan savannah agro-ecological zones during
2013 major season involving two rainfed and two
irrigated lowland ecologies. The sites were
Largbani (rainfed) and Libga (irrigated) in the
Guinea savannah as well as Nyangua (rainfed)
and Tono (irrigated) in the Sudan savannah
zones. The names and sources of the materials
are indicated in Table 1.
Table 1: Names and sources of germplasm materials used for the 2013 experiments in the Guinea and Sudan Savannah zones of Ghana
________________________________________
______________________________________
Name S ource Name S ource
Sebota 33 Cameroun IR 72 IRRI, Philippines Sebota 70 Cameroun Sebota 69 Cameroun Sebota 337 - 1 Cameroun Sebota 68 Cameroun Perfume (ST) Thailand Sebota 147 Cameroun Sebota 330 Cameroun GH1837 . CSIR - PGRI, GH Sebota 41 Cameroun Matigey . CSIR - PGRI, GH S ebota 36 Cameroun Kawawa Red. CSIR - PGRI, GH Sebota 1 Cameroun Basmati 122 IRRI, Philippines Sebota 48 Cameroun GR 18 CSIR - SARI, GH Local Red Farmer coll . Local Basmati 2 IRRI, Philippines Anyofula CSIR - PGRI, Koshihikar i Japan Sebota 87 Cameroun Basmati 113 IRRI, Philippines Basmati 123 CSIR - PGRI, Sebota 63 Cameroun Good and New Japan Viwornor CSIR - PGRI, GH Basmati 370 - 1 IRRI, Philipp Sebota 281 - 2 Cameroun
Y i r z a g l a J A m b i t . J . A g r i c . | 70
Thirty rice germplasm materials, including a locally released standard check (GR18) were laid out in a Randomized Complete Block (RCB) design with three replications per trial at each location. Plots were 5m long and 3m wide
Crop establishment and management practices.
The rain-fed experimental fields were ploughed, harrowed and levelled, while irrigated fields were rotovated and levelled. The seeds for rainfed fields were planted at stake in rows at the recommended population density (20cm x 20cm, three seeds per stand). Seeds were placed in approximately 3–5 cm deep holes made with a dibble stick. Seeds for irrigated fields were nursed and the resulting seedlings transplanted (3 weeks old) into well bunded plots of 5mx3m sizes. Population density similar to that of the rainfed sites was maintained in the irrigated fields. The recommended fertilizer application rate of 60-60-30 NPK kg/ha was adopted for the trials with the N component applied in split dose. All other cultural practices were carried out as and when it was necessary.
Data collection
For each of the locations, soil chemical analyses of the trial sites within the 0-20cm depth was carried out prior to planting. Soil samples were collected, air-dried in the laboratory, ground and sieved through a 2mm sieve. Soil pH was measured using the pH meter in 1:1 soil to water ratio. Macro-nutrients, including nitrogen, phosphorus and potassium were analysed. Percentage total nitrogen was determined by the micro Kjeldahl-technique (Jackson, 1962). The available phosphorus was extracted by the Bray method and determined colorimetrically (Bray and Kurtz 1945). Potassium was determined by flame emission photometry. A guide to the interpretation of soil analytical data by Prof. E. Y. Safo, of Kwame Nkrumah University of Science and Technology (KNUST), Kumasi were used to interpret the data (personal communication) (Appendix 1). Data were taken on the number of tillers per hill 3 and 6 weeks after planting (or sowing), days to 50% flowering, plant height at
maturity, days to maturity, number of panicles per hill, panicle weight, grain length, 1000 grain weight, straw yield and grain yield which were the major character measured for the analysis.
Data collection and analysis
Data collected were subjected to analysis of variance (ANOVA) to establish treatment and the interaction effect on grain yield and growth characteristics of the materials. All statistical analyses were conducted using the GenStat Statistical program (GenStat 12th Edition). The analysis of variance procedure for multifactor experiments was followed to determine whether differences existed among treatments. All treatment means were compared using the Least Significant Difference (LSD) at 5% level of significance. The effects of the genotypes, environments (locations) and their interactions were determined from the ANOVA analysis. Main effects and all interactions were considered significant when P≤0.05. To assess the effects of
genotype, location and genotype x location interaction for each ecology, the data were pooled and analyzed as 30 genotypes × 2 locations so as to estimate the extent of genotype × location interaction effect on the genotypes.
RESULTS AND DISCUSSION Responses of grain yield and other agronomic traits to environments (locations)
Grain yield
There were wide differences in the frequency and intensity of rainfall as well as the various soil attributes observed across the four locations within the period under study (Tables 2 and 3) which were characteristic of the Guinea and Sudan savannah zones (Padi, 2007). Thus, the environmental variability across the locations could be responsible for the varied grain yield of the genotypes evaluated during the study period. For grain yield at each location, the contributions of the genotypes to the total source of variation were highly significant (P < 0.01) indicating optimal grain yield potential of the genotypes irrespective of the prevailing environmental variability.
Y i r z a g l a J A m b i t . J . A g r i c . | 71
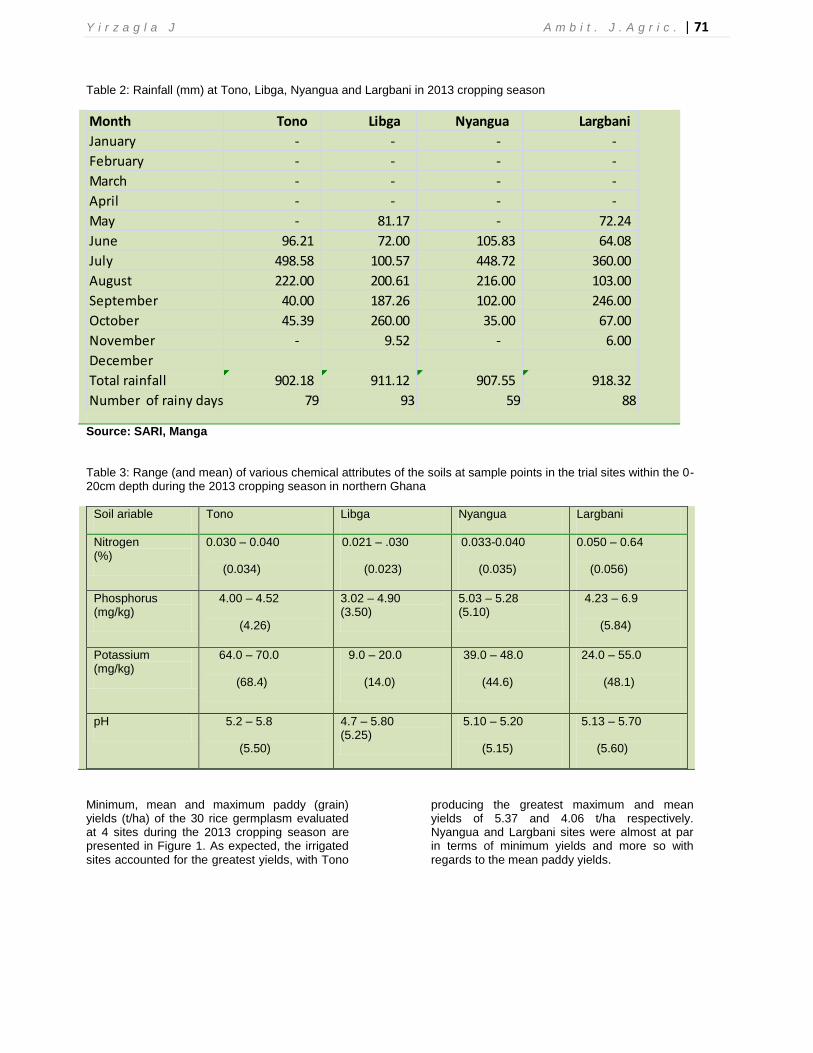
Table 2: Rainfall (mm) at Tono, Libga, Nyangua and Largbani in 2013 cropping season
Month Tono Libga Nyangua Largbani
January - - - -
February - - - -
March - - - -
April - - - -
May - 81.17 - 72.24
June 96.21 72.00 105.83 64.08
July 498.58 100.57 448.72 360.00
August 222.00 200.61 216.00 103.00
September 40.00 187.26 102.00 246.00
October 45.39 260.00 35.00 67.00
November - 9.52 - 6.00
December
Total rainfall 902.18 911.12 907.55 918.32
Number of rainy days 79 93 59 88
Source: SARI, Manga
Table 3: Range (and mean) of various chemical attributes of the soils at sample points in the trial sites within the 0-20cm depth during the 2013 cropping season in northern Ghana
Soil ariable Tono Libga Nyangua Largbani
Nitrogen (%)
0.030 – 0.040
(0.034)
0.021 – .030
(0.023)
0.033-0.040
(0.035)
0.050 – 0.64
(0.056)
Phosphorus (mg/kg)
4.00 – 4.52
(4.26)
3.02 – 4.90 (3.50)
5.03 – 5.28 (5.10)
4.23 – 6.9
(5.84)
Potassium (mg/kg)
64.0 – 70.0
(68.4)
9.0 – 20.0
(14.0)
39.0 – 48.0
(44.6)
24.0 – 55.0
(48.1)
pH 5.2 – 5.8
(5.50)
4.7 – 5.80 (5.25)
5.10 – 5.20
(5.15)
5.13 – 5.70
(5.60)
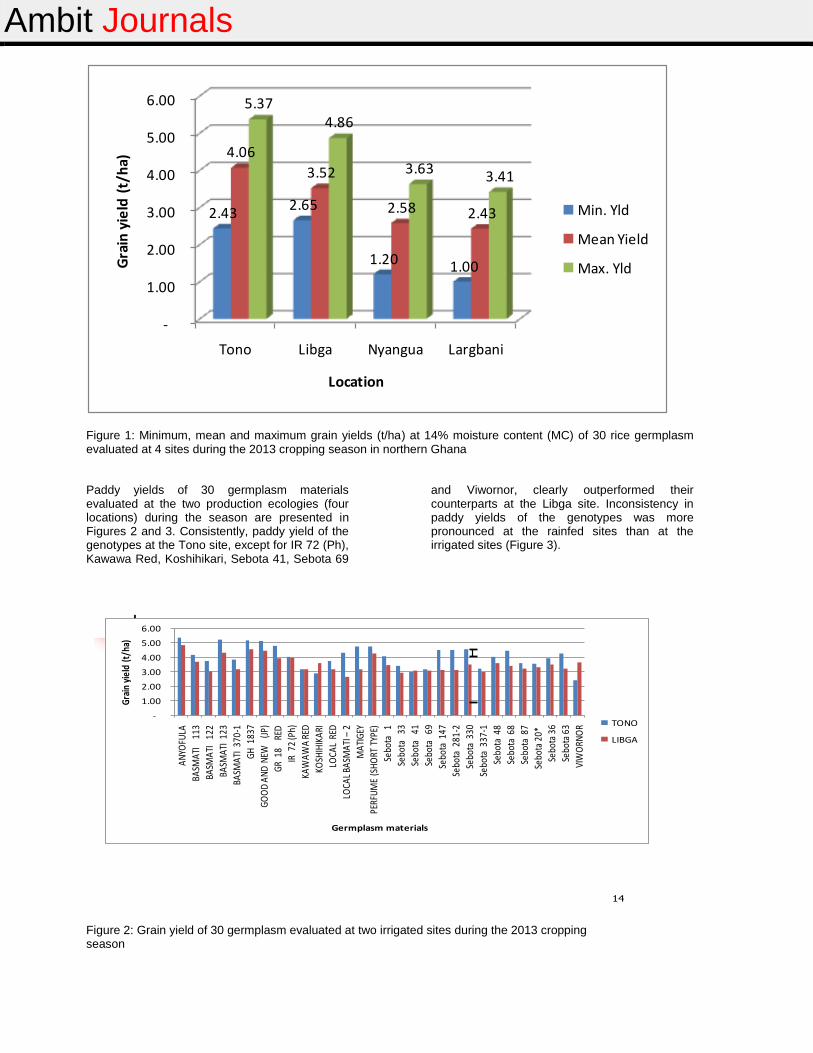
Minimum, mean and maximum paddy (grain) yields (t/ha) of the 30 rice germplasm evaluated at 4 sites during the 2013 cropping season are presented in Figure 1. As expected, the irrigated sites accounted for the greatest yields, with Tono
producing the greatest maximum and mean yields of 5.37 and 4.06 t/ha respectively. Nyangua and Largbani sites were almost at par in terms of minimum yields and more so with regards to the mean paddy yields.
Ambit Journals
-
1.00
2.00
3.00
4.00
5.00
6.00
Tono Libga Nyangua Largbani
2.43 2.65
1.20 1.00
4.06
3.52
2.58 2.43
5.37 4.86
3.63 3.41
Gra
in y
ield
(t/
ha)
Location
Min. Yld
Mean Yield
Max. Yld
Figure 1: Minimum, mean and maximum grain yields (t/ha) at 14% moisture content (MC) of 30 rice germplasm evaluated at 4 sites during the 2013 cropping season in northern Ghana
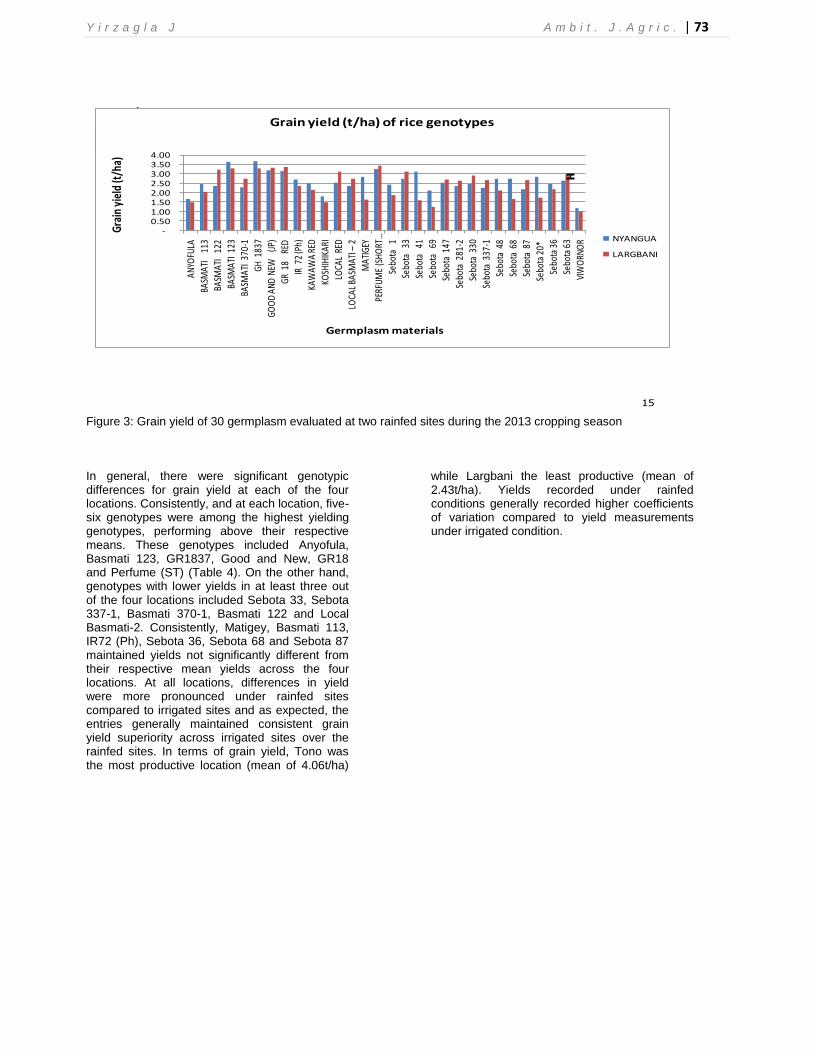
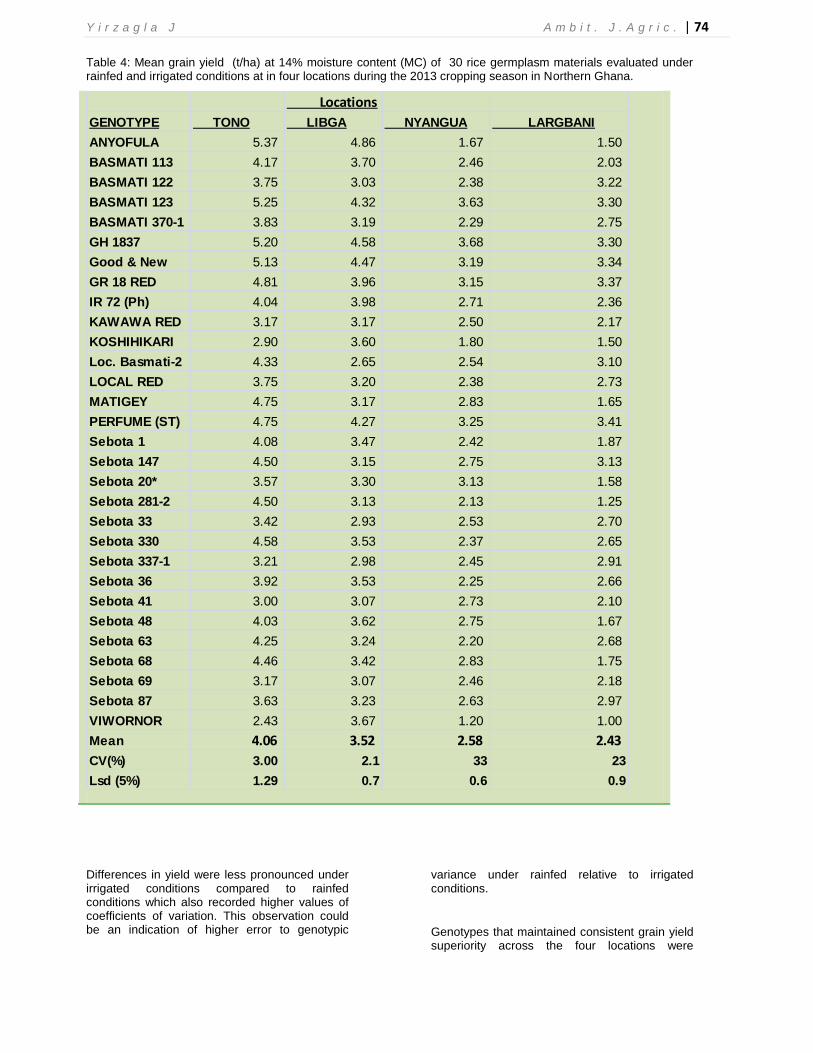
Paddy yields of 30 germplasm materials evaluated at the two production ecologies (four locations) during the season are presented in Figures 2 and 3. Consistently, paddy yield of the genotypes at the Tono site, except for IR 72 (Ph), Kawawa Red, Koshihikari, Sebota 41, Sebota 69
and Viwornor, clearly outperformed their counterparts at the Libga site. Inconsistency in paddy yields of the genotypes was more pronounced at the rainfed sites than at the irrigated sites (Figure 3).
14
-
1.00
2.00
3.00
4.00
5.00
6.00
AN
YOFU
LA
BASM
ATI
1
13
BASM
ATI
12
2
BASM
ATI
123
BASM
ATI
370
-1
GH
183
7
GO
OD
AN
D N
EW
(JP)
GR
18
RE
D
IR 7
2 (P
h)
KAW
AW
A R
ED
KOSH
IHIK
ARI
LOCA
L R
ED
LOCA
L BA
SMA
TI –
2
MA
TIG
EY
PERF
UM
E (S
HO
RT T
YPE)
Sebo
ta
1
Sebo
ta
33
Sebo
ta
41
Sebo
ta
69
Sebo
ta 1
47
Sebo
ta 2
81-2
Sebo
ta 3
30
Sebo
ta 3
37-1
Sebo
ta 4
8
Sebo
ta 6
8
Sebo
ta 8
7
Sebo
ta 2
0*
Sebo
ta 3
6
Sebo
ta 6
3
VIW
ORN
OR
Gra
in y
ield
(t/
ha)
Germplasm materials
TONO
LIBGA
Figure 2: Grain yield of 30 germplasm evaluated at two irrigated sites during the 2013 cropping season
Y i r z a g l a J A m b i t . J . A g r i c . | 73
15
-0.50 1.00 1.50 2.00 2.50 3.00 3.50 4.00
ANYO
FULA
BASM
ATI
113
BASM
ATI
122
BASM
ATI
123
BASM
ATI
370-
1
GH 1
837
GOO
D AN
D NE
W
(JP)
GR 1
8
RED
IR 7
2 (P
h)
KAW
AWA
RED
KOSH
IHIK
ARI
LOCA
L RE
D
LOCA
L BAS
MAT
I –2
MAT
IGEY
PERF
UME
(SHO
RT …
Sebo
ta
1
Sebo
ta
33
Sebo
ta
41
Sebo
ta
69
Sebo
ta 1
47
Sebo
ta 2
81-2
Sebo
ta 3
30
Sebo
ta 3
37-1
Sebo
ta 4
8
Sebo
ta 6
8
Sebo
ta 8
7
Sebo
ta 2
0*
Sebo
ta 3
6
Sebo
ta 6
3
VIW
ORN
OR
Grai
n yi
eld
(t/h
a)
Germplasm materials
Grain yield (t/ha) of rice genotypes
NYANGUA
LARGBANI
Figure 3: Grain yield of 30 germplasm evaluated at two rainfed sites during the 2013 cropping season
In general, there were significant genotypic differences for grain yield at each of the four locations. Consistently, and at each location, five-six genotypes were among the highest yielding genotypes, performing above their respective means. These genotypes included Anyofula, Basmati 123, GR1837, Good and New, GR18 and Perfume (ST) (Table 4). On the other hand, genotypes with lower yields in at least three out of the four locations included Sebota 33, Sebota 337-1, Basmati 370-1, Basmati 122 and Local Basmati-2. Consistently, Matigey, Basmati 113, IR72 (Ph), Sebota 36, Sebota 68 and Sebota 87 maintained yields not significantly different from their respective mean yields across the four locations. At all locations, differences in yield were more pronounced under rainfed sites compared to irrigated sites and as expected, the entries generally maintained consistent grain yield superiority across irrigated sites over the rainfed sites. In terms of grain yield, Tono was the most productive location (mean of 4.06t/ha)
while Largbani the least productive (mean of 2.43t/ha). Yields recorded under rainfed conditions generally recorded higher coefficients of variation compared to yield measurements under irrigated condition.
Y i r z a g l a J A m b i t . J . A g r i c . | 74
Table 4: Mean grain yield (t/ha) at 14% moisture content (MC) of 30 rice germplasm materials evaluated under rainfed and irrigated conditions at in four locations during the 2013 cropping season in Northern Ghana.
Locations
GENOTYPE TONO LIBGA NYANGUA LARGBANI
ANYOFULA 5.37 4.86 1.67 1.50
BASMATI 113 4.17 3.70 2.46 2.03
BASMATI 122 3.75 3.03 2.38 3.22
BASMATI 123 5.25 4.32 3.63 3.30
BASMATI 370-1 3.83 3.19 2.29 2.75
GH 1837 5.20 4.58 3.68 3.30
Good & New 5.13 4.47 3.19 3.34
GR 18 RED 4.81 3.96 3.15 3.37
IR 72 (Ph) 4.04 3.98 2.71 2.36
KAWAWA RED 3.17 3.17 2.50 2.17
KOSHIHIKARI 2.90 3.60 1.80 1.50
Loc. Basmati-2 4.33 2.65 2.54 3.10
LOCAL RED 3.75 3.20 2.38 2.73
MATIGEY 4.75 3.17 2.83 1.65
PERFUME (ST) 4.75 4.27 3.25 3.41
Sebota 1 4.08 3.47 2.42 1.87
Sebota 147 4.50 3.15 2.75 3.13
Sebota 20* 3.57 3.30 3.13 1.58
Sebota 281-2 4.50 3.13 2.13 1.25
Sebota 33 3.42 2.93 2.53 2.70
Sebota 330 4.58 3.53 2.37 2.65
Sebota 337-1 3.21 2.98 2.45 2.91
Sebota 36 3.92 3.53 2.25 2.66
Sebota 41 3.00 3.07 2.73 2.10
Sebota 48 4.03 3.62 2.75 1.67
Sebota 63 4.25 3.24 2.20 2.68
Sebota 68 4.46 3.42 2.83 1.75
Sebota 69 3.17 3.07 2.46 2.18
Sebota 87 3.63 3.23 2.63 2.97
VIWORNOR 2.43 3.67 1.20 1.00
Mean 4.06 3.52 2.58 2.43
CV(%) 3.00 2.1 33 23
Lsd (5%) 1.29 0.7 0.6 0.9
Differences in yield were less pronounced under irrigated conditions compared to rainfed conditions which also recorded higher values of coefficients of variation. This observation could be an indication of higher error to genotypic
variance under rainfed relative to irrigated conditions.
Genotypes that maintained consistent grain yield superiority across the four locations were
Y i r z a g l a J A m b i t . J . A g r i c . | 75
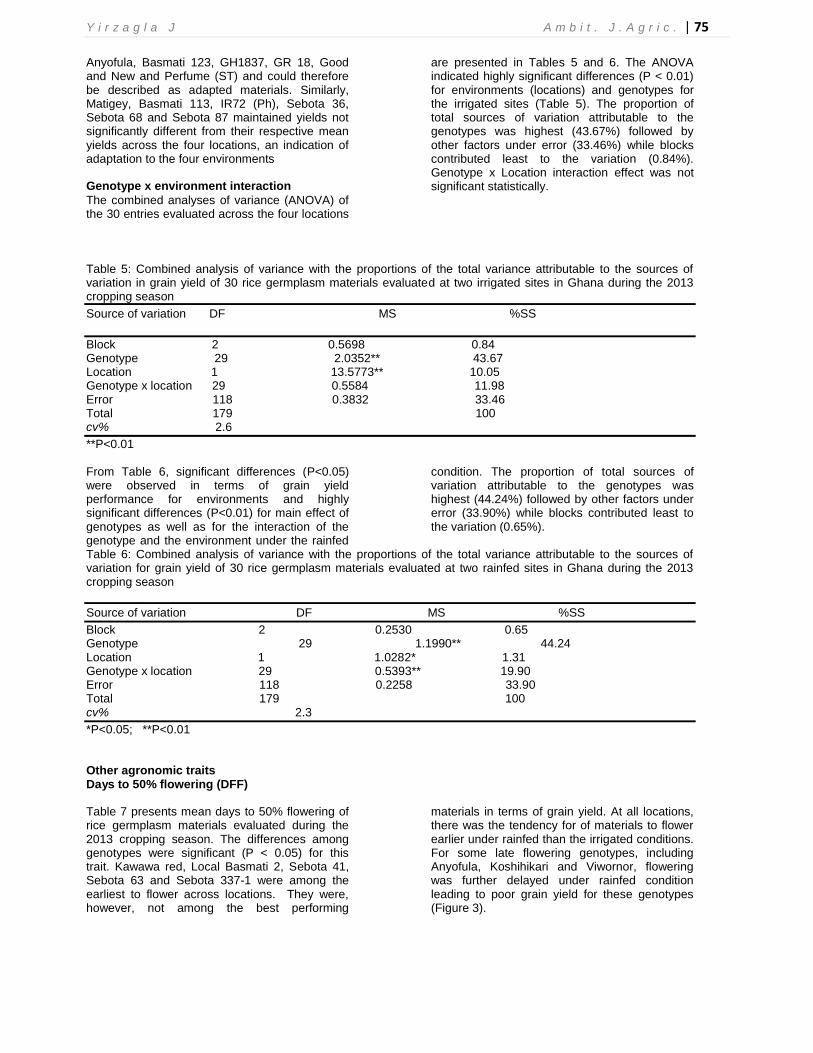
Anyofula, Basmati 123, GH1837, GR 18, Good and New and Perfume (ST) and could therefore be described as adapted materials. Similarly, Matigey, Basmati 113, IR72 (Ph), Sebota 36, Sebota 68 and Sebota 87 maintained yields not significantly different from their respective mean yields across the four locations, an indication of adaptation to the four environments Genotype x environment interaction
The combined analyses of variance (ANOVA) of the 30 entries evaluated across the four locations
are presented in Tables 5 and 6. The ANOVA indicated highly significant differences (P < 0.01) for environments (locations) and genotypes for the irrigated sites (Table 5). The proportion of total sources of variation attributable to the genotypes was highest (43.67%) followed by other factors under error (33.46%) while blocks contributed least to the variation (0.84%). Genotype x Location interaction effect was not significant statistically.
Table 5: Combined analysis of variance with the proportions of the total variance attributable to the sources of variation in grain yield of 30 rice germplasm materials evaluated at two irrigated sites in Ghana during the 2013 cropping season
Source of variation DF MS %SS
Block 2 0.5698 0.84 Genotype 29 2.0352** 43.67 Location 1 13.5773** 10.05 Genotype x location 29 0.5584 11.98 Error 118 0.3832 33.46 Total 179 100 cv% 2.6
**P<0.01 From Table 6, significant differences (P<0.05) were observed in terms of grain yield performance for environments and highly significant differences (P<0.01) for main effect of genotypes as well as for the interaction of the genotype and the environment under the rainfed
condition. The proportion of total sources of variation attributable to the genotypes was highest (44.24%) followed by other factors under error (33.90%) while blocks contributed least to the variation (0.65%).
Table 6: Combined analysis of variance with the proportions of the total variance attributable to the sources of variation for grain yield of 30 rice germplasm materials evaluated at two rainfed sites in Ghana during the 2013 cropping season
Source of variation DF MS %SS
Block 2 0.2530 0.65 Genotype 29 1.1990** 44.24 Location 1 1.0282* 1.31 Genotype x location 29 0.5393** 19.90 Error 118 0.2258 33.90 Total 179 100 cv% 2.3
*P<0.05; **P<0.01 Other agronomic traits Days to 50% flowering (DFF)
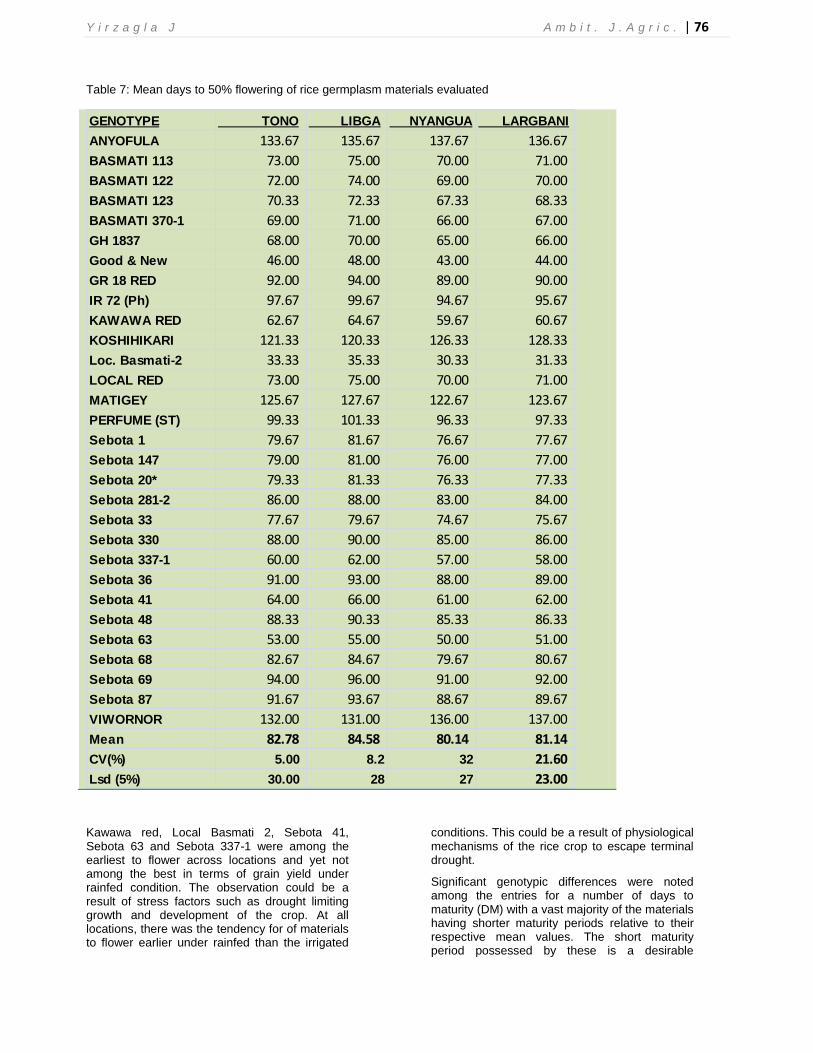
Table 7 presents mean days to 50% flowering of rice germplasm materials evaluated during the 2013 cropping season. The differences among genotypes were significant (P < 0.05) for this trait. Kawawa red, Local Basmati 2, Sebota 41, Sebota 63 and Sebota 337-1 were among the earliest to flower across locations. They were, however, not among the best performing
materials in terms of grain yield. At all locations, there was the tendency for of materials to flower earlier under rainfed than the irrigated conditions. For some late flowering genotypes, including Anyofula, Koshihikari and Viwornor, flowering was further delayed under rainfed condition leading to poor grain yield for these genotypes (Figure 3).
Y i r z a g l a J A m b i t . J . A g r i c . | 76
Table 7: Mean days to 50% flowering of rice germplasm materials evaluated
GENOTYPE TONO LIBGA NYANGUA LARGBANI
ANYOFULA 133.67 135.67 137.67 136.67
BASMATI 113 73.00 75.00 70.00 71.00
BASMATI 122 72.00 74.00 69.00 70.00
BASMATI 123 70.33 72.33 67.33 68.33
BASMATI 370-1 69.00 71.00 66.00 67.00
GH 1837 68.00 70.00 65.00 66.00
Good & New 46.00 48.00 43.00 44.00
GR 18 RED 92.00 94.00 89.00 90.00
IR 72 (Ph) 97.67 99.67 94.67 95.67
KAWAWA RED 62.67 64.67 59.67 60.67
KOSHIHIKARI 121.33 120.33 126.33 128.33
Loc. Basmati-2 33.33 35.33 30.33 31.33
LOCAL RED 73.00 75.00 70.00 71.00
MATIGEY 125.67 127.67 122.67 123.67
PERFUME (ST) 99.33 101.33 96.33 97.33
Sebota 1 79.67 81.67 76.67 77.67
Sebota 147 79.00 81.00 76.00 77.00
Sebota 20* 79.33 81.33 76.33 77.33
Sebota 281-2 86.00 88.00 83.00 84.00
Sebota 33 77.67 79.67 74.67 75.67
Sebota 330 88.00 90.00 85.00 86.00
Sebota 337-1 60.00 62.00 57.00 58.00
Sebota 36 91.00 93.00 88.00 89.00
Sebota 41 64.00 66.00 61.00 62.00
Sebota 48 88.33 90.33 85.33 86.33
Sebota 63 53.00 55.00 50.00 51.00
Sebota 68 82.67 84.67 79.67 80.67
Sebota 69 94.00 96.00 91.00 92.00
Sebota 87 91.67 93.67 88.67 89.67
VIWORNOR 132.00 131.00 136.00 137.00
Mean 82.78 84.58 80.14 81.14
CV(%) 5.00 8.2 32 21.60
Lsd (5%) 30.00 28 27 23.00
Kawawa red, Local Basmati 2, Sebota 41, Sebota 63 and Sebota 337-1 were among the earliest to flower across locations and yet not among the best in terms of grain yield under rainfed condition. The observation could be a result of stress factors such as drought limiting growth and development of the crop. At all locations, there was the tendency for of materials to flower earlier under rainfed than the irrigated
conditions. This could be a result of physiological mechanisms of the rice crop to escape terminal drought.
Significant genotypic differences were noted among the entries for a number of days to maturity (DM) with a vast majority of the materials having shorter maturity periods relative to their respective mean values. The short maturity period possessed by these is a desirable
Y i r z a g l a J A m b i t . J . A g r i c . | 77
agronomic attribute as it enables these genotypes to fit into the short cropping season and erratic rainfall patterns typical of the Guinea and Sudan Savanna zones of Ghana (Padi, 2007).
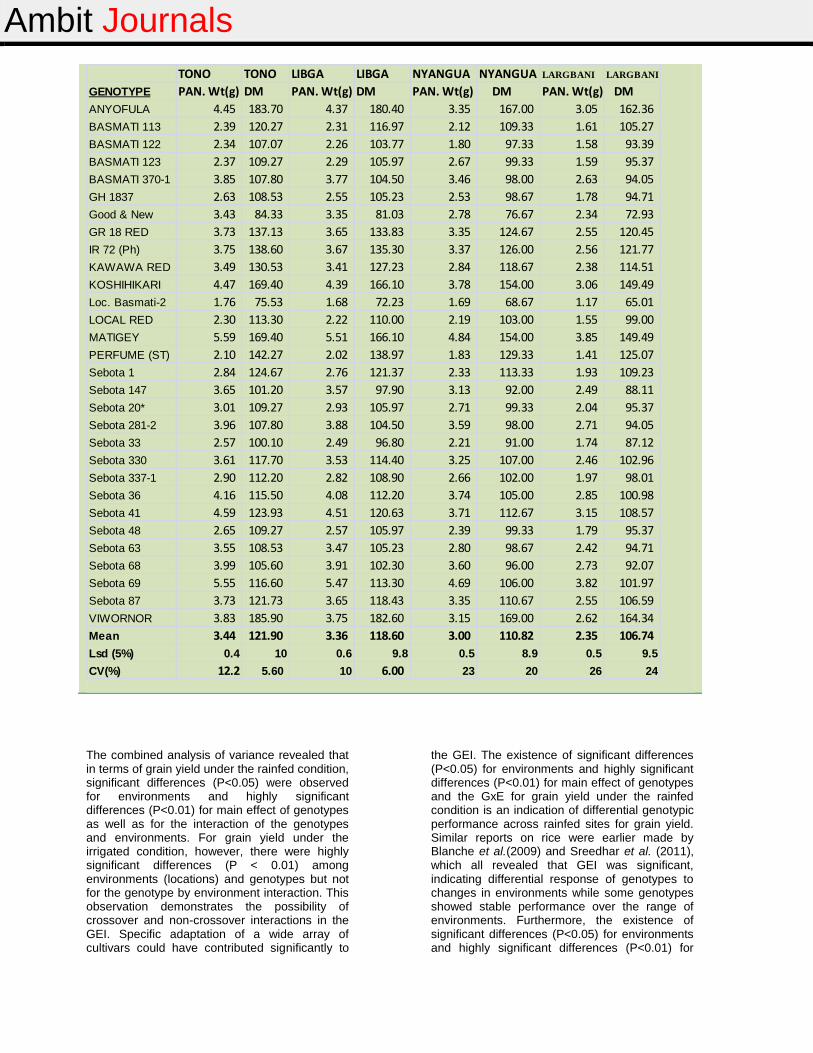
Panicle weight (PAN Wt) and number of days to maturity (DM)
The results of panicle weight (PAN. Wt) per hill after harvest and the number of days to maturity (DM) of the entries at the four locations are presented in Table 8. There were significant genotypic variations across the four locations for these traits. The data showed that panicle weight was generally reduced considerably under rainfed conditions compared to those under irrigated conditions. Here again, Anyofula, Basmati 123, GR 18, Good and New, GH1837 and Perfume (ST) were among entries with the greatest panicle weights. The least grain yielding
genotypes such as Sebota 33, Sebota 337-1, Basmati 370-1, Local Basmati-2 and Basmati 122 produced relatively less weights especially under rainfed conditions.
Generally, the irrigated sites recorded greater DM compared to the rainfed sites with Tono recording the greatest mean DM of 121.09 whilst Largbani accounted for the least mean DM of 106.74. A vast majority of the entries, except Good and New and Local Basmati-2, had DM values not significantly lower than the mean DM across locations.
Table 8: Panicle weight (PAN Wt) and number of days to maturity (DM) of rice germplasm materials at four locations under irrigated or rainfed condition in Northern Ghana during the 2013 cropping season
Ambit Journals
TONO TONO LIBGA LIBGA NYANGUA NYANGUA LARGBANI LARGBANI
GENOTYPE PAN. Wt(g) DM PAN. Wt(g) DM PAN. Wt(g) DM PAN. Wt(g) DM
ANYOFULA 4.45 183.70 4.37 180.40 3.35 167.00 3.05 162.36
BASMATI 113 2.39 120.27 2.31 116.97 2.12 109.33 1.61 105.27
BASMATI 122 2.34 107.07 2.26 103.77 1.80 97.33 1.58 93.39
BASMATI 123 2.37 109.27 2.29 105.97 2.67 99.33 1.59 95.37
BASMATI 370-1 3.85 107.80 3.77 104.50 3.46 98.00 2.63 94.05
GH 1837 2.63 108.53 2.55 105.23 2.53 98.67 1.78 94.71
Good & New 3.43 84.33 3.35 81.03 2.78 76.67 2.34 72.93
GR 18 RED 3.73 137.13 3.65 133.83 3.35 124.67 2.55 120.45
IR 72 (Ph) 3.75 138.60 3.67 135.30 3.37 126.00 2.56 121.77
KAWAWA RED 3.49 130.53 3.41 127.23 2.84 118.67 2.38 114.51
KOSHIHIKARI 4.47 169.40 4.39 166.10 3.78 154.00 3.06 149.49
Loc. Basmati-2 1.76 75.53 1.68 72.23 1.69 68.67 1.17 65.01
LOCAL RED 2.30 113.30 2.22 110.00 2.19 103.00 1.55 99.00
MATIGEY 5.59 169.40 5.51 166.10 4.84 154.00 3.85 149.49
PERFUME (ST) 2.10 142.27 2.02 138.97 1.83 129.33 1.41 125.07
Sebota 1 2.84 124.67 2.76 121.37 2.33 113.33 1.93 109.23
Sebota 147 3.65 101.20 3.57 97.90 3.13 92.00 2.49 88.11
Sebota 20* 3.01 109.27 2.93 105.97 2.71 99.33 2.04 95.37
Sebota 281-2 3.96 107.80 3.88 104.50 3.59 98.00 2.71 94.05
Sebota 33 2.57 100.10 2.49 96.80 2.21 91.00 1.74 87.12
Sebota 330 3.61 117.70 3.53 114.40 3.25 107.00 2.46 102.96
Sebota 337-1 2.90 112.20 2.82 108.90 2.66 102.00 1.97 98.01
Sebota 36 4.16 115.50 4.08 112.20 3.74 105.00 2.85 100.98
Sebota 41 4.59 123.93 4.51 120.63 3.71 112.67 3.15 108.57
Sebota 48 2.65 109.27 2.57 105.97 2.39 99.33 1.79 95.37
Sebota 63 3.55 108.53 3.47 105.23 2.80 98.67 2.42 94.71
Sebota 68 3.99 105.60 3.91 102.30 3.60 96.00 2.73 92.07
Sebota 69 5.55 116.60 5.47 113.30 4.69 106.00 3.82 101.97
Sebota 87 3.73 121.73 3.65 118.43 3.35 110.67 2.55 106.59
VIWORNOR 3.83 185.90 3.75 182.60 3.15 169.00 2.62 164.34
Mean 3.44 121.90 3.36 118.60 3.00 110.82 2.35 106.74
Lsd (5%) 0.4 10 0.6 9.8 0.5 8.9 0.5 9.5
CV(%) 12.2 5.60 10 6.00 23 20 26 24
The combined analysis of variance revealed that in terms of grain yield under the rainfed condition, significant differences (P<0.05) were observed for environments and highly significant differences (P<0.01) for main effect of genotypes as well as for the interaction of the genotypes and environments. For grain yield under the irrigated condition, however, there were highly significant differences (P < 0.01) among environments (locations) and genotypes but not for the genotype by environment interaction. This observation demonstrates the possibility of crossover and non-crossover interactions in the GEI. Specific adaptation of a wide array of cultivars could have contributed significantly to
the GEI. The existence of significant differences (P<0.05) for environments and highly significant differences (P<0.01) for main effect of genotypes and the GxE for grain yield under the rainfed condition is an indication of differential genotypic performance across rainfed sites for grain yield. Similar reports on rice were earlier made by Blanche et al.(2009) and Sreedhar et al. (2011), which all revealed that GEI was significant, indicating differential response of genotypes to changes in environments while some genotypes showed stable performance over the range of environments. Furthermore, the existence of significant differences (P<0.05) for environments and highly significant differences (P<0.01) for
Y i r z a g l a J A m b i t . J . A g r i c . | 79
main effect of genotypes and the GEI is consistent with findings by Blanche et al. (2009)
who reported greater effects for G and GxE than for E. Here again, this could be due to the wide range of cultivars included in the present study, which included different levels of homozygosity, grain types and origins of development.
From the combined analysis of variance for grain yield, the proportion of total sources of variation attributable to the genotypes was highest in both rainfed and irrigated sites, followed by other factors under error while blocks contributed least to the variation. This observation is at variance with the findings of Mohammadi et al.(2009) and Badu-Apraku et al.(1995, 2003), who reported that the largest proportion of total variation in multi-environment trials is usually attributed to locations (environments), with G and G x L sources being relatively smaller. Genetic correlation between grain yield and other agronomic traits
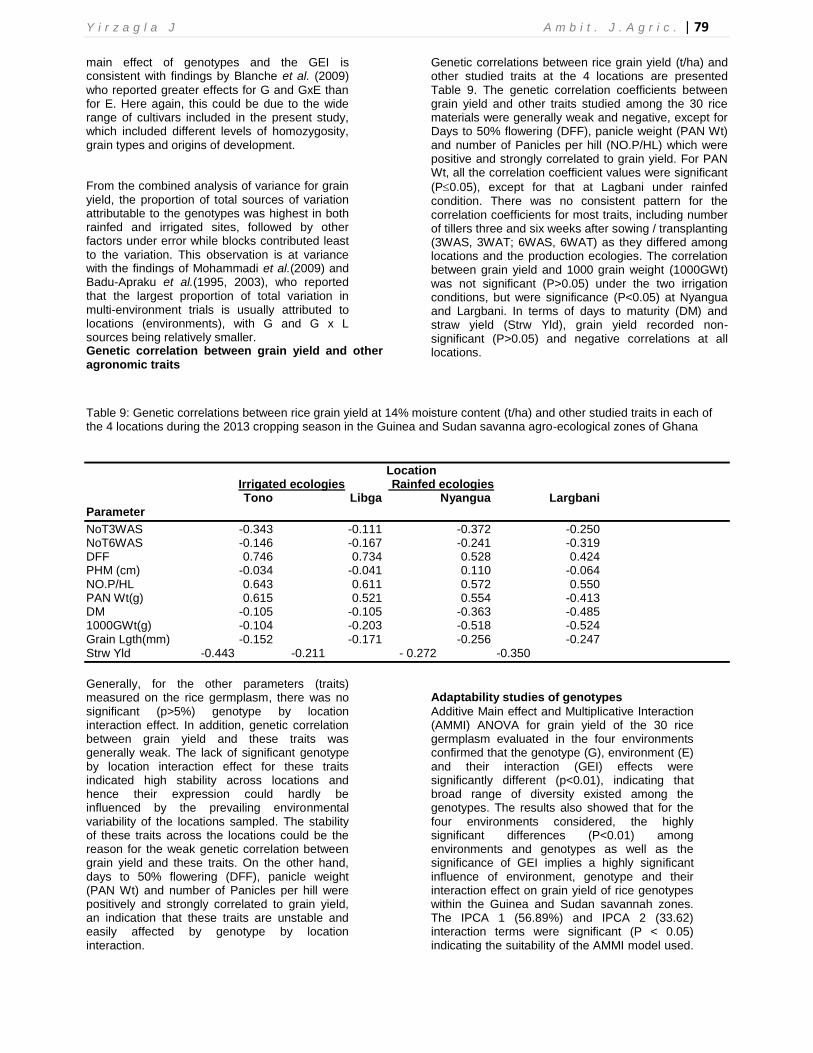
Genetic correlations between rice grain yield (t/ha) and other studied traits at the 4 locations are presented Table 9. The genetic correlation coefficients between grain yield and other traits studied among the 30 rice materials were generally weak and negative, except for Days to 50% flowering (DFF), panicle weight (PAN Wt) and number of Panicles per hill (NO.P/HL) which were positive and strongly correlated to grain yield. For PAN Wt, all the correlation coefficient values were significant
(P0.05), except for that at Lagbani under rainfed condition. There was no consistent pattern for the correlation coefficients for most traits, including number of tillers three and six weeks after sowing / transplanting (3WAS, 3WAT; 6WAS, 6WAT) as they differed among locations and the production ecologies. The correlation between grain yield and 1000 grain weight (1000GWt) was not significant (P>0.05) under the two irrigation conditions, but were significance (P<0.05) at Nyangua and Largbani. In terms of days to maturity (DM) and straw yield (Strw Yld), grain yield recorded non-significant (P>0.05) and negative correlations at all locations.
Table 9: Genetic correlations between rice grain yield at 14% moisture content (t/ha) and other studied traits in each of the 4 locations during the 2013 cropping season in the Guinea and Sudan savanna agro-ecological zones of Ghana
Location Irrigated ecologies Rainfed ecologies Tono Libga Nyangua Largbani
Parameter
NoT3WAS -0.343 -0.111 -0.372 -0.250 NoT6WAS -0.146 -0.167 -0.241 -0.319 DFF 0.746 0.734 0.528 0.424 PHM (cm) -0.034 -0.041 0.110 -0.064 NO.P/HL 0.643 0.611 0.572 0.550 PAN Wt(g) 0.615 0.521 0.554 -0.413 DM -0.105 -0.105 -0.363 -0.485 1000GWt(g) -0.104 -0.203 -0.518 -0.524 Grain Lgth(mm) -0.152 -0.171 -0.256 -0.247 Strw Yld -0.443 -0.211 - 0.272 -0.350
Generally, for the other parameters (traits) measured on the rice germplasm, there was no significant (p>5%) genotype by location interaction effect. In addition, genetic correlation between grain yield and these traits was generally weak. The lack of significant genotype by location interaction effect for these traits indicated high stability across locations and hence their expression could hardly be influenced by the prevailing environmental variability of the locations sampled. The stability of these traits across the locations could be the reason for the weak genetic correlation between grain yield and these traits. On the other hand, days to 50% flowering (DFF), panicle weight (PAN Wt) and number of Panicles per hill were positively and strongly correlated to grain yield, an indication that these traits are unstable and easily affected by genotype by location interaction.
Adaptability studies of genotypes
Additive Main effect and Multiplicative Interaction (AMMI) ANOVA for grain yield of the 30 rice germplasm evaluated in the four environments confirmed that the genotype (G), environment (E) and their interaction (GEI) effects were significantly different (p<0.01), indicating that broad range of diversity existed among the genotypes. The results also showed that for the four environments considered, the highly significant differences (P<0.01) among environments and genotypes as well as the significance of GEI implies a highly significant influence of environment, genotype and their interaction effect on grain yield of rice genotypes within the Guinea and Sudan savannah zones. The IPCA 1 (56.89%) and IPCA 2 (33.62) interaction terms were significant (P < 0.05) indicating the suitability of the AMMI model used.
Y i r z a g l a J A m b i t . J . A g r i c . | 80
Thus, multiple methods were employed to analyse stability, which coupled with mean analysis provided a good understanding of the adaptation levels of rice genotypes across the environments (Blanche et al. 2009). In the AMMI analysis, the G x E interaction effect was further partitioned into IPCA scores. The analysis permitted estimation of interaction effect of a genotype in each location and thus helped to identify genotypes that best suited specific locations (Das et al., 2010). The IPCA scores of a genotype in the AMMI analysis are an indication of the stability or adaptation over environments. The greater the IPCA scores, either negative or positive, (as it is a relative value), the more specifically adapted is a genotype to certain environments. The more the IPCA scores approximate to zero, the more stable or adapted the genotype is over all the
environments sampled. Thus, a genotype showing high positive interaction in an environment obviously has the ability to exploit the agro-ecological or agro-management conditions of the specific environment and is therefore better suited to that environment. Combined analysis of variance of the AMMI 2 model
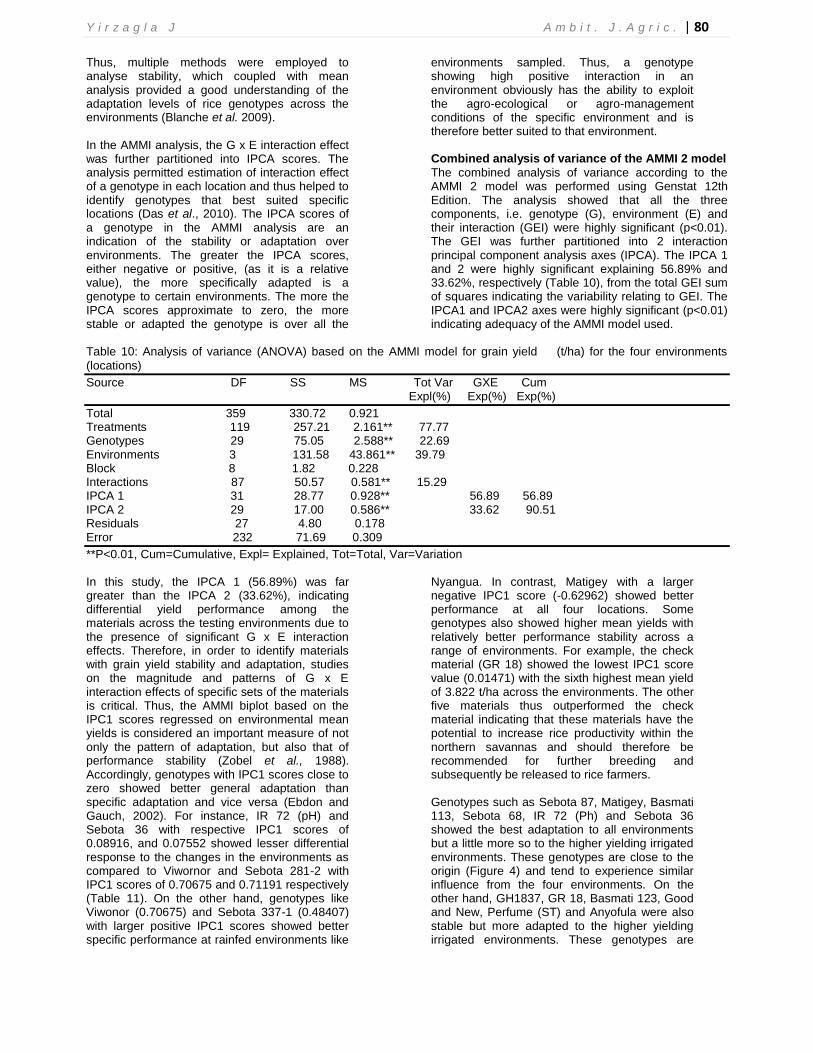
The combined analysis of variance according to the AMMI 2 model was performed using Genstat 12th Edition. The analysis showed that all the three components, i.e. genotype (G), environment (E) and their interaction (GEI) were highly significant (p<0.01). The GEI was further partitioned into 2 interaction principal component analysis axes (IPCA). The IPCA 1 and 2 were highly significant explaining 56.89% and 33.62%, respectively (Table 10), from the total GEI sum of squares indicating the variability relating to GEI. The IPCA1 and IPCA2 axes were highly significant (p<0.01) indicating adequacy of the AMMI model used.
Table 10: Analysis of variance (ANOVA) based on the AMMI model for grain yield (t/ha) for the four environments
(locations)
Source DF SS MS Tot Var GXE Cum Expl(%) Exp(%) Exp(%)
Total 359 330.72 0.921 Treatments 119 257.21 2.161** 77.77 Genotypes 29 75.05 2.588** 22.69 Environments 3 131.58 43.861** 39.79 Block 8 1.82 0.228 Interactions 87 50.57 0.581** 15.29 IPCA 1 31 28.77 0.928** 56.89 56.89 IPCA 2 29 17.00 0.586** 33.62 90.51 Residuals 27 4.80 0.178 Error 232 71.69 0.309
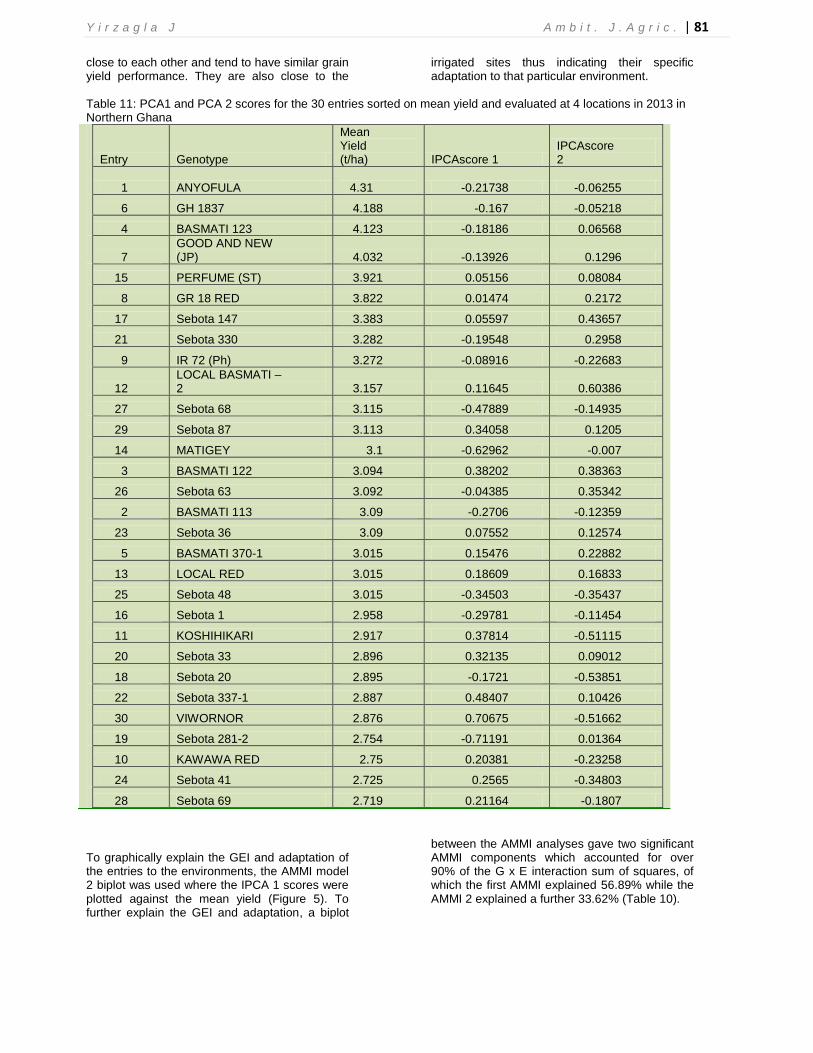
**P<0.01, Cum=Cumulative, Expl= Explained, Tot=Total, Var=Variation In this study, the IPCA 1 (56.89%) was far greater than the IPCA 2 (33.62%), indicating differential yield performance among the materials across the testing environments due to the presence of significant G x E interaction effects. Therefore, in order to identify materials with grain yield stability and adaptation, studies on the magnitude and patterns of G x E interaction effects of specific sets of the materials is critical. Thus, the AMMI biplot based on the IPC1 scores regressed on environmental mean yields is considered an important measure of not only the pattern of adaptation, but also that of performance stability (Zobel et al., 1988). Accordingly, genotypes with IPC1 scores close to zero showed better general adaptation than specific adaptation and vice versa (Ebdon and Gauch, 2002). For instance, IR 72 (pH) and Sebota 36 with respective IPC1 scores of 0.08916, and 0.07552 showed lesser differential response to the changes in the environments as compared to Viwornor and Sebota 281-2 with IPC1 scores of 0.70675 and 0.71191 respectively (Table 11). On the other hand, genotypes like Viwonor (0.70675) and Sebota 337-1 (0.48407) with larger positive IPC1 scores showed better specific performance at rainfed environments like
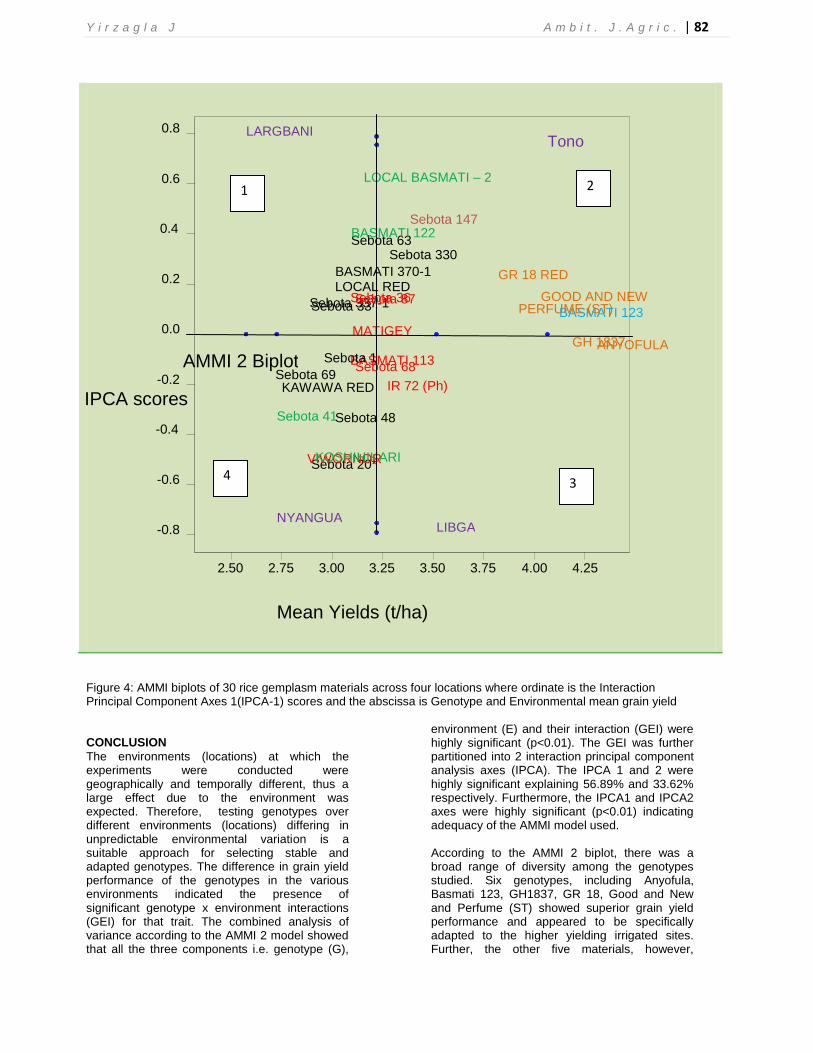
Nyangua. In contrast, Matigey with a larger negative IPC1 score (-0.62962) showed better performance at all four locations. Some genotypes also showed higher mean yields with relatively better performance stability across a range of environments. For example, the check material (GR 18) showed the lowest IPC1 score value (0.01471) with the sixth highest mean yield of 3.822 t/ha across the environments. The other five materials thus outperformed the check material indicating that these materials have the potential to increase rice productivity within the northern savannas and should therefore be recommended for further breeding and subsequently be released to rice farmers. Genotypes such as Sebota 87, Matigey, Basmati 113, Sebota 68, IR 72 (Ph) and Sebota 36 showed the best adaptation to all environments but a little more so to the higher yielding irrigated environments. These genotypes are close to the origin (Figure 4) and tend to experience similar influence from the four environments. On the other hand, GH1837, GR 18, Basmati 123, Good and New, Perfume (ST) and Anyofula were also stable but more adapted to the higher yielding irrigated environments. These genotypes are
Y i r z a g l a J A m b i t . J . A g r i c . | 81
close to each other and tend to have similar grain yield performance. They are also close to the
irrigated sites thus indicating their specific adaptation to that particular environment.
Table 11: PCA1 and PCA 2 scores for the 30 entries sorted on mean yield and evaluated at 4 locations in 2013 in Northern Ghana
Entry Genotype
Mean Yield (t/ha) IPCAscore 1
IPCAscore 2
1 ANYOFULA
4.31 -0.21738 -0.06255
6 GH 1837 4.188 -0.167 -0.05218
4 BASMATI 123 4.123 -0.18186 0.06568
7 GOOD AND NEW (JP) 4.032 -0.13926 0.1296
15 PERFUME (ST) 3.921 0.05156 0.08084
8 GR 18 RED 3.822 0.01474 0.2172
17 Sebota 147 3.383 0.05597 0.43657
21 Sebota 330 3.282 -0.19548 0.2958
9 IR 72 (Ph) 3.272 -0.08916 -0.22683
12 LOCAL BASMATI – 2 3.157 0.11645 0.60386
27 Sebota 68 3.115 -0.47889 -0.14935
29 Sebota 87 3.113 0.34058 0.1205
14 MATIGEY 3.1 -0.62962 -0.007
3 BASMATI 122 3.094 0.38202 0.38363
26 Sebota 63 3.092 -0.04385 0.35342
2 BASMATI 113 3.09 -0.2706 -0.12359
23 Sebota 36 3.09 0.07552 0.12574
5 BASMATI 370-1 3.015 0.15476 0.22882
13 LOCAL RED 3.015 0.18609 0.16833
25 Sebota 48 3.015 -0.34503 -0.35437
16 Sebota 1 2.958 -0.29781 -0.11454
11 KOSHIHIKARI 2.917 0.37814 -0.51115
20 Sebota 33 2.896 0.32135 0.09012
18 Sebota 20 2.895 -0.1721 -0.53851
22 Sebota 337-1 2.887 0.48407 0.10426
30 VIWORNOR 2.876 0.70675 -0.51662
19 Sebota 281-2 2.754 -0.71191 0.01364
10 KAWAWA RED 2.75 0.20381 -0.23258
24 Sebota 41 2.725 0.2565 -0.34803
28 Sebota 69 2.719 0.21164 -0.1807
To graphically explain the GEI and adaptation of the entries to the environments, the AMMI model 2 biplot was used where the IPCA 1 scores were plotted against the mean yield (Figure 5). To further explain the GEI and adaptation, a biplot
between the AMMI analyses gave two significant AMMI components which accounted for over 90% of the G x E interaction sum of squares, of which the first AMMI explained 56.89% while the AMMI 2 explained a further 33.62% (Table 10).
Y i r z a g l a J A m b i t . J . A g r i c . | 82
Figure 4: AMMI biplots of 30 rice gemplasm materials across four locations where ordinate is the Interaction Principal Component Axes 1(IPCA-1) scores and the abscissa is Genotype and Environmental mean grain yield CONCLUSION
The environments (locations) at which the experiments were conducted were geographically and temporally different, thus a large effect due to the environment was expected. Therefore, testing genotypes over different environments (locations) differing in unpredictable environmental variation is a suitable approach for selecting stable and adapted genotypes. The difference in grain yield performance of the genotypes in the various environments indicated the presence of significant genotype x environment interactions (GEI) for that trait. The combined analysis of variance according to the AMMI 2 model showed that all the three components i.e. genotype (G),
environment (E) and their interaction (GEI) were highly significant (p<0.01). The GEI was further partitioned into 2 interaction principal component analysis axes (IPCA). The IPCA 1 and 2 were highly significant explaining 56.89% and 33.62% respectively. Furthermore, the IPCA1 and IPCA2 axes were highly significant (p<0.01) indicating adequacy of the AMMI model used. According to the AMMI 2 biplot, there was a broad range of diversity among the genotypes studied. Six genotypes, including Anyofula, Basmati 123, GH1837, GR 18, Good and New and Perfume (ST) showed superior grain yield performance and appeared to be specifically adapted to the higher yielding irrigated sites. Further, the other five materials, however,
Sebota 20*
BASMATI 370-1
Sebota 147
BASMATI 123
BASMATI 113
VIWORNOR
Sebota 1 Sebota 69
PERFUME (ST)
Sebota 63
MATIGEY
Sebota 41
LOCAL RED Sebota 337-1
LOCAL BASMATI – 2
Sebota 33
KOSHIHIKARI
BASMATI 122
KAWAWA RED
Sebota 68
IR 72 (Ph)
Sebota 36
ANYOFULA
Sebota 87
Sebota 48
Sebota 330
GR 18 RED
GOOD AND NEW
GH 1837
NYANGUA LIBGA
Tono LARGBANI
2.50
-0.8
-0.6
3.00
-0.4
3.50
-0.2
4.00
0.0
0.2
0.4
0.6
0.8
2.75 3.75 4.25 3.25
Mean Yields (t/ha)
1 2
3 4
AMMI 2 Biplot
IPCA scores
Y i r z a g l a J A m b i t . J . A g r i c . | 83
outperformed the check material (GR18) indicating that these materials have the potential to increase rice productivity within the northern savannas and should therefore be recommended for further breeding and subsequently released to rice farmers. Even though Sebota 147 was also specifically adapted to the high yielding irrigated sites, it had below average stability. On the other hand, genotypes that were identified as broadly adapted to all the four environments (locations) included Sebota 87, Matigey, Basmati 113, Sebota 68, IR 72 (Ph) and Sebota 36. Genotypes that had above average stability, but were more specifically adapted to the lower yielding rainfed sites included Local Basmati-2, Sebota 20, Sebota 41, Viwornor and Koshihikari. Entries that showed no distinct patterns of adaptation and were specifically adapted either to lower or higher yielding environments included Sebota 330 and Sebota 48. However, since this study was conducted under researcher’s management, on-farm adaptive trials are required to validate these findings in order to arrive at conclusive recommendations for rice production within the Guinea and Sudan savannah zones.
REFERENCES
Bam, R.K., Anchirina V.M., Manful J.J., Anserebio F., Agyemang A. 1998. A Preliminary Study of Consumer Preferences and Price. Natural Resources Institute (NRI), Project Report No. 34, Project 6688, UK.
Badu-Apraku, B., Fajemisin, J. M. & Diallo, A.O. (1995). The performance of early and extra-early varieties across environments in West and Central Africa. In Contributing to Food Self-sufficiency: Maize Research and Development in West and Central Africa. Proceedings of a Regional Maize Workshop, 29 May-2 June 1995 (Eds B. Badu-Apraku, M. O. Akorodaa, M. Ouedraogo & F. M. Quin). Pp. 149-159. Cotonou, Benin Republic: IITA.
Badu-Apraku, B., Abamu, F. J., Menkir, A., Fakorede, M.A.B., Obeng-Antwi, K. & The C. (2003). Genotype by environment interactions in the regional early variety trials in West and Central Africa. Maydica 48, 93-104
Blanche S. B, Utomo H. S, Winifrida I, Myers G.O. (2009). Genotype x Environment Interactions of Hybrid and Varietal Rice Cultivars for Grain Yield and Milling Quality. Crop Science 49, 2011-2018
Bray, R.H. and L.T., Kurtz, 1945. Determination of total organic and available forms P in soils. Soil science 39:39-45
Das S, Misra R. C., Patnaik M.C., Das S.R. 2010. G x E Interaction, Adaptability, and Yield Stability of Mid-Early genotypes. Indian Journal of Agricultural Research 44(2), 104-111.
Ebdon JS, Gauch HG, 2002. Additive main effect and multiplicative interaction analysis of national turfgrass performance trials. II. Cultivar recommendations. Crop Sci, 42:497-506. Food and Agriculture Organization (FAO) of the United Nations. 2003. State of the Food Insecurity in the World.
Institute of Statistical, Social and Economic Research (ISSER), 2002. The State of the Ghanaian Economy in 2001. ISSER, University of Ghana, Legon, Accra,. Ghana.
Jackson, M. L. (1962). Soil chemical analysis. Practice, Hall, Inc. New York.
Mohammadi, R., Amri, A., Haghparast, R., Sadeghzadeh, D., Armion M. & Ahmadi, M.M (2009). Pattern analysis of genotype-by- environment interaction for grain yield in durum wheat. Journal of Agricultural Science,
Cambridge 147, 537-545.
Padi, F.K. (2007). Genotype x environment interaction and Yield Stability in cowpea-based cropping system by Padi, F.K. Euphytica 158:24
Sreedhar S, Dayakar T. R, Ramesha M.S (2011). Genotype x Environment Interactions and Stability for Yield and Its components in Hybrid Rice Cultivars (Oryza sativa L.). International Journal of Plant Breeding and Genetics. 5(3). 194-208
Zobel, R.W., Wright, M.J. And Gauch, H.G., (1988). Statistical analysis of a yield trial. Agron. J. 80: 388-393.
Y i r z a g l a J A m b i t . J . A g r i c . | 84
APPENDICE
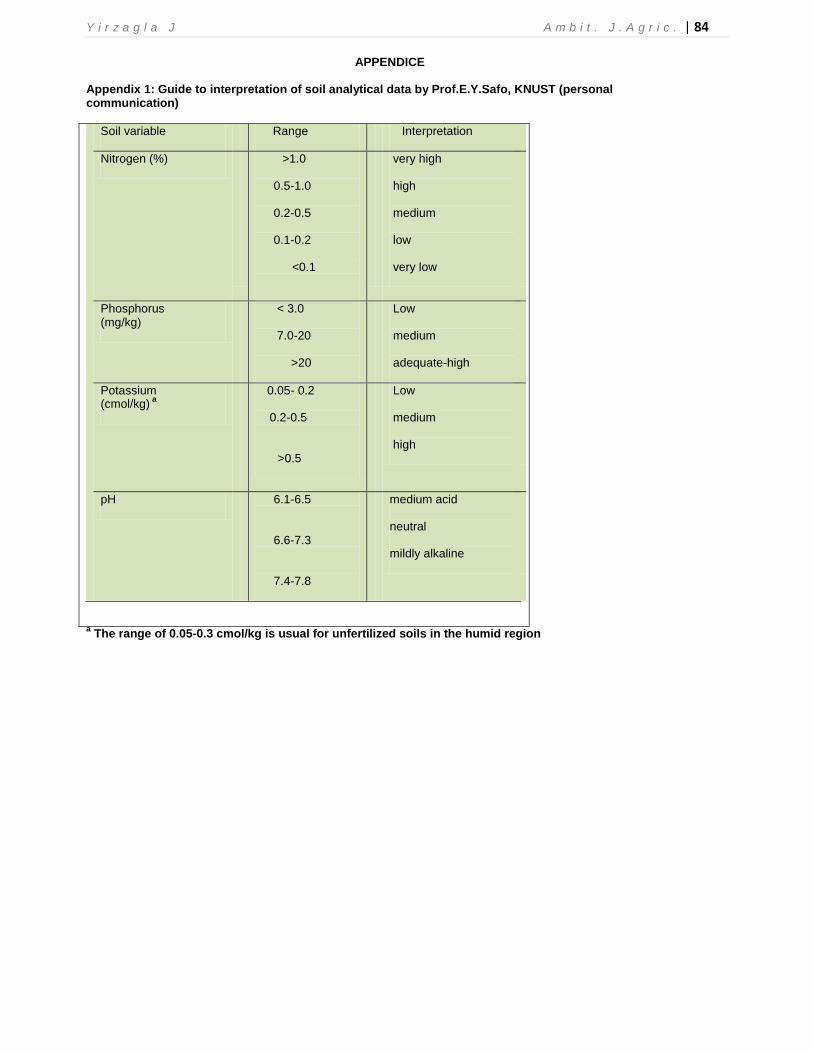
Appendix 1: Guide to interpretation of soil analytical data by Prof.E.Y.Safo, KNUST (personal communication)
Soil variable Range Interpretation
Nitrogen (%)
>1.0
0.5-1.0
0.2-0.5
0.1-0.2
<0.1
very high
high
medium
low
very low
Phosphorus (mg/kg)
< 3.0
7.0-20
>20
Low
medium
adequate-high
Potassium (cmol/kg)
a
0.05- 0.2
0.2-0.5
>0.5
Low
medium
high
pH
6.1-6.5
6.6-7.3
7.4-7.8
medium acid
neutral
mildly alkaline
a The range of 0.05-0.3 cmol/kg is usual for unfertilized soils in the humid region