


Languages
Pages
Legal


Copyright © 2007 Telefocal Asia Pte Ltd. All rights reserved.1

Copyright © 2007 Telefocal Asia Pte Ltd. All rights reserved.2
Agenda – Day One
Introduction
Microwave Link Planning
Process Flow Chart
DTM and Coordinate System
Pathloss 4.0
Summary Module
Terrain Data Module
Antenna Height Module
Network Module
Diffraction Module

Copyright © 2007 Telefocal Asia Pte Ltd. All rights reserved.3
Network Module
Worksheet Module
Diffraction Module
Reflection Module
Multipath Module
Applying Divesity and Protection
Agenda – Day Two

Copyright © 2007 Telefocal Asia Pte Ltd. All rights reserved.4
Design of Passive Repeaters
Interference Analysis
Protection and Diversity
Practicle use of Pathloss 4.0
Agenda – Day Three

Copyright © 2007 Telefocal Asia Pte Ltd. All rights reserved.5

Copyright © 2007 Telefocal Asia Pte Ltd. All rights reserved.6
Microwave Applications
Transmission
Cell Site / Base Station Interconnect
Long haul E1 / 45M / STM-1 transport
Local Wireless Links
Access
Next-to-last mile transport for LMDS, WiMAX, WIP
Backhaul from digital loop carrier & DSLAM
CLEC metropolitan wireless links
Architectures
Linear (tree & branch, hub & spoke)
Ring (unidirectional path switch ring, ATM, IP)
Hybrid SONET / Microwave

Copyright © 2007 Telefocal Asia Pte Ltd. All rights reserved.7
Microwave Transport
Requires line of site
Frequency bands
“Low frequency” = 2 - 11 GHz
“High frequency” = 13 - 38 GHz
Capacities range from 2 E1s to STM-1
Availability based on:
Distance
Terrain
Precipitation
Climate

Copyright © 2007 Telefocal Asia Pte Ltd. All rights reserved.8
How Far Can You Go ?
Practical limits governed by many factors:
Frequency
Climate
Propagation Anomalies
Terrain
Antenna Performance / Center Lines
Rainfall Rate (for high frequencies)
Radio Performance
These are weighed against your desired . . .
Availability Objectives

Copyright © 2007 Telefocal Asia Pte Ltd. All rights reserved.9
6 GHz (20-60 Km)
11 GHz (10-30 Km)
18/23 GHz (1-8 Km)
Longer paths may require space diversity receiversSome bands are limited to 2-16 E1 radios
How Far Can You Go?

Copyright © 2007 Telefocal Asia Pte Ltd. All rights reserved.10
30 40 50 60 70 80 90 100 120 140 160 180 200 240 300 MHz
3 4 5 6 7 8 9 10 12 14 16 18 20 24 30 GHz
0.3 0.4 0.5 0.6 0.7 0.8 0.9 1.0 1.2 1.4 1.6 1.8 2.0 2.4
AM Marine
Short Wave - International Broadcast - Amateur
3 4 5 6 7 8 9 10 12 14 16 18 20 24 30 MHz
CB
26 28
VHF LOW Band FM VHF VHF TV 7-13
0.3 0.4 0.5 0.6 0.7 0.8 0.9 1.0 1.2 1.4 1.6 1.8 2.0 2.4 3.0 GHz
UHF UHF TV 14-69 GPS
Cellular GSM1800, GSM1900
Broadcasting
Land-Mobile
Aeronautical
Mobile telephony
Terrestrial Microwave
Satellite
Frequency Spectrum

Copyright © 2007 Telefocal Asia Pte Ltd. All rights reserved.11
4 GHz High capacity band (max STM-1) Satellite users hinder Good propagation
LL66 GGHHzz Best high capacity band (max STM-1) Some low capacity channels Excellent propagation
UU66 GGHHzz Best low-mid capacity band (max STM-1) Very good propagation
10 GHz Low capacity band (max STM-1) Low congestion Adverse rain impact begins
What bands to use?

Copyright © 2007 Telefocal Asia Pte Ltd. All rights reserved.12
11 GHz High capacity band (max STM-1) Some low-cap channels Adverse rain impact
18 GHz Low-medium capacity band (max STM-1) Small antennas More adverse rain impact Satellite users growing encroachment
23 GHz Low-medium capacity band (max STM-1) Small antennas More adverse rain impact Shared with govt. users
What bands to use?

Copyright © 2007 Telefocal Asia Pte Ltd. All rights reserved.13
How Far Can You Go?
Below 8 GHz
Minimal influence
Above 8 GHz
Rain begins to dominate
Long paths may be practical up to 12 GHz
But only in dryer regions
The higher the frequency . . .
The more significant the impact

Copyright © 2007 Telefocal Asia Pte Ltd. All rights reserved.14
Good
AverageModerateDifficultVery Difficult
Average
Good
AverageAverage
Difficult
Difficult
Good
Difficult
Based on Bellcore c Factors
Very Difficult
Good
Propagation Regions

Copyright © 2007 Telefocal Asia Pte Ltd. All rights reserved.15
Basic Propagation Losses
Basic Propagation Losses fall into eight well defined categories:
Free-Space Propagation Loss - Basic transmission loss between two points in free space, each using an isotropic antenna.
Atmospheric Absorption - Absorption of EM energy by the oxygen and water molecules in the atmosphere. Above ~ 8 GHz.
Reflection Loss/Gain - Out of phase signals can cause 35-40 dB of attenuation, in phase can give 6 dB up fades.
Rain Attenuation - Significant only above 8 GHz..
Diffraction Loss - Losses caused by insufficient clearance over intermediate terrain features
Airborne Particles - Sand and dust only above ~ 14 GHz.
Fog and Clouds - Problem only above ~ 20 GHz.
Copyright © 2007 Telefocal Asia Pte Ltd. All rights reserved.16
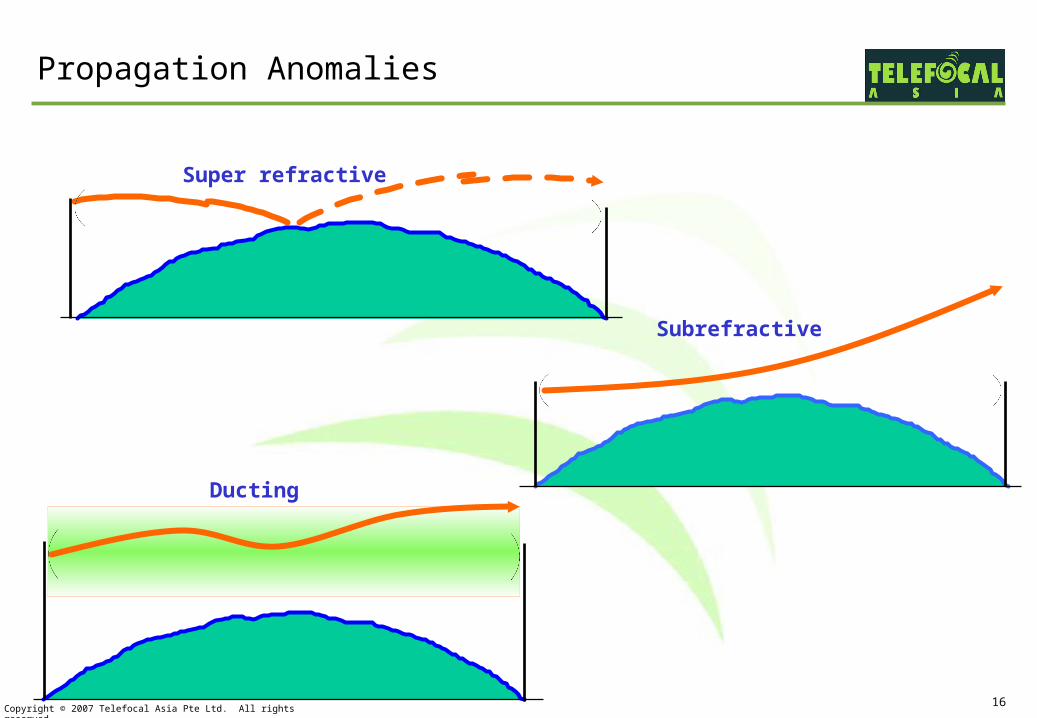
Super refractive
Propagation Anomalies
Ducting
Subrefractive

Copyright © 2007 Telefocal Asia Pte Ltd. All rights reserved.17
Path Clearance
Two factors are involved
The K factor
Fresnel zones
The K factor
Describes the effective curvature of the earthRelative to air density vs. elevationInfluenced by pressure, temp and humidity
Fresnel zones
Describe the minimum clearance required for a microwave beam to travel as if through free space (i.e. a vacuum)

Copyright © 2007 Telefocal Asia Pte Ltd. All rights reserved.18
Atmospheric Propagation
Microwaves travel a straight line in free space
If a microwave beam is launched in free space (a vacuum) it will travel in a straight line.
The atmosphere is not free space
Vertical density gradients within the atmosphere cause a microwave signal to be curved
The density gradients are a function of air pressure, temperature, and humidity.

Copyright © 2007 Telefocal Asia Pte Ltd. All rights reserved.19
Class Work.
Assignment:
D= 20km
D1= 14.5km
D2= 5.5km
Antenna Hight = 30meter
Obstacle Hight = 18meter
Freq = 18 GHz
Find the First fresnel Zone and Check the Fresnel clearance
Copyright © 2007 Telefocal Asia Pte Ltd. All rights reserved.20
The Microwave Link ?
Microwave radio link, in the context of this course, refers to point-to-point fixed links that operate in duplex mode.
In its simplest form the microwave link can be one hop, consisting of one pair of antennas spaced as little as one or two kilometers apart, or can be a backbone, including multiple hops, spanning several thousand kilometers.

Copyright © 2007 Telefocal Asia Pte Ltd. All rights reserved.21
Terminal “A”
RadioMultiplex
Tx
Rx
RadioMultiplex
Tx
Rx
Terminal “B”
Antenna
Path
FeederData Data
Antenna
Feeder
The Microwave Link (Cont’d)
The above drawing is functional block diagram of a typical microwave link consisting of set of multiplexers, digital microwave radios, antennas and transmission lines.
Copyright © 2007 Telefocal Asia Pte Ltd. All rights reserved.22
• Sometimes radios are configured as outdoor units ( ODU ) and in this case transmission lines are not required and antennas are integrated as part of the radio RF head units. In GSM deployments where roll outs are quick, this is a very desirable feature.
• The fundamental aim of a microwave radio link is to deliver sufficient signal power to the radio at the far end of the link to achieve desired performance objectives. This is the challenge of link planning.
• For proper operation a microwave link must fulfill LOS condition.
The Microwave Link (Cont’d)

Copyright © 2007 Telefocal Asia Pte Ltd. All rights reserved.23
Unfortunately, atmospheric conditions and rain effect modify the propagation of microwaves so that even if the link planner can see from point A to point B ( true LOS ), it may not be possible to place antennas at those two points and achieve a satisfactory communication performance.
A valuable characteristic of LOS transmission is that we can predict the level of a signal arriving at a distant receiver with known accuracy under non fading conditions. ( The link budget method ).
Microwave link performance and availability are predicted using a number of empirical prediction models.
For different frequency bands, capacities and under different propagation conditions, microwave link distances vary.
The Microwave Link (Cont’d)

Copyright © 2007 Telefocal Asia Pte Ltd. All rights reserved.24
General design considerations:
Specifications of the network and system
Preliminary map study and site locations
Field survey and site survey
Preparation of path profiles
Determination of antenna heights
Ground-reflection calculations
Performance and availability predictions
Frequency planning
Equipment selection
Grounding and safety considerations
Microwave Link Planning

Copyright © 2007 Telefocal Asia Pte Ltd. All rights reserved.25
The Planning Process Teams
System Engineer
LOS Survey Team
Transmission Engineer
Site Acquisition Team
Network User: Fixed, Mobile, Utility, TV, PMP

Copyright © 2007 Telefocal Asia Pte Ltd. All rights reserved.26
Field Survey shall include:
• Verify exact site coordinates• Confirmation of LOS• Check-up of suspected reflection points,vegetation
buildings and other man made obstacles• Determination of height of, and distance to critical obstacles• Check propagation conditions• Classify Path types• Site survey
Field Survey and Site Determination

Copyright © 2007 Telefocal Asia Pte Ltd. All rights reserved.27
Survey Report
This report can include the following :
• Confirmation of LOS indicating equipment used for accuracy
• Site description and layout
• Antenna and tower heights
• Path Classifications ( overland paths, coastal links or water paths )
• Path elevations, coordinates, heights of obstructions and vegetations
• Propagation conditions
• Frequency interference probabilities
• Photographs

Copyright © 2007 Telefocal Asia Pte Ltd. All rights reserved.28
Digital Terrian Models (DTM)
Digital Terrain Models
DTM is a simple digital representation of a portion of the earth’s surface.
DTM may be used as a digital model of any single-valued surface. e.g.
Geological horizons
Rainfall or pressure
Population density

Copyright © 2007 Telefocal Asia Pte Ltd. All rights reserved.29
Digital Terrian Models (DTM)
DTM Generation
Most DTM data are derived from three alternative sources
Ground surveys
Survey data may be input directly into computer systems.
DTM generated from survey data is very accurate.
Expensive and time consuming process.
Photogrammetricdata capture
Based on the stereoscopic interpretation of aerial photographs or satellite imagery.
Cartographic data sources
Deriving DTM from cartographic documents

Copyright © 2007 Telefocal Asia Pte Ltd. All rights reserved.30
Map Scales
A defined dimensional relationship between reality and the map (Robinson et al., 1995):
a) Verbal: “one cm represents ten kilometers”
b) Representative fraction: 1:10,000
c) Graphic scale:
d) Area scale: Represents square kilometers
5000 0 5000 1000 0 Me te rs

Copyright © 2007 Telefocal Asia Pte Ltd. All rights reserved.31
Calculate Map Scales
For example, if 2 cm on a map represents 1 km on the ground the scale would be 2 cm = 1 km, or...
Scale is “unitless” because it is a ratio.

Copyright © 2007 Telefocal Asia Pte Ltd. All rights reserved.32
Examples small vs. large scale
Small scale: 1:250,000
Large scale: 1:50,000

Copyright © 2007 Telefocal Asia Pte Ltd. All rights reserved.33
Coordinate systems
• A coordinate system is a reference system based on mathematical rules for specifying positions (locations) on the surface of the earth. The coordinate values can be spherical (latitude and longitude) or planar (such as Universal Transverse Mercator).
• A coordinate system is usually defined by a datum, ellipsoid and projection, and is specified in terms of units (e.g. degrees, meters).

Copyright © 2007 Telefocal Asia Pte Ltd. All rights reserved.34
Types of Coordinate Systems
Geographic coordinate system:Uses latitude and longitude for locating positions on the uniformly curved surface of the earth.
Rectangular/plane coordinate systems:Used to locate positions on a flat map.For example Universal Transverse Mercator (UTM)

Copyright © 2007 Telefocal Asia Pte Ltd. All rights reserved.35
Geographic Coordinate System
The Equator (latitude) and Prime Meridian (longitude) are the reference points. Usually Greenwich, England is the Prime Meridian.
The Cartographic Boundary Files, the Road Network Files and the representative points are disseminated in latitude/longitude coordinates.
Prime meridian
Equator
Copyright © 2007 Telefocal Asia Pte Ltd. All rights reserved.36
Decimal Degrees (DD)
Decimal degrees are similar to degrees/ minutes/seconds (DMS) except that minutes and seconds are expressed as decimal values.
Decimal degrees make digital storage of coordinates easier and computations faster.
60.34444 instead of 60º20'40"

Copyright © 2007 Telefocal Asia Pte Ltd. All rights reserved.37
Example: Converting DMS to DD
20 minutes.= 0.33333 (20/60)40 seconds = 0.01111 (40/3600)
Add up the degrees to get an answer:60º + 0.33333 + 0.01111=60.34444 DD
60º20'40"degrees
minutes
seconds

Copyright © 2007 Telefocal Asia Pte Ltd. All rights reserved.38

Copyright © 2007 Telefocal Asia Pte Ltd. All rights reserved.39
Introduction
The following Slides outlines the method of use and the parameters to be used when planning a transmission link
In order for a link to operate reliably and provide the quality of service required for the transmission of data the recommendations outlined in ITU –R.F1491 for quality of service and ITU-R.F1493 for availability of service are used as guide lines

Copyright © 2007 Telefocal Asia Pte Ltd. All rights reserved.40
Necessary Data for Microwave Network Design& How to place it in your PATHLOSS Program
Pathloss 4.0 (licensed)
Rain File This folder contents Rain data for each area of the world according to 4 standards (Canada, Crane, Crane_96 & ITU)
Equipment File
Terrain Data File (GTOPO303)

Copyright © 2007 Telefocal Asia Pte Ltd. All rights reserved.41
Rain File
ITU World Rain Regions The ITU rain region are from A to Q are based on Characterstics of precipation for propagation Modeliong Recommendation ITU-R Pn.837-1
A world Map showing the ITU rain region is given on Figure

Copyright © 2007 Telefocal Asia Pte Ltd. All rights reserved.42
Rain File
This data will automatically placed in Pathloss Folder after program set up

Copyright © 2007 Telefocal Asia Pte Ltd. All rights reserved.43
Equipment
This folder contents 4 folders but for our Microwave design we just use 2 folders as the followings
MAS which contents Microwave Antenna Data for different Antenna Manufacturer (Andrew , RFS , ERICSSON , …………..) as shown in Figure
MRS which contents Microwave Radio Data for different Manufacturer

Copyright © 2007 Telefocal Asia Pte Ltd. All rights reserved.44
Equipment
Equipment Folder is available on Pathloss CD and can be download from Pathloss Website

Copyright © 2007 Telefocal Asia Pte Ltd. All rights reserved.45
Terrain Data File (GTOPO303)
This folder contents the Terrain data for all the world
WARNINGThis data is not accurate so we usually get terrain data from contours maps or from
path survey.
Just we use this data for reference
So it isn't allowed to use this data to create path profile
How to set this data?
Create new folder in your PATHLOSS folder & name it as Gopo30303
Copy inside it the necessary area files (each area has 2 files)
Run PathLoss program
Go to configure menu & click terrain database as shown in fig.
Set Primary (No Selection) & Secondary (GTopo30 Global 30sec) as shown in Fig.
Click Set Up Secondary – Set Directory – choose Gtopo30303 folder then kick OK – click Close – click OK as shown in Fig.

Copyright © 2007 Telefocal Asia Pte Ltd. All rights reserved.46
Terrain Data File

Copyright © 2007 Telefocal Asia Pte Ltd. All rights reserved.47
How to operate PATHLOSS
PATHLOSS program is full Microwave Network design software. For our work we shall use PATHLOSS for the following
Make Network Configuration
Make Path Profile to find antenna height in each station
Calculate Link Budget to find Antenna diameters , RX level & Link Availability
Frequency Plan for overall network
Frequency Interference calculations for overall network

Copyright © 2007 Telefocal Asia Pte Ltd. All rights reserved.48
Setting up Pathloss 4
Before PL4 can be used certain parameters need to be set up.
When the program is first launched the Summary Module will open.
In the Summary Module select the Configure dropdown tag

Copyright © 2007 Telefocal Asia Pte Ltd. All rights reserved.49
Geographic defaults
Click on Geographic Defaults and the Geographic Defaults setup box will be displayed. Set up the parameters applicable to your region.

Copyright © 2007 Telefocal Asia Pte Ltd. All rights reserved.50
Terrain Database
If you are using a DTM for profile generation then set up the terrain database as described, if not omit this step.
Reselect the Configure dropdown menu and select Terrain Database. The e Configure Terrain Database dialog box will appear. Set the Primary Data Base for your DTM from the dropdown box.
Next select Setup Primary and from the dialog box choose Set Directory and configure the path to the directory where the DTM is stored.
If the DTM requires an index table follow the steps below, if not omit them.
Once this has been completed select Index in the same dialog box. When the Index Screen appears select Files, and then select Import List. The index list will be imported, but you will need to fill in the UTM Zone numbers. The zone numbers are attached at the end of this document, UTM Index File.

Copyright © 2007 Telefocal Asia Pte Ltd. All rights reserved.51
Directories
Close all open dialog boxes and reselect the Configure dropdown menu and select Directories
Chose Microwave Antenna Codes and set up the path for the program to locate the directory containing the Antenna Files.
Repeat the process for Microwave radio Codes.
PL4 is now set up for use. Next we will discuss the various modules to be used.

Copyright © 2007 Telefocal Asia Pte Ltd. All rights reserved.52
Modules
PL 4 is divided into a number of modules each module is used to plan different parts of the link or transmission network. Only the basic functions of the modules required for transmission planning are discussed in this document.
Summary Module
Terrain Data Module
Antenna Height Module
Work Sheet Module
Diffraction Module
Reflections Module
Multipath Module
Print Profile Module
Network Module

Copyright © 2007 Telefocal Asia Pte Ltd. All rights reserved.53
Summary Module

Copyright © 2007 Telefocal Asia Pte Ltd. All rights reserved.54
Summary Module
Site Names - enter an abbreviated name code.
Call Sign – enter the site call sign code. This code is used when performing interference calculations.
Station Code – enter the station code if available or leave blank.
Owner Code – enter the owner code if available or leave blank.
Latitude – make sure that the same latitude is entered for the same site each time this field in filled in.
Longitude – make sure that the same longitude is entered for the same site each time this field in filled in.
Tower heights – enter the height of the towers on each site.
Operator Code – enter the operator code if available or leave blank.
Frequency (MHz) – enter the frequency band the link will operate in e.g. 7500 or 15000.
Selecting the Report tag can generate a report of the Summary Module.

Copyright © 2007 Telefocal Asia Pte Ltd. All rights reserved.55
Terrain Data Module
From the Modules dropdown menu select Terrain Data and the Terrain Data Worksheet will be displayed. It is assumed that a DTM will be used to enter the terrain data. If it is not available the data will have to be recorded using a 1:50,000 map and entered into the module manually.

Copyright © 2007 Telefocal Asia Pte Ltd. All rights reserved.56
Terrain Data Module (Cont’d): Generate Profile
Select the Operations dropdown menu and choose Generate Profile, tick the Span Missing Files box and click Generate
Close the Generate Profile dialog box. The DTM records data points every 200 meters and there will be a number of points indicating the same ground elevation. These duplicated data points are not required for the accuracy of the profile so they can be deleted.
Select the Operation dropdown menu and choose Strip Redundant Points. Set the tolerance to 0 and click OK. Next reselect the Operations dropdown menu and Accept-Reject Changes. Choose
Yes when the Delete Marked Point dialog box opens.

Copyright © 2007 Telefocal Asia Pte Ltd. All rights reserved.57
Terrain Data Module (Cont’d): Ground Clutter
Ground clutter can be added to the profile in the form of trees, buildings, water towers and off path obstructions. Double click in the Structure Field of the display and select the type of structure you wish to insert. In the structure dialog box enter the structure information.
If a range of 25 meters high tress had been inserted on to the profile the following dialog boxes would have been used and the profile will be as shown.

Copyright © 2007 Telefocal Asia Pte Ltd. All rights reserved.58
Terrain Data Module (Cont’d):
Selecting the Report tag at the top of the profile will generate a Report detailing the terrain data.

Copyright © 2007 Telefocal Asia Pte Ltd. All rights reserved.59
Antenna Height Module
PL4 is able to calculate antenna heights for various combinations of antennas. The combinations most commonly used are Single antennas per site, TR-TR and space diversity antennas using two antennas per site, TRDR-TRDR.
From the Module dropdown menu select Antenna Heights. The screen below displayed the Antenna Height information for a diversity link

Copyright © 2007 Telefocal Asia Pte Ltd. All rights reserved.60
Calculating Kmin
In order to calculate the antenna heights we need to know what the Kmin value for the link.
To do this select the Operations dropdown menu and select Minimum K.
Record the calculated value.

Copyright © 2007 Telefocal Asia Pte Ltd. All rights reserved.61
Set Clearance Criteria
Next reselect the Operations dropdown menu and choose Set Clearance Criteria and enter the recorded value of Kmin in the dialog box for the 2nd Criteria – K and set the 2nd Criteria - %F1 to 60.
If space diversity is used enter the following - under the Diversity Option enter 1.333 for 1st Criteria – K and set the 1st Criteria - %F1 to 30. This is in accordance with the ITU recommendations for diversity link operations. If a non-diversity path is being planned then the Diversity criteria are left blank.

Copyright © 2007 Telefocal Asia Pte Ltd. All rights reserved.62
Calculate Antenna Heights
Press F9 to calculate the main antenna heights. Press F7 to change the calculation to the Diversity Path, if used, and press F9 again. The calculated antenna heights will be displayed in boxes at the top of the screen.
Click in one of the Antenna Height boxes and the Microwave Antenna Heights dialog box will be displayed
Adjust the antenna heights to the nearest metre to the calculated antenna heights. Diversity antenna heights are normally set 200 wavelengths below the main antenna, in a 7,500 MHz link this is approximately 8 metres. Diversity antennas can be set further apart from the main antenna to combat multipath or ducting, but these greater distances will not improve the link quality significantly, but will improve the link availability.
The antenna height calculations are similar for non diversity links, only the diversity calculation is omitted.

Copyright © 2007 Telefocal Asia Pte Ltd. All rights reserved.63
Print Profile Module
Select Module – Print Profile and the profile to be printed will be displayed. Three formats of display are available:
Flat Earth Drawn using multiple K values Curved Earth Straight Axis Only drawn for a single K value Curved Earth Curved Axis Only drawn for a single K value The profile below is an example of the Flat Earth Display.

Copyright © 2007 Telefocal Asia Pte Ltd. All rights reserved.64
Print Profile Module (Cont’d)
The various display options are selected by Clicking on Format and then selecting an option from the dropdown menu.
The profile Title Block can also be selected from this menu, this provides information about the link including the initials of the person planning the link as well as drawing number. This information should be included with each profile.
Top Related