


Languages
Pages
Legal


an initiative of
EU Cohesion Monitor 2018
An assessment of cohesionin the 28 member states
of the European Union
Overall Results Countriesecfr.eu/eucohesionmonitor Intro RankingsDesign

Copyright of this publication is held by the European Council on Foreign Relations. You may not copy, reproduce, republish or circulate in any way the content from this publication except for your own personal and non-commercial use. Any other use requires the prior written permission of the European Council on Foreign Relations.
© ECFR December 2017
ISBN: 978-1-911544-38-8
Published by the European Council on Foreign Relations (ECFR), Tennyson House 159-165, Great Portland Street, London, W1W 5PA, United Kingdom
Data visualization and interactive PDF by Dieter Dollacker and Dirk Waldik, Denkbuilder Berlin
Document Version 1.2
ECFR
/238
Overall Results Countriesecfr.eu/eucohesionmonitor Intro RankingsDesign

Josef Janning heads the Berlin office of ECFR and leads the project as Senior Policy Fellow.
Christoph Klavehn manages the project as Project Coordinator at the Berlin office of ECFR.
Christel Zunneberg is Project Assistant and supports Rethink: Europe’s research.
The EU Cohesion Monitor is part of the Rethink: Europe project by the European Council on Foreign Rela-tions and Stiftung Mercator.
To learn more about the project please visit ecfr.eu/rethinkeurope and ecfr.eu/eucohesionmonitor.
To contact the project team please email [email protected]
Introduction Rationale
IntroductionRationale
FAQCohesion conceptData and designThe 2017 update
Country GroupsOverviewBig SixFounding SixAffluent SevenSouthern SevenVisegrád Four
The EU Cohesion Monitor is an index of the 28 member states of the European Union and their readiness for joint action and cooperation.
The monitor uses ten indicators to conceptualize and illustrate the foundations, national trajectories and future potentials of cohesion in Europe.
This updated edition includes the cohesion ranking and trends of the EU28 from 2007 to 2017.
Team
Overall Results Countriesecfr.eu/eucohesionmonitor Intro RankingsDesign

What is the EU Cohe-sion Monitor?
The EU Cohesion Monitor is an index of the 28 member states of the European Union and their readiness for joint action and cooperation.
It measures how strong cohe-sion is, how it is changing, and how much it differs between the member states of the European Union.
The concept’s central assump-tion is that European cohesion is a precondition for Europe’s ca-pacity to act, and that acting to-gether successfully will in turn strengthen cohesion.
FAQ Cohesion concept
What recommenda-tions emerge from the EU Cohesion Monitor?
Cohesion is a central resource needed for European coopera-tion. Strategies to strengthen co-hesion need to address both its individual as well as its struc-tural dimension. They should also address each country’s dis-tinct cohesion profile.
Cohesion is not subject to swift changes. Measures that can boost cohesion should be pur-sued with stamina for the long term. The variety in cohesion also means that not only policy-makers and governments are en-couraged to address it. Cohesion is as much a field of engage-ment for civil-society organisa-tions as well as EU citizens.
IntroductionRationale
FAQCohesion conceptData and designThe 2017 update
Country GroupsOverviewBig SixFounding SixAffluent SevenSouthern SevenVisegrád Four
Are cooperation and cohesion different concepts?
Overall, we assume that success-ful cooperation between indi-viduals as well as societies and countries will strengthen mutual bonds, shared incentives, and common experiences.
Cohesion is broader in that it fo-cuses on the disposition of col-lective actors to work together.
The EU Cohesion Monitor looks not only at actual cooperation but includes a measurement of the awareness, readiness, and cooperation-mindedness of soci-eties.
What is the differ-ence between indi-vidual and structural cohesion? Individual cohesion describes people’s experiences, attitudes, beliefs, and well-being. Struc-tural cohesion is shaped by con-nections and practices between countries on the macro-level, in-cluding the actions of economic, political, and cultural elites.
The two dimensions often com-plement each other, but this is not necessarily so. The EU Cohe-sion Monitor displays both di-mensions separately to make this differentiation visible.
Overall Results Countriesecfr.eu/eucohesionmonitor Intro RankingsDesign

FAQ Data and design
What is the reason for choosing these particular indicators and variables?
Each of the EU Cohesion Monitor’s ten indicators rests on a cohesion assumption, or hy-pothesis.
Regarding the indicator Funding, for example, we argue that the inflow of resources through EU funds will strengthen awareness of EU benefits, such as through the presence of EU-funded pro-jects to improve local infrastruc-ture. At the same time, being a net contributor to the EU budget will increase that country’s stake in shaping the EU and thus will generally strengthen its engage-ment with it.
IntroductionRationale
FAQCohesion conceptData and designThe 2017 update
Country GroupsOverviewBig SixFounding SixAffluent SevenSouthern SevenVisegrád Four
How is the EU Cohe-sion Monitor com-piled?
The EU Cohesion Monitor com-bines a total of 32 factors to a set of ten cohesion indicators for each of the 28 EU member states. Data was gathered for 2007, 2014, and 2016/17.
The monitor presents the cohe-sion indicators on a scale of 1 to 10 points for ease of analysis and comparability.
A description of how the data is converted is available at ecfr.eu/eucohesionmonitor.
What are your data sources? How do you deal with data gaps?
The EU Cohesion Monitor relies on datasets that are publicly available. The most prominent sources include Eurostat and Eurobarometer surveys.
Where there are gaps in the primary data we use proxy data to cover them. For example, if a statistic is not available for 2017, we use the closest data available, say 2016. Similarly, when no data is available from other years at all, we use data from proxy countries, e.g. using Cyprus data for Malta.
The EU Cohesion Monitor was compiled with the goal to minimise these approximations.
Do you weigh your data?
We only weigh data where we see a compelling reason. For ex-ample, the maximum score in the ‘Security’ indicator is 7 points rather than 10. The scale ends at seven because stronger cooperation and deeper integra-tion in the area of security and defence is part of ongoing policy debates.
The scaling has to give room for such steps and may need to be adjusted in future editions of the EU Cohesion Monitor.
Overall Results Countriesecfr.eu/eucohesionmonitor Intro RankingsDesign
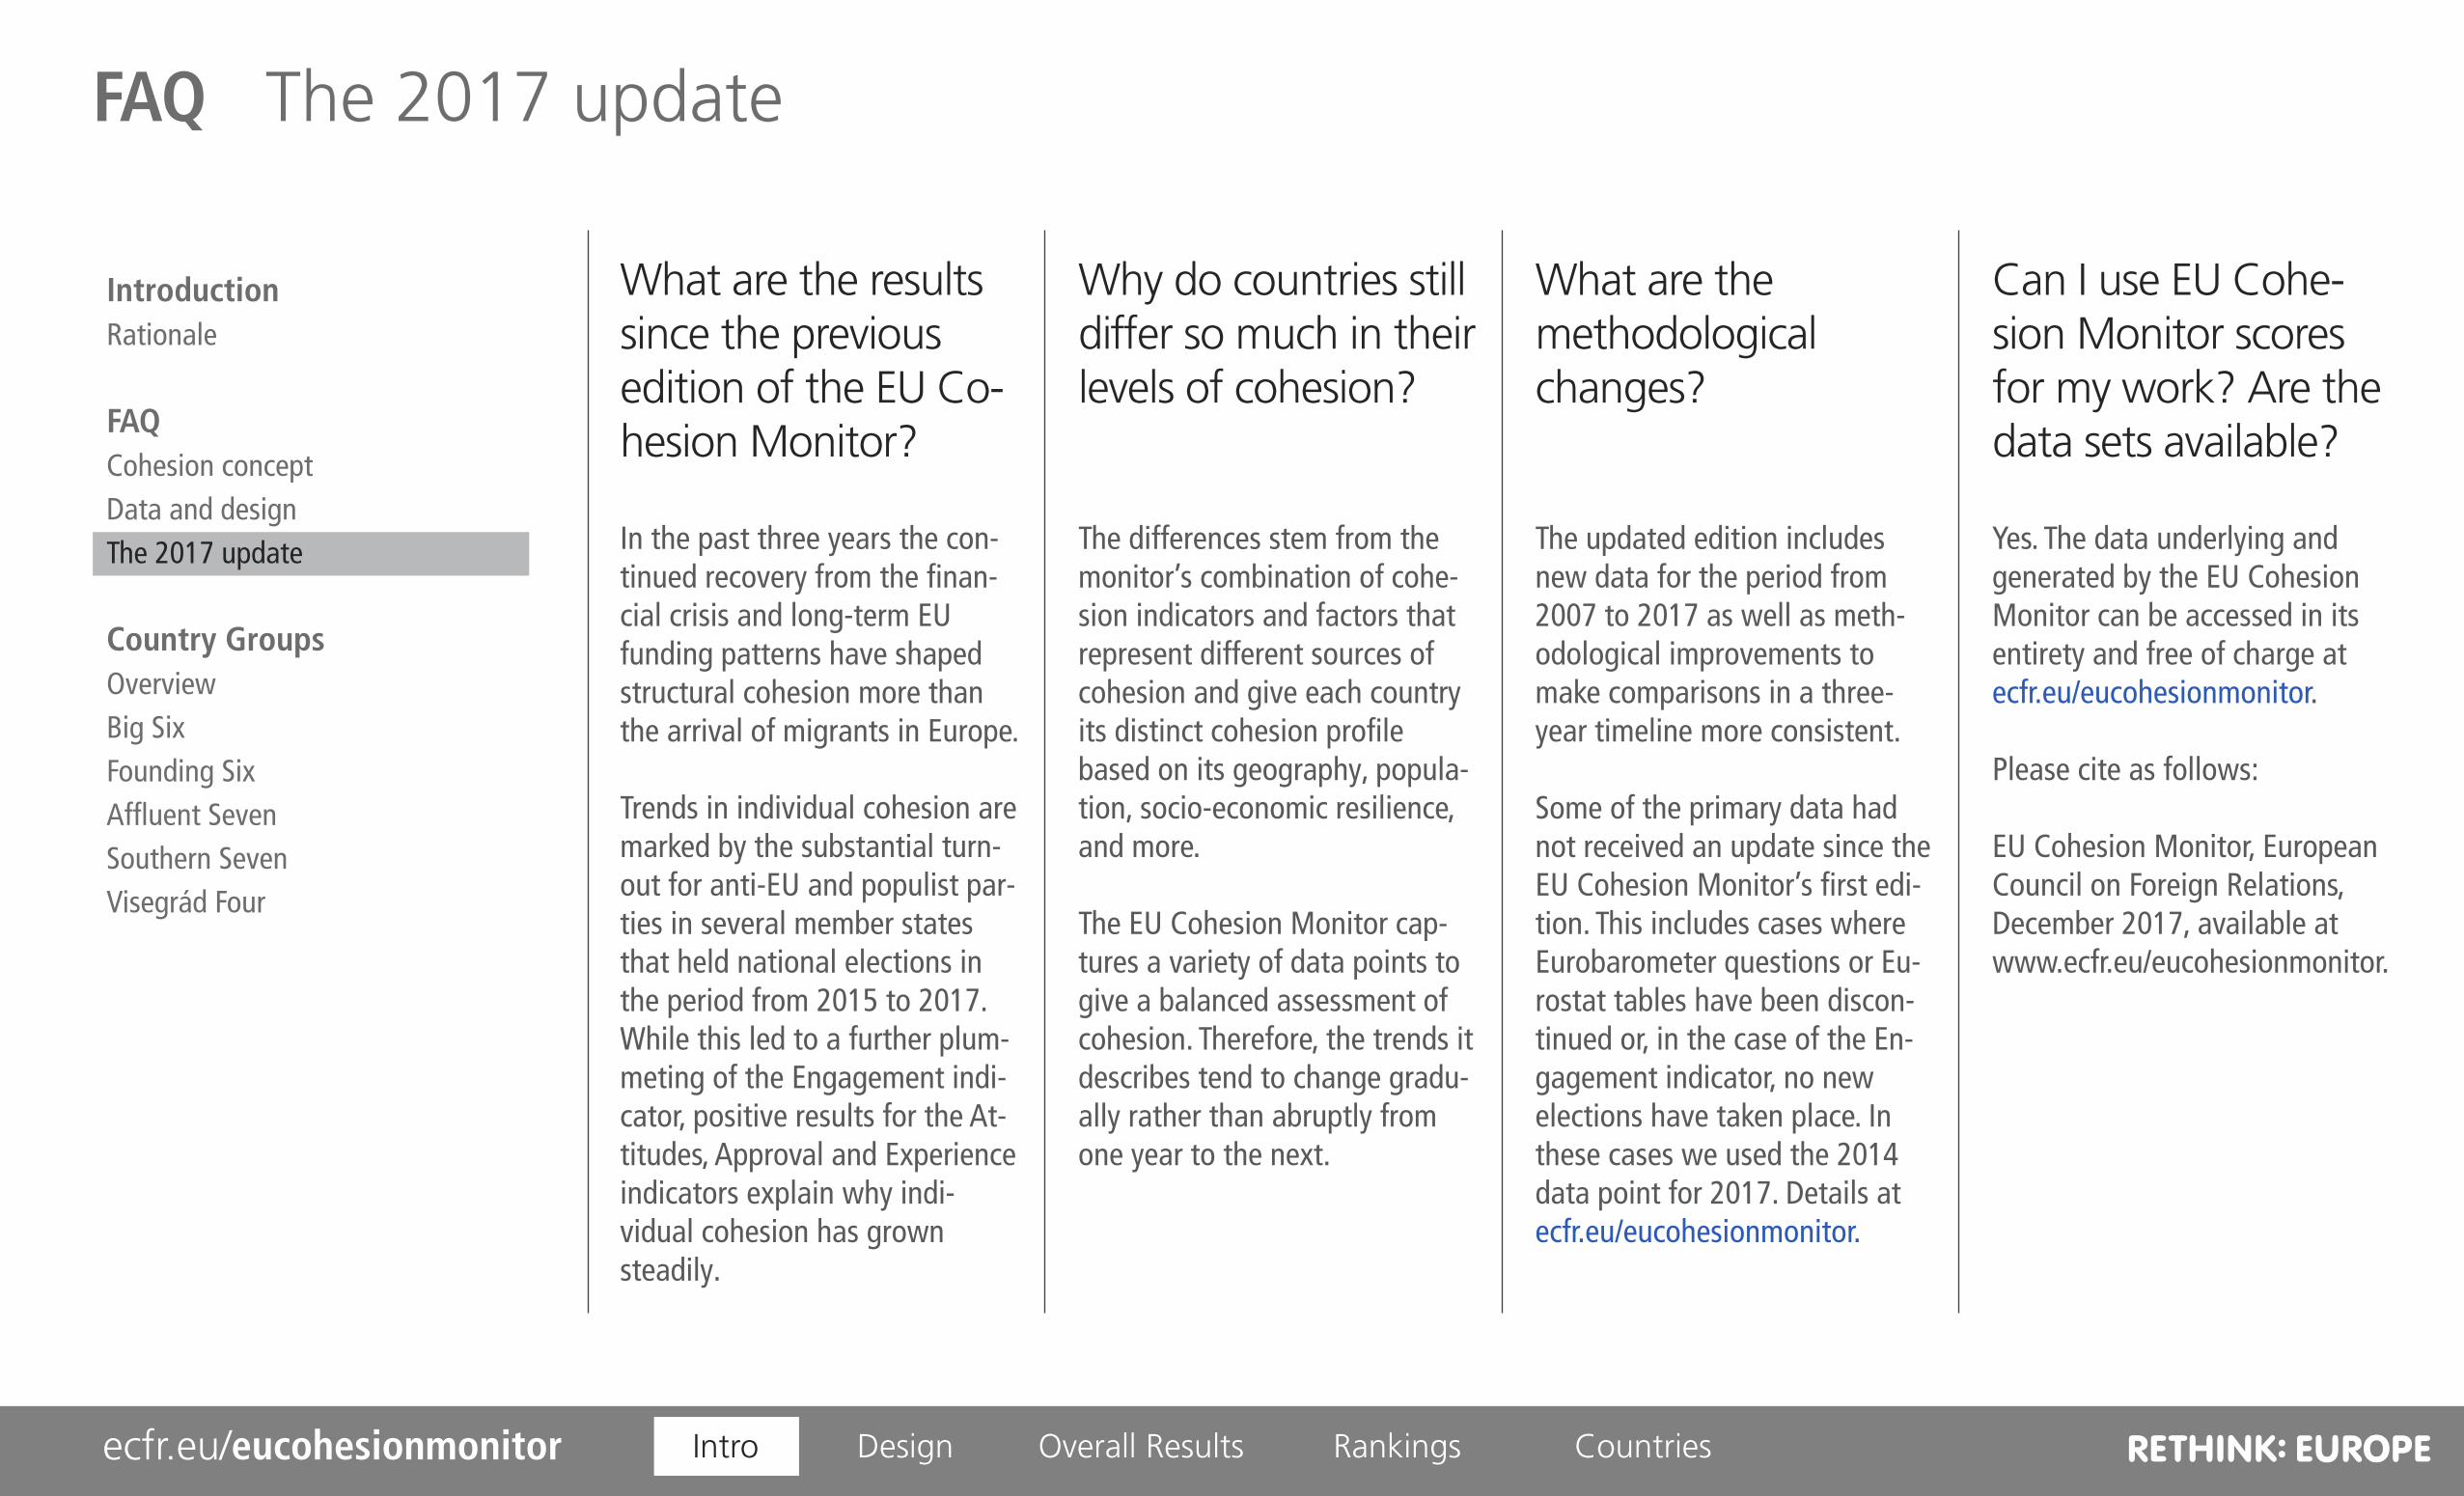
Can I use EU Cohe-sion Monitor scores for my work? Are the data sets available?
Yes. The data underlying and generated by the EU Cohesion Monitor can be accessed in its entirety and free of charge at ecfr.eu/eucohesionmonitor.
Please cite as follows:
EU Cohesion Monitor, European Council on Foreign Relations, December 2017, available at www.ecfr.eu/eucohesionmonitor.
FAQ The 2017 update
IntroductionRationale
FAQCohesion conceptData and designThe 2017 update
Country GroupsOverviewBig SixFounding SixAffluent SevenSouthern SevenVisegrád Four
What are the methodological changes?
The updated edition includes new data for the period from 2007 to 2017 as well as meth-odological improvements to make comparisons in a three-year timeline more consistent.
Some of the primary data had not received an update since the EU Cohesion Monitor’s first edi-tion. This includes cases where Eurobarometer questions or Eu-rostat tables have been discon-tinued or, in the case of the En-gagement indicator, no new elections have taken place. In these cases we used the 2014 data point for 2017. Details atecfr.eu/eucohesionmonitor.
Why do countries still differ so much in their levels of cohesion?
The differences stem from the monitor’s combination of cohe-sion indicators and factors that represent different sources of cohesion and give each country its distinct cohesion profile based on its geography, popula-tion, socio-economic resilience, and more.
The EU Cohesion Monitor cap-tures a variety of data points to give a balanced assessment of cohesion. Therefore, the trends it describes tend to change gradu-ally rather than abruptly from one year to the next.
What are the results since the previous edition of the EU Co-hesion Monitor?
In the past three years the con-tinued recovery from the finan-cial crisis and long-term EU funding patterns have shaped structural cohesion more than the arrival of migrants in Europe.
Trends in individual cohesion are marked by the substantial turn-out for anti-EU and populist par-ties in several member states that held national elections in the period from 2015 to 2017. While this led to a further plum-meting of the Engagement indi-cator, positive results for the At-titudes, Approval and Experience indicators explain why indi-vidual cohesion has grown steadily.
Overall Results Countriesecfr.eu/eucohesionmonitor Intro RankingsDesign

Country Groups Overview
France
Italy
Germany
Spain
Poland
UnitedKingdom
Greece
Portugal
Malta
Cyprus
Belgium
Luxembourg
Netherlands
Czech Rep.
Hungary
SlovakiaAustria
Denmark
Sweden
FinlandSlovenia
Croatia
Bulgaria
Romania
Estonia
Latvia
IrelandLithuania
Big SixFounding Six
Affluent Seven
Southern Seven
Vise-grád Four
Five Country Groups
Results are not only presented for individual EU member states, but also for five country groups. The illustration shows each group’s composition, the overlap between them, and the countries that do not fall into any of the five groups.
The impact of country groups on the politics of the EU and Euro-pean integration at large has been changing over time and has often depended on the policy issue at stake. Some groups are more formalized or institutional-ized than others.
Group data is provided by com-bining the scores of their respec-tive member countries.
IntroductionRationale
FAQCohesion conceptData and designThe 2017 update
Country GroupsOverviewBig SixFounding SixAffluent SevenSouthern SevenVisegrád Four
Overall Results Countriesecfr.eu/eucohesionmonitor Intro RankingsDesign

Country Groups Big Six
Share of PopulationThe EU Powerhouse
The term “Big Six” refers to France, Ger-many, Italy, Spain, Poland and the UK. These countries are considered major European powers.
After Brexit, the group will eventually turn into the Big Five. Even without the UK, it will continue to be the EU powerhouse.
Share of Military Spending
Share of GDP
Employed to Unemployed
70%
80%
75%
Spain
Poland
Italy
UK
France
Germany
Spain
Poland
Italy
UK
France
Germany
Spain
Poland
Italy
Germany
France
UK
23%
21%
16%
10%
6%
4%
16%
13%
13%
12%9%
7%
10:1Big Six
Germany
UK
Poland
France
Italy
Spain
10:1
21:1
18:1
13:1
9:1
8:1
5:1
21%
18%
15%11%
7%
3%
Big Six
IntroductionRationale
FAQCohesion conceptData and designThe 2017 update
Country GroupsOverviewBig SixFounding SixAffluent SevenSouthern SevenVisegrád Four
Sources: Eurostat (Population 2015), World Bank (GDP 2015), SIPRI Milex Data (Military Spending 2015), Eurostat (Ratio of employed to unemployed 2015).
Overall Results Countriesecfr.eu/eucohesionmonitor Intro RankingsDesign
Country Groups Founding Six
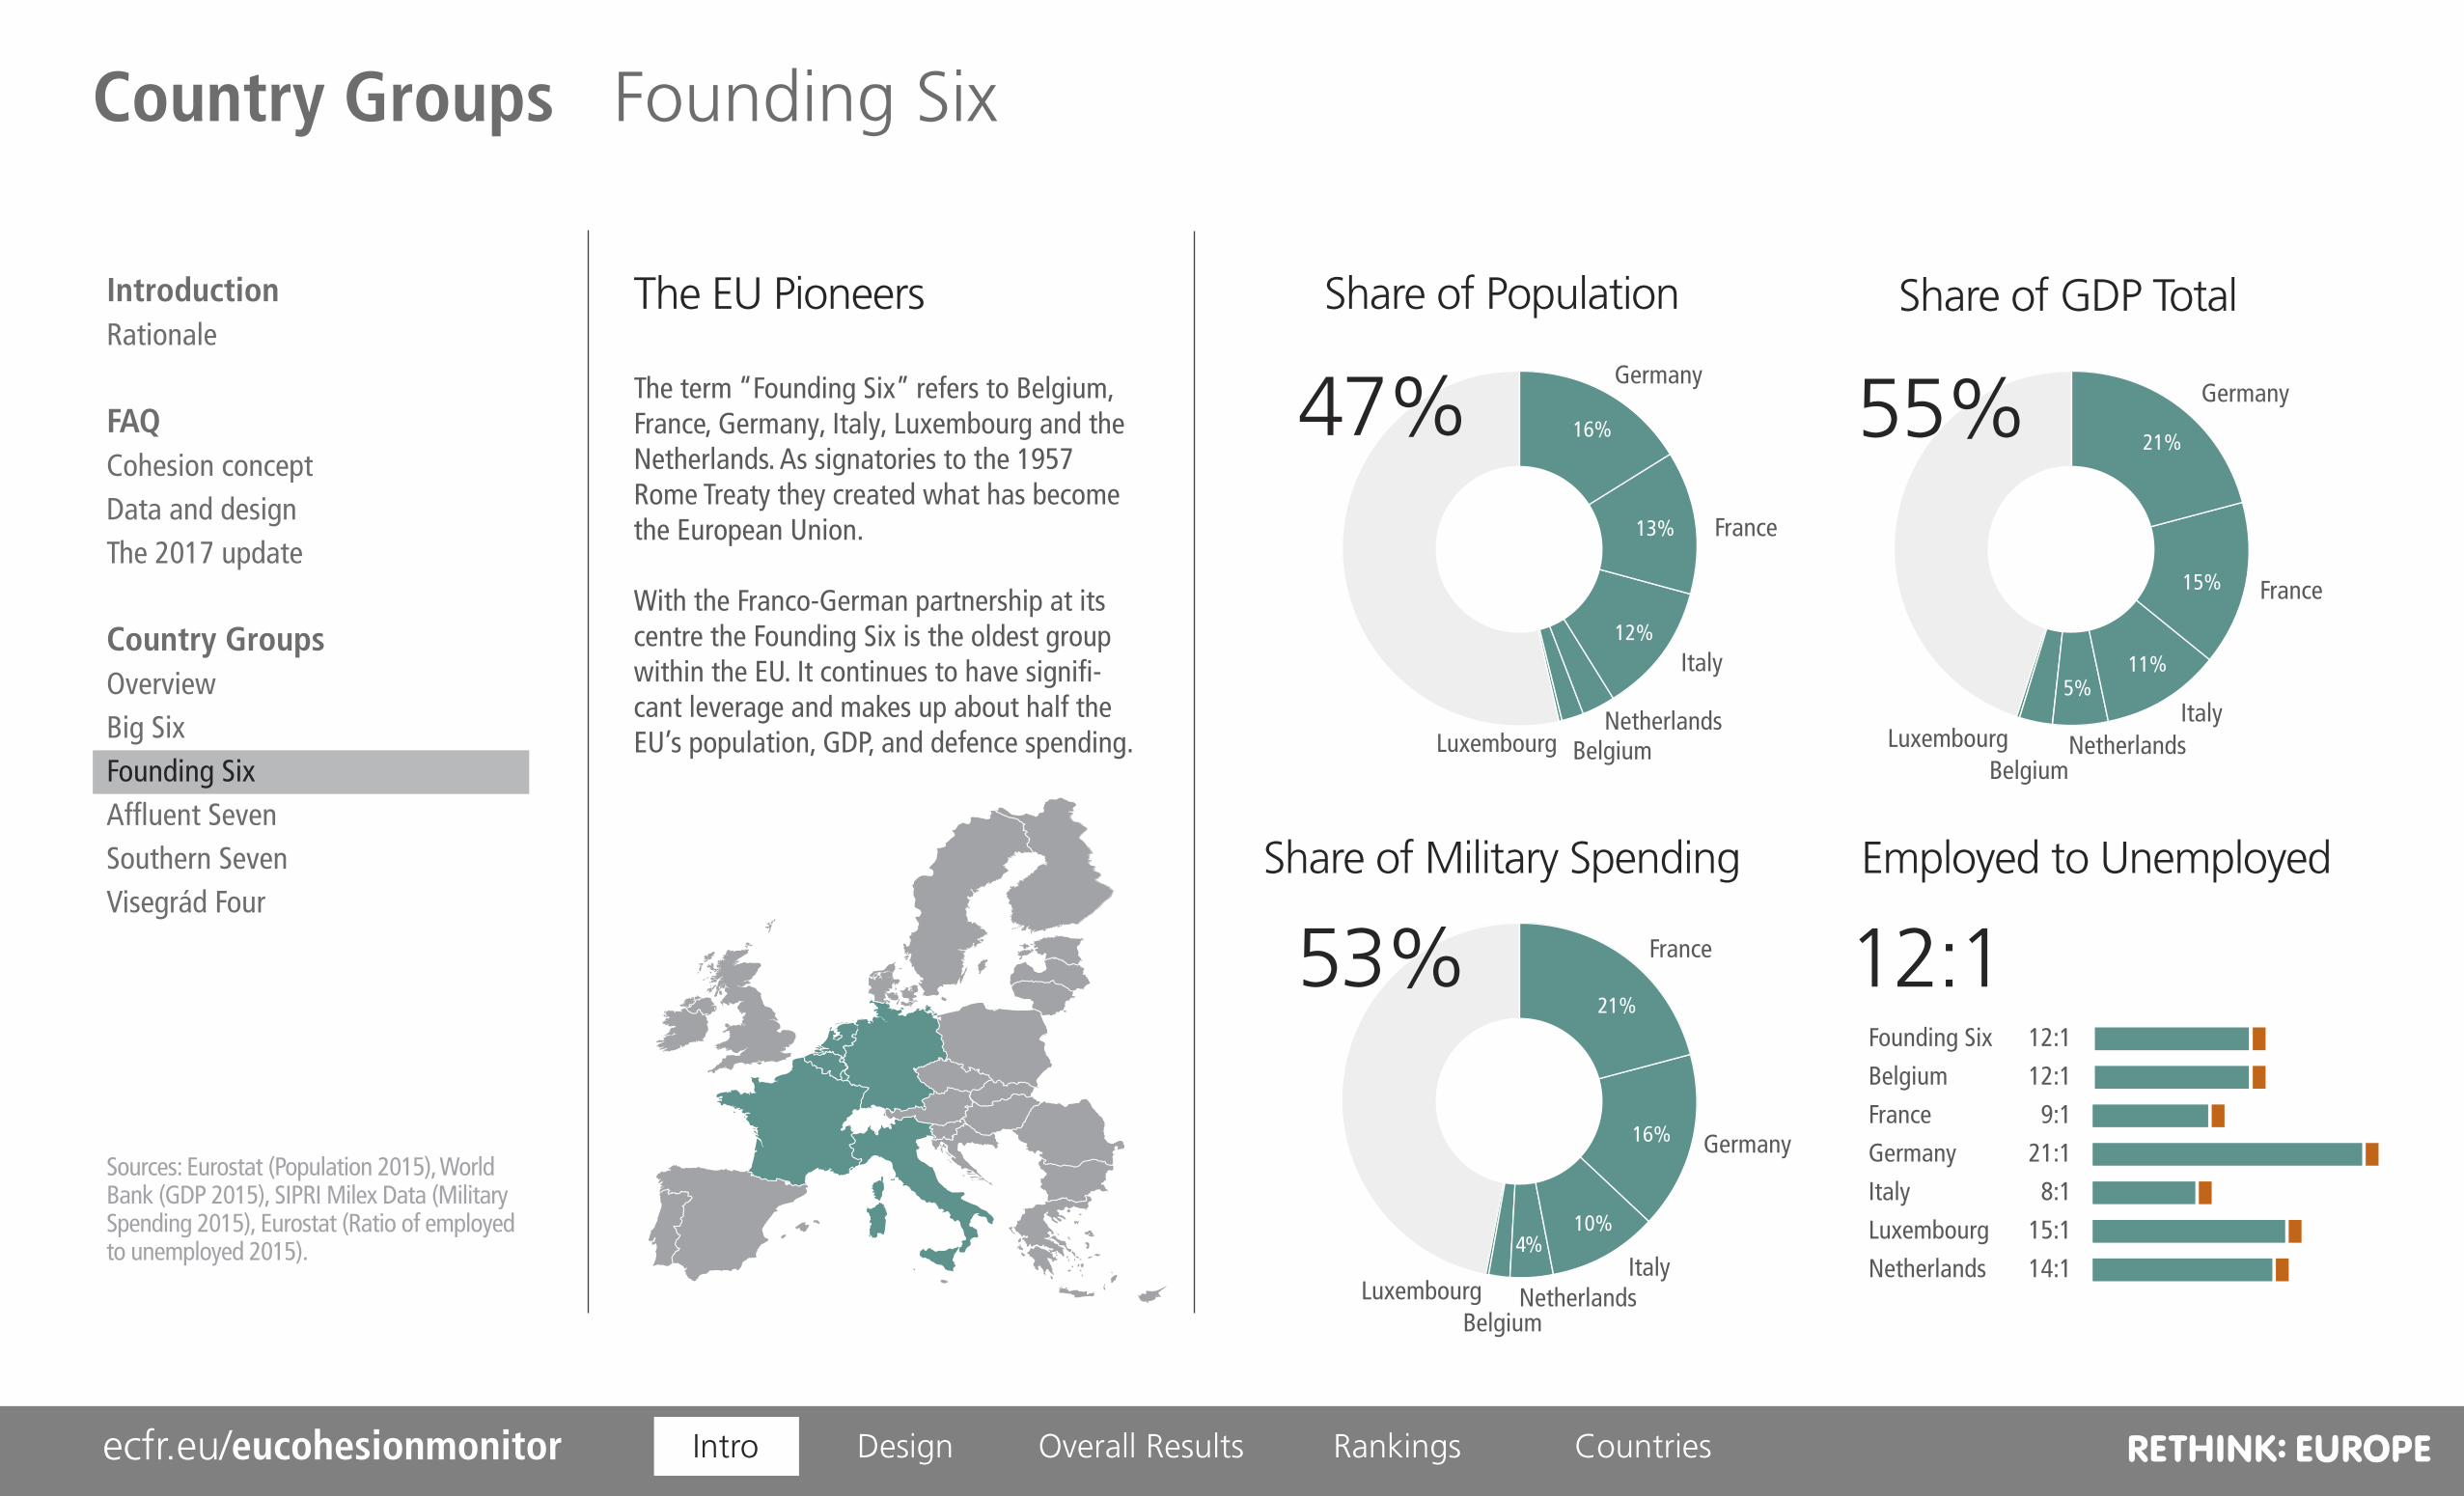
Share of PopulationThe EU Pioneers
The term “Founding Six” refers to Belgium, France, Germany, Italy, Luxembourg and the Netherlands. As signatories to the 1957 Rome Treaty they created what has become the European Union.
With the Franco-German partnership at its centre the Founding Six is the oldest group within the EU. It continues to have signifi-cant leverage and makes up about half the EU’s population, GDP, and defence spending.
Share of Military Spending
Share of GDP Total
Employed to Unemployed
47%
53%
55%
Italy
France
Germany
Italy
France
Germany
Italy
Germany
France
21%
16%
10%4%
16%
13%
12%
12:1Founding Six
Belgium
France
Germany
Italy
Luxembourg
Netherlands
12:1
12:1
9:1
21:1
8:1
15:1
14:1
21%
15%
11%5%
NetherlandsBelgium
Luxembourg
NetherlandsBelgium
Luxembourg
NetherlandsBelgiumLuxembourg
Founding Six
IntroductionRationale
FAQCohesion conceptData and designThe 2017 update
Country GroupsOverviewBig SixFounding SixAffluent SevenSouthern SevenVisegrád Four
Sources: Eurostat (Population 2015), World Bank (GDP 2015), SIPRI Milex Data (Military Spending 2015), Eurostat (Ratio of employed to unemployed 2015).
Overall Results Countriesecfr.eu/eucohesionmonitor Intro RankingsDesign

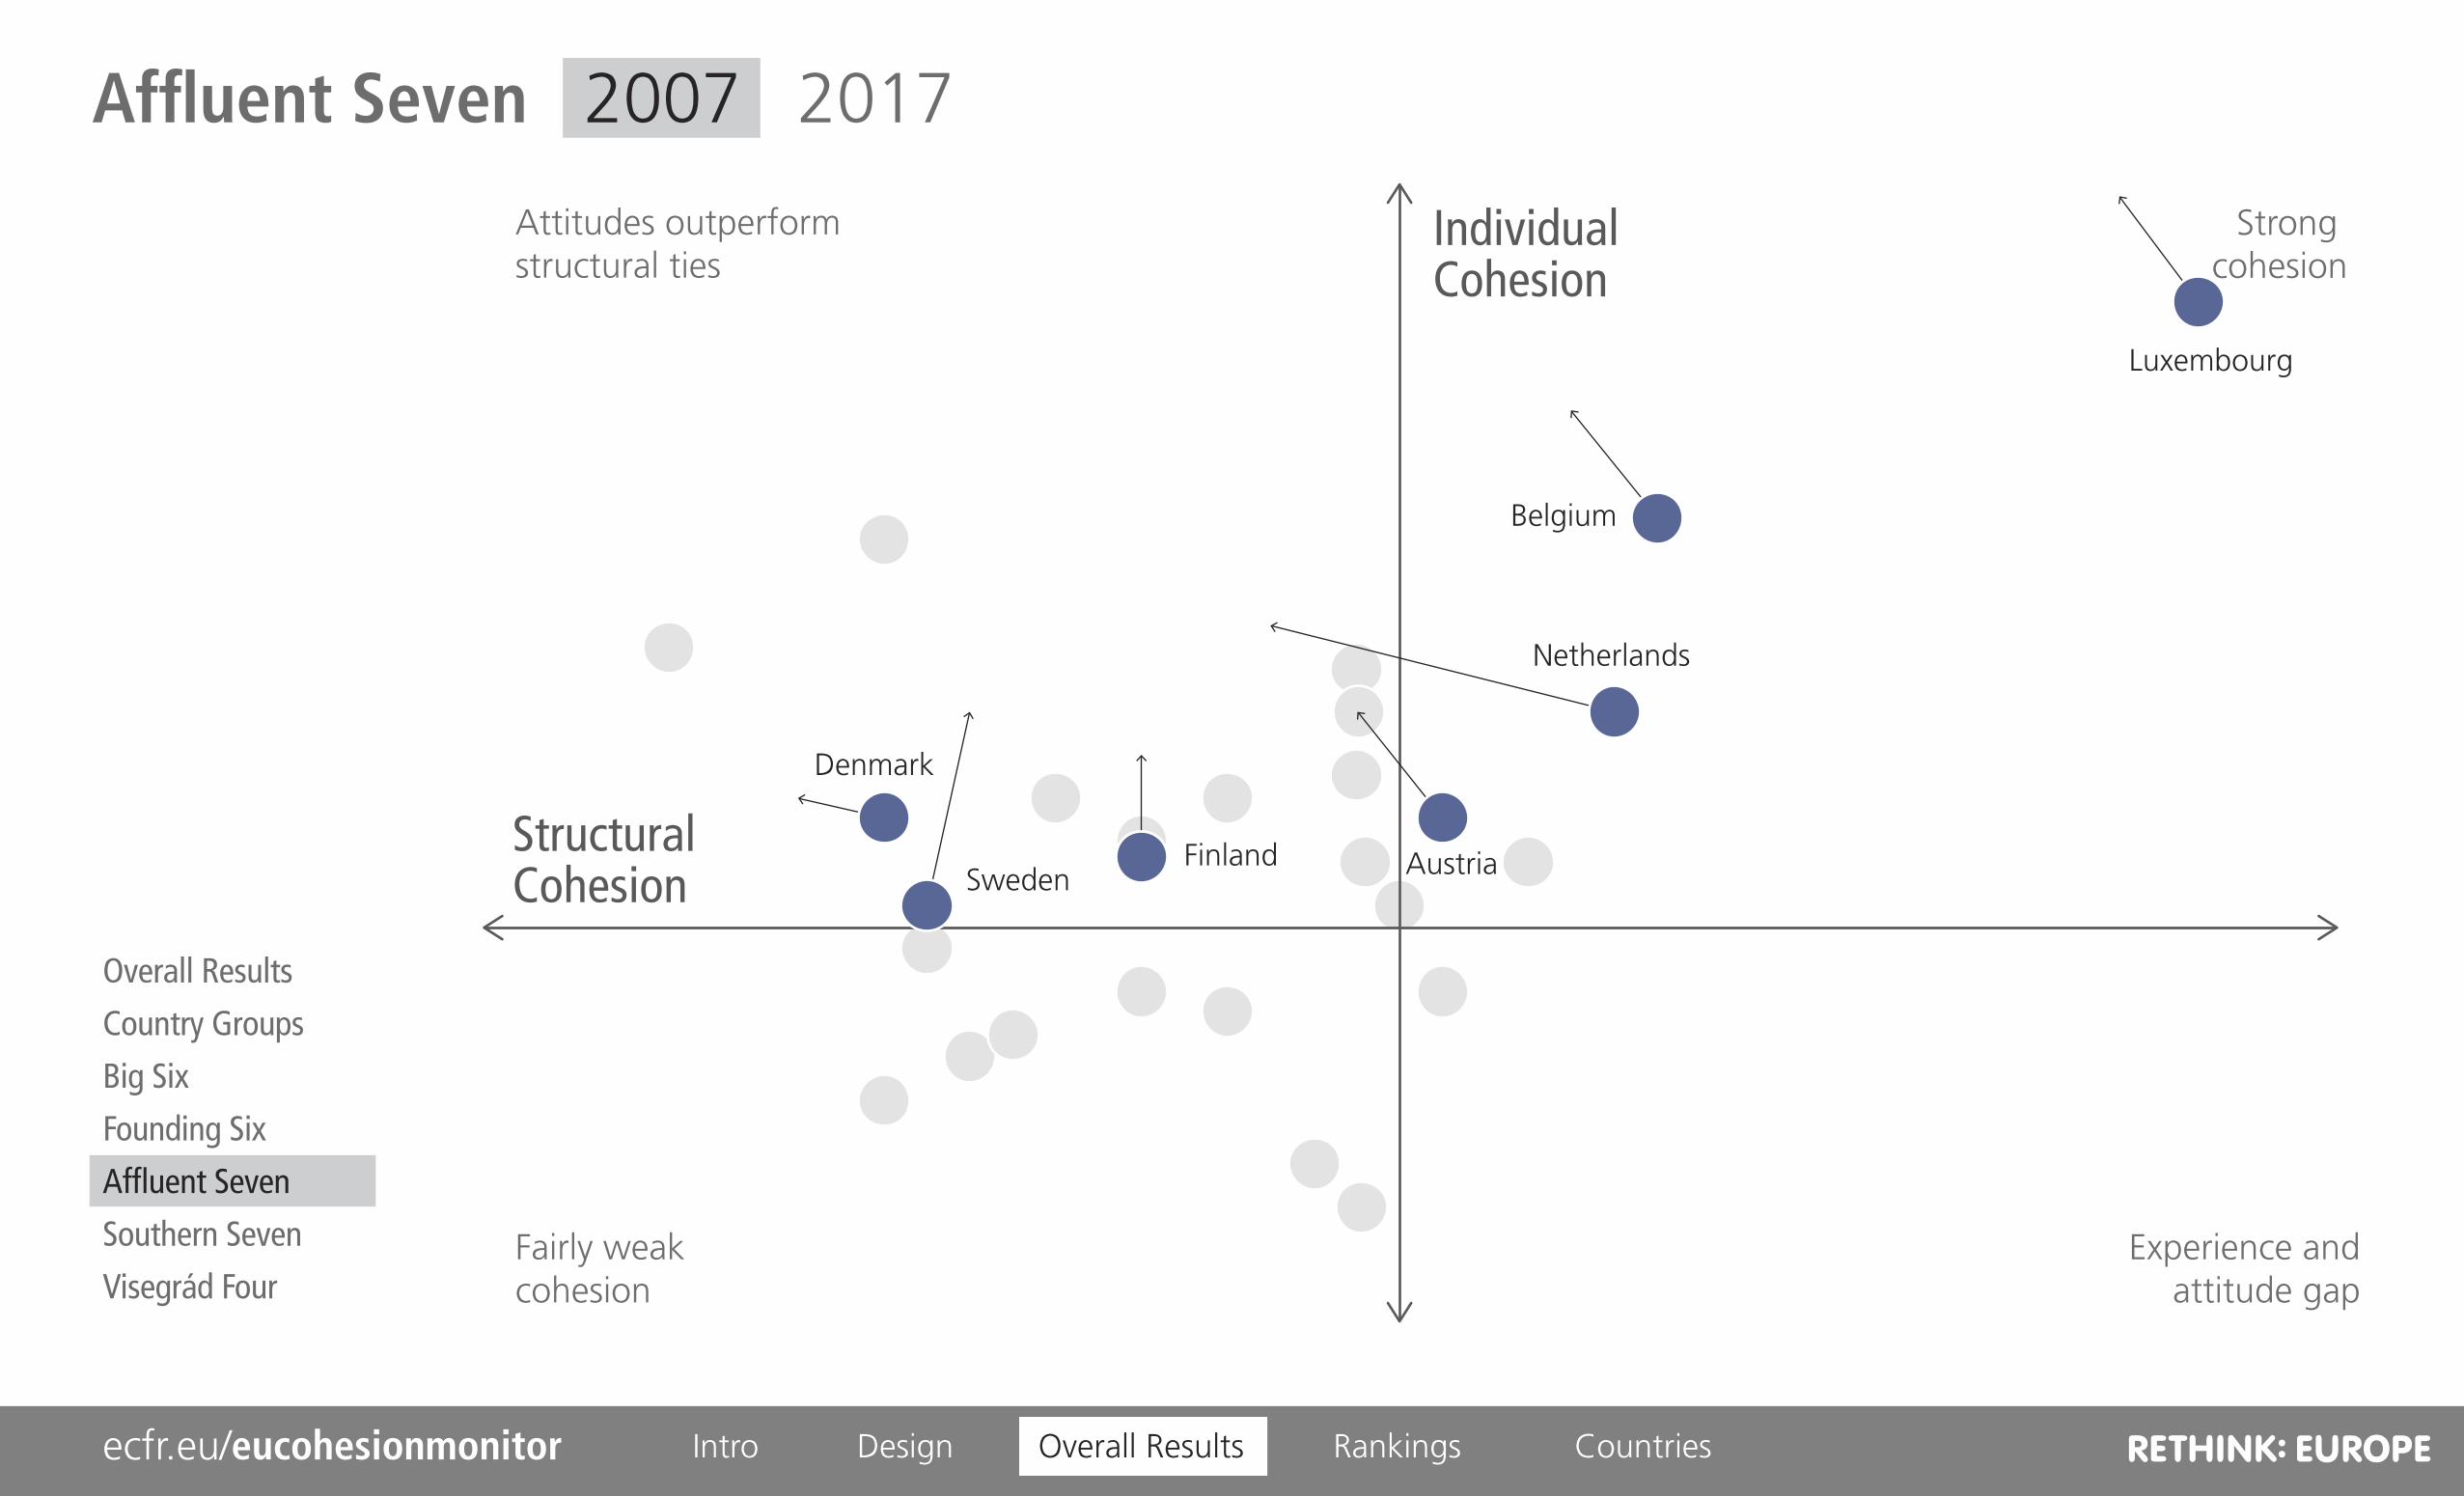
Country Groups Affluent Seven
Share of PopulationStrength in Numbers
The term “Affluent Seven“ refers to the group of seven countries consisting of Aus-tria, the three Nordic EU members of Den-mark, Finland, and Sweden, and the Benelux countries.
This group has special economic clout among the EU28. Each one of the seven maintains an employment ratio of at least 10 to 1. In addition, the group's disposable income per capita is significantly above the averages of both the EU and the Big Six.
Share of Military Spending
Share of GDP Total
Employed to Unemployed
11%
11%
16%
14:1Affluent Seven
Austria
Belgium
Denmark
Finland
Luxembourg
Netherlands
Sweden
14:1
17:1
12:1
16:1
10:1
15:1
14:1
13:1
NetherlandsAustria
BelgiumSweden
DenmarkFinland
Luxembourg
NetherlandsBelgiumSwedenAustria
DenmarkFinland
Luxembourg
NetherlandsBelgiumSwedenAustria
DenmarkFinland
Luxembourg
5%
4%
Affluent Seven
IntroductionRationale
FAQCohesion conceptData and designThe 2017 update
Country GroupsOverviewBig SixFounding SixAffluent SevenSouthern SevenVisegrád Four
Sources: Eurostat (Population 2015), World Bank (GDP 2015), SIPRI Milex Data (Military Spending 2015), Eurostat (Ratio of employed to unemployed 2015).
Overall Results Countriesecfr.eu/eucohesionmonitor Intro RankingsDesign

Country Groups Southern Seven
Share of PopulationMediterranean Shores
The term “Southern Seven“ refers to the group of seven countries consisting of Cyprus, France, Greece, Italy, Malta, Portugal and Spain.
Despite being disparate in size, the countries in this group share socio-economic similari-ties. In recent years political initiatives have attempted to institutionalize this group. The Southern Seven have been particularly af-fected by the Eurozone debt crisis and in-creasing migration to Europe.
Share of Military Spending
Share of GDP Total
Employed to Unemployed
38%
41%
36%
Spain
Cyprus
Italy
France
13%
12%
9%
7:1Southern Seven
Cyprus
France
Greece
Italy
Malta
Portugal
Spain
7:1
7:1
9:1
4:1
8:1
18:1
8:1
5:1
GreecePortugal
Malta
Spain
Cyprus
Italy
France
21%
10%
6%
GreecePortugal
Malta
Spain
Cyprus
Italy
France
15%
11%
7%
GreecePortugal
Malta (2013)
Southern Seven
IntroductionRationale
FAQCohesion conceptData and designThe 2017 update
Country GroupsOverviewBig SixFounding SixAffluent SevenSouthern SevenVisegrád Four
Sources: Eurostat (Population 2015), World Bank (GDP 2015), SIPRI Milex Data (Military Spending 2015), Eurostat (Ratio of employed to unemployed 2015).
Overall Results Countriesecfr.eu/eucohesionmonitor Intro RankingsDesign

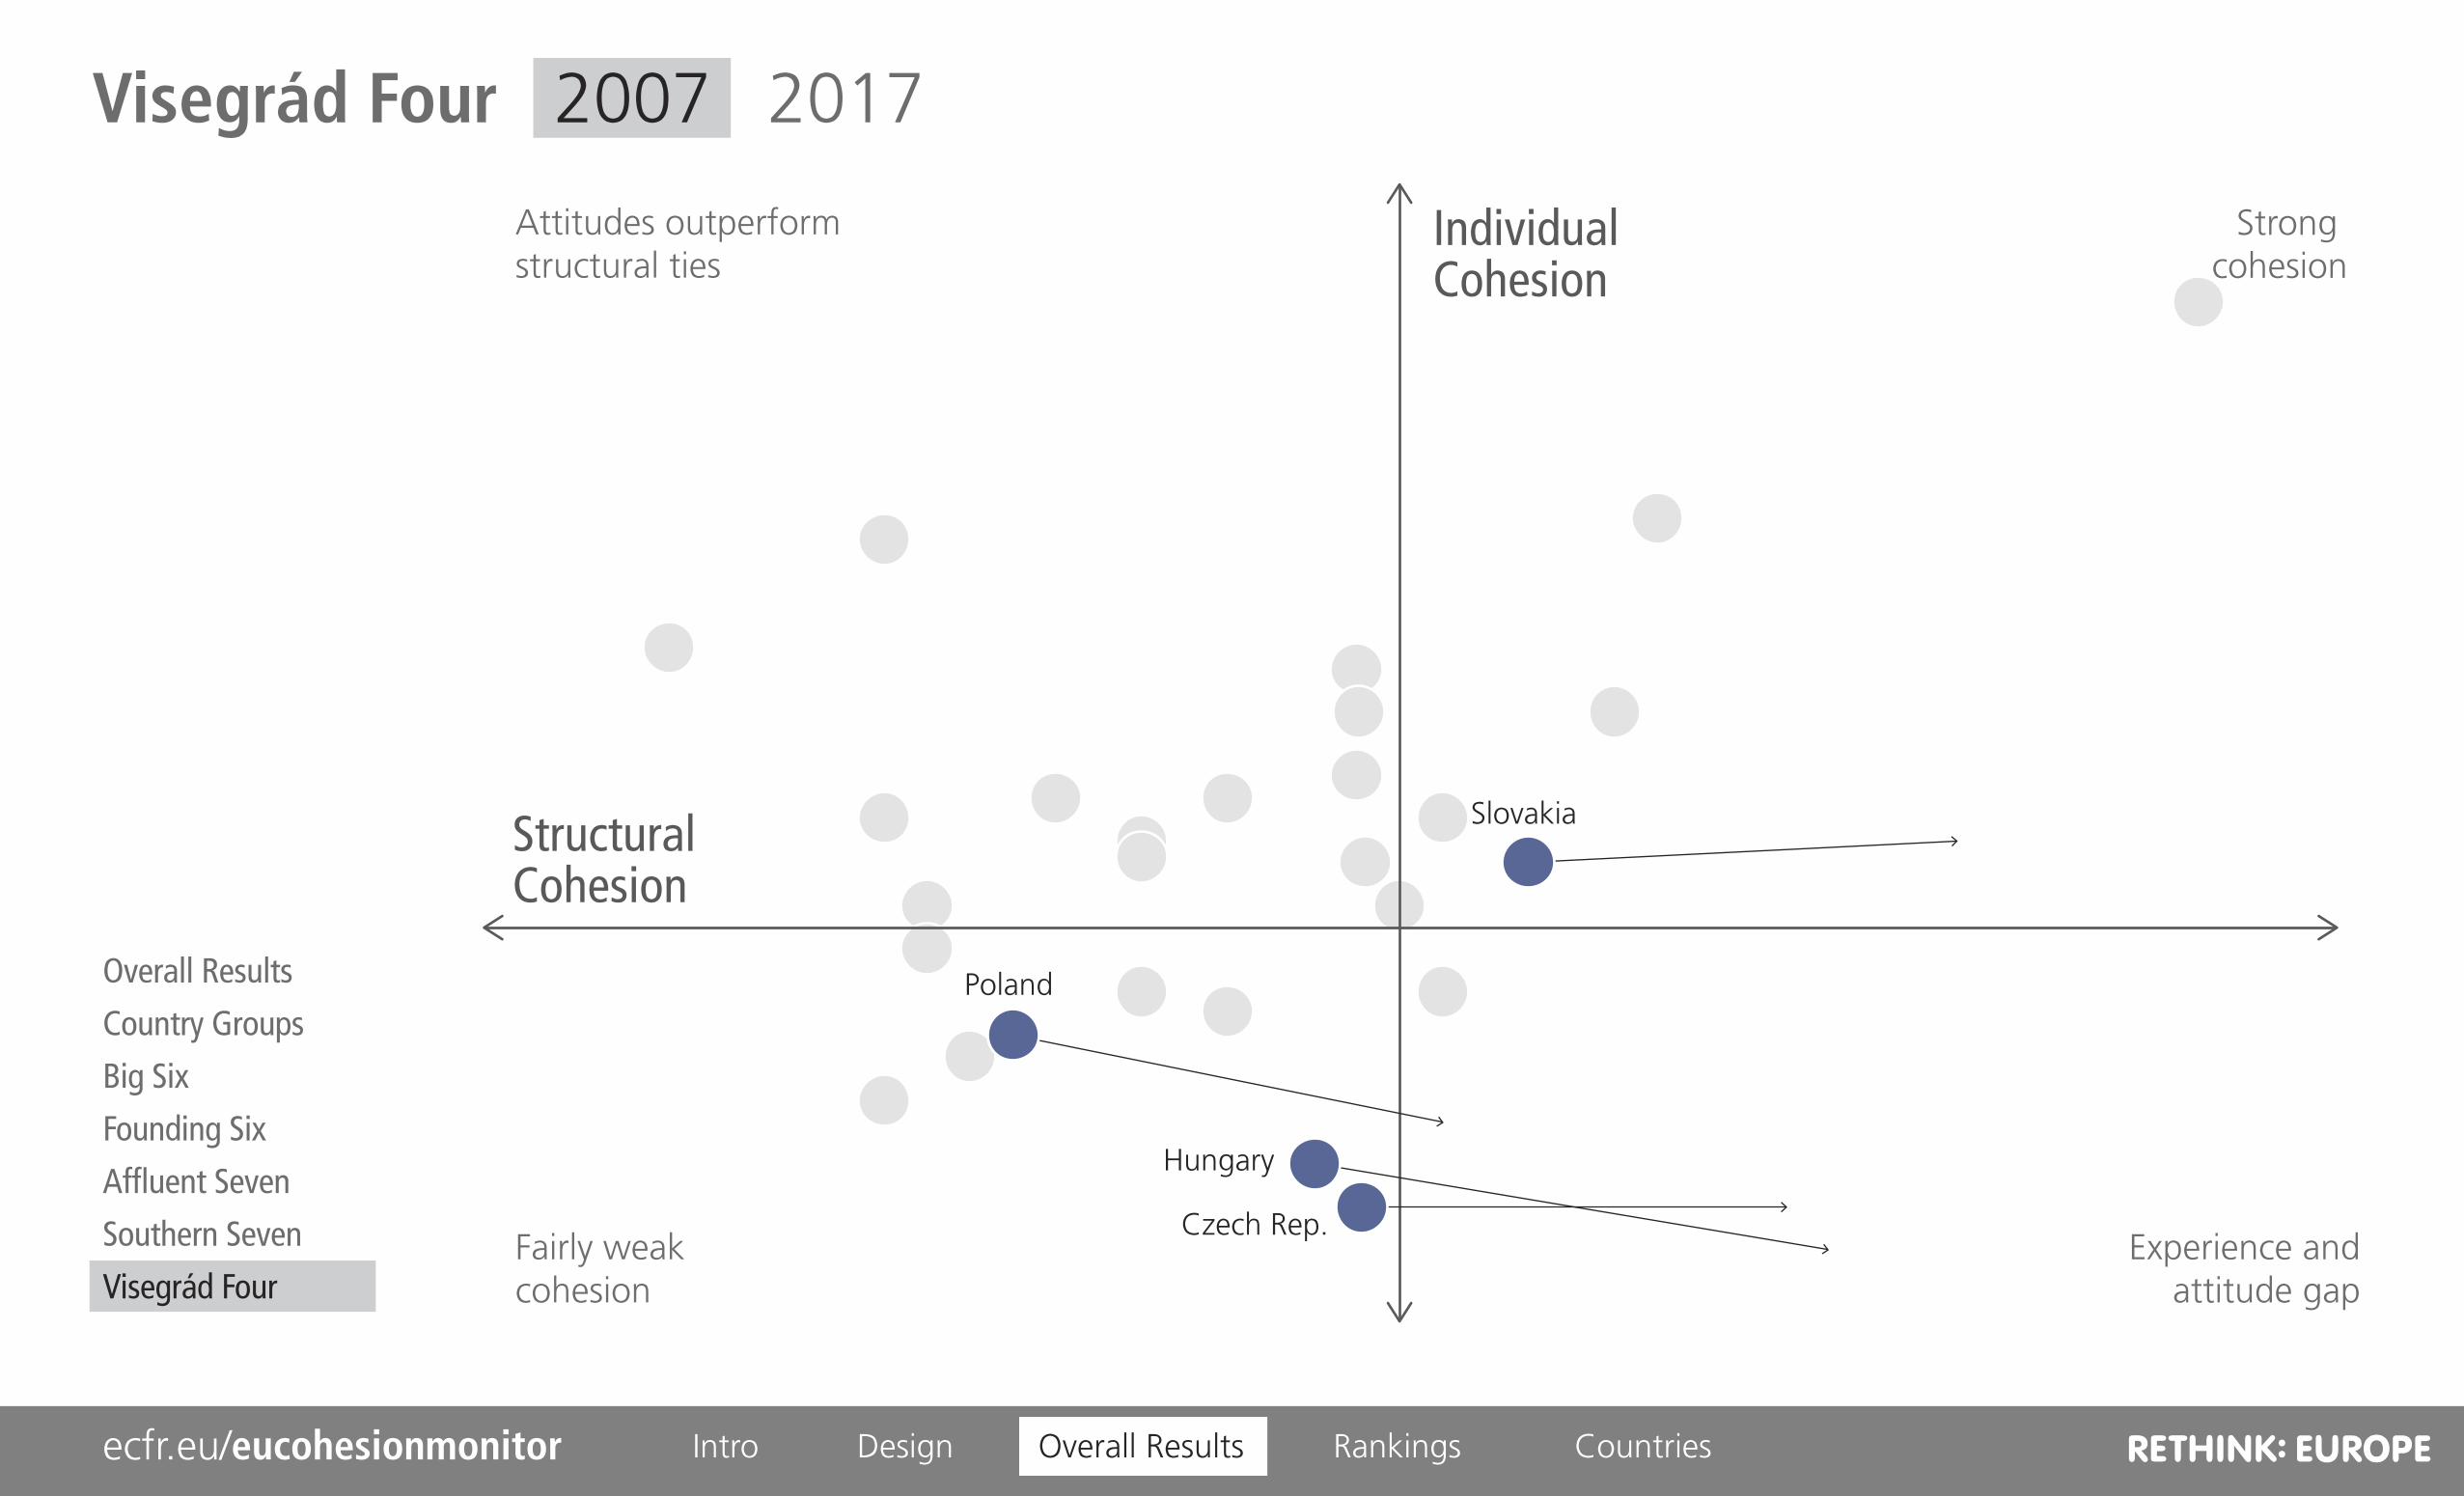
Country Groups Visegrád Four
Share of PopulationThe New East
The term “Visegrád Four” refers to the group of countries consisting of the Czech Republic, Hungary, Poland and Slovakia. All four joined the European Union together in 2004.
More frequently than other groups the Viseg-rád Four act as a political coalition within the European Union. Their cooperation is based on common cultural values, history and a similar outlook on economic and security policy.
Share of Military Spending
Share of GDP Total
Employed to Unemployed
13%
6%
5%
13:1Visegrád Four
Czech Rep.
Hungary
Poland
Slovakia
13:1
19:1
15:1
13:1
9:1
PolandCzech Rep.
HungarySlovakia
PolandCzech Rep.
HungarySlovakia
PolandCzech Rep.
HungarySlovakia
4%
7%
Visegrád Four
IntroductionRationale
FAQCohesion conceptData and designThe 2017 update
Country GroupsOverviewBig SixFounding SixAffluent SevenSouthern SevenVisegrád Four
Sources: Eurostat (Population 2015), World Bank (GDP 2015), SIPRI Milex Data (Military Spending 2015), Eurostat (Ratio of employed to unemployed 2015).
Overall Results Countriesecfr.eu/eucohesionmonitor Intro RankingsDesign

EXPERIENCE
ENGAGEMENT
ATTITUDES
APPROVAL
Citizens of other EU countries % of populationVisited another EU country
Socialised with people from other EU countryForeign language skills
Turnout in EP electionsAnti-EU/populist share in EP elections
Anti-EU/populist share in national elections
Trust in EUPositive image of EU
National interest well taken into accountPerception as European
Support for economic and monetary unionSupport for common foreign policy
Support for common defence and security policyEuro among most positive results of EU
Free movement among most positive results of EUPeace in Europe among most positive results of EU
Individual Cohesion
RESILIENCE
ECONOMIC TIES
FUNDING
NEIGHBOURHOOD
POLICY INTEGRATION
SECURITY
Disposable income per capitaDebt to GDPSocial Justice Index
EU trade to total tradeEU trade to GDP ratioEU investments to total investmentsEU investments to GDP ratio
Inflow of EU funds as % of GDPBalance of payments to EU budget
Population (share) living near bordersNon-EU neighbours
Number of opt outs
Joint commands and cooperationJoint development and procurementMultinational deployments
Structural Cohesion
EU Cohesion Monitor Design Individual Structural
Overall Results Countriesecfr.eu/eucohesionmonitor Intro RankingsDesign

EXPERIENCE
ENGAGEMENT
ATTITUDES
APPROVAL
Citizens of other EU countries % of populationVisited another EU country
Socialised with people from other EU countryForeign language skills
Turnout in EP electionsAnti-EU/populist share in EP elections
Anti-EU/populist share in national elections
Trust in EUPositive image of EU
National interest well taken into accountPerception as European
Support for economic and monetary unionSupport for common foreign policy
Support for common defence and security policyEuro among most positive results of EU
Free movement among most positive results of EUPeace in Europe among most positive results of EU
+ Citizens’ first-hand EU experience, proximity of other EU countries, and foreign language skills
+ A high turnout in elections to the European Parliament and low voting preferences for anti-EU/populist parties in the EP and national parliaments
+ Positive views on the benefits of integration and on the EU at large
+ Support for and positive views on areas of deeper integration
4 Indicators17 Factors
Individual Cohesion is strengthened by:
EU Cohesion Monitor Design Individual Structural
Overall Results Countriesecfr.eu/eucohesionmonitor Intro RankingsDesign
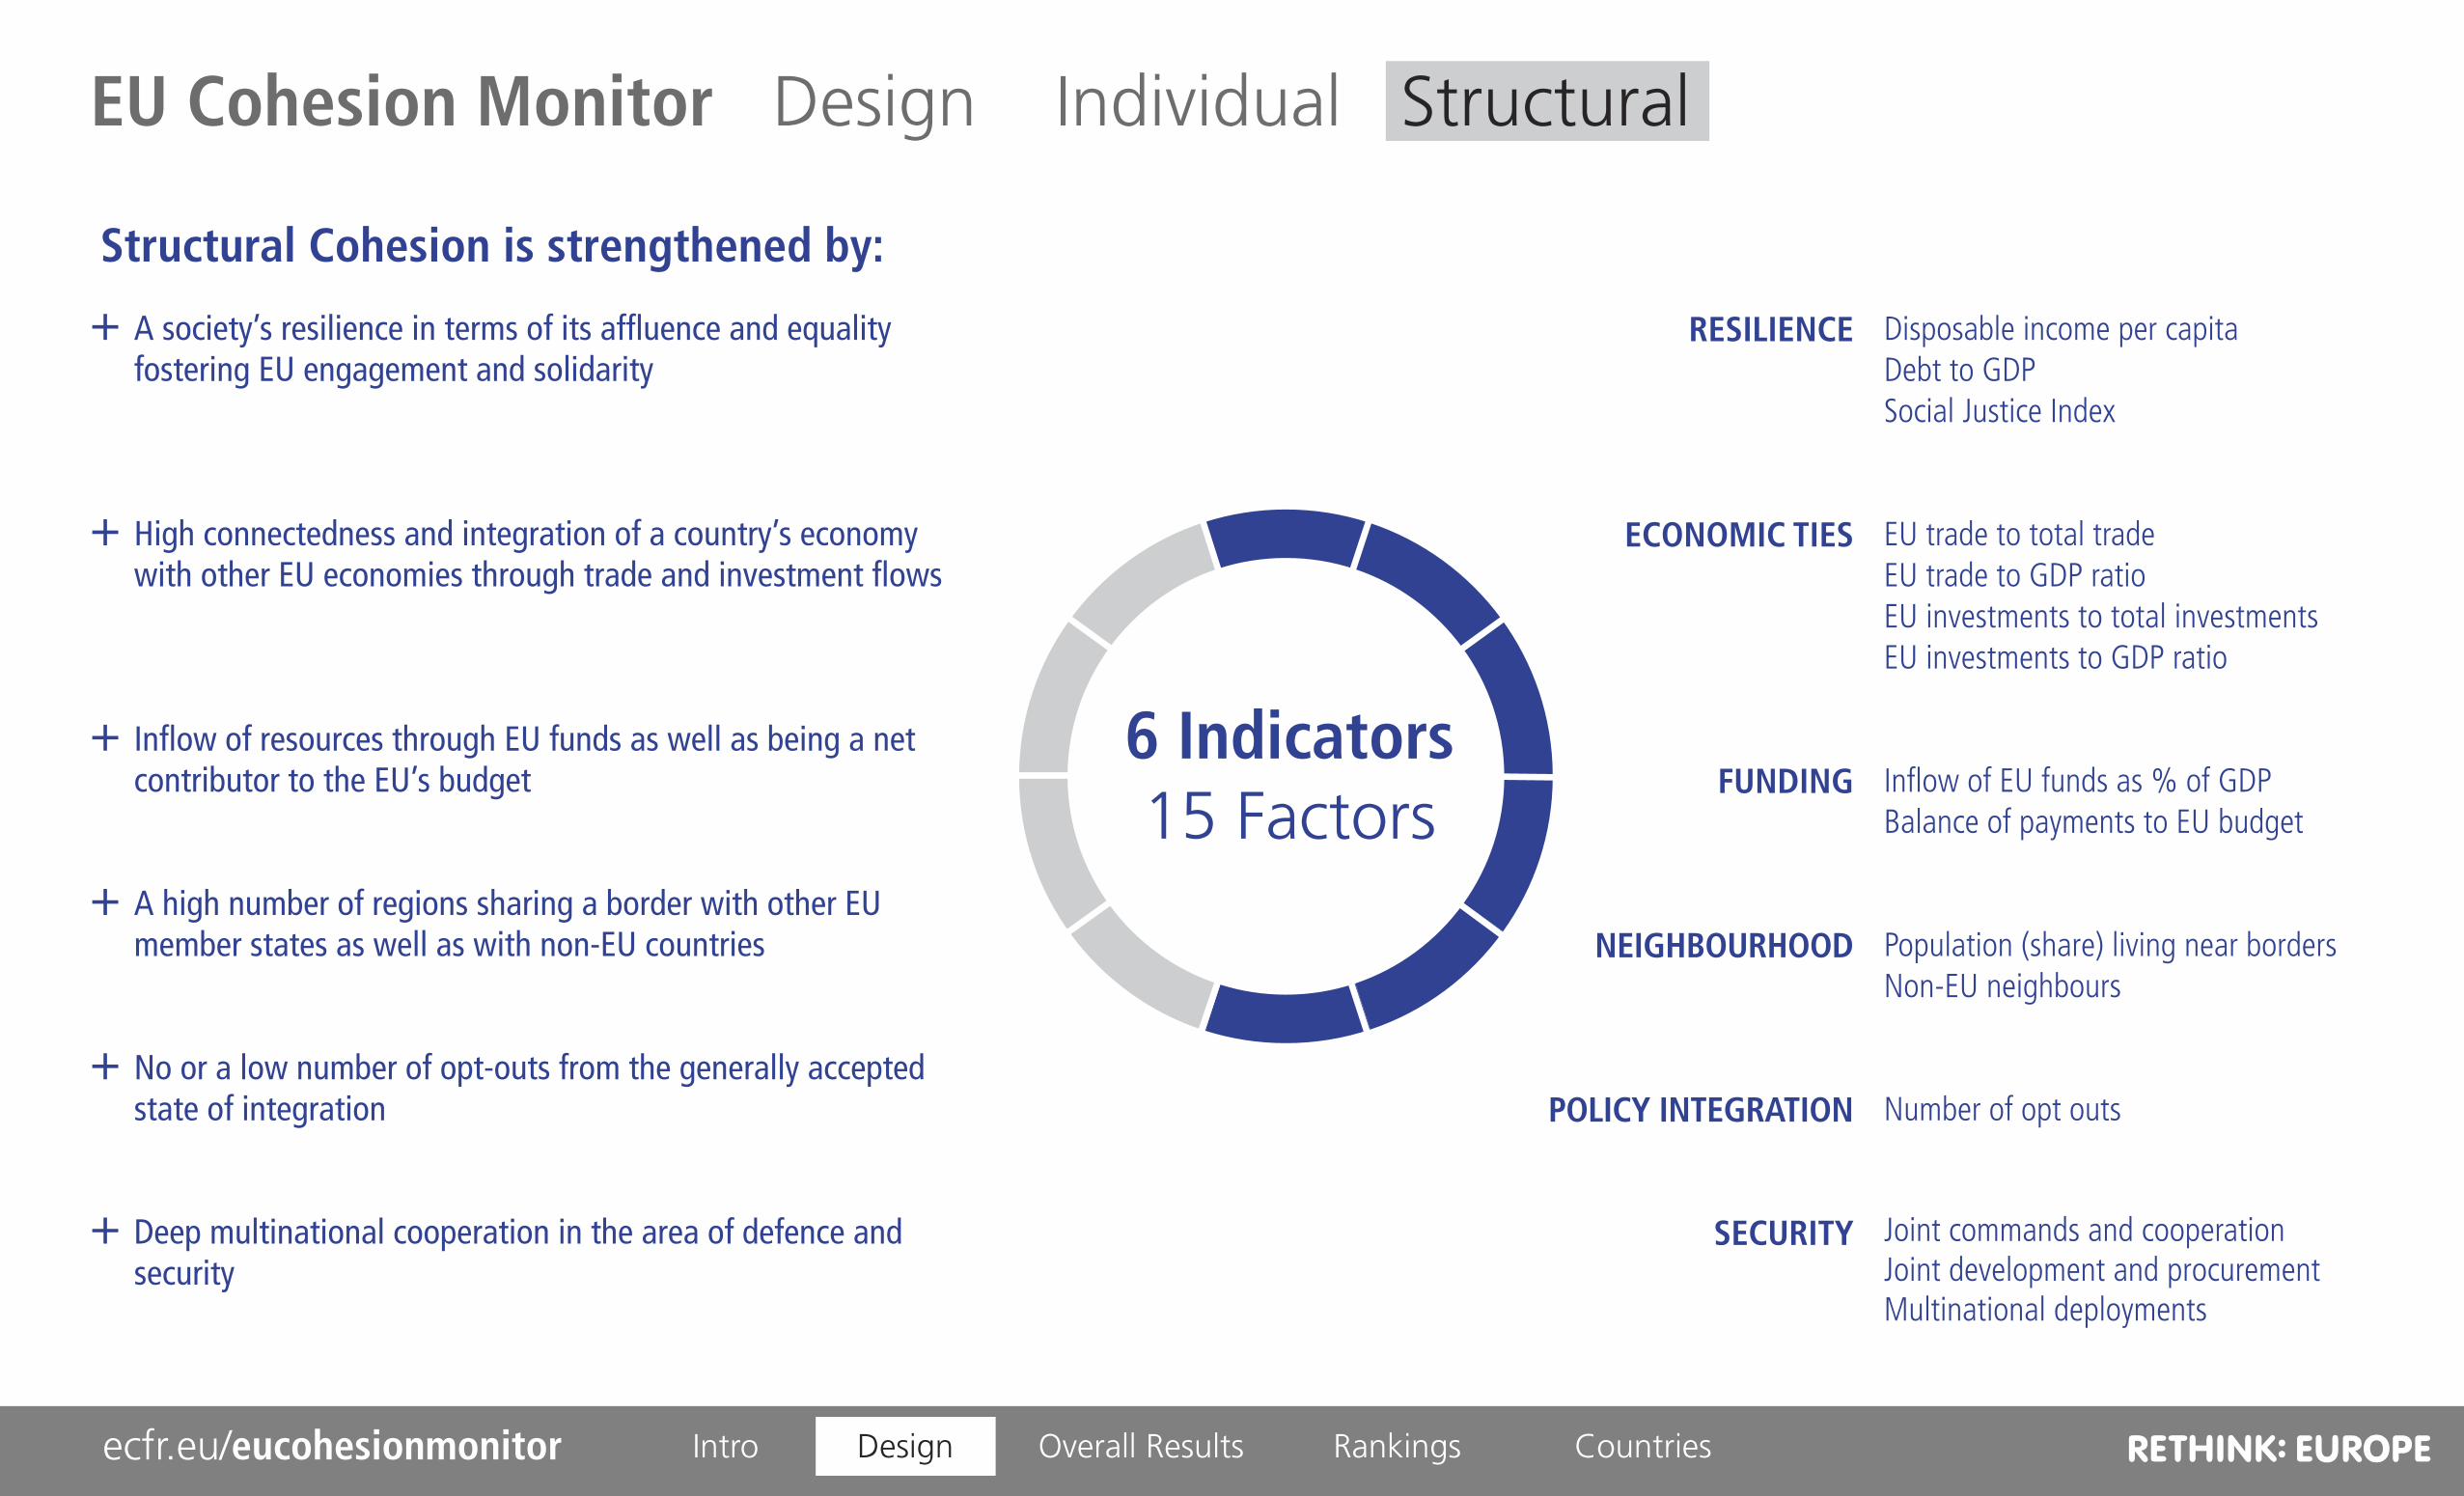
+ A society’s resilience in terms of its affluence and equality fostering EU engagement and solidarity
+ High connectedness and integration of a country’s economy with other EU economies through trade and investment flows
+ Inflow of resources through EU funds as well as being a net contributor to the EU’s budget
+ A high number of regions sharing a border with other EU member states as well as with non-EU countries
+ No or a low number of opt-outs from the generally accepted state of integration
+ Deep multinational cooperation in the area of defence and security
6 Indicators15 Factors
RESILIENCE
ECONOMIC TIES
FUNDING
NEIGHBOURHOOD
POLICY INTEGRATION
SECURITY
Disposable income per capitaDebt to GDPSocial Justice Index
EU trade to total tradeEU trade to GDP ratioEU investments to total investmentsEU investments to GDP ratio
Inflow of EU funds as % of GDPBalance of payments to EU budget
Population (share) living near bordersNon-EU neighbours
Number of opt outs
Joint commands and cooperationJoint development and procurementMultinational deployments
Structural Cohesion is strengthened by:
EU Cohesion Monitor Design Individual Structural
Overall Results Countriesecfr.eu/eucohesionmonitor Intro RankingsDesign
Design Overall Results Countriesecfr.eu/eucohesionmonitor Intro Rankings
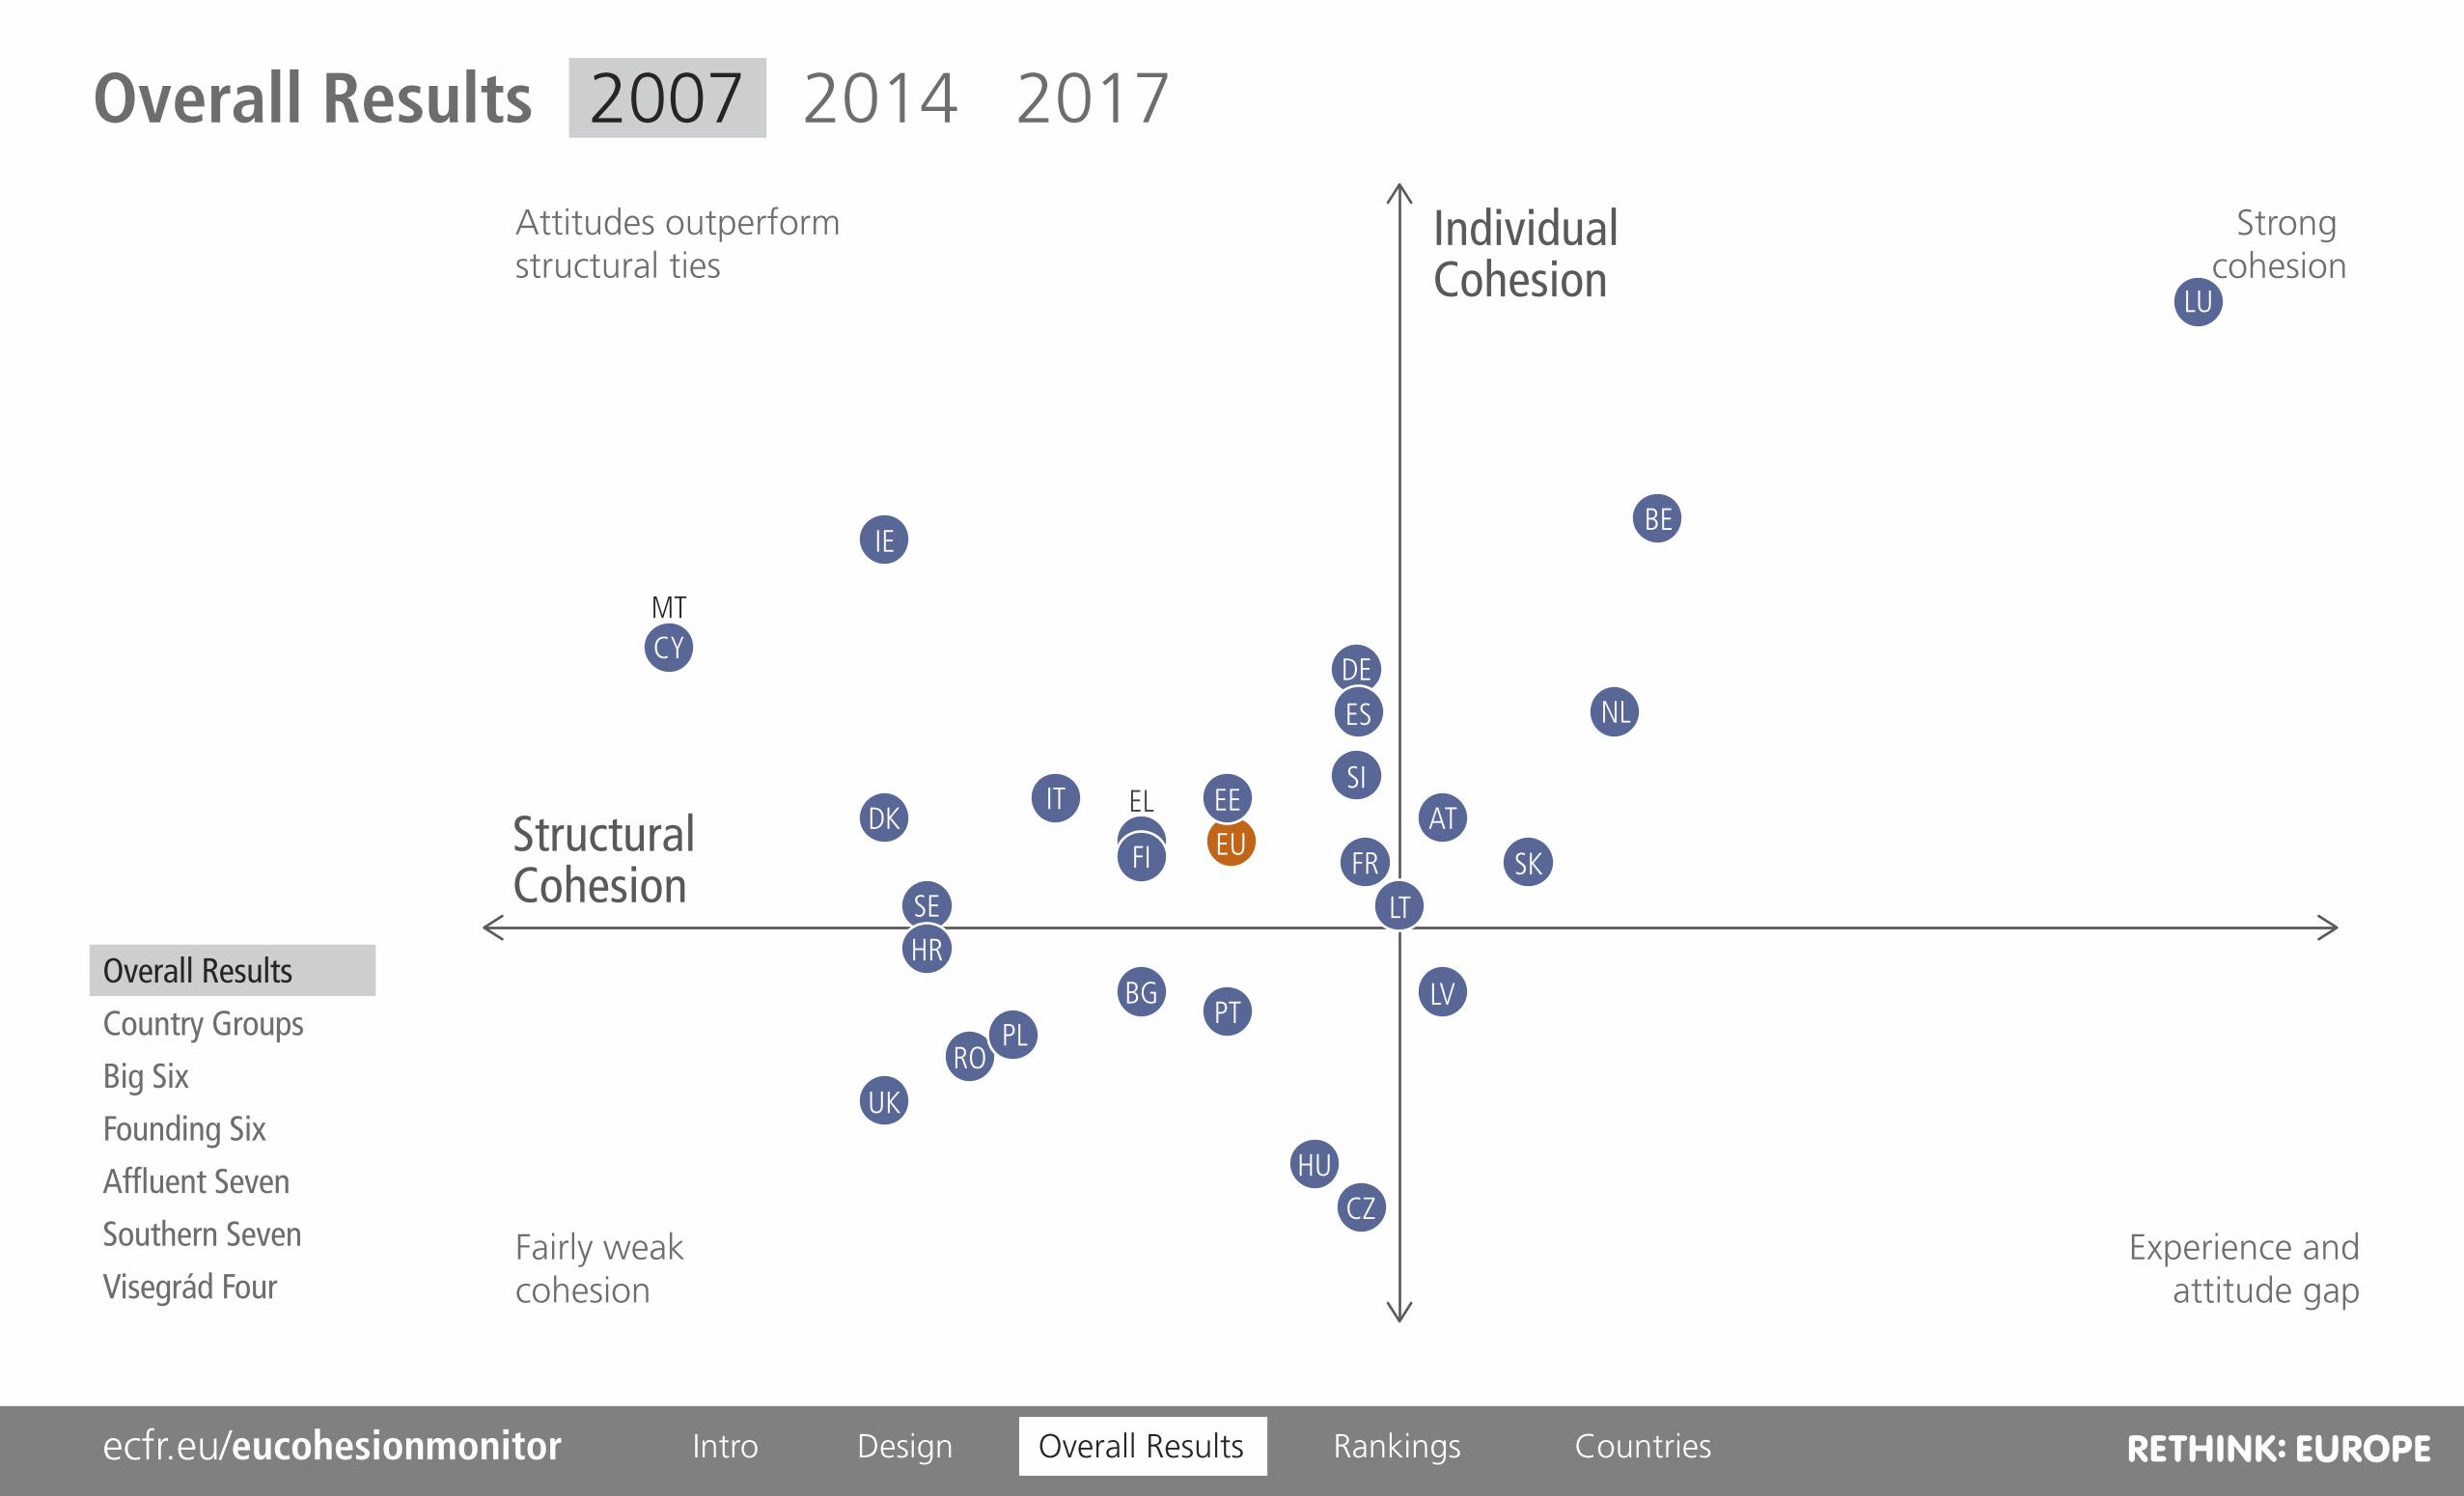
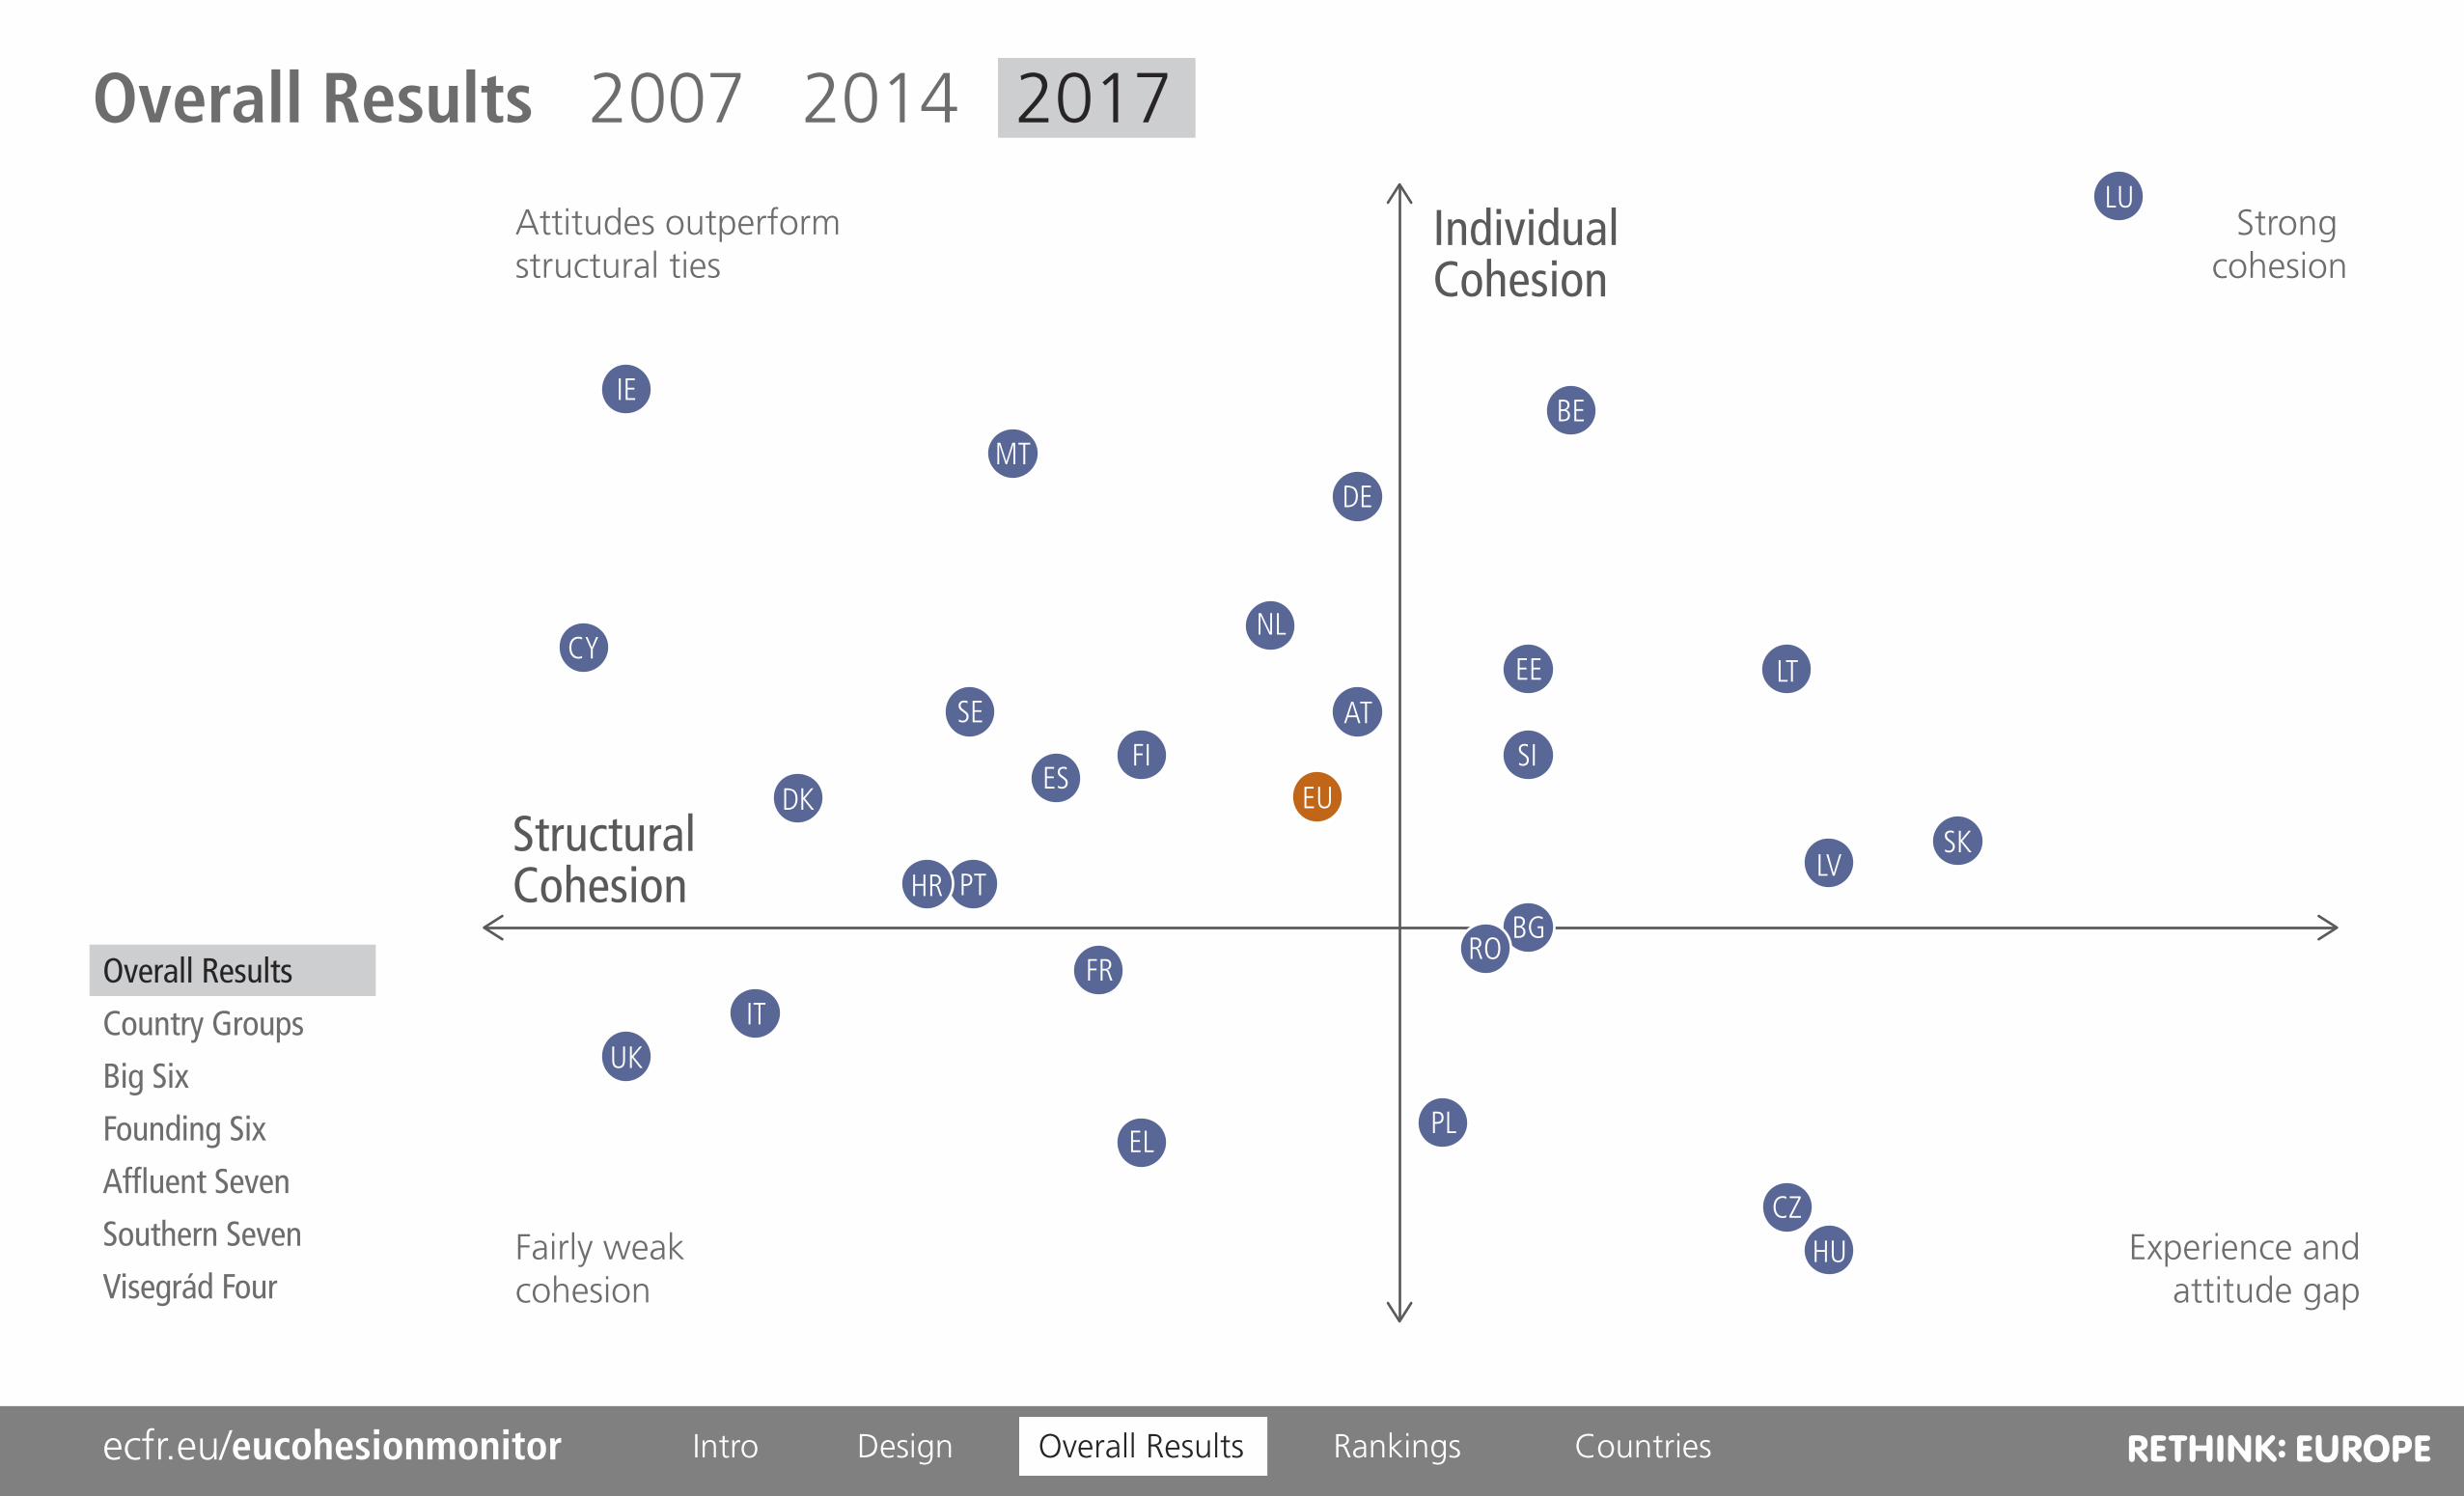
Structural Cohesion
IndividualCohesion
Attitudes outperformstructural ties
Fairly weak cohesion
Experience andattitude gap
Strong cohesion
EU
IE
MT
DK
ES
SEHR
FR
CY
UK
IT
PT
EL
BGPL
CZHU
DE
FI
NL
AT
RO
SI
BE
LU
EE
LTSK
LVOverall Results
Country Groups
Big Six
Founding Six
Affluent Seven
Southern Seven
Visegrád Four
Overall Results 2007 2014 2017

Design Overall Results Countriesecfr.eu/eucohesionmonitor Intro Rankings
Structural Cohesion
IndividualCohesion
Attitudes outperformstructural ties
Fairly weak cohesion
Experience andattitude gap
Strong cohesion
EU
IEMT
DK ESSE
HR
FR
CY
UK ITPT
EL
BG
PL
CZ
HU
DE
FI
NL
AT
RO
SI
BE
LU
EE
LTSK
LV
Overall Results
Country Groups
Big Six
Founding Six
Affluent Seven
Southern Seven
Visegrád Four
Overall Results 2007 2014 2017
Design Overall Results Countriesecfr.eu/eucohesionmonitor Intro Rankings
Structural Cohesion
IndividualCohesion
Attitudes outperformstructural ties
Fairly weak cohesion
Experience andattitude gap
Strong cohesion
EU
IE
MT
DKES
SE
HR
FR
CY
UKIT
PT
EL
BG
PL
CZHU
DE
FI
NL
AT
RO
SI
BE
LU
EE LT
SKLV
Overall Results
Country Groups
Big Six
Founding Six
Affluent Seven
Southern Seven
Visegrád Four
Overall Results 2007 2014 2017

Design Overall Results Countriesecfr.eu/eucohesionmonitor Intro Rankings
Structural Cohesion
IndividualCohesion
Attitudes outperformstructural ties
Fairly weak cohesion
Experience andattitude gap
Strong cohesion
Founding Six
EU
Southern SevenAffluent Seven
Visegrád Four
Big Six
Country Groups 2007 2017
Overall Results
Country Groups
Big Six
Founding Six
Affluent Seven
Southern Seven
Visegrád Four

Design Overall Results Countriesecfr.eu/eucohesionmonitor Intro Rankings
Structural Cohesion
IndividualCohesion
Attitudes outperformstructural ties
Fairly weak cohesion
Experience andattitude gap
Strong cohesion
Founding Six
EU
Southern Seven
Big Six
Affluent Seven
Visegrád Four
Country Groups 2007 2017
Overall Results
Country Groups
Big Six
Founding Six
Affluent Seven
Southern Seven
Visegrád Four

Design Overall Results Countriesecfr.eu/eucohesionmonitor Intro Rankings
Structural Cohesion
IndividualCohesion
Attitudes outperformstructural ties
Fairly weak cohesion
Experience andattitude gap
Strong cohesion
Germany
FranceItaly
UK
Spain
Poland
Big Six 2007 2017
Overall Results
Country Groups
Big Six
Founding Six
Affluent Seven
Southern Seven
Visegrád Four

Design Overall Results Countriesecfr.eu/eucohesionmonitor Intro Rankings
Structural Cohesion
IndividualCohesion
Attitudes outperformstructural ties
Fairly weak cohesion
Experience andattitude gap
Strong cohesion
Germany
France
Italy
UK
Spain
Poland
Big Six 2007 2017
Overall Results
Country Groups
Big Six
Founding Six
Affluent Seven
Southern Seven
Visegrád Four

Design Overall Results Countriesecfr.eu/eucohesionmonitor Intro Rankings
Structural Cohesion
IndividualCohesion
Attitudes outperformstructural ties
Fairly weak cohesion
Experience andattitude gap
Strong cohesion
Germany
FranceItaly
Belgium
Luxembourg
Netherlands
Founding Six 2007 2017
Overall Results
Country Groups
Big Six
Founding Six
Affluent Seven
Southern Seven
Visegrád Four
Design Overall Results Countriesecfr.eu/eucohesionmonitor Intro Rankings
Structural Cohesion
IndividualCohesion
Attitudes outperformstructural ties
Fairly weak cohesion
Experience andattitude gap
Strong cohesion
Denmark
AustriaSweden
Belgium
Luxembourg
Netherlands
Affluent Seven 2007 2017
Finland
Overall Results
Country Groups
Big Six
Founding Six
Affluent Seven
Southern Seven
Visegrád Four

Design Overall Results Countriesecfr.eu/eucohesionmonitor Intro Rankings
Structural Cohesion
IndividualCohesion
Attitudes outperformstructural ties
Fairly weak cohesion
Experience andattitude gap
Strong cohesion
Cyprus
FranceItaly
Spain
Greece
Malta
Overall Results
Country Groups
Big Six
Founding Six
Affluent Seven
Southern Seven
Visegrád Four
Portugal
Southern Seven 2007 2017
Design Overall Results Countriesecfr.eu/eucohesionmonitor Intro Rankings
Structural Cohesion
IndividualCohesion
Attitudes outperformstructural ties
Fairly weak cohesion
Experience andattitude gap
Strong cohesion
Hungary
Czech Rep.
Slovakia
Poland
Visegrád Four 2007 2017
Overall Results
Country Groups
Big Six
Founding Six
Affluent Seven
Southern Seven
Visegrád Four

8.4
7.4
7.3
6.8
6.7
6.5
6.2
6.1
6.0
5.9
5.8
5.6
5.4
5.2
5.1
5.0
4.9
4.7
4.4
4.2
Luxembourg
Belgium
Ireland
Cyprus
Malta
Germany
Netherlands
Spain
Slovenia
Estonia
Italy
Austria
Denmark
Greece
Finland
France
Slovakia
Lithuania
Sweden
Croatia
Bulgaria
Latvia
Portugal
Poland
Romania
UK
Hungary
Czech Rep.
#1
2
3
4
6
7
9
10
12
14
15
18
20
21
23
24
25
26
27
28
6.50 or more
5.85 to 6.49
5.20 to 5.84
less than 5.20
Individual Cohesion 2007 2017 Trend
STRUCTURALCOHESION
ResilienceEconomic TiesFundingNeighbourhoodPolicy IntegrationSecurity
INDIVIDUALCOHESION
ExperienceEngagementAttitudesApproval
Design Overall Results Countriesecfr.eu/eucohesionmonitor Intro Rankings

9,1
8,0
7,9
7,7
7,5
6,9
6,8
6,7
6,5
6,3
6,2
6,1
5,9
5,8
5,7
5,5
5,4
5,3
5,1
4,9
4,6
4,5
4,2
4,0
Luxembourg
Ireland
Belgium
Malta
Germany
Netherlands
Cyprus
Estonia
Lithuania
Austria
Sweden
Finland
Slovenia
Spain
Denmark
Slovakia
Latvia
Croatia
Portugal
Bulgaria
Romania
France
Italy
UK
Poland
Greece
Czech Rep.
Hungary
#1
2
3
4
5
6
7
8
10
12
14
15
16
17
18
20
21
22
23
24
25
26
27
28
Individual Cohesion 2007 2017 Trend
STRUCTURALCOHESION
ResilienceEconomic TiesFundingNeighbourhoodPolicy IntegrationSecurity
INDIVIDUALCOHESION
ExperienceEngagementAttitudesApproval
6.50 or more
5.85 to 6.49
5.20 to 5.84
less than 5.20
Design Overall Results Countriesecfr.eu/eucohesionmonitor Intro Rankings

8.9
7.9
7.5
7.4
7.2
6.9
6.8
6.6
6.5
6.4
6.3
6.2
5.9
5.7
5.4
5.3
5.2
5.0
4.8
4.1
Lithuania
Malta
Sweden
Germany
Ireland
Luxembourg
Estonia
Latvia
Portugal
Austria
Belgium
Finland
Romania
Netherlands
Bulgaria
Croatia
UK
Denmark
Slovakia
Slovenia
Cyprus
Czech Rep.
Spain
Hungary
Poland
France
Italy
Greece
1.1
0.9
0.8
0.7
0.6
0.5
0.4
0.3
0.2
0.1
0.0
-0.3
-0.4
-0.5
-1.0
-1.4
Gains
No Change
Losses
Individual Cohesion 2007 2017 Trend
STRUCTURALCOHESION
ResilienceEconomic TiesFundingNeighbourhoodPolicy IntegrationSecurity
INDIVIDUALCOHESION
ExperienceEngagementAttitudesApproval
Design Overall Results Countriesecfr.eu/eucohesionmonitor Intro Rankings

8.1
6.1
6.0
5.8
5.6
5.5
5.4
5.3
5.1
4.9
4.7
4.6
4.5
4.4
4.3
3.8
Luxembourg
Belgium
Netherlands
Slovakia
Austria
Latvia
Lithuania
Czech Rep.
France
Germany
Slovenia
Spain
Hungary
Estonia
Portugal
Bulgaria
Finland
Greece
Italy
Poland
Romania
Croatia
Sweden
Denmark
Ireland
UK
Cyprus
Malta
#1
2
3
4
5
7
8
13
14
16
19
20
21
22
24
27
5.48 or more
5.11 to 5.47
4.43 to 5.10
less than 4.43
Structural Cohesion 2007 2017 Trend
STRUCTURALCOHESION
ResilienceEconomic TiesFundingNeighbourhoodPolicy IntegrationSecurity
INDIVIDUALCOHESION
ExperienceEngagementAttitudesApproval
Design Overall Results Countriesecfr.eu/eucohesionmonitor Intro Rankings

7.6
6.8
6.5
6.4
5.9
5.8
5.7
5.6
5.4
5.2
4.9
4.8
4.7
4.6
4.5
4.4
4.1
4.0
3.7
3.6
Luxembourg
Slovakia
Hungary
Latvia
Czech Rep.
Lithuania
Belgium
Bulgaria
Estonia
Slovenia
Romania
Poland
Austria
Germany
Netherlands
Finland
Greece
France
Spain
Malta
Portugal
Sweden
Croatia
Denmark
Italy
Ireland
UK
Cyprus
#1
2
3
5
7
8
11
12
13
15
16
18
19
20
21
23
24
25
26
28
Structural Cohesion 2007 2017 Trend
STRUCTURALCOHESION
ResilienceEconomic TiesFundingNeighbourhoodPolicy IntegrationSecurity
INDIVIDUALCOHESION
ExperienceEngagementAttitudesApproval
5.48 or more
5.11 to 5.47
4.43 to 5.10
less than 4.43
Design Overall Results Countriesecfr.eu/eucohesionmonitor Intro Rankings

Structural Cohesion 2007 2017 Trend
STRUCTURALCOHESION
ResilienceEconomic TiesFundingNeighbourhoodPolicy IntegrationSecurity
INDIVIDUALCOHESION
ExperienceEngagementAttitudesApproval
Gains
No Change
Losses
Hungary
Romania
Czech Rep.
Poland
Slovakia
Bulgaria
Latvia
Lithuania
Malta
Estonia
Slovenia
Sweden
Croatia
Finland
Germany
Greece
Austria
Belgium
Cyprus
Denmark
Luxembourg
France
Ireland
Portugal
UK
Italy
Spain
Netherlands
1.2
1.0
0.9
0.8
0.7
0.4
0.1
0.0
-0.2
-0.5
-0.6
-0.7
-0.8
Design Overall Results Countriesecfr.eu/eucohesionmonitor Intro Rankings
RESILIENCE
ECONOMIC TIES
FUNDING
NEIGHBOURHOOD
POLICY INTEGRATION
SECURITY
EXPERIENCE
ENGAGEMENT
ATTITUDES
APPROVAL
10 8 6 4 2 2 4 6 8 10
INDIVIDUAL COHESION STRUCTURAL COHESION
Individual C.
Structural C.
AustriaBelgiumBulgariaCroatiaCyprusCzech Rep.DenmarkEstoniaFinlandFranceGermanyGreeceHungaryIreland
ItalyLatviaLithuaniaLuxembourgMaltaNetherlandsPolandPortugalRomaniaSlovakiaSloveniaSpainSwedenUK
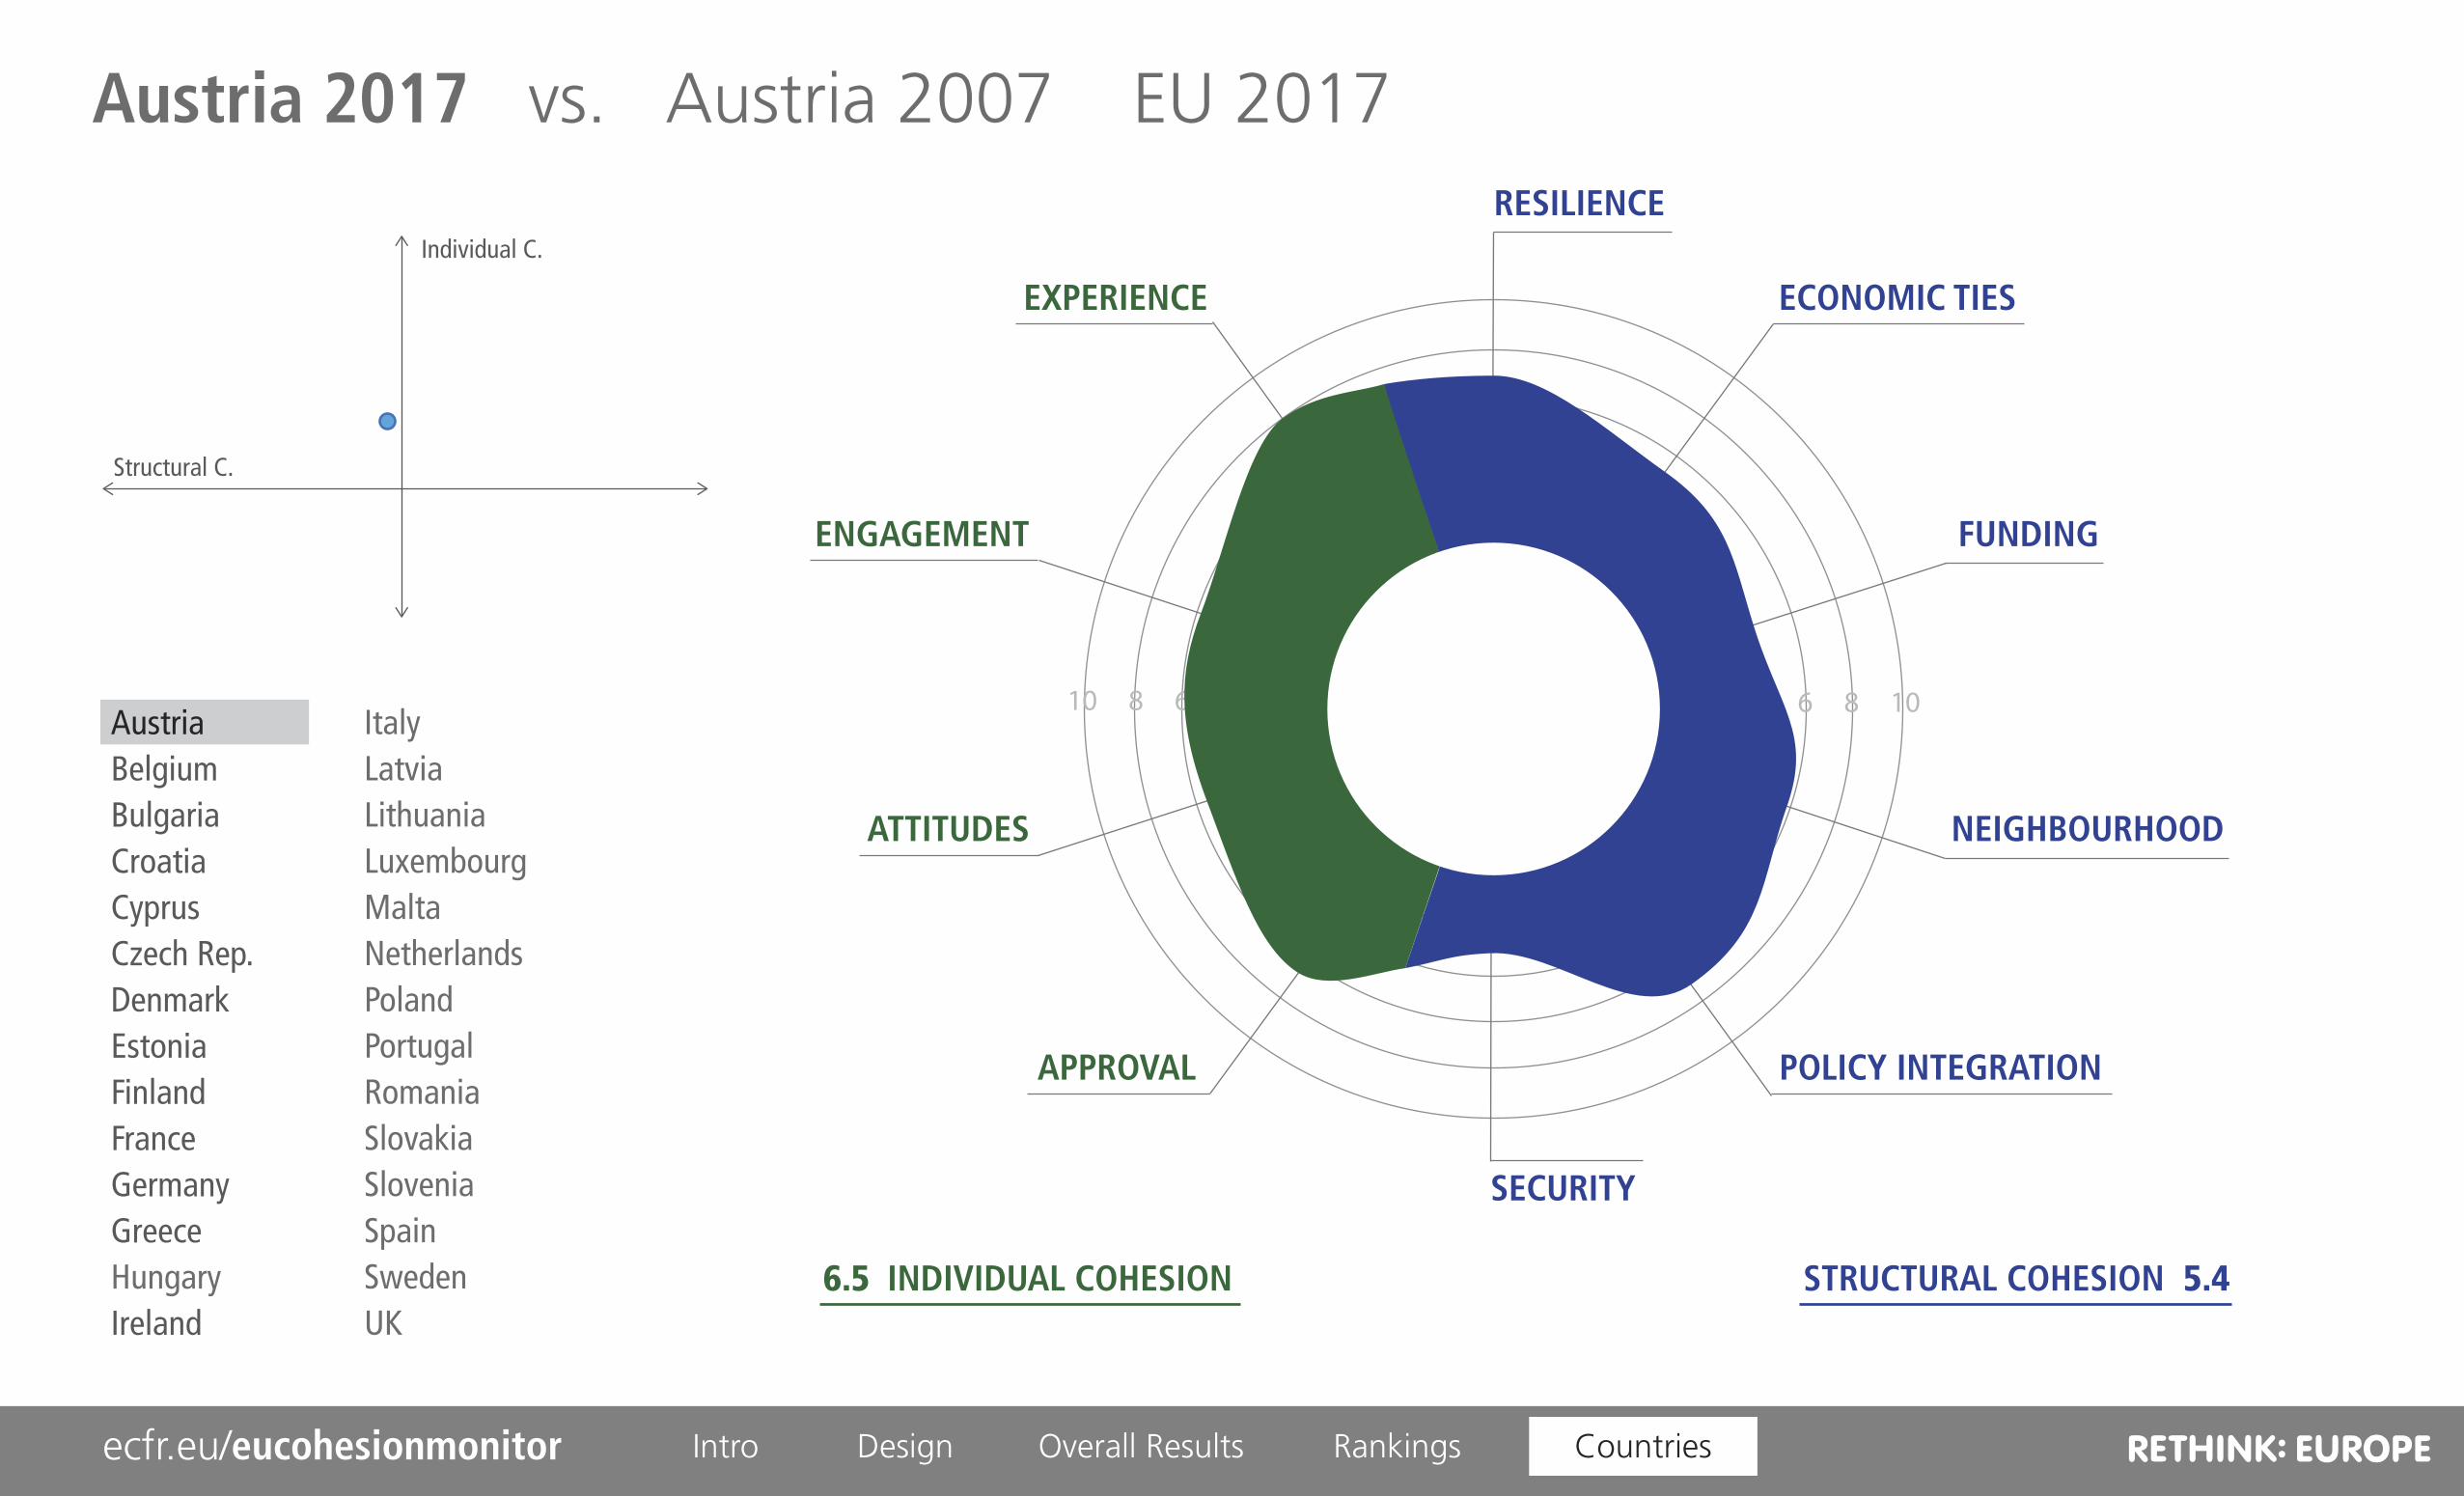
Austria 2017 vs. Austria 2007 EU 2017
6.5 5.4
Design Overall Results Rankings Countriesecfr.eu/eucohesionmonitor Intro

RESILIENCE
ECONOMIC TIES
FUNDING
NEIGHBOURHOOD
POLICY INTEGRATION
SECURITY
EXPERIENCE
ENGAGEMENT
ATTITUDES
APPROVAL
10 8 6 4 2 2 4 6 8 10
INDIVIDUAL COHESION STRUCTURAL COHESION
Individual C.
Structural C.
AustriaBelgiumBulgariaCroatiaCyprusCzech Rep.DenmarkEstoniaFinlandFranceGermanyGreeceHungaryIreland
ItalyLatviaLithuaniaLuxembourgMaltaNetherlandsPolandPortugalRomaniaSlovakiaSloveniaSpainSwedenUK
Austria 2017 vs. Austria 2007 EU 2017
6.5 5.4
Austria 2017 vs. Austria 2007 EU 2017
2.1
1.0
1.3
0.4
1.1
1.0
0.2
0.4
0.0
0.0
0.5 0.2
Design Overall Results Rankings Countriesecfr.eu/eucohesionmonitor Intro

RESILIENCE
ECONOMIC TIES
FUNDING
NEIGHBOURHOOD
POLICY INTEGRATION
SECURITY
EXPERIENCE
ENGAGEMENT
ATTITUDES
APPROVAL
10 8 6 4 2 2 4 6 8 10
INDIVIDUAL COHESION STRUCTURAL COHESION
Individual C.
Structural C.
AustriaBelgiumBulgariaCroatiaCyprusCzech Rep.DenmarkEstoniaFinlandFranceGermanyGreeceHungaryIreland
ItalyLatviaLithuaniaLuxembourgMaltaNetherlandsPolandPortugalRomaniaSlovakiaSloveniaSpainSwedenUK
Austria 2017 vs. Austria 2007 EU 2017
6.5 5.4
Austria 2017 vs. Austria 2007 EU 2017
Design Overall Results Rankings Countriesecfr.eu/eucohesionmonitor Intro
RESILIENCE
ECONOMIC TIES
FUNDING
NEIGHBOURHOOD
POLICY INTEGRATION
SECURITY
EXPERIENCE
ENGAGEMENT
ATTITUDES
APPROVAL
10 8 6 4 2 2 4 6 8 10
INDIVIDUAL COHESION STRUCTURAL COHESION
Individual C.
Structural C.
AustriaBelgiumBulgariaCroatiaCyprusCzech Rep.DenmarkEstoniaFinlandFranceGermanyGreeceHungaryIreland
ItalyLatviaLithuaniaLuxembourgMaltaNetherlandsPolandPortugalRomaniaSlovakiaSloveniaSpainSwedenUK
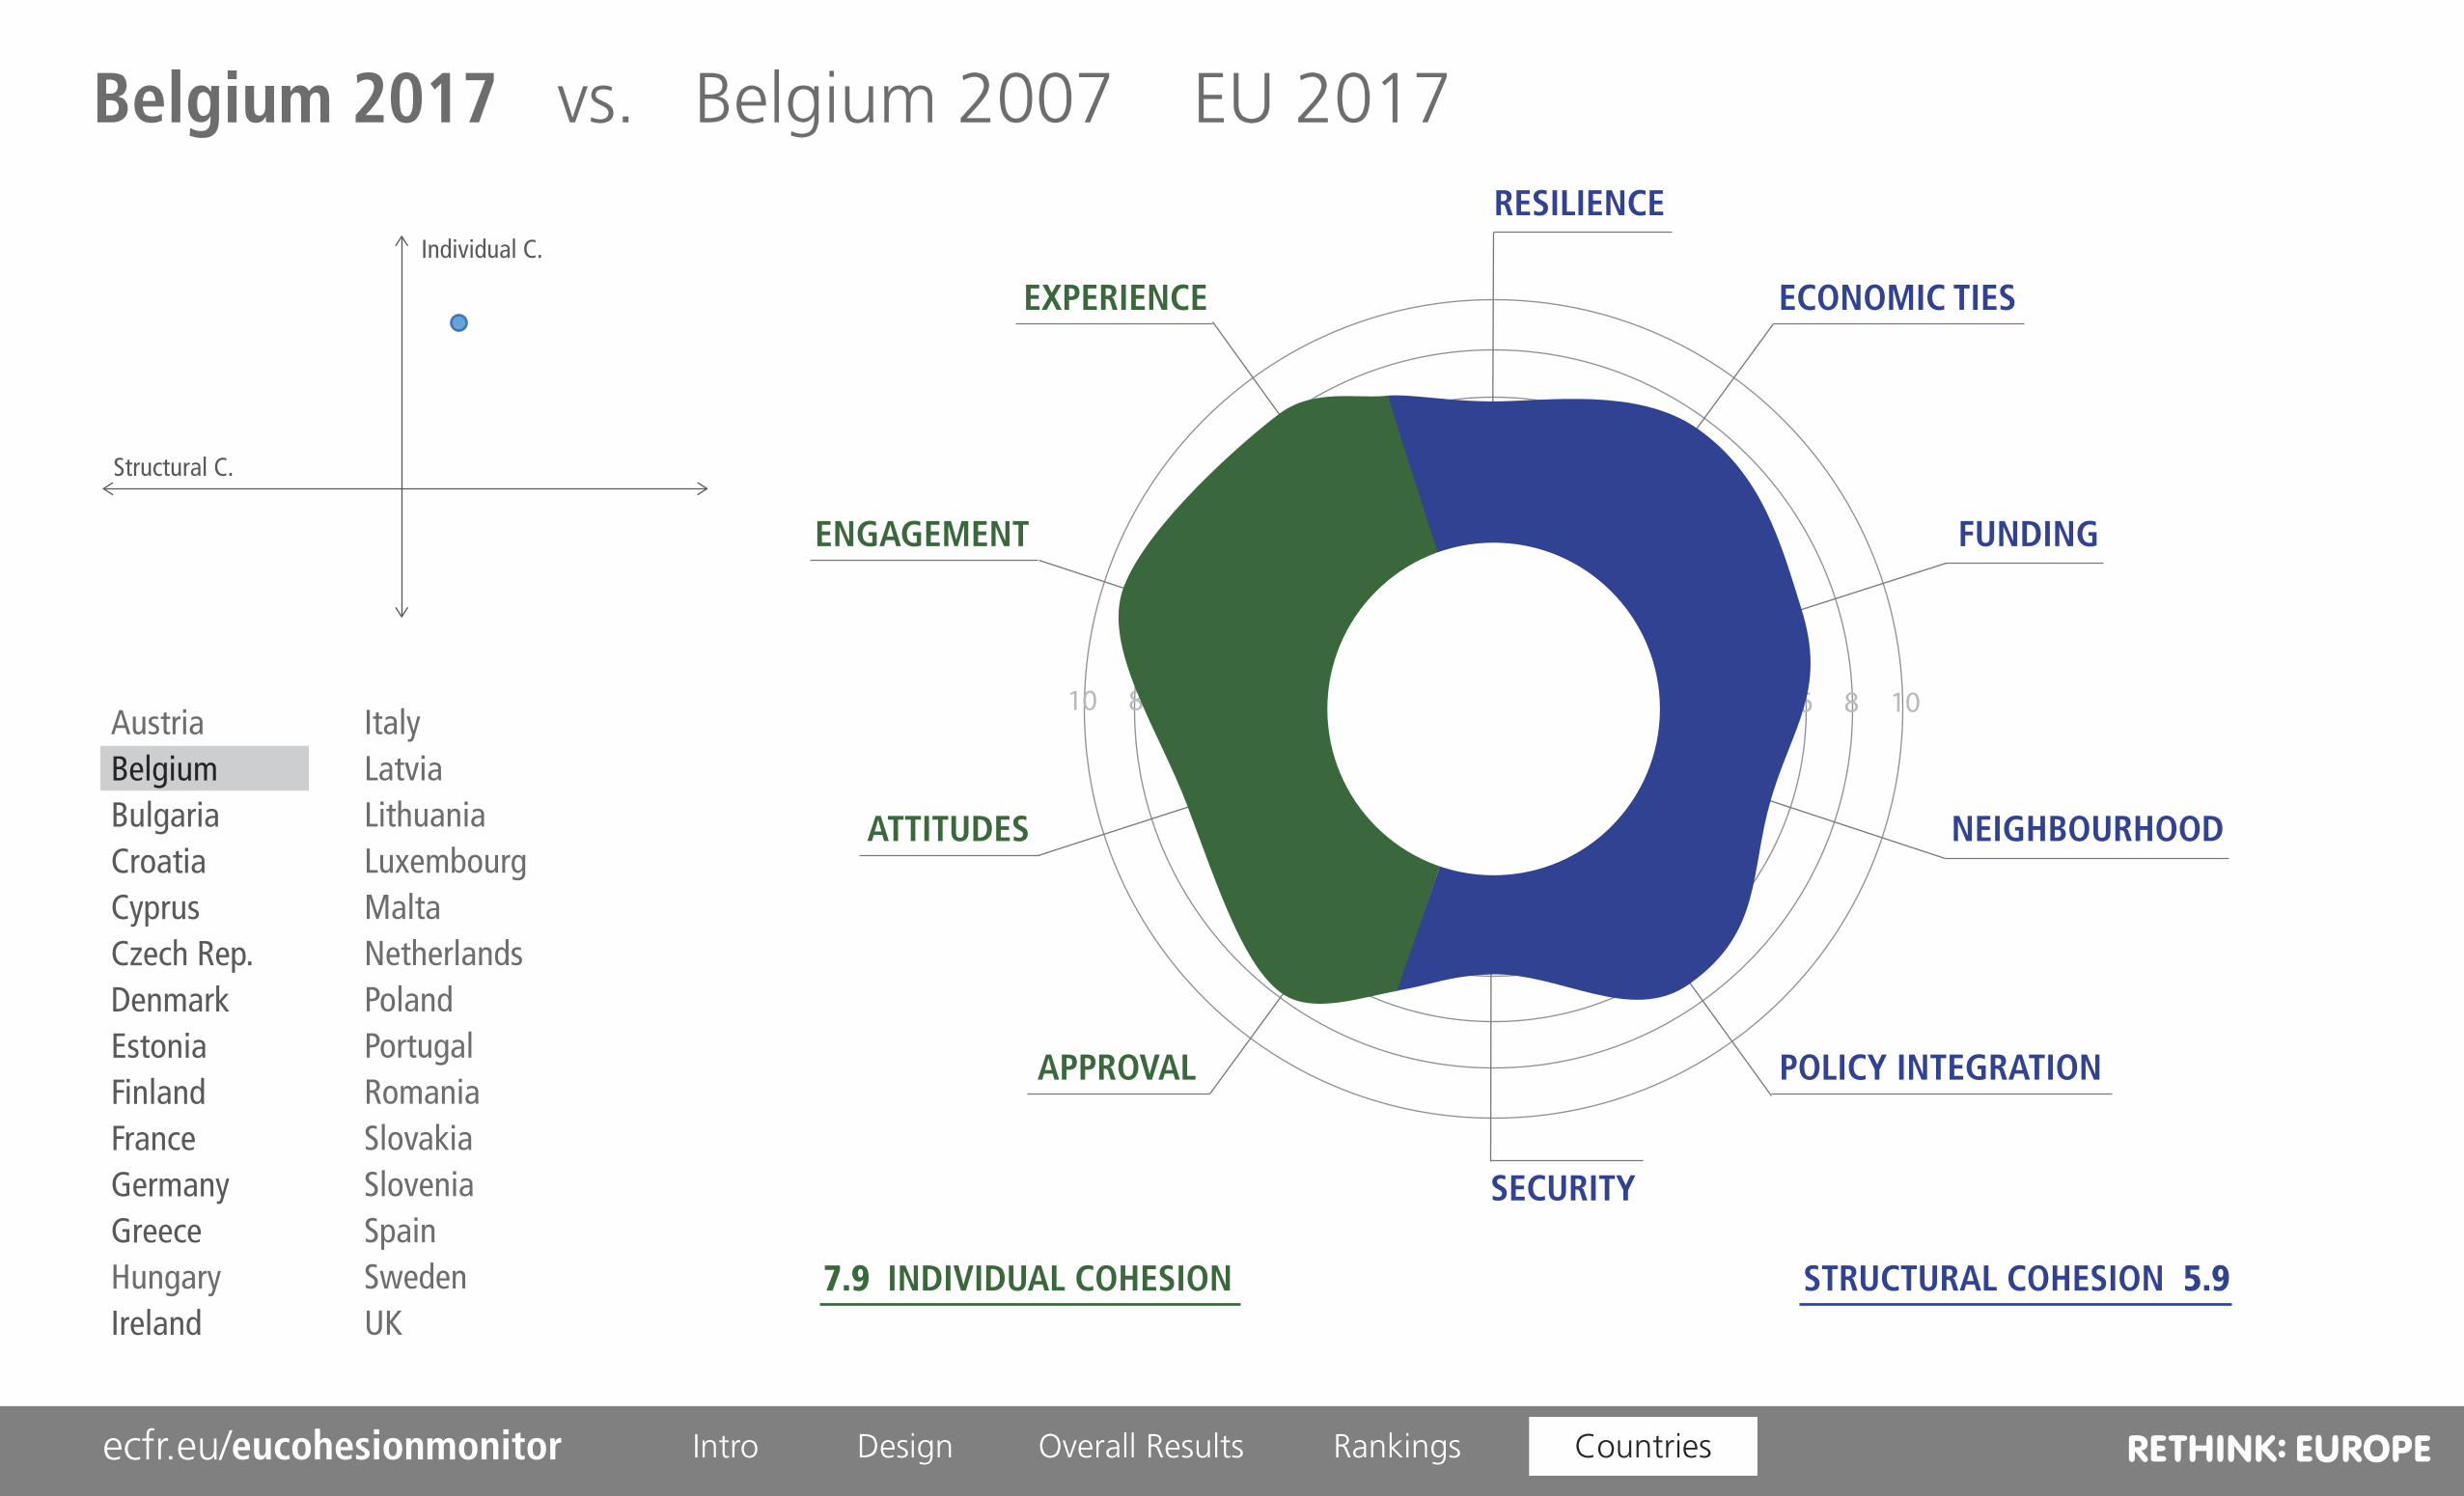
Belgium 2017 vs. Belgium 2007 EU 2017
7.9 5.9
Design Overall Results Rankings Countriesecfr.eu/eucohesionmonitor Intro

RESILIENCE
ECONOMIC TIES
FUNDING
NEIGHBOURHOOD
POLICY INTEGRATION
SECURITY
EXPERIENCE
ENGAGEMENT
ATTITUDES
APPROVAL
10 8 6 4 2 2 4 6 8 10
INDIVIDUAL COHESION STRUCTURAL COHESION
Individual C.
Structural C.
AustriaBelgiumBulgariaCroatiaCyprusCzech Rep.DenmarkEstoniaFinlandFranceGermanyGreeceHungaryIreland
ItalyLatviaLithuaniaLuxembourgMaltaNetherlandsPolandPortugalRomaniaSlovakiaSloveniaSpainSwedenUK
Belgium 2017 vs. Belgium 2007 EU 2017
7.9 5.9
Belgium 2017 vs. Belgium 2007 EU 2017
0.8
1.0
1.2
0.9
0.8
0.2
0.8
0.7
0.4
0.0
0.5 0.2
Design Overall Results Rankings Countriesecfr.eu/eucohesionmonitor Intro

RESILIENCE
ECONOMIC TIES
FUNDING
NEIGHBOURHOOD
POLICY INTEGRATION
SECURITY
EXPERIENCE
ENGAGEMENT
ATTITUDES
APPROVAL
10 8 6 4 2 2 4 6 8 10
INDIVIDUAL COHESION STRUCTURAL COHESION
Individual C.
Structural C.
AustriaBelgiumBulgariaCroatiaCyprusCzech Rep.DenmarkEstoniaFinlandFranceGermanyGreeceHungaryIreland
ItalyLatviaLithuaniaLuxembourgMaltaNetherlandsPolandPortugalRomaniaSlovakiaSloveniaSpainSwedenUK
Belgium 2017 vs. Belgium 2007 EU 2017
7.9 5.9
Belgium 2017 vs. Belgium 2007 EU 2017
Design Overall Results Rankings Countriesecfr.eu/eucohesionmonitor Intro

RESILIENCE
ECONOMIC TIES
FUNDING
NEIGHBOURHOOD
POLICY INTEGRATION
SECURITY
EXPERIENCE
ENGAGEMENT
ATTITUDES
APPROVAL
10 8 6 4 2 2 4 6 8 10
INDIVIDUAL COHESION STRUCTURAL COHESION
Individual C.
Structural C.
AustriaBelgiumBulgariaCroatiaCyprusCzech Rep.DenmarkEstoniaFinlandFranceGermanyGreeceHungaryIreland
ItalyLatviaLithuaniaLuxembourgMaltaNetherlandsPolandPortugalRomaniaSlovakiaSloveniaSpainSwedenUK
Bulgaria 2017 vs. Bulgaria 2007 EU 2017
5.5 5.8
Bulgaria 2017 vs. Bulgaria 2007 EU 2017
0.2
0.5
0.3
0.6
0.1
1.9
0.4
7.0
0.2
0.0
0.3 0.9
Design Overall Results Rankings Countriesecfr.eu/eucohesionmonitor Intro

RESILIENCE
ECONOMIC TIES
FUNDING
NEIGHBOURHOOD
POLICY INTEGRATION
SECURITY
EXPERIENCE
ENGAGEMENT
ATTITUDES
APPROVAL
10 8 6 4 2 2 4 6 8 10
INDIVIDUAL COHESION STRUCTURAL COHESION
Individual C.
Structural C.
AustriaBelgiumBulgariaCroatiaCyprusCzech Rep.DenmarkEstoniaFinlandFranceGermanyGreeceHungaryIreland
ItalyLatviaLithuaniaLuxembourgMaltaNetherlandsPolandPortugalRomaniaSlovakiaSloveniaSpainSwedenUK
Bulgaria 2017 vs. Bulgaria 2007 EU 2017
5.5 5.8
Bulgaria 2017 vs. Bulgaria 2007 EU 2017
Design Overall Results Rankings Countriesecfr.eu/eucohesionmonitor Intro

RESILIENCE
ECONOMIC TIES
FUNDING
NEIGHBOURHOOD
POLICY INTEGRATION
SECURITY
EXPERIENCE
ENGAGEMENT
ATTITUDES
APPROVAL
10 8 6 4 2 2 4 6 8 10
INDIVIDUAL COHESION STRUCTURAL COHESION
Individual C.
Structural C.
AustriaBelgiumBulgariaCroatiaCyprusCzech Rep.DenmarkEstoniaFinlandFranceGermanyGreeceHungaryIreland
ItalyLatviaLithuaniaLuxembourgMaltaNetherlandsPolandPortugalRomaniaSlovakiaSloveniaSpainSwedenUK
Croatia 2017 vs. Croatia 2007 EU 2017
5.7 4.4
Croatia 2017 vs. Croatia 2007 EU 2017
0.4
0.9
0.2
0.6
2.1
1.6
0.8
2.7
0.0
0.0
0.3 0.0
Design Overall Results Rankings Countriesecfr.eu/eucohesionmonitor Intro

RESILIENCE
ECONOMIC TIES
FUNDING
NEIGHBOURHOOD
POLICY INTEGRATION
SECURITY
EXPERIENCE
ENGAGEMENT
ATTITUDES
APPROVAL
10 8 6 4 2 2 4 6 8 10
INDIVIDUAL COHESION STRUCTURAL COHESION
Individual C.
Structural C.
AustriaBelgiumBulgariaCroatiaCyprusCzech Rep.DenmarkEstoniaFinlandFranceGermanyGreeceHungaryIreland
ItalyLatviaLithuaniaLuxembourgMaltaNetherlandsPolandPortugalRomaniaSlovakiaSloveniaSpainSwedenUK
Croatia 2017 vs. Croatia 2007 EU 2017
5.7 4.4
Croatia 2017 vs. Croatia 2007 EU 2017
Design Overall Results Rankings Countriesecfr.eu/eucohesionmonitor Intro

RESILIENCE
ECONOMIC TIES
FUNDING
NEIGHBOURHOOD
POLICY INTEGRATION
SECURITY
EXPERIENCE
ENGAGEMENT
ATTITUDES
APPROVAL
10 8 6 4 2 2 4 6 8 10
INDIVIDUAL COHESION STRUCTURAL COHESION
Individual C.
Structural C.
AustriaBelgiumBulgariaCroatiaCyprusCzech Rep.DenmarkEstoniaFinlandFranceGermanyGreeceHungaryIreland
ItalyLatviaLithuaniaLuxembourgMaltaNetherlandsPolandPortugalRomaniaSlovakiaSloveniaSpainSwedenUK
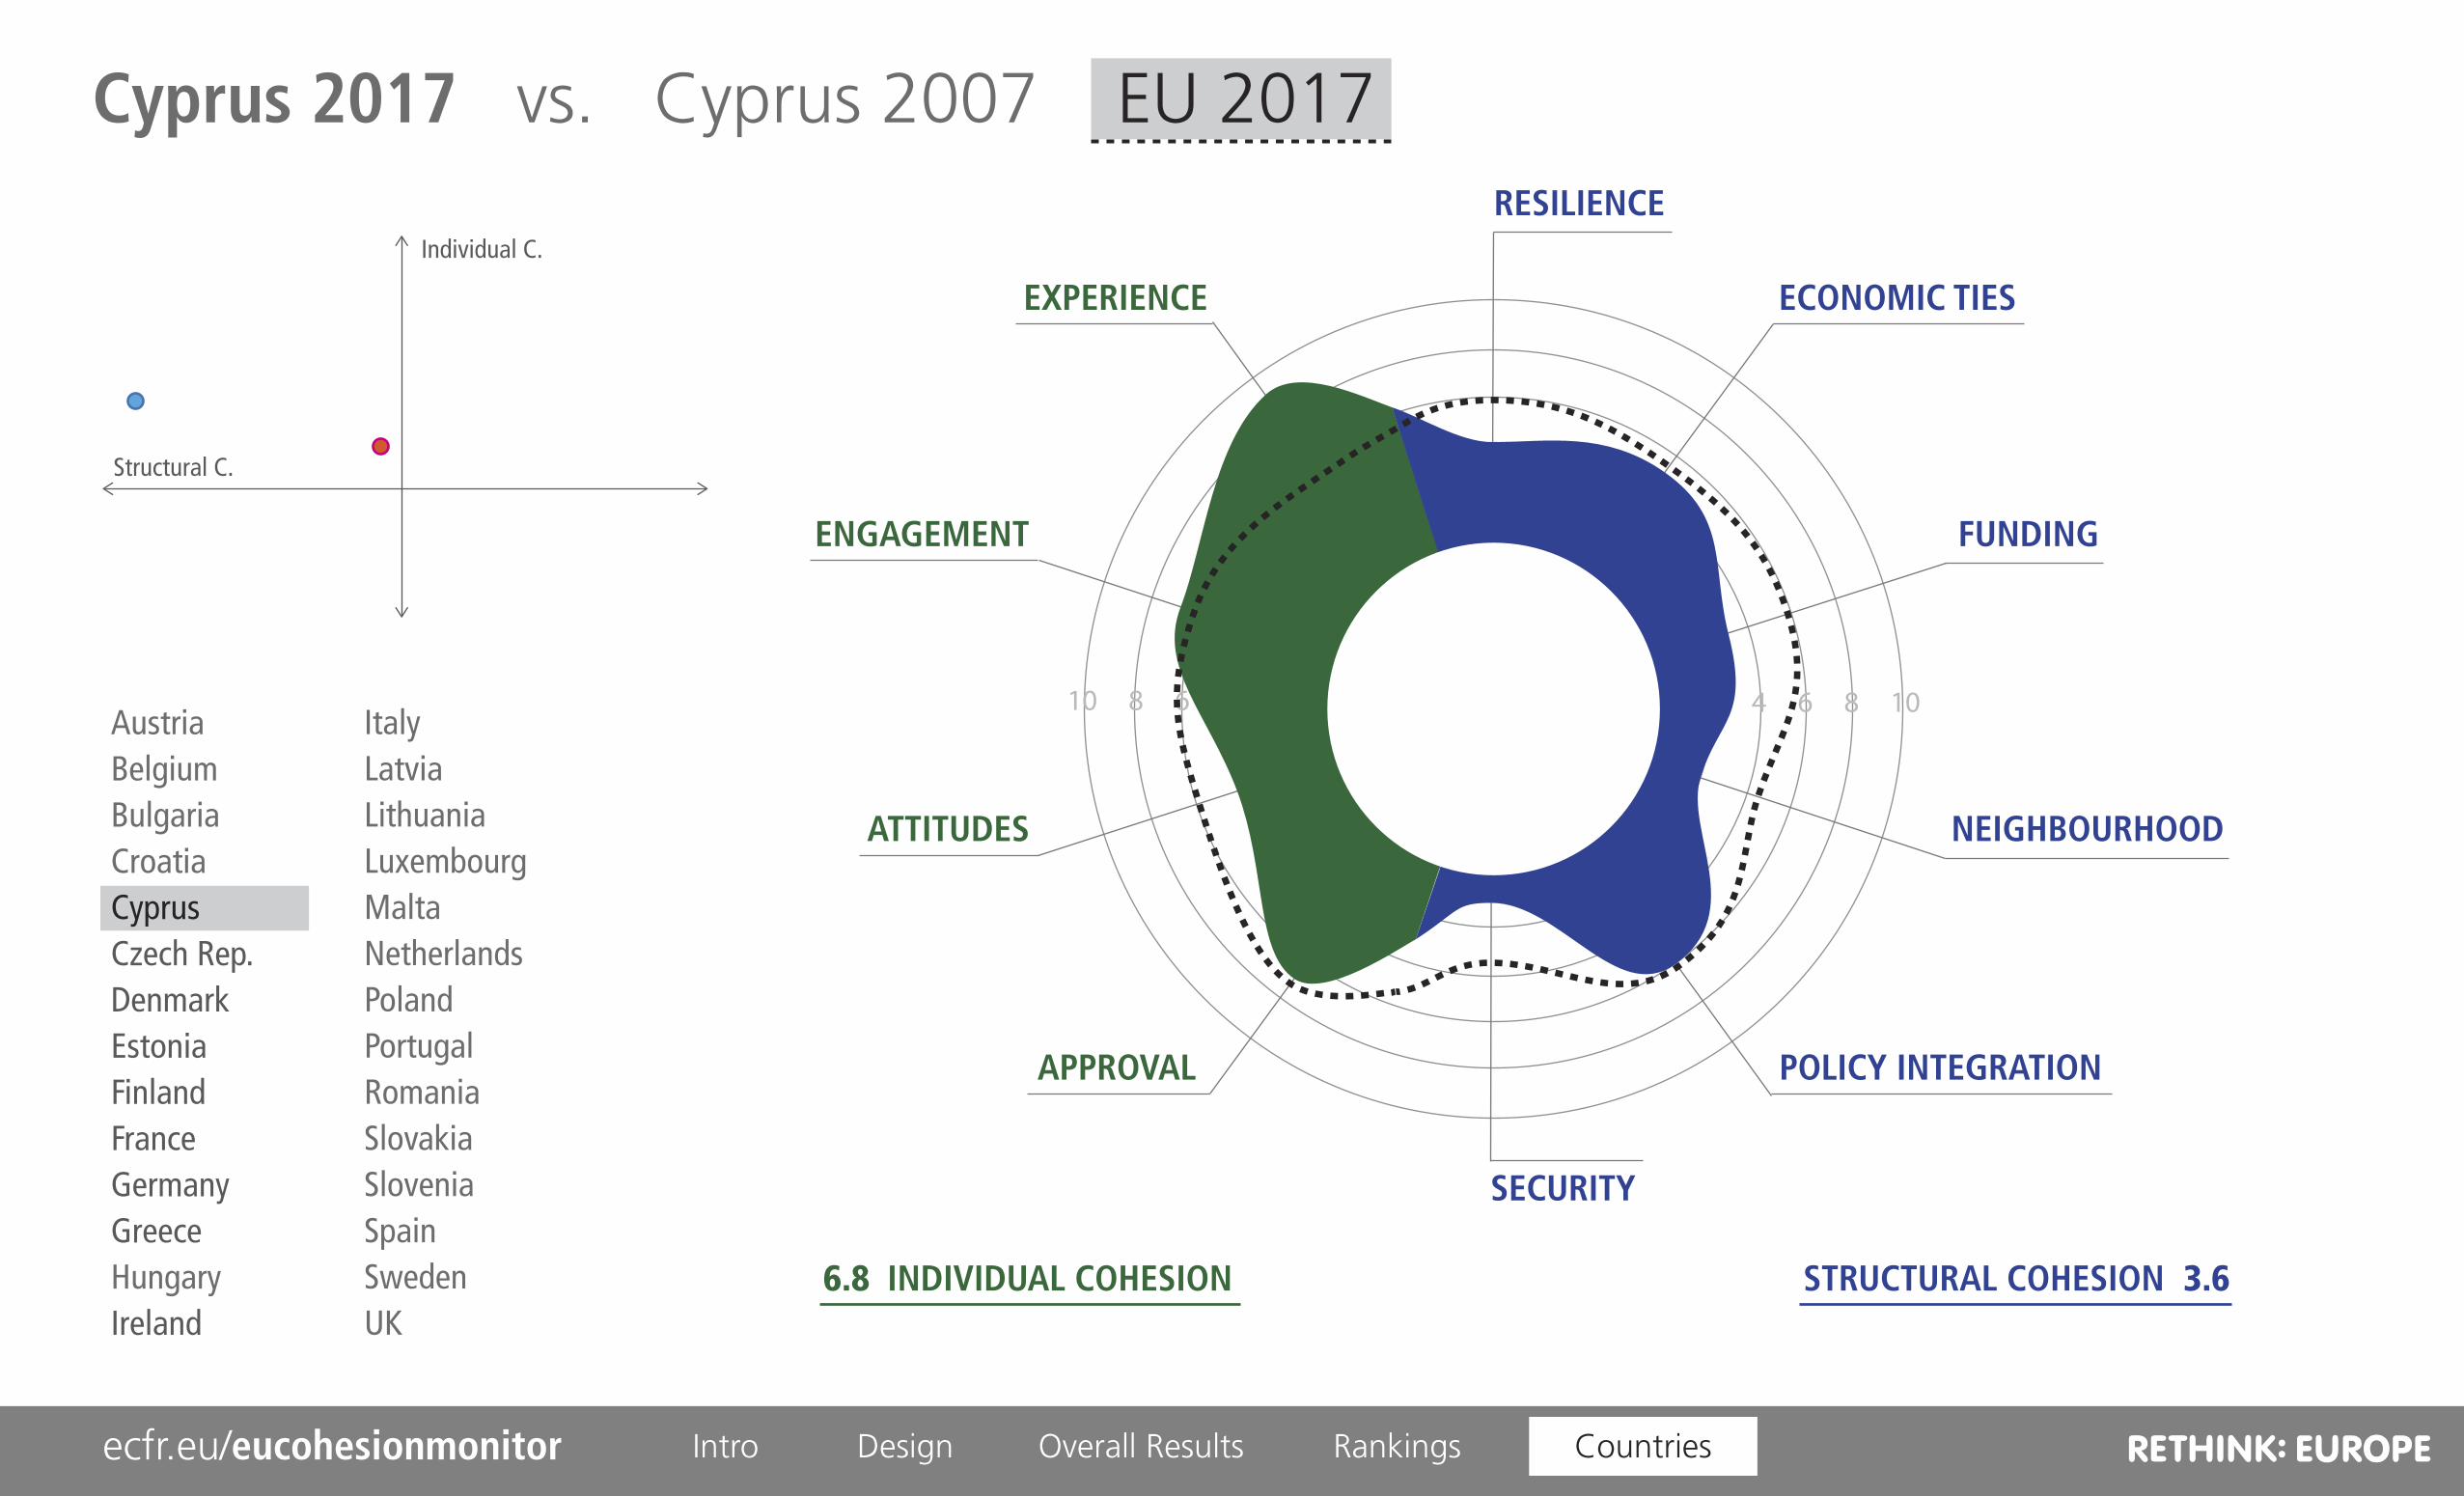
Cyprus 2017 vs. Cyprus 2007 EU 2017
6.8 3.6
Design Overall Results Rankings Countriesecfr.eu/eucohesionmonitor Intro

RESILIENCE
ECONOMIC TIES
FUNDING
NEIGHBOURHOOD
POLICY INTEGRATION
SECURITY
EXPERIENCE
ENGAGEMENT
ATTITUDES
APPROVAL
10 8 6 4 2 2 4 6 8 10
INDIVIDUAL COHESION STRUCTURAL COHESION
Individual C.
Structural C.
AustriaBelgiumBulgariaCroatiaCyprusCzech Rep.DenmarkEstoniaFinlandFranceGermanyGreeceHungaryIreland
ItalyLatviaLithuaniaLuxembourgMaltaNetherlandsPolandPortugalRomaniaSlovakiaSloveniaSpainSwedenUK
Cyprus 2017 vs. Cyprus 2007 EU 2017
6.8 3.6
Cyprus 2017 vs. Cyprus 2007 EU 2017
0.6
1.0
0.3
1.7
3.0
0.0
0.0
0.9
0.0
1.0
0.0 0.2
Design Overall Results Rankings Countriesecfr.eu/eucohesionmonitor Intro
RESILIENCE
ECONOMIC TIES
FUNDING
NEIGHBOURHOOD
POLICY INTEGRATION
SECURITY
EXPERIENCE
ENGAGEMENT
ATTITUDES
APPROVAL
10 8 6 4 2 2 4 6 8 10
INDIVIDUAL COHESION STRUCTURAL COHESION
Individual C.
Structural C.
AustriaBelgiumBulgariaCroatiaCyprusCzech Rep.DenmarkEstoniaFinlandFranceGermanyGreeceHungaryIreland
ItalyLatviaLithuaniaLuxembourgMaltaNetherlandsPolandPortugalRomaniaSlovakiaSloveniaSpainSwedenUK
Cyprus 2017 vs. Cyprus 2007 EU 2017
6.8 3.6
Cyprus 2017 vs. Cyprus 2007 EU 2017
Design Overall Results Rankings Countriesecfr.eu/eucohesionmonitor Intro

RESILIENCE
ECONOMIC TIES
FUNDING
NEIGHBOURHOOD
POLICY INTEGRATION
SECURITY
EXPERIENCE
ENGAGEMENT
ATTITUDES
APPROVAL
10 8 6 4 2 2 4 6 8 10
INDIVIDUAL COHESION STRUCTURAL COHESION
Individual C.
Structural C.
AustriaBelgiumBulgariaCroatiaCyprusCzech Rep.DenmarkEstoniaFinlandFranceGermanyGreeceHungaryIreland
ItalyLatviaLithuaniaLuxembourgMaltaNetherlandsPolandPortugalRomaniaSlovakiaSloveniaSpainSwedenUK
Czech Rep. 2017 vs. Czech Rep. 2007 EU 2017
4.2 6.4
Czech Rep. 2017 vs. Czech Rep. 2007 EU 2017
0.1
0.2
0.9
0.8
0.2
0.1
0.2
5.2
0.0
1.0
0.0 1.0
Design Overall Results Rankings Countriesecfr.eu/eucohesionmonitor Intro

RESILIENCE
ECONOMIC TIES
FUNDING
NEIGHBOURHOOD
POLICY INTEGRATION
SECURITY
EXPERIENCE
ENGAGEMENT
ATTITUDES
APPROVAL
10 8 6 4 2 2 4 6 8 10
INDIVIDUAL COHESION STRUCTURAL COHESION
Individual C.
Structural C.
AustriaBelgiumBulgariaCroatiaCyprusCzech Rep.DenmarkEstoniaFinlandFranceGermanyGreeceHungaryIreland
ItalyLatviaLithuaniaLuxembourgMaltaNetherlandsPolandPortugalRomaniaSlovakiaSloveniaSpainSwedenUK
Czech Rep. 2017 vs. Czech Rep. 2007 EU 2017
4.2 6.4
Czech Rep. 2017 vs. Czech Rep. 2007 EU 2017
Design Overall Results Rankings Countriesecfr.eu/eucohesionmonitor Intro

RESILIENCE
ECONOMIC TIES
FUNDING
NEIGHBOURHOOD
POLICY INTEGRATION
SECURITY
EXPERIENCE
ENGAGEMENT
ATTITUDES
APPROVAL
10 8 6 4 2 2 4 6 8 10
INDIVIDUAL COHESION STRUCTURAL COHESION
Individual C.
Structural C.
AustriaBelgiumBulgariaCroatiaCyprusCzech Rep.DenmarkEstoniaFinlandFranceGermanyGreeceHungaryIreland
ItalyLatviaLithuaniaLuxembourgMaltaNetherlandsPolandPortugalRomaniaSlovakiaSloveniaSpainSwedenUK
Denmark 2017 vs. Denmark 2007 EU 2017
6.1 4.1
Denmark 2017 vs. Denmark 2007 EU 2017
0.8
0.1
1.0
0.5
0.1
0.9
0.2
0.4
0.0
0.5
0.1 0.2
Design Overall Results Rankings Countriesecfr.eu/eucohesionmonitor Intro

RESILIENCE
ECONOMIC TIES
FUNDING
NEIGHBOURHOOD
POLICY INTEGRATION
SECURITY
EXPERIENCE
ENGAGEMENT
ATTITUDES
APPROVAL
10 8 6 4 2 2 4 6 8 10
INDIVIDUAL COHESION STRUCTURAL COHESION
Individual C.
Structural C.
AustriaBelgiumBulgariaCroatiaCyprusCzech Rep.DenmarkEstoniaFinlandFranceGermanyGreeceHungaryIreland
ItalyLatviaLithuaniaLuxembourgMaltaNetherlandsPolandPortugalRomaniaSlovakiaSloveniaSpainSwedenUK
Denmark 2017 vs. Denmark 2007 EU 2017
6.1 4.1
Denmark 2017 vs. Denmark 2007 EU 2017
Design Overall Results Rankings Countriesecfr.eu/eucohesionmonitor Intro

RESILIENCE
ECONOMIC TIES
FUNDING
NEIGHBOURHOOD
POLICY INTEGRATION
SECURITY
EXPERIENCE
ENGAGEMENT
ATTITUDES
APPROVAL
10 8 6 4 2 2 4 6 8 10
INDIVIDUAL COHESION STRUCTURAL COHESION
Individual C.
Structural C.
AustriaBelgiumBulgariaCroatiaCyprusCzech Rep.DenmarkEstoniaFinlandFranceGermanyGreeceHungaryIreland
ItalyLatviaLithuaniaLuxembourgMaltaNetherlandsPolandPortugalRomaniaSlovakiaSloveniaSpainSwedenUK
Estonia 2017 vs. Estonia 2007 EU 2017
6.7 5.8
Estonia 2017 vs. Estonia 2007 EU 2017
0.8
2.2
0.1
0.5
0.0
0.2
0.1
2.6
0.0
2.0
0.6 0.7
Design Overall Results Rankings Countriesecfr.eu/eucohesionmonitor Intro

RESILIENCE
ECONOMIC TIES
FUNDING
NEIGHBOURHOOD
POLICY INTEGRATION
SECURITY
EXPERIENCE
ENGAGEMENT
ATTITUDES
APPROVAL
10 8 6 4 2 2 4 6 8 10
INDIVIDUAL COHESION STRUCTURAL COHESION
Individual C.
Structural C.
AustriaBelgiumBulgariaCroatiaCyprusCzech Rep.DenmarkEstoniaFinlandFranceGermanyGreeceHungaryIreland
ItalyLatviaLithuaniaLuxembourgMaltaNetherlandsPolandPortugalRomaniaSlovakiaSloveniaSpainSwedenUK
Estonia 2017 vs. Estonia 2007 EU 2017
6.7 5.8
Estonia 2017 vs. Estonia 2007 EU 2017
Design Overall Results Rankings Countriesecfr.eu/eucohesionmonitor Intro

RESILIENCE
ECONOMIC TIES
FUNDING
NEIGHBOURHOOD
POLICY INTEGRATION
SECURITY
EXPERIENCE
ENGAGEMENT
ATTITUDES
APPROVAL
10 8 6 4 2 2 4 6 8 10
INDIVIDUAL COHESION STRUCTURAL COHESION
Individual C.
Structural C.
AustriaBelgiumBulgariaCroatiaCyprusCzech Rep.DenmarkEstoniaFinlandFranceGermanyGreeceHungaryIreland
ItalyLatviaLithuaniaLuxembourgMaltaNetherlandsPolandPortugalRomaniaSlovakiaSloveniaSpainSwedenUK
Finland 2017 vs. Finland 2007 EU 2017
6.3 4.9
Finland 2017 vs. Finland 2007 EU 2017
0.6
1.4
1.6
1.9
1.0
0.1
0.3
0.6
0.0
0.0
0.5 0.0
Design Overall Results Rankings Countriesecfr.eu/eucohesionmonitor Intro

RESILIENCE
ECONOMIC TIES
FUNDING
NEIGHBOURHOOD
POLICY INTEGRATION
SECURITY
EXPERIENCE
ENGAGEMENT
ATTITUDES
APPROVAL
10 8 6 4 2 2 4 6 8 10
INDIVIDUAL COHESION STRUCTURAL COHESION
Individual C.
Structural C.
AustriaBelgiumBulgariaCroatiaCyprusCzech Rep.DenmarkEstoniaFinlandFranceGermanyGreeceHungaryIreland
ItalyLatviaLithuaniaLuxembourgMaltaNetherlandsPolandPortugalRomaniaSlovakiaSloveniaSpainSwedenUK
Finland 2017 vs. Finland 2007 EU 2017
6.3 4.9
Finland 2017 vs. Finland 2007 EU 2017
Design Overall Results Rankings Countriesecfr.eu/eucohesionmonitor Intro

RESILIENCE
ECONOMIC TIES
FUNDING
NEIGHBOURHOOD
POLICY INTEGRATION
SECURITY
EXPERIENCE
ENGAGEMENT
ATTITUDES
APPROVAL
10 8 6 4 2 2 4 6 8 10
INDIVIDUAL COHESION STRUCTURAL COHESION
Individual C.
Structural C.
AustriaBelgiumBulgariaCroatiaCyprusCzech Rep.DenmarkEstoniaFinlandFranceGermanyGreeceHungaryIreland
ItalyLatviaLithuaniaLuxembourgMaltaNetherlandsPolandPortugalRomaniaSlovakiaSloveniaSpainSwedenUK
France 2017 vs. France 2007 EU 2017
5.3 4.8
France 2017 vs. France 2007 EU 2017
0.4
0.8
2.1
0.8
1.5
1.2
0.9
0.5
0.0
0.0
0.5 0.6
Design Overall Results Rankings Countriesecfr.eu/eucohesionmonitor Intro

RESILIENCE
ECONOMIC TIES
FUNDING
NEIGHBOURHOOD
POLICY INTEGRATION
SECURITY
EXPERIENCE
ENGAGEMENT
ATTITUDES
APPROVAL
10 8 6 4 2 2 4 6 8 10
INDIVIDUAL COHESION STRUCTURAL COHESION
Individual C.
Structural C.
AustriaBelgiumBulgariaCroatiaCyprusCzech Rep.DenmarkEstoniaFinlandFranceGermanyGreeceHungaryIreland
ItalyLatviaLithuaniaLuxembourgMaltaNetherlandsPolandPortugalRomaniaSlovakiaSloveniaSpainSwedenUK
France 2017 vs. France 2007 EU 2017
5.3 4.8
France 2017 vs. France 2007 EU 2017
Design Overall Results Rankings Countriesecfr.eu/eucohesionmonitor Intro
RESILIENCE
ECONOMIC TIES
FUNDING
NEIGHBOURHOOD
POLICY INTEGRATION
SECURITY
EXPERIENCE
ENGAGEMENT
ATTITUDES
APPROVAL
10 8 6 4 2 2 4 6 8 10
INDIVIDUAL COHESION STRUCTURAL COHESION
Individual C.
Structural C.
AustriaBelgiumBulgariaCroatiaCyprusCzech Rep.DenmarkEstoniaFinlandFranceGermanyGreeceHungaryIreland
ItalyLatviaLithuaniaLuxembourgMaltaNetherlandsPolandPortugalRomaniaSlovakiaSloveniaSpainSwedenUK
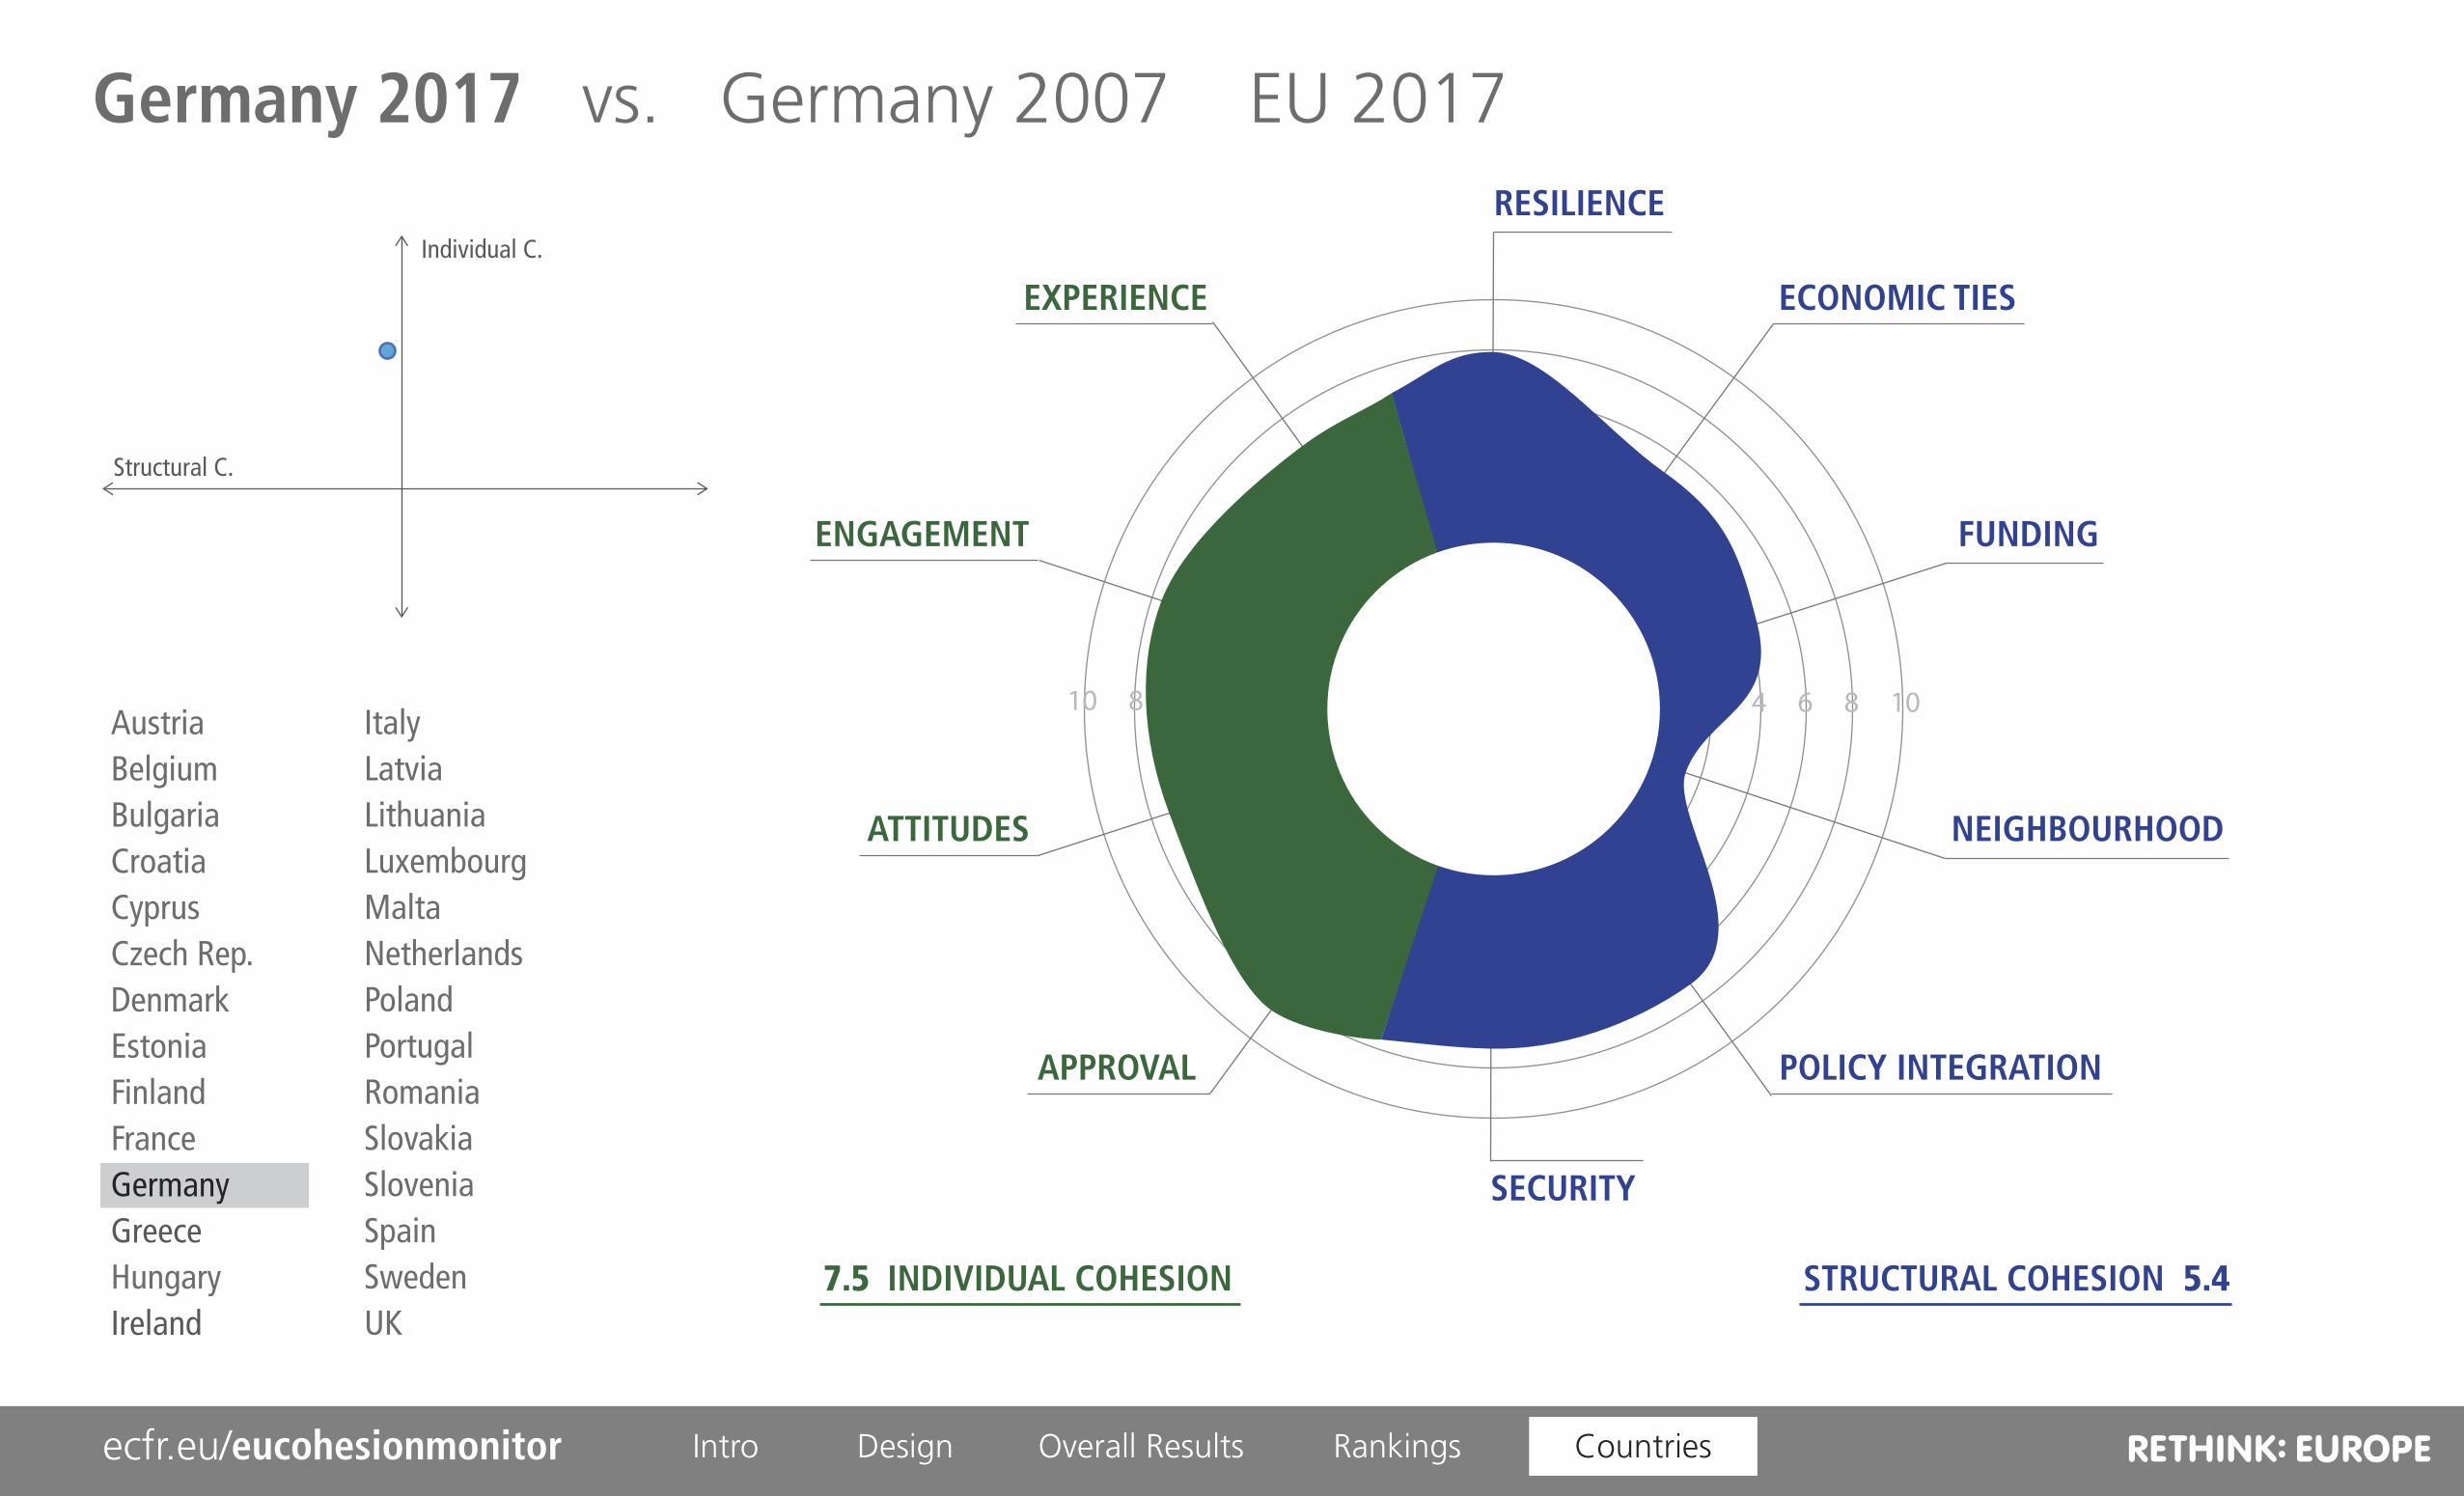
Germany 2017 vs. Germany 2007 EU 2017
7.5 5.4
Design Overall Results Rankings Countriesecfr.eu/eucohesionmonitor Intro

RESILIENCE
ECONOMIC TIES
FUNDING
NEIGHBOURHOOD
POLICY INTEGRATION
SECURITY
EXPERIENCE
ENGAGEMENT
ATTITUDES
APPROVAL
10 8 6 4 2 2 4 6 8 10
INDIVIDUAL COHESION STRUCTURAL COHESION
Individual C.
Structural C.
AustriaBelgiumBulgariaCroatiaCyprusCzech Rep.DenmarkEstoniaFinlandFranceGermanyGreeceHungaryIreland
ItalyLatviaLithuaniaLuxembourgMaltaNetherlandsPolandPortugalRomaniaSlovakiaSloveniaSpainSwedenUK
Germany 2017 vs. Germany 2007 EU 2017
7.5 5.4
Germany 2017 vs. Germany 2007 EU 2017
1.0
2.0
0.9
1.2
0.0
0.4
0.0
0.3
0.0
0.0
0.8 0.0
Design Overall Results Rankings Countriesecfr.eu/eucohesionmonitor Intro

RESILIENCE
ECONOMIC TIES
FUNDING
NEIGHBOURHOOD
POLICY INTEGRATION
SECURITY
EXPERIENCE
ENGAGEMENT
ATTITUDES
APPROVAL
10 8 6 4 2 2 4 6 8 10
INDIVIDUAL COHESION STRUCTURAL COHESION
Individual C.
Structural C.
AustriaBelgiumBulgariaCroatiaCyprusCzech Rep.DenmarkEstoniaFinlandFranceGermanyGreeceHungaryIreland
ItalyLatviaLithuaniaLuxembourgMaltaNetherlandsPolandPortugalRomaniaSlovakiaSloveniaSpainSwedenUK
Germany 2017 vs. Germany 2007 EU 2017
7.5 5.4
Germany 2017 vs. Germany 2007 EU 2017
Design Overall Results Rankings Countriesecfr.eu/eucohesionmonitor Intro
RESILIENCE
ECONOMIC TIES
FUNDING
NEIGHBOURHOOD
POLICY INTEGRATION
SECURITY
EXPERIENCE
ENGAGEMENT
ATTITUDES
APPROVAL
10 8 6 4 2 2 4 6 8 10
INDIVIDUAL COHESION STRUCTURAL COHESION
Individual C.
Structural C.
AustriaBelgiumBulgariaCroatiaCyprusCzech Rep.DenmarkEstoniaFinlandFranceGermanyGreeceHungaryIreland
ItalyLatviaLithuaniaLuxembourgMaltaNetherlandsPolandPortugalRomaniaSlovakiaSloveniaSpainSwedenUK
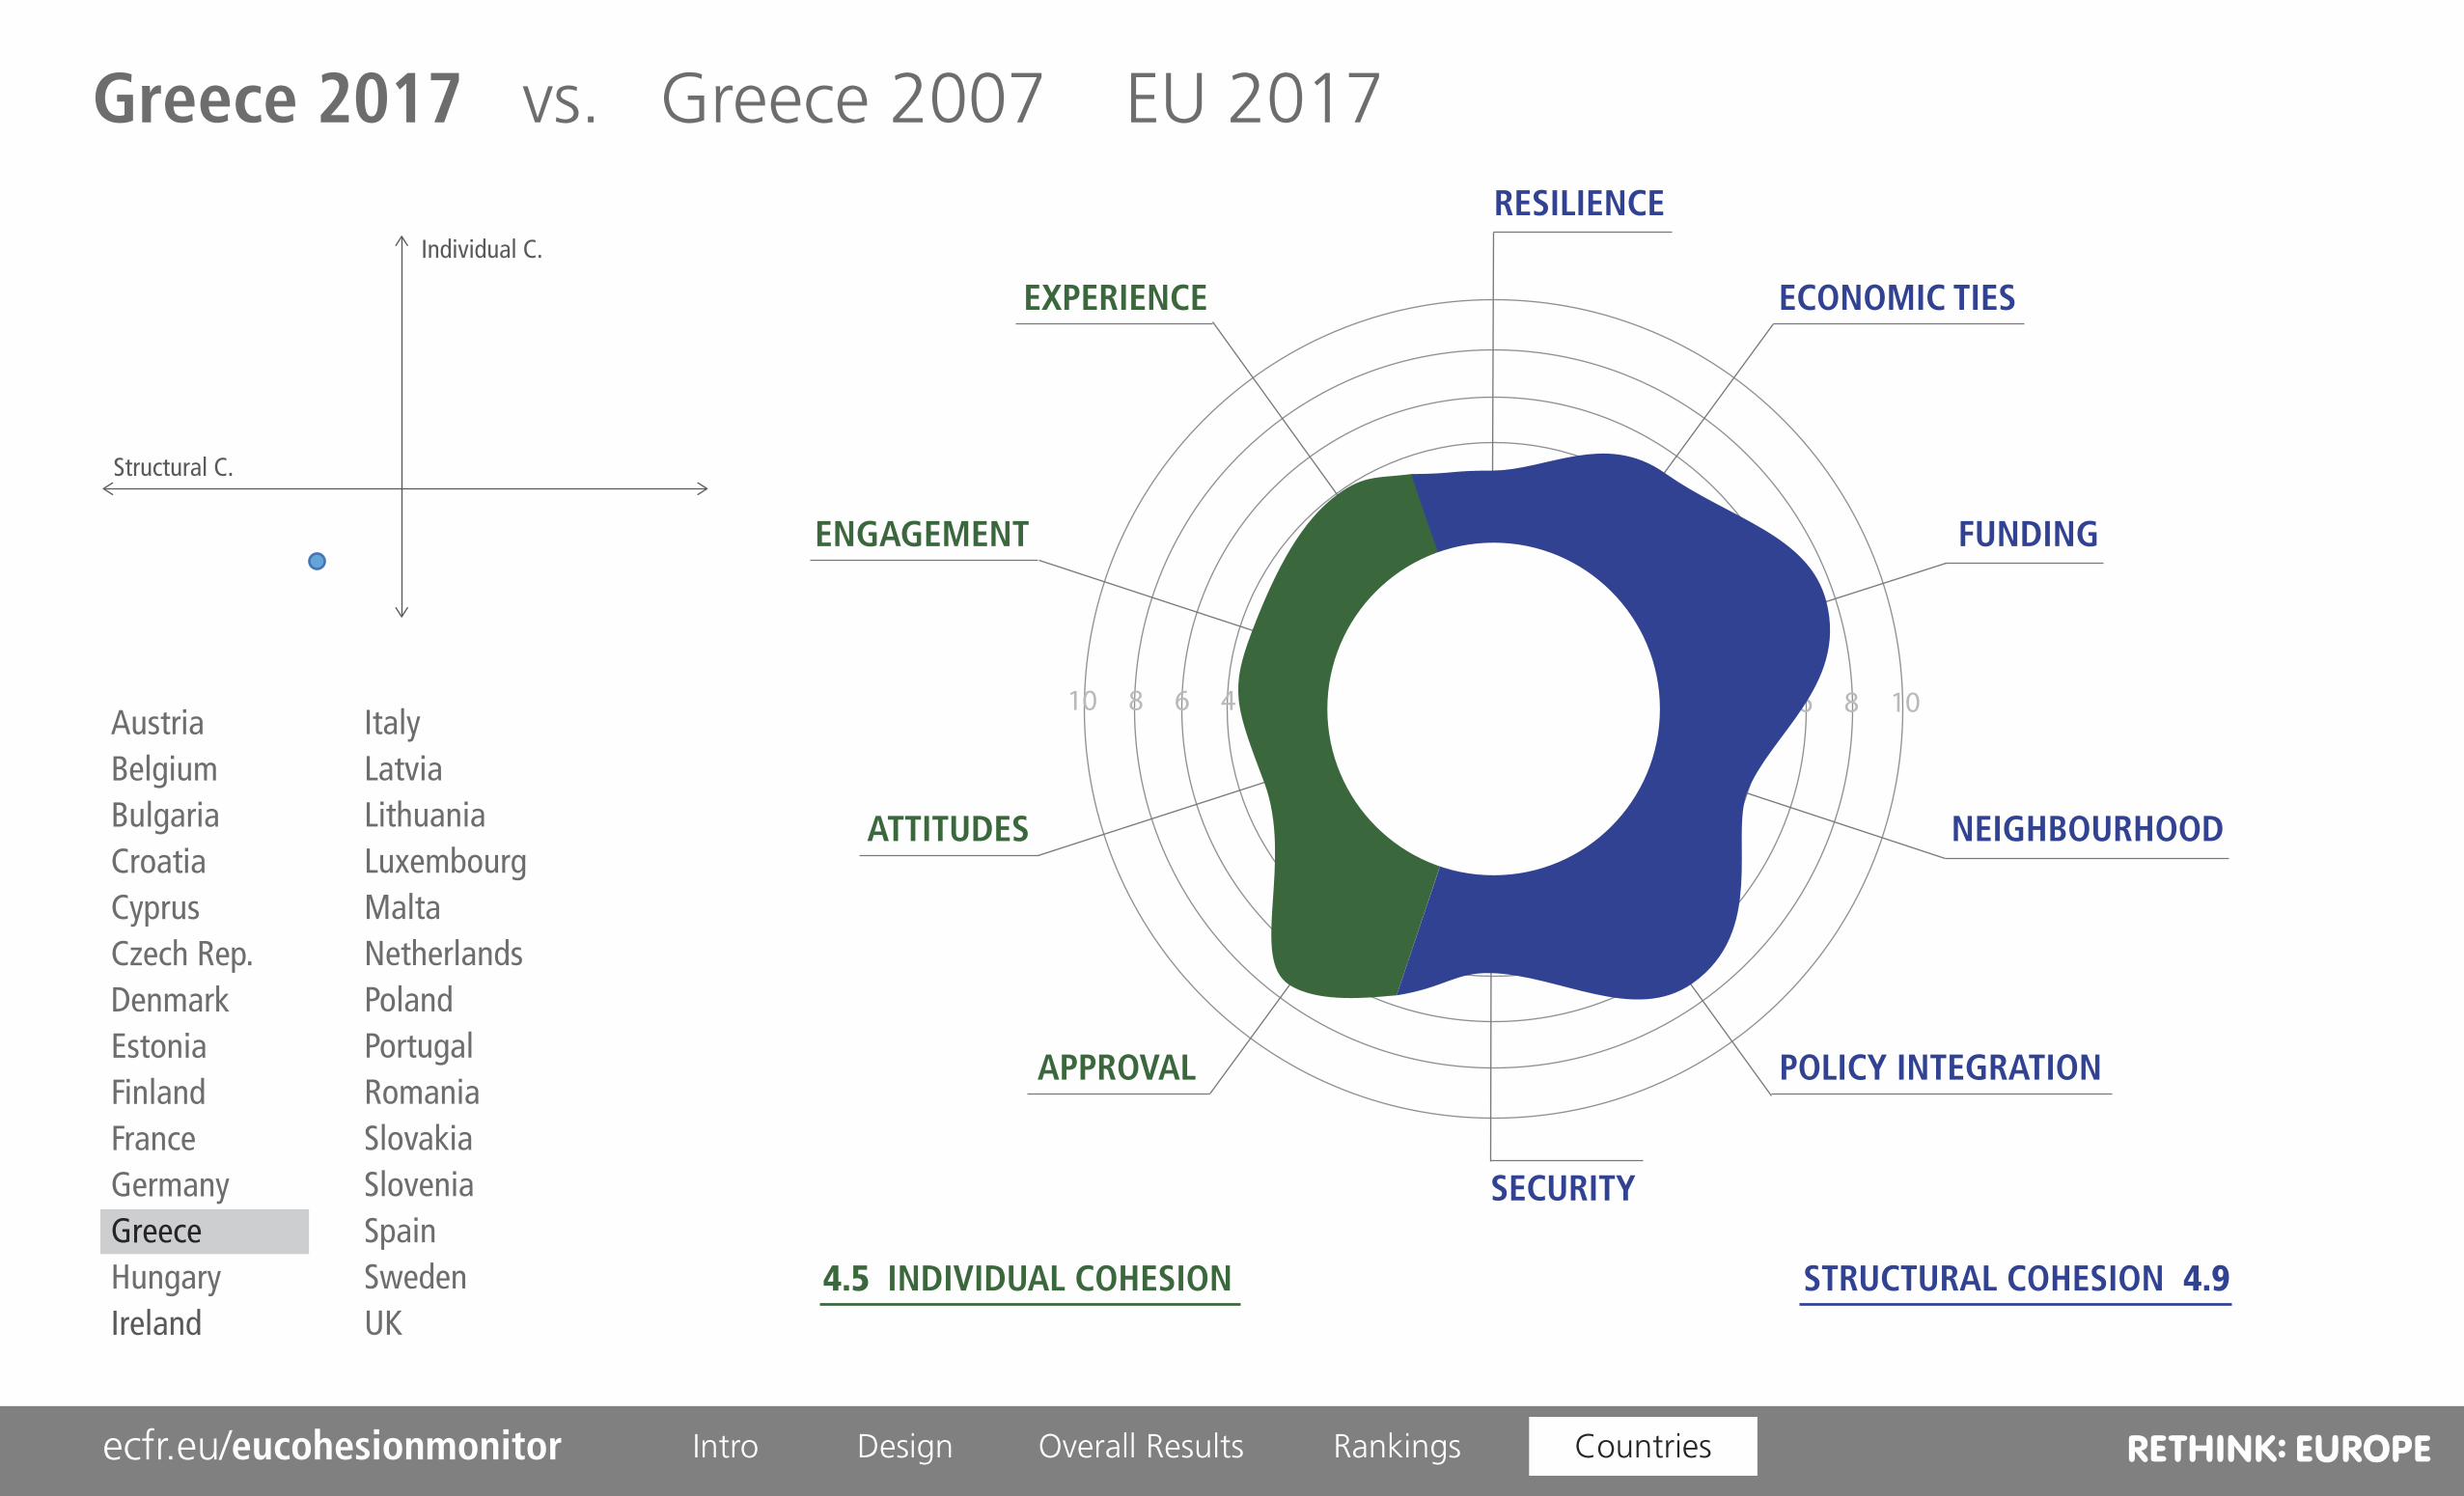
Greece 2017 vs. Greece 2007 EU 2017
4.5 4.9
Design Overall Results Rankings Countriesecfr.eu/eucohesionmonitor Intro

RESILIENCE
ECONOMIC TIES
FUNDING
NEIGHBOURHOOD
POLICY INTEGRATION
SECURITY
EXPERIENCE
ENGAGEMENT
ATTITUDES
APPROVAL
10 8 6 4 2 2 4 6 8 10
INDIVIDUAL COHESION STRUCTURAL COHESION
Individual C.
Structural C.
AustriaBelgiumBulgariaCroatiaCyprusCzech Rep.DenmarkEstoniaFinlandFranceGermanyGreeceHungaryIreland
ItalyLatviaLithuaniaLuxembourgMaltaNetherlandsPolandPortugalRomaniaSlovakiaSloveniaSpainSwedenUK
Greece 2017 vs. Greece 2007 EU 2017
4.5 4.9
Greece 2017 vs. Greece 2007 EU 2017
0.9
1.0
4.2
3.4
2.1
1.1
0.2
0.8
0.0
0.0
1.4 0.0
Design Overall Results Rankings Countriesecfr.eu/eucohesionmonitor Intro

RESILIENCE
ECONOMIC TIES
FUNDING
NEIGHBOURHOOD
POLICY INTEGRATION
SECURITY
EXPERIENCE
ENGAGEMENT
ATTITUDES
APPROVAL
10 8 6 4 2 2 4 6 8 10
INDIVIDUAL COHESION STRUCTURAL COHESION
Individual C.
Structural C.
AustriaBelgiumBulgariaCroatiaCyprusCzech Rep.DenmarkEstoniaFinlandFranceGermanyGreeceHungaryIreland
ItalyLatviaLithuaniaLuxembourgMaltaNetherlandsPolandPortugalRomaniaSlovakiaSloveniaSpainSwedenUK
Greece 2017 vs. Greece 2007 EU 2017
4.5 4.9
Greece 2017 vs. Greece 2007 EU 2017
Design Overall Results Rankings Countriesecfr.eu/eucohesionmonitor Intro
RESILIENCE
ECONOMIC TIES
FUNDING
NEIGHBOURHOOD
POLICY INTEGRATION
SECURITY
EXPERIENCE
ENGAGEMENT
ATTITUDES
APPROVAL
10 8 6 4 2 2 4 6 8 10
INDIVIDUAL COHESION STRUCTURAL COHESION
Individual C.
Structural C.
AustriaBelgiumBulgariaCroatiaCyprusCzech Rep.DenmarkEstoniaFinlandFranceGermanyGreeceHungaryIreland
ItalyLatviaLithuaniaLuxembourgMaltaNetherlandsPolandPortugalRomaniaSlovakiaSloveniaSpainSwedenUK
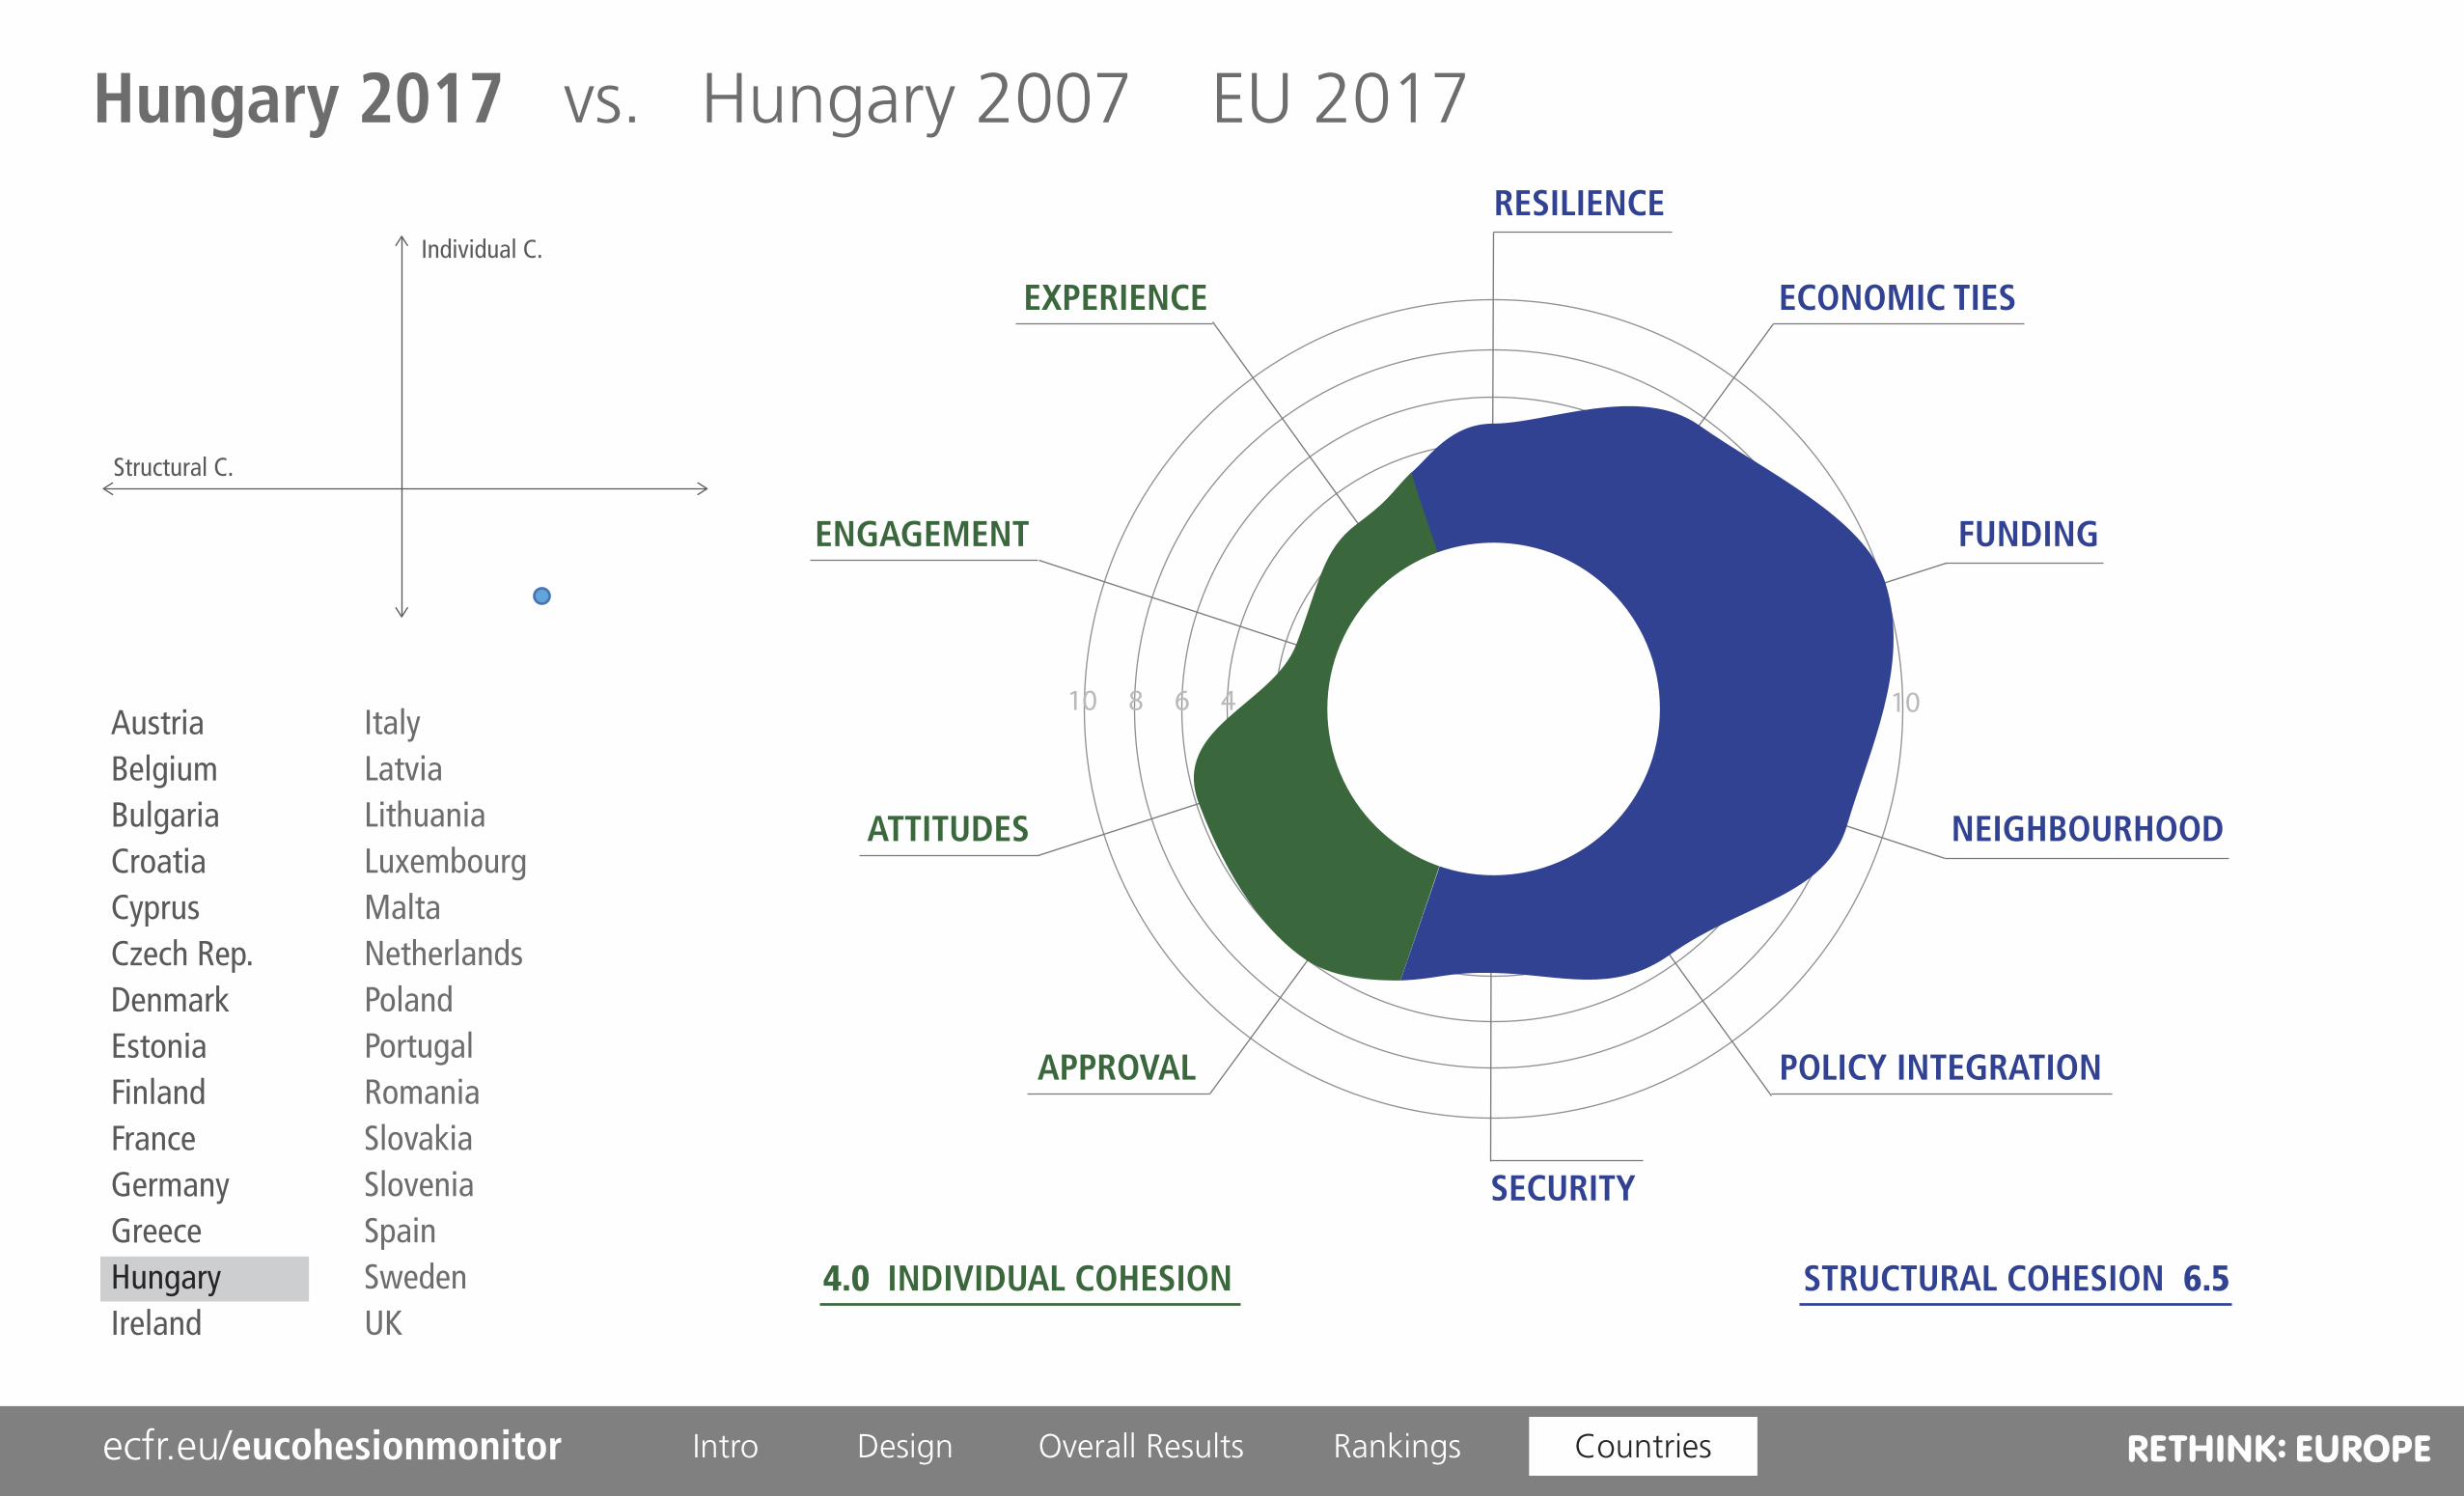
Hungary 2017 vs. Hungary 2007 EU 2017
4.0 6.5
Design Overall Results Rankings Countriesecfr.eu/eucohesionmonitor Intro

RESILIENCE
ECONOMIC TIES
FUNDING
NEIGHBOURHOOD
POLICY INTEGRATION
SECURITY
EXPERIENCE
ENGAGEMENT
ATTITUDES
APPROVAL
10 8 6 4 2 2 4 6 8 10
INDIVIDUAL COHESION STRUCTURAL COHESION
Individual C.
Structural C.
AustriaBelgiumBulgariaCroatiaCyprusCzech Rep.DenmarkEstoniaFinlandFranceGermanyGreeceHungaryIreland
ItalyLatviaLithuaniaLuxembourgMaltaNetherlandsPolandPortugalRomaniaSlovakiaSloveniaSpainSwedenUK
Hungary 2017 vs. Hungary 2007 EU 2017
4.0 6.5
Hungary 2017 vs. Hungary 2007 EU 2017
0.1
0.3
1.2
0.0
0.5
0.2
0.0
7.3
0.0
0.5
0.4 1.2
Design Overall Results Rankings Countriesecfr.eu/eucohesionmonitor Intro

RESILIENCE
ECONOMIC TIES
FUNDING
NEIGHBOURHOOD
POLICY INTEGRATION
SECURITY
EXPERIENCE
ENGAGEMENT
ATTITUDES
APPROVAL
10 8 6 4 2 2 4 6 8 10
INDIVIDUAL COHESION STRUCTURAL COHESION
Individual C.
Structural C.
AustriaBelgiumBulgariaCroatiaCyprusCzech Rep.DenmarkEstoniaFinlandFranceGermanyGreeceHungaryIreland
ItalyLatviaLithuaniaLuxembourgMaltaNetherlandsPolandPortugalRomaniaSlovakiaSloveniaSpainSwedenUK
Hungary 2017 vs. Hungary 2007 EU 2017
4.0 6.5
Hungary 2017 vs. Hungary 2007 EU 2017
Design Overall Results Rankings Countriesecfr.eu/eucohesionmonitor Intro

RESILIENCE
ECONOMIC TIES
FUNDING
NEIGHBOURHOOD
POLICY INTEGRATION
SECURITY
EXPERIENCE
ENGAGEMENT
ATTITUDES
APPROVAL
10 8 6 4 2 2 4 6 8 10
INDIVIDUAL COHESION STRUCTURAL COHESION
Individual C.
Structural C.
AustriaBelgiumBulgariaCroatiaCyprusCzech Rep.DenmarkEstoniaFinlandFranceGermanyGreeceHungaryIreland
ItalyLatviaLithuaniaLuxembourgMaltaNetherlandsPolandPortugalRomaniaSlovakiaSloveniaSpainSwedenUK
Ireland 2017 vs. Ireland 2007 EU 2017
8.0 3.7
Ireland 2017 vs. Ireland 2007 EU 2017
0.6
1.9
0.4
0.6
2.1
0.6
0.5
1.9
0.0
0.5
0.7 0.6
Design Overall Results Rankings Countriesecfr.eu/eucohesionmonitor Intro

RESILIENCE
ECONOMIC TIES
FUNDING
NEIGHBOURHOOD
POLICY INTEGRATION
SECURITY
EXPERIENCE
ENGAGEMENT
ATTITUDES
APPROVAL
10 8 6 4 2 2 4 6 8 10
INDIVIDUAL COHESION STRUCTURAL COHESION
Individual C.
Structural C.
AustriaBelgiumBulgariaCroatiaCyprusCzech Rep.DenmarkEstoniaFinlandFranceGermanyGreeceHungaryIreland
ItalyLatviaLithuaniaLuxembourgMaltaNetherlandsPolandPortugalRomaniaSlovakiaSloveniaSpainSwedenUK
Ireland 2017 vs. Ireland 2007 EU 2017
8.0 3.7
Ireland 2017 vs. Ireland 2007 EU 2017
Design Overall Results Rankings Countriesecfr.eu/eucohesionmonitor Intro

RESILIENCE
ECONOMIC TIES
FUNDING
NEIGHBOURHOOD
POLICY INTEGRATION
SECURITY
EXPERIENCE
ENGAGEMENT
ATTITUDES
APPROVAL
10 8 6 4 2 2 4 6 8 10
INDIVIDUAL COHESION STRUCTURAL COHESION
Individual C.
Structural C.
AustriaBelgiumBulgariaCroatiaCyprusCzech Rep.DenmarkEstoniaFinlandFranceGermanyGreeceHungaryIreland
ItalyLatviaLithuaniaLuxembourgMaltaNetherlandsPolandPortugalRomaniaSlovakiaSloveniaSpainSwedenUK
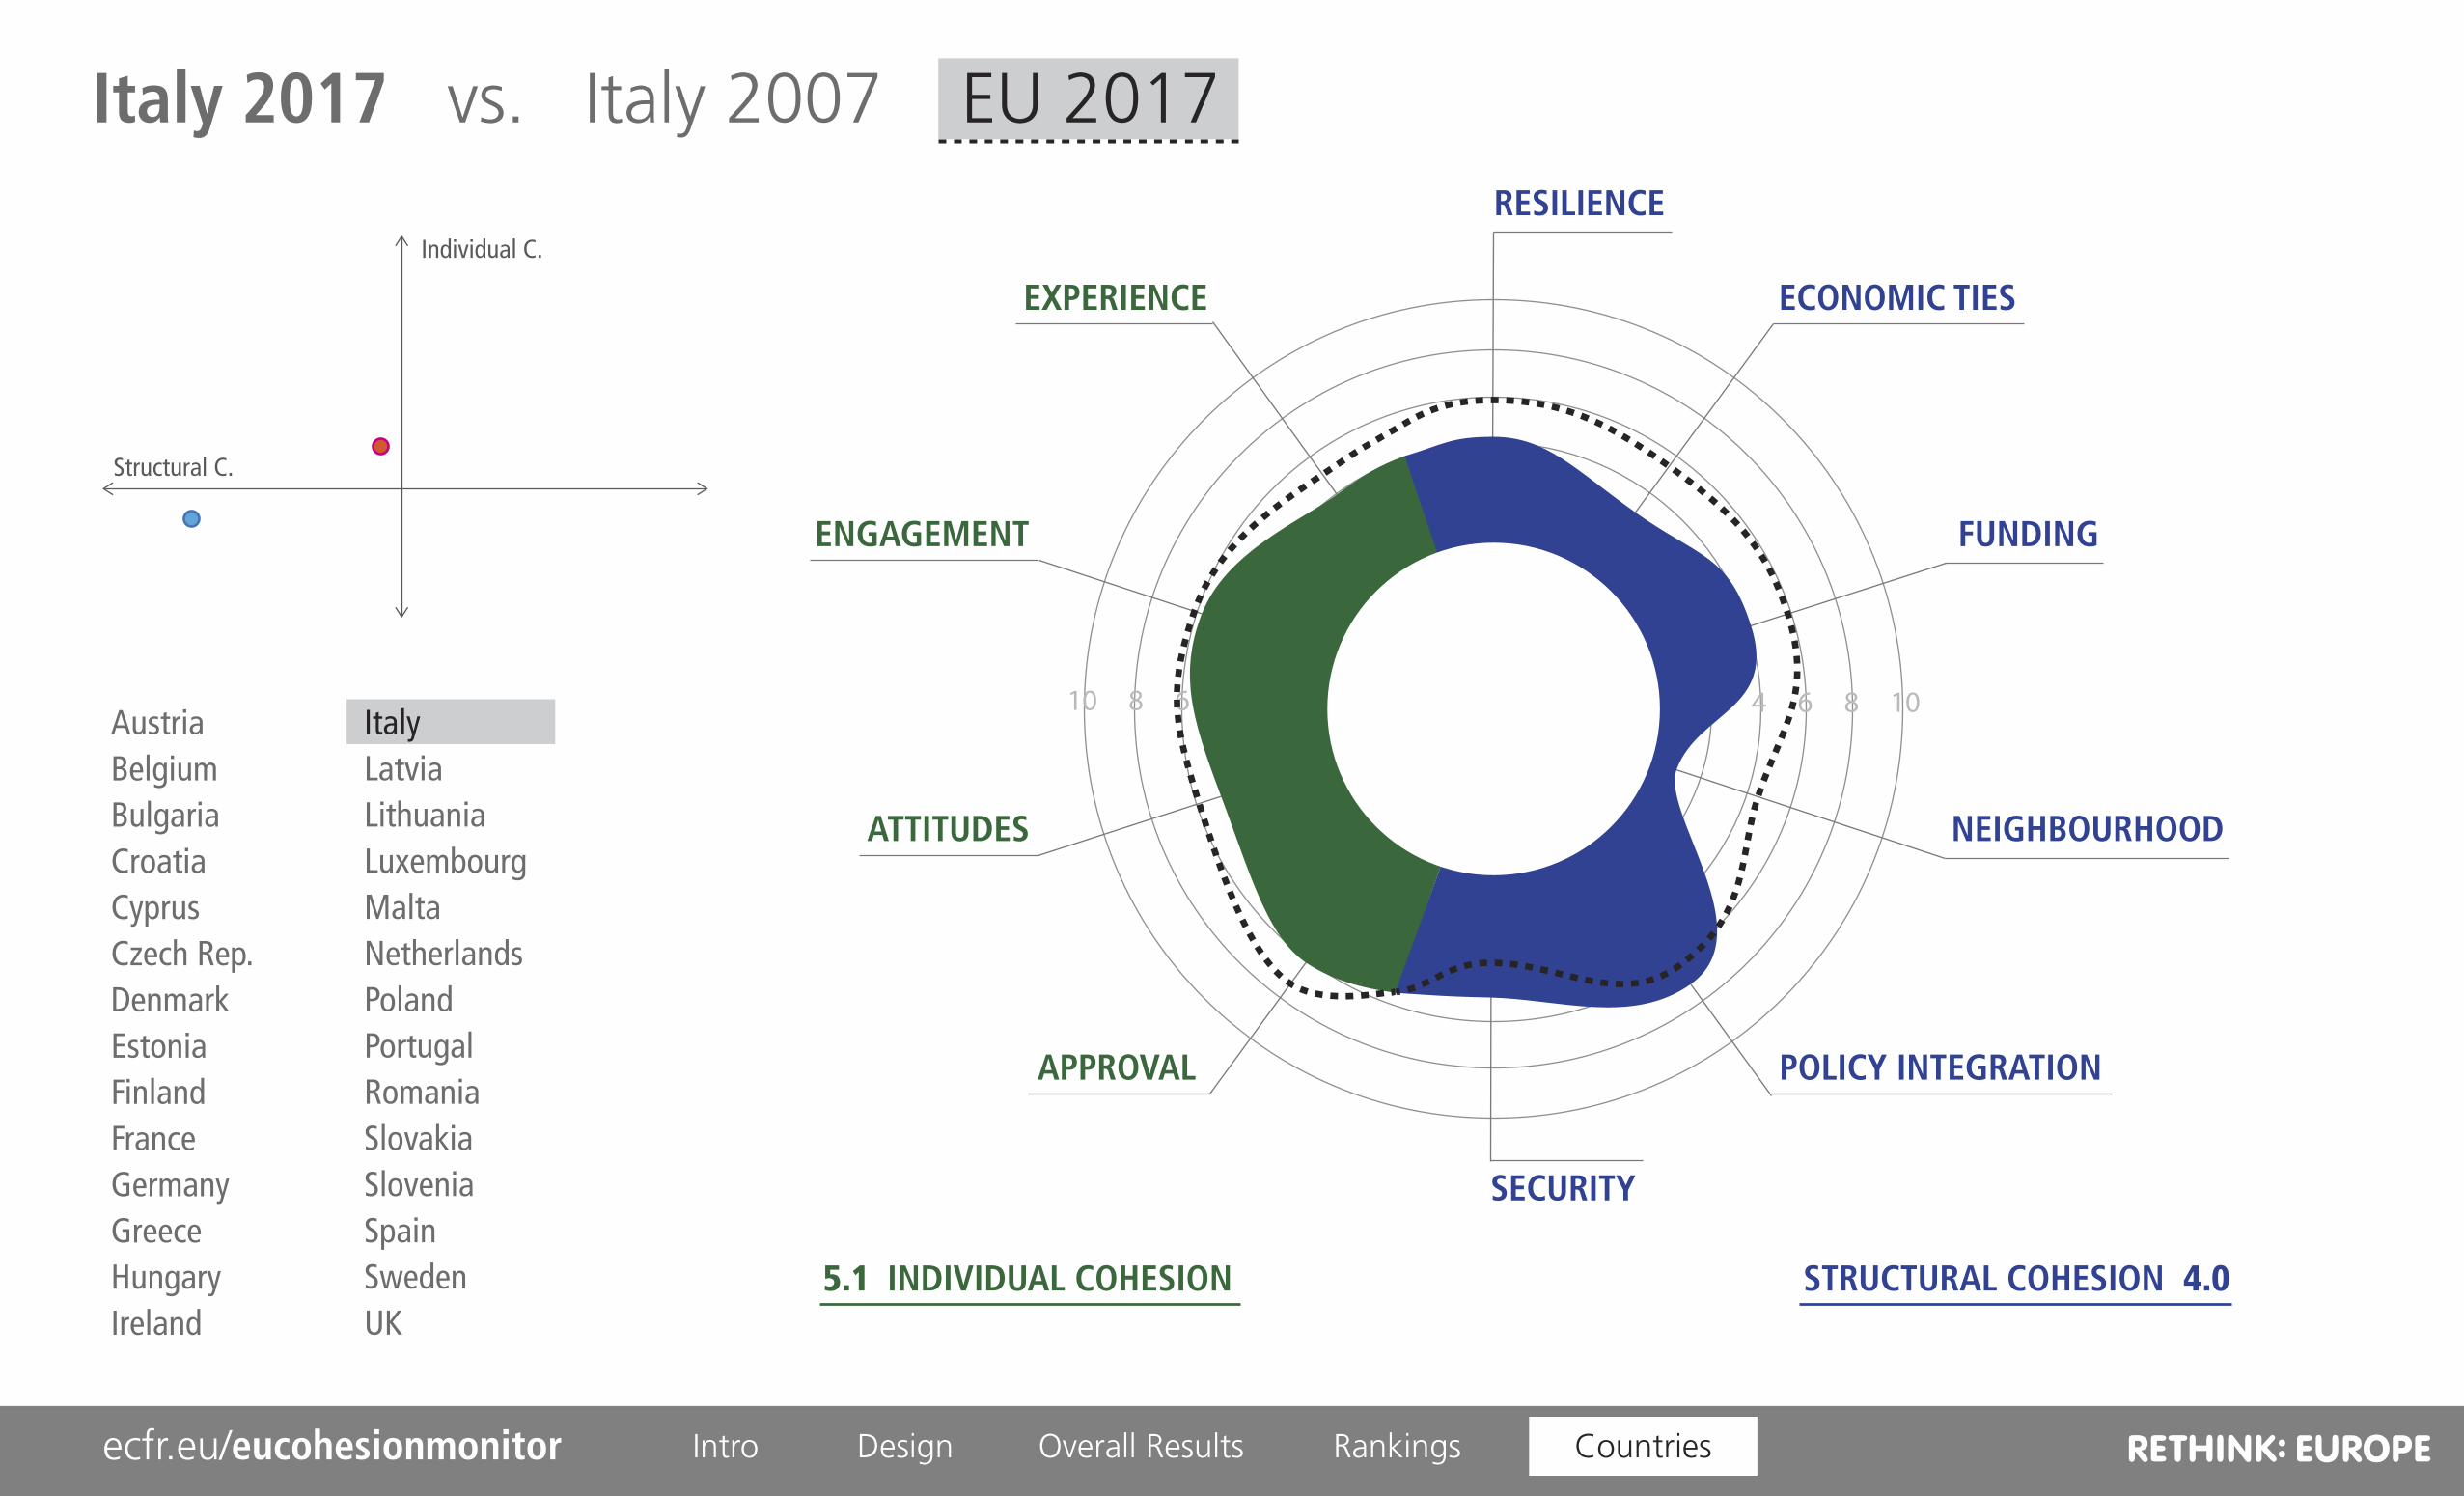
5.1 4.0
Italy 2017 vs. Italy 2007 EU 2017
Design Overall Results Rankings Countriesecfr.eu/eucohesionmonitor Intro

RESILIENCE
ECONOMIC TIES
FUNDING
NEIGHBOURHOOD
POLICY INTEGRATION
SECURITY
EXPERIENCE
ENGAGEMENT
ATTITUDES
APPROVAL
10 8 6 4 2 2 4 6 8 10
INDIVIDUAL COHESION STRUCTURAL COHESION
Individual C.
Structural C.
AustriaBelgiumBulgariaCroatiaCyprusCzech Rep.DenmarkEstoniaFinlandFranceGermanyGreeceHungaryIreland
ItalyLatviaLithuaniaLuxembourgMaltaNetherlandsPolandPortugalRomaniaSlovakiaSloveniaSpainSwedenUK
5.1 4.0
Italy 2017 vs. Italy 2007 EU 2017
0.3
0.3
3.7
0.7
1.6
2.4
0.6
0.3
0.0
0.0
1.0 0.7
Italy 2017 vs. Italy 2007 EU 2017
Design Overall Results Rankings Countriesecfr.eu/eucohesionmonitor Intro
RESILIENCE
ECONOMIC TIES
FUNDING
NEIGHBOURHOOD
POLICY INTEGRATION
SECURITY
EXPERIENCE
ENGAGEMENT
ATTITUDES
APPROVAL
10 8 6 4 2 2 4 6 8 10
INDIVIDUAL COHESION STRUCTURAL COHESION
Individual C.
Structural C.
AustriaBelgiumBulgariaCroatiaCyprusCzech Rep.DenmarkEstoniaFinlandFranceGermanyGreeceHungaryIreland
ItalyLatviaLithuaniaLuxembourgMaltaNetherlandsPolandPortugalRomaniaSlovakiaSloveniaSpainSwedenUK
5.1 4.0
Italy 2017 vs. Italy 2007 EU 2017Italy 2017 vs. Italy 2007 EU 2017
Design Overall Results Rankings Countriesecfr.eu/eucohesionmonitor Intro

RESILIENCE
ECONOMIC TIES
FUNDING
NEIGHBOURHOOD
POLICY INTEGRATION
SECURITY
EXPERIENCE
ENGAGEMENT
ATTITUDES
APPROVAL
10 8 6 4 2 2 4 6 8 10
INDIVIDUAL COHESION STRUCTURAL COHESION
Individual C.
Structural C.
AustriaBelgiumBulgariaCroatiaCyprusCzech Rep.DenmarkEstoniaFinlandFranceGermanyGreeceHungaryIreland
ItalyLatviaLithuaniaLuxembourgMaltaNetherlandsPolandPortugalRomaniaSlovakiaSloveniaSpainSwedenUK
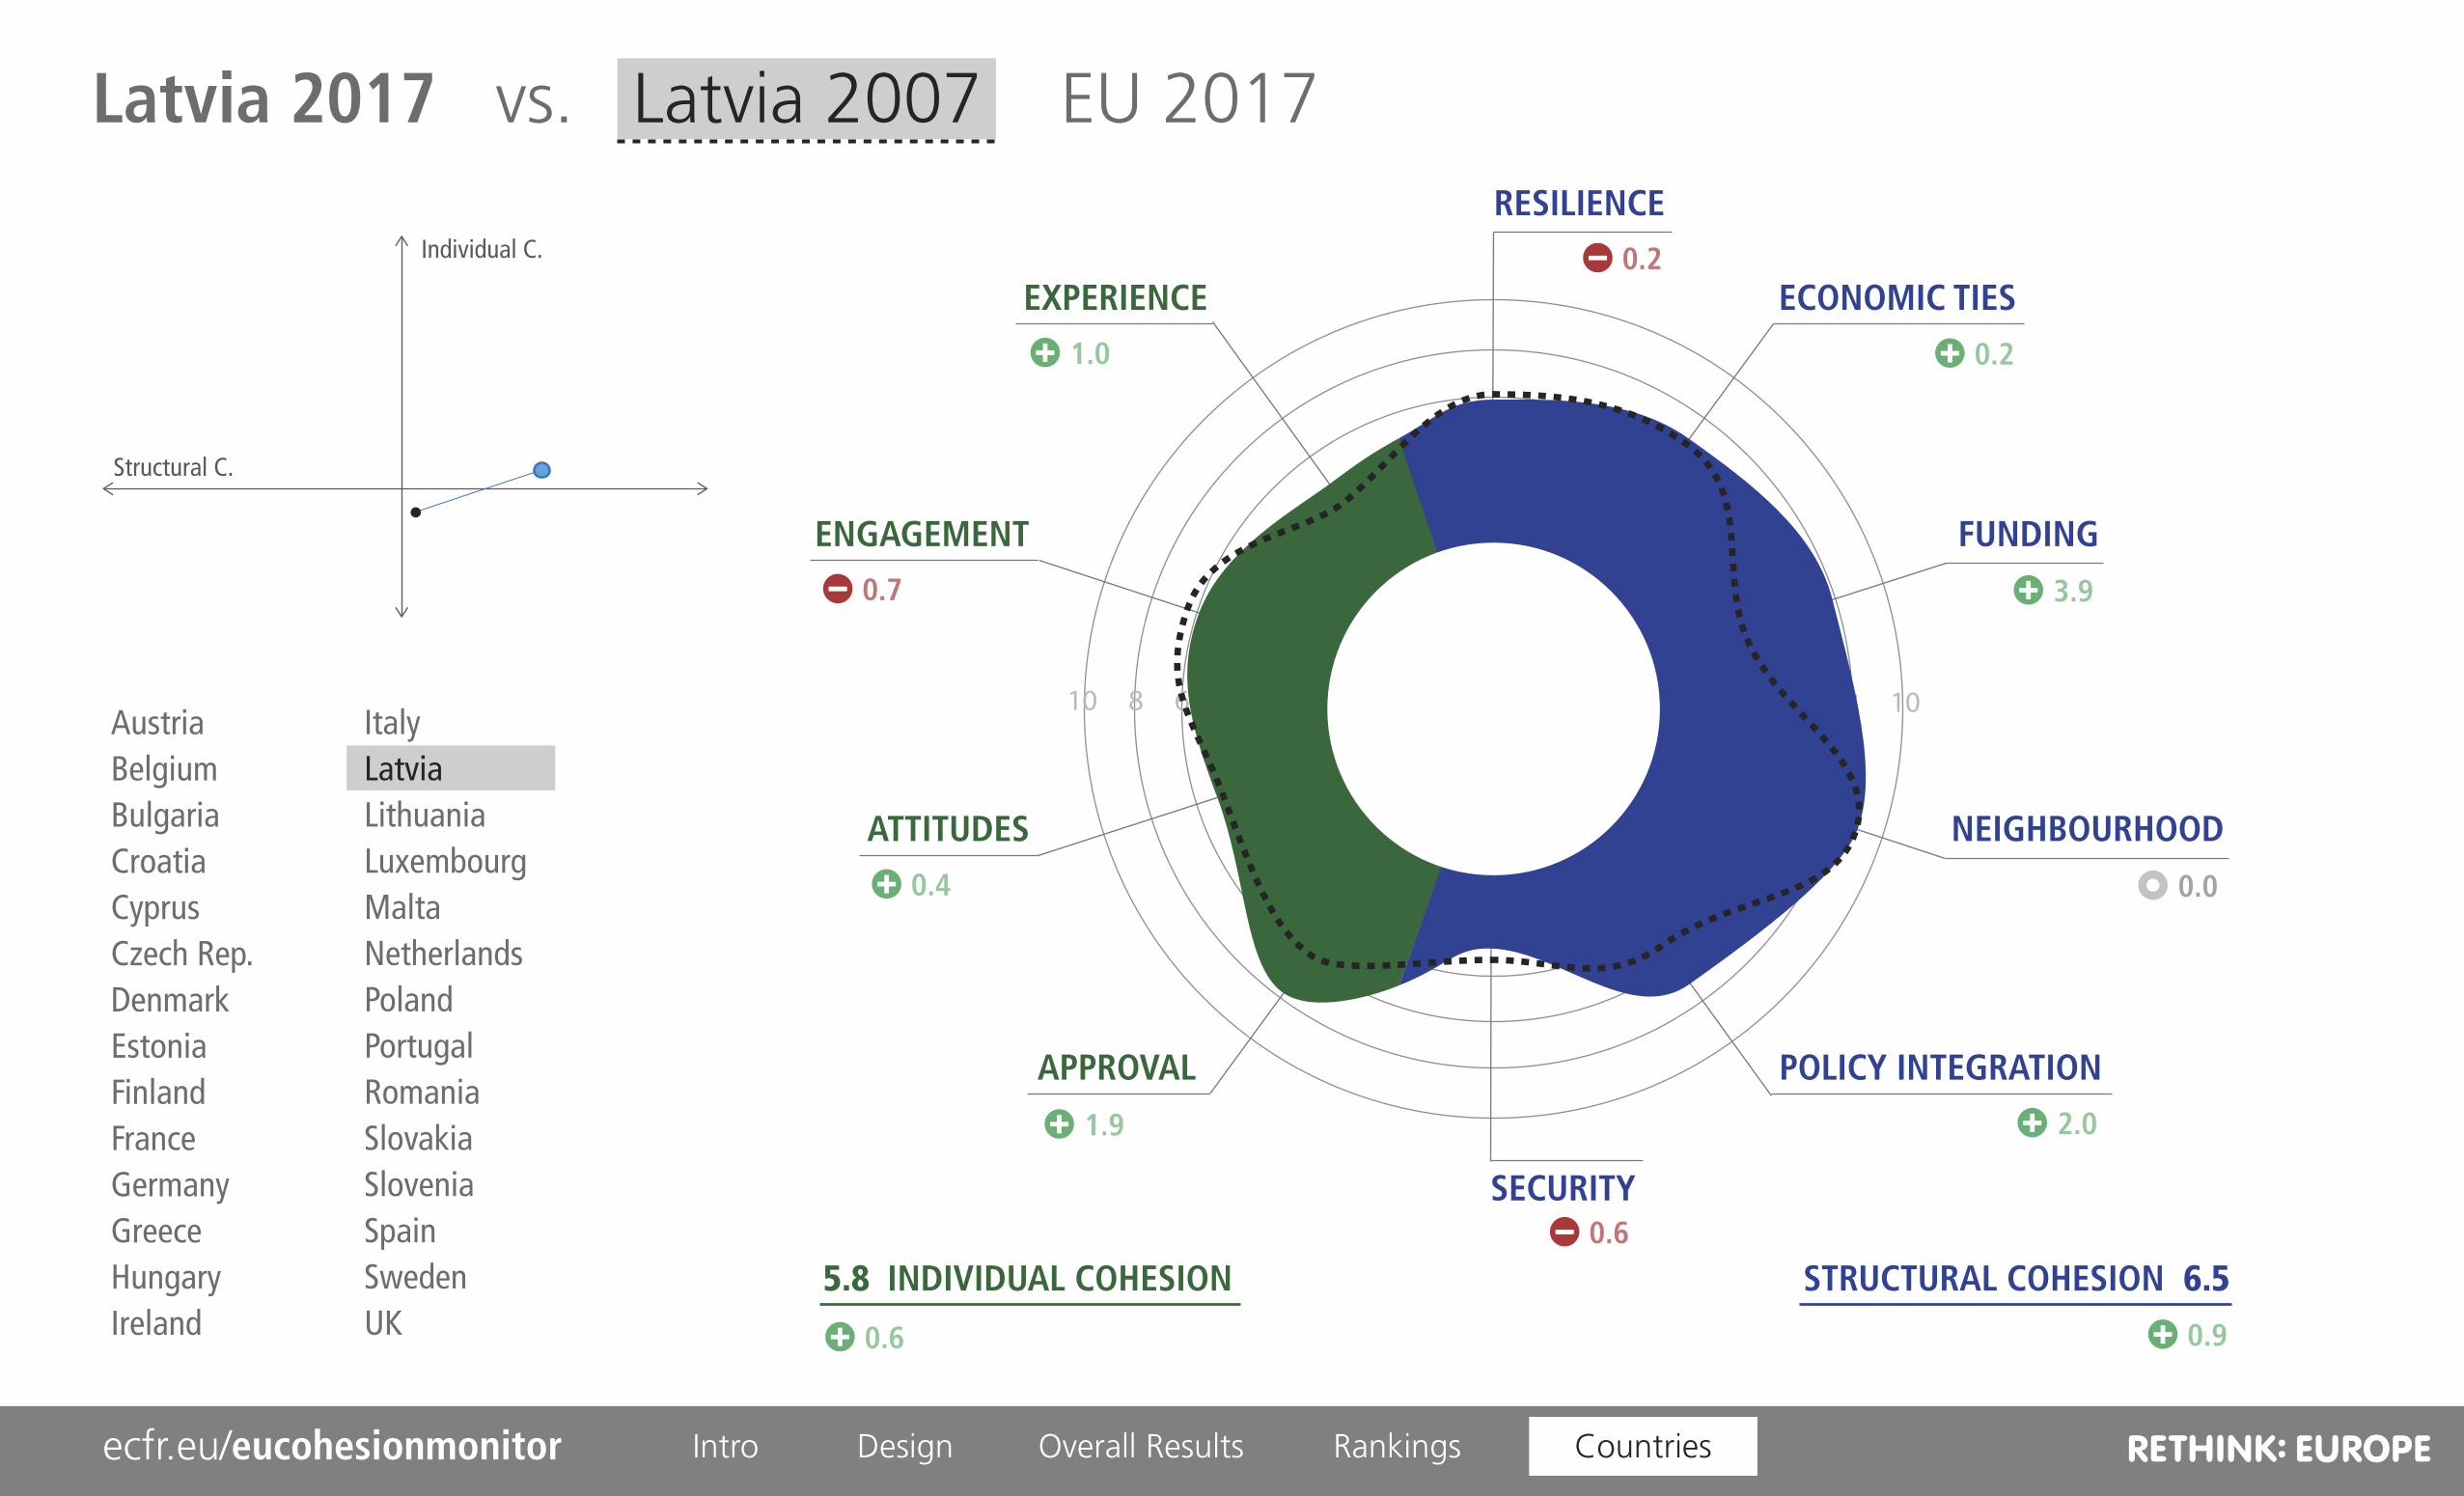
Latvia 2017 vs. Latvia 2007 EU 2017
5.8 6.5
Design Overall Results Rankings Countriesecfr.eu/eucohesionmonitor Intro
RESILIENCE
ECONOMIC TIES
FUNDING
NEIGHBOURHOOD
POLICY INTEGRATION
SECURITY
EXPERIENCE
ENGAGEMENT
ATTITUDES
APPROVAL
10 8 6 4 2 2 4 6 8 10
INDIVIDUAL COHESION STRUCTURAL COHESION
Individual C.
Structural C.
AustriaBelgiumBulgariaCroatiaCyprusCzech Rep.DenmarkEstoniaFinlandFranceGermanyGreeceHungaryIreland
ItalyLatviaLithuaniaLuxembourgMaltaNetherlandsPolandPortugalRomaniaSlovakiaSloveniaSpainSwedenUK
Latvia 2017 vs. Latvia 2007 EU 2017
5.8 6.5
1.0
1.9
0.7
0.4
0.2
0.2
0.6
3.9
0.0
2.0
0.6 0.9
Latvia 2017 vs. Latvia 2007 EU 2017
Design Overall Results Rankings Countriesecfr.eu/eucohesionmonitor Intro

RESILIENCE
ECONOMIC TIES
FUNDING
NEIGHBOURHOOD
POLICY INTEGRATION
SECURITY
EXPERIENCE
ENGAGEMENT
ATTITUDES
APPROVAL
10 8 6 4 2 2 4 6 8 10
INDIVIDUAL COHESION STRUCTURAL COHESION
Individual C.
Structural C.
AustriaBelgiumBulgariaCroatiaCyprusCzech Rep.DenmarkEstoniaFinlandFranceGermanyGreeceHungaryIreland
ItalyLatviaLithuaniaLuxembourgMaltaNetherlandsPolandPortugalRomaniaSlovakiaSloveniaSpainSwedenUK
Latvia 2017 vs. Latvia 2007 EU 2017
5.8 6.5
Latvia 2017 vs. Latvia 2007 EU 2017
Design Overall Results Rankings Countriesecfr.eu/eucohesionmonitor Intro

RESILIENCE
ECONOMIC TIES
FUNDING
NEIGHBOURHOOD
POLICY INTEGRATION
SECURITY
EXPERIENCE
ENGAGEMENT
ATTITUDES
APPROVAL
10 8 6 4 2 2 4 6 8 10
INDIVIDUAL COHESION STRUCTURAL COHESION
Individual C.
Structural C.
AustriaBelgiumBulgariaCroatiaCyprusCzech Rep.DenmarkEstoniaFinlandFranceGermanyGreeceHungaryIreland
ItalyLatviaLithuaniaLuxembourgMaltaNetherlandsPolandPortugalRomaniaSlovakiaSloveniaSpainSwedenUK
Lithuania 2017 vs. Lithuania 2007 EU 2017
6.7 6.4
Lithuania 2017 vs. Lithuania 2007 EU 2017
1.0
2.0
0.1
1.3
0.3
0.4
0.5
3.4
0.1
2.0
1.1 0.9
Design Overall Results Rankings Countriesecfr.eu/eucohesionmonitor Intro

RESILIENCE
ECONOMIC TIES
FUNDING
NEIGHBOURHOOD
POLICY INTEGRATION
SECURITY
EXPERIENCE
ENGAGEMENT
ATTITUDES
APPROVAL
10 8 6 4 2 2 4 6 8 10
INDIVIDUAL COHESION STRUCTURAL COHESION
Individual C.
Structural C.
AustriaBelgiumBulgariaCroatiaCyprusCzech Rep.DenmarkEstoniaFinlandFranceGermanyGreeceHungaryIreland
ItalyLatviaLithuaniaLuxembourgMaltaNetherlandsPolandPortugalRomaniaSlovakiaSloveniaSpainSwedenUK
Lithuania 2017 vs. Lithuania 2007 EU 2017
6.7 6.4
Lithuania 2017 vs. Lithuania 2007 EU 2017
Design Overall Results Rankings Countriesecfr.eu/eucohesionmonitor Intro

RESILIENCE
ECONOMIC TIES
FUNDING
NEIGHBOURHOOD
POLICY INTEGRATION
SECURITY
EXPERIENCE
ENGAGEMENT
ATTITUDES
APPROVAL
10 8 6 4 2 2 4 6 8 10
INDIVIDUAL COHESION STRUCTURAL COHESION
Individual C.
Structural C.
AustriaBelgiumBulgariaCroatiaCyprusCzech Rep.DenmarkEstoniaFinlandFranceGermanyGreeceHungaryIreland
ItalyLatviaLithuaniaLuxembourgMaltaNetherlandsPolandPortugalRomaniaSlovakiaSloveniaSpainSwedenUK
Luxembourg 2017 vs. Luxembourg 2007 EU 2017
9.1 7.6
Luxembourg 2017 vs. Luxembourg 2007 EU 2017
0.0
1.9
0.2
0.9
0.0
1.5
1.6
0.0
0.0
0.0
0.7 0.5
Design Overall Results Rankings Countriesecfr.eu/eucohesionmonitor Intro

RESILIENCE
ECONOMIC TIES
FUNDING
NEIGHBOURHOOD
POLICY INTEGRATION
SECURITY
EXPERIENCE
ENGAGEMENT
ATTITUDES
APPROVAL
10 8 6 4 2 2 4 6 8 10
INDIVIDUAL COHESION STRUCTURAL COHESION
Individual C.
Structural C.
AustriaBelgiumBulgariaCroatiaCyprusCzech Rep.DenmarkEstoniaFinlandFranceGermanyGreeceHungaryIreland
ItalyLatviaLithuaniaLuxembourgMaltaNetherlandsPolandPortugalRomaniaSlovakiaSloveniaSpainSwedenUK
Luxembourg 2017 vs. Luxembourg 2007 EU 2017
9.1 7.6
Luxembourg 2017 vs. Luxembourg 2007 EU 2017
Design Overall Results Rankings Countriesecfr.eu/eucohesionmonitor Intro

RESILIENCE
ECONOMIC TIES
FUNDING
NEIGHBOURHOOD
POLICY INTEGRATION
SECURITY
EXPERIENCE
ENGAGEMENT
ATTITUDES
APPROVAL
10 8 6 4 2 2 4 6 8 10
INDIVIDUAL COHESION STRUCTURAL COHESION
Individual C.
Structural C.
AustriaBelgiumBulgariaCroatiaCyprusCzech Rep.DenmarkEstoniaFinlandFranceGermanyGreeceHungaryIreland
ItalyLatviaLithuaniaLuxembourgMaltaNetherlandsPolandPortugalRomaniaSlovakiaSloveniaSpainSwedenUK
Malta 2017 vs. Malta 2007 EU 2017
7.7 4.6
Malta 2017 vs. Malta 2007 EU 2017
1.2
2.0
0.0
0.4
0.8
1.7
0.1
2.0
0.0
1.5
0.9 0.8
Design Overall Results Rankings Countriesecfr.eu/eucohesionmonitor Intro

RESILIENCE
ECONOMIC TIES
FUNDING
NEIGHBOURHOOD
POLICY INTEGRATION
SECURITY
EXPERIENCE
ENGAGEMENT
ATTITUDES
APPROVAL
10 8 6 4 2 2 4 6 8 10
INDIVIDUAL COHESION STRUCTURAL COHESION
Individual C.
Structural C.
AustriaBelgiumBulgariaCroatiaCyprusCzech Rep.DenmarkEstoniaFinlandFranceGermanyGreeceHungaryIreland
ItalyLatviaLithuaniaLuxembourgMaltaNetherlandsPolandPortugalRomaniaSlovakiaSloveniaSpainSwedenUK
Malta 2017 vs. Malta 2007 EU 2017
7.7 4.6
Malta 2017 vs. Malta 2007 EU 2017
Design Overall Results Rankings Countriesecfr.eu/eucohesionmonitor Intro
RESILIENCE
ECONOMIC TIES
FUNDING
NEIGHBOURHOOD
POLICY INTEGRATION
SECURITY
EXPERIENCE
ENGAGEMENT
ATTITUDES
APPROVAL
10 8 6 4 2 2 4 6 8 10
INDIVIDUAL COHESION STRUCTURAL COHESION
Individual C.
Structural C.
AustriaBelgiumBulgariaCroatiaCyprusCzech Rep.DenmarkEstoniaFinlandFranceGermanyGreeceHungaryIreland
ItalyLatviaLithuaniaLuxembourgMaltaNetherlandsPolandPortugalRomaniaSlovakiaSloveniaSpainSwedenUK
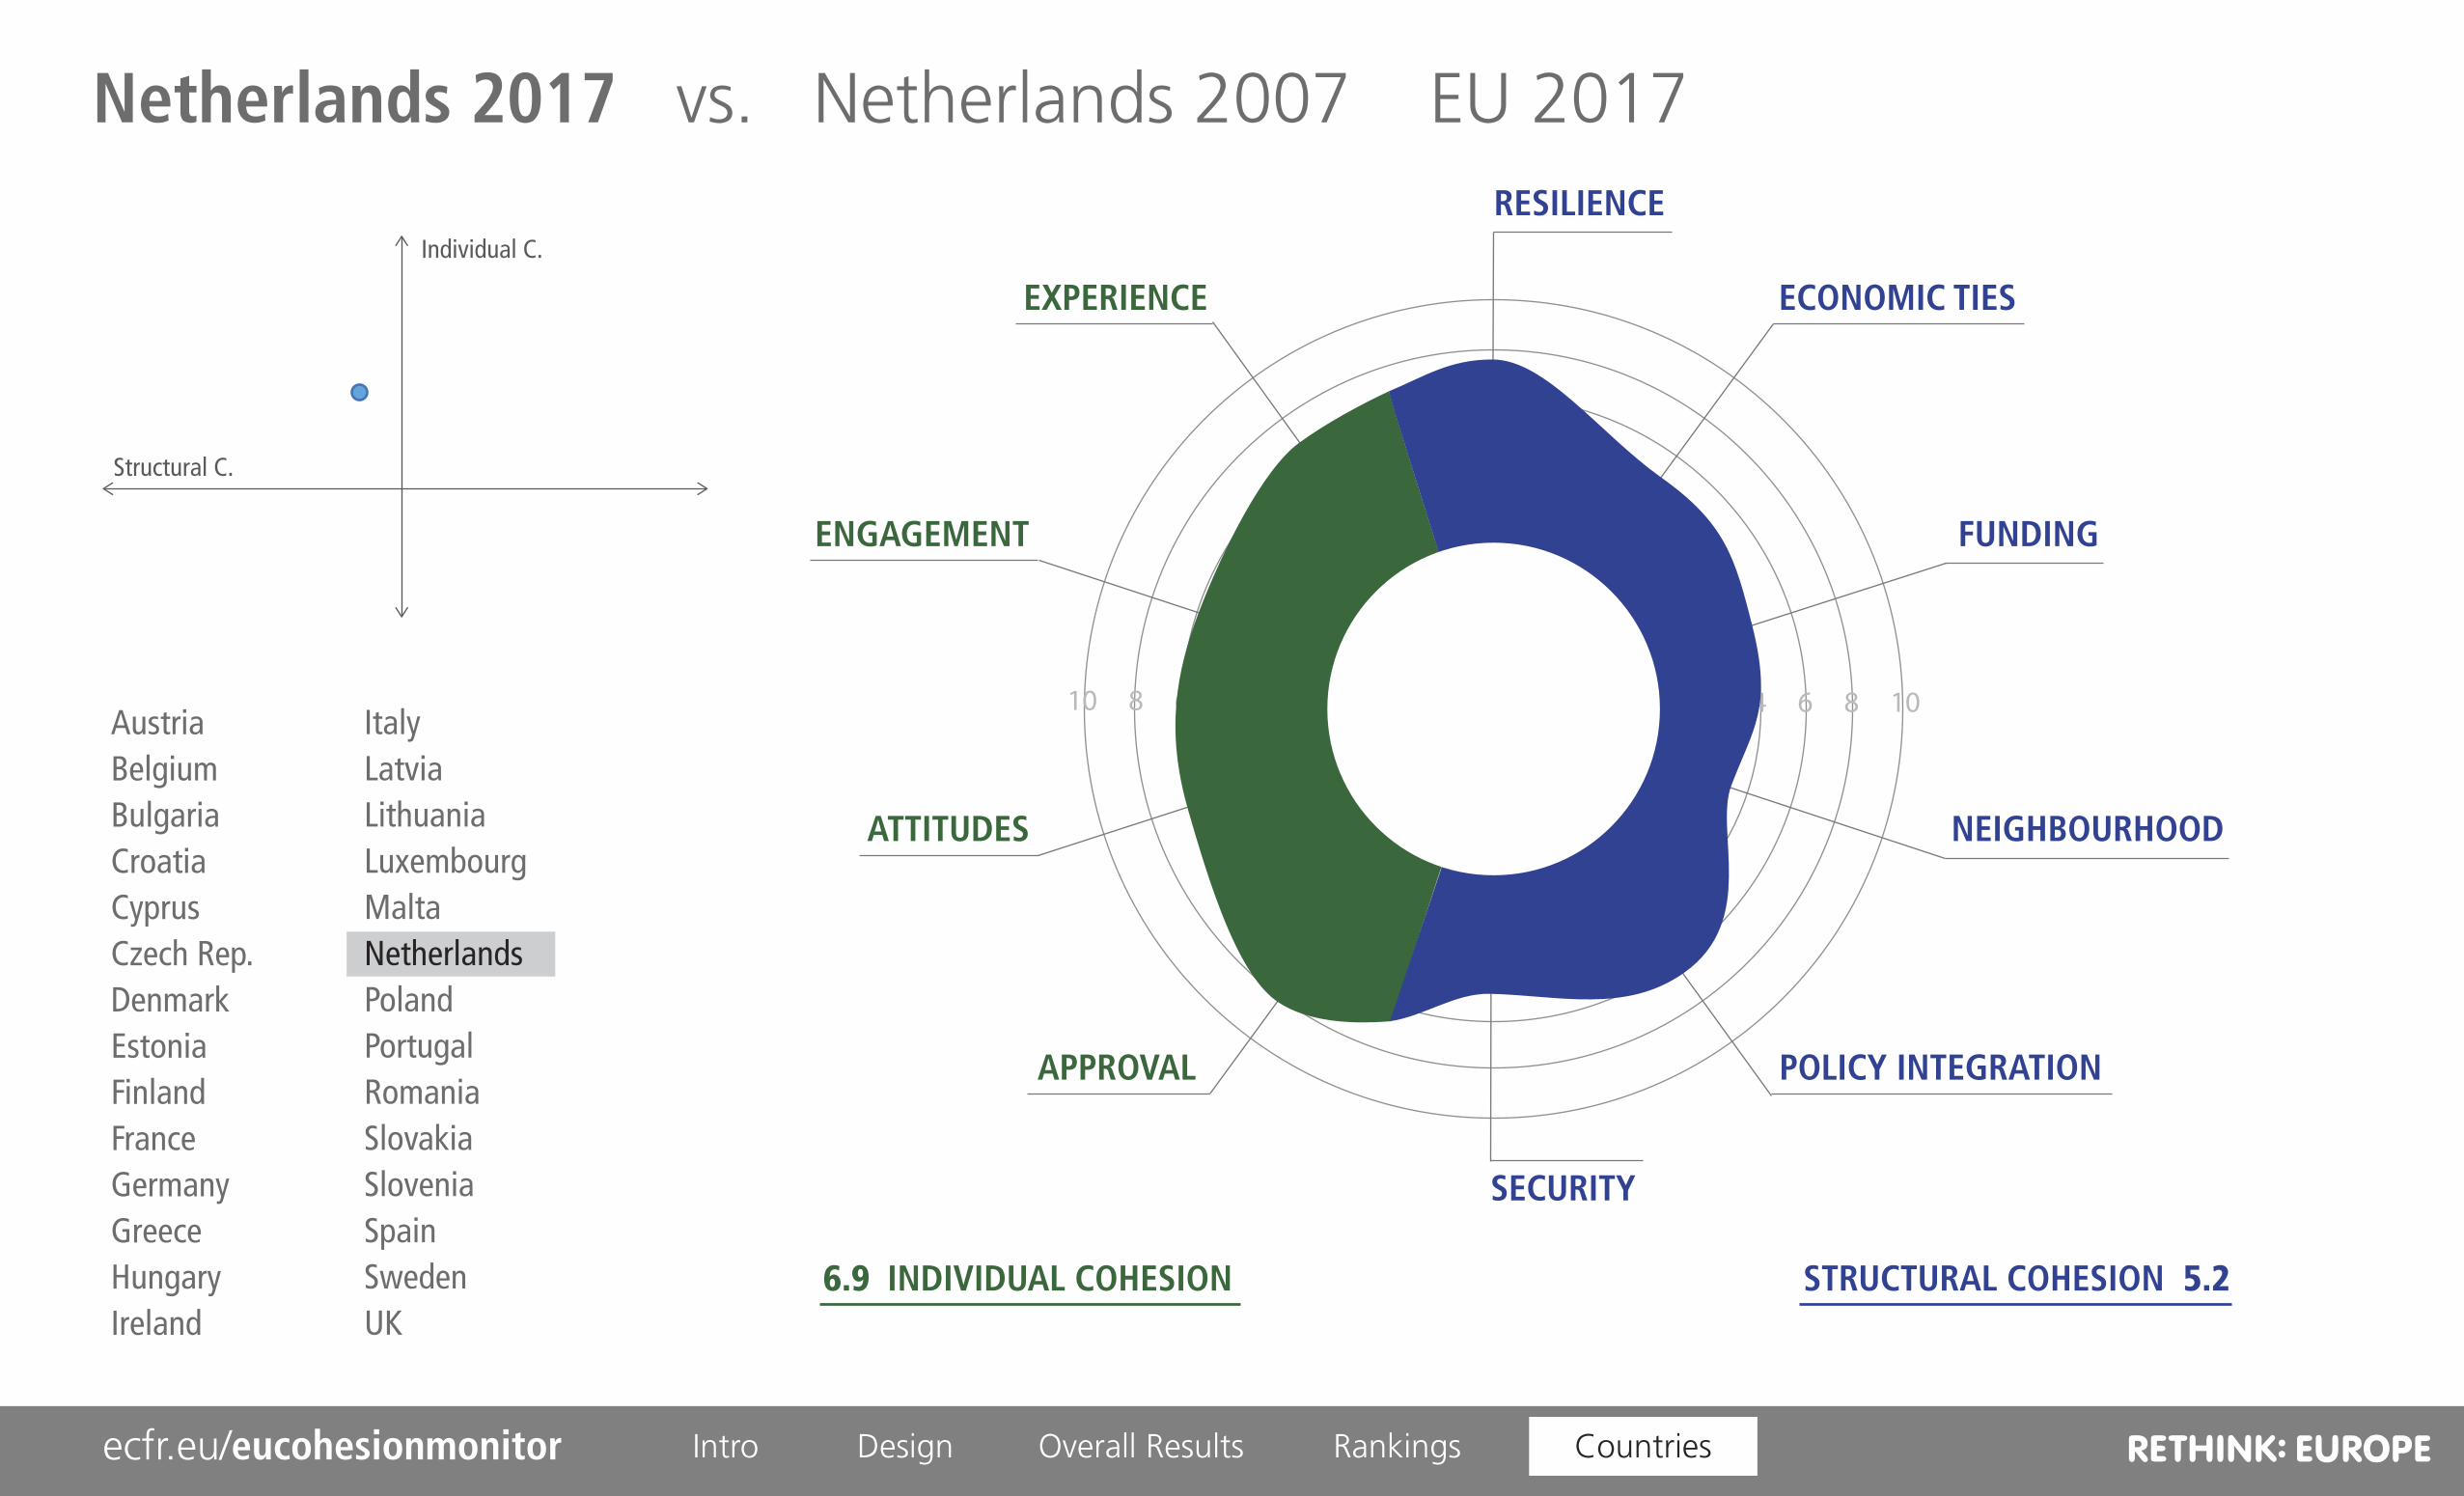
Netherlands 2017 vs. Netherlands 2007 EU 2017
6.9 5.2
Design Overall Results Rankings Countriesecfr.eu/eucohesionmonitor Intro

RESILIENCE
ECONOMIC TIES
FUNDING
NEIGHBOURHOOD
POLICY INTEGRATION
SECURITY
EXPERIENCE
ENGAGEMENT
ATTITUDES
APPROVAL
10 8 6 4 2 2 4 6 8 10
INDIVIDUAL COHESION STRUCTURAL COHESION
Individual C.
Structural C.
AustriaBelgiumBulgariaCroatiaCyprusCzech Rep.DenmarkEstoniaFinlandFranceGermanyGreeceHungaryIreland
ItalyLatviaLithuaniaLuxembourgMaltaNetherlandsPolandPortugalRomaniaSlovakiaSloveniaSpainSwedenUK
Netherlands 2017 vs. Netherlands 2007 EU 2017
6.9 5.2
Netherlands 2017 vs. Netherlands 2007 EU 2017
0.5
1.8
1.2
0.5
1.5
2.4
0.4
0.1
0.1
0.5
0.4 0.8
Design Overall Results Rankings Countriesecfr.eu/eucohesionmonitor Intro

RESILIENCE
ECONOMIC TIES
FUNDING
NEIGHBOURHOOD
POLICY INTEGRATION
SECURITY
EXPERIENCE
ENGAGEMENT
ATTITUDES
APPROVAL
10 8 6 4 2 2 4 6 8 10
INDIVIDUAL COHESION STRUCTURAL COHESION
Individual C.
Structural C.
AustriaBelgiumBulgariaCroatiaCyprusCzech Rep.DenmarkEstoniaFinlandFranceGermanyGreeceHungaryIreland
ItalyLatviaLithuaniaLuxembourgMaltaNetherlandsPolandPortugalRomaniaSlovakiaSloveniaSpainSwedenUK
Netherlands 2017 vs. Netherlands 2007 EU 2017
6.9 5.2
Netherlands 2017 vs. Netherlands 2007 EU 2017
Design Overall Results Rankings Countriesecfr.eu/eucohesionmonitor Intro

RESILIENCE
ECONOMIC TIES
FUNDING
NEIGHBOURHOOD
POLICY INTEGRATION
SECURITY
EXPERIENCE
ENGAGEMENT
ATTITUDES
APPROVAL
10 8 6 4 2 2 4 6 8 10
INDIVIDUAL COHESION STRUCTURAL COHESION
Individual C.
Structural C.
AustriaBelgiumBulgariaCroatiaCyprusCzech Rep.DenmarkEstoniaFinlandFranceGermanyGreeceHungaryIreland
ItalyLatviaLithuaniaLuxembourgMaltaNetherlandsPolandPortugalRomaniaSlovakiaSloveniaSpainSwedenUK
Poland 2017 vs. Poland 2007 EU 2017
4.6 5.6
Poland 2017 vs. Poland 2007 EU 2017
0.2
0.3
1.8
0.2
0.2
0.4
1.2
4.4
0.0
0.0
0.4 1.0
Design Overall Results Rankings Countriesecfr.eu/eucohesionmonitor Intro

RESILIENCE
ECONOMIC TIES
FUNDING
NEIGHBOURHOOD
POLICY INTEGRATION
SECURITY
EXPERIENCE
ENGAGEMENT
ATTITUDES
APPROVAL
10 8 6 4 2 2 4 6 8 10
INDIVIDUAL COHESION STRUCTURAL COHESION
Individual C.
Structural C.
AustriaBelgiumBulgariaCroatiaCyprusCzech Rep.DenmarkEstoniaFinlandFranceGermanyGreeceHungaryIreland
ItalyLatviaLithuaniaLuxembourgMaltaNetherlandsPolandPortugalRomaniaSlovakiaSloveniaSpainSwedenUK
Poland 2017 vs. Poland 2007 EU 2017
4.6 5.6
Poland 2017 vs. Poland 2007 EU 2017
Design Overall Results Rankings Countriesecfr.eu/eucohesionmonitor Intro

RESILIENCE
ECONOMIC TIES
FUNDING
NEIGHBOURHOOD
POLICY INTEGRATION
SECURITY
EXPERIENCE
ENGAGEMENT
ATTITUDES
APPROVAL
10 8 6 4 2 2 4 6 8 10
INDIVIDUAL COHESION STRUCTURAL COHESION
Individual C.
Structural C.
AustriaBelgiumBulgariaCroatiaCyprusCzech Rep.DenmarkEstoniaFinlandFranceGermanyGreeceHungaryIreland
ItalyLatviaLithuaniaLuxembourgMaltaNetherlandsPolandPortugalRomaniaSlovakiaSloveniaSpainSwedenUK
Portugal 2017 vs. Portugal 2007 EU 2017
5.7 4.5
Portugal 2017 vs. Portugal 2007 EU 2017
0.9
1.7
0.8
0.6
2.5
0.1
0.7
1.1
0.4
0.0
0.6 0.6
Design Overall Results Rankings Countriesecfr.eu/eucohesionmonitor Intro

RESILIENCE
ECONOMIC TIES
FUNDING
NEIGHBOURHOOD
POLICY INTEGRATION
SECURITY
EXPERIENCE
ENGAGEMENT
ATTITUDES
APPROVAL
10 8 6 4 2 2 4 6 8 10
INDIVIDUAL COHESION STRUCTURAL COHESION
Individual C.
Structural C.
AustriaBelgiumBulgariaCroatiaCyprusCzech Rep.DenmarkEstoniaFinlandFranceGermanyGreeceHungaryIreland
ItalyLatviaLithuaniaLuxembourgMaltaNetherlandsPolandPortugalRomaniaSlovakiaSloveniaSpainSwedenUK
Portugal 2017 vs. Portugal 2007 EU 2017
5.7 4.5
Portugal 2017 vs. Portugal 2007 EU 2017
Design Overall Results Rankings Countriesecfr.eu/eucohesionmonitor Intro

RESILIENCE
ECONOMIC TIES
FUNDING
NEIGHBOURHOOD
POLICY INTEGRATION
SECURITY
EXPERIENCE
ENGAGEMENT
ATTITUDES
APPROVAL
10 8 6 4 2 2 4 6 8 10
INDIVIDUAL COHESION STRUCTURAL COHESION
Individual C.
Structural C.
AustriaBelgiumBulgariaCroatiaCyprusCzech Rep.DenmarkEstoniaFinlandFranceGermanyGreeceHungaryIreland
ItalyLatviaLithuaniaLuxembourgMaltaNetherlandsPolandPortugalRomaniaSlovakiaSloveniaSpainSwedenUK
Romania 2017 vs. Romania 2007 EU 2017
5.4 5.7
Romania 2017 vs. Romania 2007 EU 2017
0.3
0.6
1.3
0.1
0.6
0.4
0.2
6.4
0.0
0.0
0.5 1.2
Design Overall Results Rankings Countriesecfr.eu/eucohesionmonitor Intro

RESILIENCE
ECONOMIC TIES
FUNDING
NEIGHBOURHOOD
POLICY INTEGRATION
SECURITY
EXPERIENCE
ENGAGEMENT
ATTITUDES
APPROVAL
10 8 6 4 2 2 4 6 8 10
INDIVIDUAL COHESION STRUCTURAL COHESION
Individual C.
Structural C.
AustriaBelgiumBulgariaCroatiaCyprusCzech Rep.DenmarkEstoniaFinlandFranceGermanyGreeceHungaryIreland
ItalyLatviaLithuaniaLuxembourgMaltaNetherlandsPolandPortugalRomaniaSlovakiaSloveniaSpainSwedenUK
Romania 2017 vs. Romania 2007 EU 2017
5.4 5.7
Romania 2017 vs. Romania 2007 EU 2017
Design Overall Results Rankings Countriesecfr.eu/eucohesionmonitor Intro

RESILIENCE
ECONOMIC TIES
FUNDING
NEIGHBOURHOOD
POLICY INTEGRATION
SECURITY
EXPERIENCE
ENGAGEMENT
ATTITUDES
APPROVAL
10 8 6 4 2 2 4 6 8 10
INDIVIDUAL COHESION STRUCTURAL COHESION
Individual C.
Structural C.
AustriaBelgiumBulgariaCroatiaCyprusCzech Rep.DenmarkEstoniaFinlandFranceGermanyGreeceHungaryIreland
ItalyLatviaLithuaniaLuxembourgMaltaNetherlandsPolandPortugalRomaniaSlovakiaSloveniaSpainSwedenUK
Slovakia 2017 vs. Slovakia 2007 EU 2017
5.9 6.8
Slovakia 2017 vs. Slovakia 2007 EU 2017
0.4
1.7
1.3
0.6
0.3
0.1
0.2
4.6
0.0
2.0
0.1 1.0
Design Overall Results Rankings Countriesecfr.eu/eucohesionmonitor Intro

RESILIENCE
ECONOMIC TIES
FUNDING
NEIGHBOURHOOD
POLICY INTEGRATION
SECURITY
EXPERIENCE
ENGAGEMENT
ATTITUDES
APPROVAL
10 8 6 4 2 2 4 6 8 10
INDIVIDUAL COHESION STRUCTURAL COHESION
Individual C.
Structural C.
AustriaBelgiumBulgariaCroatiaCyprusCzech Rep.DenmarkEstoniaFinlandFranceGermanyGreeceHungaryIreland
ItalyLatviaLithuaniaLuxembourgMaltaNetherlandsPolandPortugalRomaniaSlovakiaSloveniaSpainSwedenUK
Slovakia 2017 vs. Slovakia 2007 EU 2017
5.9 6.8
Slovakia 2017 vs. Slovakia 2007 EU 2017
Design Overall Results Rankings Countriesecfr.eu/eucohesionmonitor Intro

RESILIENCE
ECONOMIC TIES
FUNDING
NEIGHBOURHOOD
POLICY INTEGRATION
SECURITY
EXPERIENCE
ENGAGEMENT
ATTITUDES
APPROVAL
10 8 6 4 2 2 4 6 8 10
INDIVIDUAL COHESION STRUCTURAL COHESION
Individual C.
Structural C.
AustriaBelgiumBulgariaCroatiaCyprusCzech Rep.DenmarkEstoniaFinlandFranceGermanyGreeceHungaryIreland
ItalyLatviaLithuaniaLuxembourgMaltaNetherlandsPolandPortugalRomaniaSlovakiaSloveniaSpainSwedenUK
Slovenia 2017 vs. Slovenia 2007 EU 2017
6.3 5.8
Slovenia 2017 vs. Slovenia 2007 EU 2017
1.1
1.5
0.2
1.8
1.9
0.8
0.0
2.9
0.0
1.0
0.1 0.4
Design Overall Results Rankings Countriesecfr.eu/eucohesionmonitor Intro

RESILIENCE
ECONOMIC TIES
FUNDING
NEIGHBOURHOOD
POLICY INTEGRATION
SECURITY
EXPERIENCE
ENGAGEMENT
ATTITUDES
APPROVAL
10 8 6 4 2 2 4 6 8 10
INDIVIDUAL COHESION STRUCTURAL COHESION
Individual C.
Structural C.
AustriaBelgiumBulgariaCroatiaCyprusCzech Rep.DenmarkEstoniaFinlandFranceGermanyGreeceHungaryIreland
ItalyLatviaLithuaniaLuxembourgMaltaNetherlandsPolandPortugalRomaniaSlovakiaSloveniaSpainSwedenUK
Slovenia 2017 vs. Slovenia 2007 EU 2017
6.3 5.8
Slovenia 2017 vs. Slovenia 2007 EU 2017
Design Overall Results Rankings Countriesecfr.eu/eucohesionmonitor Intro

RESILIENCE
ECONOMIC TIES
FUNDING
NEIGHBOURHOOD
POLICY INTEGRATION
SECURITY
EXPERIENCE
ENGAGEMENT
ATTITUDES
APPROVAL
10 8 6 4 2 2 4 6 8 10
INDIVIDUAL COHESION STRUCTURAL COHESION
Individual C.
Structural C.
AustriaBelgiumBulgariaCroatiaCyprusCzech Rep.DenmarkEstoniaFinlandFranceGermanyGreeceHungaryIreland
ItalyLatviaLithuaniaLuxembourgMaltaNetherlandsPolandPortugalRomaniaSlovakiaSloveniaSpainSwedenUK
Spain 2017 vs. Spain 2007 EU 2017
6.2 4.7
Spain 2017 vs. Spain 2007 EU 2017
0.0
1.5
1.8
1.0
2.9
0.4
0.3
1.2
0.0
0.0
0.3 0.7
Design Overall Results Rankings Countriesecfr.eu/eucohesionmonitor Intro

RESILIENCE
ECONOMIC TIES
FUNDING
NEIGHBOURHOOD
POLICY INTEGRATION
SECURITY
EXPERIENCE
ENGAGEMENT
ATTITUDES
APPROVAL
10 8 6 4 2 2 4 6 8 10
INDIVIDUAL COHESION STRUCTURAL COHESION
Individual C.
Structural C.
AustriaBelgiumBulgariaCroatiaCyprusCzech Rep.DenmarkEstoniaFinlandFranceGermanyGreeceHungaryIreland
ItalyLatviaLithuaniaLuxembourgMaltaNetherlandsPolandPortugalRomaniaSlovakiaSloveniaSpainSwedenUK
Spain 2017 vs. Spain 2007 EU 2017
6.2 4.7
Spain 2017 vs. Spain 2007 EU 2017
Design Overall Results Rankings Countriesecfr.eu/eucohesionmonitor Intro

RESILIENCE
ECONOMIC TIES
FUNDING
NEIGHBOURHOOD
POLICY INTEGRATION
SECURITY
EXPERIENCE
ENGAGEMENT
ATTITUDES
APPROVAL
10 8 6 4 2 2 4 6 8 10
INDIVIDUAL COHESION STRUCTURAL COHESION
Individual C.
Structural C.
AustriaBelgiumBulgariaCroatiaCyprusCzech Rep.DenmarkEstoniaFinlandFranceGermanyGreeceHungaryIreland
ItalyLatviaLithuaniaLuxembourgMaltaNetherlandsPolandPortugalRomaniaSlovakiaSloveniaSpainSwedenUK
Sweden 2017 vs. Sweden 2007 EU 2017
6.5 4.5
Design Overall Results Rankings Countriesecfr.eu/eucohesionmonitor Intro
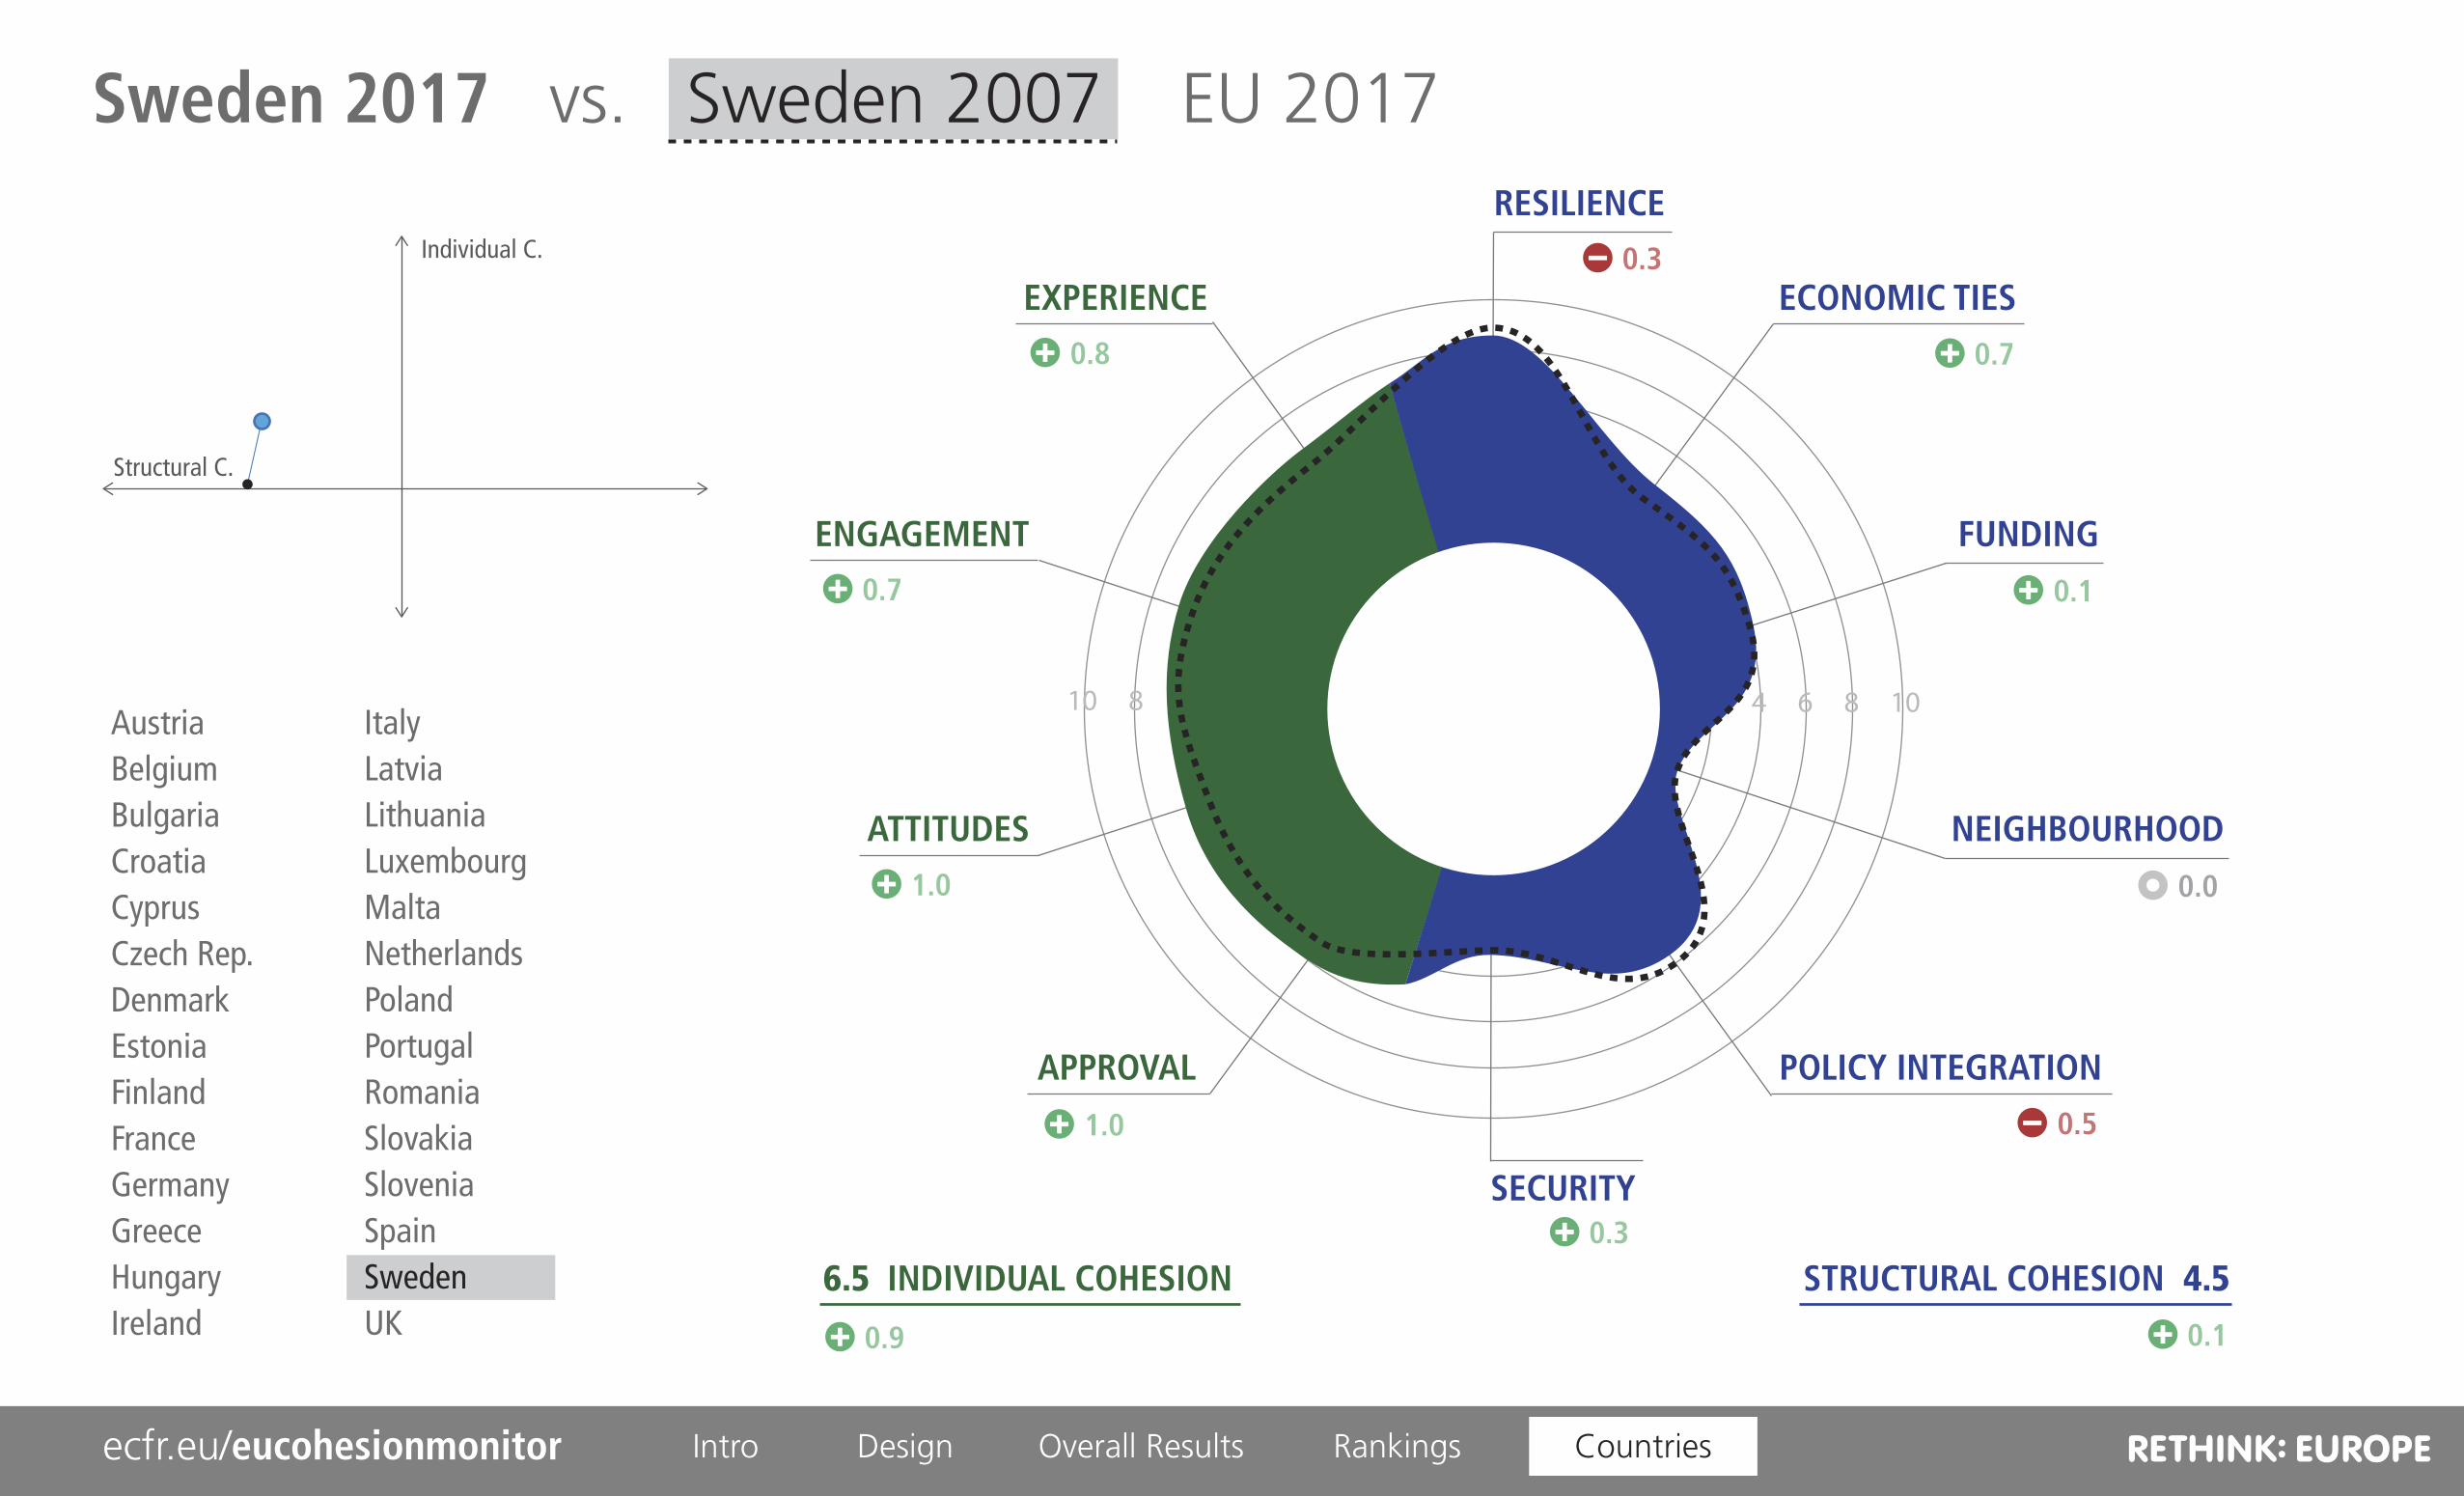
RESILIENCE
ECONOMIC TIES
FUNDING
NEIGHBOURHOOD
POLICY INTEGRATION
SECURITY
EXPERIENCE
ENGAGEMENT
ATTITUDES
APPROVAL
10 8 6 4 2 2 4 6 8 10
INDIVIDUAL COHESION STRUCTURAL COHESION
Individual C.
Structural C.
AustriaBelgiumBulgariaCroatiaCyprusCzech Rep.DenmarkEstoniaFinlandFranceGermanyGreeceHungaryIreland
ItalyLatviaLithuaniaLuxembourgMaltaNetherlandsPolandPortugalRomaniaSlovakiaSloveniaSpainSwedenUK
Sweden 2017 vs. Sweden 2007 EU 2017
6.5 4.5
Sweden 2017 vs. Sweden 2007 EU 2017
0.8
1.0
0.7
1.0
0.3
0.7
0.3
0.1
0.0
0.5
0.9 0.1
Design Overall Results Rankings Countriesecfr.eu/eucohesionmonitor Intro

RESILIENCE
ECONOMIC TIES
FUNDING
NEIGHBOURHOOD
POLICY INTEGRATION
SECURITY
EXPERIENCE
ENGAGEMENT
ATTITUDES
APPROVAL
10 8 6 4 2 2 4 6 8 10
INDIVIDUAL COHESION STRUCTURAL COHESION
Individual C.
Structural C.
AustriaBelgiumBulgariaCroatiaCyprusCzech Rep.DenmarkEstoniaFinlandFranceGermanyGreeceHungaryIreland
ItalyLatviaLithuaniaLuxembourgMaltaNetherlandsPolandPortugalRomaniaSlovakiaSloveniaSpainSwedenUK
Sweden 2017 vs. Sweden 2007 EU 2017
6.5 4.5
Sweden 2017 vs. Sweden 2007 EU 2017
Design Overall Results Rankings Countriesecfr.eu/eucohesionmonitor Intro
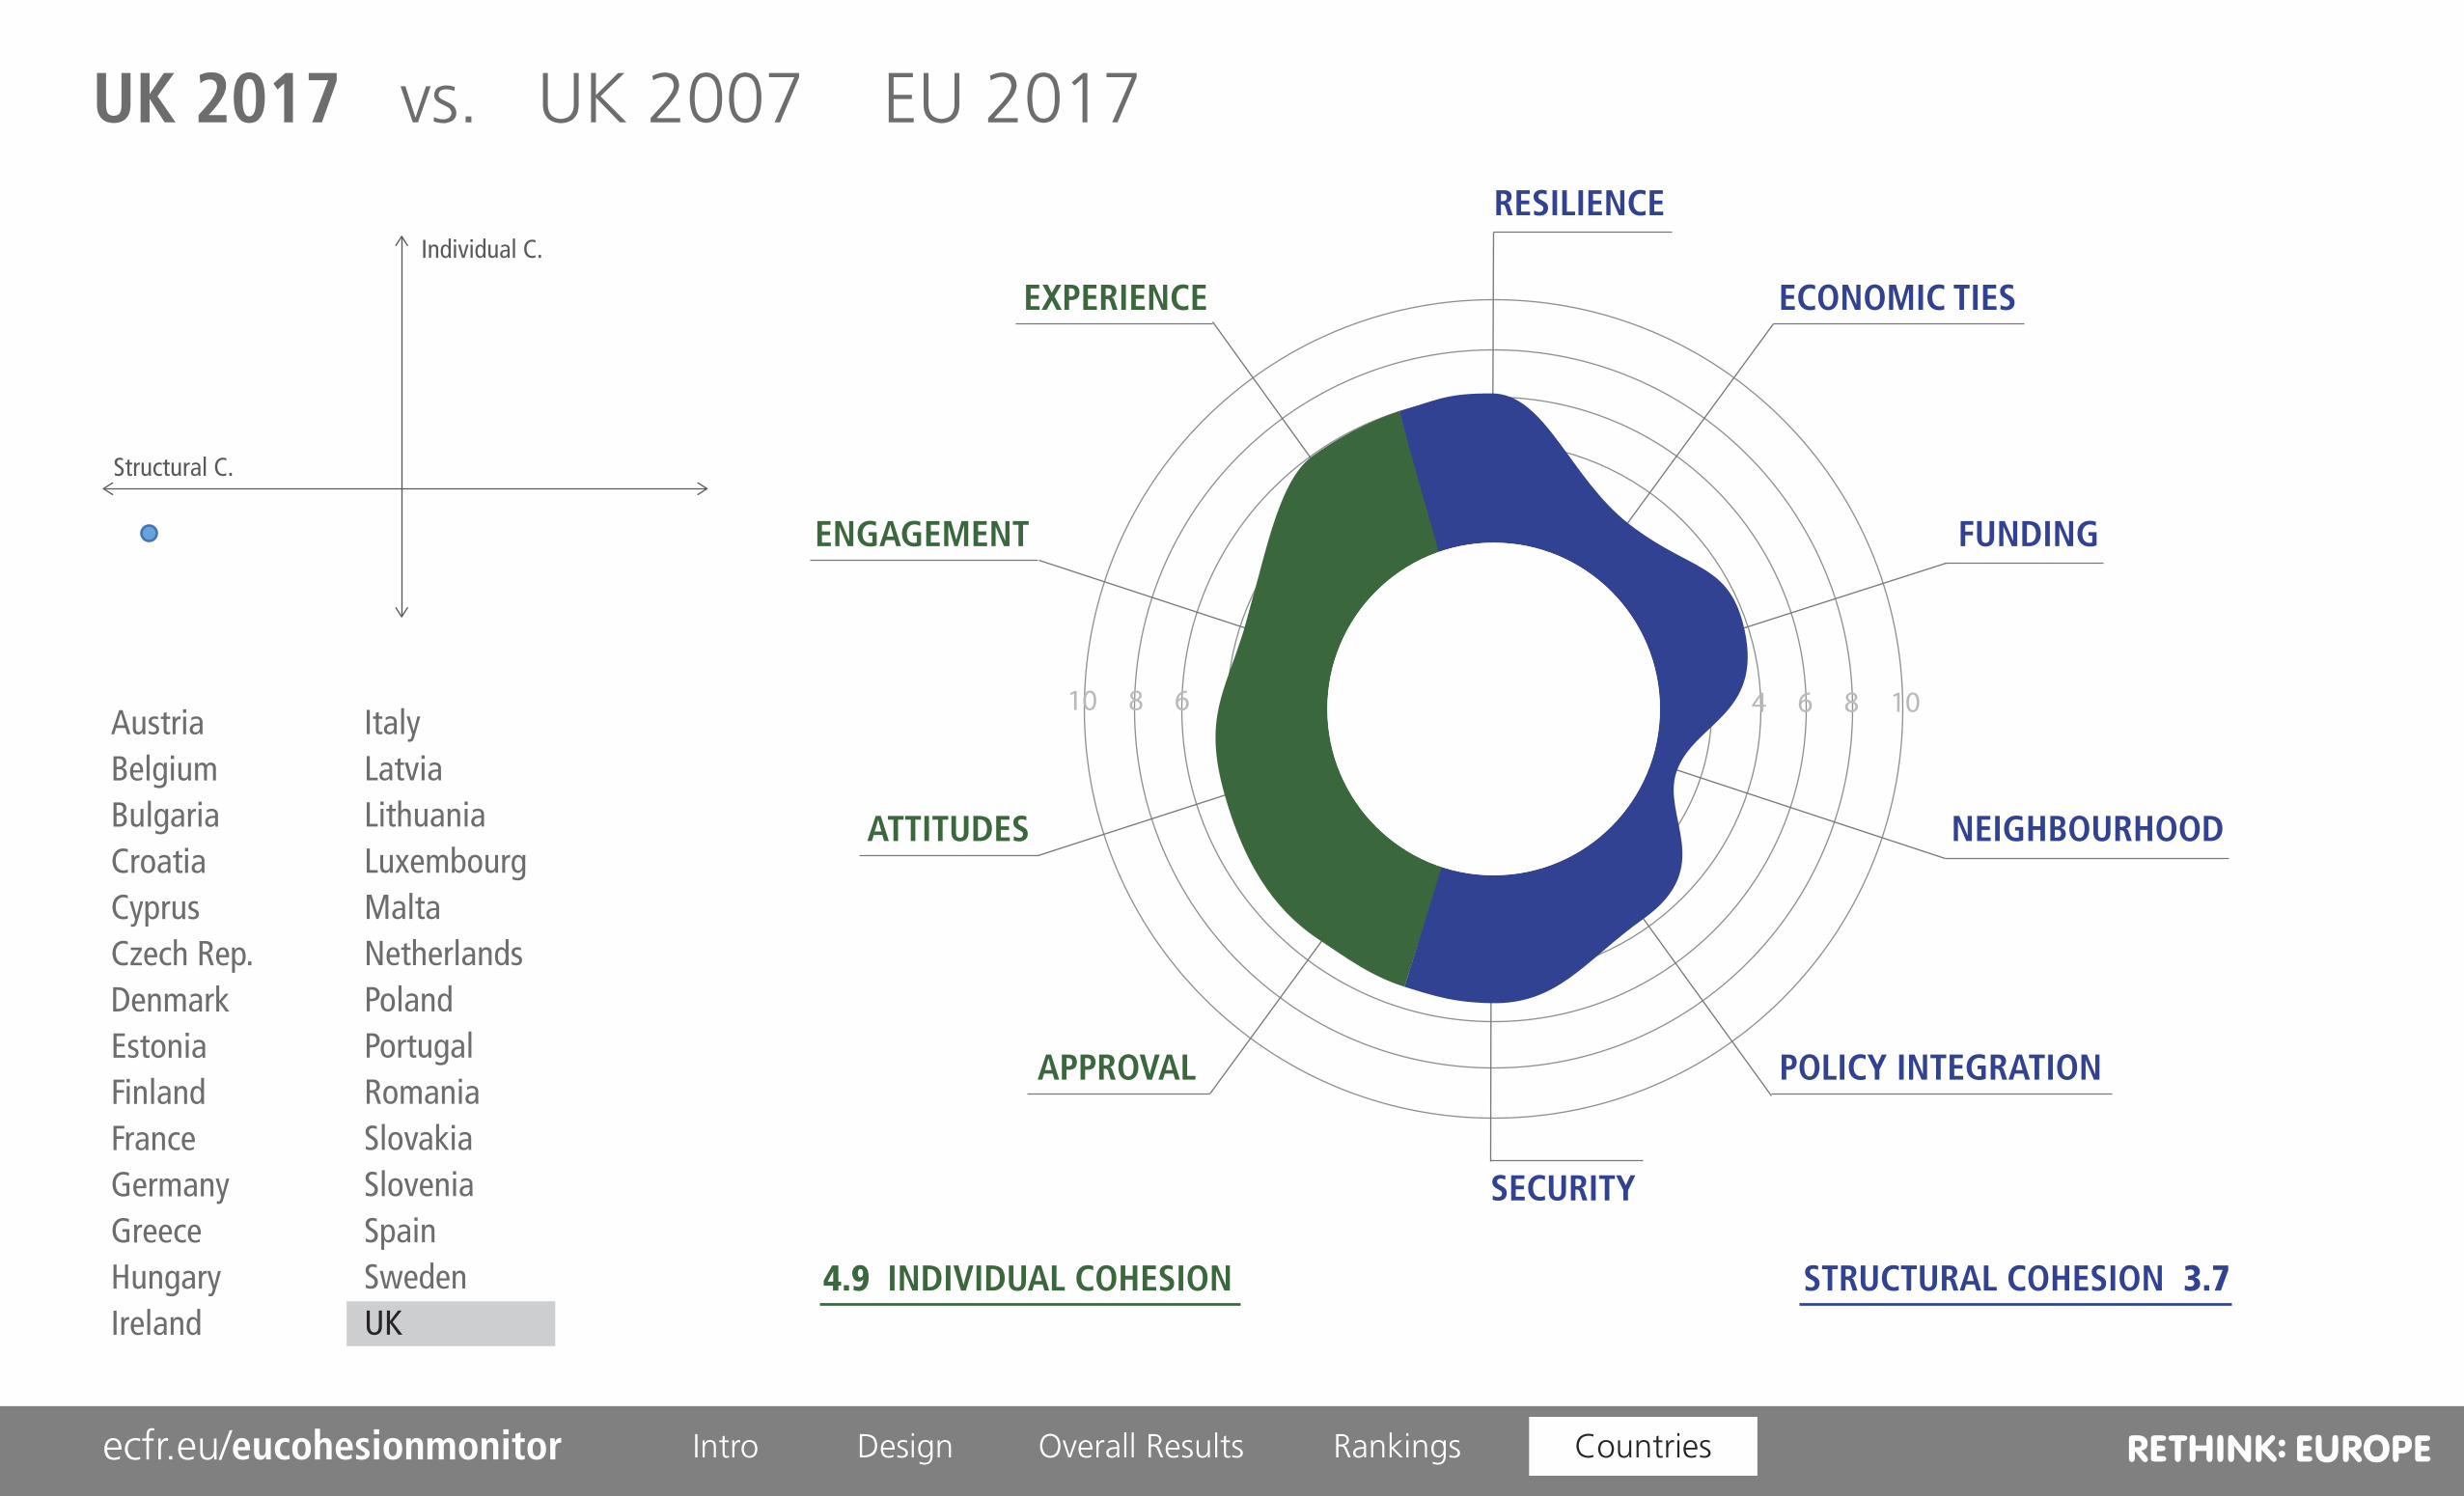
RESILIENCE
ECONOMIC TIES
FUNDING
NEIGHBOURHOOD
POLICY INTEGRATION
SECURITY
EXPERIENCE
ENGAGEMENT
ATTITUDES
APPROVAL
10 8 6 4 2 2 4 6 8 10
INDIVIDUAL COHESION STRUCTURAL COHESION
Individual C.
Structural C.
AustriaBelgiumBulgariaCroatiaCyprusCzech Rep.DenmarkEstoniaFinlandFranceGermanyGreeceHungaryIreland
ItalyLatviaLithuaniaLuxembourgMaltaNetherlandsPolandPortugalRomaniaSlovakiaSloveniaSpainSwedenUK
UK 2017 vs. UK 2007 EU 2017
4.9 3.7
UK 2017 vs. UK 2007 EU 2017
1.1
1.1
3.4
1.8
2.2
1.2
0.1
0.7
0.0
1.0
0.2 0.6
Design Overall Results Rankings Countriesecfr.eu/eucohesionmonitor Intro

RESILIENCE
ECONOMIC TIES
FUNDING
NEIGHBOURHOOD
POLICY INTEGRATION
SECURITY
EXPERIENCE
ENGAGEMENT
ATTITUDES
APPROVAL
10 8 6 4 2 2 4 6 8 10
INDIVIDUAL COHESION STRUCTURAL COHESION
Individual C.
Structural C.
AustriaBelgiumBulgariaCroatiaCyprusCzech Rep.DenmarkEstoniaFinlandFranceGermanyGreeceHungaryIreland
ItalyLatviaLithuaniaLuxembourgMaltaNetherlandsPolandPortugalRomaniaSlovakiaSloveniaSpainSwedenUK
UK 2017 vs. UK 2007 EU 2017
4.9 3.7
UK 2017 vs. UK 2007 EU 2017
Design Overall Results Rankings Countriesecfr.eu/eucohesionmonitor Intro
Top Related