
Youth Unemployment - key facts - Home : Scottish …€¦ · · 2018-05-08The Scottish Parliament...
20
Financial Scrutiny Unit Briefing Youth unemployment: key facts 23 March 2012 12/19 Nicola Hudson, Greig Liddell and Scherie Nicol “Solving youth unemployment is one of the most pressing problems governments are facing today” (Bell, D and Blanchflower, D, 2010) In Scotland, 102,000 young people are unemployed, representing around one in four of the economically active aged 16-24. This briefing looks at the scale and nature of youth unemployment in Scotland as well as reviewing research that considers its longer-term impacts. This briefing should be read in conjunction with a separate SPICe briefing SB 12/20 Youth Unemployment: Policy which examines in detail the various policies, strategies and interventions, aimed at improving youth employment in Scotland.
-
Upload
phungquynh -
Category
Documents
-
view
218 -
download
0
Transcript of Youth Unemployment - key facts - Home : Scottish …€¦ · · 2018-05-08The Scottish Parliament...
The Scottish Parliament and Scottish Parliament Infor mation C entre l ogos .
Financial Scrutiny Unit Briefing
Youth unemployment: key facts 23 March 2012
12/19
Nicola Hudson, Greig Liddell and Scherie Nicol
“Solving youth unemployment is one of the most pressing problems governments are facing today” (Bell, D and Blanchflower, D, 2010)
In Scotland, 102,000 young people are unemployed, representing around one in four of the economically active aged 16-24. This briefing looks at the scale and nature of youth unemployment in Scotland as well as reviewing research that considers its longer-term impacts.
This briefing should be read in conjunction with a separate SPICe briefing SB 12/20 Youth Unemployment: Policy which examines in detail the various policies, strategies and interventions, aimed at improving youth employment in Scotland.
2
CONTENTS
EXECUTIVE SUMMARY .............................................................................................................................................. 3
THE SCALE AND NATURE OF YOUTH UNEMPLOYMENT ..................................................................................... 4
YOUTH UNEMPLOYMENT IN SCOTLAND ............................................................................................................ 4 THE COMPOSITION OF YOUTH UNEMPLOYMENT ............................................................................................ 5
Students ............................................................................................................................................................... 5 Gender ................................................................................................................................................................. 5 Other characteristics of the young unemployed .................................................................................................. 6 Regional patterns of youth unemployment in Scotland ....................................................................................... 8 The NEET Group ............................................................................................................................................... 10 School leaver destinations ................................................................................................................................. 10
UK AND INTERNATIONAL COMPARISONS ........................................................................................................ 11 HIDDEN UNEMPLOYMENT AND UNDEREMPLOYMENT .................................................................................. 12
Visible underemployment ................................................................................................................................... 12 Invisible underemployment ................................................................................................................................ 12 Discouraged workers ......................................................................................................................................... 13
THE LONG-TERM IMPACT OF YOUTH UNEMPLOYMENT ................................................................................... 13
Impact on future employment prospects ............................................................................................................ 13 Impact on future earnings .................................................................................................................................. 13 Impact on well-being and health ........................................................................................................................ 14 Social impacts .................................................................................................................................................... 14 Impact on the public purse ................................................................................................................................. 14
ANNEX A: DEFINITIONS OF YOUTH UNEMPLOYMENT.................................................................................... 16 Labour Force Survey .......................................................................................................................................... 16 JSA claimant count ............................................................................................................................................ 16
SOURCES .................................................................................................................................................................. 17
RELATED BRIEFINGS .............................................................................................................................................. 20
3
EXECUTIVE SUMMARY
There were 102,000 unemployed 16-24 year olds in Scotland in October-December 2011. This represents an unemployment rate of 24.3%, compared with an unemployment rate of 8.6% for the workforce as a whole
The internationally-accepted definition of unemployment includes all those without work, available for work, and actively seeking work.
In Oct-Dec 2011, the youth unemployment total was composed of:
o 36,000 full-time students seeking work
o 23,000 with no qualifications or low levels of qualifications
o 44,000 with „reasonable qualifications‟ (SQCF level 4 or above)
Full-time students now account for around a third (35%) of all youth unemployment, compared to around a quarter (24%) in 2008
The majority (63.0%) of unemployed young people are young men and there has been a slightly faster increase in the number of young unemployed men (up 83.7% since 2007) than in the number of young unemployed women (up 80.4% since 2007). The female youth unemployment rate now stands at 19.5% compared with 28.5% for young men
The highest rates of youth unemployment are in parts of Glasgow, the west of Scotland, Kirkcaldy and parts of the Central Belt. Lowest rates are in Aberdeenshire, parts of Edinburgh, parts of Glasgow, North East Fife and the Shetland Islands.
In the last quarter of 2011 the youth unemployment rate in Scotland was higher than the equivalent rate for the UK as a whole (24.3% compared with 21.9% for the UK) although for much of the current downturn, the Scottish youth unemployment rate has been below the UK rate.
Youth unemployment rates vary considerably across OECD countries. The UK‟s youth unemployment rate sits roughly mid-way between the youth unemployment rate in the Netherlands (8.7%) and that of Spain (41.6%).
“Visible” or “invisible” underemployment exists when a person is working fewer hours than they would like to, or is working in a job for which they are over-qualified, due to a lack of alternative options. There are also those who are “discouraged” from looking for work by the economic situation and as a consequence they are considered to be economically inactive and are excluded from official unemployment statistics altogether.
Youth unemployment has longer term impacts both for the individual and for wider society. The longer terms “scars” include impacts on future employment prospects, future earnings prospects, the individual‟s health, wider society and the public purse. The Scottish Government estimates the lifetime cost of a single cohort of young people failing to make the transition into regular employment to be in the region of £2 billion.

4
THE SCALE AND NATURE OF YOUTH UNEMPLOYMENT
YOUTH UNEMPLOYMENT IN SCOTLAND
According to data from the Labour Force Survey, Scottish youth unemployment stood at 102,000, or 24.3%, for the period October to December 2011. This compares with a rate of 8.6% for the labour force as a whole. Within OECD countries the accepted measurement of youth unemployment is one defined by the International Labour Organisation. To be considered unemployed a young person (aged between 16 and 24) must be without work, available for work, and actively seeking work. This measurement includes full-time students looking for work (see Annex A for a fuller explanation of the definition of youth unemployment). Table 1: Youth unemployment in Scotland
16-24 year old unemployment
Scottish unemployment
rate (all workforce) % Level Rate (%)
Jan-Mar 2007 51,000 11.7 5.0
Jan-Mar 2008 56,000 13.5 4.7
Jan-Mar 2009 62,000 14.9 6.0
Jan-Mar 2010 66,000 17.0 8.2
Jan-Mar 2011 76,000 19.0 7.7
Apr-Jun 2011 88,000 21.1 7.7
Jul-Sep 2011 101,000 23.1 8.0
Oct-Dec 2011 102,000 24.3 8.6
Source: Labour Force Survey (ONS, 2012a) Figure 1: Youth unemployment rates and total workforce unemployment rates since January 2007, Scotland
Source: Labour Force Survey (2012). 16-24 year old rates have not been seasonally adjusted
Figure 1 shows the trends in both the general unemployment and youth unemployment rates since January 2007 (the latter have not been seasonally adjusted). Youth unemployment climbed above the 15% mark during the 2009 recession and peaked during the first half of

5
2010. Numbers and rates fell slightly during the second half of 2010 and the first quarter of 2011, however since the second quarter of 2011 rates have been rising to the current high of 24.3%.
Youth unemployment tends to be more responsive to the economic cycle than adult unemployment and this is partly due to the greater reliance of this age group on temporary jobs and on certain cyclically-sensitive industries, such as construction (Scarpetta, 2010).
THE COMPOSITION OF YOUTH UNEMPLOYMENT
Students
In Scotland approximately a third of those categorised as „youth unemployed‟ are in full-time education. According to the Scottish Government: „in Oct-Dec 2011, of the 102,000 people aged 16-24 who were unemployed in Scotland, approximately 36,000 (35%) were also in full-time education compared with 305,000 (30%) in the UK‟ (Scottish Government, 2012a). Table 2: Unemployed and enrolled in full-time education (16-24 year olds), Scotland
Scotland Oct- Dec
2008 Oct-Dec
2009 Oct-Dec
2010 Oct-Dec
2011
Unemployment - level (16-24) 55,000 71,000 82,000 102,000
Unemployment - rate (16-24) 13.0% 17.1% 19.1% 24.3%
Unemployed and enrolled in full-time education - level (16-24)
13,000 20,000 23,000 36,000
Unemployed and enrolled in full-time education - proportion of all unemployed (16-24)
24% 28% 28% 35%
Source: Labour Force Survey (ONS) via personal correspondence with the Scottish Government (Data are not seasonally adjusted)
Looking at the Labour Force Survey estimates in more detail, Table 2 shows that the number of unemployed full-time students has risen from 13,000 in October-December 2008 to 36,000 in October-December 2011, an increase of 177%. At the same time, the proportion of unemployed 16-24 year olds in full-time education has increased from around a quarter (24%) to over a third (35%).
Gender
For the period October to December 2011 LFS estimates show that of the 102,000 unemployed 16-24 year olds, the majority (63.0%) were young men. There has been a rapid rise in the number of unemployed young women since 2007 (an 80.4% increase) however the increase has been higher, albeit only slightly, amongst young men (an increase of 83.7%). There has however been a significant divergence between male and female rates during 2011.

6
Table 3: Youth unemployment rates (%) by gender (estimates)
Males (16-24)
Females (16-24)
Q1-2008 16.2 10.6
Q2-2008 14.4 11.7
Q3-2008 13.9 10.7
Q4-2008 15.9 9.6
Q1-2009 15.9 14.0
Q2-2009 18.0 15.4
Q3-2009 18.8 16.8
Q4-2009 19.2 14.9
Q1-2010 19.1 14.7
Q2-2010 21.7 23.1
Q3-2010 20.6 19.3
Q4-2010 18.7 19.6
Q1-2011 23.2 14.4
Q2-2011 25.3 16.4
Q3-2011 27.0 18.7
Q4-2011 28.5 19.5 Source: Labour Force Survey (2012).
Figure 2: Male and Female LFS youth unemployment rate (estimates)
Source: Labour Force Survey (2012).
Other characteristics of the young unemployed
In determining appropriate policy responses, the Scottish Government consider three distinct groups of young unemployed (Scottish Government, 2012b):
0
5
10
15
20
25
30
Q1-2
007
Q2-2
007
Q3-2
007
Q4-2
007
Q1-2
008
Q2-2
008
Q3-2
008
Q4-2
008
Q1-2
009
Q2-2
009
Q3-2
009
Q4-2
009
Q1-2
010
Q2-2
010
Q3-2
010
Q4-2
010
Q1-2
011
Q2-2
011
Q3-2
011
Q4-2
011
Un
em
plo
ym
en
t ra
te (
%) Males (16-24)
Females (16-24)
7
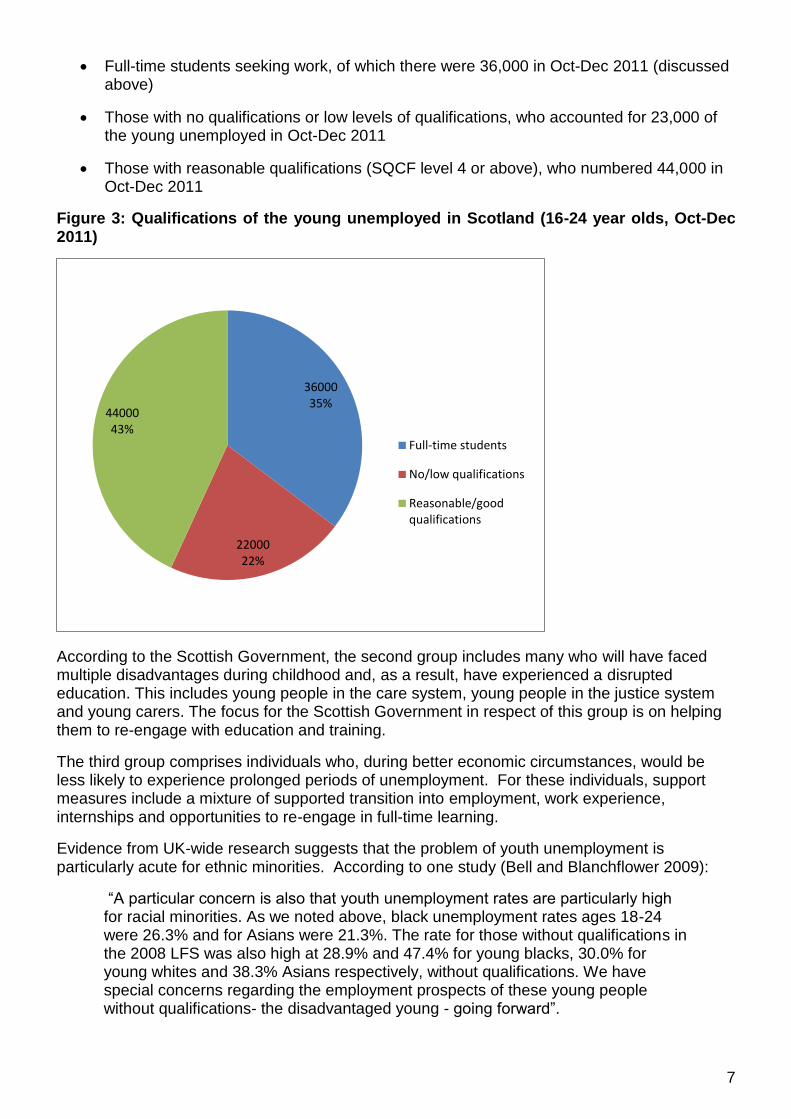
Full-time students seeking work, of which there were 36,000 in Oct-Dec 2011 (discussed above)
Those with no qualifications or low levels of qualifications, who accounted for 23,000 of the young unemployed in Oct-Dec 2011
Those with reasonable qualifications (SQCF level 4 or above), who numbered 44,000 in Oct-Dec 2011
Figure 3: Qualifications of the young unemployed in Scotland (16-24 year olds, Oct-Dec 2011)
According to the Scottish Government, the second group includes many who will have faced multiple disadvantages during childhood and, as a result, have experienced a disrupted education. This includes young people in the care system, young people in the justice system and young carers. The focus for the Scottish Government in respect of this group is on helping them to re-engage with education and training.
The third group comprises individuals who, during better economic circumstances, would be less likely to experience prolonged periods of unemployment. For these individuals, support measures include a mixture of supported transition into employment, work experience, internships and opportunities to re-engage in full-time learning.
Evidence from UK-wide research suggests that the problem of youth unemployment is particularly acute for ethnic minorities. According to one study (Bell and Blanchflower 2009):
“A particular concern is also that youth unemployment rates are particularly high for racial minorities. As we noted above, black unemployment rates ages 18-24 were 26.3% and for Asians were 21.3%. The rate for those without qualifications in the 2008 LFS was also high at 28.9% and 47.4% for young blacks, 30.0% for young whites and 38.3% Asians respectively, without qualifications. We have special concerns regarding the employment prospects of these young people without qualifications- the disadvantaged young - going forward”.
36000 35%
22000 22%
44000 43%
Full-time students
No/low qualifications
Reasonable/goodqualifications
8
Regional patterns of youth unemployment in Scotland
At a local level, unemployment rates are based on Jobseekers Allowance (JSA) claimant count data. It should be noted that the JSA claimant count is neither the official nor the most comprehensive measurement of youth unemployment, as it does not include 16 and 17 year olds, full-time students or others not eligible for job seeker benefits. Unemployment rates on this definition are therefore lower than the official measure. They are, however, useful in giving a picture of relative levels of youth unemployment across local areas. The data show highest rates of youth unemployment in parts of Glasgow, the west of Scotland, Kirkcaldy and parts of the Central Belt. Lowest rates are in Aberdeenshire, parts of Edinburgh, parts of Glasgow, North East Fife and the Shetland Islands.

9
Figure 4: JSA 18-24 year old rate by Scottish Parliament constituency, January 2012
Source: NOMIS 2012 (rates use 18-24 year old resident population as denominator)

10
The NEET Group
Scottish Government labour market statistics show there were 36,000 young people (aged 16-19) not in training, employment, education or training (NEET) in 2010, the most recent data available. The NEET group includes those who are not actively seeking work, so is a broader definition than the unemployment measure. NEET statistics generally relate to the 16-19 year old age group. Between 2008 and 2009, the size of the NEET group increased by 5,000 (1.9 percentage points), but remains lower than the levels recorded in 2005. Historically, the proportion of 16-19 year olds NEET is higher for men than for women.
Table 4: Proportion and level of 16 to 19 year olds who are NEET
Proportion Level
2004 13.1% 34,000
2005 14.2% 37,000
2006 12.4% 32,000
2007 12.2% 32,000
2008 11.8% 31,000
2009 13.7% 36,000
2010 13.7% 36,000
Source: Annual Population Survey (Jan to Dec)
School leaver destinations
Scottish Government school leaver destinations statistics show that for the 2010/11 cohort of school leavers 88.9% of leavers initially went into „positive destinations‟ (university, college, training or employment). On the other hand, 9.6% of school leavers were unemployed and seeking work and a further 1.2% were unemployed and not seeking employment. Since 2008/09 there has been a slight increase in the proportion of initial leavers moving to positive destinations, whereas the proportion leaving school and immediately becoming unemployed has reduced slightly.
Table 5: Percentage of school leavers from publicly funded secondary schools in Scotland by destination category, 2008/09 to 2010/11.
Source: Scottish Government (2012c) Summary Statistics for Schools in Scotland

11
UK AND INTERNATIONAL COMPARISONS
The youth unemployment rate in Scotland is currently higher than the equivalent rate for the UK as a whole (24.3% compared with 21.9% for the UK). However, this has not been the case throughout the period shown and until early 2010, the Scottish youth unemployment rate was lower than the equivalent UK rate.
Figure 5: Youth unemployment rates, Scotland and UK
Source: Labour Force Survey (ONS). Figures are not seasonally adjusted
Youth unemployment rates vary considerably across OECD countries. Of those shown in Figure 6, the UK‟s youth unemployment rate falls roughly half way between the lowest OECD rate (8.7% in the Netherlands) and the highest OECD rate (41.6% in Spain).
Figure 6: Youth unemployment rates, 2010
Source: OECD (accessed 23 February 2012)
0
5
10
15
20
25
30
16
to
24
un
em
plo
yme
nt
rate
(%
)
Scottish youthunemployment rate (%)
UK youth unemploymentrate (%)
0.0
5.0
10.0
15.0
20.0
25.0
30.0
35.0
40.0
45.0

12
HIDDEN UNEMPLOYMENT AND UNDEREMPLOYMENT
Official statistics do not capture the full extent of difficulties facing young people. In addition to those unemployed, there are those in the workforce but “underemployed”. Underemployment may be “visible” or “invisible” and exists when a person is working fewer hours than they would like to, or is working in a job for which they are over-qualified, due to a lack of alternative options. There are also those who are “discouraged” from seeking work by the economic situation and as a consequence they are not considered economically active and are excluded from official unemployment statistics altogether. All of these factors bring about an underutilised workforce.
Visible underemployment
Visible underemployment includes individuals who are working fewer hours than they would like to. Research by Bell and Blanchflower (2011a) into underemployment in the UK since the recession that started in Spring 2008 found “significant levels of underemployment among younger age groups - whether this is measured in relation to their actual hours of work, their desired hours of work, or their labour force participation” with young workers expressing a strong preference to increase their working hours. Table 6 shows how the number and percentage of those aged 16-24 years and working part-time has increased since the recession.
Table 6: 16-24 year olds working part-time as % of those in employment
Time period Number of 16-24 year olds working
part-time
% in employment working part-time - aged 16-24 years
Jul 2006-Jun 2007 141,900 37.5
Jul 2007-Jun 2008 131,800 34.9
Jul 2008-Jun 2009 132,400 36.0
Jul 2009-Jun 2010 143,200 42.0
Jul 2010-Jun 2011 149,300 44.2
Source: Annual Population Survey (2012)
In addition, Bell and Blanchflower‟s research found that the young are more likely to be in a temporary job than older workers, despite their preference for a permanent job. Research by the OECD (2010) into rising youth unemployment during the crisis also found that the youth are over-represented on temporary contracts and expressed concern about this situation, stating that “while for many these contracts are stepping stones into permanent jobs, for others they tend to be dead ends”.
Invisible underemployment
In some circumstances individuals cannot afford to undertake a lengthy job search and end up taking jobs for which they are overqualified. Invisible underemployment refers to these individuals, who are working in jobs where their skills are not adequately utilised (OECD 2002). Work by Bell and Blanchflower (2011b) focussed on sub-optimal job matches and found that “workers of all ages are accepting lower skilled jobs than they might have previously when the labour market was stronger, but effect is strongest for those aged 16 to 24”. They point out that this leads to further consequences:
The difficulties of unqualified job applicants increases since they find themselves in direct competition with the better qualified.
If young people accept a lower skilled job initially, there may be long-lasting negative effects on their labour market experience.

13
Discouraged workers
The transition from school to work is particularly difficult for the new generation of entrants in the labour market. The Highfliers review of the graduate market (2012) found that:
On average, employers have received 19% more graduate job applications so far, compared with the equivalent period in the 2010-2011 recruitment round.
To date, a third of applications for graduate positions in 2012 have been from previous graduates who left university in 2011 or earlier.
Research has also found that many young people are either “hiding out” in the education system rather than facing job search or are waiting for prospects to improve before taking up an active job search (ILO 2011). Bell and Blanchflower (2011a) recognised these individuals who are outwith the labour force in their research, finding that “the young are especially likely to have given up searching for work, even though they would like a job”.
THE LONG-TERM IMPACT OF YOUTH UNEMPLOYMENT
A spell of unemployment creates a direct loss of income for an individual and a direct impact for the Government in terms of increased benefit payments and loss of income tax revenues. There is also a direct cost to the economy in terms of lost productivity. However, there can also be longer terms “scars” brought about by unemployment, particularly youth unemployment. According to Bell and Blanchflower (2009):
“Unemployment while young, especially of long duration, causes permanent scars rather than temporary blemishes. For the young a spell of unemployment does not end with that spell; it raises the probability of being unemployed in later years and has a wage penalty. These effects are much larger than for older people.”
Impact on future employment prospects
A period of unemployment can lead to a depreciation of skills, forgone work experience and signal low productivity to potential employers (OECD 2010). As a result of these factors, unemployment can influence an individual‟s future employment prospects. In addition, there is some empirical evidence that early-career unemployment is linked with repeated incidence of unemployment. Burgess et al. found evidence of this effect among low-skilled individuals (1999). Further research by Gregg (2001) concluded that “an extra three months' youth unemployment (pre-23) for men leads to an extra one and a third months out of work (around 1 month of which is unemployment) between 28 and 33. The effect for women is about half this, even when inactivity as well as unemployment is considered”.
Impact on future earnings
There has been substantial research looking at the extent to which unemployment harms an individual in terms of future earnings. The OECD (2010) outlines that “most studies find that, on average, early youth unemployment has serious negative effects on incomes”. For example, Gregg and Tominey (2004) found that “youth unemployment does indeed impose a wage scar upon individuals, in the magnitude of 12% to 15% at age 42. However, this penalty is lower, at 8% to 10%, if individuals avoid repeat incidence of unemployment”.

14
Impact on well-being and health
Research by the Prince‟s Trust (2012) found that the emotional health of young people can suffer if they are unemployed, compared to those who are in work or education. For example, their survey results revealed that these individuals are more likely to feel “always” or “often” stressed, down and depressed and less likely to “always” or “often” feel loved and hopeful. In addition, they are less happy with all areas of their lives and less confident about their future. Bell and Blanchflower (2010) outline that:
“There is a wealth of literature showing that unemployment is a stressful life event that directly makes reduces individual well-being. This applies not just to the unemployed, but also may affect the employed due to increased anxiety over job security. Unemployment increases susceptibility to malnutrition, illness, mental stress, and loss of self-esteem, and increases the risk of depression. The unemployed also appear to be at higher risk of committing suicide, and of poor physical health outcomes later in life”.
Social impacts
Youth unemployment can also have adverse social impacts. For example, Fougère et al. (2009) undertook research in France which concluded that increases in youth unemployment induce increases in crime, specifically, burglaries, thefts and drug offences. Bell and Blanchflower (2010) highlight that “unemployment is often part of the cycle where involvement in crime reduces subsequent employment prospects which in turn increases the probability of participating in crime”. The International Labour Office (2011) also notes that “discontented youth have also engaged in protests in other countries, notably Greece, Italy and the United Kingdom, with at times violent outcomes”.
Impact on the public purse
Youth unemployment results in a range of both short-term and long-term costs not only for the individuals concerned, but also for their families and dependants, for wider society and for the public purse. Research which looked at the experiences of young men who had been „NEET‟ (not in employment, education or training) in their late teens with those who had not, found that once they reached their late 20s, those who had experienced being NEET were:
4 times more likely to be out of work – with resultant loss of earnings, benefit costs and loss of National Insurance contributions
5 times more likely to have a criminal record – with resultant costs to the criminal justice system and to society
6 times less likely to have qualifications – with resultant lower earnings potential for the individual and lower tax revenues for the state
3 times more likely to suffer from depression – with resultant impacts on the individual‟s quality of life and that of their family and friends and costs to the National Health Service
(Bynner and Parsons, 2002) Research undertaken by York University (Coles et al, 2010) found that a young person NEET in 2008 would cost an average of £56,000 in public finance costs before retirement age. This reflects the public finance costs of welfare payments, health and justice-related costs and lower tax and national insurance revenue. On the basis of this estimate, the Scottish Government

15
(2012b) estimates the lifetime cost of a single cohort of young people failing to make the transition into regular employment to be in the region of £2 billion.1 These costs do not take account of the additional „opportunity costs‟ of youth unemployment. Opportunity costs involve the wider losses to the economy, welfare loss to individuals and their families and the impact on society. The York University study estimated these opportunity costs at £104,000 across the working age life of a single person NEET in 2008. (Note that the opportunity cost figure cannot be added to the £56,000 public finance cost due to potential double counting).
1 Based on an estimated 36,000 16-19 years olds NEET in Scotland in 2010 (Scottish Government)

16
ANNEX A: DEFINITIONS OF YOUTH UNEMPLOYMENT
Labour Force Survey
Across OECD countries, the official measure of youth unemployment is defined by the International Labour Organisation. To be considered unemployed a young person (aged between 16 and 24) must be without work, available for work, and actively seeking work. This measurement includes full-time students looking for work. Youth unemployment figures in the UK are collected by the ONS through its Labour Force Survey (LFS) a continuous UK-wide survey with a sample of around 65,000 households, or approximately 120,000 people. The unemployment rate is calculated by dividing the number of unemployed 16-24 year olds by the total youth labour force (those in employment plus those who are unemployed). Due to the relatively small sample size, LFS figures are not available at small area level, and the ONS stresses that estimates of unemployment by age in Scotland are broadly indicative rather than definitive.
JSA claimant count
The other recognised measurement of unemployment in the UK is the Jobseeker Allowance (JSA) claimant count. JSA figures are administrative statistics which show the number, age and location of all people claiming JSA and National Insurance credits at Jobcentre Plus local offices. It is a useful measurement for identifying trends in smaller areas, such as local authority or constituency areas, for which LFS statistics are not available. Due to the absence of any sampling error it can be used to monitor unemployment amongst different age groups. It is worth emphasising, however, that the JSA claimant count is neither the „official‟ nor the most comprehensive measurement of youth unemployment, as it does not include 16 and 17 year olds, full-time students or others not eligible for job seeker benefits. Both measurements have their strengths and weaknesses, and both will be used throughout this paper where appropriate. In a recent paper, Professor David Bell sets out some of the problems associated with the representativeness of Scottish youth unemployment statistics: What is the rate of youth unemployment in Scotland? (2011)

17
SOURCES
Bell, D. and Blanchflower, D. (2009). What Should Be Done about Rising Unemployment in the UK? Available at - http://ftp.iza.org/dp4040.pdf Bell, D. and Blanchflower, D. (2010). Young People and Recession. A Lost Generation? Available at - http://www.dartmouth.edu/~blnchflr/papers/Economic%20Policy%20Article%20v3_24.pdf Bell, D. and Blanchflower, D. (2011a). Underemployment in the UK in the great recession, IN National Institute Economic Review, No 215 Jan 2011, ppR23-R33. Bell, D. and Blanchflower, D. (2011b). The crisis, policy reactions and attitudes to globalization and jobs. Available at - http://ftp.iza.org/dp5680.pdf Burgess, S. et al. (1999). The Class of ’81: The effects of early-career unemployment on subsequent unemployment experiences. Available at - http://www.bris.ac.uk/cmpo/publications/papers/1999/wp11.pdf Bynner, J and Parsons, S (2002). Social Exclusion and the Transition from School to Work: The Case of Young People Not in Education, Employment or Training (NEET), in Journal of Vocational Behaviour, vol. 60, 2002, pp289-309. Coles, B et al (2010). Estimating the life-time cost of NEET: 16-18 year olds not in Education, Employment or Training. Available at: http://www.york.ac.uk/media/spsw/documents/research-and-publications/NEET_Final_Report_July_2010_York.pdf Fougère, D. et al. (2006). Youth Unemployment and Crime in France. Available at - http://ftp.iza.org/dp2009.pdf Gregg, P. (2001). The impact of youth unemployment on adult unemployment in NCDS, Economic Journal, 111(475), pp. F623-F653. Available at - http://www.statoek.wiso.uni-goettingen.de/veranstaltungen/statistical%20consulting/Gregg.pdf Gregg, P. and Tominey, E. (2004). The wage scar from youth unemployment. Available at - http://www.bris.ac.uk/cmpo/publications/papers/2004/wp97.pdf Highfliers (2012). The Graduate Market in 2012. Available at - http://www.highfliers.co.uk/download/GMReport12.pdf International Labour Office (2011). Global Employment Trends for Youth – 2011 Update. Available at - http://www.ilo.org/wcmsp5/groups/public/---ed_emp/---emp_elm/---trends/documents/publication/wcms_165455.pdf OECD (2002). Glossary of Statistical Terms. Available at - http://stats.oecd.org/glossary/detail.asp?ID=3539
OECD (2010). Rising youth unemployment during the crisis: how to prevent negative long-term consequences on a generation? Available at - http://www.oecd.org/dataoecd/10/8/44986030.pdf
Prince‟s Trust (2012). The Prince’s Trust Youth Index 2012. Available at - http://www.princes-trust.org.uk/pdf/The%20Princes%20Trust%20Youth%20Index%202012%20FINAL%20low%20res.pdf

18
Scarpetta, S., A. Sonnet and T. Manfredi (2010), Rising Youth Unemployment During The Crisis: How to Prevent Negative Long-term Consequences on a Generation?, OECD Social, Employment and Migration Working Papers, No. 106, OECD Publishing. Available at: http://dx.doi.org/10.1787/5kmh79zb2mmv-en
Scottish Government (2012a). Youth Unemployment Summary Brief (16-24 year olds) - February 2012. Available at: http://www.scotland.gov.uk/Topics/Statistics/Browse/Labour-Market/AnalyticalPapers/YU16-24Feb2012
Scottish Government (2012b). Draft Youth Employment Strategy. Available at: http://www.employabilityinscotland.com/draftyouthemploymentstrategy.aspx
Scottish Government (2012c) Summary Statistics for Schools in Scotland, No.2, 2011 Edition (amended February 2012). Available at: http://www.scotland.gov.uk/Resource/0038/00388994.pdf

19
THIS PAGE IS INTENTIONALLY BLANK

20
RELATED BRIEFINGS
SB 12/20 Youth Unemployment: Policy SB 12/17 Unemployment – February 2012
Scottish Parliament Information Centre (SPICe) Briefings are compiled for the benefit of the Members of the Parliament and their personal staff. Authors are available to discuss the contents of these papers with MSPs and their staff who should contact Nicola Hudson on extension 85458 or email [email protected]. Members of the public or external organisations may comment on this briefing by emailing us at [email protected]. However, researchers are unable to enter into personal discussion in relation to SPICe Briefing Papers. If you have any general questions about the work of the Parliament you can email the Parliament‟s Public Information Service at [email protected].
Every effort is made to ensure that the information contained in SPICe briefings is correct at the time of publication. Readers should be aware however that briefings are not necessarily updated or otherwise amended to reflect subsequent changes.
www.scottish.parliament.uk