Yarn Strength Prediction
11
Hindawi Publishing Corporation Advances in Mechanical Engineering Volume 2010, Article ID 640103, 11 pages doi:10.1155/2010/640103 Research Article Yarn Strength Prediction: A Practical Model Based on Artificial Neural Networks Rocco Furferi 1 and Maurizio Gelli 2 1 Department of Mechanical and Industrial Technologies, University of Florence, 50121 Florence, Italy 2 New Mill S.P.A. Research Center, 59013 Montemurlo, Italy Correspondence should be addressed to Rocco Furferi, rocco.furferi@unifi.it Received 17 January 2010; Revised 21 May 2010; Accepted 17 June 2010 Academic Editor: Duc Truong Pham Copyright © 2010 R. Furferi and M. Gelli. This is an open access article distributed under the Creative Commons Attribution License, which permits unrestricted use, distribution, and reproduction in any medium, provided the original work is properly cited. Yarn strength is one of the most significant parameters to be controlled during yarn spinning process. This parameter strongly depends on both the rovings’ characteristics and the spinning process. On the basis of their expertise textile technicians are able to provide a raw and qualitative prediction of the yarn strength by knowing a series of fiber parameters like length, strength, and fineness. Nevertheless, they often need to perform many tests before producing a yarn with a desired strength. This paper describes a Feed Forward Back Propagation Artificial Neural Network-based model able to help the technicians in predicting the yarn strength without the need of physically spinning the yarn. The model performs a reliable prediction of the yarn strength on the basis of a series of roving parameters, commonly measured by the technicians before the yarn spinning process starts. The model has been trained with 98 training data and validated with 50 new tests. The mean error in prediction of yarn strength, using the validation set, is less than 4%. The results have been compared with the one obtained by means of a classical method: the multiple regression. Nowadays, the developed model is running in the laboratory of New Mill S.p.A., an important textile company that operates in Prato (Italy). 1. Introduction During yarn spinning, textile experts commonly controls a series of parameters like the fiber strength, the fiber length, the twist yarn, the yarn count, and the fineness. Strength parameters of yarns are especially important for rotor-spun yarns. More in detail a very important parameter that technicians want to control is the yarn strength. This is defined as the breaking force of a spinning yarn, and it is commonly measured in cN. On the basis of their skill, the expert operators are capable of giving a qualitative, raw prediction of the yarn strength; unfortunately the empirical estimation of the actual value of the yarn strength is not straightforward. The assessment of such parameter is essential for obtaining high quality of the yarn. Accordingly, in the last two decades, the modeling of yarn properties has become one of the most important and decisive tasks in the textile research field. A considerable number of predictive models have been implemented to evaluate some yarn properties like strength, elongation, evenness, and hairiness. The relationship between fiber properties and yarn prop- erties has been the focal point of several works [1–3]. The studies in literature have shown that the relationship between yarn strength and fiber properties is nonlinear. Accordingly mathematical models based on the fundamental mechanics of woven fabrics often fail to reach satisfactory results. Some studies have been performed so far for modeling the yarn strength using linear regression [4–6]. The main limitation of these studies is related to the need of defining a predefined linear model. In order to model a nonlinear relationship between input and output it is possible to devise an Artificial Intelligence-based approach. For this reason the problem of yarn properties prediction has been faced by some researchers by employing some knowledge-based approaches like artificial neural networks (ANNs) [7, 8] and neuro-fuzzy models [9]. Ramesh et al. [10], Zhu and Ethridge [11], Guha et al. [12], and Majumdar et al. [13] have successfully used the artificial neural network (ANN) and
-
Upload
naveen-bharathi -
Category
Documents
-
view
63 -
download
9
Transcript of Yarn Strength Prediction

Hindawi Publishing CorporationAdvances in Mechanical EngineeringVolume 2010, Article ID 640103, 11 pagesdoi:10.1155/2010/640103
Research Article
Yarn Strength Prediction: A Practical Model Based onArtificial Neural Networks
Rocco Furferi1 and Maurizio Gelli2
1 Department of Mechanical and Industrial Technologies, University of Florence, 50121 Florence, Italy2 New Mill S.P.A. Research Center, 59013 Montemurlo, Italy
Correspondence should be addressed to Rocco Furferi, [email protected]
Received 17 January 2010; Revised 21 May 2010; Accepted 17 June 2010
Academic Editor: Duc Truong Pham
Copyright © 2010 R. Furferi and M. Gelli. This is an open access article distributed under the Creative Commons AttributionLicense, which permits unrestricted use, distribution, and reproduction in any medium, provided the original work is properlycited.
Yarn strength is one of the most significant parameters to be controlled during yarn spinning process. This parameter stronglydepends on both the rovings’ characteristics and the spinning process. On the basis of their expertise textile technicians are ableto provide a raw and qualitative prediction of the yarn strength by knowing a series of fiber parameters like length, strength,and fineness. Nevertheless, they often need to perform many tests before producing a yarn with a desired strength. This paperdescribes a Feed Forward Back Propagation Artificial Neural Network-based model able to help the technicians in predicting theyarn strength without the need of physically spinning the yarn. The model performs a reliable prediction of the yarn strength onthe basis of a series of roving parameters, commonly measured by the technicians before the yarn spinning process starts. Themodel has been trained with 98 training data and validated with 50 new tests. The mean error in prediction of yarn strength,using the validation set, is less than 4%. The results have been compared with the one obtained by means of a classical method: themultiple regression. Nowadays, the developed model is running in the laboratory of New Mill S.p.A., an important textile companythat operates in Prato (Italy).
1. Introduction
During yarn spinning, textile experts commonly controlsa series of parameters like the fiber strength, the fiberlength, the twist yarn, the yarn count, and the fineness.Strength parameters of yarns are especially important forrotor-spun yarns. More in detail a very important parameterthat technicians want to control is the yarn strength. Thisis defined as the breaking force of a spinning yarn, and itis commonly measured in cN. On the basis of their skill,the expert operators are capable of giving a qualitative, rawprediction of the yarn strength; unfortunately the empiricalestimation of the actual value of the yarn strength isnot straightforward. The assessment of such parameter isessential for obtaining high quality of the yarn. Accordingly,in the last two decades, the modeling of yarn properties hasbecome one of the most important and decisive tasks in thetextile research field. A considerable number of predictivemodels have been implemented to evaluate some yarn
properties like strength, elongation, evenness, and hairiness.The relationship between fiber properties and yarn prop-erties has been the focal point of several works [1–3]. Thestudies in literature have shown that the relationship betweenyarn strength and fiber properties is nonlinear. Accordinglymathematical models based on the fundamental mechanicsof woven fabrics often fail to reach satisfactory results.Some studies have been performed so far for modelingthe yarn strength using linear regression [4–6]. The mainlimitation of these studies is related to the need of defininga predefined linear model. In order to model a nonlinearrelationship between input and output it is possible to devisean Artificial Intelligence-based approach. For this reasonthe problem of yarn properties prediction has been facedby some researchers by employing some knowledge-basedapproaches like artificial neural networks (ANNs) [7, 8]and neuro-fuzzy models [9]. Ramesh et al. [10], Zhu andEthridge [11], Guha et al. [12], and Majumdar et al. [13] havesuccessfully used the artificial neural network (ANN) and

2 Advances in Mechanical Engineering
neuralfuzzy methods to predict various properties of spunyarns. The fabric strength was modeled by Zeydan usingneural networks and Taguchi methodologies [14]. Supportvector machines (SVMs), based on statistical learning theory,have been developed by Yang and Xiang [15] for predictingyarn properties. The investigation indicates that in thesmall data sets and real-life production, SVM models arecapable of maintaining the stability of predictive accuracy.A comparison between physical and artificial neural networkmethods has been presented recently. The results show thatthe ANN model yields a very accurate prediction withrelatively few data points [16]. Moreover, it is proved thatthe parameters of the raw material that significantly influencethe basic quality parameters of the yarns are length, strength,and fineness of fibers [17–19]. The effect of yarn count andof twist yarn in the final yarn strength is also well established[20].
The objective of the present work is to propose anapproach for predicting the yarn strength based on FeedForward Back-propagation Artificial Neural Network (FFBPANNs). In authors’ opinion this work, strongly based onscientific literature, has its advantage in the fact that the FFBPANN model has been trained by means of fiber parametersthat are typically measured by the technicians for controllingthe yarn spinning. In other words, the technicians are notsupposed to carry out none of adjunctive experimental testthan they commonly assess. The reliability and goodness ofresults, in comparison with linear regression models, provethat the present work may be considered a practical methodfor assessing the yarn strength.
The developed system does not require technicians toproduce a yarn and to measure its strength. The expertshave only to test the rovings in order to assess some fiberproperties. This operation is normally done before produc-ing the yarn. Accordingly, by means of the devised model,the experience of the technicians is merged together with asimple approach in order to give an accurate prediction ofthe yarn strength.
2. Material and Methods
With the aim of developing a model of the yarn spinning,three tasks have been carried out:
(i) database creation,
(ii) definition of training parameters,
(iii) artificial Neural Network construction and training.
2.1. Database Creation. The first step for the development ofthe ANN-based system able to predict the yarn strength onthe basis of some fibers parameters was to perform a series ofexperimental tests. The main intent of such an experimentalapproach was to create a database of fiber parameters to useas input of an ANN-based algorithm. A total of 6 differentfamilies of rovings (obtained mixing together different kindsof fibers) were collected from an important spinning milloperating in Prato (Italy). For each of them, several differentvalues for fiber strength, fiber length, twist yarn, and yarn
count have been tested (see Table 1). The result is a set of 98different tests. The fiber length has been evaluated by meansof a Classifiber Model KCF/LS. The output of the Classifibermeasurement (see Figure 1) is given by the mean value oflength (ML), the humidity values (UHM and UI%), and thestandard deviation in % (CV%). The fineness was measuredwith an OFDA100, an image analysis system recognizedwith a Test Method from the (International Wool TextileOrganization) IWTO. The OFDA instrument is used tocertify mean fiber diameter. The output of the measurementis a statistical distribution of the fineness. The mean valueis assumed as the fineness parameter (see Figure 2(a)).The fiber strength was measured with a precision fiberdynamometer. In Table 2 the value of the parameters of someof the 98 tests is listed.
As may be noticed, each roving is composed by differentkinds, in different percentages, of fibers. Each fiber ischaracterized by a different value of length and fineness.For instance the roving named “velox 2” belongs to thefamily “Velox” composed by 25% viscose, 25% nylon, 10%cashmere, and 40% wool. These fibers are characterized bydifferent length and fineness. In order to use these data formodeling the yarn spinning, it is possible to evaluate a singleparameter for both length and fineness.
This can be easily carried out by defining, for eachroving:
(i) weighted average length (WL), computed as theaverage weighted length of the fibers from a rovingcomposed by a number i of different materials anddefined by the following equation:
WL =n∑
1
αi · Li [mm], (1)
(ii) fiber weighted average fineness (WF), computed asthe average weighted fineness of the fibers from aroving composed by a number i of different materialsand defined by the following equation:
WF =n∑
1
αi · Fi[m · 10−6], (2)
(iii) fiber weighted average strength (WS), computed asthe average weighted strength of the fibers from aroving composed by a number i of different materialsand defined by the following equation:
WS =n∑
1
αi · Ri [cN/tex]. (3)
In the example of the roving named “velox 2”, the valuesfor WL, WF , and WS might be evaluated as follows:
WL = 0.40 · 42 + 0.25 · 40 + 0.25 · 35 + 0.25 · 34
= 38.95 mm,
WF = 0.40 · 19.5 + 0.25 · 15.5 + 0.25 · 13 + 0.25 · 15
= 16.43 m · 10−6,
WS = 0.40 · 11.21 + 0.25 · 47.91 + 0.25 · 18.35
+ 0.25 · 10.19 = 22.07 cN/tex.
(4)

Advances in Mechanical Engineering 3
By means of (1), (2), and (3), for each of the 98different tests a set of 5 input parameters may be defined.In Table 3 a subset of this input set is listed. It is importantto remark that the parameters αi, Li, Fi, and Ri might beused for training the ANN as well, thus probably leading toaccurate results. However, when the number of componentscomposing a roving increases, the number of inputs increasesas well thus resulting in a more complex ANN architecture.Moreover, as already mentioned, the aim of the presentwork is to propose a practical approach to be used by thetechnicians and practitioners using parameters (like WL,WF , and WS) that they typically assess during the spinningprocess.
From each of the 98 selected rovings, the textile tech-nicians produced a yarn by using a ring frame machine(Marzoli ring spinning frame RST-1, see Figure 2(b)). Theprocess parameters adopted for producing the yarn weremaintained constants with the exception of the twist yarn.This is due to the fact that, as already stated, the twistyarn influences the yarn strength; therefore such a parameterhas been used as an input for the devised model. Onceproduced, the yarn strength of the 98 different yarns hasbeen measured by means of a dynamometer. Some of thevalues of yarn strength (YS) are listed in the last column ofTable 3.
2.2. Definition of Training Parameters. The result of theexperimental process consists in a dataset of 98 × 5 fiberparameters and of 98 values for yarn strength. For instance,in Table 4 the whole dataset related to cashmere family isshowed.
The dataset may be used as a training set for the FFBPANN model. In detail, the training set P is composed by amatrix 5× 98 composed by 98 vectors of 5 elements:
P =
⎡⎢⎢⎢⎢⎢⎣
Yc1 Yc2 · · · Yci · · · Yc98
Tw1 Tw2 · · · Twi · · · Tw98
WL1 WL2 · · · WLi · · · WL98
WF1 WF2 · · · WFi · · · WF98
WS1 WS2 · · · WSi · · · WS98
⎤⎥⎥⎥⎥⎥⎦. (5)
As previously mentioned the FFBP ANN is required tofind a nonlinear correlation between this training set and atarget set T, defined as a vector (size 1× 98) whose elementsare the yarn strength values of the 98 yarns:
T = [YS1, YS2, . . . , YSi, . . . , YS98]. (6)
2.3. Artificial Neural Network Construction and Training. Inorder to model the yarn spinning process, it is necessary todevise a proper neural network able to predict reliably thevalue of yarn strength, the yarn count, the twist yarn, theweighted average length, the weighted average fineness, andthe weighted average strength of a roving. This is possible ifthe ANN is properly training by means of the training andtarget sets. Both structure and training of the ANN have beendeveloped by using the Artificial Neural Network Toolboxworking into Matlab environment. The constructed FFBPANN, showed in Figure 3, has the following characteristics:
(i) three layers: input, hidden, and output layer;
(ii) hidden layer made of logistic neurons followed by anoutput layer of linear neurons;
(iii) 5 input, h hidden, and 1 output units.
The number of hidden neurons of feed-forward neuralnetworks, generally decided on the basis of experience [21],is an important factor for the training, in order to avoid overfitting in the function approximation. From one point ofview the number of hidden units may be stated a priori bymeans of empirical equations provided by the literature [22].
On the other hand it is possible to select the bestnetwork by estimation, for a given problem, of the networkarchitecture and parameters within a set of candidateconfigurations [23]. In the present work the value h wasevaluated varying from 2 to 14 with a step of 2 units,monitoring the performance of response using the trainingdata. As known, during the training, the weights and thebiases of the network are iteratively adjusted to minimizethe network error function. The network error used in thiswork is the mean square error (MSE) correspondent to thetraining set elements. This error is monitored during thetraining process and will normally decrease during the initialphase of the training. However, when the network becomesexcessively specialized in reproducing the training data, theearly stopping error will typically begin to rise. When theearly stopping error increases for a specified number ofiterations, the training is stopped, and the weights and biasesat the minimum early stopping error are returned. Theselected network is characterized by h = 10 units. Thetraining was carried out using a training rule based on theLevemberg-Marquardt descent backpropagation algorithmwith an adaptive learning rate [24]. Training set (input andtarget) has been scaled in the range [0-1] with a min-maxalgorithm. Training was automatically performed until theearly stopping error increases for a specified number ofiterations. This goal was obtained in 22 epochs (see Figure 4).
3. Results
Once trained, the network is able to correlate the trainingset elements to the target ones. In other words the ANN isable to receive any vector of 5 elements composed by the fiberparameters of any roving in input and to give, as output, theprediction of the yarn strength of the yarn produced withthat roving. Hence,
input (ANN) = [Ycin,Twin,WLin,WFin,WSin],
output (ANN) =[
YSpredicted
].
(7)
The predicted value of the yarn strength (YSpredicted) mustbe compared with the real value (YSreal) in order to assessthe reliability of the prediction. The comparison may beevaluated, in percentage, by defining a coefficient η, called“prediction error”, given by
η =∣∣∣YSreal − YSpredicted
∣∣∣
YSreal. (8)

4 Advances in Mechanical Engineering
Classifiber Series model KCF/LS version 4.20.0 <Basic> p.1New MILL S.p.A.Purchased date: Oct/16/2009Brand Name: Ws38kvvLot. No.: 118955Database: Fiber ResourcesPrint Date: Oct/16/2009Group no. 1No. SL 2.5% SL50% UR% SFC% ML UHM UI% SL66,0% CV%1 56.5 mm 21.4 mm 37.9% 0.3% 41.8 mm 48.8 mm 85.7% 17.3 mm 29.4%2 56.8 mm 21.6 mm 38% 1.1% 42.5 mm 53.1 mm 80.0% 16.9 mm 30.6%3 55.0 mm 19.8 mm 36% 0.0% 40.2 mm 51.0 mm 78.8% 15.8 mm 32.9%4 57.2 mm 22.8 mm 39.9% 0.7% 44.8 mm 53.8 mm 83.3% 18.3 mm 28.7%Total Evaluation N = 4
SL 2.5% SL50% UR% SFC% ML UHM UI% SL66,0% CV%Mean 56.4 mm 21.4 mm 38.0% 0.5% 42.3 mm 51.7 mm 81.9% 17.1 mm 30.4%Min 55.0 mm 19.8 mm 36.0% 0.0% 40.2 mm 48.8 mm 78.8% 15.8 mm 28.7%Max 57.2 mm 22.8 mm 39.9% 1.1% 44.8 mm 53.8 mm 85.7% 18.3 mm 32.9%STD. DEV. 1.0 1.2 1.6 0.5 1.9 2.3 3.1 1.0 1.8
Figure 1: Example of output of the Classifiber Model KCF/LS measurement: the mean value of length (ML), the humidity values (UHMand UI%), and the standard deviation in % (CV%) of a lot of rovings are showed.
Table 1: Number of different tests performed for each roving in order to train the ANN system.
Yarn Type Composition
Number of testsperformed varying the
fiber parameters fortraining the net
Number of testsperformed varying the
fiber parameters fortesting the net
Cashmere 100% cashmere 18 8
Maghreb 80% wool20% nylon
16 8
Joy60% viscose
14 835% nylon
5% cashmere
Beta
28% viscose
15 815% nylon
7% angora
10% cashmere
40% wool
Gamma
30% viscose
14 815% nylon
20% cashmere
35% wool
Velox
25% viscose
21 1025% nylon
10% cashmere
40% wool
Total number of Tests 98 50
Smaller is the value of η and better is the prediction.In order to validate and test the approach a new series of
experimental test (called “validation set”) has been carriedout. This new experimental phase consisted in collecting theparameters of 50 new rovings (see last column of Table 1).These parameters are used as a test set for the devised ANN.
More in detail the ANN has to give a response closer to thereal value of the really produced yarn strength. In Table 5some of the 50× 5 parameters are showed. In order to clarifythe approach described above, an example is provided below.Let suppose we want to predict the yarn strength of the“gamma 19” roving whose parameters are listed in Table 5.

Advances in Mechanical Engineering 5
Table 2: percentage, yarn count, twist, length, fineness, and fiber strength of some rovings within the 98 tested ones.
Yarn type Fiber Percentage Yarn count [tex] Twist [g/m] Length [mm] Fineness [m∗10−6] Fiber strength [cN]
Cashmere 18.3 38 16 10.19
Cashmere 1 Cashmere 80.19 35.52 416 40 15 10.19
Cashmere 1.78 34 15 10.19
Cashmere 1.5 33 15 10.19
Cashmere 0.33 39 15 10.19
Cashmere 2 Cashmere 10.5 36.48 413 34 16.5 10.19
Cashmere 23.83 39 16 10.19
Cashmere 37.01 38 15.5 10.19
Cashmere 26.83 40 15.5 10.19
Maghreb 1 Wool 80 66.48 290 38 21 11.21
Nylon 20 40 15.5 47.91
Maghreb 2 Wool 80 52.95 302 38 21 11.21
Nylon 20 40 15.5 47.91
Viscose 60 35 13 18.35
Joy 1 Nylon 35 57.52 317 40 15.5 47.91
Cashmere 5 34 15 10.19
Viscose 60 35 13 18.35
Joy 2 Nylon 35 50.76 329 40 15.5 47.91
Cashmere 5 36 15 10.19
Viscose 28 35 13 18.35
Nylon 15 40 15.5 47.91
Beta 1 Angora 7 65.2 291 38 14 9.17
Cashmere 10 36 15 10.19
Wool 40 40 19.5 11.21
Viscose 28 35 13 18.35
Nylon 15 38 15.5 47.91
Beta 2 Angora 7 65.35 316 20 14 9.17
Cashmere 10 35 15 10.19
Wool 40 40 19.5 11.21
Viscose 30 35 13 18.35
Gamma 1 Nylon 15 64.08 281 40 15.5 47.91
Cashmere 20 34 15 10.19
Wool 35 38 19.5 11.21
Viscose 30 35 13 18.35
Gamma 2 Nylon 15 76.23 312 40 15.5 47.91
Cashmere 20 36 15 10.19
Wool 35 38 19.5 11.21
Wool 40 42 19.5 11.21
Velox 1 Nylon 25 62.09 294 40 15.5 47.91
Viscose 25 35 13 18.35
Cashmere 10 34 15 10.19
Wool 40 42 19.5 11.21
Velox 2 Nylon 25 60.9 304 40 15.5 47.91
Viscose 25 35 13 18.35
Cashmere 10 34 15 10.19
The input set for the ANN is given by the following vector:
input (ANN) = [Ycin,Twin,WLin,WFin,WSin]
= [15.22, 313, 30.25, 16.3, 18.653].(9)
The ANN response to this input vector is givenby
output (ANN) =[
YSpredicted
]= 350.5 [cN]. (10)

6 Advances in Mechanical Engineering
Table 3: Values of yarn count, twist, WL, WF , WR, and yarn strength for 12 of the 98 different tests.
Yarn type Yarn count [tex] Twist [g/m] WL [mm] WF [m∗10−6] WS [cN/tex] Yarn strength [cN]
Cashmere 1 35.52 416 39.64 15.22 10.19 118.1
Cashmere 2 36.48 413 38.28 15.72 10.19 137.3
Maghreb 1 66.48 290 38.40 19.90 18.55 333.5
Maghreb 2 52.95 302 38.40 19.90 18.55 270.7
Joy 1 57.52 317 36.70 13.98 28.29 589.7
Joy 2 50.76 329 36.80 13.98 28.29 496.7
Beta 1 65.20 291 38.06 16.25 18.47 402.8
Beta 2 65.35 316 36.40 16.25 18.47 428.4
Gamma 1 64.08 281 36.60 16.05 18.65 323.4
Gamma 2 76.23 312 37.00 16.05 18.65 406.4
Velox 1 62.09 294 38.95 16.43 22.07 313.6
Velox 2 60.90 304 38.95 16.43 22.07 379.1
Table 4: values of yarn count, twist, WL, WF , WR, and yarn strength (YS) related to “cashmere” family.
Yarn type Yarn count [tex] Twist [g/m] WL [mm] WF [m∗10−6] WS [cN/tex] YS [cN]
Cashmere 1 35.52 416.00 39.64 15.22 10.19 118.10
Cashmere 2 36.48 413.00 38.28 15.72 10.19 137.30
Cashmere 3 37.15 416.20 38.92 15.85 11.10 134.21
Cashmere 4 37.17 416.42 38.65 16.07 10.86 138.26
Cashmere 5 37.18 420.01 39.04 16.57 11.35 128.21
Cashmere 6 38.14 425.00 39.12 16.82 11.33 123.20
Cashmere 7 38.91 428.31 39.13 17.56 11.49 121.98
Cashmere 8 38.96 432.01 40.12 18.50 12.02 132.10
Cashmere 9 39.44 432.16 40.50 19.25 12.80 123.90
Cashmere 10 39.57 432.53 40.86 20.09 13.02 138.09
Cashmere 11 40.08 433.98 40.89 20.63 13.88 137.85
Cashmere 12 40.91 438.01 40.90 20.72 14.83 120.22
Cashmere 13 37.06 439.55 39.22 16.28 11.19 137.69
Cashmere 14 37.48 432.87 39.59 16.84 11.45 124.98
Cashmere 15 37.68 421.87 38.95 16.27 11.75 119.54
Cashmere 16 38.49 425.76 39.07 16.34 12.71 139.76
Cashmere 17 38.71 430.42 39.90 17.20 13.37 140.70
Cashmere 18 39.39 431.75 40.20 18.17 13.72 142.87
The real value of yarn strength measured with adynamometer (after producing the yarn) is given by
YSreal = 356.6. (11)
Finally the prediction error is given by
η = 1.71%. (12)
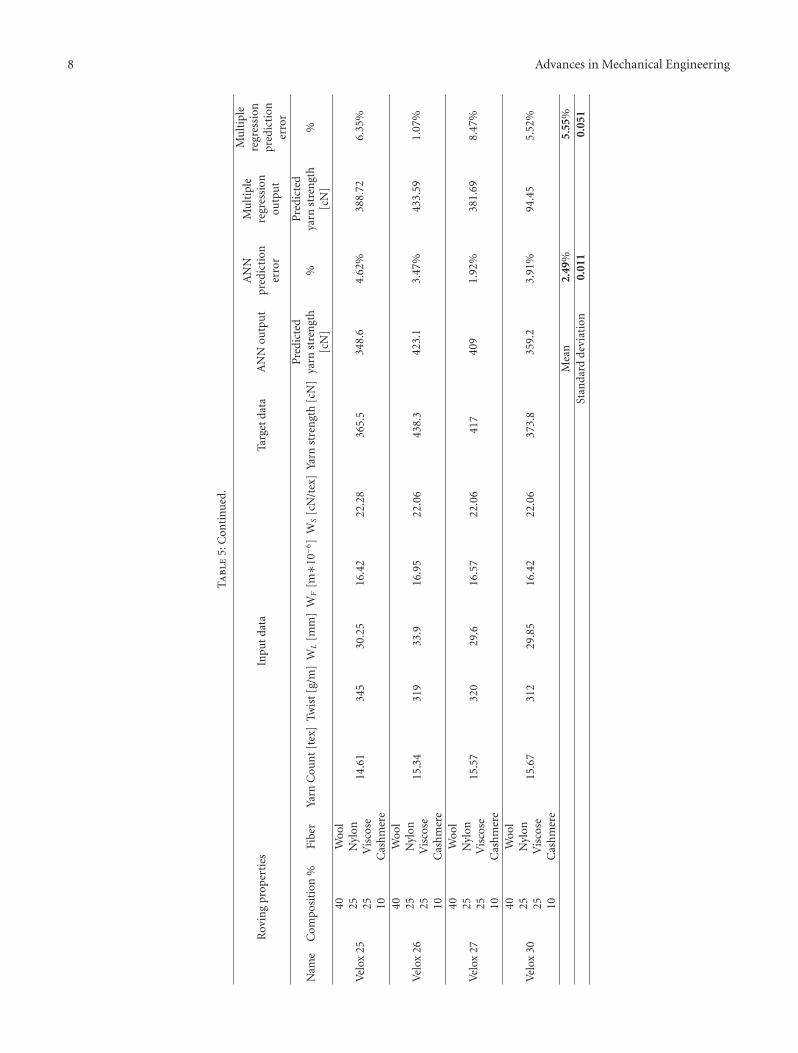
In Table 5 the results of 11 of the whole set of 50 newinputs are provided. Referring to Table 5 the mean errorin prediction of yarn strength is 3.07% with a standarddeviation equal to 0.0127. The maximum value in errorprediction is equal to 5.17%. These results may be comparedwith the one obtained by means of a multiple regression-based model. The regression equation (evaluated using, as
input, the values of Yc,Tw,WL,WF , and WS normalized inthe range [0-1]) is given by
YS = 1.027− 0.334 · Yc − 0.59 · Tw + 1.072 ·WL
− 1.090 ·WF + 0.8602 ·WS.(13)
This linear regression model, as depicted in the lastcolumn of Table 5, leads to an average estimation error equalto 5.55%. In Table 6 the results of simulation performedwith the FFBP ANN model on the whole set of 50 rovingsare listed. Referring to this validation set the mean error inprediction by using the FFBP ANN is 3.5%. The standarddeviation is equal to 0.015. In some cases, like for instancefor the roving named “joy 18”, the maximum error maybe relevant (in this case it is equal to 7.5%). This highererror may be reduced using more data for training the ANN.Future works will be addressed for the building of a moreconsistent database.
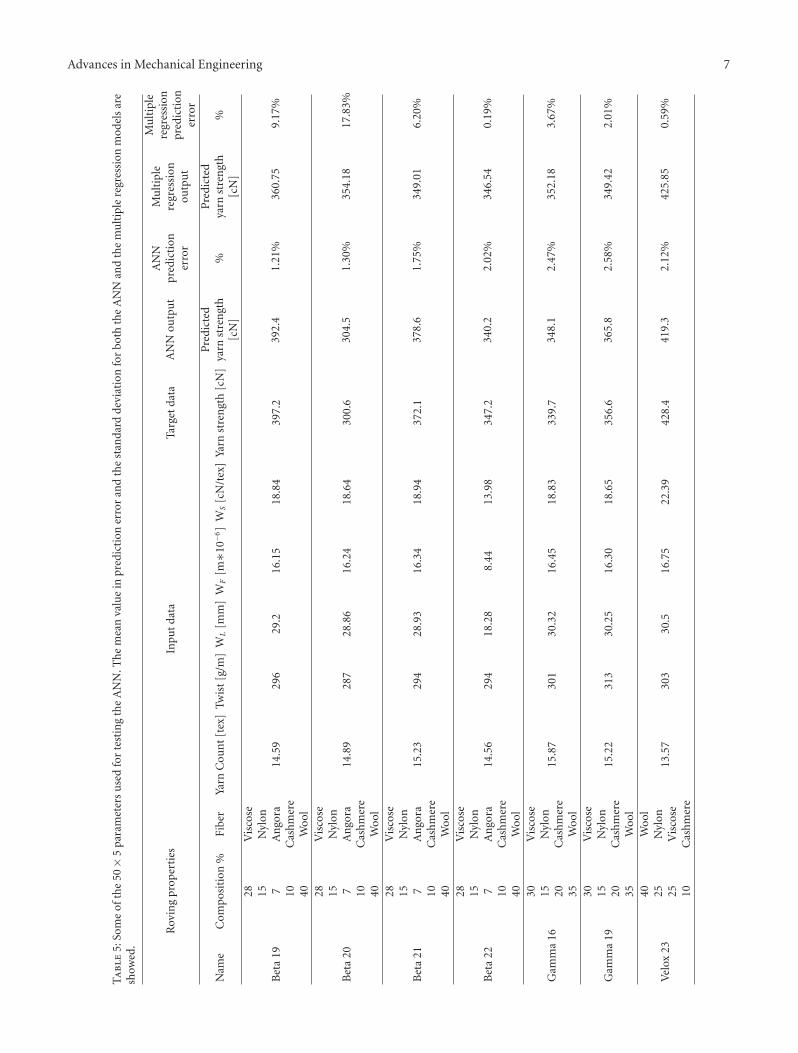
Advances in Mechanical Engineering 7
Ta
ble
5:So
me
ofth
e50×
5pa
ram
eter
su
sed
for
test
ing
the
AN
N.T
he
mea
nva
lue
inpr
edic
tion
erro
ran
dth
est
anda
rdde
viat
ion
for
both
the
AN
Nan
dth
em
ult
iple
regr
essi
onm
odel
sar
esh
owed
.
Rov
ing
prop
erti
esIn
put
data
Targ
etda
taA
NN
outp
ut
AN
Npr
edic
tion
erro
r
Mu
ltip
lere
gres
sion
outp
ut
Mu
ltip
lere
gres
sion
pred
icti
oner
ror
Nam
eC
ompo
siti
on%
Fibe
rYa
rnC
oun
t[t
ex]
Twis
t[g
/m]
WL
[mm
]W
F[m∗1
0−6]
WS
[cN
/tex
]Ya
rnst
ren
gth
[cN
]P
redi
cted
yarn
stre
ngt
h[c
N]
%P
redi
cted
yarn
stre
ngt
h[c
N]
%
Bet
a19
28V
isco
se
14.5
929
629
.216
.15
18.8
439
7.2
392.
41.
21%
360.
759.
17%
15N
ylon
7A
ngo
ra10
Cas
hm
ere
40W
ool
Bet
a20
28V
isco
se
14.8
928
728
.86
16.2
418
.64
300.
630
4.5
1.30
%35
4.18
17.8
3%15
Nyl
on7
An
gora
10C
ash
mer
e40
Woo
l
Bet
a21
28V
isco
se
15.2
329
428
.93
16.3
418
.94
372.
137
8.6
1.75
%34
9.01
6.20
%15
Nyl
on7
An
gora
10C
ash
mer
e40
Woo
l
Bet
a22
28V
isco
se
14.5
629
418
.28
8.44
13.9
834
7.2
340.
22.
02%
346.
540.
19%
15N
ylon
7A
ngo
ra10
Cas
hm
ere
40W
ool
Gam
ma
16
30V
isco
se
15.8
730
130
.32
16.4
518
.83
339.
734
8.1
2.47
%35
2.18
3.67
%15
Nyl
on20
Cas
hm
ere
35W
ool
Gam
ma
19
30V
isco
se
15.2
231
330
.25
16.3
018
.65
356.
636
5.8
2.58
%34
9.42
2.01
%15
Nyl
on20
Cas
hm
ere
35W
ool
Vel
ox23
40W
ool
13.5
730
330
.516
.75
22.3
942
8.4
419.
32.
12%
425.
850.
59%
25N
ylon
25V
isco
se10
Cas
hm
ere
8 Advances in Mechanical Engineering
Ta
ble
5:C
onti
nu
ed.
Rov
ing
prop
erti
esIn
put
data
Targ
etda
taA
NN
outp
ut
AN
Npr
edic
tion
erro
r
Mu
ltip
lere
gres
sion
outp
ut
Mu
ltip
lere
gres
sion
pred
icti
oner
ror
Nam
eC
ompo
siti
on%
Fibe
rYa
rnC
oun
t[t
ex]
Twis
t[g
/m]
WL
[mm
]W
F[m∗1
0−6]
WS
[cN
/tex
]Ya
rnst
ren
gth
[cN
]P
redi
cted
yarn
stre
ngt
h[c
N]
%P
redi
cted
yarn
stre
ngt
h[c
N]
%
Vel
ox25
40W
ool
14.6
134
530
.25
16.4
222
.28
365.
534
8.6
4.62
%38
8.72
6.35
%25
Nyl
on25
Vis
cose
10C
ash
mer
e
Vel
ox26
40W
ool
15.3
431
933
.916
.95
22.0
643
8.3
423.
13.
47%
433.
591.
07%
25N
ylon
25V
isco
se10
Cas
hm
ere
Vel
ox27
40W
ool
15.5
732
029
.616
.57
22.0
641
740
91.
92%
381.
698.
47%
25N
ylon
25V
isco
se10
Cas
hm
ere
Vel
ox30
40W
ool
15.6
731
229
.85
16.4
222
.06
373.
835
9.2
3.91
%94
.45
5.52
%25
Nyl
on25
Vis
cose
10C
ash
mer
eM
ean
2.49
%5.
55%
Stan
dard
devi
atio
n0.
011
0.05
1

Advances in Mechanical Engineering 9
New Mill S.p.A.
Date 25 Mar 2009 Mean 15.71 u
Sample Id Kvss08203 SD 3.53 u
Description 38 mm cal 4 Sample size 10002
5% of fibres 6.7 above mean Spin fineness
99.9%
0 200 400 600 800 1000 1200
00
0.10.20.51.53.79.1
19.937.961.182.294.999.399.9100
1011223461319
4056
92134
219321
461613
830972
11501169
1125985
755515
295144
4817
621
Cu
m(%
)
15.5 u
Mean value
Comfort factor
(a) (b)
Figure 2: (a) Example of output obtained by means of the OFDA instrument: statistical distribution of the fineness. The mean value isassumed as the fineness parameter. (b) Ring frame machine used in the work.
h1
h2
hn
InputLayer
+
LayerOutput
+w w
b b
Yci
TWi
WLi
WFi
WSi
YSi
Figure 3: A scheme of the devised ANN. The ANN is composedby three layers: input, hidden and output layer. The hidden, layeris made of logistic neurons followed by an output layer of linearneurons. The value for h was set to 10.
4. Conclusions
With the devised model the textile technicians may test anykind of rovings composed by different percentages of fibers.As stated above the experts are capable of knowing theyarn strength without physically processing it by using theprovided model. The model gives an output in less than 1 sec
101
100
10−1
10−2
0 5 10 15 20 25
TrainValidation
TestBest
Best validation performance is 0.046721 at epoch 22
Mea
nsq
uar
eder
ror
(mse
)
28 (epochs)
Figure 4: Training performance (MSE versus Epochs). The besttraining has been reached for 22 epochs.
and uses parameters that are commonly measured by thetechnicians before starting the spinning process. As a resultthey can quickly test a large number of rovings until theyreach the best desirable strength property. After this phase oftesting they may effectively spin the yarn. Furthermore, also
10 Advances in Mechanical Engineering
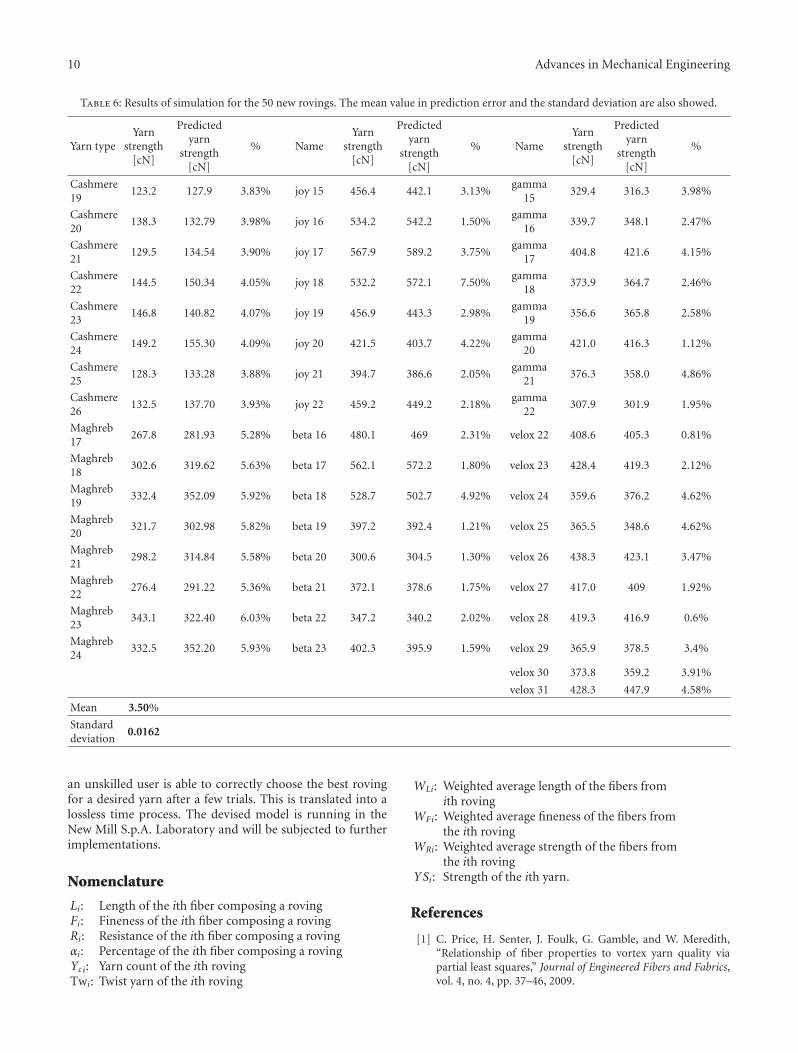
Table 6: Results of simulation for the 50 new rovings. The mean value in prediction error and the standard deviation are also showed.
Yarn typeYarn
strength[cN]
Predictedyarn
strength[cN]
% NameYarn
strength[cN]
Predictedyarn
strength[cN]
% NameYarn
strength[cN]
Predictedyarn
strength[cN]
%
Cashmere19
123.2 127.9 3.83% joy 15 456.4 442.1 3.13%gamma
15329.4 316.3 3.98%
Cashmere20
138.3 132.79 3.98% joy 16 534.2 542.2 1.50%gamma
16339.7 348.1 2.47%
Cashmere21
129.5 134.54 3.90% joy 17 567.9 589.2 3.75%gamma
17404.8 421.6 4.15%
Cashmere22
144.5 150.34 4.05% joy 18 532.2 572.1 7.50%gamma
18373.9 364.7 2.46%
Cashmere23
146.8 140.82 4.07% joy 19 456.9 443.3 2.98%gamma
19356.6 365.8 2.58%
Cashmere24
149.2 155.30 4.09% joy 20 421.5 403.7 4.22%gamma
20421.0 416.3 1.12%
Cashmere25
128.3 133.28 3.88% joy 21 394.7 386.6 2.05%gamma
21376.3 358.0 4.86%
Cashmere26
132.5 137.70 3.93% joy 22 459.2 449.2 2.18%gamma
22307.9 301.9 1.95%
Maghreb17
267.8 281.93 5.28% beta 16 480.1 469 2.31% velox 22 408.6 405.3 0.81%
Maghreb18
302.6 319.62 5.63% beta 17 562.1 572.2 1.80% velox 23 428.4 419.3 2.12%
Maghreb19
332.4 352.09 5.92% beta 18 528.7 502.7 4.92% velox 24 359.6 376.2 4.62%
Maghreb20
321.7 302.98 5.82% beta 19 397.2 392.4 1.21% velox 25 365.5 348.6 4.62%
Maghreb21
298.2 314.84 5.58% beta 20 300.6 304.5 1.30% velox 26 438.3 423.1 3.47%
Maghreb22
276.4 291.22 5.36% beta 21 372.1 378.6 1.75% velox 27 417.0 409 1.92%
Maghreb23
343.1 322.40 6.03% beta 22 347.2 340.2 2.02% velox 28 419.3 416.9 0.6%
Maghreb24
332.5 352.20 5.93% beta 23 402.3 395.9 1.59% velox 29 365.9 378.5 3.4%
velox 30 373.8 359.2 3.91%
velox 31 428.3 447.9 4.58%
Mean 3.50%
Standarddeviation
0.0162
an unskilled user is able to correctly choose the best rovingfor a desired yarn after a few trials. This is translated into alossless time process. The devised model is running in theNew Mill S.p.A. Laboratory and will be subjected to furtherimplementations.
Nomenclature
Li: Length of the ith fiber composing a rovingFi: Fineness of the ith fiber composing a rovingRi: Resistance of the ith fiber composing a rovingαi: Percentage of the ith fiber composing a rovingYci: Yarn count of the ith rovingTwi: Twist yarn of the ith roving
WLi: Weighted average length of the fibers fromith roving
WFi: Weighted average fineness of the fibers fromthe ith roving
WRi: Weighted average strength of the fibers fromthe ith roving
YSi: Strength of the ith yarn.
References
[1] C. Price, H. Senter, J. Foulk, G. Gamble, and W. Meredith,“Relationship of fiber properties to vortex yarn quality viapartial least squares,” Journal of Engineered Fibers and Fabrics,vol. 4, no. 4, pp. 37–46, 2009.

Advances in Mechanical Engineering 11
[2] M. E. Ureyen and H. Kadoglu, “Regressional estimation ofring cotton yarn properties from HVI fiber properties,” TextileResearch Journal, vol. 76, no. 5, pp. 360–366, 2006.
[3] M. W. Suh, K. Hyun-Jui, and C. Xiaoling, “Prediction of yarntensile properties based on HVI testing of 36 U.S. Uplandcottons,” in Proceedings of the Beltwide Cotton Conferences, pp.786–790, San Diego, Calif, USA, January 1998.
[4] S. Ertugrul and N. Ucar, “Predicting bursting strength ofcotton plain knitted fabrics using intelligent techniques,”Textile Research Journal, vol. 70, no. 10, pp. 845–851, 2000.
[5] Y. E. El Mogahzy, “Selecting cotton fiber properties for fittingreliable equations to HVI data,” Textile Research Journal, vol.58, no. 7, pp. 392–397, 1988.
[6] M. D. Ethridge, J. D. Towery, and J. F. Hembree, “Estimatingfunctional relationships between fiber properties and thestrength of open-end spun yarns,” Textile Research Journal, vol.52, no. 1, pp. 35–45, 1982.
[7] P. K. Majumdar and A. Majumdar, “Predicting the breakingelongation of ring spun cotton yarns using mathematical, sta-tistical, and artificial neural network models,” Textile ResearchJournal, vol. 74, no. 7, pp. 652–655, 2004.
[8] L. Cheng and D. L. Adams, “Yarn strength prediction usingneural networks. I. Fiber properties and yarn strength rela-tionship,” Textile Research Journal, vol. 65, no. 9, pp. 495–500,1995.
[9] N. Ucar and S. Ertugrul, “Predicting circular knitting machineparameters for cotton plain fabrics using conventional andneuro-fuzzy methods,” Textile Research Journal, vol. 72, no. 4,pp. 361–366, 2002.
[10] M. C. Ramesh, R. Rajamanickam, and S. Jayaraman, “Pre-diction of yarn tensile properties by using artificial neuralnetworks,” Journal of the Textile Institute, vol. 86, no. 3, pp.459–469, 1995.
[11] R. Zhu and M. D. Ethridge, “The prediction of cotton yarnirregularity based on the ‘AFIS’ measurement,” Journal ofTextile Institute, vol. 87, no. 3, pp. 509–512, 1996.
[12] A. Guha, R. Chattopadhyay, and B. Jayadeva, “Predicting yarntenacity: a comparison of mechanistic, statistical, and neuralnetwork models,” Journal of the Textile Institute , vol. 92, no. 1,pp. 139–145, 2001.
[13] A. Majumdar, A. Ghosh, S. S. Saha et al., “Empirical modellingof tensile strength of woven fabrics,” Fibers and Polymers, vol.9, no. 2, pp. 240–245, 2008.
[14] M. Zeydan, “Modelling the woven fabric strength using artifi-cial neural network and Taguchi methodologies,” InternationalJournal of Clothing Science and Technology, vol. 20, no. 2, pp.104–118, 2008.
[15] J.-G. Yang, Z.-J. Lv, and Q. Xiang, “Yarn properties predictionusing support vector machines: an intelligent reasoningmethod,” in Proceedings of the 4th International Conference onFuzzy Systems and Knowledge Discovery (FSKD ’07), vol. 1, pp.696–700, Haikou, China, August 2007.
[16] Z. Bo, “Predicting fiber diameter of Polypropylene (PP)spunbonding nonwovens process: a comparison betweenphysical and artifical neural network methods,” in Proceedingsof the International Conference on Computational Intelligenceand Security (CIS ’09), vol. 1, pp. 639–642, Beijing, China,December 2009.
[17] B. Chylewska and D. Cyniak, “Requirements for fibres used forrotor-spun yarns,” Bulletin of the Gdynia Cotton Association,no. 4, pp. 33–47, 1998 (Polish).
[18] T. Jackowski and I. Frydrych, “What i learnt in fibre quality:practical experience,” in Proceedings of the 58th PlenaryMeeting of the International Cotton Advisory Committee,Charleston, SC, USA, October 1999.
[19] M. Frey, “Influence of fibre parameters and values of theirvariation on the spinning process,” in Proceedings of the 4thInternational Conference on Grid Computing and Applications,Gdynia, Poland, 1995.
[20] M. Kilic and A. Okur, “Relationships between yarn diam-eter/diameter variation and strength,” Fibres and Textiles inEastern Europe, vol. 14, no. 5, pp. 84–87, 2006.
[21] H. C. Yuan, F. L. Xiong, and X. Y. Huai, “A method forestimating the number of hidden neurons in feed-forwardneural networks based on information entropy,” Computersand Electronics in Agriculture, vol. 40, no. 1–3, pp. 57–64, 2003.
[22] J. M. Kinser, “The determination of hidden neurons,” OpticalMemories and Neural Networks, vol. 5, no. 4, pp. 245–262,1996.
[23] L. Ren and Z. Zhao, “An optimal neural network and concretestrength modeling,” Advances in Engineering Software, vol. 33,no. 3, pp. 117–130, 2002.
[24] A.-H. Tan, G. A. Carpenter, and S. Grossberg, “Intelligencethrough interaction: towards a unified theory for learning,”in Proceedings of the 4th International Symposium on NeuralNetworks (ISNN ’07), vol. 4491 of Lecture Notes in ComputerScience, pp. 1094–1103, June 2007.