XXIX CONFERENZA ITALIANA DI SCIENZE REGIONALI THE … · THE USE OF CONJOINT CHOICE EXPERIMENT TO...
23
1 XXIX CONFERENZA ITALIANA DI SCIENZE REGIONALI THE USE OF CONJOINT CHOICE EXPERIMENT TO INVESTIGATE THE PREFERENCES OF INHABITANTS FOR THE REUSE OF DERELICT AREAS: AN APPLICATION TO TRIESTE OLD PORT Jérôme MASSIANI and Paolo ROSATO Università degli studi di Trieste, Dipartimento di Ingegneria Civile e Ambientale, Piazzale Europa, 1, 34127 Trieste. ABSTRACT In many developed countries, abandoned (derelict or underused) industrial areas often occupy important parts of the cities. This raises issues about the possibilities of reusing these areas as well as on the conservation of industrial heritage they often entail. The Conjoint Analysis (CA) can shed light on these issues as it can elicit the preferences of inhabitants for different scenarios of reuse. However, only a limited number of applications of CA have been made on this topic. In this article, we present the results of a CA experiment on the reuse of a large, mainly abandoned, port area in Trieste (Italy) featuring buildings with some historical and industrial heritage value. Three hundred computer assisted interviews have been made on a representative sample of Trieste inhabitants, eliciting their preferences for different reuse hypotheses and building conservation scenarios. The survey explores two original topics: the impact of the time horizon of the payment (single or decennial special purpose tax) and the consideration of various mixes of future uses. The collected data have been processed using latent class and mixed logit models to explore heterogeneity among interviewees' preferences. Our findings show that, while preferences clearly emerge in favor of tourism and leisure oriented uses, preferences in terms of conservation and the impact of cost are much more difficult to measure. This difficulty persists even when specified or non specified heterogeneity is taken into account, although Mixed logit estimate provides more convincing results.
Transcript of XXIX CONFERENZA ITALIANA DI SCIENZE REGIONALI THE … · THE USE OF CONJOINT CHOICE EXPERIMENT TO...

1
XXIX CONFERENZA ITALIANA DI SCIENZE REGIONALI
THE USE OF CONJOINT CHOICE EXPERIMENT TO INVESTIGATE THE PREFERENCES OF INHABITANTS FOR THE REUSE OF DERELICT AREAS: AN APPLICATION TO TRIESTE OLD PORT
Jérôme MASSIANI and Paolo ROSATO
Università degli studi di Trieste, Dipartimento di Ingegneria Civile e Ambientale, Piazzale Europa, 1, 34127 Trieste.
ABSTRACT
In many developed countries, abandoned (derelict or underused) industrial areas often occupy important parts of the cities. This raises issues about the possibilities of reusing these areas as well as on the conservation of industrial heritage they often entail. The Conjoint Analysis (CA) can shed light on these issues as it can elicit the preferences of inhabitants for different scenarios of reuse. However, only a limited number of applications of CA have been made on this topic. In this article, we present the results of a CA experiment on the reuse of a large, mainly abandoned, port area in Trieste (Italy) featuring buildings with some historical and industrial heritage value. Three hundred computer assisted interviews have been made on a representative sample of Trieste inhabitants, eliciting their preferences for different reuse hypotheses and building conservation scenarios. The survey explores two original topics: the impact of the time horizon of the payment (single or decennial special purpose tax) and the consideration of various mixes of future uses. The collected data have been processed using latent class and mixed logit models to explore heterogeneity among interviewees' preferences. Our findings show that, while preferences clearly emerge in favor of tourism and leisure oriented uses, preferences in terms of conservation and the impact of cost are much more difficult to measure. This difficulty persists even when specified or non specified heterogeneity is taken into account, although Mixed logit estimate provides more convincing results.

2
1 INTRODUCTION
In many developed countries, derelict areas occupy relevant parts of the cities. The existence of these areas raise issues regarding their future use. Moreover a number of these areas host buildings with some historical value, at least as testimonies of industrial history. In this context, policy makers and planners may need some instruments in order to know the preferences of inhabitants regarding the future of these areas. A common instrument to investigate preferences of individuals for yet unexisting situations that has been developed in the area in psychometrics and is commonly used in economics is Conjoint Analysis. This instrument has generated a number of applications in areas ranging from transport economics to the valuation of environmental externalities or the demand for cultural goods. An ongoing stream of research is using these techniques to "assign a value" to conservation of heritage (Pierce and al. 2002). However, only a very limited number of applications regard the preferences of inhabitants for the future of urban areas. Strictly speaking we are not aware of the applications of this technique to the future use of an urban area with consideration to the conservation of existing buildings. The present article aims at filling this gap. The chosen field of application is the Old Harbour of Trieste (North-East Italy) a 700.000 square meters (173 acres) area that is presently unused, except for scarce port activities. This area hosts warehouses and industrial buildings constructed at the end of XIXth century, that have some heritage value and are currently protected under Italian regulation. In this context, this paper aims at investigating the preferences of Trieste's inhabitants for the future of the Old Harbour regarding uses and conservation. The method used is based on Choice Based Conjoint Analysis. Our research differs from available results on different points. 1. We explicitly concentrate on functions and functions mixes, while most of the available
results consider merely conservation. This also allows use to investigate the possible complementarities and/ or incompatibilities between different functions.
2. We deal with an heritage that has an "intermediate" value, while most of the previous researches (Pearce et al., 2002, pp. 262-264) concentrate on construction with outstanding value.

3
3. We explicitly deal with different levels of preservation, giving the possibility to the users to express preferences for the conservation of 0, 25 and 50 % of the buildings. This makes it possible to detect non linearity in the value assigned to the heritage.
4. We make use of single scale valuation regarding future uses and conservation, together with Conjoint Analysis questions so as to be able to compare the outcomes of both types of surveys.
5. We investigate with special care the impact of the time scale for the payment (single year tax or decennial tax). Attention on the "periodicity of the elicited WTP" was listed by Pearce et al (2002, p. 265) as one of the major topics of future research for the valuation of heritage.
The article is structured in the five sections. Following this introduction (section 1), section 2 presents the context of Trieste Old Harbour, section 3 presents the data collection and descriptive results about the sample, section 4 provides the results of the Conjoint Choice experiment, Section 5 draws the conclusion of the research and indicates the possibilities for future developments.
2 TRIESTE OLD HARBOUR
In this section, we provide a brief overview on the history of Trieste Old Port and subsequently investigate the possible future of the area.
2.1 From new harbour to Old Harbour
The harbour was built during years 1867-1883, when the city of Trieste was under the Austrian authority, based on the project of the French engineers Paulin Talabot and Hilarion Pascal. However, it is only after 1887 that the warehouses and technical/servicing buildings were built to substitute shelters and give the harbour a more definite form. In the 1920's, when the harbour had found its final configuration, it held about 37 warehouses and 20 service buildings, among which some of peculiar architectural interest as the hydrodynamic station (that was using water pressure to movement goods), the warehouse number 26, and the custom belt surrounding the harbour. Due to the fast growing traffic of the beginning of the 20th century, and due to the intrinsic limitation of the Old Harbour (in particular the shallow banks) a decision was taken to expand the harbour facilities of Trieste through the construction of a new harbour in the easternmost part of the city (distant 4 km from Old Harbour). The work started in 1901. Twenty years after its completion, what was until then the "new harbour" becomes the "Old Harbour", as it is still now.

4
Figure 1 Snapshot of buildings of Trieste Old Harbour
In the subsequent years, the Old Harbour will have a declining activity and will be the object of numerous urban projects. Table 1 provides an overview of the main projects developed for the area, including an unsuccessful candidature of Trieste for the International Exhibition of 2008. None of these will be even partially undertaken. The port area is nowadays mainly unused, except for a few specialized freight activities (like a terminal for the export of living cattle, some stocking in the warehouses, and some administrative functions related to the maritime activity like the port authority). Table 1- 35 years of unrealized projects in the Old Port, an overview
1974 Guido Canella's project based on Park, Exhibition centre, parking. 1988 - 91 Project Polis: urban neighbourhood with offices Project Bonifica: Two marinas and offices with a tunnel connecting with the new Harbour 1990 Synthesis between Polis and Bonifica projects Special planning scheme focused on traffic issues 1995 Project Tergeste Pier III : Marinas, shops and parks. 1997 Association Trieste Futura: Masterplan for the restoration of Old Harbour (arch. Sola
Morales) 2000 Port authority project for the update of old harbour masterplan (arch S. Boeri), the project is
blocked by the veto of the ministry of cultural goods. 2006 A new masterplan (engineering Systematica and NormanFoster And partners) is proposed. It
is compatible with the listing of different buildings and mixes a large variety of functions.

5
2.2 Prospect for the future of Old Harbour
The current situation of the area appears to many observers as unsatisfactory because the port area has major assets. First, it is very close to the heart of the city (less than one km from the virtual centre of the city and adjacent to Trieste central station). Second, it is a very large area (700.000 m²). This is a valuable resource because, although Trieste economy is relatively stagnating, the city is one whose building space is scarce due to its geographical situation (the city is built on a tiny land strand, between a plateau and the seashore). The legal situation of the port is also peculiar : it is a free custom area in virtue of a post war agreement, known as the London memorandum, a situation latter recognised by European Union Treatise. This may explain the difficulties that emerged in the realisation of past projects. Recently, the regulatory framework of the Old Harbour has undergone important changes through deliberations of the port authority and the local administrations, that issued new building and land use regulation for the area. This change will authorize a number of non strictly maritime activities in the area (in a first stage: education, shops, offices). In this new context a number of questions arises. These questions relate to the function mix that the area will host. Functions that such a terrain can host are numerous, to name a few: industry, shops, education, public services (hospital, schools, etc), offices, marinas, hotels and restaurant etc; not to mention the expansion of port activity that is advocated by part of the business community. Given the size of the area, it would be unreasonable to concentrate on one single use for the Old Harbour and it is more sensible to think in terms of function mix, referring at least to one main use and one complementary use. Eventually the future of the area raises issues about the conservation of existing buildings. These buildings may not be outstanding, especially in a city that can count on a very rich built heritage, it is however a legacy of the past port history of the city. This heritage is submitted to legal protection: a majority of the buildings is protected by a restrictive regulations (Marin, 2003).
3 DATA COLLECTION
In this section we present the questionnaire. We also provide information on the data collection process. Eventually we present descriptive data of the questionnaire.

6
3.1 The questionnaire
A full list of the interview questions is provided in appendix. The questionnaire consists of three parts. The first part is introductory: it contains questions that allow to check that the interviewee meets the target population (people living in the Trieste Province), how much they know of the Old Harbour (did they already go there ? are they capable of precisely indicating its location in the city, etc…), closed question (would they prefer the Old Harbour to become a pedestrian area ?) as well as ratings of possible future uses of the port. A second section consists in the conjoint analysis experiment itself. Each interviewee had to answer to eight conjoint choice questions. These questions are as illustrated on Figure 2. Two "project" alternatives are presented, together with one "status quo" alternative defined as "make no intervention and leave the Old Harbour as it is". The project alternative are defined by four attributes: two attributes describing the reuse of the port (main use and complementary use), one describing conservation versus reconstruction, one reflecting the cost of the program. More in details, the attributes were: • Main use, as well of complementary use could be among the followings : Port, Industrial,
Shops, Offices, Housing, Hotels and restaurants, Marinas, Parking, Public services (school, civic centre).
• Conservation and restoration of existing buildings : 0 (full reconstruction), 25 % (only buildings with high heritage value), 50 % (same as previous + buildings of intermediate heritage value).
• Cost for taxpayers (25, 50, 100, 150 €). This attribute expresses the cost of a future scenario for the reuse of Old Harbour. It is based on the assumption that the cost would incur through a special scope local tax. This extra cost is expressed in two different ways: single payment or the annual amount of a decennial tax. This flexibility, as will be detailed latter in the paper, permits to control for the effect of payment horizon on the results of the choice experiment. Half of the sample answered the questionnaire with the 10 years payment and half of the sample answered the questionnaire with the single payment.

7
Figure 2 Conjoint choice interview screenshot (translation to English, questionnaire with 10 years payment)
Figure 2 illustrates the screen that was presented to the interviewees during the conjoint choice section of the questionnaire. A third section contains a set of supplementary descriptive questions regarding the socio economic characteristics of the interviewee (personal net income, age, education, etc).
3.2 Data collection
The data collection took place from 20 may to 28 July 2007. The target population was defined as the inhabitants of Trieste Province . The survey method was based on quota sampling. Four characteristics have been selected to define the quota: age, sex, area of habitation and level of education. The target of the quotas are presented in Table 2. These targets were respected in the data collection with a deviation smaller than 1 %.
Which alternative would you prefer ?
Conservation Cost (taxes) Main use Complementary use
25 % high heritage value
building
25 € x 10 years
Offices
Port
0% complete reconstruction
100 € x 10 years
Housing
Production
Make no intervention and
leave the Old Harbour as it is
now.

8
Table 2 Questionnaire target quotas (%, reproduced ± 1 % in the collected data) Age: 18-24 6,1 24-34 15,9 35-44 16,6 45-54 15,6 55-64 16,8 65-74 14,2 >74 14,8 Gender: Male 46,2 Female 53,8 Location: Neighbourhoods close to the port 29,9 Other neighbourhood of Trieste municipality 57,3 Other municipalities in the Province 12,8 Educational level: University degree 6,9 Secondary school 30,8 Primary school (final) 30,3 Primary school (intermediate) 27,4 No diploma 4,6
3.3 Descriptive results
The descriptive data collected in the survey indicate, first, a good level of familiarity of interviewees with the harbour. It turned out that 94 % of the interviewees know the location of the Old Harbour, although 25 % were knowing its location but could not give a clear description of its extension . 58 % of the interviewees already entered the area of the port, mainly for professional or entertainment purposes , 42 % (out of 58%) entered the area at several occasions. Interestingly, we asked people what they thought was the current use of the Old Harbour, and it turned out that 82 % of the interviewees declared it was not used, 7 % said it was used for port activities, and 10 % for parking. While the latest answer derives from a confusion (there is a large parking building at the hedge of the area, but not within the area) the two other answers should be considered as consistent with the current situation of the area. The second information provided by the interview indicates a concern that, the future of the area should not only be dictated by a functionality but also by urban quality. First, interviewees advocate a balance between the construction of new roads to access the area and the need to preserve the interior of the area from too much road and traffic: while 55 % of the interviewees declare "very important" or "rather important" the "creation of roads to connect the area with the main road network", 88 % of them declare that they would prefer an area mainly pedestrian rather than the "construction of roads within the old port area".

9
Interviewees exhibit also a preference for the conservation of existing buildings : keeping "buildings with high or intermediate heritage value, half of the existing buildings" would be favoured by 46 % of the sample ; an alternative, more modest protection (preserving "only buildings with high heritage value, 25 % of existing buildings") would be supported by 45 % of the population. This means that 91 % of the sample is in a favour of the preservation of 25 % or more of the buildings ; and, conversely, only 9 % of the population is in favour of a complete reconstruction of the area. Eventually we asked people to rate the different future possible uses of the area. As illustrated on Table 3, the main features emerging from these data is that there are clear preferences for uses linked with leisure and tourism (Marina is ranking first, Hotels and restaurant is ranking second) and services for the public (ranking third). On the contrary, there is a reject of industrial and port activities (both ranking as the two least preferred activities). Table 3 Rating of possible future uses of the Old Harbour area Port Production Shops Parking Housing Offices Services for
the public Hotels and restaurant
Marina
Mean 3,8 3,7 4,1 4,4 5,2 5,4 5,8 6,2 7,5Median 3,0 4,0 4,0 5,0 5,0 6,0 6,0 7,0 8,0Variance 9,2 5,8 5,8 4,8 6,2 6,7 7,3 6,7 3,5
Note : question was phrased as "important for the future of Old Harbour", 1 means not important, 10 means very important. These results give indication on the preferences of Trieste inhabitants for the future of the port area. However, one limitation of such results is that they give no indication on the trade-offs between competing objectives, and in particular they give no monetary measure to the benefits of the various possible interventions in the area. To overcome these limitations we make use of the conjoint choice data whose results are presented hereafter.
4 CONJOINT CHOICE EXPERIMENT RESULTS
The conjoint choice data have been analysed using different models. We first present the results of a basic multinomial Logit.
10
4.1 Multinomial logit
The model is
P(i) = 3
1
i
j
V
V
j
e
e=
∑, (1)
where P(i) is the probability of choosing alternative i, and Vi is the deterministic component of the indirect utility of alternative i, and : i i iU =V + = X + i iε β ε (2)
where Ui is the indirect utility of alternative i, β is a vector of coefficient, and Xi is a vector of attributes. Xi consists of the following attributes : • Annual tax : amount of annual taxation (= 0 for the interviews with 10 year taxation); • Total 10 years tax = 10 € annual tax, (= 0 for interviews with single year taxation); • RestCons25 : a spline variable that takes the value 0 if the alternative has no conservation,
and the value 25 if the scenario implies restoration and conservation of the most valuable 25 % among existing buildings;
• RestCons50 : 0 if the alternative has no conservation, 50 if the alternative implies restoration and conservation of 50 % of the buildings. Note that using such a codification for RestCons25 and RestCons50, the corresponding coefficients can be directly compared as they express the utility of one percent of restoration;
• 8 variables that code the Main Use of the area. Namely: port, production, shops, offices, housing, hotels and restaurant, marinas, parking, public services (hospital, schools, etc). These variables are coded using effect coding rather than the more usual dummy codification;
• 8 variables that code the complementary use (same list as main use, included with effect coding);
• Status quo : a dummy variable that is 1 for the alternative described as "make no intervention and leave Old Harbour in its current situation" and 0 for other alternatives.

11
Table 4 Model estimates for MNL (both questionnaires and single questionnaire) Model number Model 1 Model 2 Model 3 Model type MNL MNL MNL
Half sample Full sample Sample
One year tax 10 years tax (One year +10 years)
n obs (choices) 1200 1200 2400 rho² 0.232 0.172 0.196 LogLikelihood -1091 -1013 -2120 β Signif. β Signif β Signif Total cost (euro) (1 year) -0.00039 - - -0.00049 (10 years) - - -0.00014 -0.00011 Restoration- R-Cons25 % -0.0011 -0.0041 -0.0021 Conservation R-Cons50 % -0.0019 0.0007 -0.0005
Port -0.64 - -0.98 - -0.80 - Production -0.77 *** -1.22 *** -0.97 *** M Shops -0.28 ** -0.46 ** -0.35 *** A Offices 0.28 ** 0.49 ** 0.37 *** I Housing -0.11 0.01 -0.04 N Hotels and rest 0.43 *** 1.14 *** 0.76 *** Marinas 1.71 *** 1.93 *** 1.79 *** Parking -1.26 *** -1.57 *** -1.41 *** USES Services 0.64 *** 0.66 *** 0.65 *** C Port -0.66 - -0.97 - -0.79 - O Production -0.55 *** -0.42 *** -0.49 *** M Shops -0.06 -0.07 -0.06 P Offices 0.23 * 0 .27 * 0.24 ** L Housing -0.23 * 0.00 * -0.10 E Hotels and rest -0.06 0.10 0.01 M Marinas 0.90 *** 0.81 *** 0.84 *** E Parking 0.09 -0.13 -0.01 N Services 0.33 *** 0.41 *** 0.36 *** Status quo -0.55 *** -0.56 *** -0.54 ***
Significance *** at 1 % probability, ** at 5 %, * at 10 %. "-" = Non available. Table 4 presents the results of a simple MNL model. Model 1 is calibrated on the 150 questionnaires with one year payment, Model 2 is calibrated on the 150 questionnaires with 10 years payment. Model 3 is calibrated on all 300 interviews. The general pattern exhibited by models 1 to 3 is striking. They indicate very clear preferences in favour of leisure or tourism oriented uses and a strong opposition to productive uses (industrial and port) as well as parking. This is conform to answers given through Likert scales. Complementary uses exhibit the same kind of preferences except that "hotels and restaurants" and "parking" are not significant. Results also indicate that the present situation of the port is disliked by the interviewees. Recall that these estimates have been made using

12
the Effect Coding of the uses' attribute, instead of the more usual dummy coding. For this reason, each coefficient of the variables that are included in this form can be interpreted independently of the choice made for the (omitted) base variable. Another relevant result is that neither cost nor the share of restored buildings are significant in the estimates. As far as cost is concerned, this is hardly consistent with economic theory. As far as conservation is concerned, this is not consistent with answers given by interviewees to previous answers of the questionnaire. This motivated a more in depth examination of the data based on the idea that the reasons behind these results had to be found in heterogeneity of preferences among the interviewees. This hypothesis relies on a set of evidences collected in the literature on heritage preservation and cultural goods. For instance, Garrod and Willis' valuation of maximum Willingness to Pay for visiting the Durham cathedral indicates that individual willingness to pay of the interviewees varies a lot (2002, p. 46). A number of researches also found that individuals preferences could be grouped into clusters. A way to identify these clusters is to make use of Latent Class where the segmentation of the population in different clusters is made together with the model estimation. Applications of Latent Class to heritage goods include the visits to Dutch museums (Boter et alii, 2004), the preservation of marble monuments (Morey and Rossmann, 2003), choice of recreational parks (Boxall and Adamowicz, 2002), the visits made to urban parks (Kemperman and Timmermans, 2006, Kemperman et alii, 2005). These latest found that the decomposition of the demand into four groups noticeably improves the quality of the model. Other methods to deal with heterogeneity rely on Mixed Logit which relax the hypothesis of fixed coefficients among the population in favour of a continuous distribution. In the next paragraphs we propose to implement various instruments to explore the heterogeneity among interviewees in order to check for the existence of preferences for conservations and aversion to costs.
4.2 A priori segmentation based on interviewees' characteristics
A preliminary approach is to make use of a priori segmentation. Different segmented models have been estimated based on characteristics of the interviewees (sex, age, education, location, professional status, …).

13
Table 5 Segment with payment or conservation significant (10%) Attribute Value Segment β P critic Number
of obs. Number of interviewees
Conservation 50 % No diploma -0.0188 0.07 112 14 18-24 years 0.0117 0.07 144 18 Student 0.0146 0.04 112 14Taxes 10 years Female -0.0003 0.01 1280 160
Habitation = close to the harbour
-0.0003 0.02 728 91
Secondary school diploma -0.0003 0.03 752 94 Age = 55 - 64 years -0.0004 0.06 416 52 1 year Retired -0.0029 0.09 664 83
Note : estimations have been made based on specification of model 3, poling observations of one year tax and ten years taxes interviews. Table 5 indicates that only a few among the segments of the population have a significant coefficient (at the 10 % confidence level) for the conservations or cost attributes. Conservation at 25 % is never found to be significant, while conservation at the 50 % level is found to be significantly praised mainly among young interviewees (18-24 years old and students) and is significantly disliked among interviewees with low educational level. One year tax is found significant only for retired people, while 10 years tax has a significant and negative coefficient for Female, people living in the area close to the harbour, people whose educational level is secondary school diploma and people whose age is between 55 and 64 years. These results indicate that a priori segmentation may not suffice to represent heterogeneity among the interviewees. This motivated to investigate whether latent class model would not be superior in that it relaxes the hypothesis of deterministic clustering that is underlying in a priori segmentation.
4.3 Latent class estimate
The latent model expresses the probability of choosing alternative i, as the product of two probabilities: the probability of belonging to class c and the probability of choosing alternative i if individual belongs to class c. Formally:
( ) ( )1 1
1 1
exp( ) exp( )( ) | .
exp( ) exp( )
C Cc c i
C Jc c
c c jc j
z XP i P i c P c
z X
δ β
δ β= =
= =
= = ⋅∑ ∑∑ ∑
(1)

14
where δc are the class membership model coefficients, z are the characteristics of the individuals that are relevant for the classification among classes, βc are the class specific coefficients and Xj are the attributes of alternative j. The latent class approach is based on a discrete distribution of the coefficients' vector. Different latent class models have been estimated based on our data. The choice has been to estimate separated models for the each version of the questionnaire. This choice is based on the conjecture that the existence of two different versions of the questionnaire in one single latent class model could bring to serious flaws in the clustering of the population because the version of the questionnaire would already structure the data set. Table 6 Latent class estimates (2 classes, One year tax) Model number Model 4 Model type Latent Class Sample One Year Tax
n obs (choices) 1200 rho² 0.23 LogLikelihood -1011.7 Class 1 Class 2 β Signif β SignifTotal cost (euro) (1 year) -0.0068 *** 0.0009 (10 years) - - - - Restoration- R-Cons25 % 0.0070 -0.0042 conservation R-Cons50 % 0.0048 -0.0040 **
Port 1.13 - -1.16 - Production 1.06 *** -1.43 *** M Shops 1.69 *** -0.76 *** A Offices 0.92 *** 0.27 *** I Housing -1.84 *** 0.22 ** N Hotels and rest -1.81 *** 0.92 *** Marinas 1.90 *** 2.04 *** Parking -2.17 *** -1.17 *** USES Services -0.88 *** 1.07 *** C Port 0.83 - -1.13 - O Production 0.31 -0.85 *** M Shops 0.07 -0.15 P Offices 0.40 0.30 *** L Housing -1.20 *** 0.01 E Hotels and rest -1.18 *** 0.28 ** M Marinas 1.35 *** 0.90 *** E Parking -0.69 ** 0.10 N Services 0.10 0.53 *** Status quo -1.18 *** -0.37 ***

15
The general conclusion that emerged from these results, is that only a few among the estimates were feasible (due to convergence issues) and it was noticeably difficult to obtain estimates for more than two categories. Table 6 presents the results of a Latent Class model (2 classes) estimated on the questionnaire with one year tax. This models include a set of class membership coefficients (personal income; zone of habitation – whether close to or far from the port, coded as an ordered variable; education; age). This model exhibit a significant coefficient for cost in the first class and for conservation (50%) in the second class. Interestingly, a larger number of coefficients for the use attributes are significant in both class, compared with the specification without segmentation (model 3), like for instance the coefficient for housing. However, the validity of these results is limited considering that class membership model has no significant coefficient. This observation may indicate that latent class is not the appropriate tool to represent heterogeneity in our observations. This may be due to the assumption about discontinuities of coefficient values that is inherent to the latent class approach. This motivated to estimate mixed logit models where the distribution of individual coefficients is assumed to be continuous.
4.4 Mixed Logit
Mixed logit model relaxes the hypothesis of discrete distribution that is inherent to the latent class estimation in favour of a continuous distribution of each coefficient. The coefficients are assumed to be distributed, independently of � and X with a distribution where are the parameters of the distribution in the population, e.g. the mean and covariance. Such a specification is useful to capture variation in preferences among shippers. Several distribution can be assumed: typically, normal, lognormal, triangular, uniform, etc.. Instead, the error term is assumed to be independently and identically distributed (iid) extreme value type I. If the researcher observed , then the choice probability would be a standard logit. That is the probability conditional on is
∑=
= J
jnjn
ninnni
X
XL
1
'
'
)exp(
)exp()(
β
ββ (2)
However, the researcher does not know . The unconditional choice probability is therefore the integral of over all possible variables of ∫= βθββ dfLP nnini )|()( . (3)

16
A Mixed Logit probability is the integral of standard logit probabilities over a density of parameters, or, in other terms, a weighted average of the logit formula evaluated at different values of , with the weights given by the density function . Table 7 presents the estimates of a mixed logit model. This models assumes a triangular distribution for the cost coefficients. This is conform to the a priori expectation that cost coefficient is bound to be always negative. The conservation coefficients were assumed to be normally distributed, a solution that is usually invoked when there are no contrary evidence. Results indicated on Table 7 indicate that the fitting of the model is improved compared with models without heterogeneity. It also appears that one cost coefficient (ten year taxes) and one conservation coefficient (25 %) are significant at the 10 % confidence level. Moreover the sign of the costs coefficient is coherent with expectations while the sign of the coefficient associated with the 25 % conservation is negative, which indicates a dislike for conservation. The standard deviation of the normal distribution of both conservation coefficients is significant, which indicates the existence of dispersion of the "tastes" of the population for conservation. Based on the mean and the estimated standard deviation of the coefficient for conservation, one can estimate that the 54 % (cons 25) and 53 % (cons 50) of the density of the conservation coefficients is negative. Table 7 – Mixed logit estimation Table 7.a Standard deviation of β Attribute Distribution σ Sign.
(1 year) Triang 0.00059 (10 years) Triang 0.00031 *
R-Cons25 % Normal 0.0555 *** R-Cons50 % Normal 0.0237 ***

17
Table 7.b Coefficient estimate Model number Model 5 Model type Mixed Logit Sample Full sample
One year + 10 year
n obs (choices) 2400rho² 0.1887LogLikelihood -2424.4
β Signif Total cost (euro) (1 year) -0.00030 (10 years) -0.00016 * Restoration- R-Cons25 % -0.0066 * conservation R-Cons50 % -0.0018
Port -0.96 - Production -1.19 *** M Shops -0.42 *** A Offices 0.45 *** I Housing -0.11 N Hotels and rest 0.85 *** Marinas 2.23 *** Parking -1.60 *** USES Services 0.75 *** C Port -1.03 - O Production -0.61 *** M Shops -0.17 P Offices 0.26 ** L Housing -0.06 E Hotels and rest 0.02 M Marinas 1.08 *** E Parking 0.11 N Services 0.39 *** Status quo -0.53 ***
Note : model estimation takes into account the repeated observation nature of the data (panel).
4.5 Model with use interactions
Eventually, we tested the existence of interactions among the different uses. The reason for these other estimates is both to investigate potential complementarities among uses and to check whether the existence of these complementarities may be an alternative potential reason for some deficiencies of the MNL models. In other words, other than heterogeneity, does the existence of interactions between the use explain why cost and conservation coefficients are not significant in various models that were estimated ? Table 9 provides the estimates of uses' interactions coefficients where each use interaction variable is defined as the product of two dummy variables (for instance the attribute representing the mix Port (main) + Shops (complementary) takes the value one when these two uses use are proposed in the considered

18
alternative and the value zero for other uses. The mix Shops + Production is chosen as an (arbitrary) baseline for the estimation. Table 8 Coefficient of the cost and conservation coefficients (model with uses' interaction) β Critical probability
1 year tax -0.00034 0.6410 years tax -0.00012 0.09
R-Cons25 % -0.00139 0.62R-Cons50 % -0.00025 0.85
Table 9 Coefficient of the use mixes (model with uses' interaction) Main use Compl.
Port.
Prod.
Shops
Offices
Housing
Hotels and rest
Marinas
Parking
Public Services
Port. - - 0.00 - - 0.81 * 0.29 1.17 ** 2.12 *** -1.09 0.92 ** Prod. 0.72 - - 0.96 ** 0.71 0.83 * 1.24 *** 2.40 *** -0.84 1.43 ***Shops 0.85 * 0.55 - - 1.46 *** 0.73 1.73 *** 3.16 *** -0.44 1.67 ***
Offices 0.84 * 0.25 1.03 ** - - 1.65 *** 1.96 *** 3.60 *** 0.07 2.22 ***Housing 0.38 -0.03 0.61 1.94 *** - - 2.20 *** 2.97 *** 0.12 1.71 ***
Hotels and rest
-0.04 -0.19 1.36 *** 1.73 *** 1.26 *** - - 2.89 *** 0.27 1.87 ***
Marinas 0.93 ** 1.44 *** 1.94 *** 2.63 *** 2.26 *** 2.81 *** - - 0.93 ** 2.49 ***Parking 0.47 0.63 0.92 ** 1.66 *** 1.15 ** 1.96 *** 3.09 *** - - 2.69 ***Services 0.92 * 0.01 0.91 * 2.31 *** 1.45 *** 2.90 *** 3.58 *** 0.14 - -
Legend : significant * at 10 %, ** at 5 %, *** at 1 %. Remark : the model are estimated based on a dummy codification of mix uses. For instance
the configuration where main use is Productive and secondary use is Port is coded by an attribute that takes value 1, when the proposed alternative has theses uses, and 0 in the other situations. The use mix (main use = shops and complimentary use = port) is taken as the (arbitrary) baseline.
The conclusion emerging from Table 8 and Table 9 are twofold. First, they indicate that, when interactions between uses are taken into account, the only coefficient for cost and conservation that is significant is the coefficient for the 10 years taxes, this is slightly more satisfactory than in the base model (model 3), but does not solve all the problems linked with the lack of significance of these coefficients. Second, regarding the interactions between the uses, the main pattern emerging from Table 9 is that the main uses that are significant in the other model estimates are still significant when combined with another use. Marinas still exhibit the highest coefficients, whatever complimentary use is proposed. Hotels and restaurant also rank high. This happens even in circumstances where the complementary use is disliked like, for instance, when Port and Production are proposed as complement to Marinas or Hotels and restaurant. The most appreciate use mix is Marinas + Offices, the most disliked use (with at least 10 % significance) is Office + Port. One can also note that some uses are significant only in certain combinations; this is for example for the main use as parking that is significant (at the 10 % probability) only with marinas as a complimentary use.

19
5 CONCLUSIONS
In this article we have used choice based conjoint analysis to explore the preferences of Trieste inhabitants for the future of the Old Harbour area. Thanks to a first set of questions, we found that Trieste inhabitants have a knowledge of the Old Harbour that seem sufficient to consider their preferences as meaningful. Second, when asked about the future of the port, interviewees declare to be in favour of conservation of existing buildings and pedestrian area. They also exhibit clear preferences in favour of the introduction of marinas, hotels and restaurants and public services, and against port or productive activity. These results, obtained through the use of conventional poll techniques are completed with conjoint analysis questions that are more novel in the area of urban studies. The conjoint analysis experiment confirmed preferences of the inhabitants regarding the uses. However it failed to measure a significant influence of cost and conservation on the preferences expressed by the interviewees. This observation persisted even when considering segmentations, except for a very limited number of segments (mainly cost for women, conservation for youngest and most educated interviewed). Other modelling techniques, that are more capable of dealing with preferences' heterogeneity have been implemented on our data set. Latent class models proved to be relatively inefficient to fit the data. Mixed logit, provided a better result, where one cost coefficient and one conservation coefficient proved significant. This latest model indicated the existence of considerable heterogeneity among the data. The evidence of our research on the adequacy of conjoint choice techniques to shed light on the reuse of derelict area are not fully conclusive: while preferences regarding the uses clearly appear, the effect of cost only appears in the mixed logit specification, and the preference for conservation scarcely appears.
References
Alexandros A., Shabbar J. (2005) A Choice Modelling Application for Greek Heritage Attractions, Journal of Travel Research, Vol. 43(3), 309-318.
Boter J., Rouwendal J. , Wedel M. (2004) Employing Travel Costs to Compare the Use Value of Competing Cultural Organizations, Series Research Memoranda 0011, Free University Amsterdam, Faculty of Economics Business Administration and Econometrics.

20
Boxall P. , Adamowicz W. (2002) Understanding Heterogeneous Preferences in Random Utility Models: a Latent Class Approach, Environmental and Resource Economics, Vol. 23(4) : 421- 446.
Colombo S., Hanley N. (2007) Modelling Preference Heterogeneity in Stated Choice Data for Environmental Goods: a Comparison of Random Parameter, Covariance Heterogeneity and Latent Class Logit Models, Working Paper University of Stirling.
Garrod G., Willis K. G. (2002) Northumbria - Castles, Cathedrals and Towns, in: Valuing Cultural Heritage: Applying Environmental Valuation Techniques to Historical Buildings, Monuments and Artefacts, Navrud, S. and Ready, R. C. (eds), Edward Elgar Publishing Ltd., UK.
Kemperman A.D.A.M., Timmermans H.J.P. (2006) Preferences, Benefits, and Park Visits: A Latent Class Segmentation Analysis. Tourism Analysis. Vol. 11(4) : 221-230.
Kemperman A.D.A.M., Ponjé M.M.W., Timmermans H.J.P. (2005) Analyzing Heterogeneity and Substitution in Trip-Making Propensity to Urban Parks: A Mixed Logit Model. Tourism Analysis. Vol. 10(3) : 223-232.
Morey E., Rossmann, K. G. (2003) Using Stated-Preference Questions to Investigate Variations in Willingness to Pay for Preserving Marble Monuments: Classic Heterogeneity, Random Parameters, and Mixture Models, Journal of Cultural Economics, Vol. 27(3/4) : 215-229.
Marin A. (2003) "Il Porto Vecchio di Trieste da vuoto urbano a risorsa per la città", mimeo. Pearce D., Mourato S., Navrud S., Ready R. C. (2002) Review of Existing Studies, their
Policy Use and Future Research Needs. In: Valuing Cultural Heritage: Applying Environmental Valuation Techniques to Historical Buildings, Monuments and Artefacts, Navrud, S. and Ready, R. C. (eds), Edward Elgar publishing Ltd, UK.
21
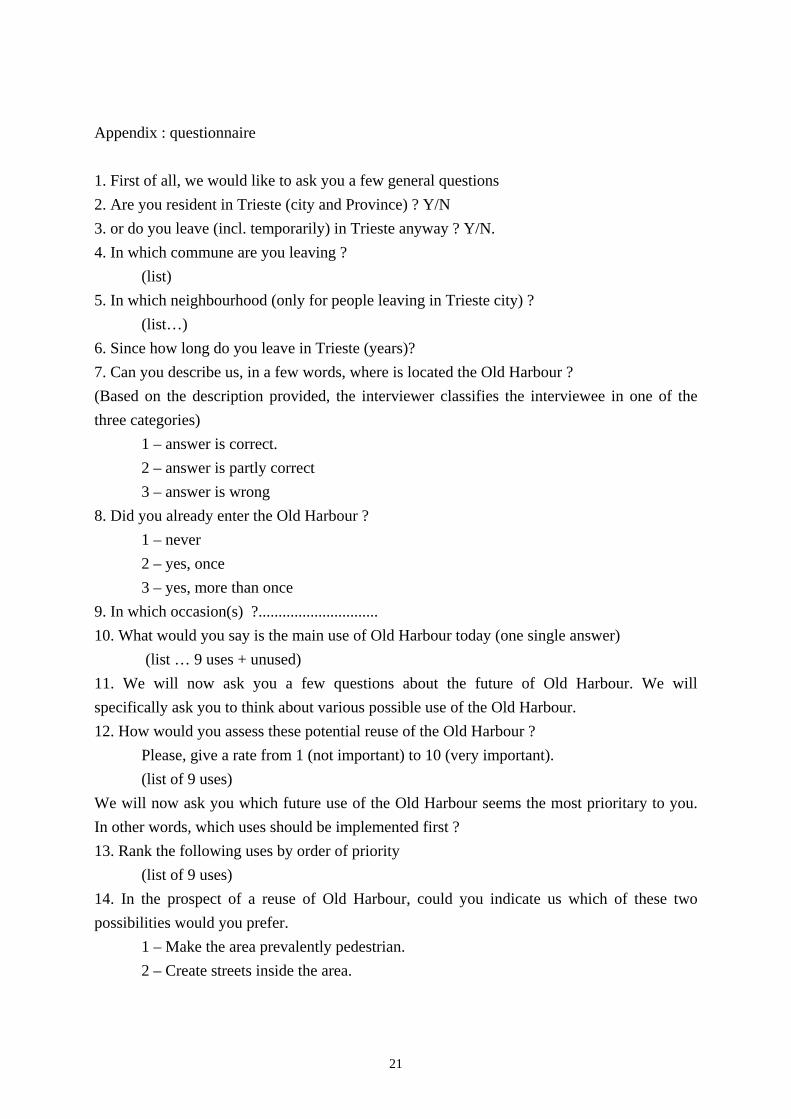
Appendix : questionnaire 1. First of all, we would like to ask you a few general questions 2. Are you resident in Trieste (city and Province) ? Y/N 3. or do you leave (incl. temporarily) in Trieste anyway ? Y/N. 4. In which commune are you leaving ?
(list) 5. In which neighbourhood (only for people leaving in Trieste city) ?
(list…) 6. Since how long do you leave in Trieste (years)? 7. Can you describe us, in a few words, where is located the Old Harbour ? (Based on the description provided, the interviewer classifies the interviewee in one of the three categories) 1 – answer is correct.
2 – answer is partly correct 3 – answer is wrong
8. Did you already enter the Old Harbour ? 1 – never 2 – yes, once 3 – yes, more than once
9. In which occasion(s) ?.............................. 10. What would you say is the main use of Old Harbour today (one single answer)
(list … 9 uses + unused) 11. We will now ask you a few questions about the future of Old Harbour. We will specifically ask you to think about various possible use of the Old Harbour. 12. How would you assess these potential reuse of the Old Harbour ?
Please, give a rate from 1 (not important) to 10 (very important). (list of 9 uses)
We will now ask you which future use of the Old Harbour seems the most prioritary to you. In other words, which uses should be implemented first ? 13. Rank the following uses by order of priority
(list of 9 uses) 14. In the prospect of a reuse of Old Harbour, could you indicate us which of these two possibilities would you prefer.
1 – Make the area prevalently pedestrian. 2 – Create streets inside the area.

22
15. In the prospect of reusing Old Harbour, how much do you think the creation of new roads for connecting Old Harbour with main road infrastructure is important ?
1 – very important 2 – quite important 3 – not very important 4 – not important at all
16. As far as existing buildings of the area are concerned, how far should they be protected ? 1 – only buildings with high heritage value (25 % of the buildings) 2 – buildings with high and intermediate heritage value (50% of the buildings) 3 – none. The whole area should be reconstructed.
CBC section : In this section, we would like to ask you about your preferences for various scenarios for the future of the Old Harbour. Three different possibilities for the reuse of Old Harbour will be presented to you. The first two are defined by a set of attributes. The third one corresponds to the current state of Old Harbour. We would ask you, each time to indicate what is your preferred alternative. 17. eight choices set are presented to the interviewees. 18. In the choice sets that we have just presented you, do you remember how was proposed to finance the reuse of Old Harbour (up to 3 answers).
1 – one year tax 2 – 10 year tax 3 – permanent tax 4 – 2 years tax 5 – none among these 4,
We now would like to make a few questions about you 19. Education
1 – University degree 2 – Secondary school diploma 3 – Primary school (final) 4 – Primary school (intermediate) 5 – No diploma
20. Are you ? 1 – self employed 2 – employee (public sector)

23
3 – employee (private sector) 4 – Retired 5 – Student 6 – looking for a job
21. What is your profession ? ……………………………………. 22. Can you indicate your age? 1 – from 18 to 24 2 – from 25 to 34 3 – from 35 to 44 4 – from 45 to 54 5 – from 55 to 64 6 - from 65 to 74 7 – over 74 23. In which interval is your income (personal, after taxes, per year, euro) ? 0 – non income 1 - < 7.500 euro
2 – from 7.500 to 10.000 3 - from 10.000 to 15.000
4 - from 15.000 to 25.000 5 – from 25.000 to 40.000
6 – from 40.000 to 75.000 7 - > 75.000 (If answer to question 23 is 0 ) 24. In which interval are the revenues of your household (after taxes, year) ? 0 – no income, 1 – < 7.500 euro
2 – from 7.500 to 10.000 3 – from 10.000 to 15.000
4 – from 15.000 to 25.000 5 – from 25.000 to 40.000
6 – from 40.000 to 75.000 7 – > 75.000 (if answer to question 23 is >0) 25. What percentage of the total household revenue does your personal revenue represent ?