WTAnalyser - Filtration v3.2
246
WTAnalyser (Filtration) Version 3.2 Developed by the Australian Water Treatment Alliance Compatible with MS Excel 2003, 2007 & 2010 Step 1.Setting up a SCADA Trend for Downloading Turbid If a filter is off line for a lengthy period the best option is to just not Step 2. Exporting the Data 1. Highlighting the column. 2. Right mouse click 3. Select Format cells 4. On the Number tab select Custom 5. Scroll down and select d/mm/yyyy h:mm 6. Click OK Step 3. Preliminary Inspection of the Data Pathogens in drinking water pose a significant hazard to public health. The establishment of appropriate barriers (preventive measures) in the water tr affords two barriers to bacteria and most viruses however only one barrier Giardia. The only barrier to these protozoans in a conventional WTP is the pr demonstrate ongoing production of safe drinking water, long term analysis o WTAnalyser (Filters) allows such long term analysis and presentation of the reporting to senior management Boards or Regulators. The WTAnalyser allows you to download and extract data from SCADA trends fo samples at short time intervals, very large amounts of data make up the tre extract a subset of the data for further analysis. The WTAnalyser package t downloaded data from the SCADA system and then takes the maximum (highest r This results in 12 data points for each 24 hours of operation. The analysis data should not be analysed, for example when the plant is off line. Set up a trend on the SCADA system with the filtered water turbidity data f period for regular downloading is two to four weeks; however it depends to systems limit the number of rows of data that can be downloaded regardless systems allow 900 rows but some may be as little as 300 rows. So if the ana rows available the interval between data points will be about 2.25 hours wh analysis. Try to choose a download interval that will give about 15 minute involve your IT staff to help you to download more rows of data. The best s you want and then download however many rows that are necessary and is only spreadsheet. If the plant runs intermittently then include on the trend page the plant i Each SCADA system will vary somewhat but all have the ability to save the d file. Consult your SCADA manual for instructions. For Citect systems there is of the screen that allows you to save the file. Once saved as a csv file, open it and save it as an excel spreadsheet. The label. Rename the columns with simple English descriptors e.g. date, time ( filter 2, raw water, settled water. In most cases very little modification is required. The only column that do datetime column. In most cases this can be done by The data in the column should now be a simple date and time format that is help from your IT staff or someone who is good with Excel. The data will be in seperate columns or as one date_time column.
description
Analyzer
Transcript of WTAnalyser - Filtration v3.2

WTAnalyser (Filtration)Version 3.2Developed by the Australian Water Treatment AllianceCompatible with MS Excel 2003, 2007 & 2010
Step 1.Setting up a SCADA Trend for Downloading Turbidity Data
If a filter is off line for a lengthy period the best option is to just not include the trend on the initial trend page.
Step 2. Exporting the Data
1. Highlighting the column.2. Right mouse click3. Select Format cells4. On the Number tab select Custom5. Scroll down and select d/mm/yyyy h:mm6. Click OK
Step 3. Preliminary Inspection of the DataBefore running the WTAnalyser package it is important to have a good look at the data file, even if it is many hundreds of rows.
Pathogens in drinking water pose a significant hazard to public health. The management of pathogens requires the establishment of appropriate barriers (preventive measures) in the water treatment process. Conventional water treatment affords two barriers to bacteria and most viruses however only one barrier to the protozoan pathogens Cryptosporidium and Giardia. The only barrier to these protozoans in a conventional WTP is the presence of well operated media filters. To demonstrate ongoing production of safe drinking water, long term analysis of filter performance is necessary. The WTAnalyser (Filters) allows such long term analysis and presentation of the data in a form that makes it suitable for reporting to senior management Boards or Regulators.
The WTAnalyser allows you to download and extract data from SCADA trends for detailed analysis. Since the trending system samples at short time intervals, very large amounts of data make up the trends for turbidity. The first step is to extract a subset of the data for further analysis. The WTAnalyser package takes an excel spreadsheet with all the downloaded data from the SCADA system and then takes the maximum (highest risk) turbidity value for each 2 hour period. This results in 12 data points for each 24 hours of operation. The analysis package can also reject data where turbidity data should not be analysed, for example when the plant is off line.
Set up a trend on the SCADA system with the filtered water turbidity data for each filter to be analysed. A suitable period for regular downloading is two to four weeks; however it depends to some extent on your exporting system. Some systems limit the number of rows of data that can be downloaded regardless of the time interval chosen. For example many systems allow 900 rows but some may be as little as 300 rows. So if the analysis period is 4 weeks and there are only 300 rows available the interval between data points will be about 2.25 hours which is really not sufficient data for good analysis. Try to choose a download interval that will give about 15 minute intervals between samples. You may need to involve your IT staff to help you to download more rows of data. The best systems allow you to select whatever interval you want and then download however many rows that are necessary and is only limited by the maximum size of an excel spreadsheet.
If the plant runs intermittently then include on the trend page the plant inflow. The package will only extract data when the plant is running.
Each SCADA system will vary somewhat but all have the ability to save the displayed trend to a data file, usually a csv file. Consult your SCADA manual for instructions. For Citect systems there is a small floppy disc icon at the bottom or top of the screen that allows you to save the file.
Once saved as a csv file, open it and save it as an excel spreadsheet. The columns of data will have a SCADA tag for a label. Rename the columns with simple English descriptors e.g. date, time (sometimes date_time), plant inflow, filter 1, filter 2, raw water, settled water.
In most cases very little modification is required. The only column that does sometimes require manipulation is the datetime column. In most cases this can be done by
The data in the column should now be a simple date and time format that is easy to recognise. If this doesn’t work seek help from your IT staff or someone who is good with Excel. The data will be processed if the date and time are presented in seperate columns or as one date_time column.
Have a look at the date and times. Are they displayed with the same time interval between rows e.g. 5 minutes, 10 minutes etc? WTAnalyser will analyse data at variable intervals but for best possible analysis the data should be evenly spaced. Quite a few SCADA systems only record data when the data starts to change, so for example you may have data sampled at 1 hour or 2 hour intervals but when a turbidity event occurs the data may be sampled at 1 minute or less intervals. This will make the data set look worse than it is. Although the analysis produced by WTAnalyser will still generally be OK, it is far better to set up the SCADA system to always sample at a set interval. The interval should be no longer than 10 minutes and preferably 1 minute intervals if the memory on the system is big enough.

Are there any gaps, where are they? (WTAnalyser can handle gaps but not in the time or date column.)
Are there any blank columns? (WTAnalyser cannot handle data with blank columns between columns with data.)
Step 4. Analyse the DataFollow the prompts in the WTAnalyser spreadsheet and generate the statistical data and have a good look at it.
Have a look at the date and times. Are they displayed with the same time interval between rows e.g. 5 minutes, 10 minutes etc? WTAnalyser will analyse data at variable intervals but for best possible analysis the data should be evenly spaced. Quite a few SCADA systems only record data when the data starts to change, so for example you may have data sampled at 1 hour or 2 hour intervals but when a turbidity event occurs the data may be sampled at 1 minute or less intervals. This will make the data set look worse than it is. Although the analysis produced by WTAnalyser will still generally be OK, it is far better to set up the SCADA system to always sample at a set interval. The interval should be no longer than 10 minutes and preferably 1 minute intervals if the memory on the system is big enough.
Are there any zeroes, where are they? (WTAnalyser can handle zeroes BUT it thinks they are real data which they may not be. Lots of zeroes in your data set will make the data look better than it really is.)

Step 1.Setting up a SCADA Trend for Downloading Turbidity Data
If a filter is off line for a lengthy period the best option is to just not include the trend on the initial trend page.
Step 2. Exporting the Data
Step 3. Preliminary Inspection of the DataBefore running the WTAnalyser package it is important to have a good look at the data file, even if it is many hundreds of rows.
Pathogens in drinking water pose a significant hazard to public health. The management of pathogens requires the establishment of appropriate barriers (preventive measures) in the water treatment process. Conventional water treatment affords two barriers to bacteria and most viruses however
. The only barrier to these protozoans in a conventional WTP is the presence of well operated media filters. To demonstrate ongoing production of safe drinking water, long term analysis of filter performance is necessary. The WTAnalyser (Filters) allows such long term analysis and presentation of the data in a form that makes it suitable for reporting to senior management
The WTAnalyser allows you to download and extract data from SCADA trends for detailed analysis. Since the trending system samples at short time intervals, very large amounts of data make up the trends for turbidity. The first step is to extract a subset of the data for further analysis. The WTAnalyser package takes an excel spreadsheet with all the downloaded data from the SCADA system and then takes the maximum (highest risk) turbidity value for each 2 hour period. This results in 12 data points for each 24 hours of operation. The analysis package can also reject data where
Set up a trend on the SCADA system with the filtered water turbidity data for each filter to be analysed. A suitable period for regular downloading is two to four weeks; however it depends to some extent on your exporting system. Some systems limit the number of rows of data that can be downloaded regardless of the time interval chosen. For example many systems allow 900 rows but some may be as little as 300 rows. So if the analysis period is 4 weeks and there are only 300 rows available the interval between data points will be about 2.25 hours which is really not sufficient data for good analysis. Try to choose a download interval that will give about 15 minute intervals between samples. You may need to involve your IT staff to help you to download more rows of data. The best systems allow you to select whatever interval you want and then download however many rows that are
If the plant runs intermittently then include on the trend page the plant inflow. The package will only extract data when the plant is running.
Each SCADA system will vary somewhat but all have the ability to save the displayed trend to a data file, usually a csv file. Consult your SCADA manual systems there is a small floppy disc icon at the bottom or top of the screen that allows you to save the file.
Once saved as a csv file, open it and save it as an excel spreadsheet. The columns of data will have a SCADA tag for a label. Rename the columns with simple English descriptors e.g. date, time (sometimes date_time), plant inflow, filter 1, filter 2, raw water, settled water.
In most cases very little modification is required. The only column that does sometimes require manipulation is the datetime column. In most cases this
The data in the column should now be a simple date and time format that is easy to recognise. If this doesn’t work seek help from your IT staff or someone who is good with Excel. The data will be processed if the date and time are presented in seperate columns or as one date_time column.
Have a look at the date and times. Are they displayed with the same time interval between rows e.g. 5 minutes, 10 minutes etc? WTAnalyser will analyse data at variable intervals but for best possible analysis the data should be evenly spaced. Quite a few SCADA systems only record data when the data starts to change, so for example you may have data sampled at 1 hour or 2 hour intervals but when a turbidity event occurs the data may be sampled at 1 minute or less intervals. This will make the data set look worse than it is. Although the analysis produced by WTAnalyser will still generally be OK, it is far better to set up the SCADA system to always sample at a set interval. The interval should be no longer than 10 minutes and preferably 1

Are there any gaps, where are they? (WTAnalyser can handle gaps but not in the time or date column.)
Are there any blank columns? (WTAnalyser cannot handle data with blank columns between columns with data.)
Step 4. Analyse the DataFollow the prompts in the WTAnalyser spreadsheet and generate the statistical data and have a good look at it.
Have a look at the date and times. Are they displayed with the same time interval between rows e.g. 5 minutes, 10 minutes etc? WTAnalyser will analyse data at variable intervals but for best possible analysis the data should be evenly spaced. Quite a few SCADA systems only record data when the data starts to change, so for example you may have data sampled at 1 hour or 2 hour intervals but when a turbidity event occurs the data may be sampled at 1 minute or less intervals. This will make the data set look worse than it is. Although the analysis produced by WTAnalyser will still generally be OK, it is far better to set up the SCADA system to always sample at a set interval. The interval should be no longer than 10 minutes and preferably 1
Are there any zeroes, where are they? (WTAnalyser can handle zeroes BUT it thinks they are real data which they may not be. Lots of zeroes in your
Go to Menu page to start analysing data.

WTAnalyser (Filtration)Version 3.2Developed by the Australian Water Treatment AllianceCompatible with MS Excel 2003, 2007 & 2010
Operating Guide
The tool uses plant flow to identify when the plant was in service (if plant flow is not available the tool will assume that the plant is always in service).
The tool can handle empty cells except in the time/date columns; it can handle missing hours or days in the data, but not blank time/date cells.
Please ensure there are no empty columns between columns of data in the data set; there can be empty columns at the end of the data set.
There are three steps to follow when using the tool:
Step 1 - Enter/Edit Plant Information
Set the start date for your dataset.Enter the plant maximum flow. This will be used to calculate the plant off flow (5% of maximum).
Step 2 - Get Data
Step 3 - View Results
Follow on-screen prompts to manipulate graphs.Graphs can easily be exported to Word document.
Click on Buttons to start
This tool has been developed to assist you in analysing the performance of filters at your plant. It extracts data from other MS Excel or csv files. Once data is selected it is automatically processed into a graphical and statistical format that will tell you how your filters are performing.
You can use any time interval in your data up to two hours (e.g. 1 minute, 10 mins, 30 mins, 1 hour, 2 hours). The tool will select the maximum turbidity value in every 2 hour period for each filter.
The tool can analyse up to a maximum of 12 months of data. Data can be added in weekly or monthly intervals to build up a 12 month dataset. The maximum number of rows the tool can process in one go is 26,500 (this is equivalent to 6 months of data at 10 minute intervals).
Enter plant information in the user form (click Button 1 below). This information will be used to create a new file. The file will be labelled with your utility and plant name and the date of the first line of data in your dataset.
If you want to combine two data sets, open up the version of the tool saved with the first dataset in it. Press Button 1 and check the merge data box (don't change the start date). Press Button 2 and select new data. Note: Data must be in exactly the same format as the original file i.e. all columns must be entered in the same order and the date/time format must be the same.
Click on Button 2 (below) and the tool will look for any open excel workbooks. Follow the on-screen prompts to select the right data.
The tool will work with all date/time stamp formats that are recognised by Excel. If your format is not recognised ask you IT department to help. You can use a single column with both date and time included or separate date/time columns.
You can also load up other data such as inlet turbidity or clarified water turbidity to help diagnose problems.
The results are displayed in a number of ways to help you identify filter issues. Click on the sheet tabs to view.
(1) Enter Plant Info (2) Get Data
Example Data Set
XYZ Performance SummaryPeriod: 1-Jan-11 Until: 31-Jan-11Selection:
0% 10% 20% 30% 40% 50% 60% 70% 80% 90% 100%
0
0.5
1
1.5
2
2.5
Filte r 1 - Cumula tiv e fre q ue n c y d is tribu tion of wa te r tu rb id ity
Cumulative Frequency Distribution
Tu
rbid
ity
(N
TU
)
0
0.02
0.04
0.06
0.08
0.1
0.12F ilte r 1 - Wa te r tu rb id ity time s e rie s
Da
ily
Ma
xim
um
Tu
rbid
ity
(N
TU
)
0.00 -
0.05
0.05 -
0.10
0.10 -
0.15
0.15 -
0.20
0.20 -
0.25
0.25 -
0.30
0.30 -
0.35
0.35 -
0.40
0.40 -
0.45
0.45 -
0.50
0.50 -
0.60
0.60 -
0.70
0.70 -
0.80
0.80 -
0.90
0.90 -
1.00
1.00 -
1.50
1.50 -
2.00
0%
20%
40%
60%
80%
100%
Filte r 1 - Wa te r turb id ity h is togra m
Turbidity Histogram
Pe
rce
nta
ge
(%
)
XYZ Performance SummaryPeriod: 1-Jul-09 Until: 31-Jul-09Selection:
0
0.02
0.04
0.06
0.08
0.1
0.12
Da
ily
Ma
xim
um
Tu
rbid
ity
(N
TU
)
0% 10% 20% 30% 40% 50% 60% 70% 80% 90% 100%
0
0.5
1
1.5
2
2.5
Cumulative Frequency Distribution
Tu
rbid
ity
(N
TU
)
0.00 -
0.05
0.05 -
0.10
0.10 -
0.15
0.15 -
0.20
0.20 -
0.25
0.25 -
0.30
0.30 -
0.35
0.35 -
0.40
0.40 -
0.45
0.45 -
0.50
0.50 -
0.60
0.60 -
0.70
0.70 -
0.80
0.80 -
0.90
0.90 -
1.00
1.00 -
1.50
1.50 -
2.00
0%
20%
40%
60%
80%
100%
Turbidity Histogram
Pe
rce
nta
ge
(%
)

0.00 -
0.05
0.05 -
0.10
0.10 -
0.15
0.15 -
0.20
0.20 -
0.25
0.25 -
0.30
0.30 -
0.35
0.35 -
0.40
0.40 -
0.45
0.45 -
0.50
0.50 -
0.60
0.60 -
0.70
0.70 -
0.80
0.80 -
0.90
0.90 -
1.00
1.00 -
1.50
1.50 -
2.00
0%
20%
40%
60%
80%
100%
Turbidity Histogram
Pe
rce
nta
ge
(%
)
XYZ Performance SummaryPeriod: 1-Jul-09 Until: 31-Jul-09Selection:
0
0.02
0.04
0.06
0.08
0.1
0.12
Da
ily
Ma
xim
um
Tu
rbid
ity
(N
TU
)
0% 10% 20% 30% 40% 50% 60% 70% 80% 90% 100%
0
0.5
1
1.5
2
2.5
Cumulative Frequency Distribution
Tu
rbid
ity
(N
TU
)
0.00 -
0.05
0.05 -
0.10
0.10 -
0.15
0.15 -
0.20
0.20 -
0.25
0.25 -
0.30
0.30 -
0.35
0.35 -
0.40
0.40 -
0.45
0.45 -
0.50
0.50 -
0.60
0.60 -
0.70
0.70 -
0.80
0.80 -
0.90
0.90 -
1.00
1.00 -
1.50
1.50 -
2.00
0%
20%
40%
60%
80%
100%
Turbidity Histogram
Pe
rce
nta
ge
(%
)
0
0.02
0.04
0.06
0.08
0.1
0.12
Da
ily
Ma
xim
um
Tu
rbid
ity
(N
TU
)
0% 10% 20% 30% 40% 50% 60% 70% 80% 90% 100%
0
0.5
1
1.5
2
2.5
Cumulative Frequency Distribution
Tu
rbid
ity
(N
TU
)
0.00 -
0.05
0.05 -
0.10
0.10 -
0.15
0.15 -
0.20
0.20 -
0.25
0.25 -
0.30
0.30 -
0.35
0.35 -
0.40
0.40 -
0.45
0.45 -
0.50
0.50 -
0.60
0.60 -
0.70
0.70 -
0.80
0.80 -
0.90
0.90 -
1.00
1.00 -
1.50
1.50 -
2.00
0%
20%
40%
60%
80%
100%
Turbidity Histogram
Pe
rce
nta
ge
(%
)

0.00 -
0.05
0.05 -
0.10
0.10 -
0.15
0.15 -
0.20
0.20 -
0.25
0.25 -
0.30
0.30 -
0.35
0.35 -
0.40
0.40 -
0.45
0.45 -
0.50
0.50 -
0.60
0.60 -
0.70
0.70 -
0.80
0.80 -
0.90
0.90 -
1.00
1.00 -
1.50
1.50 -
2.00
0%
20%
40%
60%
80%
100%
Turbidity Histogram
Pe
rce
nta
ge
(%
)
0.00 -
0.05
0.05 -
0.10
0.10 -
0.15
0.15 -
0.20
0.20 -
0.25
0.25 -
0.30
0.30 -
0.35
0.35 -
0.40
0.40 -
0.45
0.45 -
0.50
0.50 -
0.60
0.60 -
0.70
0.70 -
0.80
0.80 -
0.90
0.90 -
1.00
1.00 -
1.50
1.50 -
2.00
0%
20%
40%
60%
80%
100%
Turbidity Histogram
Pe
rce
nta
ge
(%
)

XYZ Performance SummaryPeriod: 1-Jul-09 Until: 31-Jul-09Selection:
0
0.02
0.04
0.06
0.08
0.1
0.12
Da
ily
Ma
xim
um
Tu
rbid
ity
(N
TU
)
0.00 -
0.05
0.05 -
0.10
0.10 -
0.15
0.15 -
0.20
0.20 -
0.25
0.25 -
0.30
0.30 -
0.35
0.35 -
0.40
0.40 -
0.45
0.45 -
0.50
0.50 -
0.60
0.60 -
0.70
0.70 -
0.80
0.80 -
0.90
0.90 -
1.00
1.00 -
1.50
1.50 -
2.00
0%
20%
40%
60%
80%
100%
Turbidity Histogram
Pe
rce
nta
ge
(%
)
0
0.02
0.04
0.06
0.08
0.1
0.12
Da
ily
Ma
xim
um
Tu
rbid
ity
(N
TU
)
0% 10% 20% 30% 40% 50% 60% 70% 80% 90% 100%
0
0.5
1
1.5
2
2.5
Cumulative Frequency Distribution
Tu
rbid
ity
(N
TU
)
0.00 -
0.05
0.05 -
0.10
0.10 -
0.15
0.15 -
0.20
0.20 -
0.25
0.25 -
0.30
0.30 -
0.35
0.35 -
0.40
0.40 -
0.45
0.45 -
0.50
0.50 -
0.60
0.60 -
0.70
0.70 -
0.80
0.80 -
0.90
0.90 -
1.00
1.00 -
1.50
1.50 -
2.00
0%
20%
40%
60%
80%
100%
Turbidity Histogram
Pe
rce
nta
ge
(%
)

0.00 -
0.05
0.05 -
0.10
0.10 -
0.15
0.15 -
0.20
0.20 -
0.25
0.25 -
0.30
0.30 -
0.35
0.35 -
0.40
0.40 -
0.45
0.45 -
0.50
0.50 -
0.60
0.60 -
0.70
0.70 -
0.80
0.80 -
0.90
0.90 -
1.00
1.00 -
1.50
1.50 -
2.00
0%
20%
40%
60%
80%
100%
Turbidity Histogram
Pe
rce
nta
ge
(%
)
0.00 -
0.05
0.05 -
0.10
0.10 -
0.15
0.15 -
0.20
0.20 -
0.25
0.25 -
0.30
0.30 -
0.35
0.35 -
0.40
0.40 -
0.45
0.45 -
0.50
0.50 -
0.60
0.60 -
0.70
0.70 -
0.80
0.80 -
0.90
0.90 -
1.00
1.00 -
1.50
1.50 -
2.00
0%
20%
40%
60%
80%
100%
Turbidity Histogram
Pe
rce
nta
ge
(%
)

XYZ Performance SummaryPeriod: 1-Jul-09 Until: 31-Jul-09Selection:
0
0.02
0.04
0.06
0.08
0.1
0.12
Da
ily
Ma
xim
um
Tu
rbid
ity
(N
TU
)
0% 10% 20% 30% 40% 50% 60% 70% 80% 90% 100%
0
0.5
1
1.5
2
2.5
Cumulative Frequency Distribution
Tu
rbid
ity
(N
TU
)
0.00 -
0.05
0.05 -
0.10
0.10 -
0.15
0.15 -
0.20
0.20 -
0.25
0.25 -
0.30
0.30 -
0.35
0.35 -
0.40
0.40 -
0.45
0.45 -
0.50
0.50 -
0.60
0.60 -
0.70
0.70 -
0.80
0.80 -
0.90
0.90 -
1.00
1.00 -
1.50
1.50 -
2.00
0%
20%
40%
60%
80%
100%
Turbidity Histogram
Pe
rce
nta
ge
(%
)
0
0.02
0.04
0.06
0.08
0.1
0.12
Da
ily
Ma
xim
um
Tu
rbid
ity
(N
TU
)
0% 10% 20% 30% 40% 50% 60% 70% 80% 90% 100%
0
0.5
1
1.5
2
2.5
Cumulative Frequency Distribution
Tu
rbid
ity
(N
TU
)
0.00 -
0.05
0.05 -
0.10
0.10 -
0.15
0.15 -
0.20
0.20 -
0.25
0.25 -
0.30
0.30 -
0.35
0.35 -
0.40
0.40 -
0.45
0.45 -
0.50
0.50 -
0.60
0.60 -
0.70
0.70 -
0.80
0.80 -
0.90
0.90 -
1.00
1.00 -
1.50
1.50 -
2.00
0%
20%
40%
60%
80%
100%
Turbidity Histogram
Pe
rce
nta
ge
(%
)

0.00 -
0.05
0.05 -
0.10
0.10 -
0.15
0.15 -
0.20
0.20 -
0.25
0.25 -
0.30
0.30 -
0.35
0.35 -
0.40
0.40 -
0.45
0.45 -
0.50
0.50 -
0.60
0.60 -
0.70
0.70 -
0.80
0.80 -
0.90
0.90 -
1.00
1.00 -
1.50
1.50 -
2.00
0%
20%
40%
60%
80%
100%
Turbidity Histogram
Pe
rce
nta
ge
(%
)
0.00 -
0.05
0.05 -
0.10
0.10 -
0.15
0.15 -
0.20
0.20 -
0.25
0.25 -
0.30
0.30 -
0.35
0.35 -
0.40
0.40 -
0.45
0.45 -
0.50
0.50 -
0.60
0.60 -
0.70
0.70 -
0.80
0.80 -
0.90
0.90 -
1.00
1.00 -
1.50
1.50 -
2.00
0%
20%
40%
60%
80%
100%
Turbidity Histogram
Pe
rce
nta
ge
(%
)

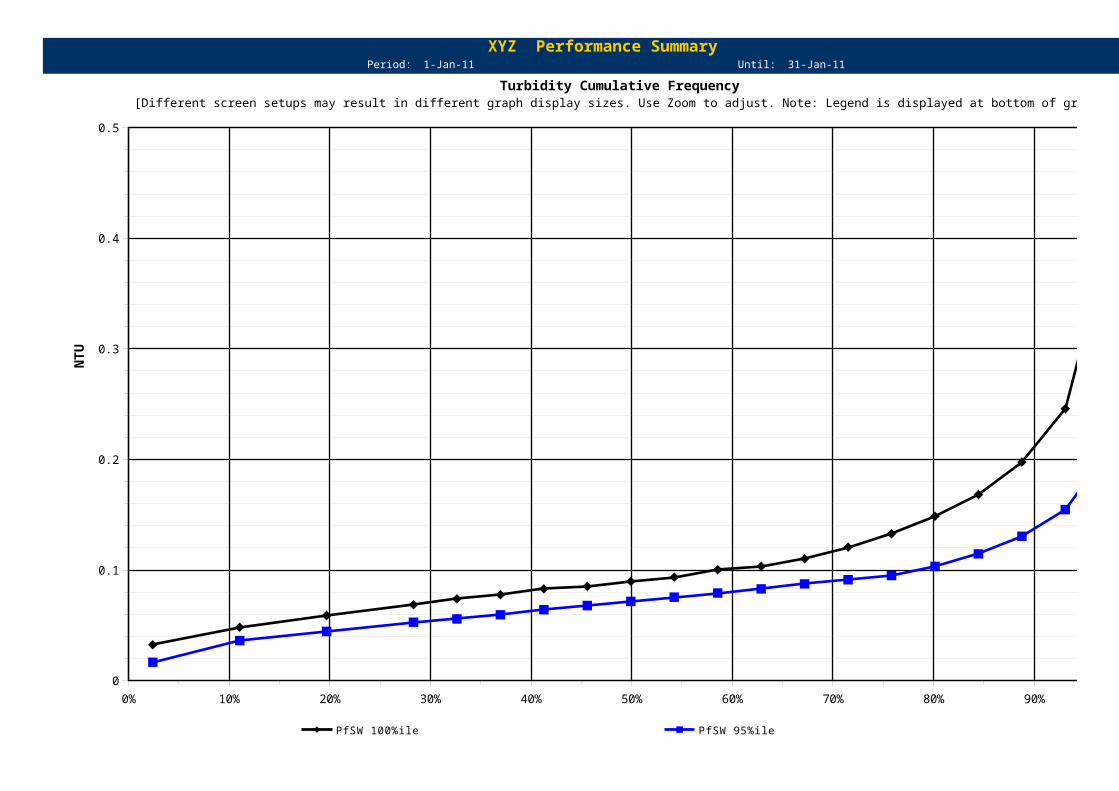
XYZ Performance SummaryPeriod: 1-Jan-11 Until: 31-Jan-11
0% 10% 20% 30% 40% 50% 60% 70% 80% 90% 100%0
0.1
0.2
0.3
0.4
0.5
PfSW 100%ile PfSW 95%ile
NT
UTurbidity Cumulative Frequency
[Different screen setups may result in different graph display sizes. Use Zoom to adjust. Note: Legend is displayed at bottom of graph.]

0% 10% 20% 30% 40% 50% 60% 70% 80% 90% 100%0
0.1
0.2
0.3
0.4
0.5
PfSW 100%ile PfSW 95%ile
NT
U

XYZ Performance SummaryPeriod: 1-Jan-11 Until: 31-Jan-11
0
0.5
1
1.5
2
2.5
Filter 1
NT
U
Turbidity Time Series [Different screen setups may result in different graph display sizes. Use Zoom to adjust. Note: Legend is displayed at bottom of graph.]

0
0.5
1
1.5
2
2.5
Filter 1
NT
U
Turbidity Time Series [Different screen setups may result in different graph display sizes. Use Zoom to adjust. Note: Legend is displayed at bottom of graph.]
XYZ Performance SummaryPeriod: 1-Jan-11 Until: 31-Jan-11
0 0 0 0 0 0 0 0 0 0 0 0 0 0 0 0
0
0.1
0.2
0.3
0.4
0.5
Turbidity Box Plot [Box is 25 and 75%iles, Bars are 5 and 95%iles. 95%ile means that 95% of all the turbidity readings are lower than this value.]
NT
U

0 0 0 0 0 0 0 0 0 0 0 0 0 0 0 0
0
0.1
0.2
0.3
0.4
0.5
Turbidity Box Plot [Box is 25 and 75%iles, Bars are 5 and 95%iles. 95%ile means that 95% of all the turbidity readings are lower than this value.]
NT
U

XYZ Filter PerformancePeriod: 1-Jan-11 Until: 31-Jan-11
Percentage of Values
Filter < 0.1 < 0.15 < 0.2 < 0.3 < 0.4 < 0.50 0% 0% 0% 0% 0% 0%0 0% 0% 0% 0% 0% 0%0 0% 0% 0% 0% 0% 0%0 0% 0% 0% 0% 0% 0%0 0% 0% 0% 0% 0% 0%0 0% 0% 0% 0% 0% 0%0 0% 0% 0% 0% 0% 0%0 0% 0% 0% 0% 0% 0%0 0% 0% 0% 0% 0% 0%0 0% 0% 0% 0% 0% 0%0 0% 0% 0% 0% 0% 0%0 0% 0% 0% 0% 0% 0%0 0% 0% 0% 0% 0% 0%0 0% 0% 0% 0% 0% 0%0 0% 0% 0% 0% 0% 0%0 0% 0% 0% 0% 0% 0%
Number of Values in Range
Filter 0 - 0.1 0.1 - 0.2 0.2 - 0.3 0.3 - 0.4 0.4 - 0.5 > 0.50 0 0 0 0 00 0 0 0 0 00 0 0 0 0 00 0 0 0 0 00 0 0 0 0 00 0 0 0 0 00 0 0 0 0 00 0 0 0 0 00 0 0 0 0 00 0 0 0 0 00 0 0 0 0 00 0 0 0 0 00 0 0 0 0 00 0 0 0 0 00 0 0 0 0 00 0 0 0 0 0

Return to Menu

WTAnalyser (Filtration)Version 3.2
Developed by the Australian Water Treatment Alliance
Compatible with MS Excel 2003, 2007 & 2010
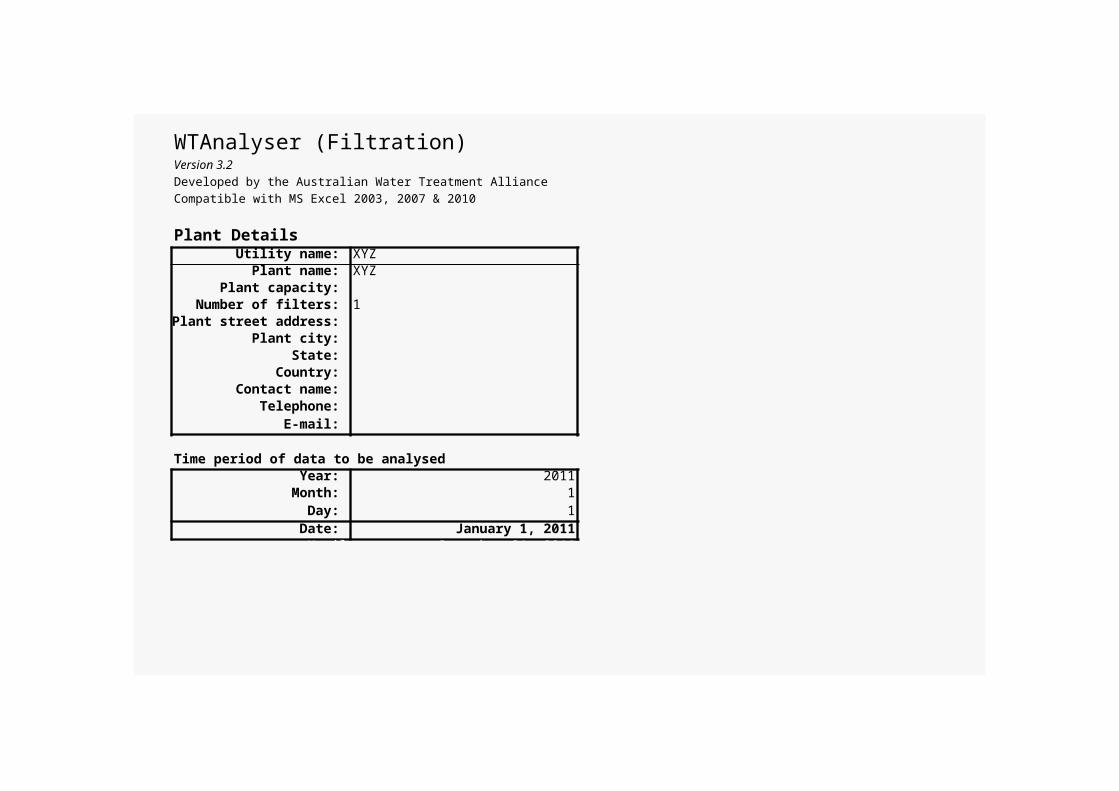
Plant Details 1 Basic Plant Data Tick BoxesUtility name: XYZ Simple Coagulant Injection: 0Plant name: XYZ Inline Mixer: 0
Plant capacity: Mechanical Mixer: 0Number of filters: 1 Sedimentation Tank: 0
Plant street address: Tube Settlers: 0Plant city: Lamella Plates: 0
State: UpfFlow Clarifier: 0Country: DAF: 0
Contact name: Mono Media Sand: 0Telephone: Dual Media: 0
E-mail: Merge Data: 0
Time period of data to be analysedYear: 2011
Month: 1Day: 1
Date: January 1, 2011Until December 31, 2011
2 Hour

WTAnalyser (Filtration)Version 3.2
Developed by the Australian Water Treatment Alliance
Compatible with MS Excel 2003, 2007 & 2010
Data for plant XYZ
- Turbidity data (NTU)0:00-2:00 2:00-4:00 4:00-6:00 6:00-8:00 8:00-10:00 10:00-12:00
1/1/20111/2/20111/3/20111/4/20111/5/20111/6/20111/7/20111/8/20111/9/2011
1/10/20111/11/20111/12/20111/13/20111/14/20111/15/20111/16/20111/17/20111/18/20111/19/20111/20/20111/21/20111/22/20111/23/20111/24/20111/25/20111/26/20111/27/20111/28/20111/29/20111/30/20111/31/2011
2/1/20112/2/20112/3/20112/4/20112/5/20112/6/20112/7/20112/8/20112/9/2011
2/10/20112/11/20112/12/20112/13/20112/14/20112/15/20112/16/20112/17/20112/18/20112/19/2011

2/20/20112/21/20112/22/20112/23/20112/24/20112/25/20112/26/20112/27/20112/28/2011
3/1/20113/2/20113/3/20113/4/20113/5/20113/6/20113/7/20113/8/20113/9/2011
3/10/20113/11/20113/12/20113/13/20113/14/20113/15/20113/16/20113/17/20113/18/20113/19/20113/20/20113/21/20113/22/20113/23/20113/24/20113/25/20113/26/20113/27/20113/28/20113/29/20113/30/20113/31/2011
4/1/20114/2/20114/3/20114/4/20114/5/20114/6/20114/7/20114/8/20114/9/2011
4/10/20114/11/20114/12/20114/13/20114/14/20114/15/20114/16/20114/17/20114/18/20114/19/20114/20/20114/21/20114/22/2011

4/23/20114/24/20114/25/20114/26/20114/27/20114/28/20114/29/20114/30/2011
5/1/20115/2/20115/3/20115/4/20115/5/20115/6/20115/7/20115/8/20115/9/2011
5/10/20115/11/20115/12/20115/13/20115/14/20115/15/20115/16/20115/17/20115/18/20115/19/20115/20/20115/21/20115/22/20115/23/20115/24/20115/25/20115/26/20115/27/20115/28/20115/29/20115/30/20115/31/2011
6/1/20116/2/20116/3/20116/4/20116/5/20116/6/20116/7/20116/8/20116/9/2011
6/10/20116/11/20116/12/20116/13/20116/14/20116/15/20116/16/20116/17/20116/18/20116/19/20116/20/20116/21/20116/22/20116/23/2011

6/24/20116/25/20116/26/20116/27/20116/28/20116/29/20116/30/2011
7/1/20117/2/20117/3/20117/4/20117/5/20117/6/20117/7/20117/8/20117/9/2011
7/10/20117/11/20117/12/20117/13/20117/14/20117/15/20117/16/20117/17/20117/18/20117/19/20117/20/20117/21/20117/22/20117/23/20117/24/20117/25/20117/26/20117/27/20117/28/20117/29/20117/30/20117/31/2011
8/1/20118/2/20118/3/20118/4/20118/5/20118/6/20118/7/20118/8/20118/9/2011
8/10/20118/11/20118/12/20118/13/20118/14/20118/15/20118/16/20118/17/20118/18/20118/19/20118/20/20118/21/20118/22/20118/23/20118/24/2011

8/25/20118/26/20118/27/20118/28/20118/29/20118/30/20118/31/2011
9/1/20119/2/20119/3/20119/4/20119/5/20119/6/20119/7/20119/8/20119/9/2011
9/10/20119/11/20119/12/20119/13/20119/14/20119/15/20119/16/20119/17/20119/18/20119/19/20119/20/20119/21/20119/22/20119/23/20119/24/20119/25/20119/26/20119/27/20119/28/20119/29/20119/30/201110/1/201110/2/201110/3/201110/4/201110/5/201110/6/201110/7/201110/8/201110/9/2011
10/10/201110/11/201110/12/201110/13/201110/14/201110/15/201110/16/201110/17/201110/18/201110/19/201110/20/201110/21/201110/22/201110/23/201110/24/201110/25/2011

10/26/201110/27/201110/28/201110/29/201110/30/201110/31/2011
11/1/201111/2/201111/3/201111/4/201111/5/201111/6/201111/7/201111/8/201111/9/2011
11/10/201111/11/201111/12/201111/13/201111/14/201111/15/201111/16/201111/17/201111/18/201111/19/201111/20/201111/21/201111/22/201111/23/201111/24/201111/25/201111/26/201111/27/201111/28/201111/29/201111/30/2011
12/1/201112/2/201112/3/201112/4/201112/5/201112/6/201112/7/201112/8/201112/9/2011
12/10/201112/11/201112/12/201112/13/201112/14/201112/15/201112/16/201112/17/201112/18/201112/19/201112/20/201112/21/201112/22/201112/23/201112/24/201112/25/201112/26/2011

12/27/201112/28/201112/29/201112/30/201112/31/2011
1/1/20121/2/2012

- Turbidity data (NTU)12:00-14:00 14:00-16:00 16:00-18:00 18:00-20:00 20:00-22:00 22:00-24:00 Daily Max
0.0000.0000.0000.0000.0000.0000.0000.0000.0000.0000.0000.0000.0000.0000.0000.0000.0000.0000.0000.0000.0000.0000.0000.0000.0000.0000.0000.0000.0000.0000.0000.0000.0000.0000.0000.0000.0000.0000.0000.0000.0000.0000.0000.0000.0000.0000.0000.0000.0000.000

0.0000.0000.0000.0000.0000.0000.0000.0000.0000.0000.0000.0000.0000.0000.0000.0000.0000.0000.0000.0000.0000.0000.0000.0000.0000.0000.0000.0000.0000.0000.0000.0000.0000.0000.0000.0000.0000.0000.0000.0000.0000.0000.0000.0000.0000.0000.0000.0000.0000.0000.0000.0000.0000.0000.0000.0000.0000.0000.0000.0000.0000.000

0.0000.0000.0000.0000.0000.0000.0000.0000.0000.0000.0000.0000.0000.0000.0000.0000.0000.0000.0000.0000.0000.0000.0000.0000.0000.0000.0000.0000.0000.0000.0000.0000.0000.0000.0000.0000.0000.0000.0000.0000.0000.0000.0000.0000.0000.0000.0000.0000.0000.0000.0000.0000.0000.0000.0000.0000.0000.0000.0000.0000.0000.000
0.0000.0000.0000.0000.0000.0000.0000.0000.0000.0000.0000.0000.0000.0000.0000.0000.0000.0000.0000.0000.0000.0000.0000.0000.0000.0000.0000.0000.0000.0000.0000.0000.0000.0000.0000.0000.0000.0000.0000.0000.0000.0000.0000.0000.0000.0000.0000.0000.0000.0000.0000.0000.0000.0000.0000.0000.0000.0000.0000.0000.0000.000

0.0000.0000.0000.0000.0000.0000.0000.0000.0000.0000.0000.0000.0000.0000.0000.0000.0000.0000.0000.0000.0000.0000.0000.0000.0000.0000.0000.0000.0000.0000.0000.0000.0000.0000.0000.0000.0000.0000.0000.0000.0000.0000.0000.0000.0000.0000.0000.0000.0000.0000.0000.0000.0000.0000.0000.0000.0000.0000.0000.0000.0000.000

0.0000.0000.0000.0000.0000.0000.0000.0000.0000.0000.0000.0000.0000.0000.0000.0000.0000.0000.0000.0000.0000.0000.0000.0000.0000.0000.0000.0000.0000.0000.0000.0000.0000.0000.0000.0000.0000.0000.0000.0000.0000.0000.0000.0000.0000.0000.0000.0000.0000.0000.0000.0000.0000.0000.0000.0000.0000.0000.0000.0000.0000.000

0.0000.0000.0000.0000.0000.0000.000
- Turbidity data (NTU)0:00-2:00 2:00-4:00 4:00-6:00 6:00-8:00 8:00-10:00 10:00-12:00
- Turbidity data (NTU)12:00-14:00 14:00-16:00 16:00-18:00 18:00-20:00 20:00-22:00 22:00-24:00 Daily Max
0.0000.0000.0000.0000.0000.0000.0000.0000.0000.0000.0000.0000.0000.0000.0000.0000.0000.0000.0000.0000.0000.0000.0000.0000.0000.0000.0000.0000.0000.0000.0000.0000.0000.0000.0000.0000.0000.0000.0000.0000.0000.0000.0000.0000.0000.0000.0000.0000.0000.000

0.0000.0000.0000.0000.0000.0000.0000.0000.0000.0000.0000.0000.0000.0000.0000.0000.0000.0000.0000.0000.0000.0000.0000.0000.0000.0000.0000.0000.0000.0000.0000.0000.0000.0000.0000.0000.0000.0000.0000.0000.0000.0000.0000.0000.0000.0000.0000.0000.0000.0000.0000.0000.0000.0000.0000.0000.0000.0000.0000.0000.0000.000

0.0000.0000.0000.0000.0000.0000.0000.0000.0000.0000.0000.0000.0000.0000.0000.0000.0000.0000.0000.0000.0000.0000.0000.0000.0000.0000.0000.0000.0000.0000.0000.0000.0000.0000.0000.0000.0000.0000.0000.0000.0000.0000.0000.0000.0000.0000.0000.0000.0000.0000.0000.0000.0000.0000.0000.0000.0000.0000.0000.0000.0000.000

0.0000.0000.0000.0000.0000.0000.0000.0000.0000.0000.0000.0000.0000.0000.0000.0000.0000.0000.0000.0000.0000.0000.0000.0000.0000.0000.0000.0000.0000.0000.0000.0000.0000.0000.0000.0000.0000.0000.0000.0000.0000.0000.0000.0000.0000.0000.0000.0000.0000.0000.0000.0000.0000.0000.0000.0000.0000.0000.0000.0000.0000.000

0.0000.0000.0000.0000.0000.0000.0000.0000.0000.0000.0000.0000.0000.0000.0000.0000.0000.0000.0000.0000.0000.0000.0000.0000.0000.0000.0000.0000.0000.0000.0000.0000.0000.0000.0000.0000.0000.0000.0000.0000.0000.0000.0000.0000.0000.0000.0000.0000.0000.0000.0000.0000.0000.0000.0000.0000.0000.0000.0000.0000.0000.000

0.0000.0000.0000.0000.0000.0000.0000.0000.0000.0000.0000.0000.0000.0000.0000.0000.0000.0000.0000.0000.0000.0000.0000.0000.0000.0000.0000.0000.0000.0000.0000.0000.0000.0000.0000.0000.0000.0000.0000.0000.0000.0000.0000.0000.0000.0000.0000.0000.0000.0000.0000.0000.0000.0000.0000.0000.0000.0000.0000.0000.0000.000

0.0000.0000.0000.0000.0000.0000.000

- Turbidity data (NTU)0:00-2:00 2:00-4:00 4:00-6:00 6:00-8:00 8:00-10:00 10:00-12:00


- Turbidity data (NTU)12:00-14:00 14:00-16:00 16:00-18:00 18:00-20:00 20:00-22:00 22:00-24:00 Daily max
0.0000.0000.0000.0000.0000.0000.0000.0000.0000.0000.0000.0000.0000.0000.0000.0000.0000.0000.0000.0000.0000.0000.0000.0000.0000.0000.0000.0000.0000.0000.0000.0000.0000.0000.0000.0000.0000.0000.0000.0000.0000.0000.0000.0000.0000.0000.0000.0000.0000.000

0.0000.0000.0000.0000.0000.0000.0000.0000.0000.0000.0000.0000.0000.0000.0000.0000.0000.0000.0000.0000.0000.0000.0000.0000.0000.0000.0000.0000.0000.0000.0000.0000.0000.0000.0000.0000.0000.0000.0000.0000.0000.0000.0000.0000.0000.0000.0000.0000.0000.0000.0000.0000.0000.0000.0000.0000.0000.0000.0000.0000.0000.000
0.0000.0000.0000.0000.0000.0000.0000.0000.0000.0000.0000.0000.0000.0000.0000.0000.0000.0000.0000.0000.0000.0000.0000.0000.0000.0000.0000.0000.0000.0000.0000.0000.0000.0000.0000.0000.0000.0000.0000.0000.0000.0000.0000.0000.0000.0000.0000.0000.0000.0000.0000.0000.0000.0000.0000.0000.0000.0000.0000.0000.0000.000

0.0000.0000.0000.0000.0000.0000.0000.0000.0000.0000.0000.0000.0000.0000.0000.0000.0000.0000.0000.0000.0000.0000.0000.0000.0000.0000.0000.0000.0000.0000.0000.0000.0000.0000.0000.0000.0000.0000.0000.0000.0000.0000.0000.0000.0000.0000.0000.0000.0000.0000.0000.0000.0000.0000.0000.0000.0000.0000.0000.0000.0000.000

0.0000.0000.0000.0000.0000.0000.0000.0000.0000.0000.0000.0000.0000.0000.0000.0000.0000.0000.0000.0000.0000.0000.0000.0000.0000.0000.0000.0000.0000.0000.0000.0000.0000.0000.0000.0000.0000.0000.0000.0000.0000.0000.0000.0000.0000.0000.0000.0000.0000.0000.0000.0000.0000.0000.0000.0000.0000.0000.0000.0000.0000.000

0.0000.0000.0000.0000.0000.0000.0000.0000.0000.0000.0000.0000.0000.0000.0000.0000.0000.0000.0000.0000.0000.0000.0000.0000.0000.0000.0000.0000.0000.0000.0000.0000.0000.0000.0000.0000.0000.0000.0000.0000.0000.0000.0000.0000.0000.0000.0000.0000.0000.0000.0000.0000.0000.0000.0000.0000.0000.0000.0000.0000.0000.000

0.0000.0000.0000.0000.0000.000

- Turbidity data (NTU)0:00-2:00 2:00-4:00 4:00-6:00 6:00-8:00 8:00-10:00 10:00-12:00


- Turbidity data (NTU)12:00-14:00 14:00-16:00 16:00-18:00 18:00-20:00 20:00-22:00 22:00-24:00 Daily max
0.0000.0000.0000.0000.0000.0000.0000.0000.0000.0000.0000.0000.0000.0000.0000.0000.0000.0000.0000.0000.0000.0000.0000.0000.0000.0000.0000.0000.0000.0000.0000.0000.0000.0000.0000.0000.0000.0000.0000.0000.0000.0000.0000.0000.0000.0000.0000.0000.0000.000

0.0000.0000.0000.0000.0000.0000.0000.0000.0000.0000.0000.0000.0000.0000.0000.0000.0000.0000.0000.0000.0000.0000.0000.0000.0000.0000.0000.0000.0000.0000.0000.0000.0000.0000.0000.0000.0000.0000.0000.0000.0000.0000.0000.0000.0000.0000.0000.0000.0000.0000.0000.0000.0000.0000.0000.0000.0000.0000.0000.0000.0000.000

0.0000.0000.0000.0000.0000.0000.0000.0000.0000.0000.0000.0000.0000.0000.0000.0000.0000.0000.0000.0000.0000.0000.0000.0000.0000.0000.0000.0000.0000.0000.0000.0000.0000.0000.0000.0000.0000.0000.0000.0000.0000.0000.0000.0000.0000.0000.0000.0000.0000.0000.0000.0000.0000.0000.0000.0000.0000.0000.0000.0000.0000.000

0.0000.0000.0000.0000.0000.0000.0000.0000.0000.0000.0000.0000.0000.0000.0000.0000.0000.0000.0000.0000.0000.0000.0000.0000.0000.0000.0000.0000.0000.0000.0000.0000.0000.0000.0000.0000.0000.0000.0000.0000.0000.0000.0000.0000.0000.0000.0000.0000.0000.0000.0000.0000.0000.0000.0000.0000.0000.0000.0000.0000.0000.000

0.0000.0000.0000.0000.0000.0000.0000.0000.0000.0000.0000.0000.0000.0000.0000.0000.0000.0000.0000.0000.0000.0000.0000.0000.0000.0000.0000.0000.0000.0000.0000.0000.0000.0000.0000.0000.0000.0000.0000.0000.0000.0000.0000.0000.0000.0000.0000.0000.0000.0000.0000.0000.0000.0000.0000.0000.0000.0000.0000.0000.0000.000

0.0000.0000.0000.0000.0000.0000.0000.0000.0000.0000.0000.0000.0000.0000.0000.0000.0000.0000.0000.0000.0000.0000.0000.0000.0000.0000.0000.0000.0000.0000.0000.0000.0000.0000.0000.0000.0000.0000.0000.0000.0000.0000.0000.0000.0000.0000.0000.0000.0000.0000.0000.0000.0000.0000.0000.0000.0000.0000.0000.0000.0000.000

0.0000.0000.0000.0000.0000.000

- Turbidity data (NTU)0:00-2:00 2:00-4:00 4:00-6:00 6:00-8:00 8:00-10:00 10:00-12:00


- Turbidity data (NTU)12:00-14:00 14:00-16:00 16:00-18:00 18:00-20:00 20:00-22:00 22:00-24:00 Daily max
0.0000.0000.0000.0000.0000.0000.0000.0000.0000.0000.0000.0000.0000.0000.0000.0000.0000.0000.0000.0000.0000.0000.0000.0000.0000.0000.0000.0000.0000.0000.0000.0000.0000.0000.0000.0000.0000.0000.0000.0000.0000.0000.0000.0000.0000.0000.0000.0000.0000.000

0.0000.0000.0000.0000.0000.0000.0000.0000.0000.0000.0000.0000.0000.0000.0000.0000.0000.0000.0000.0000.0000.0000.0000.0000.0000.0000.0000.0000.0000.0000.0000.0000.0000.0000.0000.0000.0000.0000.0000.0000.0000.0000.0000.0000.0000.0000.0000.0000.0000.0000.0000.0000.0000.0000.0000.0000.0000.0000.0000.0000.0000.000

0.0000.0000.0000.0000.0000.0000.0000.0000.0000.0000.0000.0000.0000.0000.0000.0000.0000.0000.0000.0000.0000.0000.0000.0000.0000.0000.0000.0000.0000.0000.0000.0000.0000.0000.0000.0000.0000.0000.0000.0000.0000.0000.0000.0000.0000.0000.0000.0000.0000.0000.0000.0000.0000.0000.0000.0000.0000.0000.0000.0000.0000.000

0.0000.0000.0000.0000.0000.0000.0000.0000.0000.0000.0000.0000.0000.0000.0000.0000.0000.0000.0000.0000.0000.0000.0000.0000.0000.0000.0000.0000.0000.0000.0000.0000.0000.0000.0000.0000.0000.0000.0000.0000.0000.0000.0000.0000.0000.0000.0000.0000.0000.0000.0000.0000.0000.0000.0000.0000.0000.0000.0000.0000.0000.000

0.0000.0000.0000.0000.0000.0000.0000.0000.0000.0000.0000.0000.0000.0000.0000.0000.0000.0000.0000.0000.0000.0000.0000.0000.0000.0000.0000.0000.0000.0000.0000.0000.0000.0000.0000.0000.0000.0000.0000.0000.0000.0000.0000.0000.0000.0000.0000.0000.0000.0000.0000.0000.0000.0000.0000.0000.0000.0000.0000.0000.0000.000
0.0000.0000.0000.0000.0000.0000.0000.0000.0000.0000.0000.0000.0000.0000.0000.0000.0000.0000.0000.0000.0000.0000.0000.0000.0000.0000.0000.0000.0000.0000.0000.0000.0000.0000.0000.0000.0000.0000.0000.0000.0000.0000.0000.0000.0000.0000.0000.0000.0000.0000.0000.0000.0000.0000.0000.0000.0000.0000.0000.0000.0000.000

0.0000.0000.0000.0000.0000.000

- Turbidity data (NTU)0:00-2:00 2:00-4:00 4:00-6:00 6:00-8:00 8:00-10:00 10:00-12:00


- Turbidity data (NTU)12:00-14:00 14:00-16:00 16:00-18:00 18:00-20:00 20:00-22:00 22:00-24:00 Daily max
0.0000.0000.0000.0000.0000.0000.0000.0000.0000.0000.0000.0000.0000.0000.0000.0000.0000.0000.0000.0000.0000.0000.0000.0000.0000.0000.0000.0000.0000.0000.0000.0000.0000.0000.0000.0000.0000.0000.0000.0000.0000.0000.0000.0000.0000.0000.0000.0000.0000.000

0.0000.0000.0000.0000.0000.0000.0000.0000.0000.0000.0000.0000.0000.0000.0000.0000.0000.0000.0000.0000.0000.0000.0000.0000.0000.0000.0000.0000.0000.0000.0000.0000.0000.0000.0000.0000.0000.0000.0000.0000.0000.0000.0000.0000.0000.0000.0000.0000.0000.0000.0000.0000.0000.0000.0000.0000.0000.0000.0000.0000.0000.000

0.0000.0000.0000.0000.0000.0000.0000.0000.0000.0000.0000.0000.0000.0000.0000.0000.0000.0000.0000.0000.0000.0000.0000.0000.0000.0000.0000.0000.0000.0000.0000.0000.0000.0000.0000.0000.0000.0000.0000.0000.0000.0000.0000.0000.0000.0000.0000.0000.0000.0000.0000.0000.0000.0000.0000.0000.0000.0000.0000.0000.0000.000

0.0000.0000.0000.0000.0000.0000.0000.0000.0000.0000.0000.0000.0000.0000.0000.0000.0000.0000.0000.0000.0000.0000.0000.0000.0000.0000.0000.0000.0000.0000.0000.0000.0000.0000.0000.0000.0000.0000.0000.0000.0000.0000.0000.0000.0000.0000.0000.0000.0000.0000.0000.0000.0000.0000.0000.0000.0000.0000.0000.0000.0000.000

0.0000.0000.0000.0000.0000.0000.0000.0000.0000.0000.0000.0000.0000.0000.0000.0000.0000.0000.0000.0000.0000.0000.0000.0000.0000.0000.0000.0000.0000.0000.0000.0000.0000.0000.0000.0000.0000.0000.0000.0000.0000.0000.0000.0000.0000.0000.0000.0000.0000.0000.0000.0000.0000.0000.0000.0000.0000.0000.0000.0000.0000.000

0.0000.0000.0000.0000.0000.0000.0000.0000.0000.0000.0000.0000.0000.0000.0000.0000.0000.0000.0000.0000.0000.0000.0000.0000.0000.0000.0000.0000.0000.0000.0000.0000.0000.0000.0000.0000.0000.0000.0000.0000.0000.0000.0000.0000.0000.0000.0000.0000.0000.0000.0000.0000.0000.0000.0000.0000.0000.0000.0000.0000.0000.000

0.0000.0000.0000.0000.0000.000

- Turbidity data (NTU)0:00-2:00 2:00-4:00 4:00-6:00 6:00-8:00 8:00-10:00 10:00-12:00


- Turbidity data (NTU)12:00-14:00 14:00-16:00 16:00-18:00 18:00-20:00 20:00-22:00 22:00-24:00 Daily max
0.0000.0000.0000.0000.0000.0000.0000.0000.0000.0000.0000.0000.0000.0000.0000.0000.0000.0000.0000.0000.0000.0000.0000.0000.0000.0000.0000.0000.0000.0000.0000.0000.0000.0000.0000.0000.0000.0000.0000.0000.0000.0000.0000.0000.0000.0000.0000.0000.0000.000

0.0000.0000.0000.0000.0000.0000.0000.0000.0000.0000.0000.0000.0000.0000.0000.0000.0000.0000.0000.0000.0000.0000.0000.0000.0000.0000.0000.0000.0000.0000.0000.0000.0000.0000.0000.0000.0000.0000.0000.0000.0000.0000.0000.0000.0000.0000.0000.0000.0000.0000.0000.0000.0000.0000.0000.0000.0000.0000.0000.0000.0000.000

0.0000.0000.0000.0000.0000.0000.0000.0000.0000.0000.0000.0000.0000.0000.0000.0000.0000.0000.0000.0000.0000.0000.0000.0000.0000.0000.0000.0000.0000.0000.0000.0000.0000.0000.0000.0000.0000.0000.0000.0000.0000.0000.0000.0000.0000.0000.0000.0000.0000.0000.0000.0000.0000.0000.0000.0000.0000.0000.0000.0000.0000.000

0.0000.0000.0000.0000.0000.0000.0000.0000.0000.0000.0000.0000.0000.0000.0000.0000.0000.0000.0000.0000.0000.0000.0000.0000.0000.0000.0000.0000.0000.0000.0000.0000.0000.0000.0000.0000.0000.0000.0000.0000.0000.0000.0000.0000.0000.0000.0000.0000.0000.0000.0000.0000.0000.0000.0000.0000.0000.0000.0000.0000.0000.000
0.0000.0000.0000.0000.0000.0000.0000.0000.0000.0000.0000.0000.0000.0000.0000.0000.0000.0000.0000.0000.0000.0000.0000.0000.0000.0000.0000.0000.0000.0000.0000.0000.0000.0000.0000.0000.0000.0000.0000.0000.0000.0000.0000.0000.0000.0000.0000.0000.0000.0000.0000.0000.0000.0000.0000.0000.0000.0000.0000.0000.0000.000

0.0000.0000.0000.0000.0000.0000.0000.0000.0000.0000.0000.0000.0000.0000.0000.0000.0000.0000.0000.0000.0000.0000.0000.0000.0000.0000.0000.0000.0000.0000.0000.0000.0000.0000.0000.0000.0000.0000.0000.0000.0000.0000.0000.0000.0000.0000.0000.0000.0000.0000.0000.0000.0000.0000.0000.0000.0000.0000.0000.0000.0000.000
0.0000.0000.0000.0000.0000.000

- Turbidity data (NTU)0:00-2:00 2:00-4:00 4:00-6:00 6:00-8:00 8:00-10:00 10:00-12:00


- Turbidity data (NTU)12:00-14:00 14:00-16:00 16:00-18:00 18:00-20:00 20:00-22:00 22:00-24:00 Daily max
0.0000.0000.0000.0000.0000.0000.0000.0000.0000.0000.0000.0000.0000.0000.0000.0000.0000.0000.0000.0000.0000.0000.0000.0000.0000.0000.0000.0000.0000.0000.0000.0000.0000.0000.0000.0000.0000.0000.0000.0000.0000.0000.0000.0000.0000.0000.0000.0000.0000.000

0.0000.0000.0000.0000.0000.0000.0000.0000.0000.0000.0000.0000.0000.0000.0000.0000.0000.0000.0000.0000.0000.0000.0000.0000.0000.0000.0000.0000.0000.0000.0000.0000.0000.0000.0000.0000.0000.0000.0000.0000.0000.0000.0000.0000.0000.0000.0000.0000.0000.0000.0000.0000.0000.0000.0000.0000.0000.0000.0000.0000.0000.000
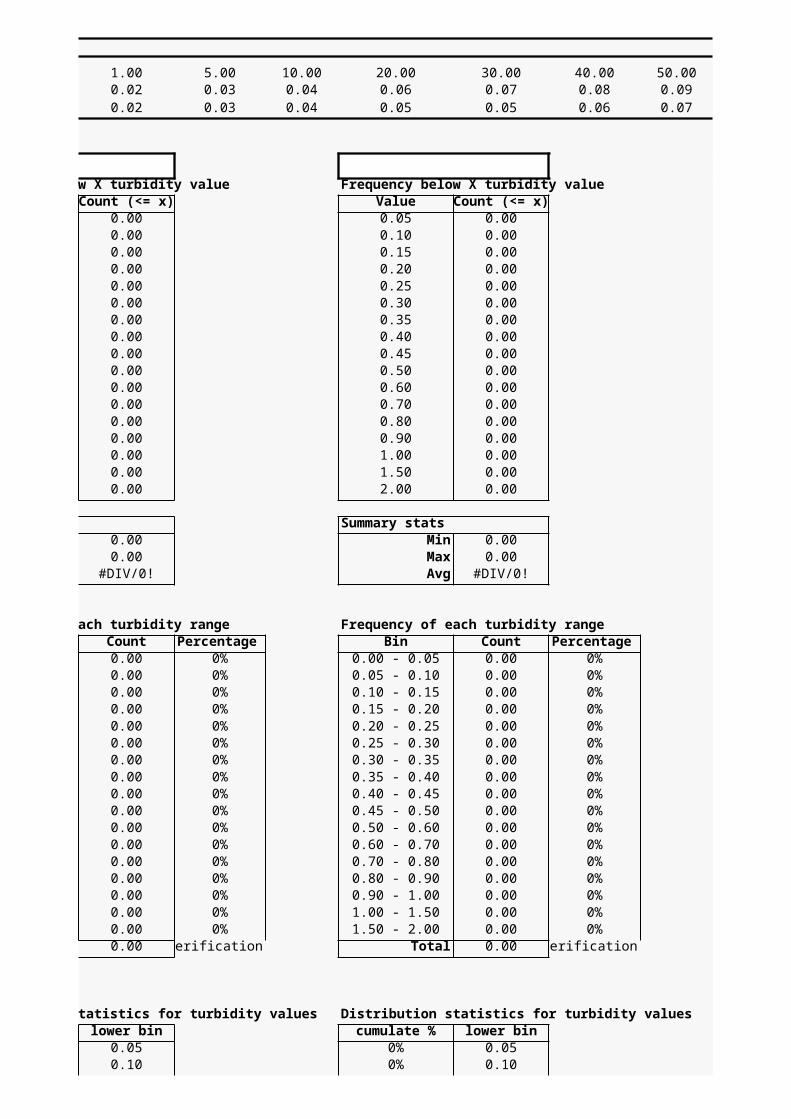
0.0000.0000.0000.0000.0000.0000.0000.0000.0000.0000.0000.0000.0000.0000.0000.0000.0000.0000.0000.0000.0000.0000.0000.0000.0000.0000.0000.0000.0000.0000.0000.0000.0000.0000.0000.0000.0000.0000.0000.0000.0000.0000.0000.0000.0000.0000.0000.0000.0000.0000.0000.0000.0000.0000.0000.0000.0000.0000.0000.0000.0000.000

0.0000.0000.0000.0000.0000.0000.0000.0000.0000.0000.0000.0000.0000.0000.0000.0000.0000.0000.0000.0000.0000.0000.0000.0000.0000.0000.0000.0000.0000.0000.0000.0000.0000.0000.0000.0000.0000.0000.0000.0000.0000.0000.0000.0000.0000.0000.0000.0000.0000.0000.0000.0000.0000.0000.0000.0000.0000.0000.0000.0000.0000.000

0.0000.0000.0000.0000.0000.0000.0000.0000.0000.0000.0000.0000.0000.0000.0000.0000.0000.0000.0000.0000.0000.0000.0000.0000.0000.0000.0000.0000.0000.0000.0000.0000.0000.0000.0000.0000.0000.0000.0000.0000.0000.0000.0000.0000.0000.0000.0000.0000.0000.0000.0000.0000.0000.0000.0000.0000.0000.0000.0000.0000.0000.000

0.0000.0000.0000.0000.0000.0000.0000.0000.0000.0000.0000.0000.0000.0000.0000.0000.0000.0000.0000.0000.0000.0000.0000.0000.0000.0000.0000.0000.0000.0000.0000.0000.0000.0000.0000.0000.0000.0000.0000.0000.0000.0000.0000.0000.0000.0000.0000.0000.0000.0000.0000.0000.0000.0000.0000.0000.0000.0000.0000.0000.0000.000

0.0000.0000.0000.0000.0000.000

- Turbidity data (NTU)0:00-2:00 2:00-4:00 4:00-6:00 6:00-8:00 8:00-10:00 10:00-12:00
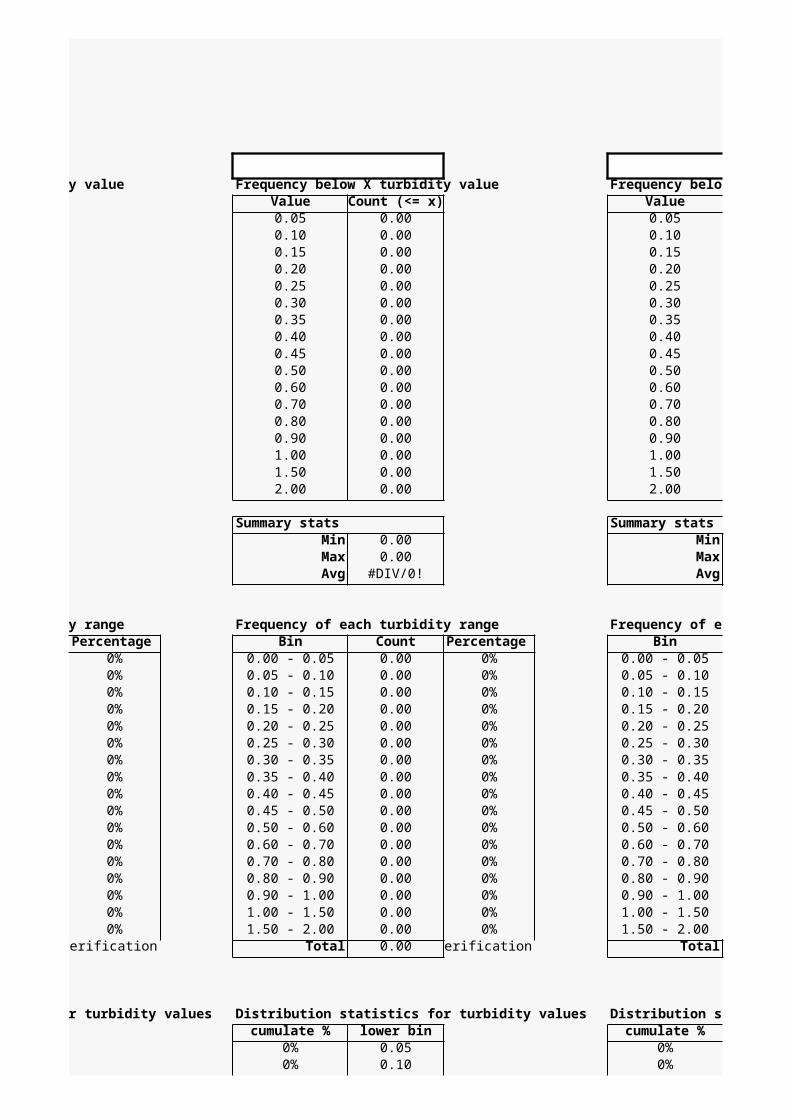


- Turbidity data (NTU)12:00-14:00 14:00-16:00 16:00-18:00 18:00-20:00 20:00-22:00 22:00-24:00 Daily max
0.0000.0000.0000.0000.0000.0000.0000.0000.0000.0000.0000.0000.0000.0000.0000.0000.0000.0000.0000.0000.0000.0000.0000.0000.0000.0000.0000.0000.0000.0000.0000.0000.0000.0000.0000.0000.0000.0000.0000.0000.0000.0000.0000.0000.0000.0000.0000.0000.0000.000

0.0000.0000.0000.0000.0000.0000.0000.0000.0000.0000.0000.0000.0000.0000.0000.0000.0000.0000.0000.0000.0000.0000.0000.0000.0000.0000.0000.0000.0000.0000.0000.0000.0000.0000.0000.0000.0000.0000.0000.0000.0000.0000.0000.0000.0000.0000.0000.0000.0000.0000.0000.0000.0000.0000.0000.0000.0000.0000.0000.0000.0000.000

0.0000.0000.0000.0000.0000.0000.0000.0000.0000.0000.0000.0000.0000.0000.0000.0000.0000.0000.0000.0000.0000.0000.0000.0000.0000.0000.0000.0000.0000.0000.0000.0000.0000.0000.0000.0000.0000.0000.0000.0000.0000.0000.0000.0000.0000.0000.0000.0000.0000.0000.0000.0000.0000.0000.0000.0000.0000.0000.0000.0000.0000.000

0.0000.0000.0000.0000.0000.0000.0000.0000.0000.0000.0000.0000.0000.0000.0000.0000.0000.0000.0000.0000.0000.0000.0000.0000.0000.0000.0000.0000.0000.0000.0000.0000.0000.0000.0000.0000.0000.0000.0000.0000.0000.0000.0000.0000.0000.0000.0000.0000.0000.0000.0000.0000.0000.0000.0000.0000.0000.0000.0000.0000.0000.000

0.0000.0000.0000.0000.0000.0000.0000.0000.0000.0000.0000.0000.0000.0000.0000.0000.0000.0000.0000.0000.0000.0000.0000.0000.0000.0000.0000.0000.0000.0000.0000.0000.0000.0000.0000.0000.0000.0000.0000.0000.0000.0000.0000.0000.0000.0000.0000.0000.0000.0000.0000.0000.0000.0000.0000.0000.0000.0000.0000.0000.0000.000

0.0000.0000.0000.0000.0000.0000.0000.0000.0000.0000.0000.0000.0000.0000.0000.0000.0000.0000.0000.0000.0000.0000.0000.0000.0000.0000.0000.0000.0000.0000.0000.0000.0000.0000.0000.0000.0000.0000.0000.0000.0000.0000.0000.0000.0000.0000.0000.0000.0000.0000.0000.0000.0000.0000.0000.0000.0000.0000.0000.0000.0000.000

0.0000.0000.0000.0000.0000.000

WTAnalyser (Filtration)Version 3.2
Developed by the Australian Water Treatment Alliance
Compatible with MS Excel 2003, 2007 & 2010
Frequency below X turbidity value Frequency below X turbidity valueValue Count (<= x) Value Count (<= x)0.05 0.00 0.05 0.000.10 0.00 0.10 0.000.15 0.00 0.15 0.000.20 0.00 0.20 0.000.25 0.00 0.25 0.000.30 0.00 0.30 0.000.35 0.00 0.35 0.000.40 0.00 0.40 0.000.45 0.00 0.45 0.000.50 0.00 0.50 0.000.60 0.00 0.60 0.000.70 0.00 0.70 0.000.80 0.00 0.80 0.000.90 0.00 0.90 0.001.00 0.00 1.00 0.001.50 0.00 1.50 0.002.00 0.00 2.00 0.00
Summary stats Summary statsMin 0.00 Min 0.00Max 0.00 Max 0.00Avg #DIV/0! Avg #DIV/0!
Frequency of each turbidity range Frequency of each turbidity rangeBin Count Percentage Bin Count
0.00 - 0.05 0.00 0% 0.00 - 0.05 0.000.05 - 0.10 0.00 0% 0.05 - 0.10 0.000.10 - 0.15 0.00 0% 0.10 - 0.15 0.000.15 - 0.20 0.00 0% 0.15 - 0.20 0.000.20 - 0.25 0.00 0% 0.20 - 0.25 0.000.25 - 0.30 0.00 0% 0.25 - 0.30 0.000.30 - 0.35 0.00 0% 0.30 - 0.35 0.000.35 - 0.40 0.00 0% 0.35 - 0.40 0.000.40 - 0.45 0.00 0% 0.40 - 0.45 0.000.45 - 0.50 0.00 0% 0.45 - 0.50 0.000.50 - 0.60 0.00 0% 0.50 - 0.60 0.000.60 - 0.70 0.00 0% 0.60 - 0.70 0.000.70 - 0.80 0.00 0% 0.70 - 0.80 0.000.80 - 0.90 0.00 0% 0.80 - 0.90 0.000.90 - 1.00 0.00 0% 0.90 - 1.00 0.001.00 - 1.50 0.00 0% 1.00 - 1.50 0.001.50 - 2.00 0.00 0% 1.50 - 2.00 0.00
Total 0.00 Verification Total 0.00
Distribution statistics for turbidity values Distribution statistics for turbidity valuescumulate % lower bin cumulate % lower bin
0% 0.05 0% 0.050% 0.10 0% 0.10

0% 0.15 0% 0.150% 0.20 0% 0.200% 0.25 0% 0.250% 0.30 0% 0.300% 0.35 0% 0.350% 0.40 0% 0.400% 0.45 0% 0.450% 0.50 0% 0.500% 0.60 0% 0.600% 0.70 0% 0.700% 0.80 0% 0.800% 0.90 0% 0.900% 1.00 0% 1.000% 1.50 0% 1.500% 2.00 0% 2.00
Statistical Calculations for Box Charts
0 0 0 0 0Average #DIV/0! #DIV/0! #DIV/0! #DIV/0! #DIV/0!95%ile #VALUE! #VALUE! #VALUE! #VALUE! #VALUE!75%ile #VALUE! #VALUE! #VALUE! #VALUE! #VALUE!25%ile #VALUE! #VALUE! #VALUE! #VALUE! #VALUE!5%ile #VALUE! #VALUE! #VALUE! #VALUE! #VALUE!

US PfSW data
PercentileMax95th %ile
Frequency below X turbidity value Frequency below X turbidity value Frequency below X turbidity valueValue Count (<= x) Value0.05 0.00 0.050.10 0.00 0.100.15 0.00 0.150.20 0.00 0.200.25 0.00 0.250.30 0.00 0.300.35 0.00 0.350.40 0.00 0.400.45 0.00 0.450.50 0.00 0.500.60 0.00 0.600.70 0.00 0.700.80 0.00 0.800.90 0.00 0.901.00 0.00 1.001.50 0.00 1.502.00 0.00 2.00
Summary stats Summary statsMin 0.00 MinMax 0.00 MaxAvg #DIV/0! Avg
Frequency of each turbidity range Frequency of each turbidity range Frequency of each turbidity rangePercentage Bin Count Percentage Bin
0% 0.00 - 0.05 0.00 0% 0.00 - 0.050% 0.05 - 0.10 0.00 0% 0.05 - 0.100% 0.10 - 0.15 0.00 0% 0.10 - 0.150% 0.15 - 0.20 0.00 0% 0.15 - 0.200% 0.20 - 0.25 0.00 0% 0.20 - 0.250% 0.25 - 0.30 0.00 0% 0.25 - 0.300% 0.30 - 0.35 0.00 0% 0.30 - 0.350% 0.35 - 0.40 0.00 0% 0.35 - 0.400% 0.40 - 0.45 0.00 0% 0.40 - 0.450% 0.45 - 0.50 0.00 0% 0.45 - 0.500% 0.50 - 0.60 0.00 0% 0.50 - 0.600% 0.60 - 0.70 0.00 0% 0.60 - 0.700% 0.70 - 0.80 0.00 0% 0.70 - 0.800% 0.80 - 0.90 0.00 0% 0.80 - 0.900% 0.90 - 1.00 0.00 0% 0.90 - 1.000% 1.00 - 1.50 0.00 0% 1.00 - 1.500% 1.50 - 2.00 0.00 0% 1.50 - 2.00
Verification Total 0.00 Verification Total
Distribution statistics for turbidity values Distribution statistics for turbidity values Distribution statistics for turbidity valuescumulate % lower bin cumulate %
0% 0.05 0%0% 0.10 0%

0% 0.15 0%0% 0.20 0%0% 0.25 0%0% 0.30 0%0% 0.35 0%0% 0.40 0%0% 0.45 0%0% 0.50 0%0% 0.60 0%0% 0.70 0%0% 0.80 0%0% 0.90 0%0% 1.00 0%0% 1.50 0%0% 2.00 0%
0 0 0 0 0 0 0#DIV/0! #DIV/0! #DIV/0! #DIV/0! #DIV/0! #DIV/0! #DIV/0!
#VALUE! #VALUE! #VALUE! #VALUE! #VALUE! #VALUE! #VALUE!#VALUE! #VALUE! #VALUE! #VALUE! #VALUE! #VALUE! #VALUE!#VALUE! #VALUE! #VALUE! #VALUE! #VALUE! #VALUE! #VALUE!#VALUE! #VALUE! #VALUE! #VALUE! #VALUE! #VALUE! #VALUE!

1.00 5.00 10.00 20.00 30.00 40.00 50.000.02 0.03 0.04 0.06 0.07 0.08 0.090.02 0.03 0.04 0.05 0.05 0.06 0.07
Frequency below X turbidity value Frequency below X turbidity valueCount (<= x) Value Count (<= x)
0.00 0.05 0.000.00 0.10 0.000.00 0.15 0.000.00 0.20 0.000.00 0.25 0.000.00 0.30 0.000.00 0.35 0.000.00 0.40 0.000.00 0.45 0.000.00 0.50 0.000.00 0.60 0.000.00 0.70 0.000.00 0.80 0.000.00 0.90 0.000.00 1.00 0.000.00 1.50 0.000.00 2.00 0.00
Summary stats0.00 Min 0.000.00 Max 0.00
#DIV/0! Avg #DIV/0!
Frequency of each turbidity range Frequency of each turbidity rangeCount Percentage Bin Count Percentage0.00 0% 0.00 - 0.05 0.00 0%0.00 0% 0.05 - 0.10 0.00 0%0.00 0% 0.10 - 0.15 0.00 0%0.00 0% 0.15 - 0.20 0.00 0%0.00 0% 0.20 - 0.25 0.00 0%0.00 0% 0.25 - 0.30 0.00 0%0.00 0% 0.30 - 0.35 0.00 0%0.00 0% 0.35 - 0.40 0.00 0%0.00 0% 0.40 - 0.45 0.00 0%0.00 0% 0.45 - 0.50 0.00 0%0.00 0% 0.50 - 0.60 0.00 0%0.00 0% 0.60 - 0.70 0.00 0%0.00 0% 0.70 - 0.80 0.00 0%0.00 0% 0.80 - 0.90 0.00 0%0.00 0% 0.90 - 1.00 0.00 0%0.00 0% 1.00 - 1.50 0.00 0%0.00 0% 1.50 - 2.00 0.00 0%0.00 Verification Total 0.00 Verification
Distribution statistics for turbidity values Distribution statistics for turbidity valueslower bin cumulate % lower bin
0.05 0% 0.050.10 0% 0.10

0.15 0% 0.150.20 0% 0.200.25 0% 0.250.30 0% 0.300.35 0% 0.350.40 0% 0.400.45 0% 0.450.50 0% 0.500.60 0% 0.600.70 0% 0.700.80 0% 0.800.90 0% 0.901.00 0% 1.001.50 0% 1.502.00 0% 2.00
0 0 0 0#DIV/0! #DIV/0! #DIV/0! #DIV/0!
#VALUE! #VALUE! #VALUE! #VALUE!#VALUE! #VALUE! #VALUE! #VALUE!#VALUE! #VALUE! #VALUE! #VALUE!#VALUE! #VALUE! #VALUE! #VALUE!

60.00 70.00 80.00 90.00 95.00 97.500.10 0.12 0.15 0.20 0.28 0.400.08 0.09 0.10 0.13 0.17 0.19
Frequency below X turbidity value Frequency below X turbidity valueValue Count (<= x) Value Count (<= x)0.05 0.00 0.05 0.000.10 0.00 0.10 0.000.15 0.00 0.15 0.000.20 0.00 0.20 0.000.25 0.00 0.25 0.000.30 0.00 0.30 0.000.35 0.00 0.35 0.000.40 0.00 0.40 0.000.45 0.00 0.45 0.000.50 0.00 0.50 0.000.60 0.00 0.60 0.000.70 0.00 0.70 0.000.80 0.00 0.80 0.000.90 0.00 0.90 0.001.00 0.00 1.00 0.001.50 0.00 1.50 0.002.00 0.00 2.00 0.00
Summary stats Summary statsMin 0.00 Min 0.00Max 0.00 Max 0.00Avg #DIV/0! Avg #DIV/0!
Frequency of each turbidity range Frequency of each turbidity rangeBin Count Percentage Bin Count Percentage
0.00 - 0.05 0.00 0% 0.00 - 0.05 0.00 0%0.05 - 0.10 0.00 0% 0.05 - 0.10 0.00 0%0.10 - 0.15 0.00 0% 0.10 - 0.15 0.00 0%0.15 - 0.20 0.00 0% 0.15 - 0.20 0.00 0%0.20 - 0.25 0.00 0% 0.20 - 0.25 0.00 0%0.25 - 0.30 0.00 0% 0.25 - 0.30 0.00 0%0.30 - 0.35 0.00 0% 0.30 - 0.35 0.00 0%0.35 - 0.40 0.00 0% 0.35 - 0.40 0.00 0%0.40 - 0.45 0.00 0% 0.40 - 0.45 0.00 0%0.45 - 0.50 0.00 0% 0.45 - 0.50 0.00 0%0.50 - 0.60 0.00 0% 0.50 - 0.60 0.00 0%0.60 - 0.70 0.00 0% 0.60 - 0.70 0.00 0%0.70 - 0.80 0.00 0% 0.70 - 0.80 0.00 0%0.80 - 0.90 0.00 0% 0.80 - 0.90 0.00 0%0.90 - 1.00 0.00 0% 0.90 - 1.00 0.00 0%1.00 - 1.50 0.00 0% 1.00 - 1.50 0.00 0%1.50 - 2.00 0.00 0% 1.50 - 2.00 0.00 0%
Total 0.00 Verification Total 0.00 Verification
Distribution statistics for turbidity values Distribution statistics for turbidity valuescumulate % lower bin cumulate % lower bin
0% 0.05 0% 0.050% 0.10 0% 0.10

0% 0.15 0% 0.150% 0.20 0% 0.200% 0.25 0% 0.250% 0.30 0% 0.300% 0.35 0% 0.350% 0.40 0% 0.400% 0.45 0% 0.450% 0.50 0% 0.500% 0.60 0% 0.600% 0.70 0% 0.700% 0.80 0% 0.800% 0.90 0% 0.900% 1.00 0% 1.000% 1.50 0% 1.500% 2.00 0% 2.00

Frequency below X turbidity value Frequency below X turbidity valueValue Count (<= x) Value Count (<= x)0.05 0.00 0.05 0.000.10 0.00 0.10 0.000.15 0.00 0.15 0.000.20 0.00 0.20 0.000.25 0.00 0.25 0.000.30 0.00 0.30 0.000.35 0.00 0.35 0.000.40 0.00 0.40 0.000.45 0.00 0.45 0.000.50 0.00 0.50 0.000.60 0.00 0.60 0.000.70 0.00 0.70 0.000.80 0.00 0.80 0.000.90 0.00 0.90 0.001.00 0.00 1.00 0.001.50 0.00 1.50 0.002.00 0.00 2.00 0.00
Summary stats Summary statsMin 0.00 Min 0.00Max 0.00 Max 0.00Avg #DIV/0! Avg #DIV/0!
Frequency of each turbidity range Frequency of each turbidity rangeBin Count Percentage Bin Count
0.00 - 0.05 0.00 0% 0.00 - 0.05 0.000.05 - 0.10 0.00 0% 0.05 - 0.10 0.000.10 - 0.15 0.00 0% 0.10 - 0.15 0.000.15 - 0.20 0.00 0% 0.15 - 0.20 0.000.20 - 0.25 0.00 0% 0.20 - 0.25 0.000.25 - 0.30 0.00 0% 0.25 - 0.30 0.000.30 - 0.35 0.00 0% 0.30 - 0.35 0.000.35 - 0.40 0.00 0% 0.35 - 0.40 0.000.40 - 0.45 0.00 0% 0.40 - 0.45 0.000.45 - 0.50 0.00 0% 0.45 - 0.50 0.000.50 - 0.60 0.00 0% 0.50 - 0.60 0.000.60 - 0.70 0.00 0% 0.60 - 0.70 0.000.70 - 0.80 0.00 0% 0.70 - 0.80 0.000.80 - 0.90 0.00 0% 0.80 - 0.90 0.000.90 - 1.00 0.00 0% 0.90 - 1.00 0.001.00 - 1.50 0.00 0% 1.00 - 1.50 0.001.50 - 2.00 0.00 0% 1.50 - 2.00 0.00
Total 0.00 Verification Total 0.00
Distribution statistics for turbidity values Distribution statistics for turbidity valuescumulate % lower bin cumulate % lower bin
0% 0.05 0% 0.050% 0.10 0% 0.10

0% 0.15 0% 0.150% 0.20 0% 0.200% 0.25 0% 0.250% 0.30 0% 0.300% 0.35 0% 0.350% 0.40 0% 0.400% 0.45 0% 0.450% 0.50 0% 0.500% 0.60 0% 0.600% 0.70 0% 0.700% 0.80 0% 0.800% 0.90 0% 0.900% 1.00 0% 1.000% 1.50 0% 1.500% 2.00 0% 2.00

Frequency below X turbidity value Frequency below X turbidity value Frequency below X turbidity valueValue Count (<= x) Value0.05 0.00 0.050.10 0.00 0.100.15 0.00 0.150.20 0.00 0.200.25 0.00 0.250.30 0.00 0.300.35 0.00 0.350.40 0.00 0.400.45 0.00 0.450.50 0.00 0.500.60 0.00 0.600.70 0.00 0.700.80 0.00 0.800.90 0.00 0.901.00 0.00 1.001.50 0.00 1.502.00 0.00 2.00
Summary stats Summary statsMin 0.00 MinMax 0.00 MaxAvg #DIV/0! Avg
Frequency of each turbidity range Frequency of each turbidity range Frequency of each turbidity rangePercentage Bin Count Percentage Bin
0% 0.00 - 0.05 0.00 0% 0.00 - 0.050% 0.05 - 0.10 0.00 0% 0.05 - 0.100% 0.10 - 0.15 0.00 0% 0.10 - 0.150% 0.15 - 0.20 0.00 0% 0.15 - 0.200% 0.20 - 0.25 0.00 0% 0.20 - 0.250% 0.25 - 0.30 0.00 0% 0.25 - 0.300% 0.30 - 0.35 0.00 0% 0.30 - 0.350% 0.35 - 0.40 0.00 0% 0.35 - 0.400% 0.40 - 0.45 0.00 0% 0.40 - 0.450% 0.45 - 0.50 0.00 0% 0.45 - 0.500% 0.50 - 0.60 0.00 0% 0.50 - 0.600% 0.60 - 0.70 0.00 0% 0.60 - 0.700% 0.70 - 0.80 0.00 0% 0.70 - 0.800% 0.80 - 0.90 0.00 0% 0.80 - 0.900% 0.90 - 1.00 0.00 0% 0.90 - 1.000% 1.00 - 1.50 0.00 0% 1.00 - 1.500% 1.50 - 2.00 0.00 0% 1.50 - 2.00
Verification Total 0.00 Verification Total
Distribution statistics for turbidity values Distribution statistics for turbidity values Distribution statistics for turbidity valuescumulate % lower bin cumulate %
0% 0.05 0%0% 0.10 0%

0% 0.15 0%0% 0.20 0%0% 0.25 0%0% 0.30 0%0% 0.35 0%0% 0.40 0%0% 0.45 0%0% 0.50 0%0% 0.60 0%0% 0.70 0%0% 0.80 0%0% 0.90 0%0% 1.00 0%0% 1.50 0%0% 2.00 0%

Frequency below X turbidity value Frequency below X turbidity valueCount (<= x) Value Count (<= x)
0.00 0.05 0.000.00 0.10 0.000.00 0.15 0.000.00 0.20 0.000.00 0.25 0.000.00 0.30 0.000.00 0.35 0.000.00 0.40 0.000.00 0.45 0.000.00 0.50 0.000.00 0.60 0.000.00 0.70 0.000.00 0.80 0.000.00 0.90 0.000.00 1.00 0.000.00 1.50 0.000.00 2.00 0.00
Summary stats0.00 Min 0.000.00 Max 0.00
#DIV/0! Avg #DIV/0!
Frequency of each turbidity range Frequency of each turbidity rangeCount Percentage Bin Count Percentage0.00 0% 0.00 - 0.05 0.00 0%0.00 0% 0.05 - 0.10 0.00 0%0.00 0% 0.10 - 0.15 0.00 0%0.00 0% 0.15 - 0.20 0.00 0%0.00 0% 0.20 - 0.25 0.00 0%0.00 0% 0.25 - 0.30 0.00 0%0.00 0% 0.30 - 0.35 0.00 0%0.00 0% 0.35 - 0.40 0.00 0%0.00 0% 0.40 - 0.45 0.00 0%0.00 0% 0.45 - 0.50 0.00 0%0.00 0% 0.50 - 0.60 0.00 0%0.00 0% 0.60 - 0.70 0.00 0%0.00 0% 0.70 - 0.80 0.00 0%0.00 0% 0.80 - 0.90 0.00 0%0.00 0% 0.90 - 1.00 0.00 0%0.00 0% 1.00 - 1.50 0.00 0%0.00 0% 1.50 - 2.00 0.00 0%0.00 Verification Total 0.00 Verification
Distribution statistics for turbidity values Distribution statistics for turbidity valueslower bin cumulate % lower bin
0.05 0% 0.050.10 0% 0.10

0.15 0% 0.150.20 0% 0.200.25 0% 0.250.30 0% 0.300.35 0% 0.350.40 0% 0.400.45 0% 0.450.50 0% 0.500.60 0% 0.600.70 0% 0.700.80 0% 0.800.90 0% 0.901.00 0% 1.001.50 0% 1.502.00 0% 2.00

Frequency below X turbidity value Frequency below X turbidity valueValue Count (<= x) Value Count (<= x)0.05 0.00 0.05 0.000.10 0.00 0.10 0.000.15 0.00 0.15 0.000.20 0.00 0.20 0.000.25 0.00 0.25 0.000.30 0.00 0.30 0.000.35 0.00 0.35 0.000.40 0.00 0.40 0.000.45 0.00 0.45 0.000.50 0.00 0.50 0.000.60 0.00 0.60 0.000.70 0.00 0.70 0.000.80 0.00 0.80 0.000.90 0.00 0.90 0.001.00 0.00 1.00 0.001.50 0.00 1.50 0.002.00 0.00 2.00 0.00
Summary stats Summary statsMin 0.00 Min 0.00Max 0.00 Max 0.00Avg #DIV/0! Avg #DIV/0!
Frequency of each turbidity range Frequency of each turbidity rangeBin Count Percentage Bin Count Percentage
0.00 - 0.05 0.00 0% 0.00 - 0.05 0.00 0%0.05 - 0.10 0.00 0% 0.05 - 0.10 0.00 0%0.10 - 0.15 0.00 0% 0.10 - 0.15 0.00 0%0.15 - 0.20 0.00 0% 0.15 - 0.20 0.00 0%0.20 - 0.25 0.00 0% 0.20 - 0.25 0.00 0%0.25 - 0.30 0.00 0% 0.25 - 0.30 0.00 0%0.30 - 0.35 0.00 0% 0.30 - 0.35 0.00 0%0.35 - 0.40 0.00 0% 0.35 - 0.40 0.00 0%0.40 - 0.45 0.00 0% 0.40 - 0.45 0.00 0%0.45 - 0.50 0.00 0% 0.45 - 0.50 0.00 0%0.50 - 0.60 0.00 0% 0.50 - 0.60 0.00 0%0.60 - 0.70 0.00 0% 0.60 - 0.70 0.00 0%0.70 - 0.80 0.00 0% 0.70 - 0.80 0.00 0%0.80 - 0.90 0.00 0% 0.80 - 0.90 0.00 0%0.90 - 1.00 0.00 0% 0.90 - 1.00 0.00 0%1.00 - 1.50 0.00 0% 1.00 - 1.50 0.00 0%1.50 - 2.00 0.00 0% 1.50 - 2.00 0.00 0%
Total 0.00 Verification Total 0.00 Verification
Distribution statistics for turbidity values Distribution statistics for turbidity valuescumulate % lower bin cumulate % lower bin
0% 0.05 0% 0.050% 0.10 0% 0.10

0% 0.15 0% 0.150% 0.20 0% 0.200% 0.25 0% 0.250% 0.30 0% 0.300% 0.35 0% 0.350% 0.40 0% 0.400% 0.45 0% 0.450% 0.50 0% 0.500% 0.60 0% 0.600% 0.70 0% 0.700% 0.80 0% 0.800% 0.90 0% 0.900% 1.00 0% 1.000% 1.50 0% 1.500% 2.00 0% 2.00

Frequency below X turbidity value Frequency below X turbidity valueValue Count (<= x) Value Count (<= x)0.05 0.00 0.05 0.000.10 0.00 0.10 0.000.15 0.00 0.15 0.000.20 0.00 0.20 0.000.25 0.00 0.25 0.000.30 0.00 0.30 0.000.35 0.00 0.35 0.000.40 0.00 0.40 0.000.45 0.00 0.45 0.000.50 0.00 0.50 0.000.60 0.00 0.60 0.000.70 0.00 0.70 0.000.80 0.00 0.80 0.000.90 0.00 0.90 0.001.00 0.00 1.00 0.001.50 0.00 1.50 0.002.00 0.00 2.00 0.00
Summary stats Summary statsMin 0.00 Min 0.00Max 0.00 Max 0.00Avg #DIV/0! Avg #DIV/0!
Frequency of each turbidity range Frequency of each turbidity rangeBin Count Percentage Bin Count
0.00 - 0.05 0.00 0% 0.00 - 0.05 0.000.05 - 0.10 0.00 0% 0.05 - 0.10 0.000.10 - 0.15 0.00 0% 0.10 - 0.15 0.000.15 - 0.20 0.00 0% 0.15 - 0.20 0.000.20 - 0.25 0.00 0% 0.20 - 0.25 0.000.25 - 0.30 0.00 0% 0.25 - 0.30 0.000.30 - 0.35 0.00 0% 0.30 - 0.35 0.000.35 - 0.40 0.00 0% 0.35 - 0.40 0.000.40 - 0.45 0.00 0% 0.40 - 0.45 0.000.45 - 0.50 0.00 0% 0.45 - 0.50 0.000.50 - 0.60 0.00 0% 0.50 - 0.60 0.000.60 - 0.70 0.00 0% 0.60 - 0.70 0.000.70 - 0.80 0.00 0% 0.70 - 0.80 0.000.80 - 0.90 0.00 0% 0.80 - 0.90 0.000.90 - 1.00 0.00 0% 0.90 - 1.00 0.001.00 - 1.50 0.00 0% 1.00 - 1.50 0.001.50 - 2.00 0.00 0% 1.50 - 2.00 0.00
Total 0.00 Verification Total 0.00
Distribution statistics for turbidity values Distribution statistics for turbidity valuescumulate % lower bin cumulate % lower bin
0% 0.05 0% 0.050% 0.10 0% 0.10

0% 0.15 0% 0.150% 0.20 0% 0.200% 0.25 0% 0.250% 0.30 0% 0.300% 0.35 0% 0.350% 0.40 0% 0.400% 0.45 0% 0.450% 0.50 0% 0.500% 0.60 0% 0.600% 0.70 0% 0.700% 0.80 0% 0.800% 0.90 0% 0.900% 1.00 0% 1.000% 1.50 0% 1.500% 2.00 0% 2.00

Frequency below X turbidity value
Frequency of each turbidity rangePercentage
0%0%0%0%0%0%0%0%0%0%0%0%0%0%0%0%0%
Verification
Distribution statistics for turbidity values


![Outline & Introduction v3.2 [02]](https://static.fdocuments.in/doc/165x107/577d34f01a28ab3a6b8f3637/outline-introduction-v32-02.jpg)