WT KO A B Suppl. Fig 1 Supplemental Figure 1. The expression of CYLD in liver. (A)...
7
WT KO A B Suppl. Fig 1 Supplemental Figure 1. The expression of CYLD in liver. (A) Immunohistochemical analysis of CYLD in liver tissue of adult wildtype and CYLD- deficient mice (magnification 40X) as well as in human liver tissue (magnification 10X). (B) The levels of CYLD mRNA in liver of wild type (1 and 3) and CYLD-deficient mice (2 and 4). Mouse Human GAPDH CYLD 1 2 3 4 Suppl. Fig 2 Cyclin D1 Actin WT KO WT KO Lung Brain Supplemental Figure 2. The levels of cyclin D1 in lung and brain of wildtype and CYLD- deficient mice (12 months post treatment).
-
Upload
edith-merritt -
Category
Documents
-
view
215 -
download
0
Transcript of WT KO A B Suppl. Fig 1 Supplemental Figure 1. The expression of CYLD in liver. (A)...
WT KO
A
B
Suppl. Fig 1
Supplemental Figure 1. The expression of CYLD in liver.(A) Immunohistochemical analysis of CYLD in liver tissue of adult wildtype and CYLD-deficient mice (magnification 40X) as well as in human liver tissue (magnification 10X). (B) The levels of CYLD mRNA in liver of wild type (1 and 3) and CYLD-deficient mice (2 and 4).
Mouse Human
GAPDH
CYLD
1 2 3 4
Suppl. Fig 2
Cyclin D1
Actin
WT KO WT KO
Lung Brain
Supplemental Figure 2. The levels of cyclin D1 in lung and brain of wildtype and CYLD-deficient mice (12 months post treatment).
Suppl. Fig 5
Cyclin D1
Actin
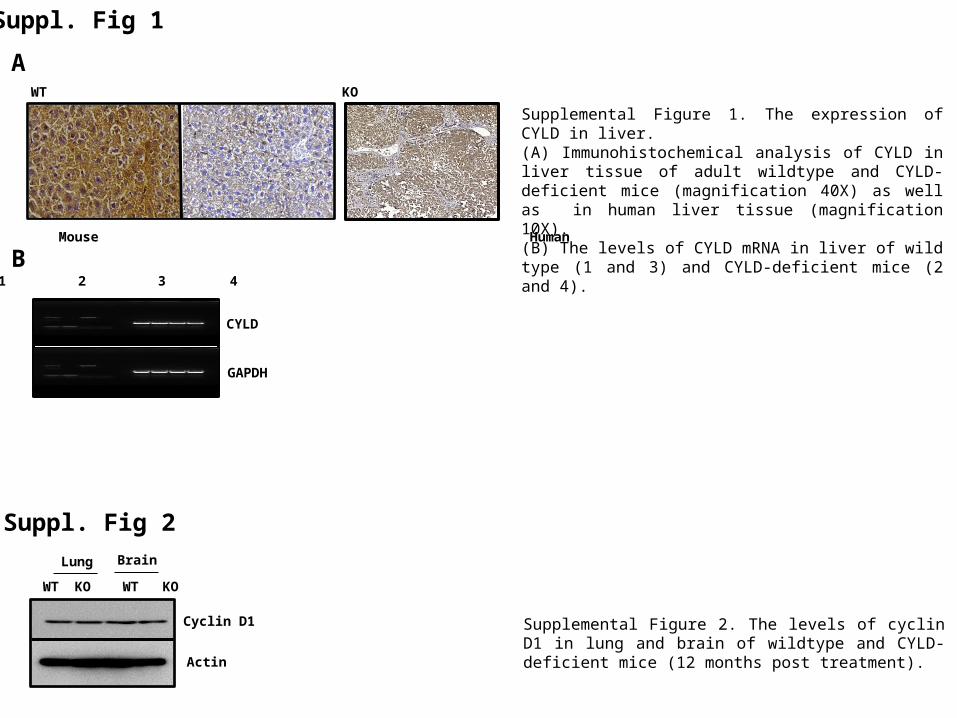
WT KOSupplemental Figure 4. The levels of cyclin D1 in livers of DEN-treated wild type and CYLD-deficient mice (72 h post treatment).
Suppl. Fig 4
p53
Actin
WT KO WT KO
Ctrl DENSupplemental Figure 5. The levels of p53 in livers of untreated or DEN-treated wildtype and CYLD-deficient mice (72 h post treatment).
CYLD High CYLD Low
Supplemental Figure 3. Representative images of CYLD-positive and CYLD-negative tumour and adjacent non-tumorous liver tissue.
Suppl. Fig 3
Suppl. Fig 7
p65
WT KO
100
50
0
150
200
WT KO
B
cl3
po
siti
ve s
tain
ing
in n
ucl
eus
[num
ber/
5 fie
lds
(40x
)]Bcl3
10
5
0
15
p
65 p
osi
tive
stai
nin
g in
nu
clu
s[n
umbe
r/5
field
s (4
0x)]
WT KO
WT KO
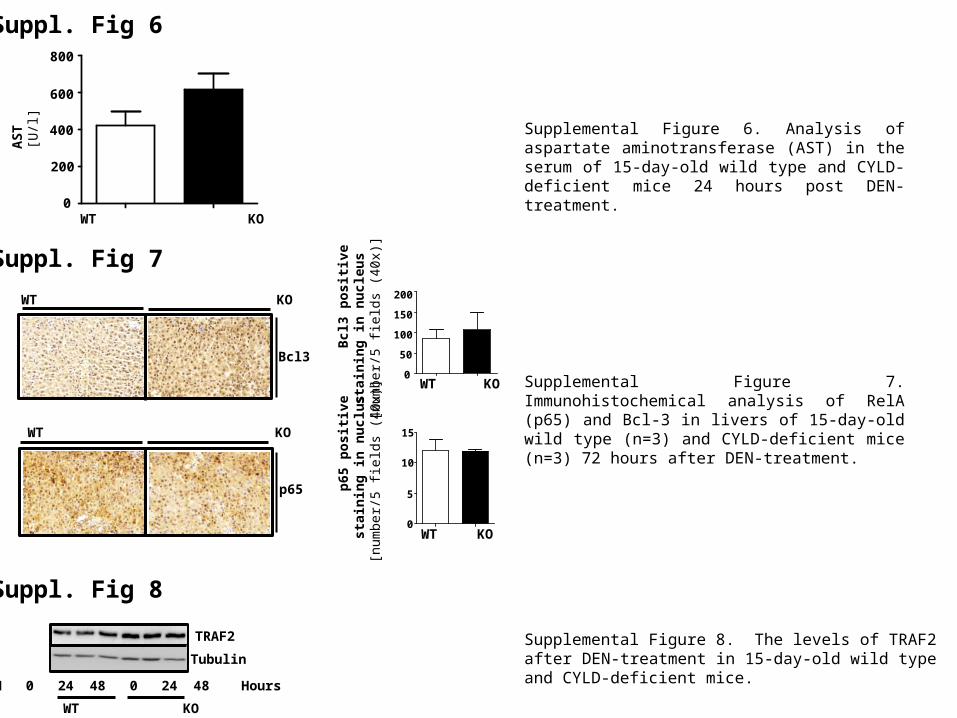
Supplemental Figure 7. Immunohistochemical analysis of RelA (p65) and Bcl-3 in livers of 15-day-old wild type (n=3) and CYLD-deficient mice (n=3) 72 hours after DEN-treatment.
AS
T[U
/l]
WT KO
200
0
400
600
800
Supplemental Figure 6. Analysis of aspartate aminotransferase (AST) in the serum of 15-day-old wild type and CYLD-deficient mice 24 hours post DEN-treatment.
Suppl. Fig 6
Suppl. Fig 8
TRAF2
Tubulin
DEN 0 24 48 0 24 48 Hours
WT KO
Supplemental Figure 8. The levels of TRAF2 after DEN-treatment in 15-day-old wild type and CYLD-deficient mice.
A
IP: FLAG-TRAF2WB: FLAG
IP: FLAG-TRAF2WB: TRAF2-Ubiquitin
C D
Lu
cife
rase
-DL
R R
atio
[
fold
cha
nge]
c-MYC
Cyclin D1
p-JNK
Actin
HA-CYLD
40
20
60
Pro
lifer
atio
n
[
%]
Ctrl HA-CYLDH
A-C
YL
DB
PL
C
Hu
h7
PL
C
Hu
h7
Ctr
l
HA
-CY
LD
Ctr
l
PLC Huh7
PLC Huh7
HA
-CY
LD
Ctr
l
HA
-CY
LD
Ctr
l
80
100
120
**
PLC Huh7
HA
-CY
LD
Ctr
l
HA
-CY
LD
Ctr
l
1.0
0.5
1.5
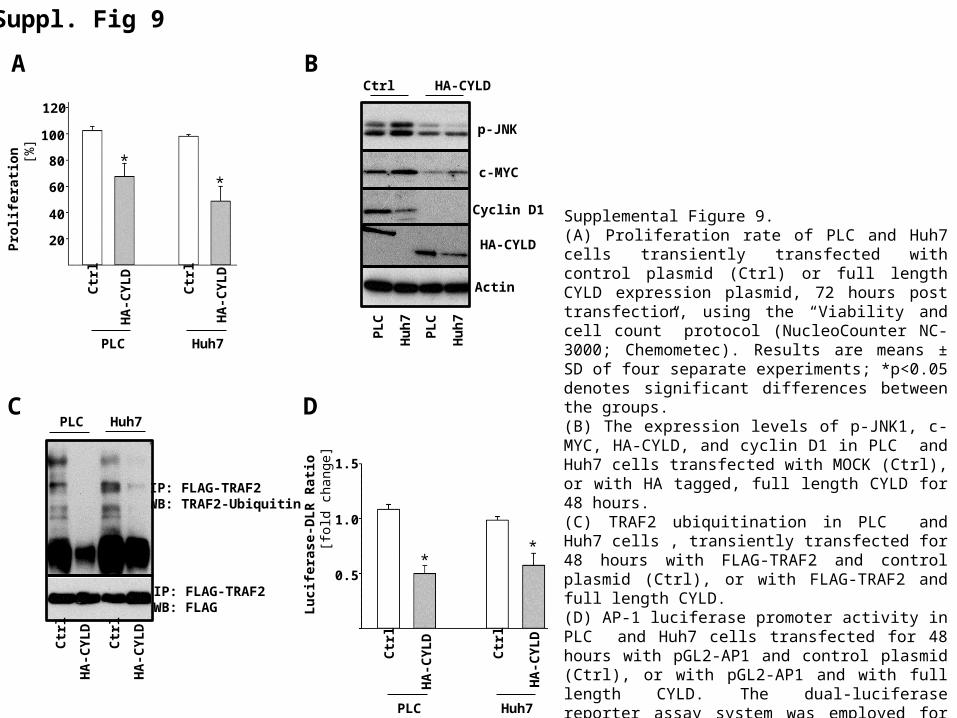
Supplemental Figure 9.(A) Proliferation rate of PLC and Huh7 cells transiently transfected with control plasmid (Ctrl) or full length CYLD expression plasmid, 72 hours post transfection, using the “Viability and cell count” protocol (NucleoCounter NC-3000; Chemometec). Results are means ± SD of four separate experiments; *p<0.05 denotes significant differences between the groups.(B) The expression levels of p-JNK1, c-MYC, HA-CYLD, and cyclin D1 in PLC and Huh7 cells transfected with MOCK (Ctrl), or with HA tagged, full length CYLD for 48 hours.(C) TRAF2 ubiquitination in PLC and Huh7 cells , transiently transfected for 48 hours with FLAG-TRAF2 and control plasmid (Ctrl), or with FLAG-TRAF2 and full length CYLD.(D) AP-1 luciferase promoter activity in PLC and Huh7 cells transfected for 48 hours with pGL2-AP1 and control plasmid (Ctrl), or with pGL2-AP1 and with full length CYLD. The dual-luciferase reporter assay system was employed for the analysis (Promega). The Promoter-driven Renilla control vector was used as an internal control to normalize the values of the experimental reporter gene. Results are means ± SD of four separate experiments; *p<0.05 denotes significant differences between the groups.
Suppl. Fig 9
**
Suppl. Fig 10
A
B
100
50
150
0Ctrl HA-CYLD
Ap
op
tosi
s
[%
]C
Ctrl HA-CYLD
Pla
tin
g e
ffic
ien
cy
[fol
d ch
ange
]
0.0
0.5
1.0
1.5
0.0
0.5
1.0
1.5
Mig
rati
on
[a
rea
units
]
Ctrl HA-CYLD
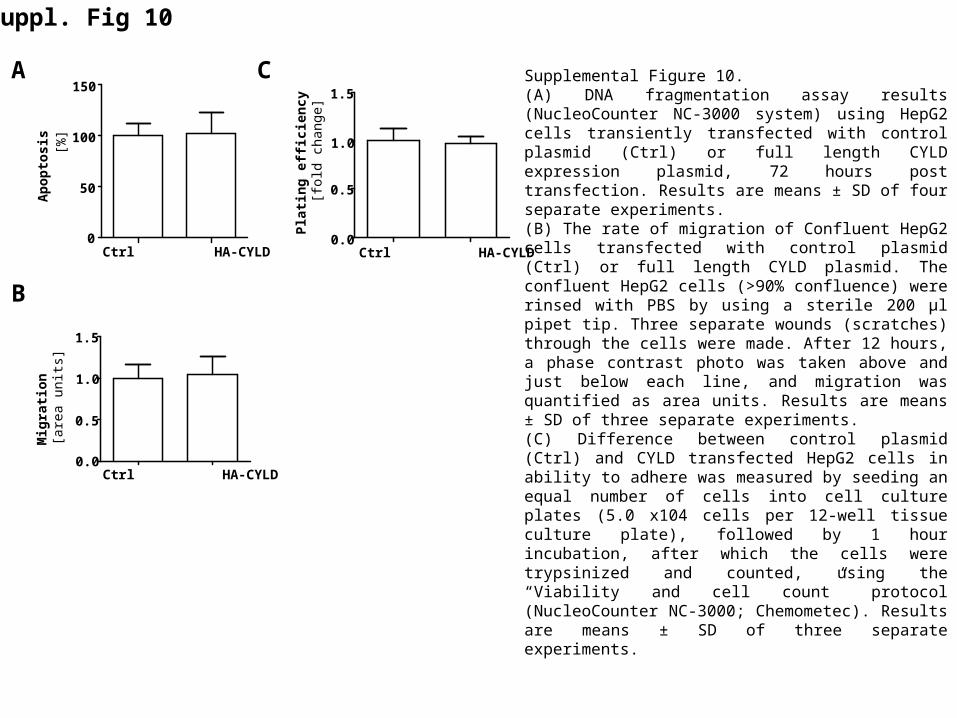
Supplemental Figure 10. (A) DNA fragmentation assay results (NucleoCounter NC-3000 system) using HepG2 cells transiently transfected with control plasmid (Ctrl) or full length CYLD expression plasmid, 72 hours post transfection. Results are means ± SD of four separate experiments.(B) The rate of migration of Confluent HepG2 cells transfected with control plasmid (Ctrl) or full length CYLD plasmid. The confluent HepG2 cells (>90% confluence) were rinsed with PBS by using a sterile 200 μl pipet tip. Three separate wounds (scratches) through the cells were made. After 12 hours, a phase contrast photo was taken above and just below each line, and migration was quantified as area units. Results are means ± SD of three separate experiments.(C) Difference between control plasmid (Ctrl) and CYLD transfected HepG2 cells in ability to adhere was measured by seeding an equal number of cells into cell culture plates (5.0 x10⁴ cells per 12-well tissue culture plate), followed by 1 hour incubation, after which the cells were trypsinized and counted, using the “Viability and cell count” protocol (NucleoCounter NC-3000; Chemometec). Results are means ± SD of three separate experiments.

C
A
c-MYC
Actin
Ctrl c-MYC siRNAP
LC
Hu
h7
PL
C
Hu
h7
Lu
cife
rase
-DL
R R
atio
[
fold
cha
nge]
1.0
0.5
1.5
B
40
20
60
Pro
lifer
atio
n
[
%]
80
100
PLC Huh7
C-M
YC
siR
NA
Ctr
l
C-M
YC
siR
NA
Ctr
l
**
PLC Huh7
HA
-CY
LD
Ctr
l
HA
-CY
LD
Ctr
l
* *
Supplemental Figure 11.(A). Expression levels of c-MYC protein in PLC and Huh7 after transient transfection for 48 hours with control (Ctrl) or c-MYC siRNA oligos.(B) Evaluation of proliferation rate in PLC and Huh7 cells 48 hours after being transiently transfected with control (Ctrl) or c-MYC siRNA oligos, using the “Viability and cell count” protocol (NucleoCounter NC-3000; Chemometec). Results are means ± SD of three separate experiments; *p<0.05 denotes significant differences between the groups.(C). c-MYC luciferase promoter activity in PLC and Huh7 cells transfected for 48 hours with c-MYC promoter luciferase and control plasmid (Ctrl), or with c-MYC promoter luciferase and full length CYLD. The dual-luciferase reporter assay system was applied for the analysis (Promega). The Promoter-driven Renilla control vector was used as an internal control to normalize the values of the experimental reporter gene. Results are means ± SD of three separate experiments; *p<0.05 denotes significant differences between the groups.
Suppl. Fig 11
Suppl. Fig 12
c-MYC High c-MYC Low
40X 40X
400X
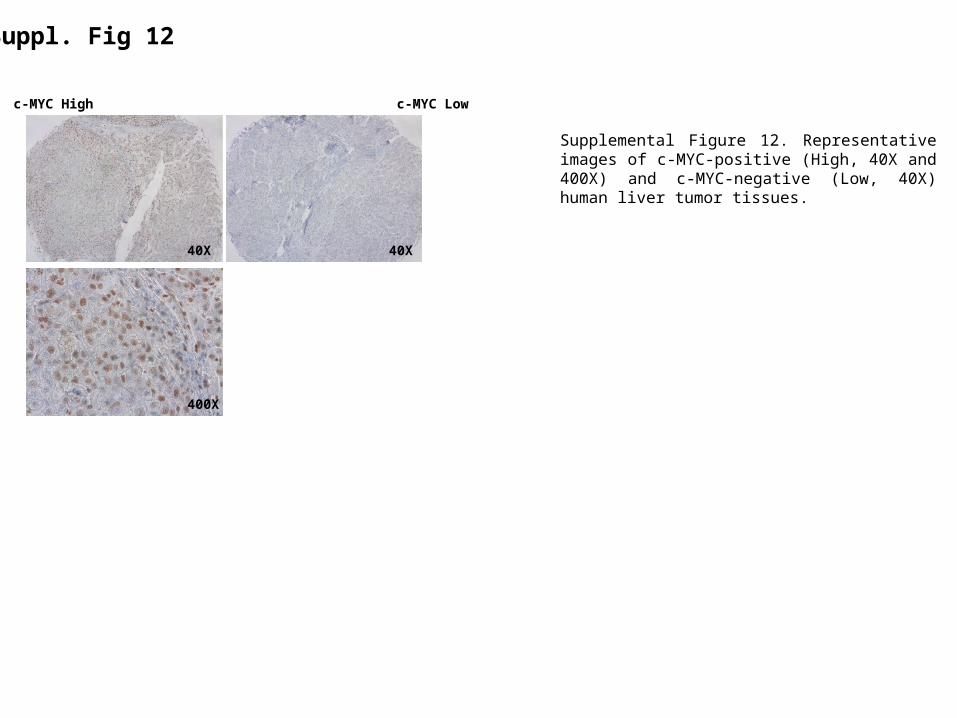
Supplemental Figure 12. Representative images of c-MYC-positive (High, 40X and 400X) and c-MYC-negative (Low, 40X) human liver tumor tissues.