World Fertility Patterns 2015 - Welcome to the United … Fertility Patterns 2015 World ertility...
30
World Fertility Patterns 2015 United Nations Data Booklet
Transcript of World Fertility Patterns 2015 - Welcome to the United … Fertility Patterns 2015 World ertility...

World Fertility Patterns 2015 United Nations
Data Booklet

2
Fertility patterns in the world have changed dramatically over the last few decades. Global fertility has reached unprecedented low levels, yet stark differences persist in childbearing patterns across countries and regions. The population and development implications of these diverse fertility patterns are directly relevant for the implementation of the 2030 Agenda for Sustainable Development and policymaking and planning in all countries.
This data booklet presents selected findings drawn from the latest fertility estimates and projections as published in World Population Prospects: The 2015 Revision. All information is available at www.unpopulation.org.
Suggested citation: United Nations, Department of Economic and Social Affairs, Population Division (2015). World Fertility Patterns 2015 – Data Booklet (ST/ESA/SER.A/370).
Cover photo: Dominic Chavez/World Bank(2014) “Refugees receiving care at a hospital in the Ifo 2 Refugee Camp in Dadaab”
World Fertility Patterns 2015

3World Fertility Patterns 2015
Global fertility is now 2.5 children per woman
According to the results of the 2015 Revision of World Population Prospects, total fertility is now 2.5 children per woman globally.
This global average masks wide regional differences. Africa remains the region with the highest fertility at 4.7 children per woman. Europe has the lowest fertility of 1.6 children per woman. Both Asia and Latin America and the Caribbean have total fertility of 2.2 chil-dren per woman, closely followed by Oceania with 2.4 children per woman.
Middle and Western Africa stand out as having particularly high fertility of over five children per woman. Eastern Asia, Eastern Europe and Southern Europe have very low fertility at under 1.6 children per woman.
0
1
2
3
4
5
6
Child
ren
per w
oman
Africa4.7
Asia2.2
Europe1.6
Latin Americaand theCaribbean 2.2 Oceania
2.4
World2.5
NorthernAmerica1.9
Easte
rn Af
rica
Midd
le Af
rica
North
ern A
frica
Sout
hern
Afric
a
Wes
tern
Afric
a
Easte
rn As
ia
Cent
ral A
sia
Sout
hern
Asia
Sout
h-Ea
stern
Asia
Wes
tern
Asia
Easte
rn Eu
rope
North
ern E
urop
e
Sout
hern
Euro
pe
Wes
tern
Euro
pe
Carib
bean
Cent
ral A
mer
ica
Sout
h Am
erica
North
ern A
mer
ica
Austr
alia a
nd N
ew Ze
aland
Mela
nesia
Micr
ones
ia
Polyn
esia
Total fertility by region and major area, 2010-2015

4 World Fertility Patterns 2015
Fertility was high in most countries in the world in 1990-1995
The boundaries and names shown and the designations used on the this map do not imply official endorsement or acceptance by the United Nations. Dotted line represents approximately the Line of Control in Jammu and Kashmir agreeed upon by India and Pakistan. The final status of Jammu and Kashmir has not yet been agreed upon by the parties. Final Boundary between the Republic of Sudan and the Republic of South Sudan has not yet been determined.
Total fertility
4 or more
2.1 to less than 4.0
1.5 to less than 2.1
Less than 1.5
No data
Total fertility (children per woman) 1990-1995

5World Fertility Patterns 2015
Fertility has declined but remains high in sub-Saharan Africa
The boundaries and names shown and the designations used on the this map do not imply official endorsement or acceptance by the United Nations. Dotted line represents approximately the Line of Control in Jammu and Kashmir agreeed upon by India and Pakistan. The final status of Jammu and Kashmir has not yet been agreed upon by the parties. Final Boundary between the Republic of Sudan and the Republic of South Sudan has not yet been determined.
Total fertility
4 or more
2.1 to less than 4.0
1.5 to less than 2.1
Less than 1.5
No data
Total fertility (children per woman) 2010-2015

6 World Fertility Patterns 2015
Nearly half the world lives in below-replacement level fertility countries
Today, 46 per cent of the world’s population lives in countries with low levels of fertility, where women have fewer than 2.1 children on average.
Low-fertility countries now include all of Europe and Northern America, as well as many countries in Asia and Latin America and the Caribbean.
Another 46 per cent of the world’s population lives in “intermediate-
fertility” countries that have already experienced substantial fertility declines and where women have on average between 2.1 and 5 children.
The remaining 8 per cent of the world’s population lives in “high-fertility” countries that have experienced only limited fertility decline to date. In these countries the average woman has five or more children over her lifetime. Most of these countries are in sub-Saharan Africa.
Total fertility and proportion of global population, 1970-1975 to 2025-2030
0
1
2
3
4
5
6
7
8
9
0% 20% 40% 60% 80% 100%
1970-1975Gloval average children per woman = 4.5
1990-1995Global average children per woman = 3.0
2010-2015Global average children per woman = 2.5
2025-2030Global average children per woman = 2.4
China
China
Sri Lanka
India
India
India
India ChinaUSA
USA*
Niger
YemenRwanda
Rwanda
Rwanda
Rwanda
NigeriaNigeria
Nigeria
Nigeria
Iran
Iran
Iran
Niger
EgyptIndonesia
ThailandBrazil
Republic of Korea
Sri Lanka
SpainChina, Hong Kong SAR
FranceRussia USA
Germany Finland
PakistanGhana
Nepal
DRC*Uganda
Malawi
MoroccoMexico
IndonesiaBrazil
China, Hong Kong SAR
TogoEthiopia
EgyptBolivia
Indonesia South AfricaTunisia
Mali
DRC*Congo
IraqKenya
Ethiopia
CambodiaIndonesia Argentina
France USA* IranQatarBrazil Thailand
Italy Italy
Niger
Child
ren
per w
oman
*Notes: DRC is Democratic Republic of Congo; USA is United States of America
7World Fertility Patterns 2015
Shifts over time in the top ten lowest and highest fertility countries or areas
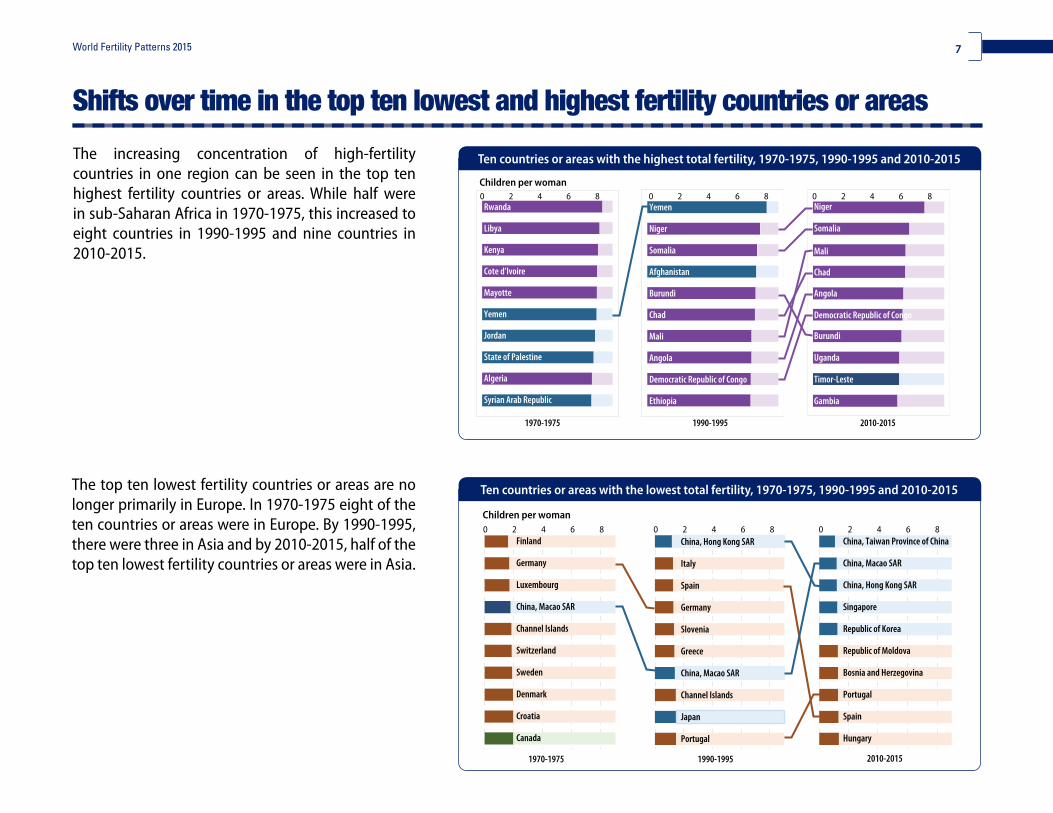
The increasing concentration of high-fertility countries in one region can be seen in the top ten highest fertility countries or areas. While half were in sub-Saharan Africa in 1970-1975, this increased to eight countries in 1990-1995 and nine countries in 2010-2015.
Children per woman 0 2 4 6 8 0 2 4 6 8
1970-1975 1990-1995 2010-2015
Ethiopia
Democratic Republic of Congo
Angola
Mali
Chad
Burundi
Afghanistan
Somalia
Niger
Yemen Niger
Somalia
Angola
Burundi
Timor-Leste
Gambia
Mali
Chad
Uganda
0 2 4 6 8
Democratic Republic of Congo
Cote d’Ivoire
Syrian Arab Republic
Algeria
State of Palestine
Jordan
Yemen
Mayotte
Kenya
Libya
Rwanda
China, Macao SAR
Children per woman
1970-1975 1990-1995 2010-2015
Portugal
Japan
Channel Islands
China, Macao SAR
Greece
Slovenia
Germany
Spain
Italy
China, Hong Kong SAR China, Taiwan Province of China
China, Macao SAR
Republic of Korea
Republic of Moldova
Bosnia and Herzegovina
Spain
Hungary
China, Hong Kong SAR
Singapore
Portugal
Canada
Croatia
Denmark
Sweden
Switzerland
Channel Islands
Luxembourg
Germany
Finland 0 2 4 6 8 0 2 4 6 8 0 2 4 6 8
Ten countries or areas with the highest total fertility, 1970-1975, 1990-1995 and 2010-2015
Ten countries or areas with the lowest total fertility, 1970-1975, 1990-1995 and 2010-2015The top ten lowest fertility countries or areas are no longer primarily in Europe. In 1970-1975 eight of the ten countries or areas were in Europe. By 1990-1995, there were three in Asia and by 2010-2015, half of the top ten lowest fertility countries or areas were in Asia.

8 World Fertility Patterns 2015
0
2
4
6
Northern America
0
2
4
6
Oceania
0
2
4
6
Latin America and the Caribbean
0
2
4
6
Europe
0
2
4
6
Africa
0
2
4
6
Asia
Child
ren p
er w
oman
Child
ren p
er w
oman
Child
ren p
er w
oman
1950 1960 1970 1980 1990 2000 2010 2020 2030 2040 2050 1950 1960 1970 1980 1990 2000 2010 2020 2030 2040 2050
1950 1960 1970 1980 1990 2000 2010 2020 2030 2040 2050 1950 1960 1970 1980 1990 2000 2010 2020 2030 2040 2050
1950 1960 1970 1980 1990 2000 2010 2020 2030 2040 2050 1950 1960 1970 1980 1990 2000 2010 2020 2030 2040 2050
Variant:
Low
High
Medium
Total fertility estimates and projections by region, 1950-2050
Fertility is projected to decline slowly in Africa
Global total fertility is projected to decline to 2.4 children per woman by 2030 and 2.2 children per woman by 2050.
In Africa, fertility is projected to decline to 3.9 children per woman by 2030 and 3.1 children per woman by 2050. Fertility declines in all other regions are projected to be much more modest and even show small increases in Europe and Northern America.
The slower projected pace of fertility decline in Africa compared with the pace experienced by Asia and Latin America and the Caribbean at similar levels of fertility has important population and development implications for Africa.

9World Fertility Patterns 2015
Sex ratios at birth are imbalanced in some countries, especially in Asia
The standard biological sex ratio at birth is around 104 to 106 boys per 100 girls. Sex ratios above this range indicate the use of practices and methods, including sex-selective abortion, to realize strong pref-erences for sons.
The current sex ratios among children will have a lasting impact on population dynamics with men of marriageable age already outnum-bering women in many countries, especially in Asia which has nine out of the ten countries or areas with the highest sex ratio at birth.
China
Azerbaijan
Armenia
Viet Nam
India
Georgia
Maldives
Pakistan
Samoa
105
116.0 boys per 100 girls
115.8 boys per 100 girls
113.8 boys per 100 girls
112.0 boys per 100 girls
110.9 boys per 100 girls
110.6 boys per 100 girls
110.4 boys per 100 girls
109.0 boys per 100 girls
108.7 boys per 100 girls
108.0 boys per 100 girls
China, TaiwanProvince of China
Ten countries or areas with highest sex ratio at birth, 2010-2015

10 World Fertility Patterns 2015
Each woman in the world is replacing herself with just over one surviving daughter on average
The net reproduction rate is the average number of daughters that would be born to a woman taking into account the prevailing levels of fertility, female mortality and the sex ratio at birth. When the net reproduction rate is one, each woman is exactly replacing herself with one surviving daughter and this implies that fertility is at replacement level.
Where more boys than expected are born com-pared with girls, the net reproduction rate will be lower than expected for a given fertility rate and the long-term population growth rate will be lower as a result. This is the case in many countries in Asia.
Globally, the net reproduction rate is 1.1 surviving daughters per woman. In all regions in the world, the net reproduction rate is at or below this level, ex-cept for Africa, where the net reproduction rate is 1.9. This means that, on average, each African mother is replacing herself with nearly two daughters, which leads to fast population growth.
1.1
1.0
0.8
1.0 0.9
1.1
0
1
2
World Africa Asia Europe Latin Americaand the
Caribbean
NorthernAmerica
Oceania
Num
ber o
f sur
vivin
g dau
ghte
rs pe
r wom
an
1.9
Net reproduction rate, world and by region, 2010-2015

11World Fertility Patterns 2015
Africa remains the region with the highest adolescent birth rate
The adolescent birth rate is the number of births per 1,000 women ages 15 to 19. Early childbearing pos-es increased health risks to adolescent mothers and reduces the education and employment opportunities that adolescent girls might have had otherwise.
0
20
40
60
80
100
120
140
Africa Asia Europe Latin Americaand the Caribbean
NorthernAmerica
Oceania
1990-1995
2010-2015
Birth
s per
1,00
0 wom
en ag
ed 15
-19
0 50 100 150 200 250 0 50 100 150 200 2500 50 100 150 200 250 0 50 100 150 200 250
Adolescent birth rate (births per 1,000 women aged 15-19)
Dem People’s Rep of Korea Dem People’s Rep of Korea
Japan Republic of Korea
Republic of Korea Switzerland
Switzerland China, Hong Kong SAR
China, Macao SAR China, Macao SAR
China, Hong Kong SAR Singapore
Netherlands Denmark
Italy Slovenia
Libya Netherlands
Singapore Japan
Angola
Niger
Chad
Uganda
Mali
Mozambique
Gabon
Guinea
Cameroon
Sierra Leone
Niger
Mali
Angola
Mozambique
Chad
Guinea
Malawi
Cote d’Ivoire
Uganda
Congo
1990-1995 2010-2015 1990-1995 2010-2015
Adolescent birth rate by region, 1990-1995 and 2010-2015
The trend in adolescent fertility has been downward in all regions but there are very sharp differences in levels and trends. Africa has the highest adolescent birth rate and the decline over time has been slow. High adolescent fertility also persists in Latin America and the Caribbean.
Ten countries or areas with the lowest adolescent birth rates, 1990-1995
and 2010-2015
Ten countries or areas with the highest adolescent birth rates, 1990-1995
and 2010-2015

12 World Fertility Patterns 2015
Adolescent birth rates were high in 1990-1995, especially in sub-Saharan Africa
Adolescent birth rate
100 or more
60 to less than 100
30 to less than 60
Less than 30
No data
The boundaries and names shown and the designations used on the this map do not imply official endorsement or acceptance by the United Nations. Dotted line represents approximately the Line of Control in Jammu and Kashmir agreeed upon by India and Pakistan. The final status of Jammu and Kashmir has not yet been agreed upon by the parties. Final Boundary between the Republic of Sudan and the Republic of South Sudan has not yet been determined.
Adolescent birth rate 1990-1995

13World Fertility Patterns 2015
Adolescents are having fewer children in most countries of the world
Adolescent birth rate
100 or more
60 to less than 100
30 to less than 60
Less than 30
No data
The boundaries and names shown and the designations used on the this map do not imply official endorsement or acceptance by the United Nations. Dotted line represents approximately the Line of Control in Jammu and Kashmir agreeed upon by India and Pakistan. The final status of Jammu and Kashmir has not yet been agreed upon by the parties. Final Boundary between the Republic of Sudan and the Republic of South Sudan has not yet been determined.
Adolescent birth rate 2010-2015

14 World Fertility Patterns 2015
In Africa, Asia, and Latin America and the Caribbean, the greater proportional decline of childbearing of women at older ages has led to a decreasing mean age at childbearing.
In Europe and Northern America, where fertility was already relatively low by 1970-1975, the postponement of childbearing has led to an increasing mean age at childbearing.
26 27 28 29 30
Africa
Asia
1970-1975
1990-1995
2010-2015 Europe
Latin Americaand the Caribbean
Northern America
Oceania
Mean age at childbearing (years)
Mean age at childbearing by region, 1970-1975, 1990-1995 and 2010-2015
Mean age at childbearing decreased in regions where fertility was declining
15World Fertility Patterns 2015
Countries can differ greatly in the age pattern of childbearing
0
50.0
100.0
150.0
200.0
250.0
15-19 20-24 25-29 30-34 35-39 40-44 45-49
Birth
s per
1,00
0 wom
en
Total fertility = 1.3
Republic of Korea Republic of Moldova
0
50.0
100.0
150.0
200.0
250.0
15-19 20-24 25-29 30-34 35-39 40-44 45-49
Birth
s per
1,00
0 birt
hs
Total fertility = 1.8
Belgium Brazil
0
50.0
100.0
150.0
200.0
250.0
15-19 20-24 25-29 30-34 35-39 40-44 45-49
Birth
s per
1,00
0 wom
en
Total fertility = 2.5
India Libya
0
50.0
100.0
150.0
200.0
250.0
15-19 20-24 25-29 30-34 35-39 40-44 45-49
Birth
s per
1,00
0 wom
en
Total fertility = 3.5-3.6
Namibia Jordan
0
50.0
100.0
150.0
200.0
250.0
15-19 20-24 25-29 30-34 35-39 40-44 45-49
Birth
s per
1,00
0 wom
en
Total fertility = 4.2-4.3
Samoa Ghana
0
50.0
100.0
150.0
200.0
250.0
15-19 20-24 25-29 30-34 35-39 40-44 45-49
Birth
s per
1,00
0 wom
en
Total fertility = 5.1
Côte d'Ivoire Afghanistan
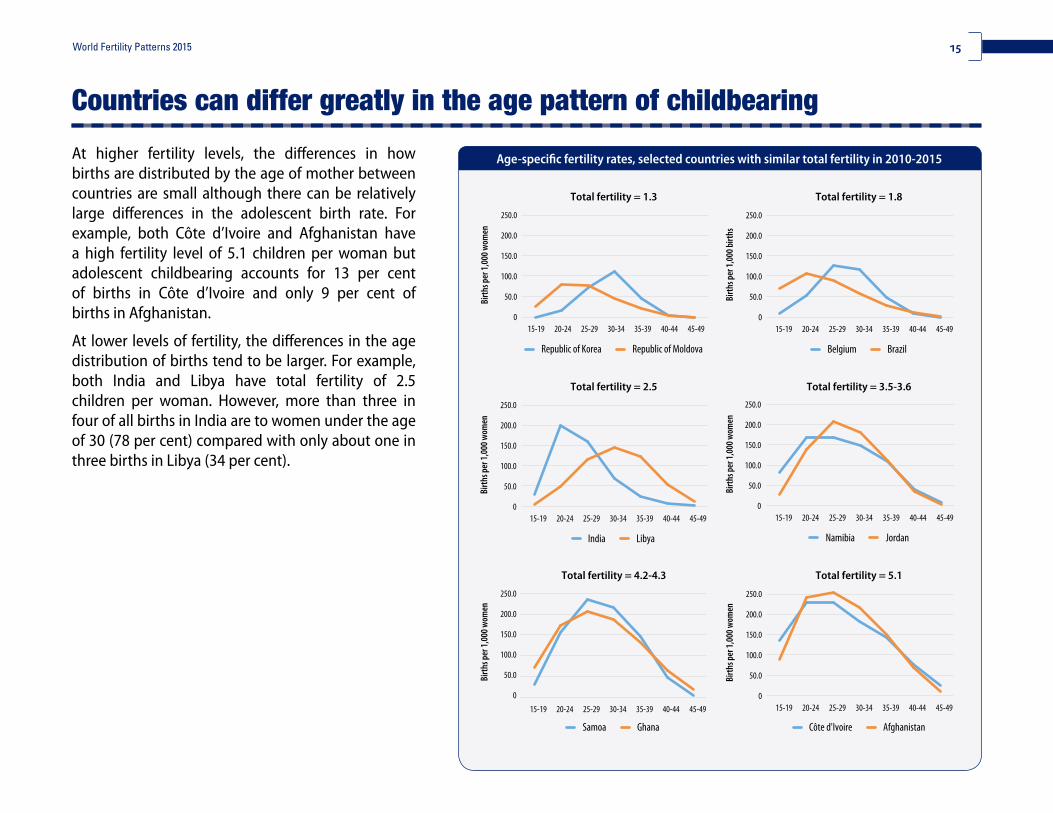
Age-specific fertility rates, selected countries with similar total fertility in 2010-2015At higher fertility levels, the differences in how births are distributed by the age of mother between countries are small although there can be relatively large differences in the adolescent birth rate. For example, both Côte d’Ivoire and Afghanistan have a high fertility level of 5.1 children per woman but adolescent childbearing accounts for 13 per cent of births in Côte d’Ivoire and only 9 per cent of births in Afghanistan.
At lower levels of fertility, the differences in the age distribution of births tend to be larger. For example, both India and Libya have total fertility of 2.5 children per woman. However, more than three in four of all births in India are to women under the age of 30 (78 per cent) compared with only about one in three births in Libya (34 per cent).

16 World Fertility Patterns 2015
Total fertility (children per woman)
Net reproduction rate
Adolescent birth rate (births per thousand women aged 15-19)
Share of total fertility by women under age 20 (per cent)
Age-specific fertility rate 2010-2015 (births per thousand women in age group)
Country or area 1970-1975 1990-1995 2010-2015 2025-2030 Trends 2010-2015 1970-1975 1990-1995 2010-2015 2025-2030 Trends Country or area 2010-2015 15-19 20-24 25-29 30-34 35-39 40-44 45-49 Age distribution
World 4.5 3.0 2.5 2.4 1.1 75 65 46 37 World 9 46 149 144 95 48 16 4
More developed regions a 2.2 1.7 1.7 1.8 0.8 39 34 19 9 More developed regions a 6 19 65 98 93 47 10 1
Less developed regions b 5.4 3.4 2.6 2.5 1.2 85 71 50 40 Less developed regions b 9 50 162 152 95 48 17 5
Least developed countries c 6.7 5.8 4.3 3.5 1.8 152 133 97 72 Least developed countries c 11 97 210 211 163 108 49 16
Other less developed countries d 5.2 3.1 2.4 2.2 1.0 77 61 39 31 Other less developed countries d 8 39 153 142 84 40 13 3
Less developed regions, excluding China 5.7 4.0 3.0 2.6 1.3 110 89 59 46 Less developed regions, excluding China 10 59 171 164 110 62 23 7
High-income countries e 2.3 1.8 1.7 1.8 0.8 41 34 22 13 High-income countries e 6 22 66 101 98 51 11 1
Middle-income countries e 5.2 3.2 2.4 2.3 1.1 81 66 42 33 Middle-income countries e 9 42 156 144 84 40 14 4
Upper-middle-income countries e 4.9 2.4 1.9 1.8 0.8 52 39 30 26 Upper-middle-income countries e 8 30 126 117 62 26 8 1
Lower-middle-income countries e 5.6 4.0 2.9 2.5 1.3 113 90 50 37 Lower-middle-income countries e 9 50 180 166 103 54 20 6
Low-income countries e 6.6 6.2 4.9 3.9 2.0 134 133 103 76 Low-income countries e 11 103 229 241 193 130 61 21
Sub-Saharan Africa f 6.8 6.2 5.1 4.1 2.1 152 139 109 80 Sub-Saharan Africa f 11 109 230 243 200 142 69 25
Africa 6.7 5.7 4.7 3.9 1.9 145 122 98 73 Africa 10 98 216 229 187 131 61 21
Eastern Africa 7.1 6.4 4.9 3.9 2.1 142 134 99 67 Eastern Africa 10 99 234 242 193 131 64 25
Burundi 7.3 7.4 6.1 4.9 2.4 48 49 30 21 Burundi 2 30 233 352 285 188 102 24
Comoros 7.1 6.1 4.6 3.6 2.0 128 108 74 48 Comoros 8 74 182 210 218 139 67 30
Djibouti 6.8 5.9 3.3 2.6 1.4 53 45 23 16 Djibouti 4 23 78 147 187 148 58 18
Eritrea 6.6 6.2 4.4 3.4 1.9 115 108 61 35 Eritrea 7 61 194 220 200 132 58 15
Ethiopia 7.1 7.1 4.6 3.1 2.0 119 118 67 33 Ethiopia 7 67 203 224 193 132 68 30
Kenya 8.0 5.6 4.4 3.6 1.9 181 114 94 75 Kenya 11 94 221 221 163 112 46 31
Madagascar 7.3 6.1 4.5 3.7 2.0 163 150 123 91 Madagascar 14 123 222 222 163 107 51 12
Malawi 7.4 6.7 5.3 4.2 2.2 197 164 140 114 Malawi 13 140 252 220 190 140 81 27
Mauritius 1 3.5 2.2 1.5 1.5 0.7 56 43 29 26 Mauritius 1 10 29 75 92 66 29 7 0
Mayotte 7.9 5.3 4.1 3.2 2.0 186 90 62 46 Mayotte 8 62 183 188 178 132 62 15
Mozambique 6.6 6.1 5.5 4.5 2.2 127 189 154 95 Mozambique 14 154 243 231 197 155 77 33
Réunion 3.9 2.4 2.2 2.0 1.1 62 51 42 48 Réunion 9 42 98 129 110 54 16 1
Rwanda 8.3 6.6 4.1 3.0 1.8 75 59 30 16 Rwanda 4 30 166 231 182 120 66 13
Seychelles 5.4 2.6 2.3 2.0 1.1 146 68 60 47 Seychelles 13 60 118 133 93 50 11 1
Somalia 7.1 7.5 6.6 5.2 2.6 54 102 110 78 Somalia 8 110 274 325 258 189 107 59
South Sudan 6.9 6.7 5.2 4.0 2.0 148 136 78 34 South Sudan 8 78 224 279 209 123 75 43
Uganda 7.1 7.1 5.9 4.6 2.4 182 201 127 69 Uganda 11 127 317 303 221 137 55 24
United Republic of Tanzania 2 6.8 6.1 5.2 4.3 2.3 155 140 123 98 United Republic of Tanzania 2 12 123 262 257 200 131 61 13
Zambia 7.4 6.4 5.5 4.6 2.2 189 163 103 56 Zambia 9 103 267 265 210 152 72 20
Zimbabwe 7.4 4.8 4.0 3.1 1.7 174 111 113 90 Zimbabwe 14 113 203 188 149 103 38 9
Middle Africa 6.5 6.8 5.8 4.6 2.3 180 164 133 98 Middle Africa 11 133 264 281 227 162 76 20
Angola 7.4 7.2 6.2 5.0 2.3 234 227 176 121 Angola 14 176 319 324 223 129 59 10
Cameroon 6.3 6.2 4.8 3.8 1.9 190 178 116 70 Cameroon 12 116 219 244 193 126 49 16

17World Fertility Patterns 2015
Total fertility (children per woman)
Net reproduction rate
Adolescent birth rate (births per thousand women aged 15-19)
Share of total fertility by women under age 20 (per cent)
Age-specific fertility rate 2010-2015 (births per thousand women in age group)
Country or area 1970-1975 1990-1995 2010-2015 2025-2030 Trends 2010-2015 1970-1975 1990-1995 2010-2015 2025-2030 Trends Country or area 2010-2015 15-19 20-24 25-29 30-34 35-39 40-44 45-49 Age distribution
World 4.5 3.0 2.5 2.4 1.1 75 65 46 37 World 9 46 149 144 95 48 16 4
More developed regions a 2.2 1.7 1.7 1.8 0.8 39 34 19 9 More developed regions a 6 19 65 98 93 47 10 1
Less developed regions b 5.4 3.4 2.6 2.5 1.2 85 71 50 40 Less developed regions b 9 50 162 152 95 48 17 5
Least developed countries c 6.7 5.8 4.3 3.5 1.8 152 133 97 72 Least developed countries c 11 97 210 211 163 108 49 16
Other less developed countries d 5.2 3.1 2.4 2.2 1.0 77 61 39 31 Other less developed countries d 8 39 153 142 84 40 13 3
Less developed regions, excluding China 5.7 4.0 3.0 2.6 1.3 110 89 59 46 Less developed regions, excluding China 10 59 171 164 110 62 23 7
High-income countries e 2.3 1.8 1.7 1.8 0.8 41 34 22 13 High-income countries e 6 22 66 101 98 51 11 1
Middle-income countries e 5.2 3.2 2.4 2.3 1.1 81 66 42 33 Middle-income countries e 9 42 156 144 84 40 14 4
Upper-middle-income countries e 4.9 2.4 1.9 1.8 0.8 52 39 30 26 Upper-middle-income countries e 8 30 126 117 62 26 8 1
Lower-middle-income countries e 5.6 4.0 2.9 2.5 1.3 113 90 50 37 Lower-middle-income countries e 9 50 180 166 103 54 20 6
Low-income countries e 6.6 6.2 4.9 3.9 2.0 134 133 103 76 Low-income countries e 11 103 229 241 193 130 61 21
Sub-Saharan Africa f 6.8 6.2 5.1 4.1 2.1 152 139 109 80 Sub-Saharan Africa f 11 109 230 243 200 142 69 25
Africa 6.7 5.7 4.7 3.9 1.9 145 122 98 73 Africa 10 98 216 229 187 131 61 21
Eastern Africa 7.1 6.4 4.9 3.9 2.1 142 134 99 67 Eastern Africa 10 99 234 242 193 131 64 25
Burundi 7.3 7.4 6.1 4.9 2.4 48 49 30 21 Burundi 2 30 233 352 285 188 102 24
Comoros 7.1 6.1 4.6 3.6 2.0 128 108 74 48 Comoros 8 74 182 210 218 139 67 30
Djibouti 6.8 5.9 3.3 2.6 1.4 53 45 23 16 Djibouti 4 23 78 147 187 148 58 18
Eritrea 6.6 6.2 4.4 3.4 1.9 115 108 61 35 Eritrea 7 61 194 220 200 132 58 15
Ethiopia 7.1 7.1 4.6 3.1 2.0 119 118 67 33 Ethiopia 7 67 203 224 193 132 68 30
Kenya 8.0 5.6 4.4 3.6 1.9 181 114 94 75 Kenya 11 94 221 221 163 112 46 31
Madagascar 7.3 6.1 4.5 3.7 2.0 163 150 123 91 Madagascar 14 123 222 222 163 107 51 12
Malawi 7.4 6.7 5.3 4.2 2.2 197 164 140 114 Malawi 13 140 252 220 190 140 81 27
Mauritius 1 3.5 2.2 1.5 1.5 0.7 56 43 29 26 Mauritius 1 10 29 75 92 66 29 7 0
Mayotte 7.9 5.3 4.1 3.2 2.0 186 90 62 46 Mayotte 8 62 183 188 178 132 62 15
Mozambique 6.6 6.1 5.5 4.5 2.2 127 189 154 95 Mozambique 14 154 243 231 197 155 77 33
Réunion 3.9 2.4 2.2 2.0 1.1 62 51 42 48 Réunion 9 42 98 129 110 54 16 1
Rwanda 8.3 6.6 4.1 3.0 1.8 75 59 30 16 Rwanda 4 30 166 231 182 120 66 13
Seychelles 5.4 2.6 2.3 2.0 1.1 146 68 60 47 Seychelles 13 60 118 133 93 50 11 1
Somalia 7.1 7.5 6.6 5.2 2.6 54 102 110 78 Somalia 8 110 274 325 258 189 107 59
South Sudan 6.9 6.7 5.2 4.0 2.0 148 136 78 34 South Sudan 8 78 224 279 209 123 75 43
Uganda 7.1 7.1 5.9 4.6 2.4 182 201 127 69 Uganda 11 127 317 303 221 137 55 24
United Republic of Tanzania 2 6.8 6.1 5.2 4.3 2.3 155 140 123 98 United Republic of Tanzania 2 12 123 262 257 200 131 61 13
Zambia 7.4 6.4 5.5 4.6 2.2 189 163 103 56 Zambia 9 103 267 265 210 152 72 20
Zimbabwe 7.4 4.8 4.0 3.1 1.7 174 111 113 90 Zimbabwe 14 113 203 188 149 103 38 9
Middle Africa 6.5 6.8 5.8 4.6 2.3 180 164 133 98 Middle Africa 11 133 264 281 227 162 76 20
Angola 7.4 7.2 6.2 5.0 2.3 234 227 176 121 Angola 14 176 319 324 223 129 59 10
Cameroon 6.3 6.2 4.8 3.8 1.9 190 178 116 70 Cameroon 12 116 219 244 193 126 49 16

18 World Fertility Patterns 2015
Total fertility (children per woman)
Net reproduction rate
Adolescent birth rate (births per thousand women aged 15-19)
Share of total fertility by women under age 20 (per cent)
Age-specific fertility rate 2010-2015 (births per thousand women in age group)
Country or area 1970-1975 1990-1995 2010-2015 2025-2030 Trends 2010-2015 1970-1975 1990-1995 2010-2015 2025-2030 Trends Country or area 2010-2015 15-19 20-24 25-29 30-34 35-39 40-44 45-49 Age distribution
Middle Africa (continued) Middle Africa (continued)
Central African Republic 6.0 5.7 4.4 3.3 1.6 175 143 98 67 Central African Republic 11 98 191 202 161 113 61 55
Chad 6.7 7.4 6.3 4.8 2.3 209 218 152 79 Chad 12 152 324 321 252 147 54 13
Congo 6.4 5.2 5.0 4.1 2.1 147 130 125 90 Congo 13 125 244 232 186 125 60 18
Dem. Republic of the Congo 6.3 7.1 6.2 4.8 2.5 156 133 124 105 Dem. Republic of the Congo 10 124 260 285 247 195 96 23
Equatorial Guinea 5.7 5.9 5.0 3.7 2.0 130 134 114 82 Equatorial Guinea 12 114 242 249 155 122 76 35
Gabon 5.2 5.2 4.0 3.2 1.7 201 181 111 66 Gabon 14 111 166 182 165 113 55 8
São Tomé and Príncipe 6.5 5.7 4.7 3.8 2.1 137 115 89 67 São Tomé and Príncipe 9 89 202 200 191 162 83 8
Northern Africa 6.4 4.2 3.3 2.8 1.5 121 59 47 33 Northern Africa 7 47 155 176 141 92 34 9
Algeria 7.6 4.1 2.9 2.3 1.4 103 24 11 8 Algeria 2 11 92 151 147 125 52 7
Egypt 5.7 4.1 3.4 2.8 1.6 128 80 55 42 Egypt 8 55 208 195 131 67 17 4
Libya 8.1 4.2 2.5 2.0 1.2 132 8 6 6 Libya 1 6 48 116 146 124 55 11
Morocco 6.4 3.7 2.6 2.1 1.2 128 37 33 25 Morocco 7 33 99 123 118 85 41 13
Sudan 6.9 6.0 4.5 3.6 1.9 152 108 84 46 Sudan 9 84 192 243 190 112 50 21
Tunisia 6.4 3.0 2.2 1.9 1.0 43 17 7 7 Tunisia 2 7 57 123 132 88 23 2
Western Sahara 6.6 4.0 2.2 1.8 1.0 131 59 23 14 Western Sahara 5 23 78 108 104 77 38 13
Southern Africa 5.6 3.5 2.5 2.2 1.1 82 92 54 34 Southern Africa 11 54 134 136 95 57 22 6
Botswana 6.5 4.3 2.9 2.3 1.3 158 85 39 17 Botswana 7 39 138 137 117 90 45 14
Lesotho 5.8 4.7 3.3 2.6 1.3 82 86 90 90 Lesotho 14 90 175 146 112 78 44 6
Namibia 6.6 4.9 3.6 2.9 1.6 139 103 80 63 Namibia 11 80 167 168 149 108 41 9
South Africa 5.5 3.3 2.4 2.1 1.0 76 91 51 31 South Africa 11 51 129 133 90 52 19 6
Swaziland 6.9 5.3 3.4 2.6 1.3 151 125 86 39 Swaziland 13 86 177 164 127 78 28 12
Western Africa 6.8 6.4 5.5 4.6 2.1 171 146 120 93 Western Africa 11 120 232 254 222 166 83 31
Benin 6.8 6.6 4.9 3.8 2.0 93 127 90 59 Benin 9 90 226 256 204 126 56 19
Burkina Faso 6.7 6.9 5.6 4.5 2.3 169 145 115 82 Burkina Faso 10 115 249 265 226 168 83 23
Cabo Verde 6.9 4.9 2.4 1.9 1.1 116 109 75 63 Cabo Verde 16 75 120 119 78 51 28 3
Côte d'Ivoire 7.9 6.4 5.1 4.2 1.9 217 148 135 125 Côte d'Ivoire 13 135 229 230 182 142 77 25
Gambia 6.2 6.1 5.8 4.9 2.4 216 153 116 95 Gambia 10 116 244 268 235 168 83 42
Ghana 6.9 5.3 4.2 3.5 1.8 142 104 70 53 Ghana 8 70 174 208 187 130 63 19
Guinea 6.3 6.5 5.1 4.0 2.1 181 180 146 114 Guinea 14 146 209 225 201 142 76 28
Guinea-Bissau 6.1 6.5 5.0 3.9 1.9 108 138 99 59 Guinea-Bissau 10 99 211 248 203 144 62 23
Liberia 6.8 6.3 4.8 3.9 2.0 214 161 117 79 Liberia 12 117 217 229 188 129 65 21
Mali 7.2 7.2 6.4 5.0 2.5 194 196 179 145 Mali 14 179 264 284 240 173 92 38
Mauritania 6.7 5.9 4.7 3.9 2.0 121 106 82 63 Mauritania 9 82 171 211 201 159 83 31
Niger 7.5 7.7 7.6 6.7 3.1 214 222 208 168 Niger 14 208 334 326 287 220 102 49
Nigeria 6.6 6.4 5.7 4.7 2.1 168 143 117 86 Nigeria 10 117 235 260 232 178 91 35
Senegal 7.4 6.3 5.2 4.2 2.3 188 126 87 53 Senegal 8 87 209 244 225 172 81 18
Sierra Leone 6.1 6.6 4.8 3.4 1.8 191 176 125 86 Sierra Leone 13 125 212 216 178 132 65 30
Togo 7.2 6.0 4.7 3.8 2.0 145 110 92 84 Togo 10 92 210 240 182 133 64 17
19World Fertility Patterns 2015
Total fertility (children per woman)
Net reproduction rate
Adolescent birth rate (births per thousand women aged 15-19)
Share of total fertility by women under age 20 (per cent)
Age-specific fertility rate 2010-2015 (births per thousand women in age group)
Country or area 1970-1975 1990-1995 2010-2015 2025-2030 Trends 2010-2015 1970-1975 1990-1995 2010-2015 2025-2030 Trends Country or area 2010-2015 15-19 20-24 25-29 30-34 35-39 40-44 45-49 Age distribution
Middle Africa (continued) Middle Africa (continued)
Central African Republic 6.0 5.7 4.4 3.3 1.6 175 143 98 67 Central African Republic 11 98 191 202 161 113 61 55
Chad 6.7 7.4 6.3 4.8 2.3 209 218 152 79 Chad 12 152 324 321 252 147 54 13
Congo 6.4 5.2 5.0 4.1 2.1 147 130 125 90 Congo 13 125 244 232 186 125 60 18
Dem. Republic of the Congo 6.3 7.1 6.2 4.8 2.5 156 133 124 105 Dem. Republic of the Congo 10 124 260 285 247 195 96 23
Equatorial Guinea 5.7 5.9 5.0 3.7 2.0 130 134 114 82 Equatorial Guinea 12 114 242 249 155 122 76 35
Gabon 5.2 5.2 4.0 3.2 1.7 201 181 111 66 Gabon 14 111 166 182 165 113 55 8
São Tomé and Príncipe 6.5 5.7 4.7 3.8 2.1 137 115 89 67 São Tomé and Príncipe 9 89 202 200 191 162 83 8
Northern Africa 6.4 4.2 3.3 2.8 1.5 121 59 47 33 Northern Africa 7 47 155 176 141 92 34 9
Algeria 7.6 4.1 2.9 2.3 1.4 103 24 11 8 Algeria 2 11 92 151 147 125 52 7
Egypt 5.7 4.1 3.4 2.8 1.6 128 80 55 42 Egypt 8 55 208 195 131 67 17 4
Libya 8.1 4.2 2.5 2.0 1.2 132 8 6 6 Libya 1 6 48 116 146 124 55 11
Morocco 6.4 3.7 2.6 2.1 1.2 128 37 33 25 Morocco 7 33 99 123 118 85 41 13
Sudan 6.9 6.0 4.5 3.6 1.9 152 108 84 46 Sudan 9 84 192 243 190 112 50 21
Tunisia 6.4 3.0 2.2 1.9 1.0 43 17 7 7 Tunisia 2 7 57 123 132 88 23 2
Western Sahara 6.6 4.0 2.2 1.8 1.0 131 59 23 14 Western Sahara 5 23 78 108 104 77 38 13
Southern Africa 5.6 3.5 2.5 2.2 1.1 82 92 54 34 Southern Africa 11 54 134 136 95 57 22 6
Botswana 6.5 4.3 2.9 2.3 1.3 158 85 39 17 Botswana 7 39 138 137 117 90 45 14
Lesotho 5.8 4.7 3.3 2.6 1.3 82 86 90 90 Lesotho 14 90 175 146 112 78 44 6
Namibia 6.6 4.9 3.6 2.9 1.6 139 103 80 63 Namibia 11 80 167 168 149 108 41 9
South Africa 5.5 3.3 2.4 2.1 1.0 76 91 51 31 South Africa 11 51 129 133 90 52 19 6
Swaziland 6.9 5.3 3.4 2.6 1.3 151 125 86 39 Swaziland 13 86 177 164 127 78 28 12
Western Africa 6.8 6.4 5.5 4.6 2.1 171 146 120 93 Western Africa 11 120 232 254 222 166 83 31
Benin 6.8 6.6 4.9 3.8 2.0 93 127 90 59 Benin 9 90 226 256 204 126 56 19
Burkina Faso 6.7 6.9 5.6 4.5 2.3 169 145 115 82 Burkina Faso 10 115 249 265 226 168 83 23
Cabo Verde 6.9 4.9 2.4 1.9 1.1 116 109 75 63 Cabo Verde 16 75 120 119 78 51 28 3
Côte d'Ivoire 7.9 6.4 5.1 4.2 1.9 217 148 135 125 Côte d'Ivoire 13 135 229 230 182 142 77 25
Gambia 6.2 6.1 5.8 4.9 2.4 216 153 116 95 Gambia 10 116 244 268 235 168 83 42
Ghana 6.9 5.3 4.2 3.5 1.8 142 104 70 53 Ghana 8 70 174 208 187 130 63 19
Guinea 6.3 6.5 5.1 4.0 2.1 181 180 146 114 Guinea 14 146 209 225 201 142 76 28
Guinea-Bissau 6.1 6.5 5.0 3.9 1.9 108 138 99 59 Guinea-Bissau 10 99 211 248 203 144 62 23
Liberia 6.8 6.3 4.8 3.9 2.0 214 161 117 79 Liberia 12 117 217 229 188 129 65 21
Mali 7.2 7.2 6.4 5.0 2.5 194 196 179 145 Mali 14 179 264 284 240 173 92 38
Mauritania 6.7 5.9 4.7 3.9 2.0 121 106 82 63 Mauritania 9 82 171 211 201 159 83 31
Niger 7.5 7.7 7.6 6.7 3.1 214 222 208 168 Niger 14 208 334 326 287 220 102 49
Nigeria 6.6 6.4 5.7 4.7 2.1 168 143 117 86 Nigeria 10 117 235 260 232 178 91 35
Senegal 7.4 6.3 5.2 4.2 2.3 188 126 87 53 Senegal 8 87 209 244 225 172 81 18
Sierra Leone 6.1 6.6 4.8 3.4 1.8 191 176 125 86 Sierra Leone 13 125 212 216 178 132 65 30
Togo 7.2 6.0 4.7 3.8 2.0 145 110 92 84 Togo 10 92 210 240 182 133 64 17

20 World Fertility Patterns 2015
Total fertility (children per woman)
Net reproduction rate
Adolescent birth rate (births per thousand women aged 15-19)
Share of total fertility by women under age 20 (per cent)
Age-specific fertility rate 2010-2015 (births per thousand women in age group)
Country or area 1970-1975 1990-1995 2010-2015 2025-2030 Trends 2010-2015 1970-1975 1990-1995 2010-2015 2025-2030 Trends Country or area 2010-2015 15-19 20-24 25-29 30-34 35-39 40-44 45-49 Age distribution
Asia 5.1 3.0 2.2 2.0 1.0 70 56 30 22 Asia 7 30 151 138 76 32 10 2
Eastern Asia 4.4 2.0 1.6 1.6 0.7 27 16 7 6 Eastern Asia 2 7 123 111 49 15 4 1
China 3 4.9 2.0 1.6 1.7 0.7 30 17 8 7 China 3 2 8 134 113 40 11 4 1
China, Hong Kong SAR 4 3.3 1.2 1.2 1.4 0.6 18 7 4 3 China, Hong Kong SAR 4 1 4 24 57 95 52 9 0
China, Macao SAR 5 1.8 1.4 1.2 1.5 0.6 6 7 4 3 China, Macao SAR 5 1 4 40 77 65 39 14 0
China, Taiwan Province of China 3.4 1.8 1.1 1.2 0.5 37 17 4 1 China, Taiwan Province of China 2 4 23 65 81 36 5 0
Dem. People's Rep. of Korea 4.0 2.3 2.0 1.9 0.9 4 2 1 0 Dem. People's Rep. of Korea 0 1 58 209 110 18 3 0
Japan 2.1 1.5 1.4 1.6 0.7 5 4 5 3 Japan 2 5 34 87 97 48 9 0
Mongolia 7.5 3.3 2.7 2.3 1.3 83 38 19 8 Mongolia 4 19 142 164 110 69 28 3
Republic of Korea 4.3 1.7 1.3 1.4 0.6 14 4 2 1 Republic of Korea 1 2 17 71 112 44 4 0
South-Central Asia 6 5.6 4.0 2.6 2.2 1.1 114 95 38 21 South-Central Asia 6 7 38 185 159 83 34 11 3
Central Asia 4.8 3.5 2.7 2.3 1.2 39 55 26 20 Central Asia 5 26 176 170 107 47 13 1
Kazakhstan 3.5 2.6 2.6 2.3 1.2 33 54 31 19 Kazakhstan 6 31 153 156 109 62 16 1
Kyrgyzstan 4.7 3.6 3.1 2.6 1.5 43 68 42 32 Kyrgyzstan 7 42 189 175 124 70 22 3
Tajikistan 6.8 4.9 3.6 2.9 1.6 65 57 39 32 Tajikistan 6 39 216 217 145 69 22 1
Turkmenistan 6.2 4.0 2.3 2.0 1.1 30 26 18 12 Turkmenistan 4 18 129 166 106 42 7 1
Uzbekistan 5.7 3.8 2.5 2.1 1.1 38 58 18 15 Uzbekistan 4 18 182 165 94 29 7 1
Southern Asia 5.7 4.0 2.6 2.2 1.1 118 97 39 21 Southern Asia 8 39 185 158 82 34 11 4
Afghanistan 7.5 7.5 5.1 3.0 2.1 145 164 88 36 Afghanistan 9 88 240 254 215 149 68 12
Bangladesh 6.9 4.1 2.2 1.8 1.0 204 143 85 69 Bangladesh 19 85 150 113 62 25 8 3
Bhutan 6.7 5.1 2.1 1.7 1.0 110 102 28 9 Bhutan 7 28 112 125 86 44 21 4
India 5.4 3.8 2.5 2.1 1.1 109 94 30 12 India 6 30 199 159 69 26 9 3
Iran (Islamic Republic of) 6.2 4.0 1.7 1.5 0.8 136 75 29 20 Iran (Islamic Republic of) 8 29 81 103 86 39 9 2
Maldives 7.2 5.2 2.2 1.7 1.0 212 103 9 2 Maldives 2 9 120 140 108 48 11 1
Nepal 5.9 5.0 2.3 1.8 1.1 130 135 75 58 Nepal 16 75 174 110 55 30 15 3
Pakistan 6.6 5.7 3.7 2.9 1.6 110 76 41 30 Pakistan 5 41 182 224 174 85 29 9
Sri Lanka 4.0 2.4 2.1 1.9 1.0 49 29 18 8 Sri Lanka 4 18 69 141 120 57 16 2
South-eastern Asia 5.5 3.1 2.4 2.1 1.1 84 51 44 43 South-eastern Asia 9 44 120 128 99 57 19 4
Brunei Darussalam 5.9 3.3 1.9 1.7 0.9 55 44 22 18 Brunei Darussalam 6 22 79 117 90 56 16 1
Cambodia 6.2 5.1 2.7 2.3 1.2 90 67 49 54 Cambodia 9 49 163 152 103 51 17 4
Indonesia 5.3 2.9 2.5 2.1 1.2 129 63 52 41 Indonesia 10 52 130 132 103 59 18 5
Lao People's Dem. Republic 6.0 5.9 3.1 2.3 1.4 105 105 66 52 Lao People's Dem. Republic 11 66 170 178 112 68 22 4
Malaysia 7 4.6 3.4 2.0 1.8 0.9 48 19 13 15 Malaysia 7 3 13 55 117 118 70 21 2
Myanmar 5.7 3.2 2.3 2.0 1.0 91 31 18 13 Myanmar 4 18 83 119 114 81 31 5
Philippines 6.0 4.1 3.0 2.6 1.4 56 51 57 69 Philippines 9 57 148 147 127 84 37 7
Singapore 2.8 1.7 1.2 1.3 0.6 25 8 4 4 Singapore 2 4 20 74 95 46 8 0
Thailand 5.1 2.0 1.5 1.4 0.7 61 50 45 41 Thailand 15 45 81 82 63 29 7 0
Timor-Leste 5.5 5.7 5.9 4.3 2.7 58 59 52 29 Timor-Leste 4 52 241 307 272 186 88 36

21World Fertility Patterns 2015
Total fertility (children per woman)
Net reproduction rate
Adolescent birth rate (births per thousand women aged 15-19)
Share of total fertility by women under age 20 (per cent)
Age-specific fertility rate 2010-2015 (births per thousand women in age group)
Country or area 1970-1975 1990-1995 2010-2015 2025-2030 Trends 2010-2015 1970-1975 1990-1995 2010-2015 2025-2030 Trends Country or area 2010-2015 15-19 20-24 25-29 30-34 35-39 40-44 45-49 Age distribution
Asia 5.1 3.0 2.2 2.0 1.0 70 56 30 22 Asia 7 30 151 138 76 32 10 2
Eastern Asia 4.4 2.0 1.6 1.6 0.7 27 16 7 6 Eastern Asia 2 7 123 111 49 15 4 1
China 3 4.9 2.0 1.6 1.7 0.7 30 17 8 7 China 3 2 8 134 113 40 11 4 1
China, Hong Kong SAR 4 3.3 1.2 1.2 1.4 0.6 18 7 4 3 China, Hong Kong SAR 4 1 4 24 57 95 52 9 0
China, Macao SAR 5 1.8 1.4 1.2 1.5 0.6 6 7 4 3 China, Macao SAR 5 1 4 40 77 65 39 14 0
China, Taiwan Province of China 3.4 1.8 1.1 1.2 0.5 37 17 4 1 China, Taiwan Province of China 2 4 23 65 81 36 5 0
Dem. People's Rep. of Korea 4.0 2.3 2.0 1.9 0.9 4 2 1 0 Dem. People's Rep. of Korea 0 1 58 209 110 18 3 0
Japan 2.1 1.5 1.4 1.6 0.7 5 4 5 3 Japan 2 5 34 87 97 48 9 0
Mongolia 7.5 3.3 2.7 2.3 1.3 83 38 19 8 Mongolia 4 19 142 164 110 69 28 3
Republic of Korea 4.3 1.7 1.3 1.4 0.6 14 4 2 1 Republic of Korea 1 2 17 71 112 44 4 0
South-Central Asia 6 5.6 4.0 2.6 2.2 1.1 114 95 38 21 South-Central Asia 6 7 38 185 159 83 34 11 3
Central Asia 4.8 3.5 2.7 2.3 1.2 39 55 26 20 Central Asia 5 26 176 170 107 47 13 1
Kazakhstan 3.5 2.6 2.6 2.3 1.2 33 54 31 19 Kazakhstan 6 31 153 156 109 62 16 1
Kyrgyzstan 4.7 3.6 3.1 2.6 1.5 43 68 42 32 Kyrgyzstan 7 42 189 175 124 70 22 3
Tajikistan 6.8 4.9 3.6 2.9 1.6 65 57 39 32 Tajikistan 6 39 216 217 145 69 22 1
Turkmenistan 6.2 4.0 2.3 2.0 1.1 30 26 18 12 Turkmenistan 4 18 129 166 106 42 7 1
Uzbekistan 5.7 3.8 2.5 2.1 1.1 38 58 18 15 Uzbekistan 4 18 182 165 94 29 7 1
Southern Asia 5.7 4.0 2.6 2.2 1.1 118 97 39 21 Southern Asia 8 39 185 158 82 34 11 4
Afghanistan 7.5 7.5 5.1 3.0 2.1 145 164 88 36 Afghanistan 9 88 240 254 215 149 68 12
Bangladesh 6.9 4.1 2.2 1.8 1.0 204 143 85 69 Bangladesh 19 85 150 113 62 25 8 3
Bhutan 6.7 5.1 2.1 1.7 1.0 110 102 28 9 Bhutan 7 28 112 125 86 44 21 4
India 5.4 3.8 2.5 2.1 1.1 109 94 30 12 India 6 30 199 159 69 26 9 3
Iran (Islamic Republic of) 6.2 4.0 1.7 1.5 0.8 136 75 29 20 Iran (Islamic Republic of) 8 29 81 103 86 39 9 2
Maldives 7.2 5.2 2.2 1.7 1.0 212 103 9 2 Maldives 2 9 120 140 108 48 11 1
Nepal 5.9 5.0 2.3 1.8 1.1 130 135 75 58 Nepal 16 75 174 110 55 30 15 3
Pakistan 6.6 5.7 3.7 2.9 1.6 110 76 41 30 Pakistan 5 41 182 224 174 85 29 9
Sri Lanka 4.0 2.4 2.1 1.9 1.0 49 29 18 8 Sri Lanka 4 18 69 141 120 57 16 2
South-eastern Asia 5.5 3.1 2.4 2.1 1.1 84 51 44 43 South-eastern Asia 9 44 120 128 99 57 19 4
Brunei Darussalam 5.9 3.3 1.9 1.7 0.9 55 44 22 18 Brunei Darussalam 6 22 79 117 90 56 16 1
Cambodia 6.2 5.1 2.7 2.3 1.2 90 67 49 54 Cambodia 9 49 163 152 103 51 17 4
Indonesia 5.3 2.9 2.5 2.1 1.2 129 63 52 41 Indonesia 10 52 130 132 103 59 18 5
Lao People's Dem. Republic 6.0 5.9 3.1 2.3 1.4 105 105 66 52 Lao People's Dem. Republic 11 66 170 178 112 68 22 4
Malaysia 7 4.6 3.4 2.0 1.8 0.9 48 19 13 15 Malaysia 7 3 13 55 117 118 70 21 2
Myanmar 5.7 3.2 2.3 2.0 1.0 91 31 18 13 Myanmar 4 18 83 119 114 81 31 5
Philippines 6.0 4.1 3.0 2.6 1.4 56 51 57 69 Philippines 9 57 148 147 127 84 37 7
Singapore 2.8 1.7 1.2 1.3 0.6 25 8 4 4 Singapore 2 4 20 74 95 46 8 0
Thailand 5.1 2.0 1.5 1.4 0.7 61 50 45 41 Thailand 15 45 81 82 63 29 7 0
Timor-Leste 5.5 5.7 5.9 4.3 2.7 58 59 52 29 Timor-Leste 4 52 241 307 272 186 88 36

22 World Fertility Patterns 2015
Total fertility (children per woman)
Net reproduction rate
Adolescent birth rate (births per thousand women aged 15-19)
Share of total fertility by women under age 20 (per cent)
Age-specific fertility rate 2010-2015 (births per thousand women in age group)
Country or area 1970-1975 1990-1995 2010-2015 2025-2030 Trends 2010-2015 1970-1975 1990-1995 2010-2015 2025-2030 Trends Country or area 2010-2015 15-19 20-24 25-29 30-34 35-39 40-44 45-49 Age distribution
South-eastern Asia (continued) South-eastern Asia (continued)
Viet Nam 6.3 3.2 2.0 1.9 0.9 19 34 36 40 Viet Nam 9 36 120 127 72 30 7 1
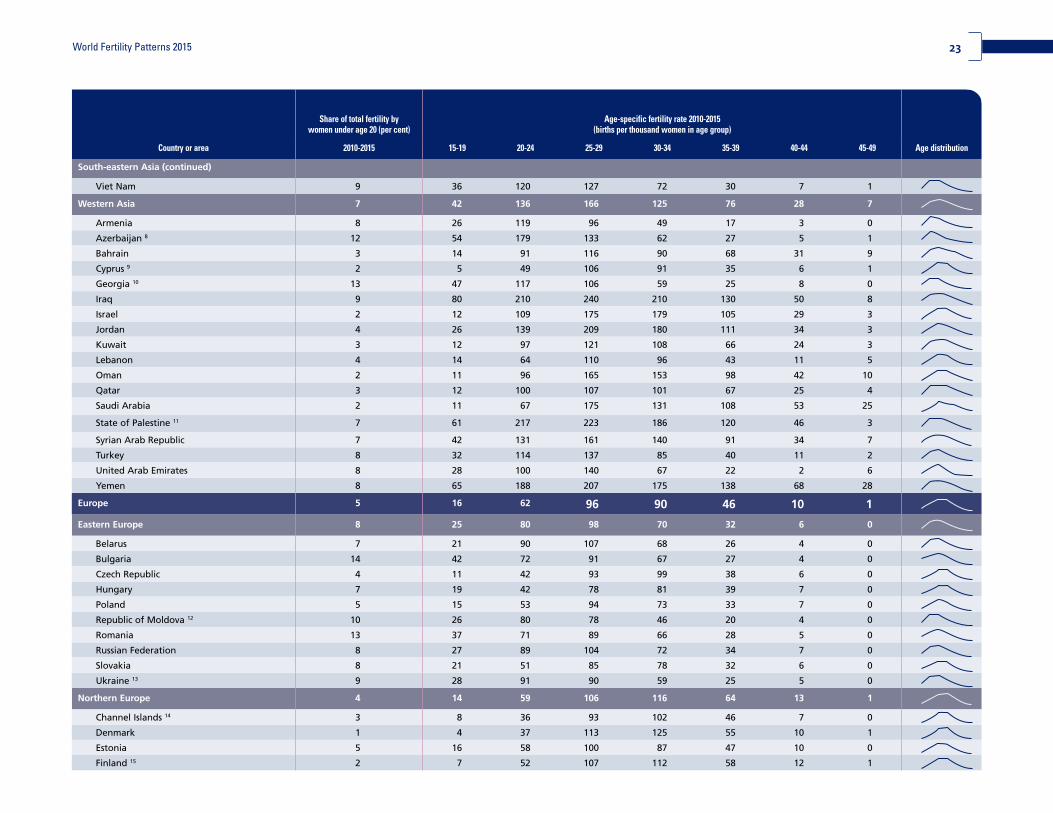
Western Asia 5.7 4.0 2.9 2.5 1.4 107 67 42 36 Western Asia 7 42 136 166 125 76 28 7
Armenia 3.0 2.4 1.6 1.5 0.7 41 80 26 17 Armenia 8 26 119 96 49 17 3 0
Azerbaijan 8 4.3 2.9 2.3 2.1 1.0 29 38 54 71 Azerbaijan 8 12 54 179 133 62 27 5 1
Bahrain 5.9 3.4 2.1 1.8 1.0 74 22 14 12 Bahrain 3 14 91 116 90 68 31 9
Cyprus 9 2.5 2.3 1.5 1.5 0.7 21 24 5 4 Cyprus 9 2 5 49 106 91 35 6 1
Georgia 10 2.6 2.1 1.8 1.8 0.8 87 69 47 14 Georgia 10 13 47 117 106 59 25 8 0
Iraq 7.2 5.6 4.6 3.9 2.1 121 67 80 88 Iraq 9 80 210 240 210 130 50 8
Israel 3.8 2.9 3.1 2.7 1.5 43 19 12 5 Israel 2 12 109 175 179 105 29 3
Jordan 7.8 5.1 3.5 2.7 1.7 100 49 26 15 Jordan 4 26 139 209 180 111 34 3
Kuwait 7.0 2.4 2.2 1.9 1.0 143 21 12 6 Kuwait 3 12 97 121 108 66 24 3
Lebanon 4.7 2.8 1.7 1.7 0.8 69 39 14 10 Lebanon 4 14 64 110 96 43 11 5
Oman 7.4 6.3 2.9 2.1 1.4 137 73 11 3 Oman 2 11 96 165 153 98 42 10
Qatar 6.8 3.7 2.1 1.8 1.0 89 44 12 8 Qatar 3 12 100 107 101 67 25 4
Saudi Arabia 7.3 5.6 2.9 2.2 1.4 125 60 11 4 Saudi Arabia 2 11 67 175 131 108 53 25
State of Palestine 11 7.7 6.6 4.3 3.4 2.0 111 110 61 47 State of Palestine 11 7 61 217 223 186 120 46 3
Syrian Arab Republic 7.5 4.8 3.0 2.4 1.4 118 68 42 29 Syrian Arab Republic 7 42 131 161 140 91 34 7
Turkey 5.3 2.9 2.1 1.9 1.0 113 61 32 17 Turkey 8 32 114 137 85 40 11 2
United Arab Emirates 6.4 3.9 1.8 1.6 0.9 163 42 28 32 United Arab Emirates 8 28 100 140 67 22 2 6
Yemen 7.9 8.2 4.4 3.0 1.9 169 146 65 45 Yemen 8 65 188 207 175 138 68 28
Europe 2.2 1.6 1.6 1.7 0.8 36 31 16 10 Europe 5 16 62 96 90 46 10 1
Eastern Europe 2.1 1.6 1.6 1.7 0.7 37 49 25 15 Eastern Europe 8 25 80 98 70 32 6 0
Belarus 2.3 1.7 1.6 1.7 0.8 21 44 21 11 Belarus 7 21 90 107 68 26 4 0
Bulgaria 2.2 1.6 1.5 1.7 0.7 71 67 42 24 Bulgaria 14 42 72 91 67 27 4 0
Czech Republic 2.2 1.6 1.5 1.7 0.7 50 41 11 8 Czech Republic 4 11 42 93 99 38 6 0
Hungary 2.1 1.7 1.3 1.5 0.6 56 37 19 14 Hungary 7 19 42 78 81 39 7 0
Poland 2.2 1.9 1.4 1.4 0.7 26 29 15 11 Poland 5 15 53 94 73 33 7 0
Republic of Moldova 12 2.6 2.1 1.3 1.3 0.6 33 63 26 16 Republic of Moldova 12 10 26 80 78 46 20 4 0
Romania 2.7 1.5 1.5 1.6 0.7 64 48 37 25 Romania 13 37 71 89 66 28 5 0
Russian Federation 2.0 1.5 1.7 1.8 0.8 32 52 27 15 Russian Federation 8 27 89 104 72 34 7 0
Slovakia 2.5 1.9 1.4 1.5 0.7 41 45 21 16 Slovakia 8 21 51 85 78 32 6 0
Ukraine 13 2.1 1.6 1.5 1.7 0.7 39 58 28 15 Ukraine 13 9 28 91 90 59 25 5 0
Northern Europe 2.1 1.8 1.9 1.9 0.9 38 26 14 7 Northern Europe 4 14 59 106 116 64 13 1
Channel Islands 14 1.9 1.5 1.5 1.5 0.7 21 17 8 5 Channel Islands 14 3 8 36 93 102 46 7 0
Denmark 2.0 1.7 1.7 1.8 0.8 28 9 4 4 Denmark 1 4 37 113 125 55 10 1
Estonia 2.2 1.6 1.6 1.7 0.8 34 47 16 8 Estonia 5 16 58 100 87 47 10 0
Finland 15 1.6 1.8 1.7 1.8 0.8 28 11 7 6 Finland 15 2 7 52 107 112 58 12 1
23World Fertility Patterns 2015
Total fertility (children per woman)
Net reproduction rate
Adolescent birth rate (births per thousand women aged 15-19)
Share of total fertility by women under age 20 (per cent)
Age-specific fertility rate 2010-2015 (births per thousand women in age group)
Country or area 1970-1975 1990-1995 2010-2015 2025-2030 Trends 2010-2015 1970-1975 1990-1995 2010-2015 2025-2030 Trends Country or area 2010-2015 15-19 20-24 25-29 30-34 35-39 40-44 45-49 Age distribution
South-eastern Asia (continued) South-eastern Asia (continued)
Viet Nam 6.3 3.2 2.0 1.9 0.9 19 34 36 40 Viet Nam 9 36 120 127 72 30 7 1
Western Asia 5.7 4.0 2.9 2.5 1.4 107 67 42 36 Western Asia 7 42 136 166 125 76 28 7
Armenia 3.0 2.4 1.6 1.5 0.7 41 80 26 17 Armenia 8 26 119 96 49 17 3 0
Azerbaijan 8 4.3 2.9 2.3 2.1 1.0 29 38 54 71 Azerbaijan 8 12 54 179 133 62 27 5 1
Bahrain 5.9 3.4 2.1 1.8 1.0 74 22 14 12 Bahrain 3 14 91 116 90 68 31 9
Cyprus 9 2.5 2.3 1.5 1.5 0.7 21 24 5 4 Cyprus 9 2 5 49 106 91 35 6 1
Georgia 10 2.6 2.1 1.8 1.8 0.8 87 69 47 14 Georgia 10 13 47 117 106 59 25 8 0
Iraq 7.2 5.6 4.6 3.9 2.1 121 67 80 88 Iraq 9 80 210 240 210 130 50 8
Israel 3.8 2.9 3.1 2.7 1.5 43 19 12 5 Israel 2 12 109 175 179 105 29 3
Jordan 7.8 5.1 3.5 2.7 1.7 100 49 26 15 Jordan 4 26 139 209 180 111 34 3
Kuwait 7.0 2.4 2.2 1.9 1.0 143 21 12 6 Kuwait 3 12 97 121 108 66 24 3
Lebanon 4.7 2.8 1.7 1.7 0.8 69 39 14 10 Lebanon 4 14 64 110 96 43 11 5
Oman 7.4 6.3 2.9 2.1 1.4 137 73 11 3 Oman 2 11 96 165 153 98 42 10
Qatar 6.8 3.7 2.1 1.8 1.0 89 44 12 8 Qatar 3 12 100 107 101 67 25 4
Saudi Arabia 7.3 5.6 2.9 2.2 1.4 125 60 11 4 Saudi Arabia 2 11 67 175 131 108 53 25
State of Palestine 11 7.7 6.6 4.3 3.4 2.0 111 110 61 47 State of Palestine 11 7 61 217 223 186 120 46 3
Syrian Arab Republic 7.5 4.8 3.0 2.4 1.4 118 68 42 29 Syrian Arab Republic 7 42 131 161 140 91 34 7
Turkey 5.3 2.9 2.1 1.9 1.0 113 61 32 17 Turkey 8 32 114 137 85 40 11 2
United Arab Emirates 6.4 3.9 1.8 1.6 0.9 163 42 28 32 United Arab Emirates 8 28 100 140 67 22 2 6
Yemen 7.9 8.2 4.4 3.0 1.9 169 146 65 45 Yemen 8 65 188 207 175 138 68 28
Europe 2.2 1.6 1.6 1.7 0.8 36 31 16 10 Europe 5 16 62 96 90 46 10 1
Eastern Europe 2.1 1.6 1.6 1.7 0.7 37 49 25 15 Eastern Europe 8 25 80 98 70 32 6 0
Belarus 2.3 1.7 1.6 1.7 0.8 21 44 21 11 Belarus 7 21 90 107 68 26 4 0
Bulgaria 2.2 1.6 1.5 1.7 0.7 71 67 42 24 Bulgaria 14 42 72 91 67 27 4 0
Czech Republic 2.2 1.6 1.5 1.7 0.7 50 41 11 8 Czech Republic 4 11 42 93 99 38 6 0
Hungary 2.1 1.7 1.3 1.5 0.6 56 37 19 14 Hungary 7 19 42 78 81 39 7 0
Poland 2.2 1.9 1.4 1.4 0.7 26 29 15 11 Poland 5 15 53 94 73 33 7 0
Republic of Moldova 12 2.6 2.1 1.3 1.3 0.6 33 63 26 16 Republic of Moldova 12 10 26 80 78 46 20 4 0
Romania 2.7 1.5 1.5 1.6 0.7 64 48 37 25 Romania 13 37 71 89 66 28 5 0
Russian Federation 2.0 1.5 1.7 1.8 0.8 32 52 27 15 Russian Federation 8 27 89 104 72 34 7 0
Slovakia 2.5 1.9 1.4 1.5 0.7 41 45 21 16 Slovakia 8 21 51 85 78 32 6 0
Ukraine 13 2.1 1.6 1.5 1.7 0.7 39 58 28 15 Ukraine 13 9 28 91 90 59 25 5 0
Northern Europe 2.1 1.8 1.9 1.9 0.9 38 26 14 7 Northern Europe 4 14 59 106 116 64 13 1
Channel Islands 14 1.9 1.5 1.5 1.5 0.7 21 17 8 5 Channel Islands 14 3 8 36 93 102 46 7 0
Denmark 2.0 1.7 1.7 1.8 0.8 28 9 4 4 Denmark 1 4 37 113 125 55 10 1
Estonia 2.2 1.6 1.6 1.7 0.8 34 47 16 8 Estonia 5 16 58 100 87 47 10 0
Finland 15 1.6 1.8 1.7 1.8 0.8 28 11 7 6 Finland 15 2 7 52 107 112 58 12 1

24 World Fertility Patterns 2015
Total fertility (children per woman)
Net reproduction rate
Adolescent birth rate (births per thousand women aged 15-19)
Share of total fertility by women under age 20 (per cent)
Age-specific fertility rate 2010-2015 (births per thousand women in age group)
Country or area 1970-1975 1990-1995 2010-2015 2025-2030 Trends 2010-2015 1970-1975 1990-1995 2010-2015 2025-2030 Trends Country or area 2010-2015 15-19 20-24 25-29 30-34 35-39 40-44 45-49 Age distribution
Northern Europe (continued) Northern Europe (continued)
Iceland 2.9 2.2 2.0 1.8 1.0 71 26 8 2 Iceland 2 8 58 121 126 65 14 1
Ireland 3.8 1.9 2.0 2.0 1.0 22 16 12 9 Ireland 3 12 51 88 130 98 22 1
Latvia 2.0 1.6 1.5 1.7 0.7 39 44 15 10 Latvia 5 15 57 94 79 40 10 1
Lithuania 2.3 1.8 1.6 1.7 0.8 23 45 14 6 Lithuania 4 14 55 117 86 34 6 0
Norway 16 2.2 1.9 1.8 1.8 0.9 32 16 6 6 Norway 16 2 6 49 115 122 57 10 1
Sweden 1.9 2.0 1.9 1.9 0.9 33 11 5 6 Sweden 1 5 48 114 134 68 14 1
United Kingdom 2.0 1.8 1.9 1.9 0.9 43 31 18 8 United Kingdom 5 18 65 105 115 65 14 1
Southern Europe 2.5 1.4 1.4 1.5 0.7 32 14 10 7 Southern Europe 3 10 40 74 91 55 13 1
Albania 4.6 2.8 1.8 1.8 0.8 29 19 21 21 Albania 6 21 107 127 72 24 4 1
Bosnia and Herzegovina 2.7 1.7 1.3 1.3 0.6 51 25 11 4 Bosnia and Herzegovina 4 11 52 92 70 26 4 0
Croatia 2.0 1.5 1.5 1.5 0.7 53 21 11 6 Croatia 4 11 55 99 91 40 7 0
Greece 2.3 1.4 1.3 1.4 0.6 39 17 9 5 Greece 3 9 33 76 92 48 10 1
Italy 2.3 1.3 1.4 1.6 0.7 30 8 6 5 Italy 2 6 33 73 95 61 15 1
Malta 2.0 2.0 1.4 1.6 0.7 13 12 18 13 Malta 6 18 39 87 93 43 7 0
Montenegro 2.6 2.0 1.7 1.6 0.8 33 26 13 10 Montenegro 4 13 75 115 90 39 10 1
Portugal 2.8 1.5 1.3 1.3 0.6 32 22 12 6 Portugal 5 12 38 71 83 43 9 1
Serbia 17 2.4 2.0 1.6 1.6 0.8 65 36 21 14 Serbia 17 7 21 68 99 83 35 6 1
Slovenia 2.2 1.3 1.6 1.7 0.8 56 20 4 3 Slovenia 1 4 44 108 107 44 7 0
Spain 18 2.9 1.3 1.3 1.5 0.6 17 10 9 7 Spain 18 3 9 29 58 91 62 14 1
TFYR Macedonia 19 2.9 2.1 1.5 1.6 0.7 46 43 19 14 TFYR Macedonia 19 6 19 72 103 76 28 4 0
Western Europe 2.0 1.5 1.7 1.8 0.8 38 13 8 6 Western Europe 2 8 45 103 111 54 10 1
Austria 2.0 1.5 1.5 1.6 0.7 55 20 9 4 Austria 3 9 44 89 95 47 9 1
Belgium 2.0 1.6 1.8 1.9 0.9 31 11 9 7 Belgium 2 9 53 127 117 48 9 0
France 2.3 1.7 2.0 2.0 1.0 38 11 10 8 France 2 10 59 132 127 58 13 1
Germany 1.7 1.3 1.4 1.5 0.7 42 16 8 4 Germany 3 8 36 79 95 51 9 0
Luxembourg 1.7 1.7 1.6 1.7 0.8 27 13 7 4 Luxembourg 2 7 41 84 110 57 12 1
Netherlands 2.1 1.6 1.8 1.8 0.8 19 7 4 4 Netherlands 1 4 35 108 137 56 9 0
Switzerland 1.9 1.5 1.5 1.7 0.7 20 7 3 2 Switzerland 1 3 32 82 112 63 12 1
Latin America and the Caribbean 5.0 3.0 2.2 1.9 1.0 95 83 67 53 Latin America and the Caribbean 15 67 119 109 76 43 14 3
Caribbean 4.4 2.8 2.3 2.0 1.0 115 82 60 47 Caribbean 13 60 125 118 89 47 14 4
Antigua and Barbuda 3.3 2.1 2.1 1.9 1.0 94 66 49 32 Antigua and Barbuda 12 49 105 124 89 42 9 1
Aruba 2.7 2.2 1.7 1.6 0.8 60 49 27 13 Aruba 8 27 82 105 80 36 6 0
Bahamas 3.5 2.6 1.9 1.8 0.9 85 70 34 18 Bahamas 9 34 84 99 88 60 11 1
Barbados 2.7 1.7 1.8 1.8 0.9 92 58 47 15 Barbados 13 47 87 81 73 52 16 2
Cuba 3.6 1.7 1.6 1.6 0.8 143 69 48 36 Cuba 15 48 100 90 58 24 5 0
Curaçao 2.9 2.3 2.1 2.0 1.0 65 52 35 29 Curaçao 8 35 104 117 98 52 13 1

25World Fertility Patterns 2015
Total fertility (children per woman)
Net reproduction rate
Adolescent birth rate (births per thousand women aged 15-19)
Share of total fertility by women under age 20 (per cent)
Age-specific fertility rate 2010-2015 (births per thousand women in age group)
Country or area 1970-1975 1990-1995 2010-2015 2025-2030 Trends 2010-2015 1970-1975 1990-1995 2010-2015 2025-2030 Trends Country or area 2010-2015 15-19 20-24 25-29 30-34 35-39 40-44 45-49 Age distribution
Northern Europe (continued) Northern Europe (continued)
Iceland 2.9 2.2 2.0 1.8 1.0 71 26 8 2 Iceland 2 8 58 121 126 65 14 1
Ireland 3.8 1.9 2.0 2.0 1.0 22 16 12 9 Ireland 3 12 51 88 130 98 22 1
Latvia 2.0 1.6 1.5 1.7 0.7 39 44 15 10 Latvia 5 15 57 94 79 40 10 1
Lithuania 2.3 1.8 1.6 1.7 0.8 23 45 14 6 Lithuania 4 14 55 117 86 34 6 0
Norway 16 2.2 1.9 1.8 1.8 0.9 32 16 6 6 Norway 16 2 6 49 115 122 57 10 1
Sweden 1.9 2.0 1.9 1.9 0.9 33 11 5 6 Sweden 1 5 48 114 134 68 14 1
United Kingdom 2.0 1.8 1.9 1.9 0.9 43 31 18 8 United Kingdom 5 18 65 105 115 65 14 1
Southern Europe 2.5 1.4 1.4 1.5 0.7 32 14 10 7 Southern Europe 3 10 40 74 91 55 13 1
Albania 4.6 2.8 1.8 1.8 0.8 29 19 21 21 Albania 6 21 107 127 72 24 4 1
Bosnia and Herzegovina 2.7 1.7 1.3 1.3 0.6 51 25 11 4 Bosnia and Herzegovina 4 11 52 92 70 26 4 0
Croatia 2.0 1.5 1.5 1.5 0.7 53 21 11 6 Croatia 4 11 55 99 91 40 7 0
Greece 2.3 1.4 1.3 1.4 0.6 39 17 9 5 Greece 3 9 33 76 92 48 10 1
Italy 2.3 1.3 1.4 1.6 0.7 30 8 6 5 Italy 2 6 33 73 95 61 15 1
Malta 2.0 2.0 1.4 1.6 0.7 13 12 18 13 Malta 6 18 39 87 93 43 7 0
Montenegro 2.6 2.0 1.7 1.6 0.8 33 26 13 10 Montenegro 4 13 75 115 90 39 10 1
Portugal 2.8 1.5 1.3 1.3 0.6 32 22 12 6 Portugal 5 12 38 71 83 43 9 1
Serbia 17 2.4 2.0 1.6 1.6 0.8 65 36 21 14 Serbia 17 7 21 68 99 83 35 6 1
Slovenia 2.2 1.3 1.6 1.7 0.8 56 20 4 3 Slovenia 1 4 44 108 107 44 7 0
Spain 18 2.9 1.3 1.3 1.5 0.6 17 10 9 7 Spain 18 3 9 29 58 91 62 14 1
TFYR Macedonia 19 2.9 2.1 1.5 1.6 0.7 46 43 19 14 TFYR Macedonia 19 6 19 72 103 76 28 4 0
Western Europe 2.0 1.5 1.7 1.8 0.8 38 13 8 6 Western Europe 2 8 45 103 111 54 10 1
Austria 2.0 1.5 1.5 1.6 0.7 55 20 9 4 Austria 3 9 44 89 95 47 9 1
Belgium 2.0 1.6 1.8 1.9 0.9 31 11 9 7 Belgium 2 9 53 127 117 48 9 0
France 2.3 1.7 2.0 2.0 1.0 38 11 10 8 France 2 10 59 132 127 58 13 1
Germany 1.7 1.3 1.4 1.5 0.7 42 16 8 4 Germany 3 8 36 79 95 51 9 0
Luxembourg 1.7 1.7 1.6 1.7 0.8 27 13 7 4 Luxembourg 2 7 41 84 110 57 12 1
Netherlands 2.1 1.6 1.8 1.8 0.8 19 7 4 4 Netherlands 1 4 35 108 137 56 9 0
Switzerland 1.9 1.5 1.5 1.7 0.7 20 7 3 2 Switzerland 1 3 32 82 112 63 12 1
Latin America and the Caribbean 5.0 3.0 2.2 1.9 1.0 95 83 67 53 Latin America and the Caribbean 15 67 119 109 76 43 14 3
Caribbean 4.4 2.8 2.3 2.0 1.0 115 82 60 47 Caribbean 13 60 125 118 89 47 14 4
Antigua and Barbuda 3.3 2.1 2.1 1.9 1.0 94 66 49 32 Antigua and Barbuda 12 49 105 124 89 42 9 1
Aruba 2.7 2.2 1.7 1.6 0.8 60 49 27 13 Aruba 8 27 82 105 80 36 6 0
Bahamas 3.5 2.6 1.9 1.8 0.9 85 70 34 18 Bahamas 9 34 84 99 88 60 11 1
Barbados 2.7 1.7 1.8 1.8 0.9 92 58 47 15 Barbados 13 47 87 81 73 52 16 2
Cuba 3.6 1.7 1.6 1.6 0.8 143 69 48 36 Cuba 15 48 100 90 58 24 5 0
Curaçao 2.9 2.3 2.1 2.0 1.0 65 52 35 29 Curaçao 8 35 104 117 98 52 13 1
26 World Fertility Patterns 2015
Total fertility (children per woman)
Net reproduction rate
Adolescent birth rate (births per thousand women aged 15-19)
Share of total fertility by women under age 20 (per cent)
Age-specific fertility rate 2010-2015 (births per thousand women in age group)
Country or area 1970-1975 1990-1995 2010-2015 2025-2030 Trends 2010-2015 1970-1975 1990-1995 2010-2015 2025-2030 Trends Country or area 2010-2015 15-19 20-24 25-29 30-34 35-39 40-44 45-49 Age distribution
Caribbean (continued) Caribbean (continued)
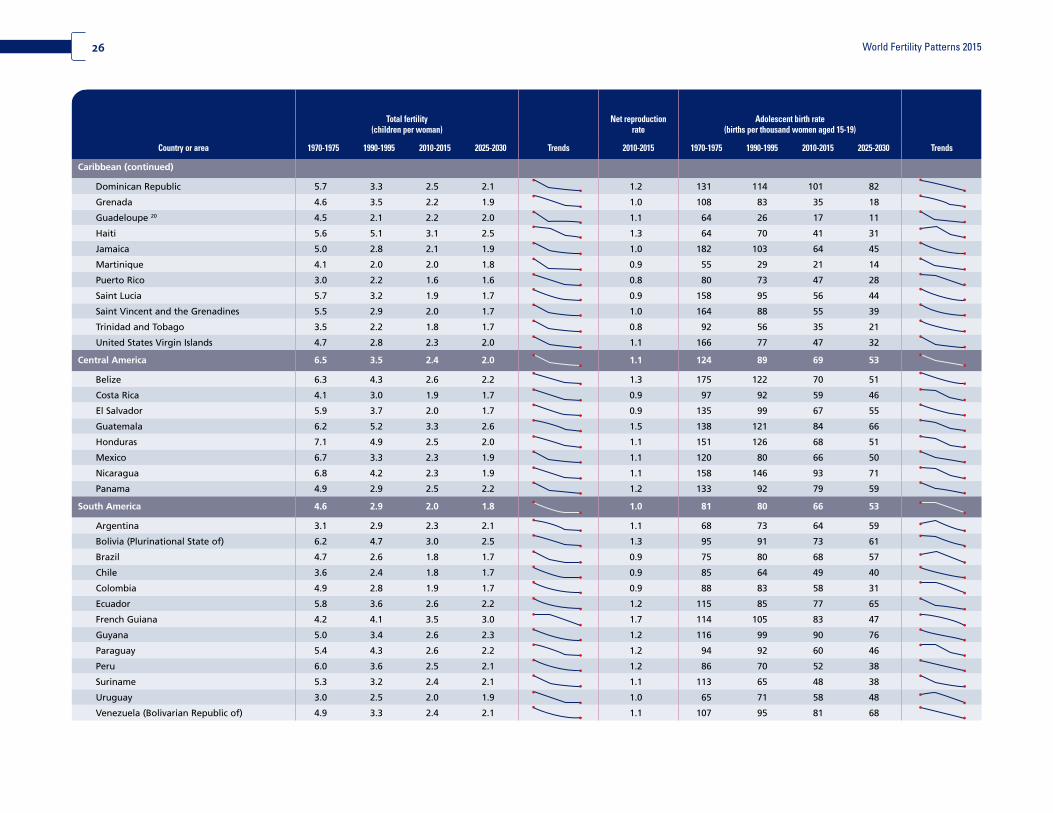
Dominican Republic 5.7 3.3 2.5 2.1 1.2 131 114 101 82 Dominican Republic 20 101 156 122 82 34 9 2
Grenada 4.6 3.5 2.2 1.9 1.0 108 83 35 18 Grenada 8 35 97 133 102 53 15 1
Guadeloupe 20 4.5 2.1 2.2 2.0 1.1 64 26 17 11 Guadeloupe 20 4 17 78 122 129 69 17 2
Haiti 5.6 5.1 3.1 2.5 1.3 64 70 41 31 Haiti 7 41 131 151 136 101 47 17
Jamaica 5.0 2.8 2.1 1.9 1.0 182 103 64 45 Jamaica 15 64 128 106 69 36 12 2
Martinique 4.1 2.0 2.0 1.8 0.9 55 29 21 14 Martinique 5 21 71 107 104 66 20 1
Puerto Rico 3.0 2.2 1.6 1.6 0.8 80 73 47 28 Puerto Rico 14 47 96 93 62 25 5 0
Saint Lucia 5.7 3.2 1.9 1.7 0.9 158 95 56 44 Saint Lucia 15 56 92 96 77 46 17 0
Saint Vincent and the Grenadines 5.5 2.9 2.0 1.7 1.0 164 88 55 39 Saint Vincent and the Grenadines 14 55 106 114 78 38 9 0
Trinidad and Tobago 3.5 2.2 1.8 1.7 0.8 92 56 35 21 Trinidad and Tobago 10 35 101 101 76 36 10 1
United States Virgin Islands 4.7 2.8 2.3 2.0 1.1 166 77 47 32 United States Virgin Islands 10 47 152 124 84 40 9 4
Central America 6.5 3.5 2.4 2.0 1.1 124 89 69 53 Central America 15 69 130 127 86 47 12 2
Belize 6.3 4.3 2.6 2.2 1.3 175 122 70 51 Belize 13 70 151 142 99 49 16 1
Costa Rica 4.1 3.0 1.9 1.7 0.9 97 92 59 46 Costa Rica 16 59 101 87 70 41 11 1
El Salvador 5.9 3.7 2.0 1.7 0.9 135 99 67 55 El Salvador 17 67 108 98 71 37 13 2
Guatemala 6.2 5.2 3.3 2.6 1.5 138 121 84 66 Guatemala 13 84 173 159 124 80 33 6
Honduras 7.1 4.9 2.5 2.0 1.1 151 126 68 51 Honduras 14 68 135 114 87 56 28 5
Mexico 6.7 3.3 2.3 1.9 1.1 120 80 66 50 Mexico 14 66 126 128 83 44 9 2
Nicaragua 6.8 4.2 2.3 1.9 1.1 158 146 93 71 Nicaragua 20 93 123 109 76 43 16 5
Panama 4.9 2.9 2.5 2.2 1.2 133 92 79 59 Panama 16 79 149 132 88 38 9 1
South America 4.6 2.9 2.0 1.8 1.0 81 80 66 53 South America 16 66 113 101 72 41 15 2
Argentina 3.1 2.9 2.3 2.1 1.1 68 73 64 59 Argentina 14 64 109 110 103 63 19 2
Bolivia (Plurinational State of) 6.2 4.7 3.0 2.5 1.3 95 91 73 61 Bolivia (Plurinational State of) 12 73 147 149 115 81 36 8
Brazil 4.7 2.6 1.8 1.7 0.9 75 80 68 57 Brazil 19 68 108 91 56 29 10 2
Chile 3.6 2.4 1.8 1.7 0.9 85 64 49 40 Chile 14 49 85 93 74 42 12 1
Colombia 4.9 2.8 1.9 1.7 0.9 88 83 58 31 Colombia 15 58 112 97 65 38 15 3
Ecuador 5.8 3.6 2.6 2.2 1.2 115 85 77 65 Ecuador 15 77 139 125 91 55 24 6
French Guiana 4.2 4.1 3.5 3.0 1.7 114 105 83 47 French Guiana 12 83 156 182 151 89 33 3
Guyana 5.0 3.4 2.6 2.3 1.2 116 99 90 76 Guyana 17 90 156 119 87 50 13 5
Paraguay 5.4 4.3 2.6 2.2 1.2 94 92 60 46 Paraguay 12 60 130 130 103 65 26 5
Peru 6.0 3.6 2.5 2.1 1.2 86 70 52 38 Peru 10 52 117 123 106 68 29 5
Suriname 5.3 3.2 2.4 2.1 1.1 113 65 48 38 Suriname 10 48 117 129 101 59 24 2
Uruguay 3.0 2.5 2.0 1.9 1.0 65 71 58 48 Uruguay 14 58 98 106 86 46 14 1
Venezuela (Bolivarian Republic of) 4.9 3.3 2.4 2.1 1.1 107 95 81 68 Venezuela (Bolivarian Republic of) 17 81 132 119 86 46 15 2

27World Fertility Patterns 2015
Total fertility (children per woman)
Net reproduction rate
Adolescent birth rate (births per thousand women aged 15-19)
Share of total fertility by women under age 20 (per cent)
Age-specific fertility rate 2010-2015 (births per thousand women in age group)
Country or area 1970-1975 1990-1995 2010-2015 2025-2030 Trends 2010-2015 1970-1975 1990-1995 2010-2015 2025-2030 Trends Country or area 2010-2015 15-19 20-24 25-29 30-34 35-39 40-44 45-49 Age distribution
Caribbean (continued) Caribbean (continued)
Dominican Republic 5.7 3.3 2.5 2.1 1.2 131 114 101 82 Dominican Republic 20 101 156 122 82 34 9 2
Grenada 4.6 3.5 2.2 1.9 1.0 108 83 35 18 Grenada 8 35 97 133 102 53 15 1
Guadeloupe 20 4.5 2.1 2.2 2.0 1.1 64 26 17 11 Guadeloupe 20 4 17 78 122 129 69 17 2
Haiti 5.6 5.1 3.1 2.5 1.3 64 70 41 31 Haiti 7 41 131 151 136 101 47 17
Jamaica 5.0 2.8 2.1 1.9 1.0 182 103 64 45 Jamaica 15 64 128 106 69 36 12 2
Martinique 4.1 2.0 2.0 1.8 0.9 55 29 21 14 Martinique 5 21 71 107 104 66 20 1
Puerto Rico 3.0 2.2 1.6 1.6 0.8 80 73 47 28 Puerto Rico 14 47 96 93 62 25 5 0
Saint Lucia 5.7 3.2 1.9 1.7 0.9 158 95 56 44 Saint Lucia 15 56 92 96 77 46 17 0
Saint Vincent and the Grenadines 5.5 2.9 2.0 1.7 1.0 164 88 55 39 Saint Vincent and the Grenadines 14 55 106 114 78 38 9 0
Trinidad and Tobago 3.5 2.2 1.8 1.7 0.8 92 56 35 21 Trinidad and Tobago 10 35 101 101 76 36 10 1
United States Virgin Islands 4.7 2.8 2.3 2.0 1.1 166 77 47 32 United States Virgin Islands 10 47 152 124 84 40 9 4
Central America 6.5 3.5 2.4 2.0 1.1 124 89 69 53 Central America 15 69 130 127 86 47 12 2
Belize 6.3 4.3 2.6 2.2 1.3 175 122 70 51 Belize 13 70 151 142 99 49 16 1
Costa Rica 4.1 3.0 1.9 1.7 0.9 97 92 59 46 Costa Rica 16 59 101 87 70 41 11 1
El Salvador 5.9 3.7 2.0 1.7 0.9 135 99 67 55 El Salvador 17 67 108 98 71 37 13 2
Guatemala 6.2 5.2 3.3 2.6 1.5 138 121 84 66 Guatemala 13 84 173 159 124 80 33 6
Honduras 7.1 4.9 2.5 2.0 1.1 151 126 68 51 Honduras 14 68 135 114 87 56 28 5
Mexico 6.7 3.3 2.3 1.9 1.1 120 80 66 50 Mexico 14 66 126 128 83 44 9 2
Nicaragua 6.8 4.2 2.3 1.9 1.1 158 146 93 71 Nicaragua 20 93 123 109 76 43 16 5
Panama 4.9 2.9 2.5 2.2 1.2 133 92 79 59 Panama 16 79 149 132 88 38 9 1
South America 4.6 2.9 2.0 1.8 1.0 81 80 66 53 South America 16 66 113 101 72 41 15 2
Argentina 3.1 2.9 2.3 2.1 1.1 68 73 64 59 Argentina 14 64 109 110 103 63 19 2
Bolivia (Plurinational State of) 6.2 4.7 3.0 2.5 1.3 95 91 73 61 Bolivia (Plurinational State of) 12 73 147 149 115 81 36 8
Brazil 4.7 2.6 1.8 1.7 0.9 75 80 68 57 Brazil 19 68 108 91 56 29 10 2
Chile 3.6 2.4 1.8 1.7 0.9 85 64 49 40 Chile 14 49 85 93 74 42 12 1
Colombia 4.9 2.8 1.9 1.7 0.9 88 83 58 31 Colombia 15 58 112 97 65 38 15 3
Ecuador 5.8 3.6 2.6 2.2 1.2 115 85 77 65 Ecuador 15 77 139 125 91 55 24 6
French Guiana 4.2 4.1 3.5 3.0 1.7 114 105 83 47 French Guiana 12 83 156 182 151 89 33 3
Guyana 5.0 3.4 2.6 2.3 1.2 116 99 90 76 Guyana 17 90 156 119 87 50 13 5
Paraguay 5.4 4.3 2.6 2.2 1.2 94 92 60 46 Paraguay 12 60 130 130 103 65 26 5
Peru 6.0 3.6 2.5 2.1 1.2 86 70 52 38 Peru 10 52 117 123 106 68 29 5
Suriname 5.3 3.2 2.4 2.1 1.1 113 65 48 38 Suriname 10 48 117 129 101 59 24 2
Uruguay 3.0 2.5 2.0 1.9 1.0 65 71 58 48 Uruguay 14 58 98 106 86 46 14 1
Venezuela (Bolivarian Republic of) 4.9 3.3 2.4 2.1 1.1 107 95 81 68 Venezuela (Bolivarian Republic of) 17 81 132 119 86 46 15 2

28 World Fertility Patterns 2015
Total fertility (children per woman)
Net reproduction rate
Adolescent birth rate (births per thousand women aged 15-19)
Share of total fertility by women under age 20 (per cent)
Age-specific fertility rate 2010-2015 (births per thousand women in age group)
Country or area 1970-1975 1990-1995 2010-2015 2025-2030 Trends 2010-2015 1970-1975 1990-1995 2010-2015 2025-2030 Trends Country or area 2010-2015 15-19 20-24 25-29 30-34 35-39 40-44 45-49 Age distribution
Northern America 2.0 2.0 1.9 1.9 0.9 59 56 28 8 Northern America 8 28 81 106 98 48 10 1
Canada 2.0 1.7 1.6 1.6 0.8 37 25 11 7 Canada 4 11 44 96 108 53 10 0
United States of America 2.0 2.0 1.9 1.9 0.9 61 60 30 8 United States of America 8 30 84 107 97 48 10 1
Oceania 3.2 2.5 2.4 2.2 1.1 67 37 30 23 Oceania 6 30 93 124 132 79 22 5
Australia/New Zealand 2.6 1.9 1.9 1.8 0.9 52 23 17 12 Australia/New Zealand 4 17 56 102 125 71 15 1
Australia 21 2.5 1.9 1.9 1.8 0.9 49 21 16 11 Australia 21 4 16 53 102 126 72 15 1
New Zealand 2.8 2.1 2.1 1.9 1.0 65 33 25 19 New Zealand 6 25 72 105 122 71 15 1
Melanesia 5.8 4.5 3.7 3.1 1.6 123 68 54 44 Melanesia 7 54 178 178 148 104 48 22
Fiji 4.2 3.4 2.6 2.3 1.2 59 63 43 46 Fiji 8 43 158 141 94 58 22 5
New Caledonia 5.2 2.9 2.1 1.9 1.0 77 35 19 18 New Caledonia 5 19 97 121 97 65 27 1
Papua New Guinea 6.1 4.7 3.8 3.2 1.7 140 69 57 46 Papua New Guinea 7 57 183 182 155 111 53 27
Solomon Islands 7.2 5.5 4.1 3.3 1.8 142 85 54 33 Solomon Islands 7 54 184 213 178 110 52 21
Vanuatu 6.1 4.8 3.4 2.9 1.6 86 70 45 36 Vanuatu 7 45 171 179 138 92 43 14
Micronesia 5.3 3.7 2.8 2.5 1.3 85 68 30 17 Micronesia 5 30 113 169 151 76 25 4
Guam 4.1 2.9 2.4 2.1 1.2 93 78 50 41 Guam 10 50 134 137 97 51 13 1
Kiribati 5.0 4.6 3.8 3.2 1.7 54 46 21 8 Kiribati 3 21 119 216 228 127 39 8
Micronesia (Fed. States of) 6.9 4.8 3.3 2.7 1.5 75 48 19 7 Micronesia (Fed. States of) 3 19 104 189 201 112 34 7
Polynesia 22 5.7 4.0 3.0 2.6 1.4 69 45 30 19 Polynesia 22 5 30 119 168 149 93 29 3
French Polynesia 4.9 3.1 2.1 1.9 1.0 96 57 38 28 French Polynesia 9 38 96 111 93 57 18 1
Samoa 7.0 4.9 4.2 3.5 1.9 62 34 28 16 Samoa 3 28 155 237 216 146 46 5
Tonga 5.5 4.6 3.8 3.2 1.8 31 26 17 11 Tonga 2 17 111 210 222 140 47 11
Notes: The designations employed in this publication and the material presented in it do not imply the expression of any opinion whatsoever on the part of the Secretariat of the United Nations concerning the legal status of any country, territory, city or area or of its authorities, or concerning the delimitation of its frontiers or boundaries. The term “coun-try” as used in the text of this report also refers, as appropriate, to territories or areas. The designations “more developed”, “less developed” and “least developed” countries, areas or regions are intended for statistical convenience and do not necessarily express a judge-ment about the stage reached by a particular country or area in the developing process.
The tables and figures presented are from the medium variant of the World Population Prospects: The 2015 Revision, the official United Nations population estimates and pro-jections prepared by the United Nations Population Division. Data are also available in digital form and can be consulted at the Population Division’s web site at www.unpopula-tion.org. Users requiring the complete results of the 2015 Revision can purchase them on
CD-ROM. A description of the data contained in the different CD-ROMs available and an order form are posted on the web site of the Population Division.
A minus sign (-) before a figure indicates a decrease.
A full stop (.) is used to indicate decimals.
Years given refer to 1 July.
Use of a hyphen (-) between years, for example, 1995-2000, signifies the full period in-volved, from 1 July of the first year to 1 July of the second year.
An em dash (—) indicates that the value is zero (magnitude zero).
A 0 or 0.0 indicates that the magnitude is not zero, but less than half of the unit employed.
Numbers and percentages in this table do not necessarily add to totals because of rounding.
(a) More developed regions comprise Europe, Northern America, Australia/New Zealand and Japan.
(b) Less developed regions comprise all regions of Africa, Asia (except Japan), Latin Amer-ica and the Caribbean plus Melanesia, Micronesia and Polynesia.
(c) The group of least developed countries, as defined by the United Nations General Assembly in its resolutions (most recently, 68/18) included 48 countries in 2015: 34 in Africa, 9 in Asia, 4 in Oceania and one in Latin America and the Caribbean.
(d) Other less developed countries comprise the less developed regions excluding the least developed countries.
(e) The country classification by income level is based on 2014 GNI per capita from the World Bank.
(f) Sub-Saharan Africa refers to all of Africa except Northern Africa.

29World Fertility Patterns 2015
Total fertility (children per woman)
Net reproduction rate
Adolescent birth rate (births per thousand women aged 15-19)
Share of total fertility by women under age 20 (per cent)
Age-specific fertility rate 2010-2015 (births per thousand women in age group)
Country or area 1970-1975 1990-1995 2010-2015 2025-2030 Trends 2010-2015 1970-1975 1990-1995 2010-2015 2025-2030 Trends Country or area 2010-2015 15-19 20-24 25-29 30-34 35-39 40-44 45-49 Age distribution
Northern America 2.0 2.0 1.9 1.9 0.9 59 56 28 8 Northern America 8 28 81 106 98 48 10 1
Canada 2.0 1.7 1.6 1.6 0.8 37 25 11 7 Canada 4 11 44 96 108 53 10 0
United States of America 2.0 2.0 1.9 1.9 0.9 61 60 30 8 United States of America 8 30 84 107 97 48 10 1
Oceania 3.2 2.5 2.4 2.2 1.1 67 37 30 23 Oceania 6 30 93 124 132 79 22 5
Australia/New Zealand 2.6 1.9 1.9 1.8 0.9 52 23 17 12 Australia/New Zealand 4 17 56 102 125 71 15 1
Australia 21 2.5 1.9 1.9 1.8 0.9 49 21 16 11 Australia 21 4 16 53 102 126 72 15 1
New Zealand 2.8 2.1 2.1 1.9 1.0 65 33 25 19 New Zealand 6 25 72 105 122 71 15 1
Melanesia 5.8 4.5 3.7 3.1 1.6 123 68 54 44 Melanesia 7 54 178 178 148 104 48 22
Fiji 4.2 3.4 2.6 2.3 1.2 59 63 43 46 Fiji 8 43 158 141 94 58 22 5
New Caledonia 5.2 2.9 2.1 1.9 1.0 77 35 19 18 New Caledonia 5 19 97 121 97 65 27 1
Papua New Guinea 6.1 4.7 3.8 3.2 1.7 140 69 57 46 Papua New Guinea 7 57 183 182 155 111 53 27
Solomon Islands 7.2 5.5 4.1 3.3 1.8 142 85 54 33 Solomon Islands 7 54 184 213 178 110 52 21
Vanuatu 6.1 4.8 3.4 2.9 1.6 86 70 45 36 Vanuatu 7 45 171 179 138 92 43 14
Micronesia 5.3 3.7 2.8 2.5 1.3 85 68 30 17 Micronesia 5 30 113 169 151 76 25 4
Guam 4.1 2.9 2.4 2.1 1.2 93 78 50 41 Guam 10 50 134 137 97 51 13 1
Kiribati 5.0 4.6 3.8 3.2 1.7 54 46 21 8 Kiribati 3 21 119 216 228 127 39 8
Micronesia (Fed. States of) 6.9 4.8 3.3 2.7 1.5 75 48 19 7 Micronesia (Fed. States of) 3 19 104 189 201 112 34 7
Polynesia 22 5.7 4.0 3.0 2.6 1.4 69 45 30 19 Polynesia 22 5 30 119 168 149 93 29 3
French Polynesia 4.9 3.1 2.1 1.9 1.0 96 57 38 28 French Polynesia 9 38 96 111 93 57 18 1
Samoa 7.0 4.9 4.2 3.5 1.9 62 34 28 16 Samoa 3 28 155 237 216 146 46 5
Tonga 5.5 4.6 3.8 3.2 1.8 31 26 17 11 Tonga 2 17 111 210 222 140 47 11
(1) Including Agalega, Rodrigues and Saint Brandon.
(2) Including Zanzibar.
(3) For statistical purposes, the data for China do not include Hong Kong and Macao, Special Administrative Regions (SAR) of China, and Taiwan Province of China.
(4) As of 1 July 1997, Hong Kong became a Special Administrative Region (SAR) of China.
(5) As of 20 December 1999, Macao became a Special Administrative Region (SAR) of China.
(6) The regions Southern Asia and Central Asia are combined into South-Central Asia.
(7) Including Sabah and Sarawak.
(8) Including Nagorno-Karabakh.
(9) Refers to the whole country.
(10) Including Abkhazia and South Ossetia.
(11) Including East Jerusalem.
(12) Including Transnistria.
(13) Including Crimea.
(14) Refers to Guernsey, and Jersey.
(15) Including Åland Islands.
(16) Including Svalbard and Jan Mayen Islands.
(17) Including Kosovo.
(18) Including Canary Islands, Ceuta and Melilla.
(19) The former Yugoslav Republic of Macedonia.
(20) Including Saint-Barthélemy and Saint-Martin (French part).
(21) Including Christmas Island, Cocos (Keeling) Islands and Norfolk Island.
(22) Including Pitcairn.

ISBN 978-92-1-151542-8
15-1
5253